
Corporate Social Responsibility: Impact on Firm Performance for an Emerging Economy


1
Management Development Institute Murshidabad, Murshidabad 742235, India
2
Center for Sustainable Development (CSD), Fore School of Management, New Delhi 110016, India
*
Author to whom correspondence should be addressed.
J. Risk Financial Manag. 2024, 17(4), 171; https://doi.org/10.3390/jrfm17040171
Submission received: 5 March 2024
/
Revised: 12 April 2024
/
Accepted: 18 April 2024
/
Published: 22 April 2024
(This article belongs to the Special Issue Corporate Sustainability and Firm Performance: Models, Practices and Policy Perspective)
Abstract
:Corporate Social Responsibility (CSR) was usually referred to as a concept where companies initiate voluntary action towards social and environmental concerns in the context of business operations related to the stakeholders of the company prior to the CSR Act 2013 in India. Post-2013, the voluntary initiative was replaced by regulatory guidelines to address social and environmental concerns. The CSR applicability–investment gap was used as a base concept in this study with instrumental theory; the study offers a strategic perspective of CSR and how organizations emphasized maximizing stakeholders’ value. In order to further investigate the effect of CSR on corporate financial performance (CFP) through the measure of shareholders’ value, i.e., the return on equity (ROE), the study used the sample from the National Stock Exchange (NSE)-Nifty-100 indexed companies of Emerging Economy—India for a span of fourteen years (2009–2023). The vast majority of research in this domain is conducted in developed countries; the research gap is filled by this study by considering India and drawing samples from multiple industries. The empirical model was developed by using panel data regression, where the dependent variable was ROE, and the independent variables were earning per share (EPS), log total income (LTI), CSR applicability/profit after tax (CRSAPPPAT), and CSR investment/profit after tax (CSRIPAT). The findings also highlighted the CSR applicability and investment of the firms during pre- and post-Sustainable Development Goal (SDG) periods. The same was also analyzed for the firms committed to CSR and not committed to CSR. The results indicated that there is no significant impact of the CSR/ESG initiatives (applicability and investment) on the ROE of the firms. The performance could be better if the companies minimize the CSR/ESG promise–performance gap through effective communication with stakeholders.
1. Introduction
Corporate Social Responsibility (CSR) has had a long journey with lots of debate and discussions among policymakers, corporations, and society. Economic and financial thinkers highlighted the different aspects of CSR with research contributions from different parts of the globe. Berle (1931) and Dodd (1932) had two different perspectives published in the Harvard Business Review; Berle focused on the shareholder’s primacy while Dodd argued for the wider perspective of the organization, covering the concern for employment, good quality products for customers, and concern for society. Twenty years later, Berle (1954) conditionally conceded with Dodd’s contention.
Nobel laureate Friedman (1970) mentioned that shareholders owned the corporation and that the social responsibility of the business is to increase its profit. The shareholder’s perspective is covered as part of the agency theory, many researchers and scholars claimed, and managers served as shareholder’s agents (Jensen and Meckling 1976). Over a period of decades, economics and finance scholars published many articles on shareholder return. The shareholder’s perspective emerged as a central theme among business academics and managers (Rönnegard and Smith 2019; Wicks et al. 2019).
Freeman’s (1984) contribution highlighted the shift towards the stakeholder’s perspective and the wellbeing of employees, customers, society, and all those associated with business including shareholders. However, this contribution led to some confusion between stakeholder theory and corporate social responsibility. Further contributions also claimed and created some distraction for managers and kept them away from maximizing shareholder’s returns (Harrison 2011). Stout (2012) focused on the law perspective for shareholders and stakeholders and concluded that the claim that directors have a legal obligation to maximize the shareholder’s return was largely unfounded. The recent contributions are capturing a shift towards the stakeholder’s betterment.
In India, CSR continued; since the Vedic periods, 1500 BCE to 600 BCE (Sundar 2000), Indian business families and corporate houses were doing CSR as a part of philanthropy and social work. Gradually, CSR shifted towards state-led development and social work for uplifting society. Since 1990 onwards, CSR activities were more streamlined and were given due importance by corporations and policymakers. In most parts of the world, CSR activity is performed on a voluntary basis, and the same was the case with India; since April 2014, CSR is a mandatory requirement under the Companies Act 2013. Since it took effect on 1 April 2014, companies must spend 2% of their profit for socially beneficial projects and activities (eradicating hunger, poverty, and malnutrition; promoting education; promoting gender equality; empowering women; ensuring environmental sustainability; ecological balance; protection of national heritage, art, and culture; measures for the benefit of armed forces veterans, war widows, and their dependents; training to promote rural sports, nationally recognized sports, Paralympic sports, and Olympic sports; contributions to the prime minister’s national relief fund; contribution to incubators or research and development projects in the field of science, technology, engineering, and medicine; contribution to academic institutions; etc.), as per schedule VII of the Companies Act 2013 (Dharmapala and Khanna 2016). The positive relationship between CSR and financial performance is well explored and proven by many researchers over this period (McWilliams and Siegel 2001; Wang et al. 2016).
According to the (PwC 2018) report, companies are incorporating Sustainable Development Goals (SDGs) in their corporate strategies for better contributions towards sustainable development. The seventeen SDGs were adopted in the year 2015 as part of the United Nations (UN) agenda towards sustainable development and signed by 191 countries. The UN-suggested road map started to be followed by policymakers, corporations, and societies for addressing the concerns about environmental, social, and economic challenges. Primarily and superficially, SDGs were adopted by CSR or communication departments of corporations (PwC 2018).
The study conducted by (Mintzberg et al. 2009) identified the corporations’ intention–realization gap for corporate strategy execution; (Van de Ven 2008) further explored the same in the context of the CSR promise–performance gap. Our study also phrased a question around the CSR applicability–investment gap for one hundred NSE-listed companies (National Stock Exchange of India Ltd., India) to see whether they complied with environmental, social, and governance (ESG) norms. The first research goal of the study is detailed in the following section.
1.1. Explore the Impact of CSR-Complied/Non-Complied Companies on Corporate Financial Performance (CFP)
According to (Sehrawat et al. 2020), CSR intensity and financial performance had a positive relationship, though it is insignificant. However, the results were significant and positive in pre-CSR regulation time in the context of India, i.e., before 2014. The CSR mandate came into effect in India from 2013 onwards. Al Lawati and Hussainey (2022) conducted a study on the Muscat Stock Exchange and drew a conclusion that SDGs have a positive and significant impact on corporations’ performance. The parameters identified for corporate financial performance were ROE (return on equity) and other financial indicators.
CSR impact on corporate financial performance was measured by different authors across different countries and markets (Wu and Shen 2013; Velte 2017; Laskar and Gopal Maji 2018; Anifowose et al. 2020; Vafaei et al. 2011; Lo and Kwan 2017). In most of the studies, CSR was positively associated with ROA, ROE, net interest income and non-interest income, performance on market-to-book ratio, revenue growth, earnings per share (EPS), total income, stock value, etc.
Friede et al. (2015) conducted a study and mentioned that the first article on ESG and financial performance was published in 1970; according to Drempetic et al. (2019), until now, more than 2200 articles have been published on a similar theme. Several studies highlighted the positive impact on financial performance (Barnett and Salomon 2006; Peiris and Evans 2010; Jo and Harjoto 2011). Some studies captured the negative impact of ESG/CSR on the financial performance of the company (Brammer et al. 2006; Lee et al. 2009; Nollet et al. 2016; Garcia and Orsato 2020; Folger-Laronde et al. 2020; Mittal et al. 2008; Crisóstomo et al. 2011; Velte 2017). Brammer and Millington (2008) found a mixed impact of corporate social performance on company financial performance. According to a study conducted by (Atan et al. 2018; Galema et al. 2008; Humphrey et al. 2012), no correlation exists between ESG and financial performance. The second question for the study is detailed in the following section.
1.2. Exploring the Impact of CSR on Corporate Financial Performance in Pre- and Post-SDG Periods
The second question for the study is, to explore the CSR impact on Corporate Financial Performance in the pre and the post SDG period.
2. Theoretical Perspective
Over the previous decades, different researchers and scholars captured various definitions of CSR, with some contributions addressing societal concerns, such as Fitch (1976), and some studies focusing on ethical practices adopted by organizations for the betterment of society (Ismail 2009). Yoon et al. (2018) captured the CSR as a voluntary activity for the betterment of society. A study by Carroll (1999) measured the corporate efficacy for investing in CSR; the study considered ethical, economic, and legal dimensions (the environmental dimension was covered as a part of ethical and legal). This contribution evolved many synonyms of CSR, such as sustainability, corporate responsibility, corporate governance, socio-environmental governance, and environmental, social, and governance (ESG). Yoon et al. (2018) addressed the CSR perspective through ESG analysis. Institutional theory suggested that regulatory pressure has a positive impact on firm heterogeneity and competitive advantage (DiMaggio and Powell 1983, 1991; Scott 1987).
According to a KPMG (2017) survey of corporate responsibility reporting on corporate practices, the mentioned ESG adaptation rate in emerging markets was around 75% compared to 93% by the world’s largest companies. Limited research has been conducted in emerging markets on the ESG efficacy rate and its impact on corporate financial performance. According to (Odell and Ali 2016), companies in emerging markets were facing different challenges on the front of environmental, social, and governance issues, and the companies incorporating sustainability practices may get higher financial benefits in the long run.
Friedman (1970) captured the traditional mindset of the corporations; they aim to maximize the shareholder’s wealth and spending for a social cause was a reduction in the shareholder’s money. The opposite of this perspective was captured by Freeman (1984) in a stakeholder’s theory focused on employees, customers, society, and other major stakeholders. Jones (1995) discussed CSR expenditure for the betterment of the stakeholders such as employees, consumers, the local community, environmental activists, and others.
Socially responsible investment (SRI) as a concept emerged during the nineteenth century and traveled a long distance until being investigated in a study conducted by Martínez-Ferrero et al. (2015). According to Garriga and Melé (2004), CSR theories were classified into four categories: instrumental, political, integrative, and ethical. Instrumental theory emphasized the strategic perspective of CSR and how organizations enhanced wealth creation and focused on economic objectives. The theory further focused on maximizing the shareholder’s value, achieving a competitive advantage and cause-related marketing. Political theory focused on the impact of excessive corporate power on society. Integrative theory addresses the stakeholder’s perspective and social concerns. Ethical theory covered the ethical relationship between business and society. Our study is based on the instrumental perspective of CSR theory and will further explore the impact of CSR on shareholder return.
According to García et al. (2020), corporate financial performance (CFP) can be measured through two methods: accounting-based measures and market-based measures. Accounting-based measures are based on ROA, ROE, and return on sales (ROS); market-based measures include share price, Tobin’s Q, and beta. The study also mentioned that companies spending more on CSR get better ESG scores. Our study measured corporate performance through ROE, EPS, and total income (TI).
3. Literature Review
3.1. Journey from CSR to SDG and ESG
Over the last few decades, corporations, policymakers, and society have had serious concerns with respect to their social footprints due to the economic, environmental, and financial downturn. All major stakeholders are looking back to classic economic theories and business practices to explore the solutions for enhancing social contributions. In the twentieth century, a philanthropic perspective emerged as an initiative for addressing social concerns; based on the evidence, in 1960 and 1970, the major reasons for CSR were the social concerns. In the present day, the instrumental and performance aspects of CSR have gained more relevance (Carroll and Shabana 2010). According to Zubeltzu-Jaka et al. (2018), presently, CSR is interpreted as a prerequisite for developing competitive and sustainable enterprises. According to Carroll (1999), CSR definitions and the empirical research era were started in 1950, and from 1980 onwards, it entered the modern era.
During the CSR journey, another debate also evolved around the stockholder vs stakeholder perspective. Freeman (1984) captured the same in the stakeholder’s theory and talked about organizations’ responsibility not only towards stockholders but also towards employees, customers, the company, the environment, and many more. Until the present day, no appropriate theory emerged that can quantify the appropriate level of social responsibility. Behavioral finance researchers have explored some theories to capture the investor’s perspective; Brunen and Laubach (2022) used the theory of consistent behavior for exploring the investor sustainability perspective in investment decisions, Sultana et al. (2018) used the theory of planned behavior, Diouf et al. (2016) used the theory of complexity, and Perez-Gladish et al. (2012) explored utility theory for exploring the same perspective.
According to Ansoff (1965), the stakeholder’s theory is focused on stakeholder value maximization; Bhattacharyya and Rahman (2019) used the theory for examining the relationship between CSR activities and firm performance. Grewal et al. (2019) mentioned that prior research captured the voluntary perspective of CSR, while recent research emphasized mandatory CSR. Bhattacharyya and Rahman (2019) examine the correlation between mandatory CSR and firm performance. According to Liu et al. (2019), whether mandatory ESG is beneficial for business or not is an empirical research question.
CSR has been a voluntary activity in India since the Vedic periods; it took the shape of a mandatory activity from 2014 onwards by introducing changes in section 135 of the Companies Act in 2013. The journey of CSR amendments for addressing SDG concerns and the compliance of ESG is captured in Table 1.
Waddock and Graves (1997) explored the relationship between CSR and company financial performance and concluded that it is possible to find positive, negative, and no relation between the two depending on what performance metric is used for the research. Giannopoulos et al. (2022) also captured the literature based on positive, negative, and no relationship between ESG and firm performance. Dalal and Thaker (2019) conducted a study in the Indian context with the parameters of ESG measurement; they used sustainability ratings by the NSE 100 and indices and performance measurements of ROA and found a positive relationship between the two. According to Derwall et al. (2005), a positive relationship was found between eco-efficiency and stock price for the study conducted in the USA. Lee et al. (2009) derived a negative relationship between Dow Jones Sustainability Indexes and ROA and ROE; the study covered multiple countries. Mittal et al. (2008) considered CSR disclosure as a representative of ESG measures and found a negative relationship between economic value added (EVA) and market value added (MVA), the study was conducted in an Indian context. A study conducted by Crisóstomo et al. (2011) in Brazil found a negative relationship between CSR index and ROA and ROE.
Brammer and Millington (2008) found both a positive and negative relationship between corporate social performance (CSP) and financial performance; the study mentioned higher financial performance in the case of both high and low CSP. The study also captured that low CSP performed better in the short run and higher CSP performed better in the long run. According to Han et al. (2016), a positive relationship exists between governance and financial performance and a negative relationship exists with environmental score. Some studies captured that no relationship exists between financial performance and ESG (Atan et al. 2018; Galema et al. 2008; Humphrey et al. 2012).
As per PwC (2021), India started its sustainability journey in 2009, as mentioned in Table 1, and moved to business responsibility reporting (BRR) in 2012 and 2014. India introduced the amendment of the Companies Act in 2013 and extended the standards of BRR to 1000 listed companies on the Indian stock exchange in 2023.
3.2. Hypothesis Development
3.2.1. CSR Applicability/PAT Has No Significant Impact on the Shareholder’s Return
The literature had mixed responses on the ESG/CSR impact on the corporate firm’s performance. Therefore, it can be examined whether the CSR applicability and CSR investment concerning the profit of the firm (PAT) has a significant impact on the corporate firm’s performance or not. To understand the corporate firm’s performance, the shareholder’s return has been used (Lee et al. 2009; Crisóstomo et al. 2011). CSR was financially useful to shareholders since it increased their returns (Luo and Bhattacharya 2009). Firms should focus on CSR disclosure since, if done correctly, there are several chances to boost investor confidence, resulting in an improvement in shareholder returns (Zumente and Bistrova 2021). This also results in understanding the firms in a better way and makes the firm analysis ready for the investors (Feng and Wu 2021). The theories in the literature presented by Suttipun and Thanyaorn (2021), Bardos et al. (2020), and Melinda and Wardhani (2020) state the association of CSR disclosure and applicability to the firm’s performance. Therefore, the hypothesis mentioned below is proposed in the study:
Hypothesis 1 (H1).
CSR applicability/PAT has no significant impact on the shareholder’s return.
3.2.2. CSR Investment/PAT Has No Significant Impact on the Shareholder’s Return
The firms believe that if the CSR investment increases the firm’s performance, then the willingness to invest increases (Brønn and Vidaver-Cohen (2009). To support this, Wang et al. (2016) also explained that CSR investment has a positive association with shareholders’ returns. CSR investment also has strategic advantages and acts as a driving force for investment in CSR in India (Malik 2015). The CSR investment impact on the shareholders’ return was stated in the studies of Iatridis (2013), Li et al. (2018), and Cho (2022). Therefore, the hypothesis mentioned below is proposed in the study:
Hypothesis 2 (H2).
CSR investment/PAT has no significant impact on the shareholder’s return.
4. Methodology
4.1. Data
To understand the relationship of shareholders’ return to the CSR applicability and investment, data from “Appendix A” firms were obtained from the electronic database Centre for Monitoring Indian Economy Pvt. Ltd (CMIE) Prowess IQ. The study sample drawn from 100 firms listed on the NSE-Nifty-100 index belongs to the emerging economy in India. The financial data were collected for a span of fourteen years (2009–2023). Out of 100 firms, 88 were CSR-complied firms and 12 were non-CSR-complied firms. A list of the 100 sampled companies can be found in the Appendix (Appendix A). A systemic method was adopted to reach the sample, where the firms with missing data, non-availability of compatible financial information, and full information were dropped from the sample. The final sample arrived at 83 firms that were CSR-compliant.
4.2. Variables
After conducting an in-depth literature review, the determinants and the variables used for model estimation were identified. Table 2 lists the determinants and the variables.
4.3. Model Estimation
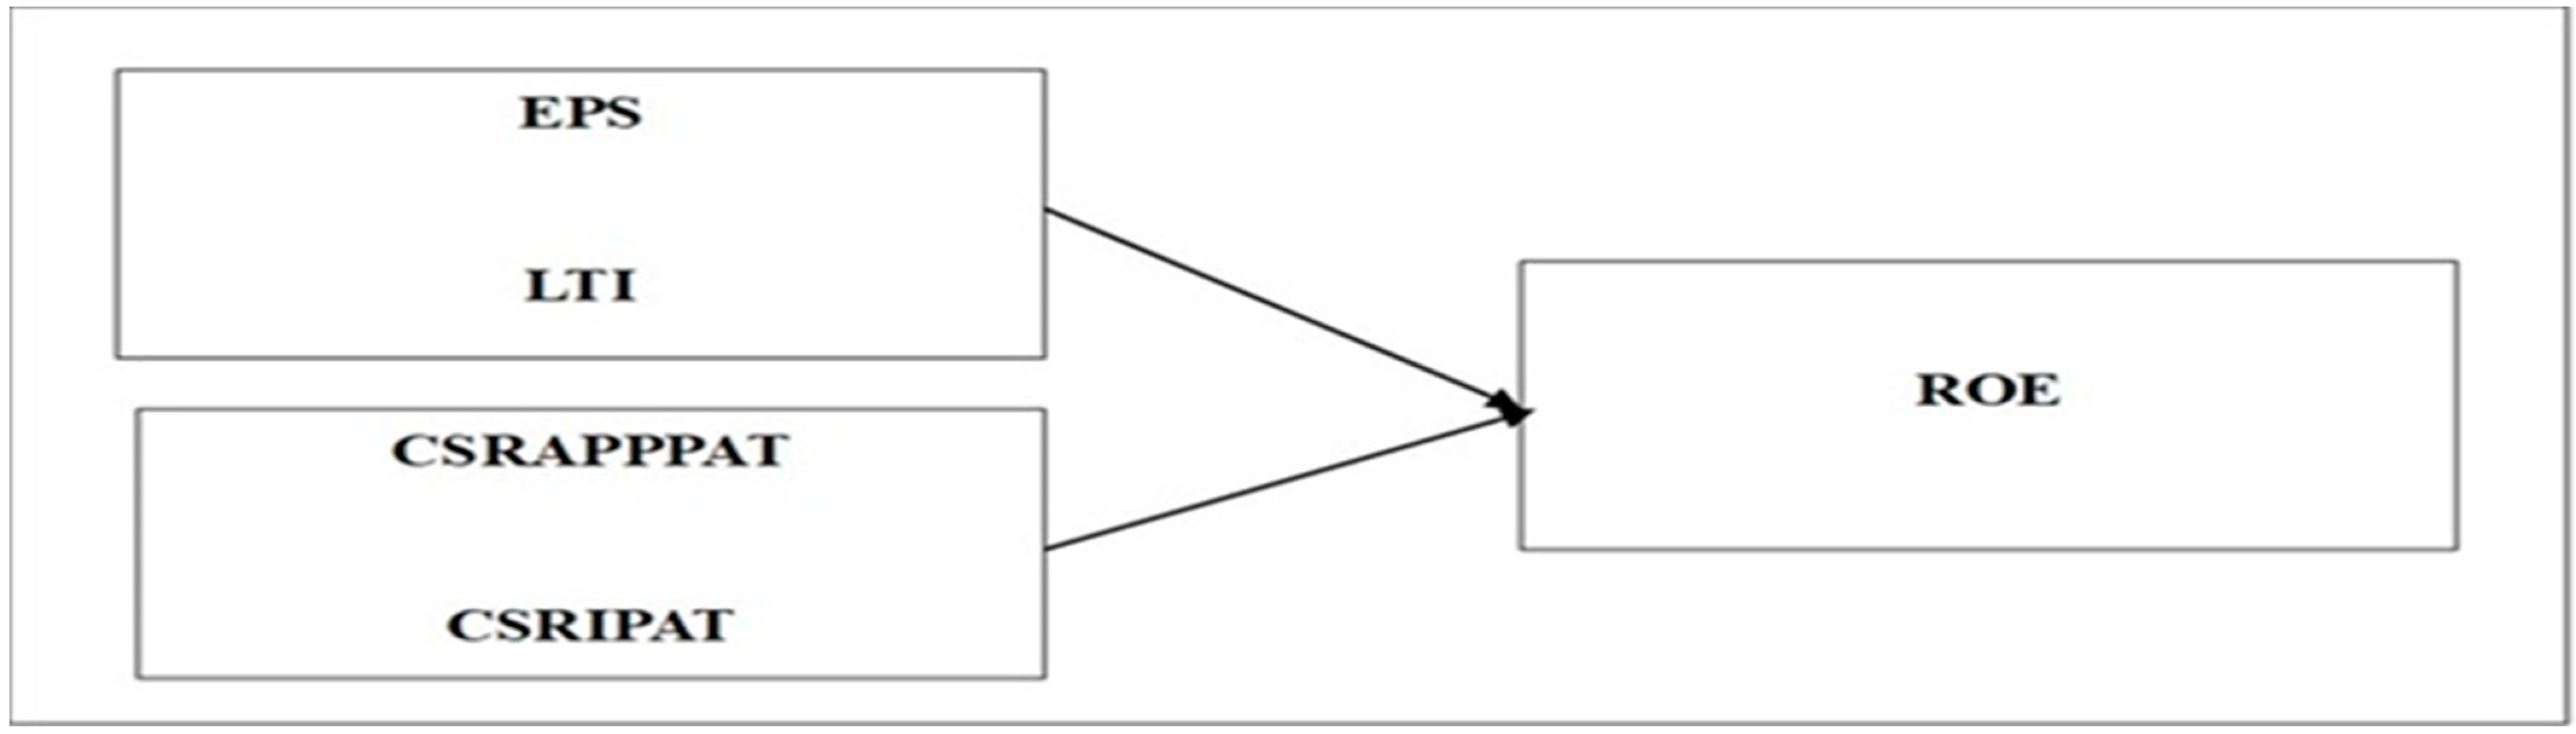
The growing importance of CSR disclosure and its strategic benefit has resulted in firms incorporating CSR disclosure and its applicability in their financial reports. This has increased the CSR investment in India (Malik 2015). The CSR disclosure and investment in return increase the shareholder’s return. (Suttipun and Thanyaorn 2021; Bardos et al. 2020), and Melinda and Wardhani (2020). This motivated the researchers to develop an empirical model to establish the association of CSR applicability and investment with shareholder return (ROE). The empirical model was developed by applying the panel data regression. To determine the relationship between the dependent and independent variables, a linear model based on a straight line was used. Considering the heterogeneity across the variables, panel data regression was applied (Baltagi 2008). Thus, the study also used panel data regression to estimate the model. The model is proposed with the dependent variable as ROE and the independent variables as CRSAPPPAT and CRSIPAT with controlled variables EPS and LTI (Figure 1).
The estimated model’s multicollinearity was examined. When there is a strong connection between the independent variables, multicollinearity is present. Variance of factors (VIF) and Pearson correlation were computed and examined to verify the multicollinearity issue.
5. Results and Discussion
5.1. Do the CSR Applicability/PAT of the Firms Pre- and Post-SDG Periods Differ?
Table 3 indicates the average and standard deviation (SD) for CSR applicability/PAT% of the firms before the implementation of mandatory CSR and SDG by the Companies Act 2013, section 135; the average was 0.00210 and the SD was 0.00295. After CSR and SDG were made mandatory by the Companies Act 2013; section 135, the average of the CSR applicability/PAT% was increased to 0.02359 and the SD also improved to 0.0528.
It was very evident that as it was made mandatory by the Companies Act 2013, section 135, the firms improved their investment in CSR as it was mandatory to spend 2% of their average net profit for the past three years on CSR. But as it was not uniformly applicable by the firms, the SD also increased significantly.
5.2. Do the CSR Investment/PAT of the Firms Pre- and Post-SDG Periods Differ?
Table 4 reflects the average and standard deviation (SD) of the firms before the implementation of mandatory CSR and SDG by the Companies Act 2013, section 135; the average of the firms in CSR investment/PAT% was 0.001673 and the SD was 0.003211. After the CSR and SDG were made mandatory by the Companies Act 2013, section 135, the average of the CSR investment/PAT% was boosted to 0.022269 and the SD also increased to 0.043726.
The Companies Act 2013, section 135 made CSR investments compulsory for the Indian firms; after that, there was a significant increase in the CSR investment/PAT% of the firms. At the same time, all the firms were not in the same space to implement the same, so the SD also increased in the post-SDG period.
5.3. Do the CSR Applicability/PAT of the Firms Who Are Committed to CSR vs. Those That Are Not Committed Differ?
Examining the findings of Table 5, it was evident that the firms committed to CSR have a higher average for CSR applicability/PAT% of 0.013962 and 0.033185 of SD. Whereas the firms not committed to CSR reported a low average and SD of 0.01083 and 0.015973, respectively.
The firms committed to CSR have a higher CSR applicability/PAT%, as they have plans and strategies in place for the implementation of CSR expenditure. The SD reported was also higher, as the variation among the firms was also higher. The research conducted by Atan (2017) reflected that there has been no significant impact on CSR disclosure and firm performance. Thus, the firms having CSR disclosure and firms having no CSR disclosure may have the same firm performance.
5.4. Do the CSR Investment/PAT of the Firms Who Are Committed to CSR vs. Those That Are Not Committed Differ?
Examining the findings of Table 6, it was found that the firms committed to CSR have a lower average for CSR investment/PAT% of 0.012463 but a higher SD of 0.025577. Whereas the firms not committed to CSR reported a high average of 0.014013 and a slightly lower SD of 0.024211.
According to these findings, the average CSR investment/PAT% for the firms that are committed to CSR was slightly lower than it was for those that are not. This implies that companies that have made CSR commitments may have changed their CSR strategies without necessarily increasing the percentage of PAT devoted to CSR. In contrast, these firms might have expanded their revenues more quickly than they did their CSR spending.
It is crucial to keep in mind that additional research would be necessary to discover whether these differences are statistically significant. It is also important to consider the findings’ broader context, which includes shifting social and economic conditions as well as the specific effects of CSR on business priorities and plans.
5.5. Correlations Analysis and VIFs
Subsequently, the Pearson correlation test and variance of factors (VIFs) were conducted to check the multicollinearity problem. Pearson correlation coefficients were computed to understand the association among the variables used in the model. The findings are captured in Table 7. The variable ROE had a significant positive relation between EPS and LTI. CSRAPPPAT and CSRIPAT had a negative relation with ROE, but they were statistically significant. The variable EPS was found statistically insignificant with all other variables.
Similarly, the variable LTI had a statistically significant positive relationship with CSRAPPPAT and CSRIPAT. CSRAPPPAT had a positive relation with CSRIPAT and was found to be statistically significant. All the correlation coefficients of the variables were within the limit of 0.3. So further, VIFs were calculated for all independent and control variables, and it was found that the VIF values for the variables were below 2. Therefore, it can be concluded that there was no serious multicollinearity problem.
5.6. Panel Data Regression Analysis
Table 8 provides the results of the fixed effect and random effect panel data regression analysis. The null hypothesis was not accepted, as the p-value for f statistics was less than the five percent significance level. Therefore, the fixed-effect model was well-fitted. The R-squared value was 0.57, which represents that the total variation of 5.70 percent of the variability in ROE was described by the four independent variables. The independent variables EPS were found statistically significant but the LTI, CSRAPPPAT, and CSRIPAT were not significant. The variables EPS were positively related to ROE, whereas LTI, CSRAPPPAT, and CSRIPAT were negatively related to ROE.
For the random effect, the null hypothesis was also not accepted as the p-value of the Wald chi-squared was less than a five percent significance level. Therefore, the random effect model was also fitted. The R-squared value was 0.0.598, which represents that 5.98 percent of the variability in ROE was explained by all four independent variables of the model. The same observation was found in the case of random effects. The variables LTI and EPS had a positive relation with ROE.
The null hypothesis H1o was accepted, and no significant relation was found between CSR Applicability/PAT with the shareholder’s return. Also, the null hypothesis H2o was accepted, and no significant relation was found between CSR investment/PAT with the shareholder’s return. Thus, it is concluded that CSR disclosure and applicability investment done by the firms on CSR has no profound contribution in the firm’s performance in return having an impact on the ROE of the firms.
The findings were in line with the study conducted by (Brammer et al. 2006; Lee et al. 2009; Nollet et al. 2016; Garcia and Orsato 2020; Folger-Laronde et al. 2020; Mittal et al. 2008; Crisóstomo et al. 2011; Velte 2017). Whereas Dkhili (2023) contradicts the results, indicating that CSR disclosure has a positive impact on firm performance.
Further, the Hausman test was conducted to check the best-fit model. The result was presented in Table 9, which indicated that the null hypothesis was accepted as the p-value was greater than a five percent significance level. So, the random effect model was a better fit. Therefore, the empirical model estimated by the random effect was presented as follows:
ROEit = 18.964 + 0.003(EPSit) + 0.194(LTIit) − 5.622(CSRAPPPATit) − 21.712(CSRIPATit) + εit
6. Conclusions
The study analyzed CSR impact on the financial performance of the selected Indian-listed firms as per Appendix A. The sample consists of the NSE-Nifty-100, which indexed 100 companies for a span of fourteen years (2009–2023). The study used the shareholders’ return (ROE) to examine the research question and hypothesis testing. The literature review gave a mixed response on the direction of the relationship of the hypothesis. The findings of the study suggest that CSR applicability and investment affect the financial performance of the firms significantly at a 95 percent confidence level. The hypothesis was accepted that no significant relation was found between CSR applicability/PAT with ROE (Lee et al. 2009; Nollet et al. 2016; Garcia and Orsato 2020; Folger-Laronde et al. 2020; Mittal et al. 2008; Crisóstomo et al. 2011; Velte 2017).
Also, no significant relation was found between CSR investment/PAT with ROE. The shareholders’ return (ROE) is considered as a short-term financial performance, which has not resulted in a significant impact from the CSR investment (Giannopoulos et al. 2022). The Companies Act 2013, section 135, made CSR investments compulsory for Indian firms; after that, there was a significant increase in the CSR investment/PAT% of the firms. At the same time, all the firms were not in the same space to implement the same amount, so the SD also increased in the post-SDG period. Moreover, the firms committed to CSR have a higher CSR applicability/PAT% as they have plans and strategies in place for the implementation of CSR expenditure. The SD reported was also higher, as the variation among the firms was also higher. Another important finding of the study was that the average CSR investment/PAT% for the firms that are committed to CSR was slightly lower than it was for those that are not. This implies that companies that have made CSR commitments may have changed their CSR strategies without necessarily increasing the percentage of PAT devoted to CSR. In contrast, these firms might have expanded their revenues more quickly than they did their CSR spending.
The study contributes to the current literature about CSR/ESG investment concerning an emerging economy like India. The actual CSR initiatives taken up by the sample firms might not have been communicated well to the stakeholders, like consumers, employees, peers, and investors. The results coincide with the observation drawn by (PwC 2018), SDGs were unable to perform better due to communication gaps with investors, peers, employees, and customers. A firm may be investing in CSR activities but the same may not be reflected in the shareholders’ return. Another limitation of the study may be that some variables might be omitted that affected the firm’s performance and the CSR investment (Dalal and Thaker 2019). These factors may be measuring the firm’s performance through Tobin’s Q as proxy growth and long-term performance measures. At the same time, the ESG scores of the firms can also act as the CSR investment outcomes.
7. Future Scope for Research
There is a scope for future research with a larger data set including a greater number of firms listed in the NSE. The ESG scores of the firms may also be explored to better understand the CSR investments made by the firms. A tool for the long-term firm’s performance measurement like Tobin’s Q can be considered to investigate the impact of ESG initiatives on corporate performance. The social and the environmental factors can also be explored for understanding the overall impact and initiative towards ESG.
The regulatory initiatives related to CSR and ESG already rolled out in India from 2014 onwards in a phase-wise manner, as depicted in Table 1. Based on the literature and the research findings, a more streamlined action is required to minimize the CSR promise–performance gap.
Author Contributions
Conceptualization: N.S., P.P., S.G. and S.T.; Methodology: N.S., P.P. and S.G.; Software: N.S., P.P. and S.G.Validation: N.S., P.P., S.G. and S.T.; Formal Analysis: N.S., P.P. and S.G.; Investigation: N.S., P.P. and S.G.; Resource, Data Curation: N.S., P.P. and S.G.; Writing—original draft preparation: N.S., P.P., S.G. and S.T.; Writing—review and editing: N.S., P.P., S.G. and S.T.; Visualization: N.S., P.P. and S.G.; Supervision: N.S., P.P., S.G. and S.T.; Project administration: N.S., P.P., S.G. and S.T. All authors have read and agreed to the published version of the manuscript.
Funding
This research received no external funding.
Data Availability Statement
The raw data supporting the conclusions of this article will be made available by the authors on request.
Acknowledgments
The support provided by FORE School of Management, New Delhi, India in writing this paper is highly appreciable.
Conflicts of Interest
The authors declare no conflict of interest.
Appendix A
| S. No. | Company Name |
| 1 | A B B India Ltd. |
| 2 | A C C Ltd. |
| 3 | Adani Energy Solutions Ltd. |
| 4 | Adani Green Energy Ltd. |
| 5 | Adani Total Gas Ltd. |
| 6 | Ambuja Cements Ltd. |
| 7 | Apollo Hospitals Enterprise Ltd. |
| 8 | Asian Paints Ltd. |
| 9 | Avenue Supermarts Ltd. |
| 10 | Axis Bank Ltd. |
| 11 | Bajaj Auto Ltd. |
| 12 | Bajaj Finance Ltd. |
| 13 | Bajaj Finserv Ltd. |
| 14 | Bajaj Holdings & Invst. Ltd. |
| 15 | Bank Of Baroda |
| 16 | Berger Paints India Ltd. |
| 17 | Bharat Petroleum Corpn. Ltd. |
| 18 | Bharti Airtel Ltd. |
| 19 | Bosch Ltd. |
| 20 | Britannia Industries Ltd. |
| 21 | Canara Bank |
| 22 | Cholamandalam Investment & Finance Co. Ltd. |
| 23 | Cipla Ltd. |
| 24 | Coal India Ltd. |
| 25 | Colgate-Palmolive (India) Ltd. |
| 26 | D L F Ltd. |
| 27 | Dabur India Ltd. |
| 28 | Divi’S Laboratories Ltd. |
| 29 | Dr. Reddy’S Laboratories Ltd. |
| 30 | Eicher Motors Ltd. |
| 31 | F S N E-Commerce Ventures Ltd. |
| 32 | G A I L (India) Ltd. |
| 33 | Godrej Consumer Products Ltd. |
| 34 | Grasim Industries Ltd. |
| 35 | H C L Technologies Ltd. |
| 36 | H D F C Asset Mgmt. Co. Ltd. |
| 37 | H D F C Bank Ltd. |
| 38 | H D F C Life Insurance Co. Ltd. |
| 39 | Havells India Ltd. |
| 40 | Hero Motocorp Ltd. |
| 41 | Hindalco Industries Ltd. |
| 42 | Hindustan Unilever Ltd. |
| 43 | I C I C I Bank Ltd. |
| 44 | I C I C I Lombard General Insurance Co. Ltd. |
| 45 | I C I C I Prudential Life Insurance Co. Ltd. |
| 46 | Indian Oil Corpn. Ltd. |
| 47 | Indian Railway Catering & Tourism Corpn. Ltd. |
| 48 | Indus Towers Ltd. |
| 49 | Indusind Bank Ltd. |
| 50 | Info Edge (India) Ltd. |
| 51 | Infosys Ltd. |
| 52 | Interglobe Aviation Ltd. |
| 53 | J S W Steel Ltd. |
| 54 | Kotak Mahindra Bank Ltd. |
| 55 | Larsen & Toubro Ltd. |
| 56 | Life Insurance Corpn. Of India |
| 57 | Ltimindtree Ltd. |
| 58 | Mahindra & Mahindra Ltd. |
| 59 | Marico Ltd. |
| 60 | Maruti Suzuki India Ltd. |
| 61 | Muthoot Finance Ltd. |
| 62 | Nestle India Ltd. |
| 63 | P I Industries Ltd. |
| 64 | Page Industries Ltd. |
| 65 | Pidilite Industries Ltd. |
| 66 | Power Grid Corpn. Of India Ltd. |
| 67 | Procter & Gamble Hygiene & Health Care Ltd. |
| 68 | Reliance Industries Ltd. |
| 69 | S B I Cards & Payment Services Ltd. |
| 70 | S B I Life Insurance Co. Ltd. |
| 71 | S R F Ltd. |
| 72 | Samvardhana Motherson Intl. Ltd. |
| 73 | Shree Cement Ltd. |
| 74 | Siemens Ltd. |
| 75 | State Bank Of India |
| 76 | Sun Pharmaceutical Inds. Ltd. |
| 77 | Tata Consultancy Services Ltd. |
| 78 | Tata Consumer Products Ltd. |
| 79 | Tata Motors Ltd. |
| 80 | Tata Power Co. Ltd. |
| 81 | Tata Steel Ltd. |
| 82 | Tech Mahindra Ltd. |
| 83 | Titan Company Ltd. |
| 84 | Torrent Pharmaceuticals Ltd. |
| 85 | Ultratech Cement Ltd. |
| 86 | Varun Beverages Ltd. |
| 87 | Wipro Ltd. |
| 88 | Zomato Ltd. |
| 89 | Adani Enterprises Ltd. |
| 90 | Adani Ports & Special Economic Zone Ltd. |
| 91 | Adani Wilmar Ltd. |
| 92 | Bharat Electronics Ltd. |
| 93 | Hindustan Aeronautics Ltd. |
| 94 | I T C Ltd. |
| 95 | Jindal Steel & Power Ltd. |
| 96 | N T P C Ltd. |
| 97 | Oil & Natural Gas Corpn. Ltd. |
| 98 | U P L Ltd. |
| 99 | United Spirits Ltd. |
| 100 | Vedanta Ltd. |
References
- Al Lawati, Hidaya, and Khaled Hussainey. 2022. Does Sustainable Development Goals Disclosure Affect Corporate Financial Performance? Sustainability 14: 7815. [Google Scholar] [CrossRef]
- Anifowose, Mutalib, Salihin Abang, and Muntaka Alhaji Zakari. 2020. Integrated capitals reporting and companies’ sustainable value: Evidence from the Asian continent. Asian Review of Accounting 28: 567–89. [Google Scholar] [CrossRef]
- Ansoff, H. Igor. 1965. Corporate Strategy. New York: McGraw Hill. [Google Scholar]
- Atan, Ruhaya. 2017. The impacts of environmental, social, and governance factors on firm performance. Management of Environmental Quality 29: 182–94. [Google Scholar] [CrossRef]
- Atan, Ruhaya, Md Mahmudul Alam, Jamaliah Said, and Mohamed Zamri. 2018. The impacts of environmental, social and governance factors on firm performance: Panel Study of Malaysian Companies. Management Environmental Quality 29: 182–94. [Google Scholar] [CrossRef]
- Baltagi, Badi H. 2008. Econometric Analysis of Panel Data. Chichester: John Wiley & Sons. [Google Scholar]
- Bardos, Katsiaryna Salavei, Mine Ertugrul, and Lucia Silva Gao. 2020. Corporate social responsibility, product market perception, and firm value. Journal of Corporate Finance 62: 101588. [Google Scholar] [CrossRef]
- Barnett, Michael L., and Robert M. Salomon. 2006. Beyond dichotomy: The curvilinear relationship between social responsibility and financial performance. Strategic Management Journal 27: 1101–22. [Google Scholar] [CrossRef]
- Berle, A. A., Jr. 1931. Corporate powers as powers in trust. Harvard Law Review 44: 1049–74. [Google Scholar] [CrossRef]
- Berle, A. A., Jr. 1954. The 20th Century Capitalist Revolution. New York: Harcourt, Brace and Company. [Google Scholar]
- Bhattacharyya, Asit, and Md Lutfur Rahman. 2019. Mandatory CSR expenditure and firm performance. Journal of Contemporary Accounting and Economics 15: 100163. [Google Scholar] [CrossRef]
- Brammer, Stephen, and Andrew Millington. 2008. Does it pay to be different? An analysis of the relationship between corporate social and financial performance. Strategic Management Journal 29: 1325–43. [Google Scholar] [CrossRef]
- Brammer, Stephen, Chris Brooks, and Stephen Pavelin. 2006. Corporate Social Performance and Stock Returns: U.K. Evidence from Disaggregate Measures. Financial Management 35: 97–116. [Google Scholar] [CrossRef]
- Brønn, Peggy Simcic, and Debohar Vidaver-Cohen. 2009. Corporate motives for social initiative: Legitimacy, sustainability, or the bottom line? Journal of Business Ethics 87: 91–109. [Google Scholar] [CrossRef]
- Brunen, Ann Christine, and Oliver Laubach. 2022. Do sustainable consumers prefer socially responsible investments? A study among the users of robo advisors. Journal of Banking and Finance 136: 106314. [Google Scholar] [CrossRef]
- Carroll, Archie B. 1999. Corporate Social Responsibility: Evolution of a Definitional Construct. Business & Society 38: 268–95. [Google Scholar]
- Carroll, Archie B., and Kareem. M. Shabana. 2010. The business case for corporate social responsibility: A review of concepts, research and practice. International Journal of Management Reviews 12: 85–105. [Google Scholar] [CrossRef]
- Cho, Yoonkyo. 2022. ESG and firm performance: Focusing on the environmental strategy. Sustainability 14: 7857. [Google Scholar] [CrossRef]
- Crisóstomo, Vicente Lima, Fatima de Souza Freire, and Felipe Cortes De Vasconcellos. 2011. Corporate social responsibility, firm value and financial performance in Brazil. Social Responsibility Journal 7: 295–309. [Google Scholar] [CrossRef]
- Dalal, Karishma Anklesaria, and Nimit Thaker. 2019. ESG and Corporate Financial Performance: A Panel Study of Indian Companies. IUP Journal of Corporate Governance 18: 44–59. [Google Scholar]
- Derwall, Jeroen, Nadja Guenster, Rob Bauer, and Kees Koedijk. 2005. The Eco-Efficiency Premium Puzzle. Financial Analysts Journal 61: 51–63. [Google Scholar] [CrossRef]
- Dharmapala, Dhammika, and Vikramaditya S. Khanna. 2016. The Impact of Mandated Corporate Social Responsibility: Evidence from India’s Companies Act of 2013. Available online: https://ssrn.com/abstract=2895986 (accessed on 19 April 2024).
- DiMaggio, Paul, and Walter W. Powell. 1983. The iron cage revisited: Collective rationality and institutional isomorphism in organizational fields. American Sociological Review 48: 147–60. [Google Scholar] [CrossRef]
- DiMaggio, Paul J., and Walter W. Powell, eds. 1991. The New Institutionalism in Organizational Analysis. Chicago: University of Chicago Press, vol. 17, pp. 1–38. [Google Scholar]
- Diouf, Dominique, El Hadji Toure, and Teassa Hebb. 2016. Exploring factors that influence social retail investors’ decisions: Evidence from Desjardins fund. Journal of Business Ethics 134: 45–67. [Google Scholar] [CrossRef]
- Dkhili, Hichem. 2023. Does environmental, social and governance (ESG) affect market performance ? The moderating role of competitive advantage. Competitiveness Review—An International Business Journa 34: 327–52. [Google Scholar] [CrossRef]
- Dodd, E. Merrick. 1932. For whom are managers trustees? Harvard Law Review 45: 1145–63. [Google Scholar]
- Drempetic, Samuel, Christian Klein, and Bernhard Zwergel. 2019. The Influence of Firm Size on the ESG Score: Corporate Sustainability Ratings under Review. Journal of Business Ethics 167: 333–60. [Google Scholar] [CrossRef]
- Feng, Zifeng, and Zhonghua Wu. 2021. ESG disclosure, REIT debt financing and firm value. The Journal of Real Estate Finance and Economics 67: 388–422. [Google Scholar] [CrossRef]
- Fitch, H. G. 1976. Achieving corporate social responsibility. Academy of Management Review 1: 38–46. [Google Scholar] [CrossRef]
- Folger-Laronde, Zachary, Sep Pashang, Leah Feor, and Amr ElAlfy. 2020. ESG ratings and financial performance of exchange-traded funds during the COVID-19 pandemic. Journal of Sustainable Finance & Investment 12: 490–96. [Google Scholar]
- Freeman, R. Edward. 1984. Strategic Management: A Stakeholder Theory Approach. Boston: Pitman. [Google Scholar]
- Friede, Gunnar, Timo Busch, and Alexander Bassen. 2015. ESG and financial performance: Aggregated evidence from more than 2000 empirical studies. Journal of Sustainable Finance and Investment 5: 210–33. [Google Scholar] [CrossRef]
- Friedman, M. 1970. The Social Responsibility of Business Is to Increase Its Profits. New York Times Magazine, September 13. [Google Scholar]
- Galema, Rients, Auke Plantinga, and Bert Scholtens. 2008. The Stocks at Stake: Return and risk in socially responsible investment. Journal of Banking and Finance 32: 2646–54. [Google Scholar] [CrossRef]
- Garcia, Alexandre Sanches, and Renato J. Orsato. 2020. Testing the institutional difference hypothesis: A study about environmental, social, governance, and financial performance. Business Strategy and the Environment 29: 3261–72. [Google Scholar] [CrossRef]
- García, Fernando, David González-Bueno, Jairo Guijarro Francisco, and Javier Oliver. 2020. Forecasting the Environmental, Social, and Governance Rating of Firms by Using Corporate Financial Performance Variables: A Rough Set Approach. Sustainability 12: 3324. [Google Scholar] [CrossRef]
- Garriga, Elisabet, and Domenec Melé. 2004. Corporate social responsibility theories: Mapping the territory. Journal of Business Ethics 53: 51–71. [Google Scholar] [CrossRef]
- Giannopoulos, George, Renate Victoria Kihle Fagernes, Mahmoud Elmarzouky, and Kazi Abul Bashar Muhammad Afzal Hossain. 2022. The ESG Disclosure and the Financial Performance of Norwegian Listed Firms. Journal of Risk and Financial Management 15: 237. [Google Scholar] [CrossRef]
- Grewal, Jodey, Eddie Riedl, and George Serafeim. 2019. Market reaction to mandatory nonfinancial disclosure. Management Science 65: 3061–84. [Google Scholar] [CrossRef]
- Han, Jae-Joon, Hyun Jeong Kim, and Jeongmin Yu. 2016. Empirical study on relationship between corporate social responsibility and financial performance in Korea. Asian Journal of Sustainability and Social Responsibility 1: 61–76. [Google Scholar] [CrossRef]
- Harrison, Jeffrey S. 2011. Stakeholder theory in strategic management: A retrospective. In Stakeholder Theory: Impact and Prospects. Edited by Robert A. Phillips. Cheltenham: Elgar, pp. 99–110. [Google Scholar]
- Humphrey, Jacquelyn E., Darren D. Lee, and Yaokan Shen. 2012. Does it cost to be sustainable? Journal of Corporate Finance 18: 636–39. [Google Scholar] [CrossRef]
- Iatridis, George Emmanuel. 2013. Environmental disclosure quality: Evidence on environmental performance, corporate governance and value relevance. Emerging Markets Review 14: 55–75. [Google Scholar] [CrossRef]
- Ismail, Maimunah. 2009. Corporate social responsibility and its role in community development: An international perspective. The Journal of International Social Research 2: 199–209. [Google Scholar]
- Jensen, Michael, and William Meckling. 1976. Theory of the firm: Managerial behavior, agency costs and capital structure. Journal of Financial Economics 3: 305–60. [Google Scholar] [CrossRef]
- Jo, Hoje, and Maretno A. Harjoto. 2011. Corporate Governance and Firm Value: The Impact of Corporate Social Responsibility. Journal of Business Ethics 103: 351–83. [Google Scholar] [CrossRef]
- Jones, Thomas M. 1995. Instrumental stakeholder theory: A synthesis of ethics and economics. Academy of Management Review 20: 404–37. [Google Scholar] [CrossRef]
- KPMG. 2017. Available online: https://assets.kpmg.com/content/dam/kpmg/be/pdf/2017/kpmg-survey-of-corporate-responsibility-reporting-2017.pdf (accessed on 12 December 2023).
- Laskar, Najul, and Santi Gopal Maji. 2018. Disclosure of corporate sustainability performance and firm performance in Asia. Asian Review of Accounting 26: 414–43. [Google Scholar] [CrossRef]
- Lee, Darren D., Robert W. Faff, and Kim Langfield-Smith. 2009. Revisiting the Vexing Question: Does Superior Corporate Social Performance Lead to Improved Financial Performance? Australian Journal of Management 34: 21–49. [Google Scholar] [CrossRef]
- Li, Yiwei, Mengfeng Gong, Xiuye Zhang, and Lenny Koh. 2018. The impact of environmental, social, and governace disclosure on firm value: The role of CEO power. The British Accounting Review 50: 60–75. [Google Scholar] [CrossRef]
- Liu, Felicia, David Demeritt, and Samuel Tang. 2019. Accounting for sustainability in Asia: Stock market regulation and reporting in Hong Kong and Singapore. Economic Geography 95: 362–84. [Google Scholar] [CrossRef]
- Lo, Kar Yee, and Calvin Lee Kwan. 2017. The effect of environmental, social, governance and sustainability initiatives on stock value–Examining market response to initiatives undertaken by listed companies. Corporate Social Responsibility and Environmental Management 24: 606–19. [Google Scholar] [CrossRef]
- Luo, Xueming, and Chinmoy B. Bhattacharya. 2009. The debate over doing good: Corporate social performance, strategic marketing levers, and firmidiosyncratic risk. Journal of Marketing 73: 198–213. [Google Scholar] [CrossRef]
- Malik, Mahfuja. 2015. Value-enhancing capabilities of CSR: A brief review of contemporary literature. Journal of Business Ethics 127: 419–38. [Google Scholar] [CrossRef]
- Martínez-Ferrero, Jennifer, Isabel Gallego-Álvarez, and Isabel Maria García-Sánchez. 2015. A bidirectional analysis of earnings management and corporate social responsibility: The moderating effect of stakeholder and investor protection. Australian Accounting Review 25: 359–71. [Google Scholar] [CrossRef]
- McWilliams, Abagail, and Donald Siegel. 2001. Corporate social responsibility: A theory of the firm perspective. Academy of Management Review 26: 117–27. [Google Scholar] [CrossRef]
- Melinda, Anna, and Ratna Wardhani. 2020. The effect of environmental, social, governance, and controversies on firms. Value: Evidence from Asia 27: 147–73. [Google Scholar] [CrossRef]
- Mintzberg, Henry, Joseph Lampel, and Bruce Ahlstrand. 2009. Strategy Safari: A Guided Tour through the Wilds of Strategic Management. Minnesota: The Free Press. [Google Scholar]
- Mittal, Raj Kumar, Neena Sinha, and Archana Singh. 2008. An analysis of linkage between economic value added and corporate social responsibility. Management Decision 46: 1437–43. [Google Scholar] [CrossRef]
- Nollet, Joscha, George Filis, and Evangelos Mitrokostas. 2016. Corporate social responsibility and financial performance: A non-linear and disaggregated approach. Economic Modelling 52: 400–7. [Google Scholar] [CrossRef]
- Odell, Jamieson, and Usman Ali. 2016. ESG investing in emerging and frontier markets. Journal of Applied Corporate Finance 28: 96–101. [Google Scholar] [CrossRef]
- Peiris, Dinusha, and John Evans. 2010. The relationship between environmental social governance factors and U.S. stock performance. Journal of Investing 19: 104–12. [Google Scholar] [CrossRef]
- Perez-Gladish, Blanca, Karan Benson, and Robert Faff. 2012. Profiling socially responsible investors: Australian evidence. Australian Journal of Management 37: 189–209. [Google Scholar] [CrossRef]
- PwC. 2018. From Promise to Reality: Does Business Really Care about the SDGs? Available online: www.pwc.com/sdgreportingchallenge (accessed on 10 October 2023).
- PwC. 2021. Mainstreaming ESG via Business Responsibility and Sustainability Reporting. PricewaterhouseCoopers Private Limited. Available online: https://www.pwc.in/assets/pdfs/consulting/esg/business-responsibility-and-sustainability-report.pdf (accessed on 10 October 2023).
- Rönnegard, David, and N. Craig Smith. 2019. Shareholder primacy vs. stakeholder theory: The law as constraint and potential enabler. In Cambridge Handbook of Stakeholder Theory. Edited by Jeffrey S. Harrison, Jay B. Barney, R. Edward Freeman and Robert A. Phillips. Cambridge: Cambridge University Press, pp. 117–31. [Google Scholar]
- Scott, W. Richard. 1987. The adolescence of institutional theory. Administrative Science Quarterly 32: 493–511. [Google Scholar] [CrossRef]
- Sehrawat, Neeraj Kumar, Sumanjeet Singh, and Amit Kumar. 2020. Does corporate governance affect financial performance of firms? A large sample evidence from India. Business Strategy & Development 3: 615–25. [Google Scholar] [CrossRef]
- Stout, Lynn A. 2012. The Shareholder Value Myth: How Putting Shareholders First Harms Investors, Corporations, and the Public. San Francisco: Berrett-Koehler. [Google Scholar]
- Sultana, Sayema, Norhayah Zulkifli, and Dalilawati Zainal. 2018. Environmental, social and governance (ESG) and investment decision in Bangladesh. Sustainability 10: 1831. [Google Scholar] [CrossRef]
- Sundar, Pushpa. 2000. Beyond Business: From Merchant Charity to Corporate Citizenship: Indian Business Philanthropy through the Ages. New Delhi: Tata McGraw-Hill Publishing Company. [Google Scholar]
- Suttipun, M., and Y. Thanyaorn. 2021. Impact of Environmental, Social and Governance Disclosures on Market Reaction: An Evidence of Top50 Companies Listed from Thailand. Journal of Financial Reporting and Accounting 20: 753–67. [Google Scholar] [CrossRef]
- Vafaei, Alireza, Dennis Taylor, and Kamran Ahmed. 2011. The value relevance of intellectual capital disclosures. Journal of Intellectual Capital 12: 407–29. [Google Scholar] [CrossRef]
- Van de Ven, Bert. 2008. An Ethical Framework for the Marketing of Corporate Social Responsibility. Journal of Business Ethics 82: 339–52. [Google Scholar] [CrossRef]
- Velte, P. 2017. Does ESG performance have an impact on financial performance? Evidence from Germany. Journal of Global Responsibility 8: 169–78. [Google Scholar] [CrossRef]
- Waddock, Sandra A., and Samuel B. Graves. 1997. The Corporate Social Performance-Financial Performance Link. Strategic Management Journal 18: 303–19. [Google Scholar] [CrossRef]
- Wang, Qian, Junsheng Dou, and Shenghua Jia. 2016. A meta-analytic review of corporate social responsibility and corporate financial performance: The moderating effect of contextual factors. Business & Society 55: 1083–121. [Google Scholar] [CrossRef]
- Wicks, Andrew C., F. A. Elmore, and David Jonas. 2019. Connecting stakeholder theory to the law and public policy. In Cambridge Handbook of Stakeholder Theory. Edited by Jeffery S. Harrison, Jay B. Barney, R. Edward Freeman and Robert A. Phillips. Cambridge: Cambridge University Press, pp. 97–116. [Google Scholar]
- Wu, Meng-Wen, and Chung-Hua Shen. 2013. Corporate social responsibility in the banking industry: Motives and financial performance. Journal of Banking and Finance 37: 3529–47. [Google Scholar] [CrossRef]
- Yoon, Bohyun, Jeong Hwan Lee, and Ryan Byun. 2018. Does ESG performance enhance firm value? Evidence from Korea. Sustainability 10: 3635. [Google Scholar] [CrossRef]
- Zubeltzu-Jaka, Eugenio, Lorea Andicoechea-Arondo, and Igor Alvarez Etxeberria. 2018. Corporate social responsibility and corporate governance and corporate financial performance: Bridging concepts for a more ethical business model. Business Strategy & Development 1: 214–22. [Google Scholar] [CrossRef]
- Zumente, IIze, and Julija Bistrova. 2021. ESG importance for long-term shareholder value creation: Literature vs. practice. Journal of Open Innovation: Technology, Market, and Complexity 7: 127. [Google Scholar] [CrossRef]
Figure 1.
Proposed Model, Authors’ Compilation, Yit—Dependent variable with “i” as firms and “t” as years, R1, R2, R3, and R4—Independent variables with “i” as firms and “t” as years, β1, β2, β3, β4, and β5—Coefficient of independent variables, and εit—Error term.
Figure 1.
Proposed Model, Authors’ Compilation, Yit—Dependent variable with “i” as firms and “t” as years, R1, R2, R3, and R4—Independent variables with “i” as firms and “t” as years, β1, β2, β3, β4, and β5—Coefficient of independent variables, and εit—Error term.


Table 1.
Evolution of CSR journey in India.
| Year | Concern | Action |
|---|---|---|
| 2009 | National Voluntary Guidelines (NVGs) | Ministry of Corporate Affairs (MCA) issued NVGs for CSR |
| 2012 | Business Responsibility Report (BSR) | Security Exchange Board of India (SEBI) mandated that top 100 listed companies by market capitalization file BRR based on NVGs along with annual report |
| 2014 | Corporate Social Responsibility (CSR) | CSR is mandated and CSR rules come into force |
| 2015 | BRR extension to top 500 listed companies | Requirement for filing BRR was extended to 500 listed companies by market capitalization |
| 2017 | Integrated reporting | SEBI issued guidelines of Integrated reporting for BRR on voluntary basis from financial year 2017–2018 |
| 2019 | National Guidelines on Responsible Business Conduct (NGRBC) | NGRBC release in 2019 |
| 2019 | BRR extension to top 1000 listed companies | SEBI extended BRR to top 1000 listed companies from financial year 2019–2020 |
| 2021 | Business Responsibility and Sustainability Report (BRSR) | BRSR introduced from May 2021 |
| 2023 | Mandatory BRSR for top 1000 listed companies | Mandatory BRSR for top 1000 listed companies from 2023 |
Source: PwC (2021, p. 5) Adapted and modified.
Table 2.
Determinants and Variables Used in Model Estimation with Literature Source.
| Variable Name | Acronym | Calculation | Literature Source |
|---|---|---|---|
| Return on Equity | ROE | Profit after tax/total equity shareholders’ fund X 100 | Lee et al. (2009); Crisóstomo et al. (2011) |
| Earnings per Share | EPS | Profit after tax/no. of equity shares | Brammer and Millington (2008) |
| Log Total Income | LTI | Log (total income) | Giannopoulos et al. (2022) |
| CSR Applicability/PAT | CSRAPPPAT | CSR applicability/profit after tax X 100 | Zumente and Bistrova (2021) |
| CSR Investment/PAT | CSRIPAT | CSR investment/profit after tax X 100 | Brønn and Vidaver-Cohen (2009); Wang et al. (2016) |
Source: Authors’ compilation.
Table 3.
Average and SD for CSR applicability/PAT of the firm pre- and post-SDG period.
| Average | SD | |
|---|---|---|
| Pre-SDG period | 0.002101 | 0.002952 |
| Post-SDG period | 0.023599 | 0.0528 |
Authors’ calculations.
Table 4.
Average and SD for CSR investment/PAT of the firm pre- and post-SDG period.
| Average | SD | |
|---|---|---|
| Pre-SDG period | 0.001673 | 0.003211 |
| Post-SDG period | 0.022269 | 0.043726 |
Authors’ calculations.
Table 5.
Average and SD for CSR applicability/PAT of the firm committed and not committed to CSR.
| Average | SD | |
|---|---|---|
| Firms committed to CSR | 0.013962 | 0.033185 |
| Firms not committed to CSR | 0.01083 | 0.015973 |
Authors’ calculations.
Table 6.
Average and SD for CSR investment/PAT of the firm committed and not committed to CSR.
| Average | SD | |
|---|---|---|
| Firms committed to CSR | 0.012463 | 0.025577 |
| Firms not committed to CSR | 0.014013 | 0.024211 |
Authors’ calculations.
Table 7.
Results of Correlations Analysis and VIFs.
| ROE | EPS | LTI | CSRAPPPAT | CSRIPAT | VIFs | |
|---|---|---|---|---|---|---|
| ROE | 1.0000 | - | ||||
| EPS | 0.2359 * | 1.0000 | 1.00 | |||
| LTI | 0.0653 * | 0.0238 | 1.0000 | 1.01 | ||
| CSRAPPPAT | −0.0345 | −0.0047 | 0.0767 * | 1.0000 | 1.18 | |
| CSRIPAT | −0.0431 | −0.0061 | 0.0821 * | 0.3866 * | 1.0000 | 1.18 |
Notes: * Significant at 5 percent, VIFs—Variance of factors, Authors’ calculation.
Table 8.
Panel Data Regression Model.
| Fixed Effect | Random Effect | |||||
|---|---|---|---|---|---|---|
| ROE | ROE | |||||
| Coefficient (B) | Std. Error | p-Value | Coefficient (B) | Std. Error | p-Value | |
| EPS | 0.0033 | 0.0004 | 0.000 * | 0.0034 | 0.0004 | 0.000 * |
| LTI | −0.0335 | 0.5236 | 0.949 | 0.1946 | 0.4659 | 0.676 |
| CSRAPPPAT | −5.5903 | 7.2452 | 0.441 | −5.6227 | 7.2277 | 0.437 |
| CSRIPAT | −20.9936 | 13.4775 | 0.120 | −21.71297 | 13.4052 | 0.105 |
| Constant | 21.0409 | 4.7505 | 0.000 * | 18.9640 | 4.6080 | 0.000 * |
| R2 | 0.057 | 0.0598 | ||||
| Test | F | 0.000 * | Wald chi-Sq | 0.000 * | ||
* Significant at 5% level, Authors’ calculations.
Table 9.
Fixed Effect vs. Random Effect-Hausman test.
| Model Specification | Test | p-Value |
|---|---|---|
| Fixed effect or random effect | Chi-squared | 0.7826 |
Significant at 5% level. Authors’ calculations.
Disclaimer/Publisher’s Note: The statements, opinions and data contained in all publications are solely those of the individual author(s) and contributor(s) and not of MDPI and/or the editor(s). MDPI and/or the editor(s) disclaim responsibility for any injury to people or property resulting from any ideas, methods, instructions or products referred to in the content. |
© 2024 by the authors. Licensee MDPI, Basel, Switzerland. This article is an open access article distributed under the terms and conditions of the Creative Commons Attribution (CC BY) license (https://creativecommons.org/licenses/by/4.0/).
Share and Cite
MDPI and ACS Style
Singhal, N.; Paul, P.; Giri, S.; Taneja, S. Corporate Social Responsibility: Impact on Firm Performance for an Emerging Economy. J. Risk Financial Manag. 2024, 17, 171. https://doi.org/10.3390/jrfm17040171
AMA Style
Singhal N, Paul P, Giri S, Taneja S. Corporate Social Responsibility: Impact on Firm Performance for an Emerging Economy. Journal of Risk and Financial Management. 2024; 17(4):171. https://doi.org/10.3390/jrfm17040171
Chicago/Turabian StyleSinghal, Neeraj, Pinku Paul, Sunil Giri, and Shallini Taneja. 2024. "Corporate Social Responsibility: Impact on Firm Performance for an Emerging Economy" Journal of Risk and Financial Management 17, no. 4: 171. https://doi.org/10.3390/jrfm17040171