Study and Optimization of Design Parameters in Water Loop Heat Pump Systems for Office Buildings in the Iberian Peninsula †


Polytechnic School of Engineering, University of Oviedo, C/Wifredo Ricart s/n, 33204 Gijón, Spain
*
Author to whom correspondence should be addressed.
†
This paper is an extended version of our paper published in:” Fernández, F.J.; Folgueras, M.B.; Suárez, I. Energy study in water loop heat pump systems for office buildings in the Iberian Peninsula. Energy Procedia 2017, 136, 91–96, also presented at the 4th International Conference on Energy and Environmental Research (ICEER2017).
Energies 2017, 10(12), 1958; https://doi.org/10.3390/en10121958
Submission received: 24 October 2017
/
Revised: 8 November 2017
/
Accepted: 20 November 2017
/
Published: 24 November 2017
(This article belongs to the Special Issue Selected Papers from ICEER 2017: 2017 the 4th International Conference on Energy and Environment Research)
Abstract
:Water loop heat pump (WLHP) air conditioning systems use heat pumps connected to a common water circuit to fulfill the energy demands of different thermal zones in a building. In this study, the energy consumption was analyzed for the air conditioning of an office building in the typical climate of four important cities of the Iberian Peninsula. The energy consumption of one water loop heat pump system was compared with a conventional water system. Two design parameters, the range in the control temperatures and the water loop thermal storage size, were tested. Energy redistribution is an important advantage of the WLHP system, but significant savings came from high efficiency parameters in the heat pumps and minor air flow rates in the cooling tower. The low thermal level in the water loop makes this technology appropriate to combine with renewable sources. Using natural gas as the thermal energy source, a mean decrease in CO2 emissions of 8.1% was reached. Simulations showed that the installation of big thermal storage tanks generated small energy savings. Besides, the total annual consumption in buildings with high internal loads can be reduced by keeping the water loop as cool as possible.
1. Introduction
Water loop heat pump (WLHP) systems are common in the air conditioning of commercial and office buildings. In this scheme, one water loop circuit receives energy from condensation and yields it to evaporation in reversible heat pumps that address the thermal loads of different zones of the building. The net energy necessary to keep the water loop temperature in a proper range can be obtained from gas boilers or other energy production systems and dissipated by cooling towers. One important advantage of these systems is the transfer of energy between zones of the building when the system is simultaneously serving heating and cooling loads. Besides, heat pumps using the water loop as a source have very good efficiency as measured by the energy efficiency ratio (EER) in refrigeration and the coefficient of performance (COP) in heating mode.
Some references to WLHP systems can be found in specialized literature. Their performance has been analyzed in representative weather in China [1] and in several European climatic areas [2]. Yuan and Grabon [3] optimized their working parameters by mathematical modeling. The effect of variable frequency-driven loop pumps was evaluated by Henderson et al. [4] together with geothermal heat pump facilities. It is common for WLHP systems to be combined with geothermal in ground-source-water loop heat pump applications [5,6], and also with solar [7] or other technologies like engine-driven heat pumps [8] or CO2 refrigeration units [9].
The present study analyzed the behavior of a WLHP system in a common office building under typical climatic conditions in four important cities in the Iberian Peninsula. The energy consumption of this system and other more conventional systems were compared. The WLHP system is a water system with a four-tube connection design to allow simultaneous heating and cooling loads, fan-coils, one gas boiler and a conventional chiller. In the WLHP system, the boiler and the cooling tower keep the temperature of the water loop in a range, letting it freely oscillate while the temperature is inside this range. The effect of changing minimum and maximum temperature set points in this regulation system was studied, comparing annual consumption with a base case. The size of one thermal storage tank installed in the water loop was also studied as a design parameter. The objective was to obtain important information that could be useful to the optimization of the design of WLHP systems, reducing energy consumption for office building air conditioning.
2. Calculation of Energy Demands and Systems Energy Consumption
2.1. Energy Demand in an Office Building
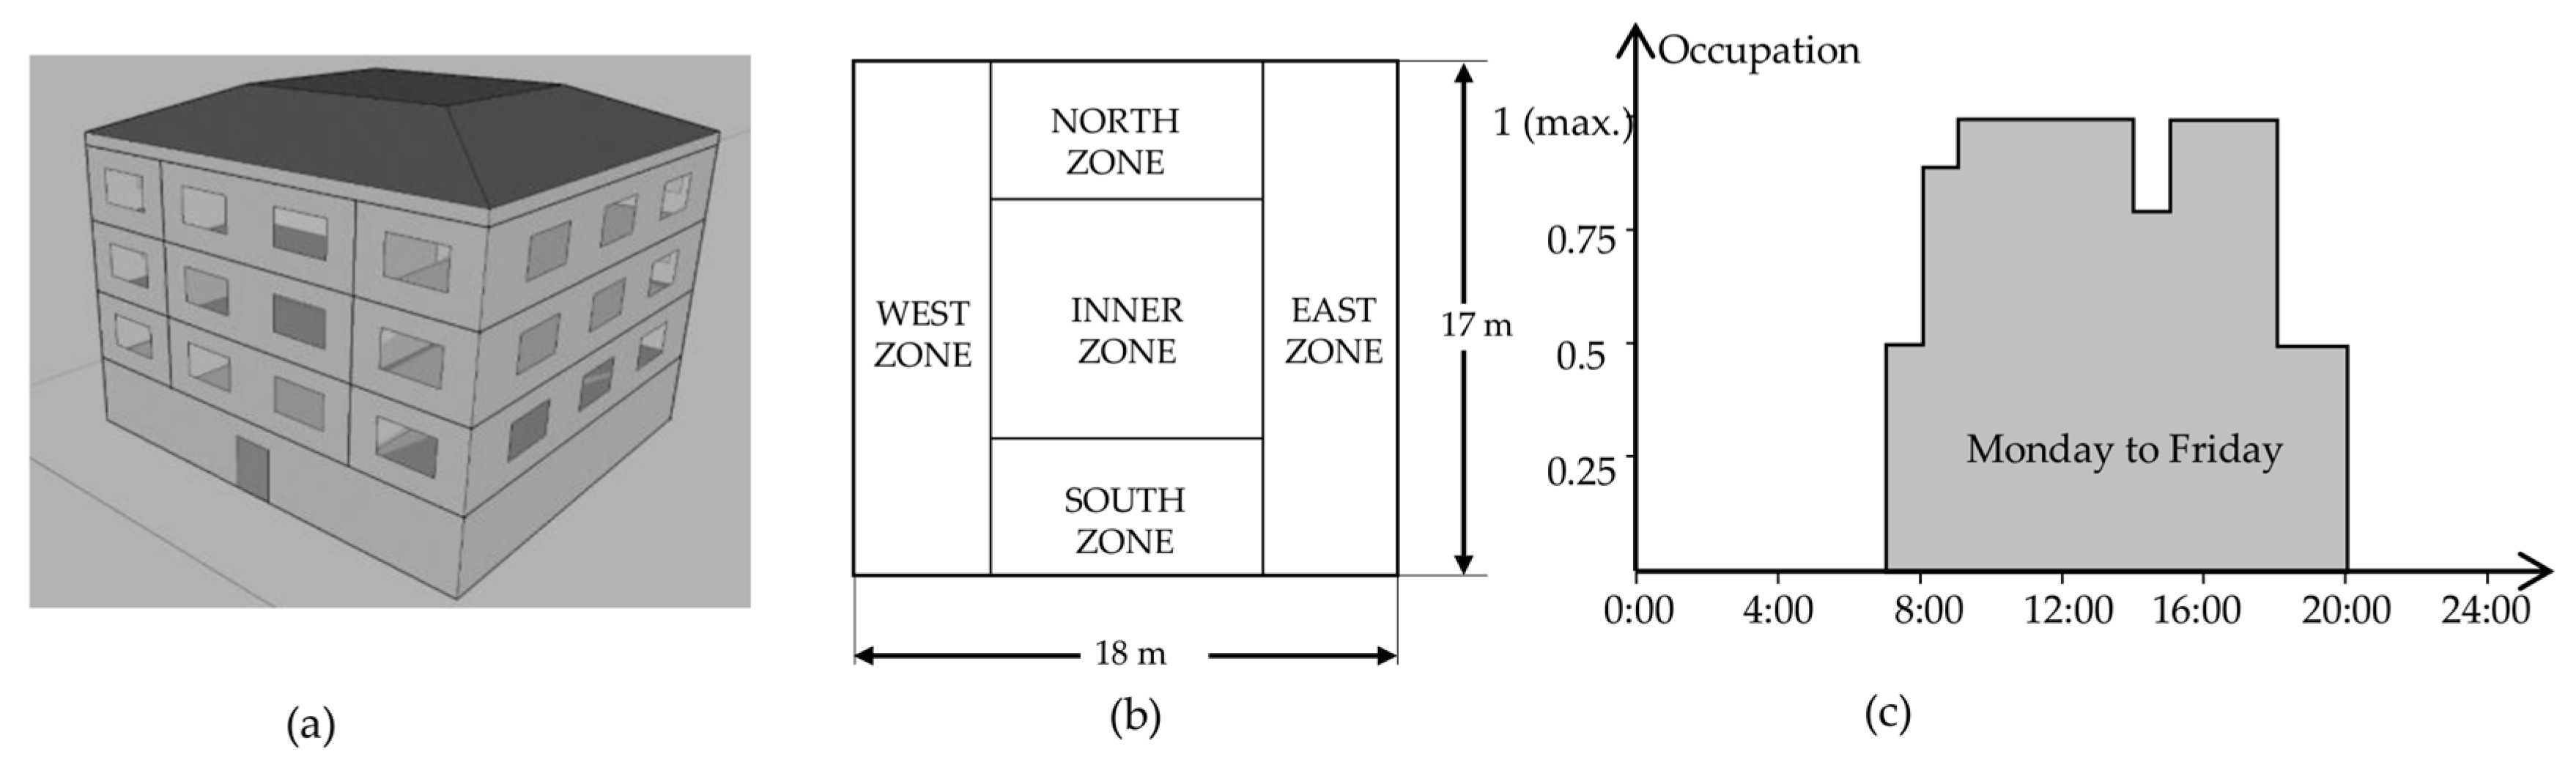
A regular office building was studied in order to obtain the detailed energy demand profiles corresponding to four representative cities. The building had three occupied plants, as well as uninhabitable attic and ground floor zones. The gross total inhabited area was 918 m2, and it had external zones with four orientations as well as an inner zone, as shown in Figure 1a,b.
Typical compositions were chosen for the opaque surfaces, resulting in a U-factor values of 0.517 W/m2-K for walls and 0.563 W/m2-K for floors and ceilings. U-factor values were calculated by the procedure in the Ashrae Fundamentals Handbook [10]. The U-factor for windows was 2.9 W/m2-K and their solar heat gain coefficient was 0.72. Internal heat gains were included for people, lighting and office equipment: people activity was estimated at 130 W/person (p), with an occupation density of 12 m2/p; the heat gain from lighting was fixed at 7 W/m2; and internal heat gain for the electric office equipment was fixed at 8 W/m2. The ventilation air volume was fixed at 12 l/s-p. These are the maximum values for people, lighting, equipment and ventilation loads. Their profiles follow the occupation schedule in Figure 1c. Constant air infiltration values were fixed for uninhabitable zones: 2 air changes per hour in the attic and 3 changes per hour on the ground floor. The loads were calculated for an ideal air loads mode, with cooling and heating thermostat schedules that would keep the air temperature in a range between 21 °C and 25 °C during working hours from Monday to Friday, and humidity controls which would keep humidity ratios between 45% and 55% for the same schedule.
The calculations of the energy demand were performed with the EnergyPlus [11] simulation software, using the OpenStudio® [12] platform to define the building, loads and weather data. The energy demand was calculated for the typical climatic conditions of four cities in the Iberian Peninsula: Madrid, Barcelona, Zaragoza and Porto. The weather data files were obtained from the EnergyPlus site, using weather data from the Spanish Weather for Energy Calculations (SWEC) database for Spanish cities and from the International Weather for Energy Calculations (IWEC) database for the Porto weather data.
2.2. Heating, Ventalation and Air Conditioning (HVAC) Systems
The energy consumption necessary to fulfill the building’s energy demands were compared for a WLHP system and a conventional 4-tube fan-coil water HVAC system. Figure 2 shows two simplified configuration schemes for these systems. One storage tank is included in the water loop system.
2.3. Energy Calculations in the WLHP System
The energy consumption in the WLHP system, represented in Figure 2a, was estimated by Equations (1)–(11). The calculations were performed in terms of energy analysis in time step periods Δt of one hour. For each time step period, the net thermal energy from heat pumps to the water loop was calculated from the heating and cooling demands, with regards to the cooling energy efficiency ratio and the heating coefficient of performance of the heat pumps:
The COP and the EER were estimated with Equations (2) and (3) through the Carnot limit values with an approximation factor ξC = 0.5. The condensation and evaporation temperatures for the Carnot limit calculation were related to ambient temperatures and their difference from the water loop temperature, Twl.
When the net thermal energy to the water loop was positive due to higher condensing heat from the heat pumps, this energy was dissipated by the cooling tower (Qwl,ct). If the net was negative because the evaporation of thermal energy to the heat pumps is greater, the boiler supplied it with a maximum of ∆t·Pb. The thermal power of the boiler (Pb) was slightly greater than the maximum needed.
Because of the energy dissipated by the cooling tower or supplied by the gas boiler, the temperature of the water loop changed in a time step period according to Equation (5). The boiler and cooling tower prevented the water loop temperature Twl from exceeding the 18–30 °C range, allowing free oscillation inside this range.
The mass of the water loop Mwl is the sum of the storage tank mass, fixing mst = 10 kg/m2, per habitable surface area (Ah) and using a fixed Mpi = 313.8 kg for water loop pipes:
The energy supplied to the water loop generated the total thermal consumption QT, calculated with the value of the boiler thermal efficiency ηb = 0.95.
The total electrical consumption We,T is the sum of the consumption of the heat pumps (considering COP and EER), the pumping in the water loop and cooling tower circuits, and the cooling tower fan (Equation (8)).
The pumping energy, which was estimated by Equations (9) and (10), propelled the demanded mass of water for each time step period through a water height corresponding to the pressure losses of the water loop and cooling tower circuits. The water temperature change in the heat pumps, ΔTi, was 5 K. The water temperature range in the cooling tower ΔTct was 8 K. Pressure losses were 6 meters of water height for the water loop (ΔHwl) and 12 m for the cooling tower (ΔHct) circuits. The total pumping efficiency was ηp = 0.45 in both cases.
The cooling tower fan consumption was estimated by Equation (11). The energy evacuation through the cooling tower Qwl,ct and the air enthalpy change (Δhair,ct) in the cooling tower allowed for estimations regarding the air moved by the fan. Air enthalpy changed from ambient conditions to saturated air conditions at 35 °C. Other assumptions were the fan total efficiency factor, ηf = 0.35, and 250 Pa of air pressure drop through the tower.
2.4. Energy Calculations in the 4-Tube Fan-Coil System
One equivalent procedure was defined to evaluate the energy consumption of the conventional 4-tube fan-coil water HVAC system represented in Figure 2b. The total electrical consumption We,T is the sum of the consumption in the chiller compressor (considering its EER), the pumping in cold and hot water circuits, and the consumption of the fan in the dry condenser (Equation (12)).
The chiller energy efficiency ratio was estimated by the approximation to the Carnot maximum efficiency:
The total thermal consumption QT was calculated with the sum of the heating demands supplied by the boiler with the thermal efficiency ηb.
The pumping in the cold water and hot water circuits were calculated through the heating and cooling thermal demands. The demanded water was pumped through 6 m water height pressure losses in both circuits (ΔHb, ΔHch). Temperature changes in the fan-coils (ΔTi) were 5 °C for cooling and 15 °C for heating.
The air pressure drop ΔPair,dc, was 150 Pa in the chiller dry condenser, and its enthalpy change, Δhair,dc, represents its heating from ambient conditions to 45 °C.
The fan, pump and boiler efficiencies (ηf, ηp, ηb), and the Carnot approximation factor ξC had the same values as in the WLHP calculations.
2.5. Energy Calculations in the 4-Tube Fan-Coil System
Two important energy parameters were selected in order to analyze the total environmental impact of the systems: the total consumed nonrenewable primary energy (NRPE) and the total CO2 emissions. The conversion factors were taken from the official Spanish Institute for the Diversification and Energy Saving (IDAE) site [13], as expressed in Equations (18) and (19). For the scope of comparison, it was assumed that the thermal energy was generated through natural gas combustion in both cases. The energy units in Equation (19) are kWh (1 kWh = 3600 kJ = 3412.14 BTU).
3. Results
3.1. Building Demands in the Four Cities
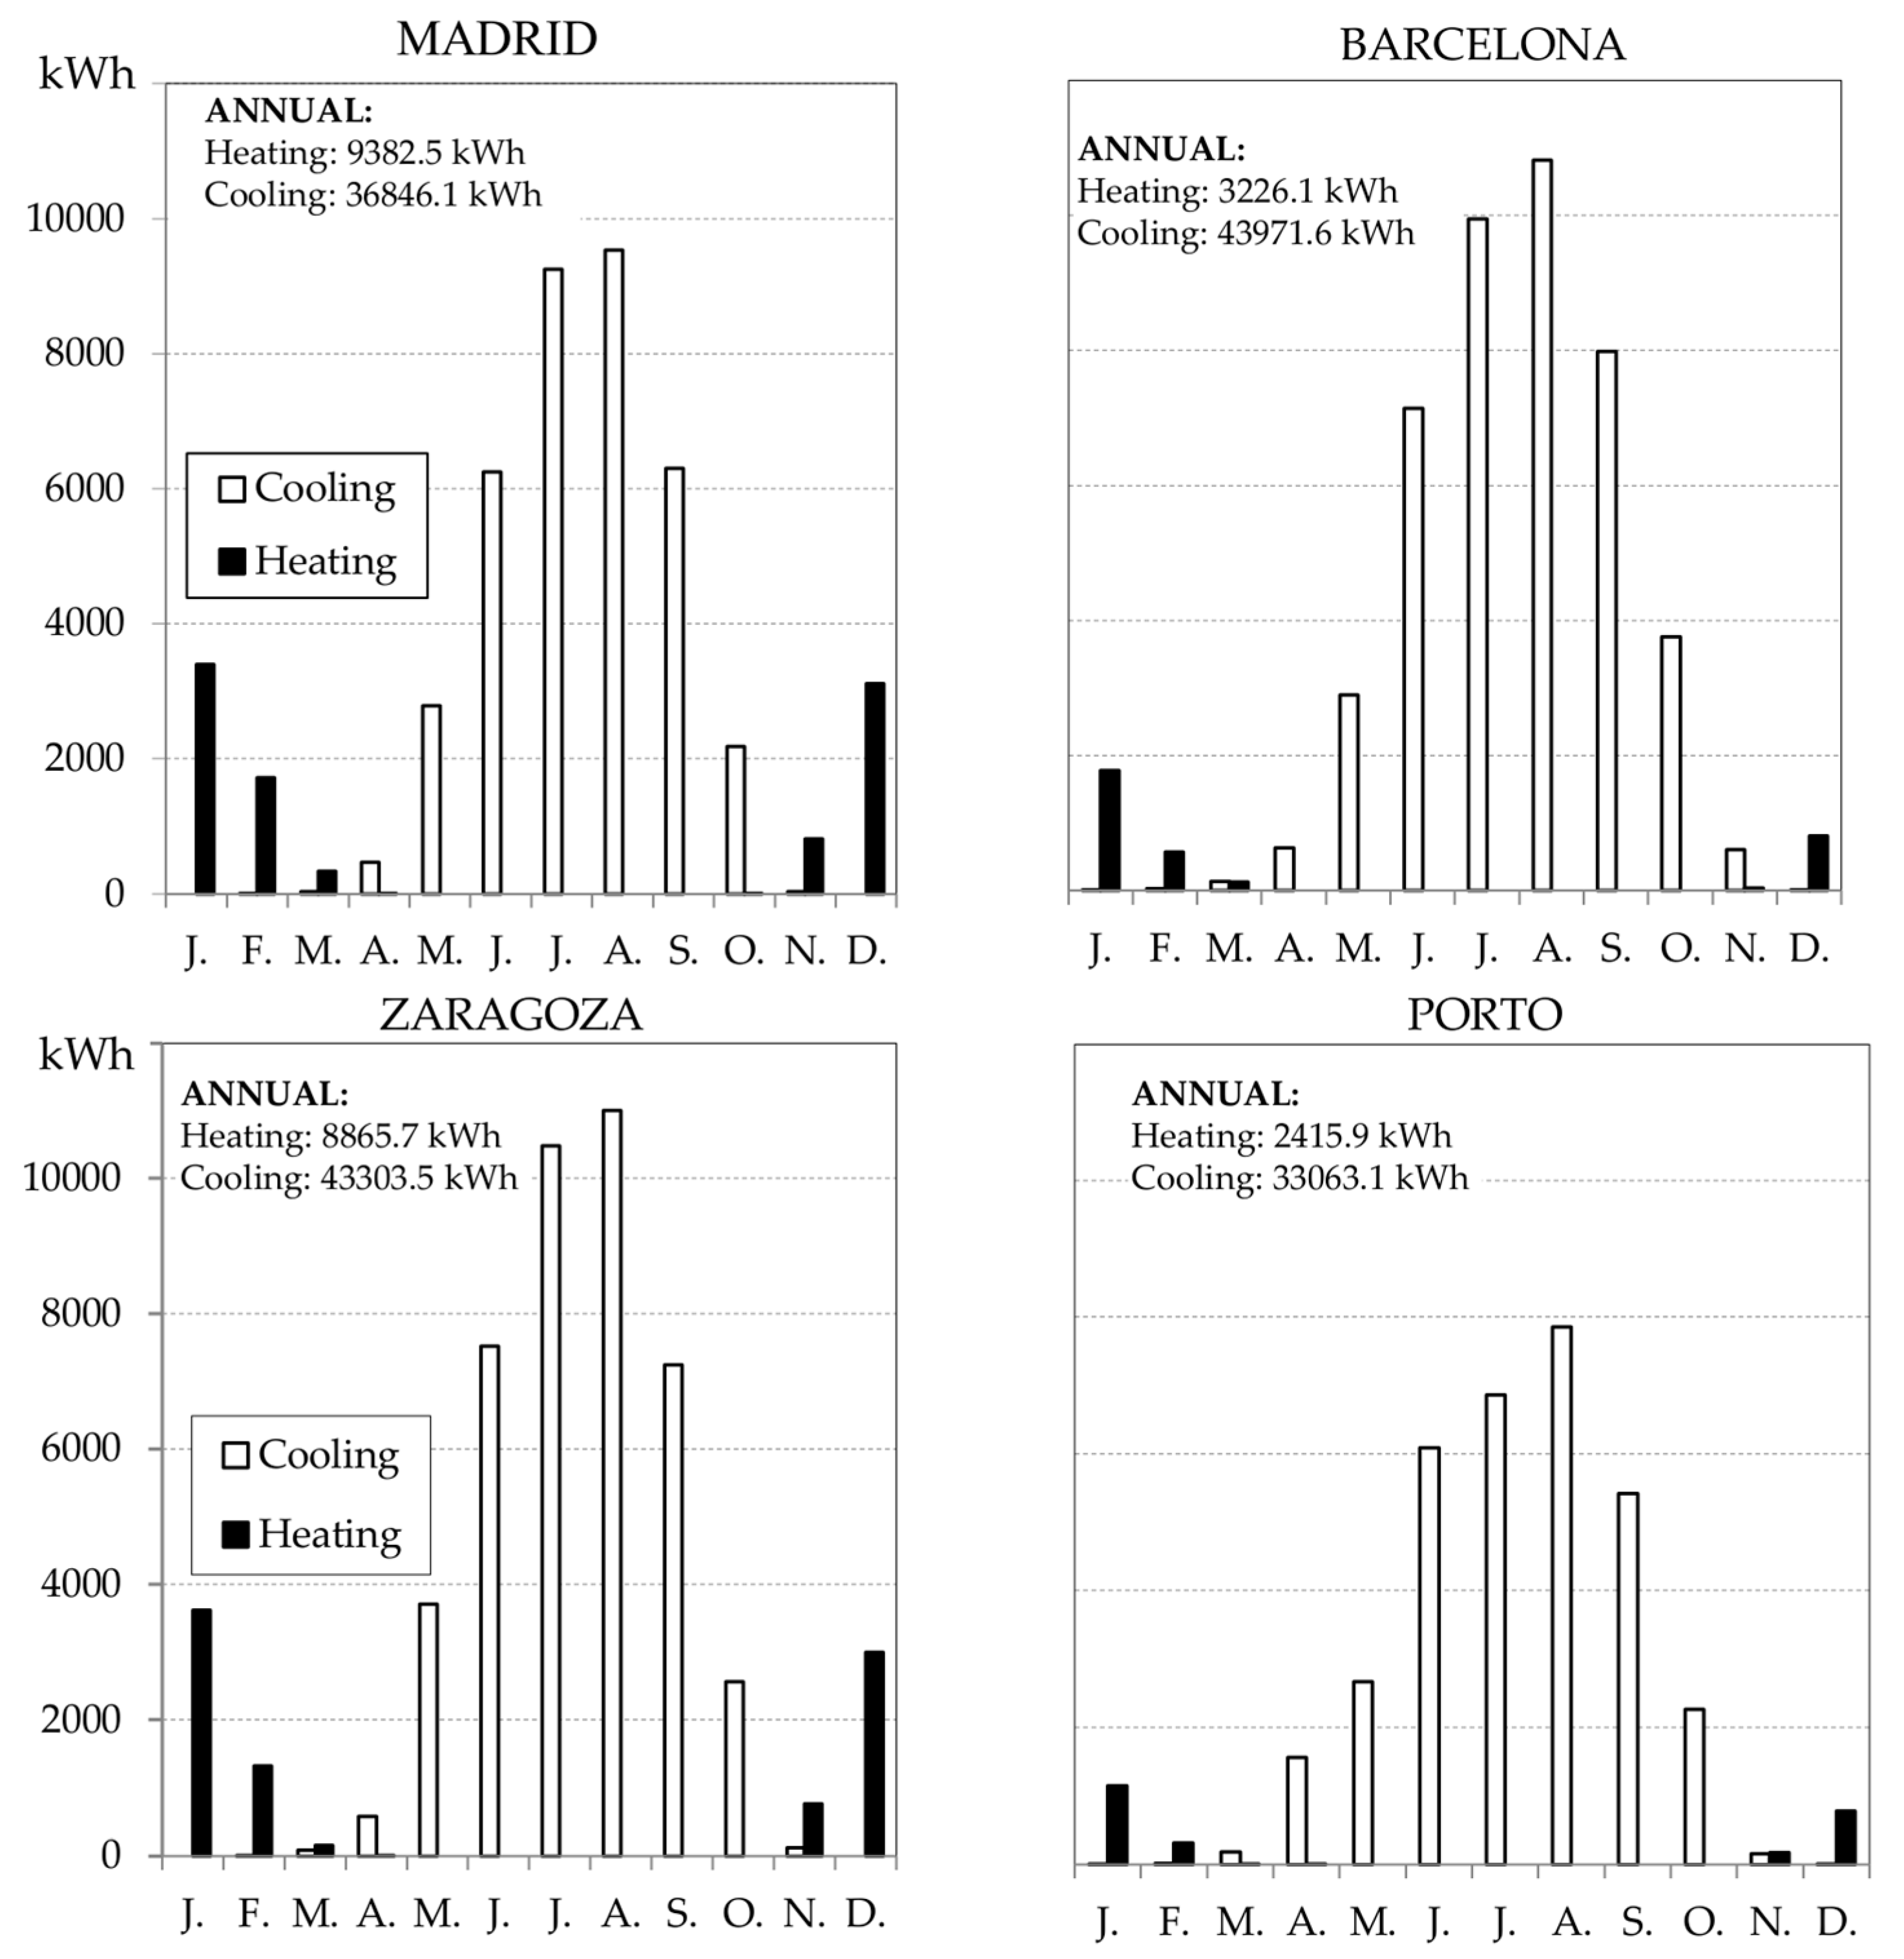
The monthly and annual heating and cooling energy demands are shown in Figure 3 for the four selected cities.
The cooling demand is higher than the heating demand in all the cases, as could be expected in a high internal load building. Madrid and Zaragoza have higher heating demands due to their more severe winter conditions. The highest cooling demands are in Barcelona and Zaragoza. Porto has the lowest cooling and heating demands, corresponding to a more temperate oceanic climate.
These four cities represent climatic variations from the coastal Mediterranean to the Atlantic, as well as continental climates with similar latitudes in the Iberian Peninsula. It can be assumed that an office building with the selected characteristics could be placed at any of these cities. The results of the energy demand calculations show variations between cities. At the same time, these profiles could be a good representation of office buildings, in general, at this latitude. This assumption helps to support the desired comparative study, and the adjustment of the parameters for the HVAC systems.
3.2. Energy Consumption of WLHP and 4-Tube Fan-Coil Water Systems
The energy consumption necessary to meet the demands of the WLHP and 4-tube fan-coil water systems are presented in Table 1 and Table 2 respectively.
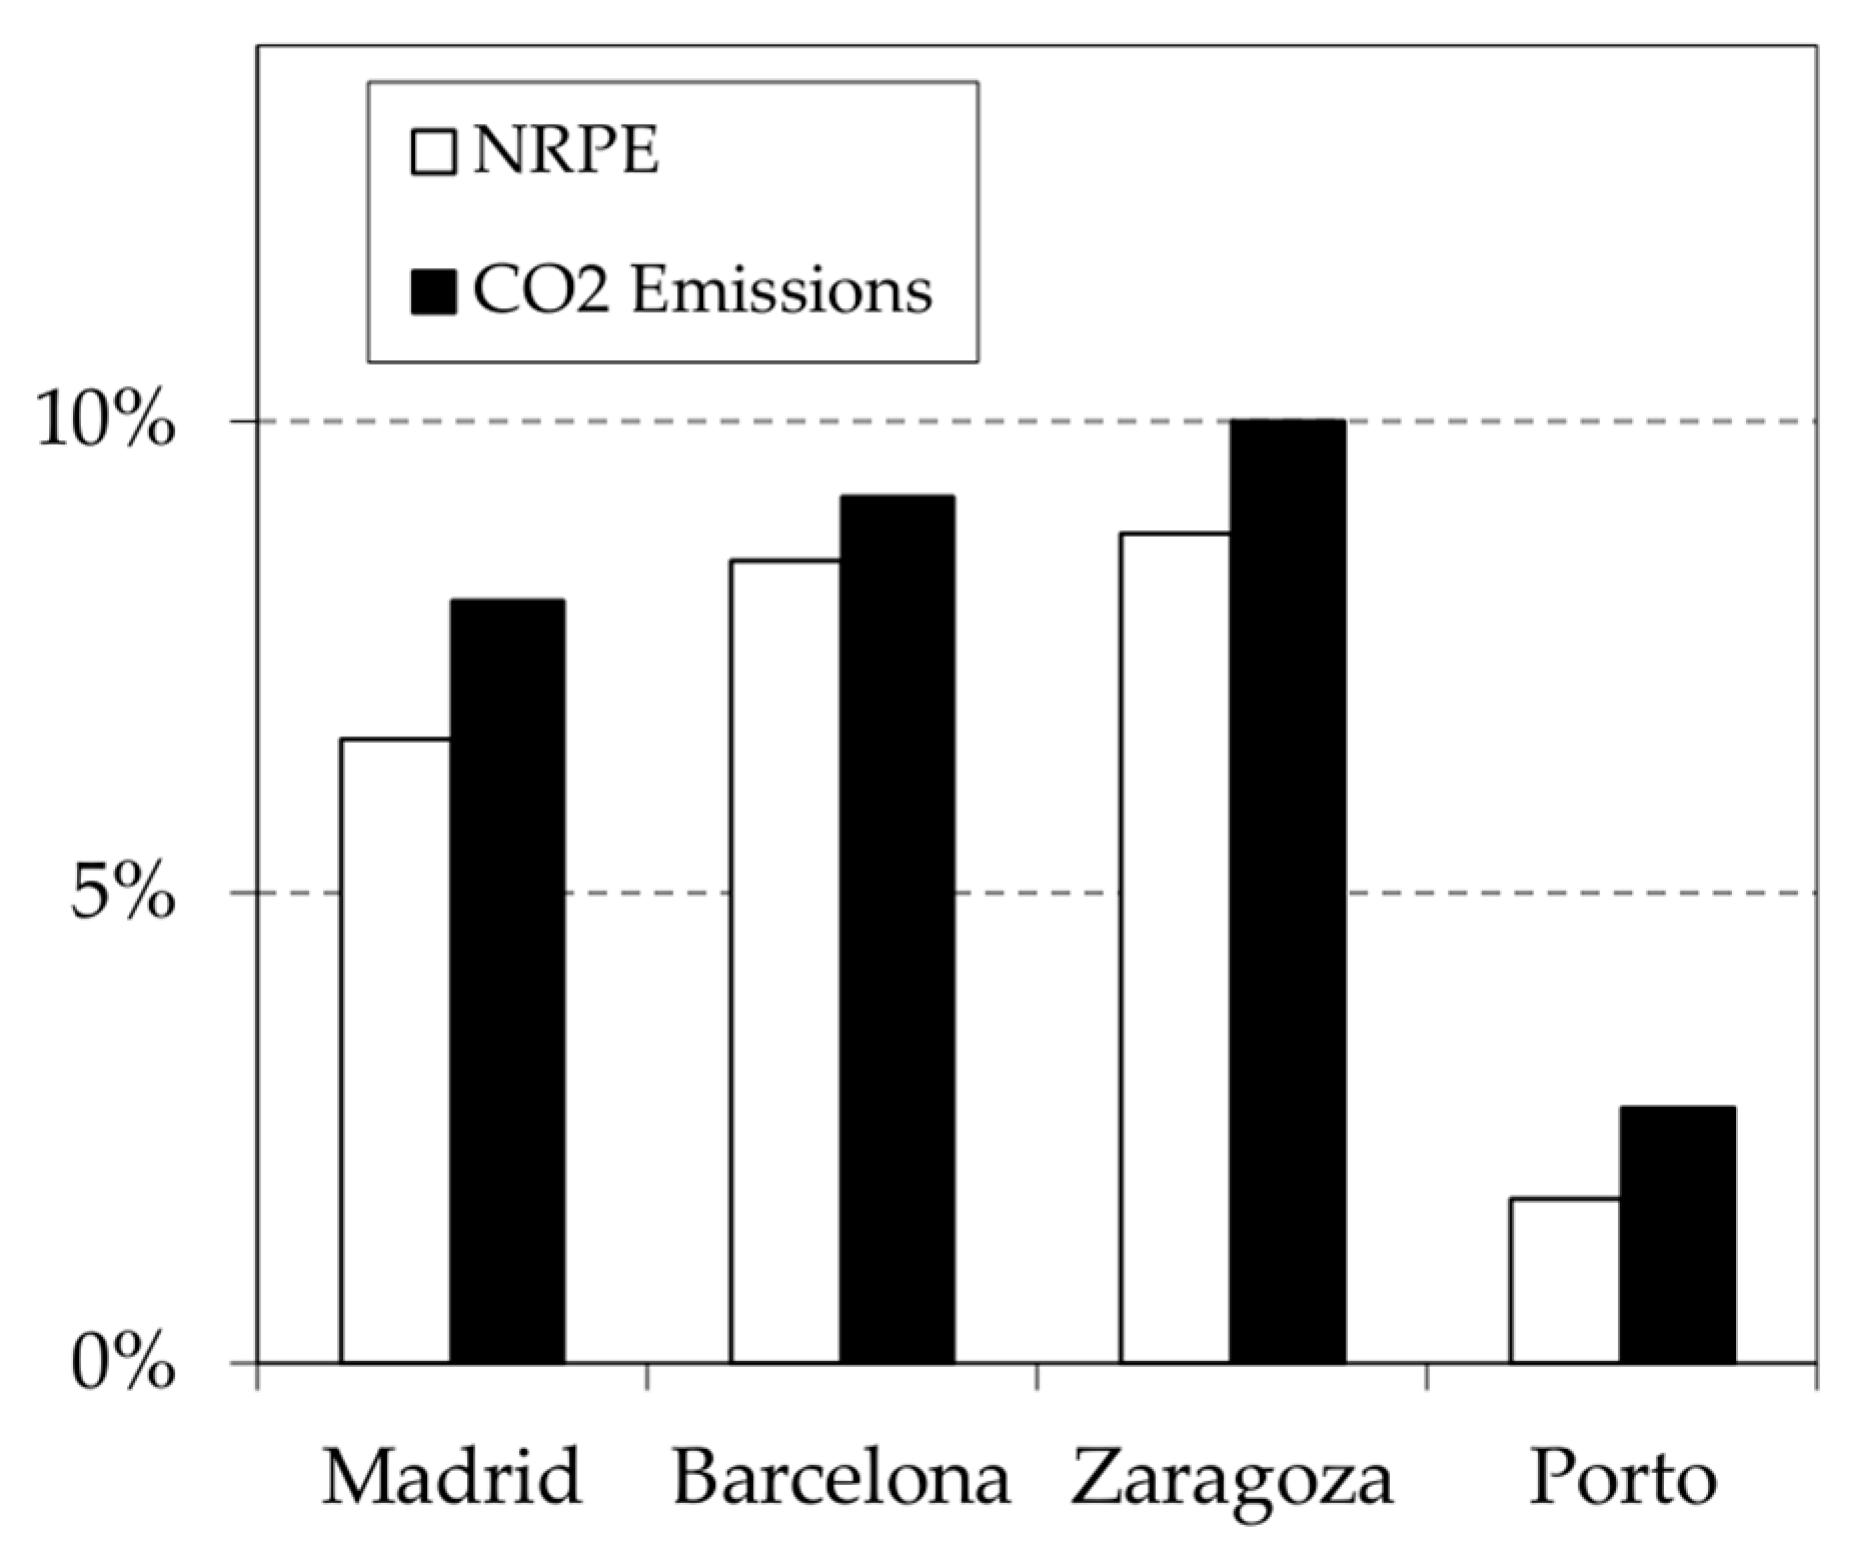
The main savings of the WLHP system were in thermal consumption, while the electrical consumption was similar for both systems. The seasonal EER of the heat pumps in WLHP were higher than the seasonal EER of the chiller in the water system. The seasonal COP of heat pumps had good values above 4.0. Higher consumption was measured for pumping in WLHP systems, but they were compensated by the lower fan consumption of the cooling tower, compared to the chiller dry condenser. Figure 4 shows that the resulting savings in terms of nonrenewable primary energy and CO2 emissions were important, especially in the locations with higher cooling demands where they reached values of around 8%. The total mean savings were 6.9% in nonrenewable primary energy and 8.1% in CO2 emissions.
The thermal and electrical consumption can be converted to primary energy (PE). The coefficients were published by [13]:
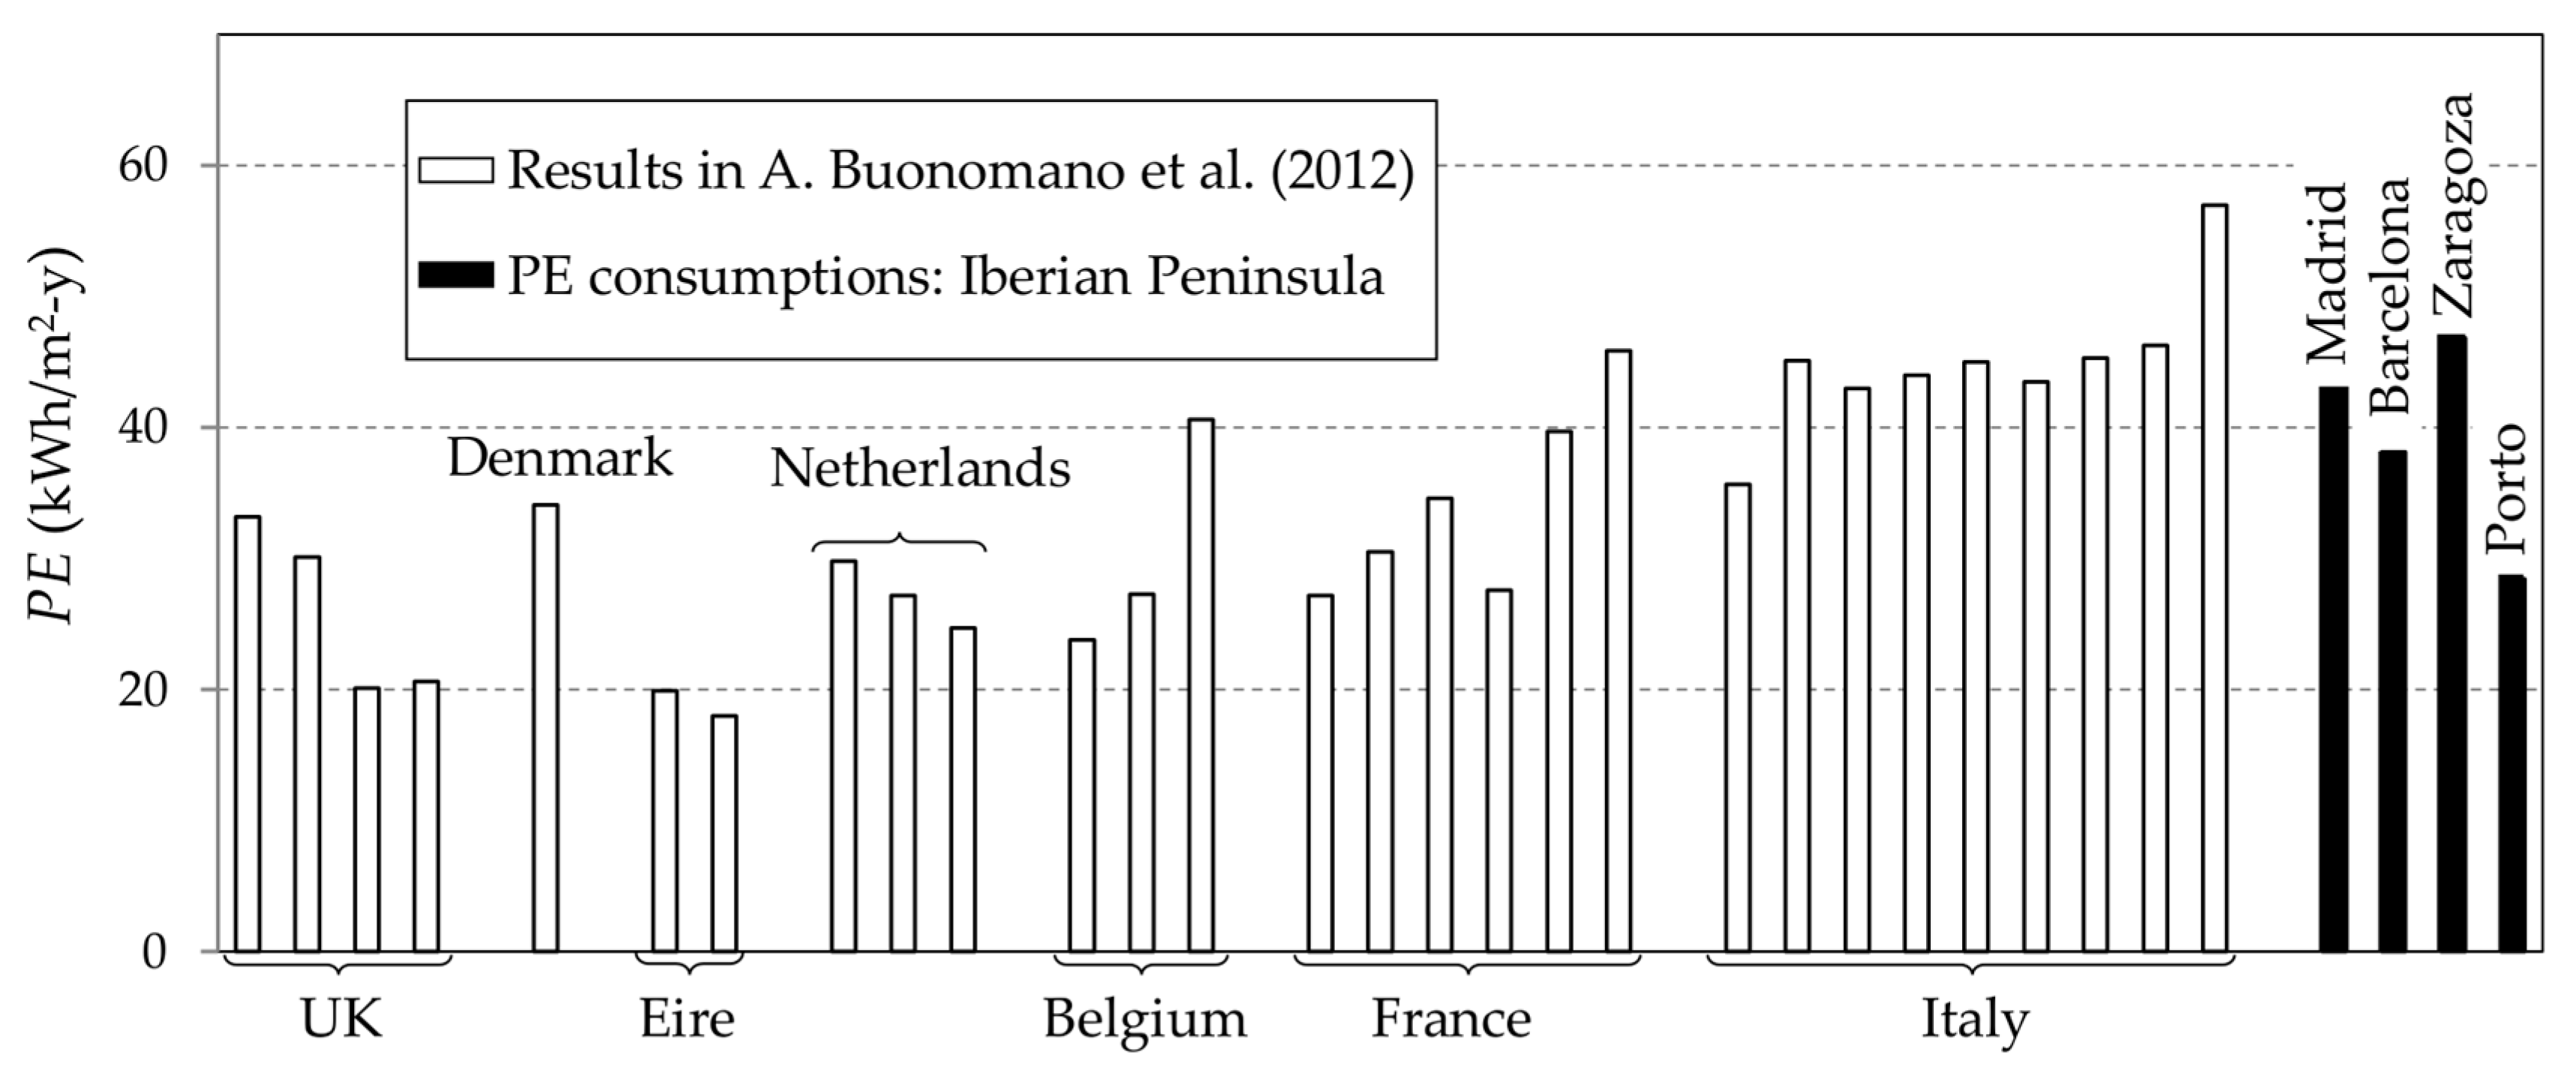
The study published by Buonomano et al. [2] in 2012 made an exhaustive analysis of 28 cities in Europe. They calculated annual consumption in office buildings with WLHP systems similar to ours. The comparison of annual consumption in terms of total annual PE per habitable surface area, as per Buonomano et al.’s results, is represented in Figure 5.
Annual primary energy consumption was 42.9, 38.1, 46.8 and 28.4 kWh/m2-y in Madrid, Barcelona, Zaragoza and Porto, respectively. The results were compared with office buildings having U-factors similar to ours (designated as building I in [2]). Not all of the calculation conditions are equivalent, and the models are different. Notwithstanding, the annual consumption results in our model are similar to those of nearby comparable countries, such as France or Italy.
3.3. Water Loop Parameters: Set Point Temperatures and Mass Storage
In the base case, the water loop set point temperatures Twl,min and Twl,max were 18 and 30 °C. Furthermore, the storage tank size per habitable surface area (mst) was 10 kg/m2. These are important parameters for the water loop design; the model was used to check the behavior of the WLHP system against variations in these parameters.
The results of variations in energy consumption against changes in the water loop set point temperatures are shown in Figure 6. They correspond to the model tested for Barcelona and are expressed in terms of their relative percentage value with respect to the base case. The behavior differed for the three consumption parameters: annual total thermal consumption, annual total electric consumption and annual nonrenewable primary energy consumption, according to Equation (18). The thermal consumption (QT) increased as Twl,min grew and decreased for higher values of Twl,max, with a stronger dependence on Twl,min. The electrical consumption (We,T) showed the opposite trend, decreasing for growing values of Twl,min and increasing for higher values of Twl,max, with a stronger dependence on Twl,max.
When the analyzed consumption parameter was nonrenewable primary energy, the main dependence was with Twl,max, and the effect of Twl,min almost disappeared. This behavior was observed for simulations for each of the four cities: the total annual nonrenewable primary energy consumption increased for higher values of Twl,max, and this consumption showed a much weaker relationship with the minimum set point water loop temperature Twl,min. The variation of mean calculated values of NRPE with maximum water loop set point temperature Twl,max, with respect to the base case (Twl,max = 30 °C), is represented in Figure 7 for the four cities.
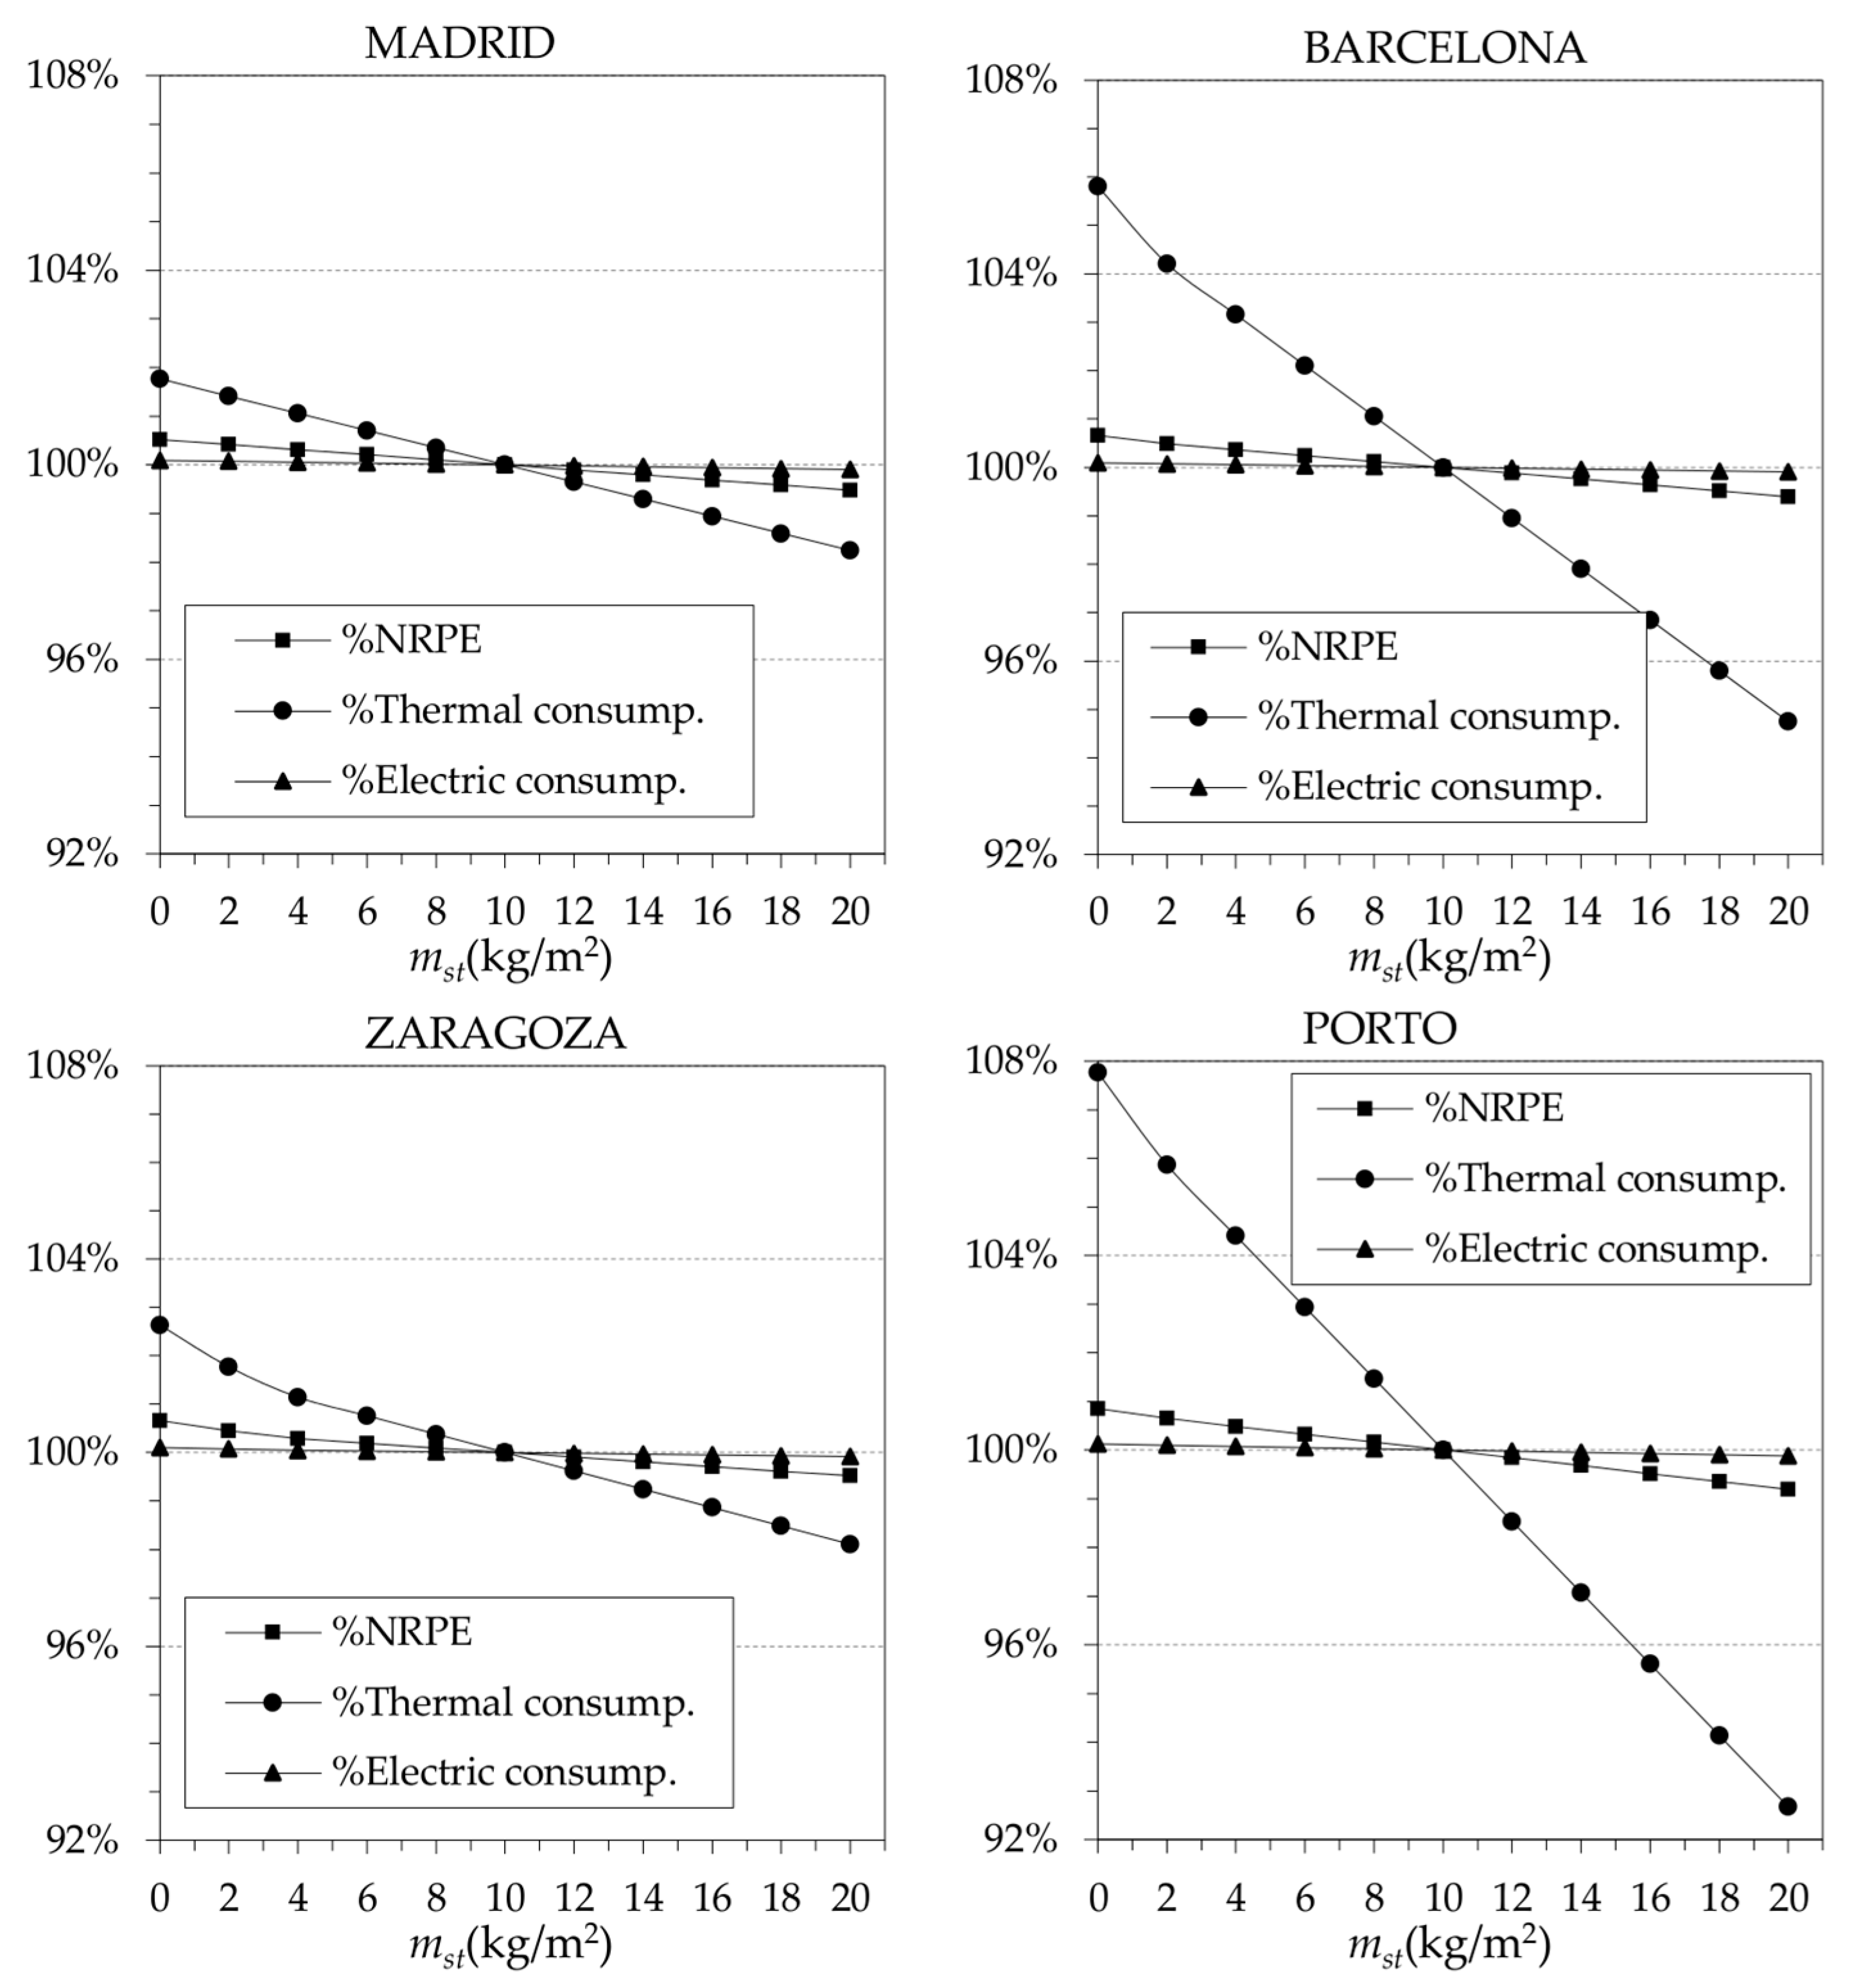
The effect of the size of the storage tank in the water loop was also analyzed. Variations were input for its specific mass capacity mst, considering values from 0 to 20 kg/m2 per habitable surface area, and calculating the total water loop mass with Equation (6). The total annual thermal, electrical and nonrenewable primary energy consumption results are shown in Figure 8 for the four cities. The effect was almost unappreciable in the electric energy consumption, being more important for the thermal total energy consumption. The resulting effect in the nonrenewable primary energy consumption was not very important, since only variations of ±1% with respect to the base case were observed.
The main consumption of the water loop heat pump and HVAC systems was electric, under the studied conditions. If the equipment that keeps the water loop temperature in the range was adequately sized, the loop temperature was stable and the efficiency of the heat pumps were keep high. The parameter of the water loop that produces a greater effect is the maximum water loop set point temperature, because it affects the EER of the heat pumps. This parameter is important in office buildings with high internal loads where the cooling mode prevails. Installing big tanks for thermal storage did not produce an important effect on energy consumption. This solution can be recommended in combination with biomass boilers because they have a lower modulation capacity which can be compensated for with a thermal storage tank.
4. Conclusions
The calculation of the energy demands of a conventional office building has been performed by means of the building energy simulation software EnergyPlus. The result allowed the evaluation of the energy consumption of two different systems in office buildings in four important cities of the Iberian Peninsula. The calculation of system energy consumption also contributed new knowledge about the optimization of design parameters for WLHP systems, namely the temperature range of the water loop or the size of its storage tank.
The energy analysis showed much higher cooling demands than heating demands, even in locations with severe winter conditions, such as Madrid or Zaragoza. Few occasions of simultaneous heating and cooling demands were found, so the advantage of energy redistribution was not very appreciable. Nonetheless, other advantages of the WLHP system allowed for important savings, as compared with the conventional 4-tube fan-coil water system. Important advantages of the WLHP systems include the use of evaporative cooling towers, and the stable temperature of the water loop that helps in heat pumps with high COP and EER values. Good fit was found in the comparison of our results with results of similar conditions taken from literature.
With the aim of optimizing the advantages of WLHP systems in office buildings, parametric studies were performed to observe the effect of some water loop design parameters on the energy consumption. Air conditioned spaces in office buildings have high internal loads, so keeping the water loop temperature as cool as possible had an important effect on the efficiency of heat pumps working in the cooling mode. The heat pump’s enhanced EER compensated for possible extra consumption by the cooling tower pumping and fan.
The ability of WLHP systems to redistribute energy inside the building, together with the recent improvement in heat pump efficiency, makes this technology a very good option for minimizing the environmental impact of building air conditioning.
Author Contributions
Authors Francisco Javier Fernández and Inés Suárez conceived the original idea; María Belén Folgueras studied the office building constructive typology, created the building model and studied the energy demand; Francisco Javier Fernández developed the mathematical models of WLHP and 4-tube fan-coil systems; María Belén Folgueras and Inés Suárez planed the simulations of the base case and the parametric studies. Francisco Javier Fernández carried out the simulations and post-processed the results; all authors contributed to the interpretation of the results and provided critical feedback. Francisco Javier Fernández wrote the paper with help of María Belén Folgueras and Inés Suárez to shape the analysis and manuscript structure.
Conflicts of Interest
The authors declare no conflicts of interest.
Nomenclature
| Ah | Habitable surface area (m2) |
| COP | Coefficient of performance (−) |
| cp,l | specific heat capacity of liquid water (J/kg-K) |
| EER | Energy efficiency ratio (−) |
| g | standard gravity acceleration (9.81 m/s2) |
| h | specific enthalpy (J/kg) |
| M | Mass (kg) |
| m | Mass per habitable surface area (kg/m2) |
| NRPE | Nonrenewable primary energy (J) |
| P | Thermal power (W) |
| PE | Primary energy (J) |
| Q | Thermal energy consumption-demand (J) |
| T | Temperature (K) |
| W | Electrical energy consumption (J) |
| ∆H | circuit pressure losses as water height (m) |
| ∆P | pressure losses (Pa) |
| ∆t | Time step (s) |
| η | Equipment efficiency (−) |
| ξC | Approximation factor to Carnot efficiency |
| ρ | density (kg/m3) |
| Subscripts | |
| amb | Ambient |
| b | Boiler |
| C | cooling |
| c | heat pump compressor |
| ch | Chiller |
| cond | condensation |
| ct | cooling tower |
| dc | dry condenser |
| e | electrical |
| evap | evaporation |
| f | Fan |
| H | heating |
| hp | heat pump |
| i | counter for spaces with heating demand |
| j | counter for spaces with cooling demand |
| p | pumping |
| pi | Pipes |
| st | storage |
| T | Total |
| wl | water loop |
References
- Lian, Z.; Park, S.; Qi, H. Analysis on energy consumption of water-loop heat pump system in China. Appl. Therm. Eng. 2005, 25, 73–85. [Google Scholar] [CrossRef]
- Buonomano, A.; Calise, F.; Palombo, A. Buildings dynamic simulation: Water loop heat pump systems analysis for European climates. Appl. Energy 2012, 91, 222–234. [Google Scholar] [CrossRef]
- Yuan, S.; Grabon, M. Optimizing energy consumption of a water-loop variable-speed heat pump system. Appl. Therm. Eng. 2011, 31, 894–901. [Google Scholar] [CrossRef]
- Henderson, H.I., Jr.; Khattar, M.K.; Carlson, S.W.; Walburger, A.C. The implications of the measured performance of variable flow pumping systems in geothermal and water loop heat pump applications. ASHRAE Trans. 2000, 106, 533. [Google Scholar]
- Chen, C.; Sun, F.; Feng, L.; Liu, M. Underground water-source loop heat-pump air-conditioning system applied in a residential building in Beijing. Appl. Energy 2005, 82, 331–344. [Google Scholar] [CrossRef]
- Sarbu, I.; Sebarchievici, C. General review of ground-source heat pump systems for heating and cooling of buildings. Energy Build. 2014, 70, 441–454. [Google Scholar] [CrossRef]
- Esen, H.; Esen, M.; Ozsolak, O. Modelling and experimental performance analysis of solar-assisted ground source heat pump system. J. Exp. Theor. Artif. Intell. 2017, 29, 1–17. [Google Scholar] [CrossRef]
- Lian, Z.; Park, S.; Huang, W.; Baik, Y.; Yao, Y. Conception of combination of gas-engine-driven heat pump and water-loop heat pump system. Int. J. Refrig. 2005, 28, 810–819. [Google Scholar] [CrossRef]
- Polzot, A.; Dipasquale, C.; D’Agaro, P.; Cortella, C. Energy benefit assessment of a water loop heat pump system integrated with a CO2 commercial refrigeration unit. Energy Procedia 2017, 123, 36–45. [Google Scholar] [CrossRef]
- American Society of Heating, Refrigerating and Air-Conditioning Engineers, (ASHRAE). Heat, air and moisture control in building assemblies-examples. In 2013 ASHRAE Handbook: Fundamentals; ASHRAE: Atlanta, GA, USA, 2013; Chapter 27. [Google Scholar]
- EnergyPlus. Available online: www.energyplus.net (accessed on 21 September 2017).
- OpenStudio®. Available online: www.openstudio.net (accessed on 21 September 2017).
- Instituto Para la Diversificación y Ahorro de la Energía. Available online: www.idae.es (accessed on 5 October 2017).
Figure 1.
(a) External view of the building; (b) distribution of thermal zones in the occupied plants; (c) office occupation profile.
Figure 1.
(a) External view of the building; (b) distribution of thermal zones in the occupied plants; (c) office occupation profile.

Figure 2.
(a) Water Loop Heat Pump (WLHP) system; (b) 4-Tube fan-coil water heating, ventilation and air conditioning (HVAC) system. Qwl,ct is the energy evacuated, cooling tower; Wp,wl is the water loop pump consumption; Wp,ct is the cooling tower pump consumption; Wf,ct is the cooling tower fan consumption.
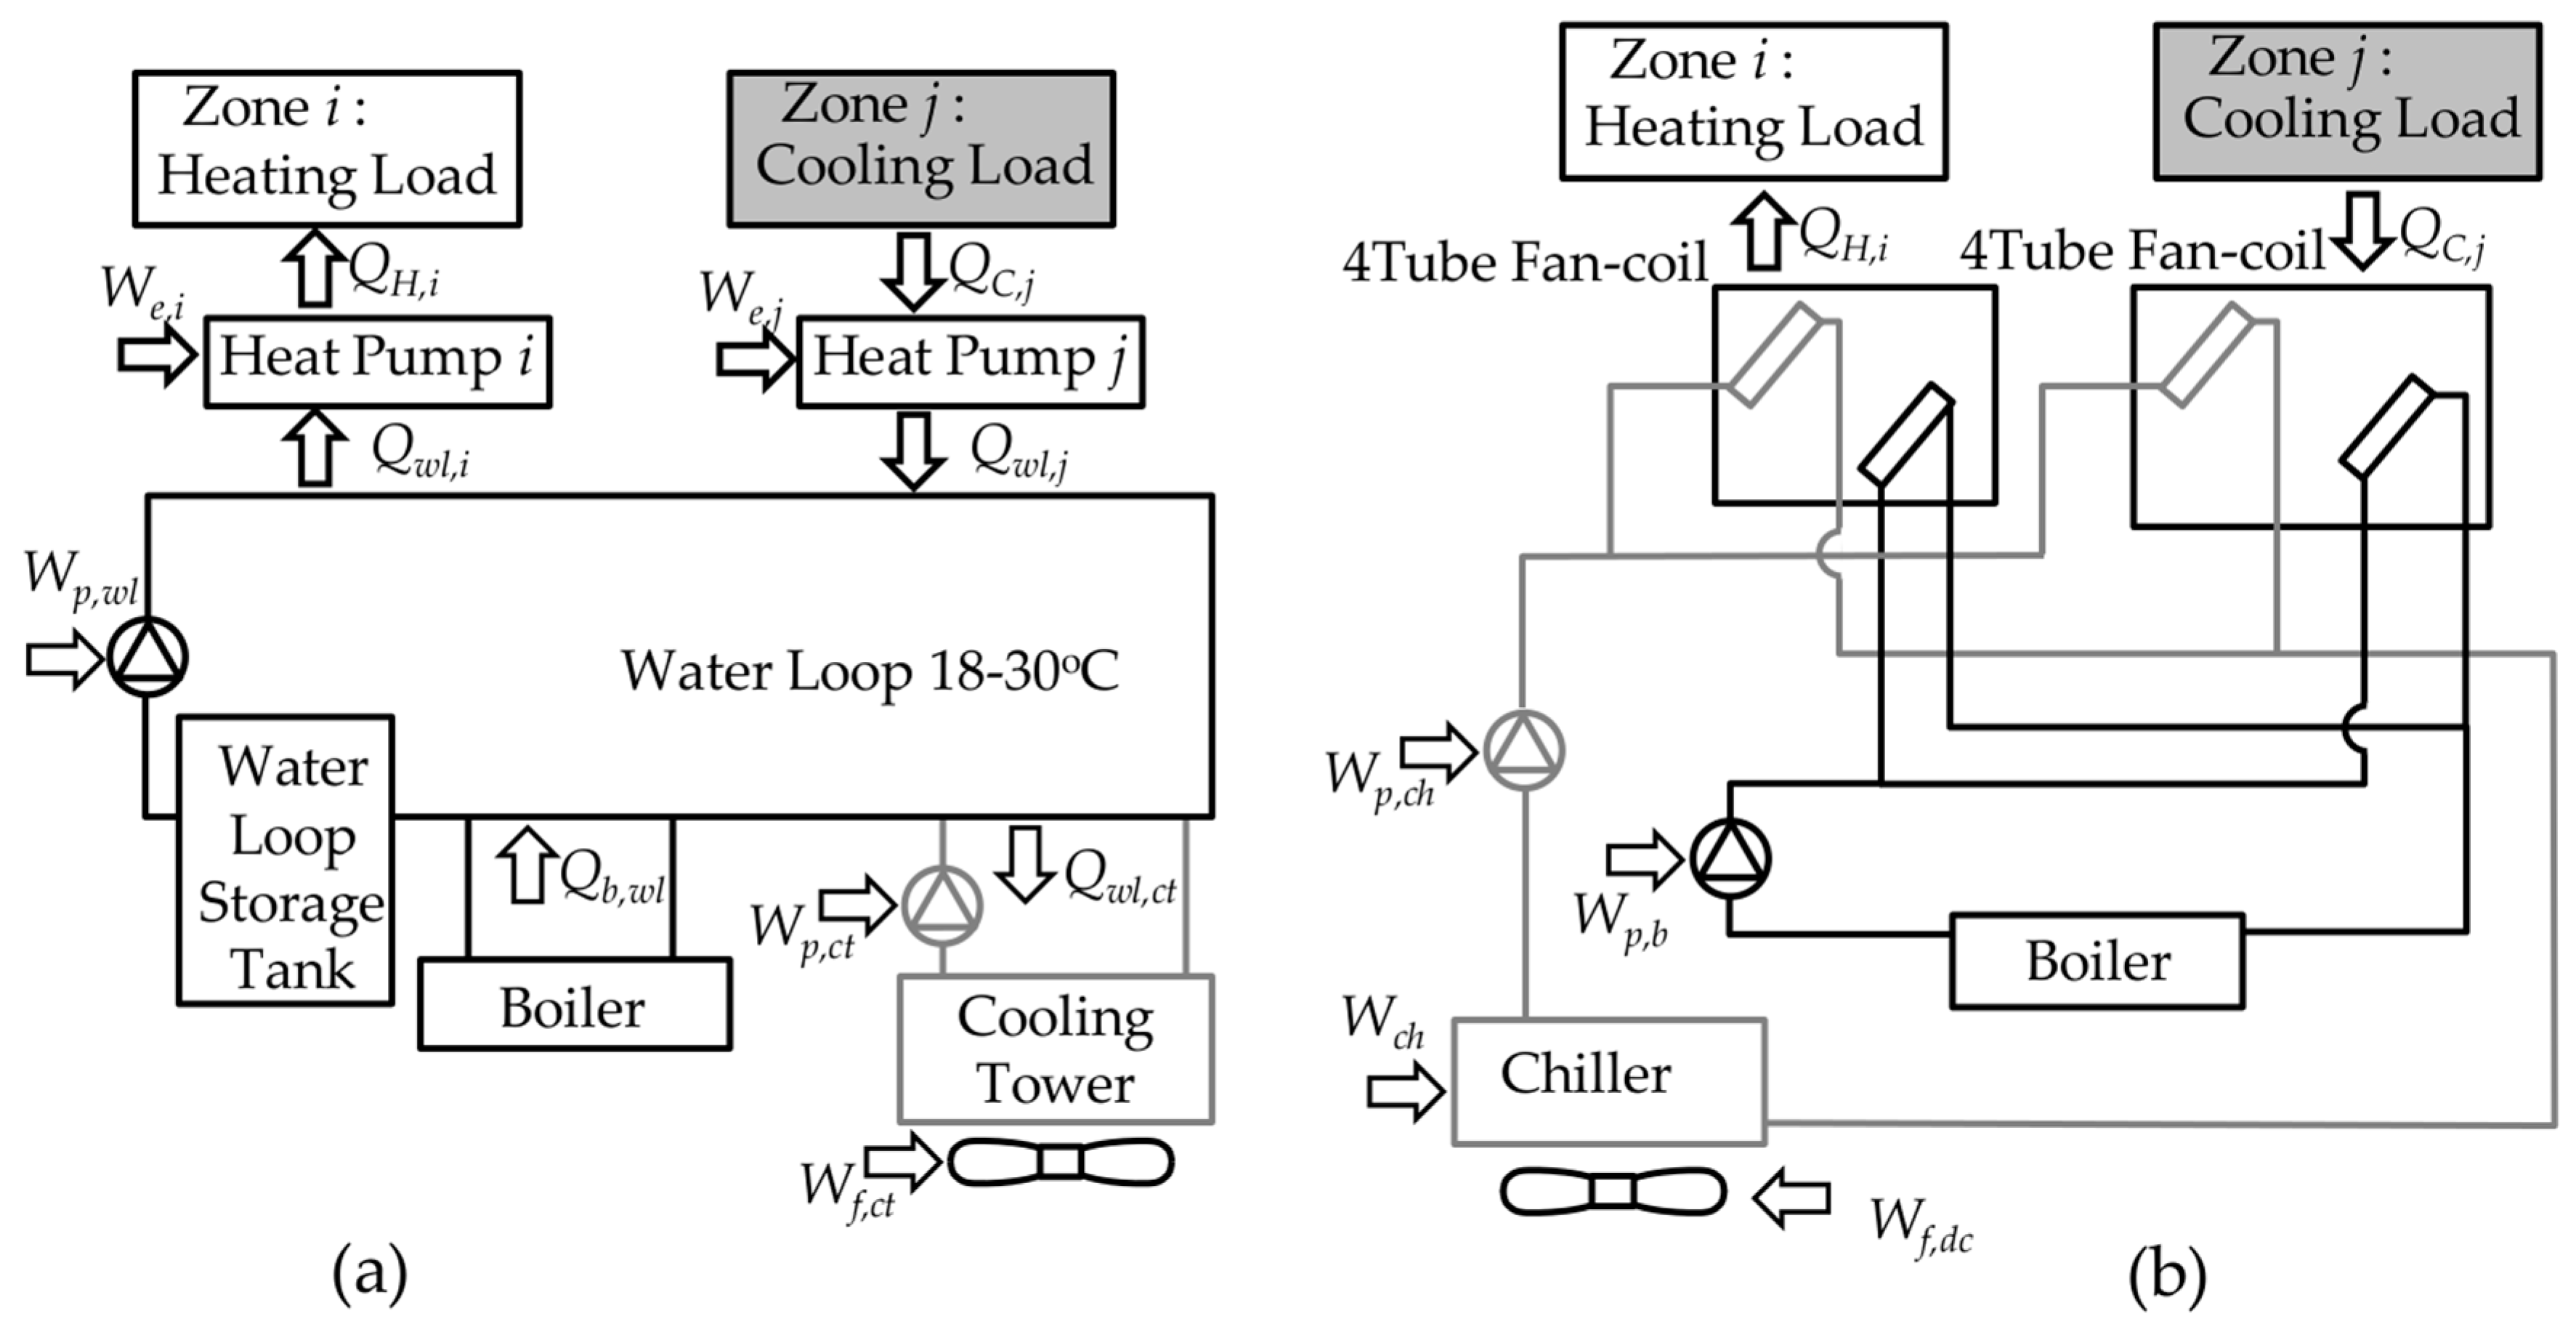
Figure 3.
Energy demand for air conditioning in the office building in: Madrid, Barcelona, Zaragoza, Porto.
Figure 3.
Energy demand for air conditioning in the office building in: Madrid, Barcelona, Zaragoza, Porto.

Figure 4.
Energy savings of a WLHP system with respect to the 4-tube fan-coil water system, in terms of nonrenewable primary energy and CO2 emissions in the four cities.
Figure 4.
Energy savings of a WLHP system with respect to the 4-tube fan-coil water system, in terms of nonrenewable primary energy and CO2 emissions in the four cities.

Figure 5.
Annual primary energy consumption in Buonomano et al. [2], in comparison with annual primary energy consumption as calculated for the Iberian Peninsula cities.
Figure 5.
Annual primary energy consumption in Buonomano et al. [2], in comparison with annual primary energy consumption as calculated for the Iberian Peninsula cities.

Figure 6.
Effect of variations in minimum and maximum water loop set point temperatures relative to: (a) annual total thermal consumption; (b) total electrical consumption; (c) nonrenewable primary energy in Barcelona, with respect to a base case with 18–30 °C set point temperatures.
Figure 6.
Effect of variations in minimum and maximum water loop set point temperatures relative to: (a) annual total thermal consumption; (b) total electrical consumption; (c) nonrenewable primary energy in Barcelona, with respect to a base case with 18–30 °C set point temperatures.
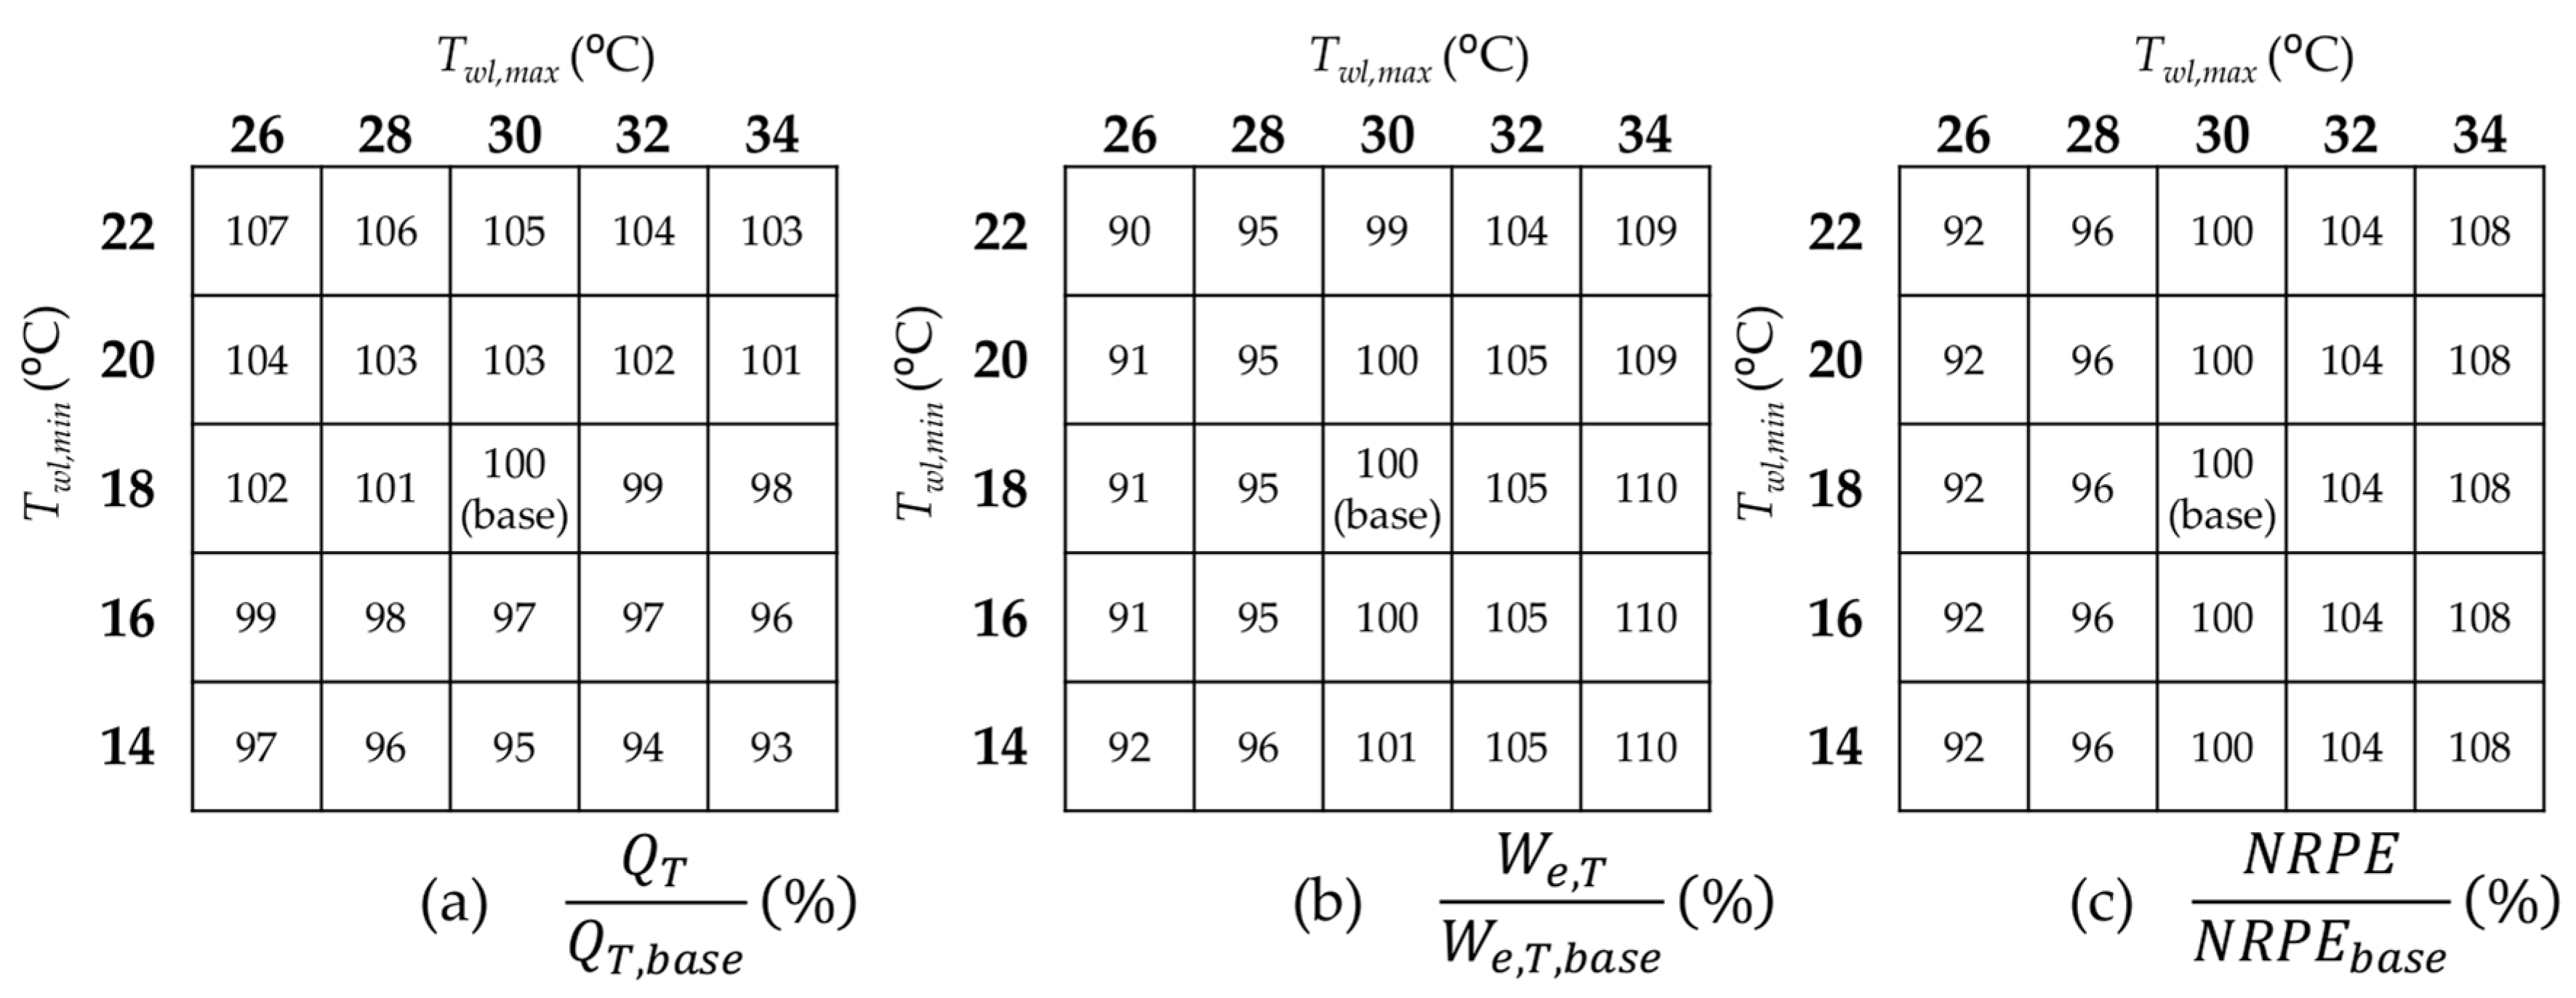
Figure 7.
Effect of maximum water loop set point temperature in the annual nonrenewable primary energy consumption, with respect to the base case with 30 °C set point temperature, in the four cities.
Figure 7.
Effect of maximum water loop set point temperature in the annual nonrenewable primary energy consumption, with respect to the base case with 30 °C set point temperature, in the four cities.
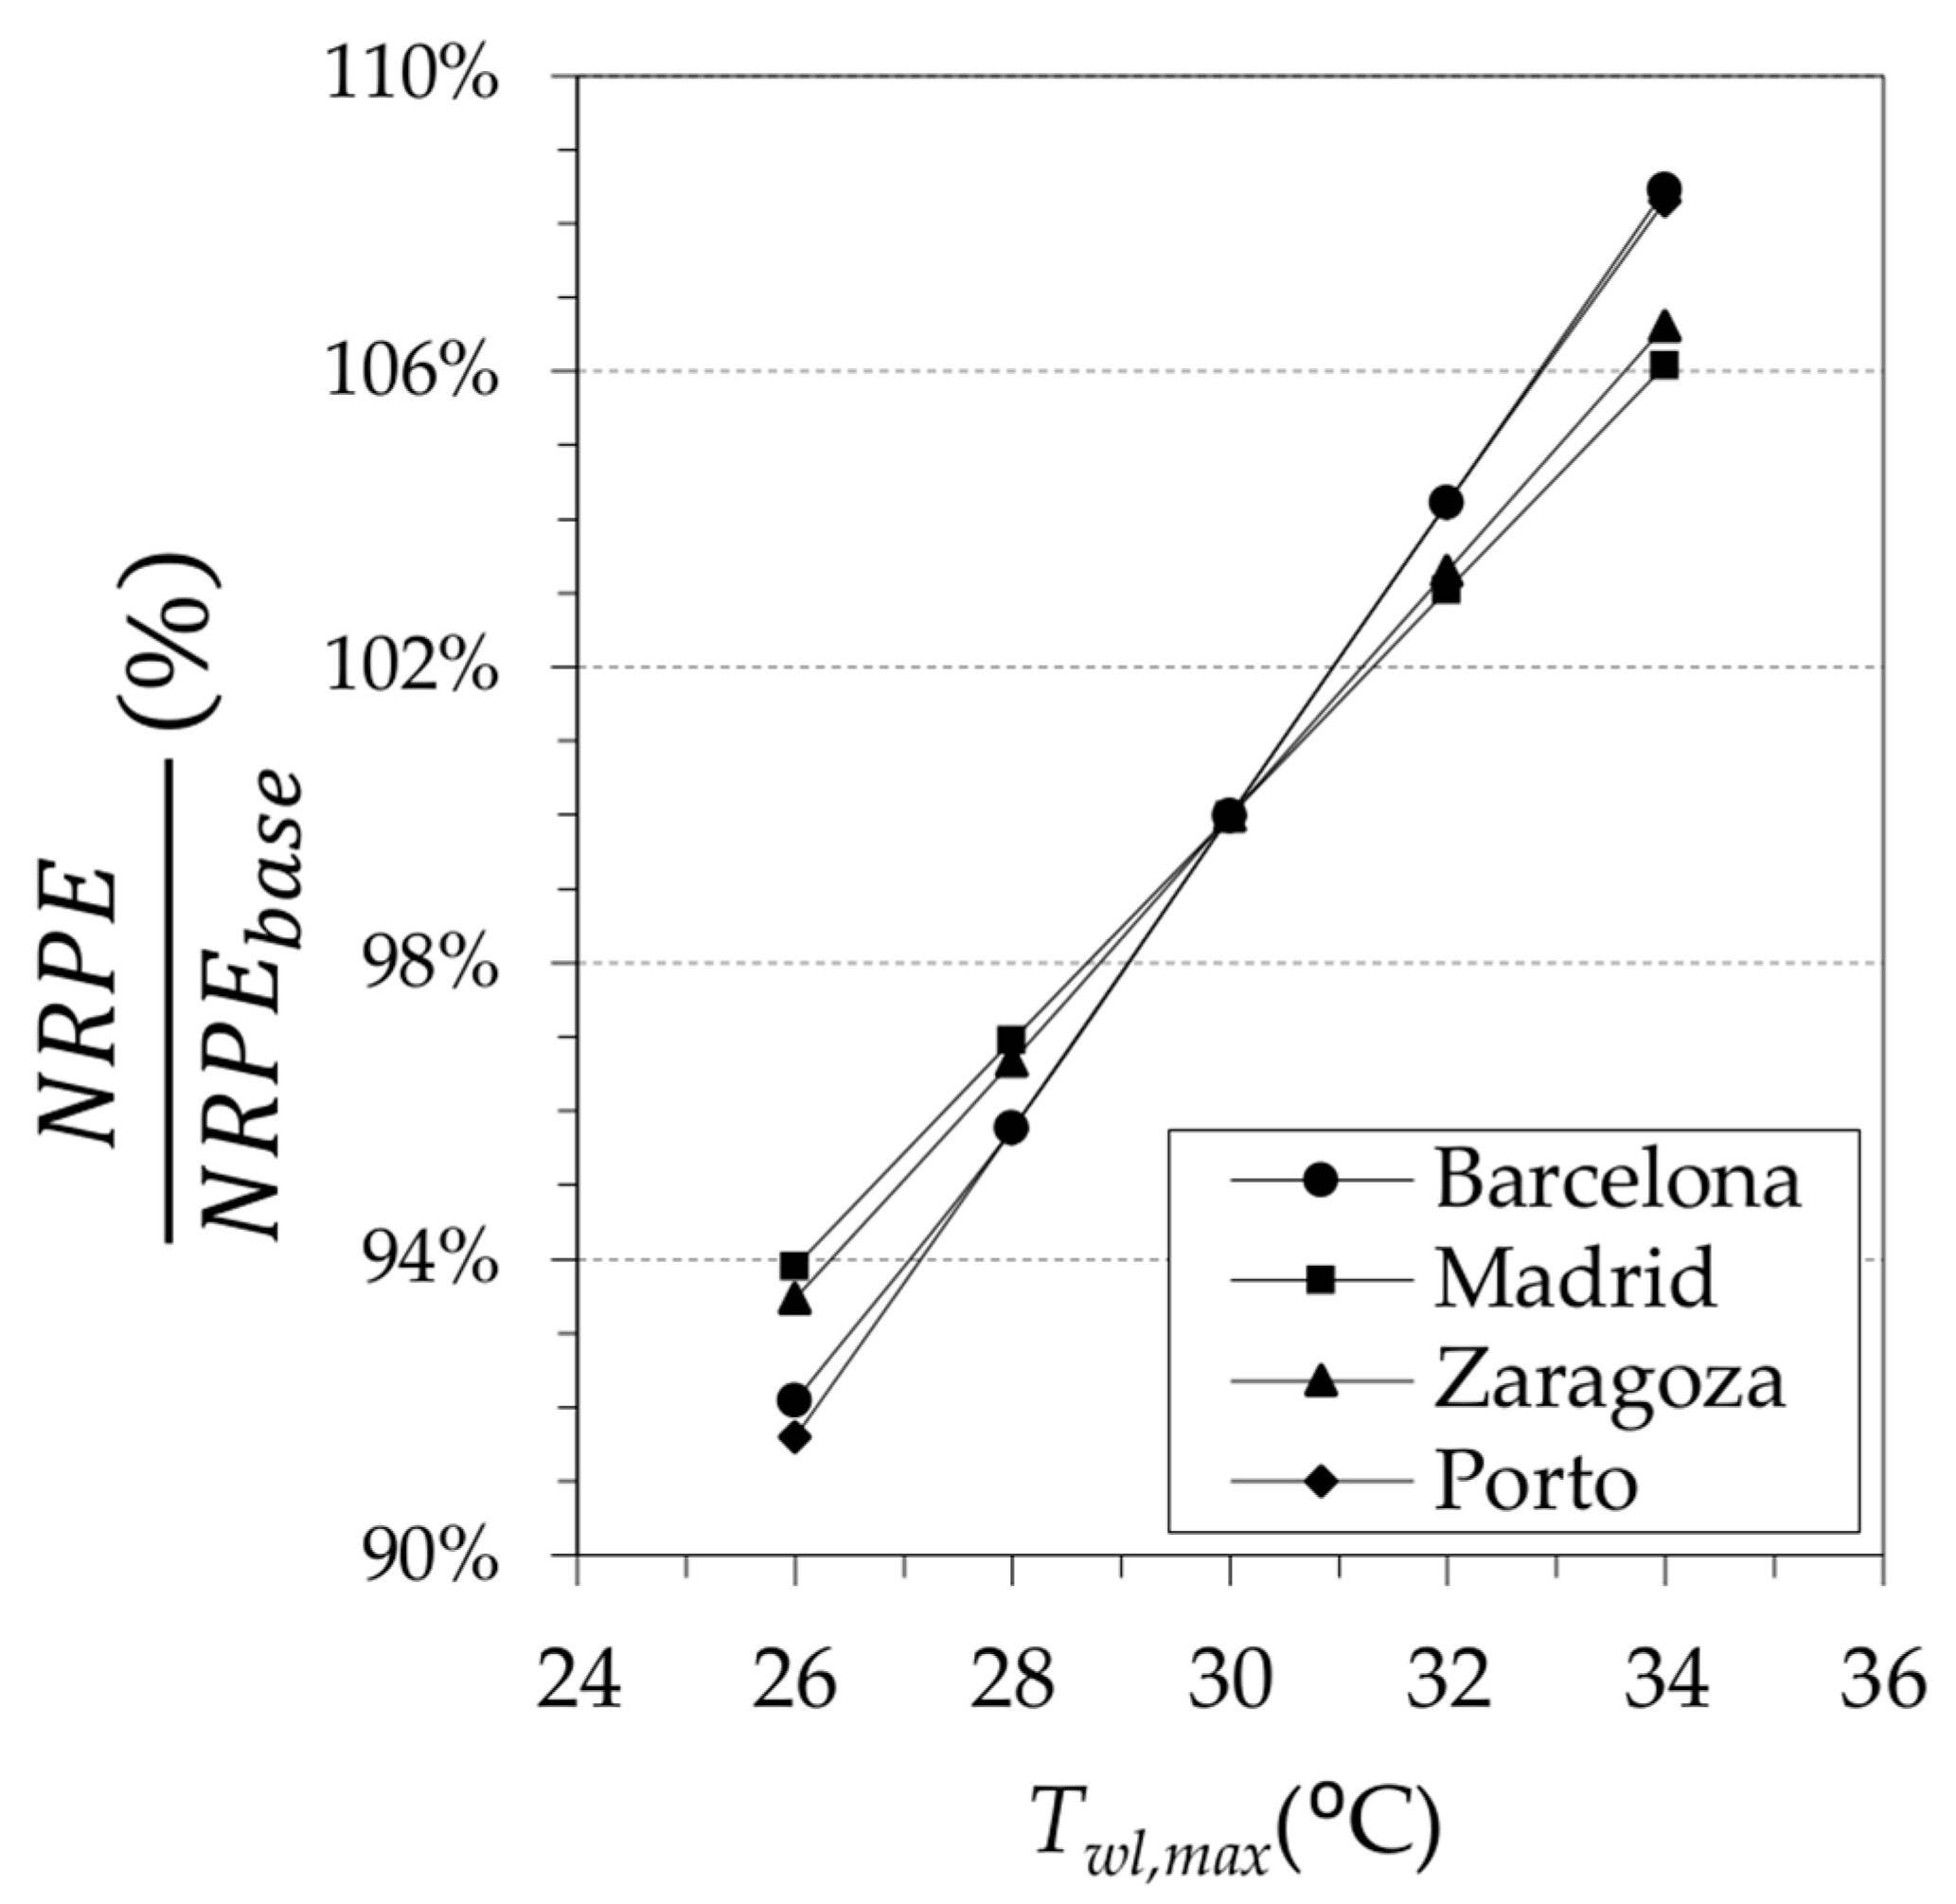
Figure 8.
Effect of storage capacity per unit of habitable surface area (mst) in the relative annual total thermal consumption, total electrical consumption and nonrenewable primary energy with respect to a base case with mst = 10 kg/m2.
Figure 8.
Effect of storage capacity per unit of habitable surface area (mst) in the relative annual total thermal consumption, total electrical consumption and nonrenewable primary energy with respect to a base case with mst = 10 kg/m2.

Table 1.
WLHP system: Annual energy consumption and mean efficiency parameters.
| WLHP System | Madrid | Barcelona | Zaragoza | Porto |
|---|---|---|---|---|
| Total thermal consumption (QT), kWh | 7279.7 | 2443.3 | 6786.6 | 1751.6 |
| Total electrical consumption (We,T), kWh | 12,974.4 | 13,550.1 | 14,728.9 | 10,139.7 |
| Nonrenewable primary energy (NRPE), kWh | 34,014.8 | 29,384.5 | 36,856.4 | 21,897.3 |
| CO2 emissions, kg | 6129.0 | 5100.8 | 6585.5 | 3797.6 |
| Heat pumps seasonal coefficient of performance (COP) | 4.05 | 4.07 | 4.05 | 4.08 |
| Heat pumps seasonal energy efficiency ratio (EER) | 3.82 | 3.82 | 3.82 | 3.82 |
| Energy evacuated, cooling tower (Qwl,ct), kWh | 46,337.3 | 55,287.4 | 54,399.6 | 41,552.8 |
| Water loop pump consumption (Wp,wl), kWh | 335.2 | 362.9 | 383.7 | 272.5 |
| Cooling tower pump consumption (Wp,ct), kWh | 362.5 | 432.5 | 425.6 | 325.1 |
| Cooling tower fan consumption (Wf,ct), kWh | 318.8 | 434.0 | 405.2 | 300.6 |
| Max. boiler power (Pb,max), kW | 23.3 | 16.3 | 25.8 | 12.5 |
| Max. cooling tower dissipation rate (Pct,max), kW | 80.6 | 98.7 | 104.9 | 79.5 |
Table 2.
4-Tube Fan-coil system: Annual energy consumption and mean efficiency parameters.
| 4-Tube Fan-Coil Water System | Madrid | Barcelona | Zaragoza | Porto |
|---|---|---|---|---|
| Total thermal consumption (QT), kWh | 9876.3 | 3501.1 | 9332.3 | 2543.0 |
| Total electrical consumption (WeT), kWh | 12,629.3 | 14,306.8 | 15,001.7 | 9856.3 |
| NRPE, kWh | 36,430.5 | 32,121.9 | 40,418.7 | 22,285.4 |
| CO2 emissions, kg | 6669.1 | 5617.8 | 7317.3 | 3903.3 |
| Chiller seasonal EER | 3.23 | 3.38 | 3.20 | 3.67 |
| Heating circuit pump consumption (Wp,b), kWh | 19.6 | 6.9 | 18.5 | 5.0 |
| Cooling circuit pump consumption (Wp,ch), kWh | 230.6 | 275.2 | 271.0 | 206.9 |
| Dry condenser fan consumption (Wf,dc), kWh | 969.1 | 1004.0 | 1163.8 | 641.1 |
| Max. boiler power (Pb,max), kW | 32.6 | 22.8 | 36.1 | 17.4 |
| Max. chiller cooling rate (Pch,max), kW | 22.8 | 24.8 | 29.3 | 21.8 |
© 2017 by the authors. Licensee MDPI, Basel, Switzerland. This article is an open access article distributed under the terms and conditions of the Creative Commons Attribution (CC BY) license (http://creativecommons.org/licenses/by/4.0/).
Share and Cite
MDPI and ACS Style
Fernández, F.J.; Folgueras, M.B.; Suárez, I. Study and Optimization of Design Parameters in Water Loop Heat Pump Systems for Office Buildings in the Iberian Peninsula. Energies 2017, 10, 1958. https://doi.org/10.3390/en10121958
AMA Style
Fernández FJ, Folgueras MB, Suárez I. Study and Optimization of Design Parameters in Water Loop Heat Pump Systems for Office Buildings in the Iberian Peninsula. Energies. 2017; 10(12):1958. https://doi.org/10.3390/en10121958
Chicago/Turabian StyleFernández, Francisco Javier, María Belén Folgueras, and Inés Suárez. 2017. "Study and Optimization of Design Parameters in Water Loop Heat Pump Systems for Office Buildings in the Iberian Peninsula" Energies 10, no. 12: 1958. https://doi.org/10.3390/en10121958
Note that from the first issue of 2016, this journal uses article numbers instead of page numbers. See further details here.