New Performance Indices for Voltage Stability Analysis in a Power System


1
Department of Electrical and Electronic Engineering Science, University of Johannesburg, Johannesburg 2006, South Africa
2
Department of Electronic and Electrical Engineering, Ladoke Akintola University of Technology, P.M.B 4000, Ogbomoso 210271, Oyo State, Nigeria
*
Author to whom correspondence should be addressed.
Energies 2017, 10(12), 2042; https://doi.org/10.3390/en10122042
Submission received: 23 September 2017
/
Revised: 16 November 2017
/
Accepted: 26 November 2017
/
Published: 3 December 2017
(This article belongs to the Section F: Electrical Engineering)
Abstract
:The frequent occurrence of voltage instability in a modern power system is alarming and thus, has been of great concern to power system utilities. In this paper, a new performance index based on the power flow solutions for voltage stability assessment of a power system is presented. First, the voltage deviation with respect to reactive power load variation at each load bus is found. Thereafter, the performance voltage bus index for each load bus is computed. An improved modal analysis technique (IMAT) is used to identify weak nodes that are liable to voltage instability in a power system. This technique uses a submatrix of the full Jacobian matrix for voltage stability analysis. Comparison of the proposed method is done with existing voltage stability indices and the conventional modal analysis technique (CMAT). The effectiveness of all the approaches presented are tested on both Western system coordinating Council (WSCC) 9-bus, IEEE 30 bus and IEEE 57 bus test systems. Results obtained show that the proposed techniques can serve as an alternative tool to other conventional techniques for voltage stability assessment in a power system and can be of tremendous benefits in the planning and operation of a power system by system operators.
1. Introduction
Voltage stability is said to be the ability of a power system to maintain acceptable voltages at all network buses of the system under normal operating conditions and after being subjected to a disturbance [1]. The power system utilities have been much more concerned about the incessant occurrence of voltage instability as a result of continuous increase in load demands and lack of transmission capability. Recently, the problem of voltage instability has been observed as the main cause of numerous major network blackouts experienced in various countries such as France, Sweden, Belgium, Sweden, Germany, Japan, Iran and USA [2]. Thus, the need for a reliable method for voltage stability assessment in a power system [3]. Voltage stability is believed to be a dynamic phenomenon. If analysis targets system critical bus identification, reactive power compensation or load margin, then the use of static model is adequate [4]. A considerable portion of research studies has concentrated on the static model aspects of voltage stability. While steady state analysis is simple, it yet gives some practical benefits over dynamic analysis, providing results with satisfactory accuracy and slight computational effort [4]. A system is said to enter a state of voltage instability when a disturbance, an increase in load demand and/or a variation of system conditions cause a continuous and uncontrollable drop in voltage. The key factor, which contributes to voltage instability, is the incapability of a power system to meet the reactive power demand [5].
The importance of reactive power cannot be overemphasized since it affects the transmission system reliability and efficiency with which real power is delivered to end users. If the problems related to the reactive power are ignored, it may eventually result in voltage collapse phenomenon which has been responsible for several blackout incidents throughout the globe [6,7]. Voltage collapse problems may basically be described as the system’s inability to supply the reactive power or by an excessive absorption of reactive power by the power system itself [8]. Therefore, it is becoming more and more imperative for power system operators and engineers to perform a comprehensive voltage stability analysis of the power systems.
To achieve this, a considerable number of techniques has been reported in the literature [9,10]. Some of these methods include, but are not limited to the use of real power-voltage (PV) and reactive power-voltage (QV) curves, continuation power flow, multiple power flow solutions, modal analysis and optimization-based techniques [11,12,13,14,15]. These methods have their own benefits and shortcomings, which were presented in [16]. For instance, as reported in [11], although, PV and QV curves and multiple power flow solution techniques have been reported as being useful, especially in the analysis of voltage stability in a power system, these techniques are time-consuming and they require a lot of computational efforts, especially for a large power system network [14]. To overcome the difficulties posed by the use of PV and QV curves, the continuation power flow (CPF) method was proposed for steady state voltage stability analysis [12] in a power system. Although the use of the CPF method has proved to be insightful and meaningful, unfortunately, it is also time-consuming as several loading conditions have to be specified before the critical bus, which is susceptible to voltage collapse is identified. In addition to the aforementioned power flow-based traditional methods, voltage stability indices have gained much attention recently and they include voltage stability index (L-index), voltage collapse proximity index (VCPI), fast voltage stability index (FVSI), line stability index (LSI), Full Sum dQ/dV (FSQV) index and so on [8,17,18,19]. Some of these methods are insightful and useful in the analysis of voltage stability, while some are not practical since their computation cost is high for large power system networks.
This paper proposes a new performance index which is based on the voltage deviation of each load bus of the system for voltage stability analysis. Detailed information regarding the maximum loadability of the load buses and the total step size for the loadability of each load bus can be known from this index. This index can be used as an alternative tool to the existing voltage stability indices to solve voltage stability related issues in a power system. This approach, which made use of only the submatrix of the Jacobian matrix to determine the weak bus of the system, was reported in [19]. However, it is not practical due to its high computation cost. In this study, we try to propose an improved modal analysis technique which is based on the submatrix of the Jacobian matrix instead of either the full matrix or the reduced Jacobian matrix.
The main contributions of this study are thus summarized as follows: (1) a performance index which takes into account the maximum loadability of the buses, the voltage deviations and the total number of steps taken to reach a minimum permissible reactive power load of each load bus is proposed. This information is imperative and could be of significance to power system operators in the analysis of voltage stability of a power system; (2) computational burden usually encountered in the course of the study of voltage stability is also a growing concern to the system utilities. In the case of voltage collapse occurrence, the aftermath of this may be adverse as the end users of electricity may often be left in a total blackout for longer periods of time. Using a full Jacobian matrix for voltage stability analysis may aggravate this problem. Thus, an approach which considers a submatrix of the Jacobian matrix and which also focuses on the important factors that affect voltage stability in a power system is proposed.
The remainder of this paper is organized as follows. Section 2 gives the mathematical formulation of the traditional power-flow-based voltage collapse proximity index, the proposed performance index and the suggested IMAT. Results of the simulation obtained for all the test cases used are presented in Section 3. Discussion of the results is presented in Section 4. The conclusion of the work is presented in Section 5.
2. Power Voltage Performance Indexes
This section presents the mathematical formulations of the conventional index and the proposed methods.
2.1. Mathematical Formulation of the VCPI [17]
Consider a single diagram shown in Figure 1.
The injected current at node is given as:
where,
- = Current injected at node
- = Voltage at mth node
- = Voltage at kth node
- = Mutual admittance between mth and kth nodes
The apparent or complex power injection at mth node is given as:
By substituting (2) into (1):
If we define:
one obtains:
where:
Re-arranging (5) and (6) gives:
where is the voltage angle at node.
Algebraic manipulation of (8) yields:
At the voltage collapse point, the determinant of (9) will always equal to zero. This means that the matrix (9) becomes singular at the voltage collapse point.
If J = 0, we have:
Re-writing (10), one can obtain:
where in (11) is a real constant.
Using the complex number identities, (11) can be written as:
Thus, the VCPI at is given as:
Equation (13) implies that, the bus voltage is stable if the VCPI index is 0 and if it is 1 the bus voltage reaches a collapse point.
2.2. Proposed Performance Voltage Stability Index (PVSI)
Voltage stability analysis in a power system usually begins with a power flow solution to determine the voltage magnitude at each node. Also, using Figure 1, the current injected into a node in terms of real and reactive power is given as:
The details of the power flow equations by Newton Raphson iterative technique is reported in [20]. In a compact form, a linearized power flow equation may be written as:
where and are the Jacobian matrices of the system.
The new voltage magnitude at a bus m can be updated as:
where is the number of step size (iterations).
By using the bus voltage magnitudes obtained from Equation (17), the absolute values are taken and changed into per unit.
Thus, the performance voltage deviation index (PVDI) with respective to reactive power load variations at each load node is given as:
where represents the total number of load nodes;
- is the nominal voltage magnitude;
- is the voltage magnitude at node;
- is the reactive power loading condition.
Assuming that the change in the reactive power deviation at each load node of the system is , with being the total number of step sizes taken by each load node to reach the maximum loadability. Thus, the proposed performance voltage bus index (PVBI) can be formulated as:
Equation (19) may be expressed in terms of the maximum loadability of a load node m. That is, the total summation of individual reactive power load changes at each iteration step of a load bus m.
Thus,
where = maximum loadability of load node .
Let:
Substituting Equation (21) into (20), we have:
Equation (22) implies that, the load node that has maximum value of the proposed PVBI is taken as the voltage collapse node due to the inverse relationship that exists with the product of the total step size () and the maximum loadability (Qmax) of a load node .
Equation (22) may therefore be expressed as:
There are two main benefits associated with the proposed PVBI: (1) both weak and voltage collapse nodes can be identified using the proposed method. (2) information relating to the maximum loadability of each load node and the total number of step sizes taken to reach the maximum loadability of each load bus can easily be obtained.
2.3. Conventional Modal Analysis Technique (CMAT)
Details of the mathematical formulations involved in the CMAT are presented in [14,21]. This conventional method makes use of a reduced Jacobian matrix, modes of the system and the participation factor of each load bus to study voltage stability in a power system. Although, significant contributions were made by the authors through the proposed CMAT, the approach could still be further simplified and explored to ensure less computational efforts and also focus on the key factors that affect voltage stability in a power system.
2.4. Improved Modal Analysis Technique (IMAT)
The suggested IMAT is also based on the linearized power flow model as follows:
where is the Jacobian matrix of the system and is given as:
Since most voltage instability experienced in the past was caused by insufficient reactive power to meet the power demand, it is believed that information contained in the incremental relationship between the reactive power Q and system voltage magnitude V could be sufficient to evaluate voltage stability in a power system. The suggested modified modal analysis method focuses mainly on the Jacobian element JQV for voltage stability analysis against the use of reduced Jacobian matrix as proposed by [14].
Therefore, based on these assumptions, we may express the relationship that exists between the reactive power Q and voltage magnitude V with respect to JQV as:
where comprises of the product of the partial derivatives of the reactive power equation with respect to the voltage magnitude:
The proposed IMAT also makes use of the eigen-analysis to determine the critical mode. The contribution of each bus to the critical mode identified using eigenvalue decomposition method is determined. This method is more advantageous in that it focuses majorly on the key factor that affect voltage stability in a power system. Analysis with the full Jacobian matrix could be computationally expensive. Thus, the computational efforts involved could be reduced significantly with the use Jacobian element JQV.
2.4.1. Determination of the Modes of a Power Network
The modes of a power system can be determined by finding the eigenvalues and eigenvectors of the Jacobian matrix .
Let:
where
- is the right eigenvector of the Jacobian matrix ;
- represents the left eigenvector of the Jacobian matrix and
- represents the diagonal eigenvalues of the Jacobian matrix .
From Equation (28), we have:
Substituting Equation (29) in (27), we obtain:
Equation (30) may be re-written as follows:
Equation (31) shows that large eigenvalues implies small changes in the modal voltage and vice versa, due to the inverse relationship that exists between them. However, as the power system is stressed due to continuous increase in reactive power demand, the eigenvalue tends to be smaller, and thus, results in system voltage drop. Voltage collapse may occur if the magnitude of the eigenvalue becomes zero as this may undergo many changes in the reactive power variation. We can therefore infer that the mode which has the smallest eigenvalues is the critical mode of the system. Identification of this mode is very important in voltage stability assessment.
2.4.2 Bus Participation Factor
The left and right eigenvectors of the matrix associated with the critical mode of the system can also provide useful information regarding the voltage instability of the system. Identification of various elements participating in the modes is also of great importance to the planning and operation of the system.
Thus, the bus participation factor measuring the participation of node to the mode may be expressed in terms of the left and right eigenvectors as follows:
This we termed as Improved Modal analysis Technique (IMAT) in this paper. Thus,
The load nodes with large participation factor to the critical mode is considered as the voltage unstable buses which are susceptible to voltage collapse. The IMAT is synonymous with the CMAT. This is because both techniques involve determination of the critical mode of the system and the bus participation factor that measures the contributions of each node to the critical mode identified. However, the difference is that the IMAT makes use of the diagonal eigenvalues of the Jacobian matrix whereas the CMAT uses the reduced Jacobian matrix in the analysis.
3. Simulation Results and Discussion
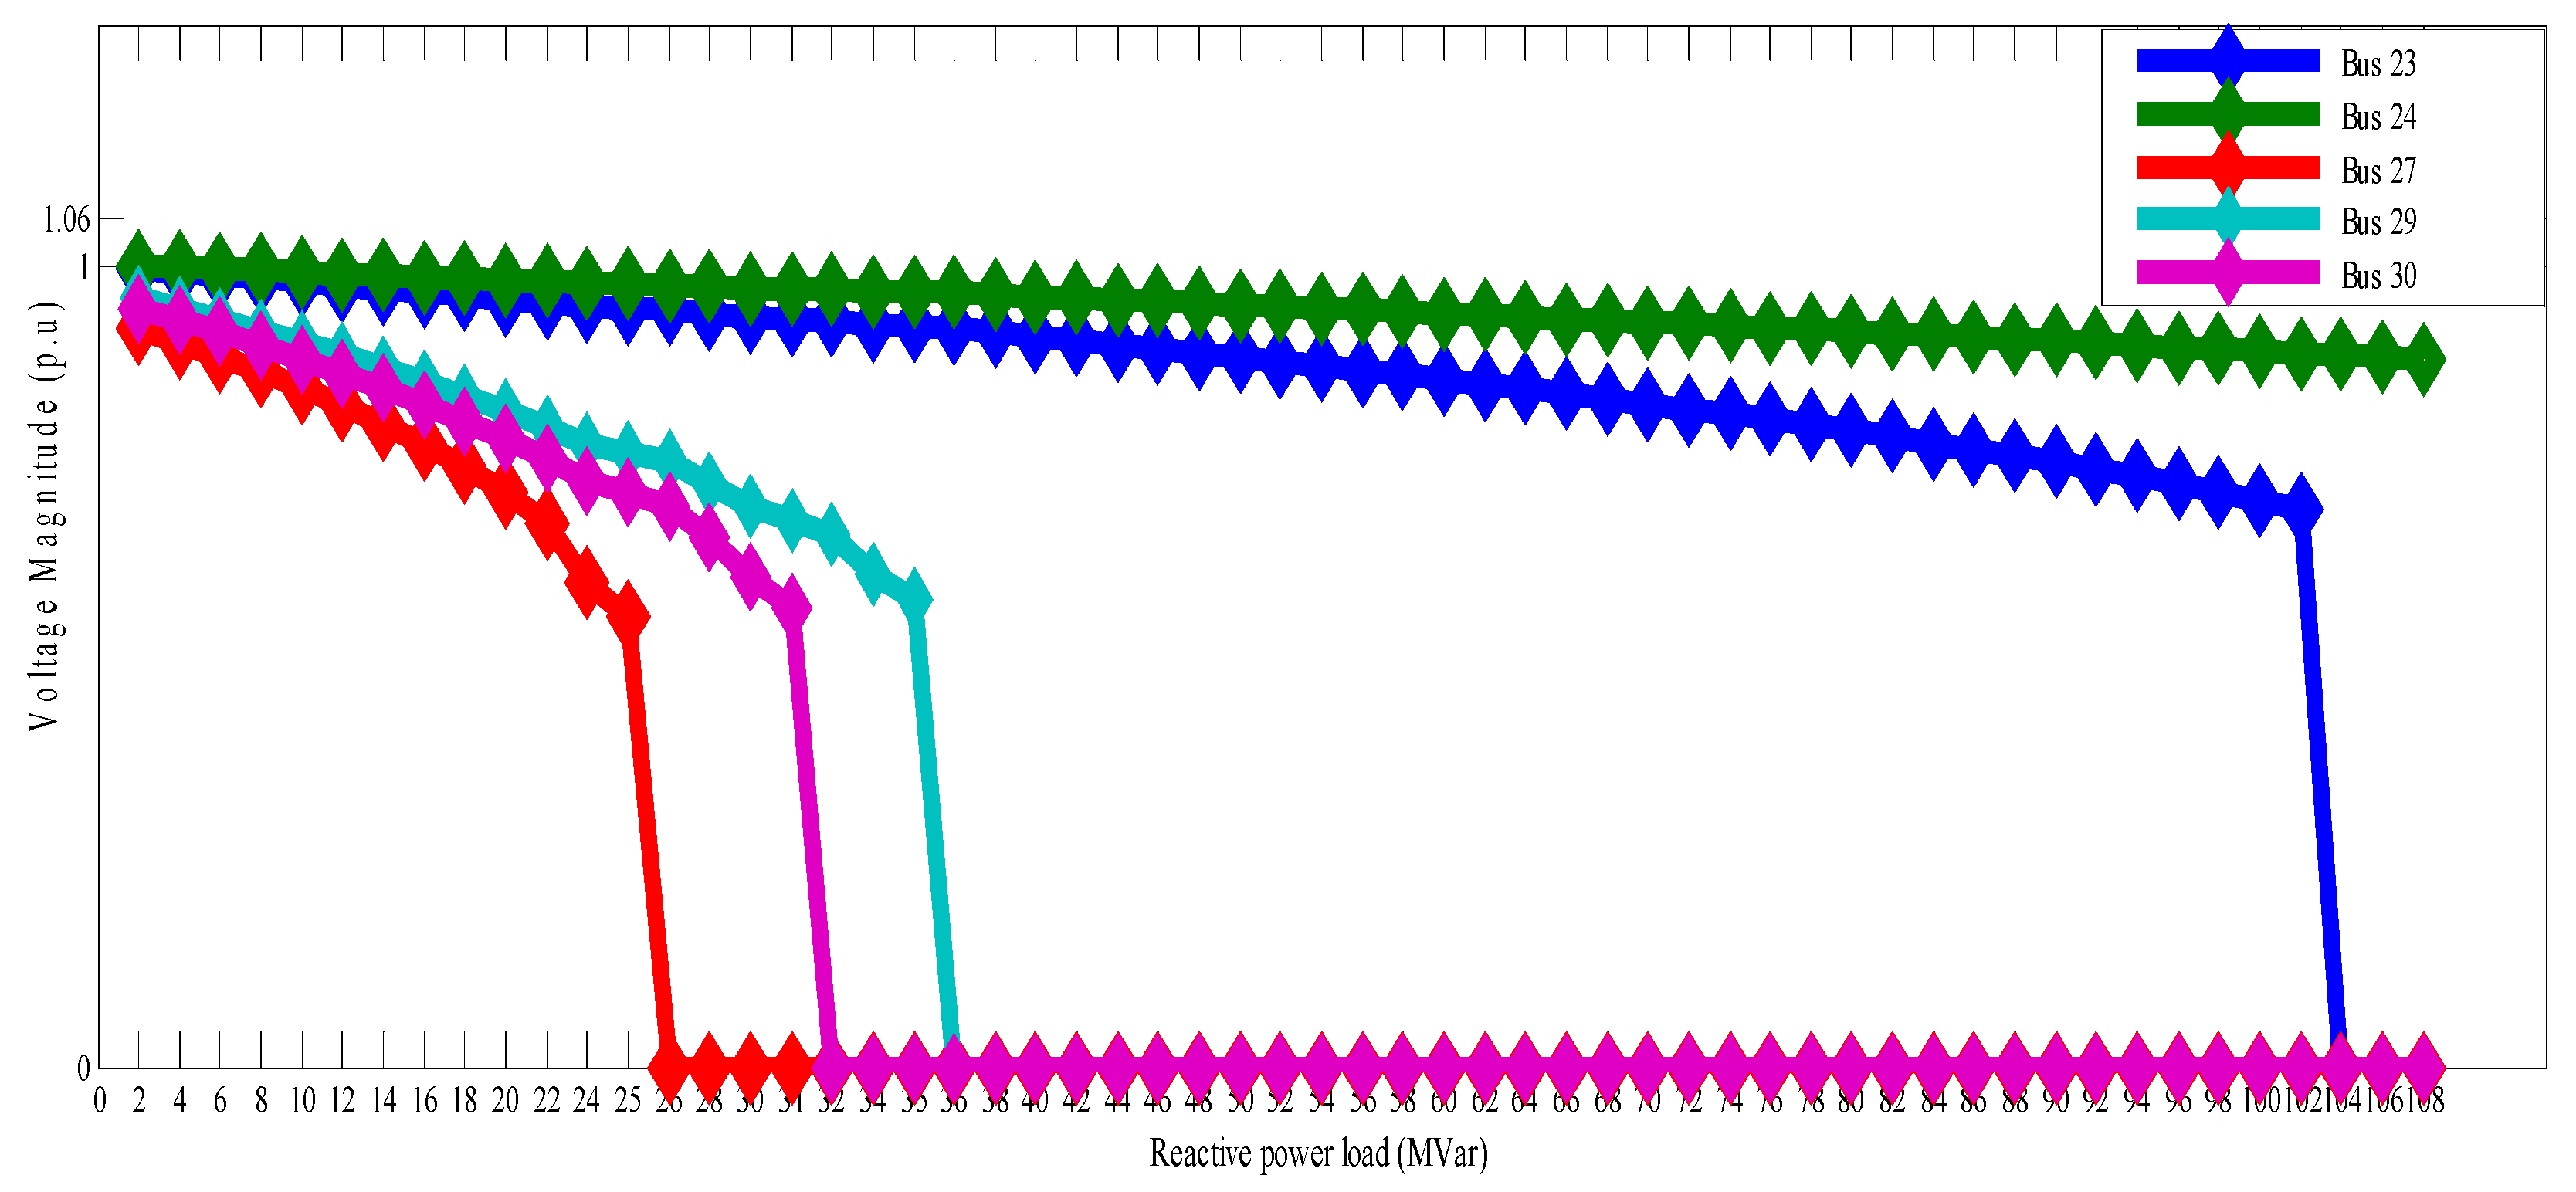
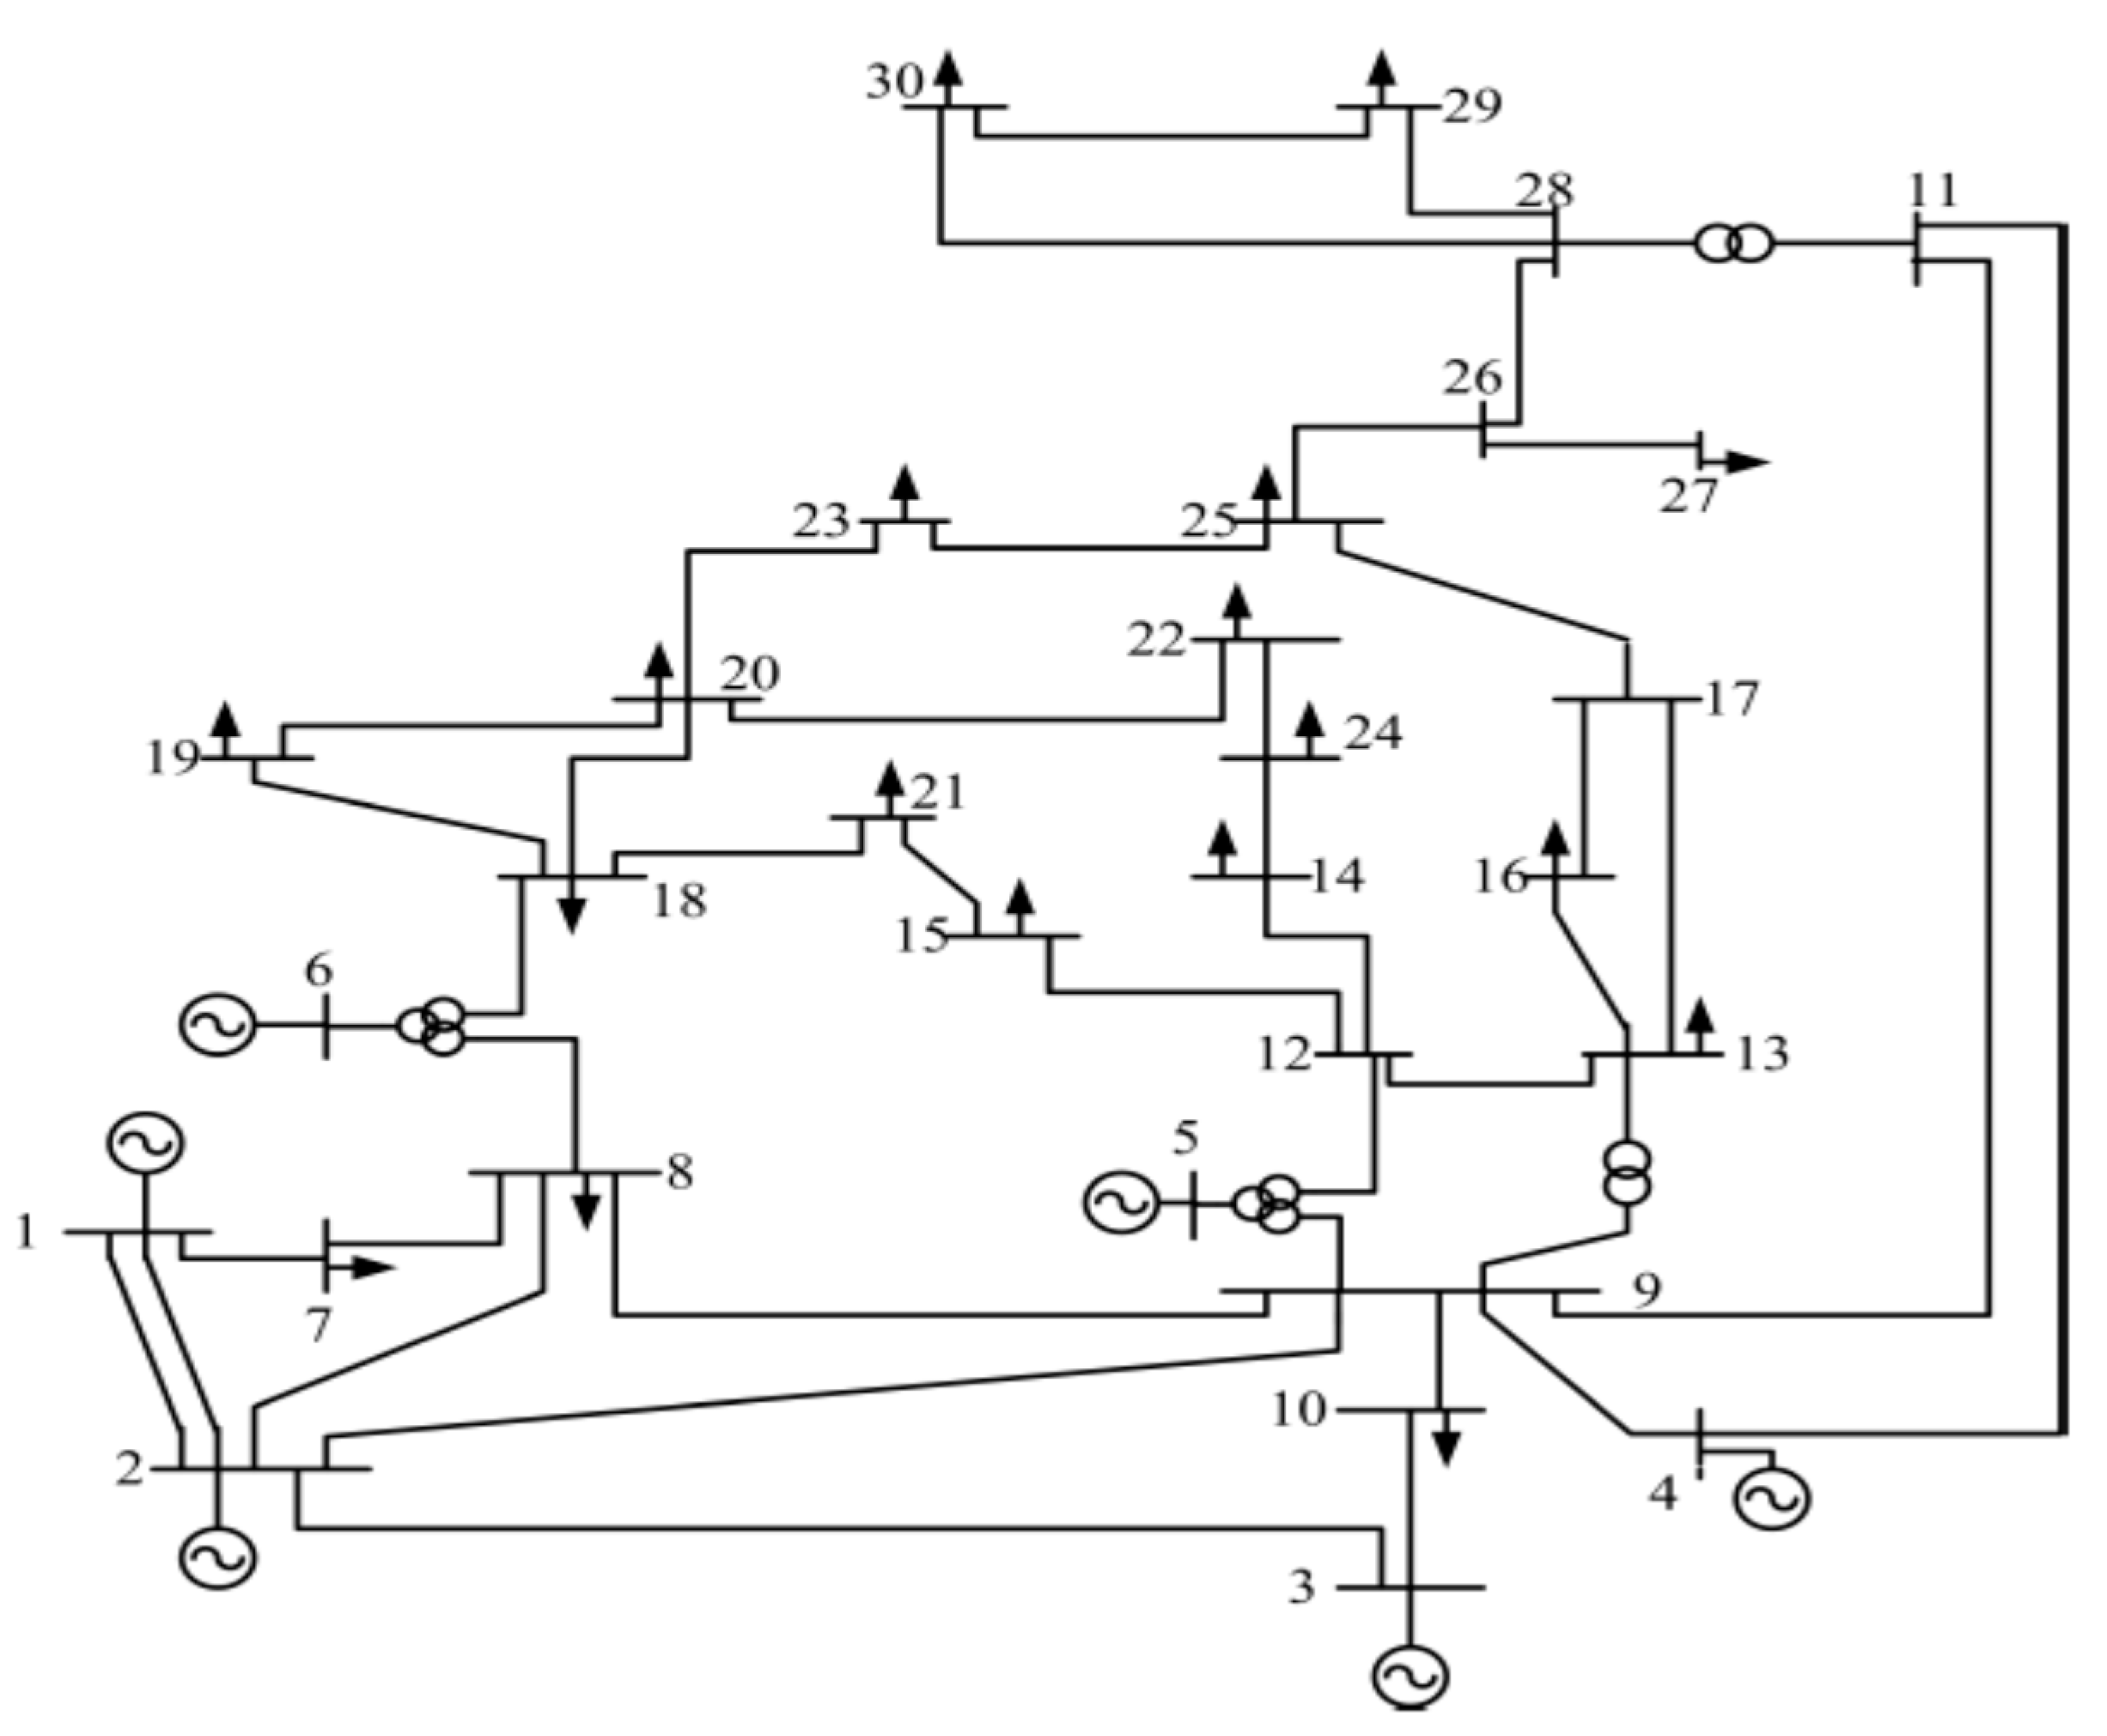
The effectiveness of all the approaches presented are tested on the WSCC 9-bus, IEEE 30 bus and IEEE 57 bus power systems. The detailed descriptions of the WSCC 9-bus and IEEE 30 bus power systems are presented in [22,23], respectively. In this work, load buses 5, 6, 8 and 23, 24, 27, 29 and 30 of the WSCC 9-bus and IEEE 30-bus test systems, respectively, are randomly selected for the purpose of voltage stability analysis. The WSCC 9-bus test system has three (3) loads connected at buses 5, 6 and 8 respectively. Similarly, the IEEE 30 bus system whose single line diagram is shown in Figure 2 consists of six (6) generator nodes, twenty four load nodes and forty one transmission lines with four (4) tap ratios. Also, the IEEE 57 bus test system has seven (7) generator nodes, fifty (50) load nodes and eighty (80) transmission lines. Nodes 12, 25, 27, 30, 31, 32, 33 and 57 of the IEEE 57 bus power system are selected at random in this paper for the purpose of analysis. These nodes were found to have the least allowable reactive power loads among all the load nodes of the system.
Simulation Results of the VCPI, CMAT and the Proposed PVBI and IMAT
All the simulations were done using MATLAB software (R2014a, MathWorks, Natick, MA, USA). Windows 7, HP, 64 bit operating system, with 500 GB hard disc and 4 GB random access memory laptop are used. Results of the simulation obtained are presented in the form of test cases. Test cases A, B and C show the results obtained for the WSCC-9 bus, IEEE 30 bus and IEEE 57 bus test systems, respectively. Table 1 and Table 2 and Figure 3 of Test Case A, show the results obtained for the traditional VCPI, proposed PVBI and voltage magnitude with respect to reactive power load variation at each load bus of the 9-bus test system, respectively. Simulation results of the CMAT and the proposed IMAT are also shown in Table 3 and Table 4, respectively. Similarly, the results of VCPI, proposed PVBI and the voltage magnitude of the IEEE 30 bus system are also presented in Table 5 and Table 6, and Figure 4, respectively. We have also presented the results obtained for the CMAT and the proposed IMAT for the IEEE 30 bus system in Table 7 and Table 8, respectively. The proposed approaches were also tested on a large-scale IEEE 57 bus test system. Results of the VCPI and the proposed PVBI for the selected nodes of the IEEE 57 bus test system are as presented in Table 9 and Table 10, respectively. The voltage magnitudes obtained at the minimum allowable load of the randomly selected nodes of the IEEE 57 bus system, are also presented alongside with both Table 9 and Table 10. We have also shown results of the CMAT and the proposed IMAT for the IEEE 57 bus test system in Table 11 and Table 12, respectively.
Test Case A: Results of the VCPI, PVBI, Voltage magnitude, CMAT and IMAT for the WSCC 9-bus test system.
Test Case B: Results of the IEEE 30-bus power system.
Test Case C: Results of the IEEE 57-bus power system.
4. Discussion of Results
The discussion of the results obtained for all the approaches considered are presented in this section. To ensure clarity of presentation, results of the conventional methods as well as the suggested techniques are discussed separately in subsections of this paper.
4.1. Results of the Traditional VCPI
To identify voltage collapse buses using the traditional power-flow-based approach VCPI, the system is subjected to the contingencies of gradual reactive power load increase at each load bus. Power flow is performed for each reactive power load variation at every load bus. The load bus that has maximum value of VCPI is considered as the critical bus of the system that is liable to voltage collapse. For this traditional method, load buses 5, 6 and 8 of the WSCC 9-bus system are randomly selected based on the loadability of each bus.
Similarly, for the IEEE 30 bus test system, load buses 23, 24, 27, 29 and 30 have been reported as the most critical buses of the IEEE 30 bus system [23]. Thus, these buses are selected for further study of voltage stability analysis. The outputs of the power flow solutions and the admittance matrix of the network were used by this method to evaluate VCPIs for various operating scenarios, which involve gradual reactive power load variation at each load bus.
From the simulation results presented in Table 1 and Table 5 of the test cases A and B, respectively, load buses 5 and 27 of the WSCC 9-bus and IEEE 30 bus test systems have maximum values of VCPI and are considered as the critical buses of the WSCC 9 bus and the IEEE 30 bus systems, respectively.
Their VCPI values are calculated as 0.5235 (bus 5) and 0.4030 (bus 27) for the WSCC 9 bus and IEEE 30 bus systems, respectively. For a reactive power load of 40 MVar at bus 5, the VCPI value was calculated to be 0.5235 and the voltage magnitude was reduced to 0.5677 p.u. from an initial value of 0.8476 p.u. This is shown in Figure 3. Similarly, for the IEEE 30 bus system, we observed that load bus 27 has the maximum loadability of 25 MVar and least voltage magnitude of 0.5623 p.u. as shown in Table 5 and Figure 4, respectively. With the VCPI method, it takes the total computational time of 50.042033 s and 99.120633 s to identify the critical buses 5 and 27 of the WSCC 9 bus and the IEEE 30 bus test systems, respectively. Results of the VCPI for each load node of the IEEE 57 bus power system presented in Table 9 show that, bus 31 is the most susceptible bus to voltage collapse when compared with the results obtained for other load buses. The VCPI values of the selected buses 12, 25, 27, 30, 31, 32, 33 and 57 are 0.3584, 0.4826, 0.4004, 0.5002, 0.7400, 0.5021, 0.6327 and 0.4203, respectively, from which bus 31 has the highest VCPI value. Thus, with the traditional approach of VCPI, bus 31 is considered as the critical bus of the IEEE 57 bus test system. Besides, of all the load nodes of the IEEE 57 bus test system, bus 31 has the lowest voltage magnitude of 0.5069 p.u. at the minimum reactive power load of 17 MVar as shown in Table 9. It takes the total computational time of 228.105231 s to identify this bus.
4.2. Proposed Performance Voltage Bus Index (PVBI)
For the proposed PVBI method, first, the performance voltage deviation index (PVDBI) for each load bus with respect to reactive power load variation was calculated using Equation (18). Power flow solution was performed on every load bus at each reactive power load increase. We then estimated the PVBI for each load bus using Equation (24) to monitor system voltage stability. The load bus that has maximum value of PVBI is taken as a critical bus which is susceptible to voltage collapse. The stability of a bus using the suggested PVBI also depends on the maximum loadability value of that bus and the total number of steps taken to reach the collapse point.
The performance of this proposed method is tested on the WSCC 9 bus, IEEE 30 bus and IEEE 57 bus test systems, and results obtained are shown in Table 2, Table 6 and Table 10, respectively. Buses 5, 8 and 6 are considered weak load buses of the WSCC 9 bus system based on the bus ranking order which was done by considering the maximum loadability of each load bus, the total number of steps taken to attain a collapse point and the value of PVBI at each bus. However, as can be observed in the case of WSCC 9 bus system, load bus 5 has the maximum value of PVBI (20.3000 × 10⁻⁴), minimum allowable load (40 MVar) and least voltage magnitude (0.5677 p.u.) as shown in Table 2 and Figure 3. We also observed a total voltage collapse on this bus, as the power flow solution did not converge for any additional load beyond the minimum permissible reactive power load of 40 MVar. Thus, of all the load buses of the WSCC 9 bus system, bus 5 is the critical bus liable to voltage collapse. The total computational time taken to identify the critical load bus 5 of the 9 bus system is 40.774147 s.
Similar procedures were also followed for the IEEE 30 bus system, to identify a voltage collapse bus in the system. Buses 27, 30, 29, 23 and 24 are identified as the weak buses of the system in accordance with the ranking order as shown in Table 6. However, load bus 27 is found to be the weakest of them all, having the maximum PVBI value of 21.48388 × 10⁻⁴, least sustainable load of 25 MVar, lowest total number of step size of 14 and lowest voltage magnitude (0.5677 p.u.). The voltage stability analysis of the IEEE 30 bus system took up to the total computational time of 90.984727 s to attain a solution. This amounts to 8.2% of time saving compared with the conventional modal analysis technique. Also, for a large scale IEEE 57 bus system, bus 31 has the least permissible reactive power load of 17 MVar, maximum PVBI value of 51.960784, lowest total number of step size of 6 and least voltage magnitude (0.5069 p.u.) at the minimum permissible load of 17 MVar. Thus, with the proposed PVBI, bus 31 is considered the weakest load bus of the IEEE 57 bus test system. It takes the total computational time of 198.559777 s to attain this solution. This amounts to 12.95% of time saving compared with the traditional approach of VCPI.
4.3. Conventional Modal Analysis (CMAT) and the Proposed IMAT
The simulation results of the CMAT for the WSCC 9-bus, IEEE 30-bus and the IEEE 57 bus test systems are as shown in Table 3, Table 7 and Table 11, respectively. Eigenvalue decomposition technique was applied on the reduced Jacobian matrix to compute the modes of the system. This enables us to obtain the relative proximity of the system to voltage collapse. The participation factors of each load bus were then computed based on the critical mode to predict voltage collapse bus in the system. The bus that has highest value of the participation factor or CMAT was taken as the critical bus of the system. For the WSCC 9-bus system, the minimum eigenvalue is 0.1919 which corresponds to mode 6 of the system. Mode 6 is then identified as the critical mode as shown in Table 3. The bus participation factors were then computed based on this critical mode. Results of the participation factors obtained for all the load buses show that bus 5, being the bus with the highest value of the participation factor (0.8535), is the most critical bus of the 9-bus power system.
The total computational time taken to achieve this solution is estimated to be 0.559172 s. In the same vein, still for the conventional modal analysis technique, as shown in Table 7, bus 30 of the IEEE 30 bus system has the highest value of the participation factor (0.2178), and thus, it is identified as the critical bus closest to voltage instability. For the IEEE 30 bus system, using the CMAT, it takes the total computational time of 0.923476 s to reach a solution. Result of the CMAT for the IEEE 57 bus power system is shown in Table 11. The least eigenvalue of this system is 0.2184 and this corresponds to mode 27 as shown in Table 11. This mode is then taken as the critical mode and the corresponding participation factors for each load bus of the IEEE 57 bus power system were computed. As can be seen from Table 11, bus 31 has the highest value (0.1687) of CMAT, and thus, it is ranked as the critical bus of the IEEE 57 bus system. It takes the total computational time of 1.709213 s to reach a solution.
For the proposed IMAT, information contained in the Jacobian matrix which relates the reactive power and the voltage magnitude of the system together was further explored for voltage stability assessment. Unlike the CMAT which makes use of the reduced Jacobian matrix to determine the critical mode of the system, the suggested IMAT uses only the submatrix of the full Jacobian matrix to determine the critical mode (smallest eigenvalues) of the system. Table 4, Table 8 and Table 12 show the simulation results obtained using the IMAT for the WSCC 9-bus, IEEE 30 bus and IEEE 57 bus test systems, respectively. For the WSCC 9-bus system, the minimum eigenvalue is 1.4946 and this corresponds to mode 6. Bus participation factors (PFs) to this critical mode are then computed. Results of this computation shows bus 5 as the critical bus of the system. This is due to its highest value of PF (0.8558) as shown in Table 4. The table also shows that the proposed IMAT predicts the critical buses in exactly the same ranking order with the CMAT. Although, the computational time for each technique differs. The proposed IMAT saves time by 6.8% compared with the conventional approach.
Similarly, for the IEEE 30 bus test system, with the IMAT, the smallest eigenvalues of this system is 0.4481 and corresponds to mode 16 as shown in Table 8. Thus, this mode (mode 16) is then considered as the critical mode. The bus PFs for each load bus are then generated based on the critical mode of the system to predict the proximity of it to voltage collapse. Unlike the CMAT, which identified bus 30 as the critical bus of the IEEE 30 bus system, we observed that, for the suggested IMAT, bus 27 was found to have the maximum value of PF (0.2458). Therefore, this bus is taken as the weakest bus of the IEEE 30 bus system. However, it must be stated that, when compared with the traditional power-flow-based VCPI and the proposed PVBI, bus 27 appears to have the minimum permissible reactive power loading (25 MVar) compared with other load buses of the IEEE 30 bus system. Thus, bus 27, being the critical bus of the IEEE 30 bus system, as identified by the performance voltage stability indices is also in agreement with the result obtained using the proposed IMAT. For the IEEE 30 bus system, the proposed IMAT also saves time by 11.4%. By following same procedures involved in the identification of both critical mode and node using the proposed IMAT, as in both WSCC 9 bus and the IEEE 30 bus test systems, also, for the IEEE 57 bus test system, bus 31 is ranked as the most critical bus of the system being the bus with the highest PF value of 0.1669 as shown in Table 12. When compared with the CMAT, the proposed IMAT saves time by 39.4%.
4.4. A Brief Comparison of all the Techniques Presented
The technique based on the use of VCPI takes longer period of time to identify the critical bus of the system compared to the proposed PVBI. The proposed PVBI also brings out, very clearly, the details information on the voltage deviations of each load bus, the maximum loadability and the total number of steps taken by each bus to reach a point of voltage collapse. This, without doubt, will be of tremendous advantage to the power system utilities, especially, in the planning and operation of the system. Both CMA and IMA techniques have proven to be more significant in voltage stability analysis compared with the power-flow-based performance indices presented. This is because with the modal analysis, solutions are attained in just a single computational step. Nonetheless, the use of the suggested IMAT will go a long way to assist the system engineers in the analysis of voltage stability. This is because computational burden in involved may still be reduced further using the proposed IMAT, as it does not depend on the entire Jacobian matrix. A considerable time is also saved in the course of computation using the IMAT compared with the traditional approach.
5. Conclusions
Performance indices and techniques for predicting voltage collapse in a power system were presented in this paper. The effectiveness of all the approaches presented are tested on the WSCC 9-bus, IEEE 30 bus and IEEE 57 bus power systems. Power flow solution was performed to arrive at a solution in all the cases considered. Comparison of the proposed methods is done with exiting power-flow-based voltage collapse proximity index (VCPI) and the conventional modal analysis techniques. Results of the simulation obtained show that the suggested PVBI could be of tremendous benefit when compared to the conventional VCPI in the analysis of voltage stability. This is because detailed information that may be required by the power system operators can be easily obtained using the technique. Also, the suggested improved modal analysis could serve as an alternative tool to the conventional method for voltage stability assessment in a power system.
Acknowledgments
The authors acknowledge the contributions and financial support received from the University of Johannesburg and Electrical and Electronic Engineering Science Department, Johannesburg, South Africa.
Author Contributions
Isaiah Adebayo and Yanxia Sun were in agreement as per the development and formulations of all the algorithms involved in the paper. Isaiah Adebayo performed and carried out the result simulation processes. Isaiah Adebayo wrote the paper. Yanxia Sun coordinated and thoroughly revised the paper.
Conflicts of Interest
The authors declare no conflict of interest.
References
- Kundur, P.; Paserba, J.; Ajjarapu, V.; Andersson, G.; Bose, A.; Canizares, C.; Hatziargyriou, N.; Hill, D.; Stankovic, A.; Taylor, C.; et al. Definition and classification of power system stability IEEE/CIGRE joint task force on stability terms and definitions. IEEE Trans. Power Syst. 2014, 19, 1387–1401. [Google Scholar]
- Thukaram, D.; Vyjayanthi, C. Evaluation of suitable locations for generation expansion in restructured power systems: A novel concept of T-index. Int. J. Emerg. Electr. Power Syst. 2009, 10. [Google Scholar] [CrossRef]
- Hong, Y.Y.; Gau, C.H. Voltage stability indicator for identification of the weakest bus/area in power systems. IEE Proc. Gener. Transm. Distrib. 1994, 141, 305–309. [Google Scholar] [CrossRef]
- Su, H.Y. An Efficient Approach for Fast and Accurate Voltage Stability Margin Computation in Large Power Grids. Appl. Sci. 2016, 6, 335. [Google Scholar] [CrossRef]
- Ellithy, K.; Shaheen, M.; Al-Athba, M. Voltage Stability Evaluation of Real Power Transmission System Using Singular Value Decomposition Technique. In Proceedings of the 2nd IEEE International Conference on Power and Energy (PECon 08), Johor Baharu, Malaysia, 1–3 December 2008. [Google Scholar]
- Su, H.Y.; Liu, C.W. Estimating the Voltage Stability Margin Using PMU Measurements. IEEE Trans. Power Syst. 2016, 31, 3221–3229. [Google Scholar] [CrossRef]
- Ngo, V.D.; Le, D.D.; Le, K.H.; Pham, V.K.; Berizzi, A. A Methodology for Determining Permissible Operating Region of Power Systems According to Conditions of Static Stability Limit. Energies 2017, 10, 1163. [Google Scholar] [CrossRef]
- Kessel, P.; Glavitsch, H. Estimating the Voltage Stability of a Power System. IEEE Trans. Power Deliv. 1986, 1, 346–354. [Google Scholar] [CrossRef]
- Claudia, R. A Comparison of Voltage Stability Indices. In Proceedings of the IEEE MELECON 2006, Malaga, Spain, 16–19 May 2006. [Google Scholar]
- Moghawemi, M.; Omar, F.M. A Line Outage Study for Prediction of Static Voltage Collapse. IEEE Power Eng. Rev. 1998, 18, 52–54. [Google Scholar] [CrossRef]
- Taylor, C.W. Power System Voltage Stability; McGraw-Hill Companies: New York, NY, USA, 1994. [Google Scholar]
- Ajjarapu, V.; Christy, C. The continuation power flow: A tool for steady state voltage stability analysis. IEEE Trans. Power Syst. 1992, 7, 416–423. [Google Scholar] [CrossRef]
- Tamura, Y.; Mori, H.; Iwamoto, S. Relationship between voltage instability and multiple load flow solutions in electric power systems. IEEE Trans. Power Appar. Syst. 1983, 5, 1115–1125. [Google Scholar] [CrossRef]
- Gao, B.; Morison, G.K.; Kundur, P. Voltage stability evaluation using modal analysis. IEEE Trans. Power Syst. 1922, 7, 1529–1542. [Google Scholar] [CrossRef]
- Acharjee, P. Identification of voltage collapse points and weak buses under security constraints using hybrid particle swarm optimization technique. Int. Trans. Electr. Energy Syst. 2013, 23, 230–248. [Google Scholar] [CrossRef]
- Moger, T.; Dhadbanjan, T. A novel index for identification of weak nodes for reactive compensation to improve voltage stability. IET Gener. Transm. Distrib. 2015, 9, 1826–1834. [Google Scholar] [CrossRef]
- Balamourougan, V.; Sidhu, T.S.; Sachdev, M.S. Technique for online prediction of voltage collapse. IEE Proc. Gener. Transm. Distrib. 2004, 151, 453–460. [Google Scholar] [CrossRef]
- Musirin, I.; Rahman, T.K. Estimating Maximum Loadability for Weak Bus Identification Using FVSI. IEEE Power Eng. Rev. 2002, 22, 50–52. [Google Scholar] [CrossRef]
- Andrade, A.C.; Barbosa, F.P.M. Voltage Collapse Preventive Control—A New method. In Proceedings of the 12th IEEE Mediterranean Electrotechnical Conference, MELECON 2004, Dubrovnik, Croatia, 12–15 May 2004. [Google Scholar]
- Saadat, H. Power Systems Analysis; McGraw-Hill: New York, NY, USA, 1999. [Google Scholar]
- Sharma, C.; Ganness, M.G. Determination of the applicability of using modal analysis for the prediction of voltage stability. In Proceedings of the 2008 IEEE/PES Transmission and Distribution Conference and Exposition, Chicago, IL, USA, 21–24 April 2008; pp. 1–7. [Google Scholar]
- Asija, D.; Choudekar, P.; Soni, K.M.; Sinha, S.K. Power Flow Study and Contingency status of WSCC 9 Bus Test System using MATLAB. In Proceedings of the 2015 International Conference on Recent Developments in Control, Automation and Power Engineering (RDCAPE), Noida, India, 12–13 March 2015; pp. 338–342. [Google Scholar]
- Kumar, V.; Gupta, M.; Sharma, N.K.; Banerjee, G.K. Comparative analysis of different Power delivery System using Voltage Stability Index. In Proceedings of the 2016 Second International Innovative Applications of Computational Intelligence on Power, Energy and Controls with their Impact on Humanity (CIPECH), Ghaziabad, India, 18–19 November 2016. [Google Scholar]
Figure 1.
Single line diagram of a two bus power system.
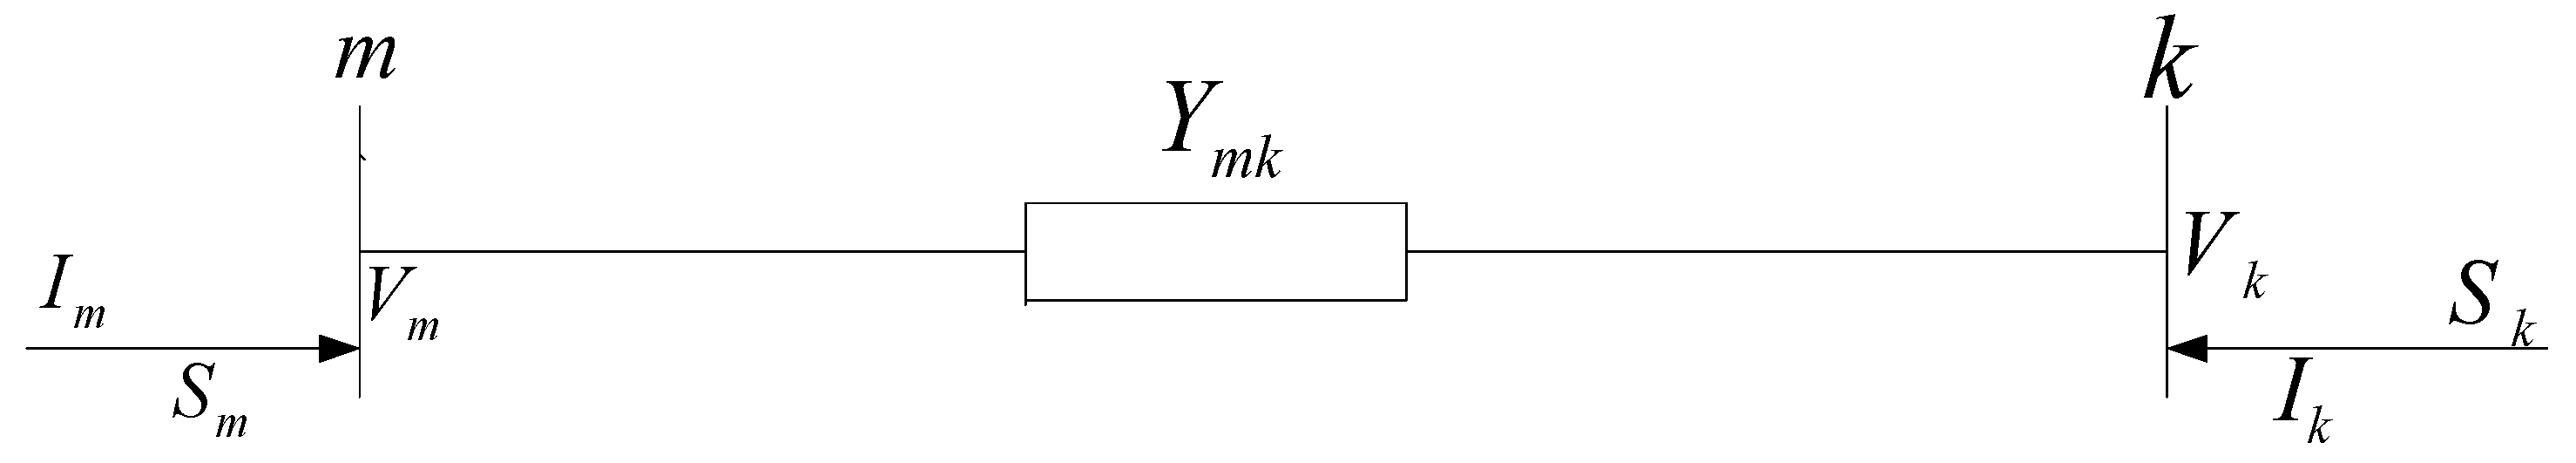
Figure 2.
Single line diagram of the IEEE 30 bus system.

Figure 3.
Voltage magnitudes of the western system coordinating council (WSCC) 9-bus power system.
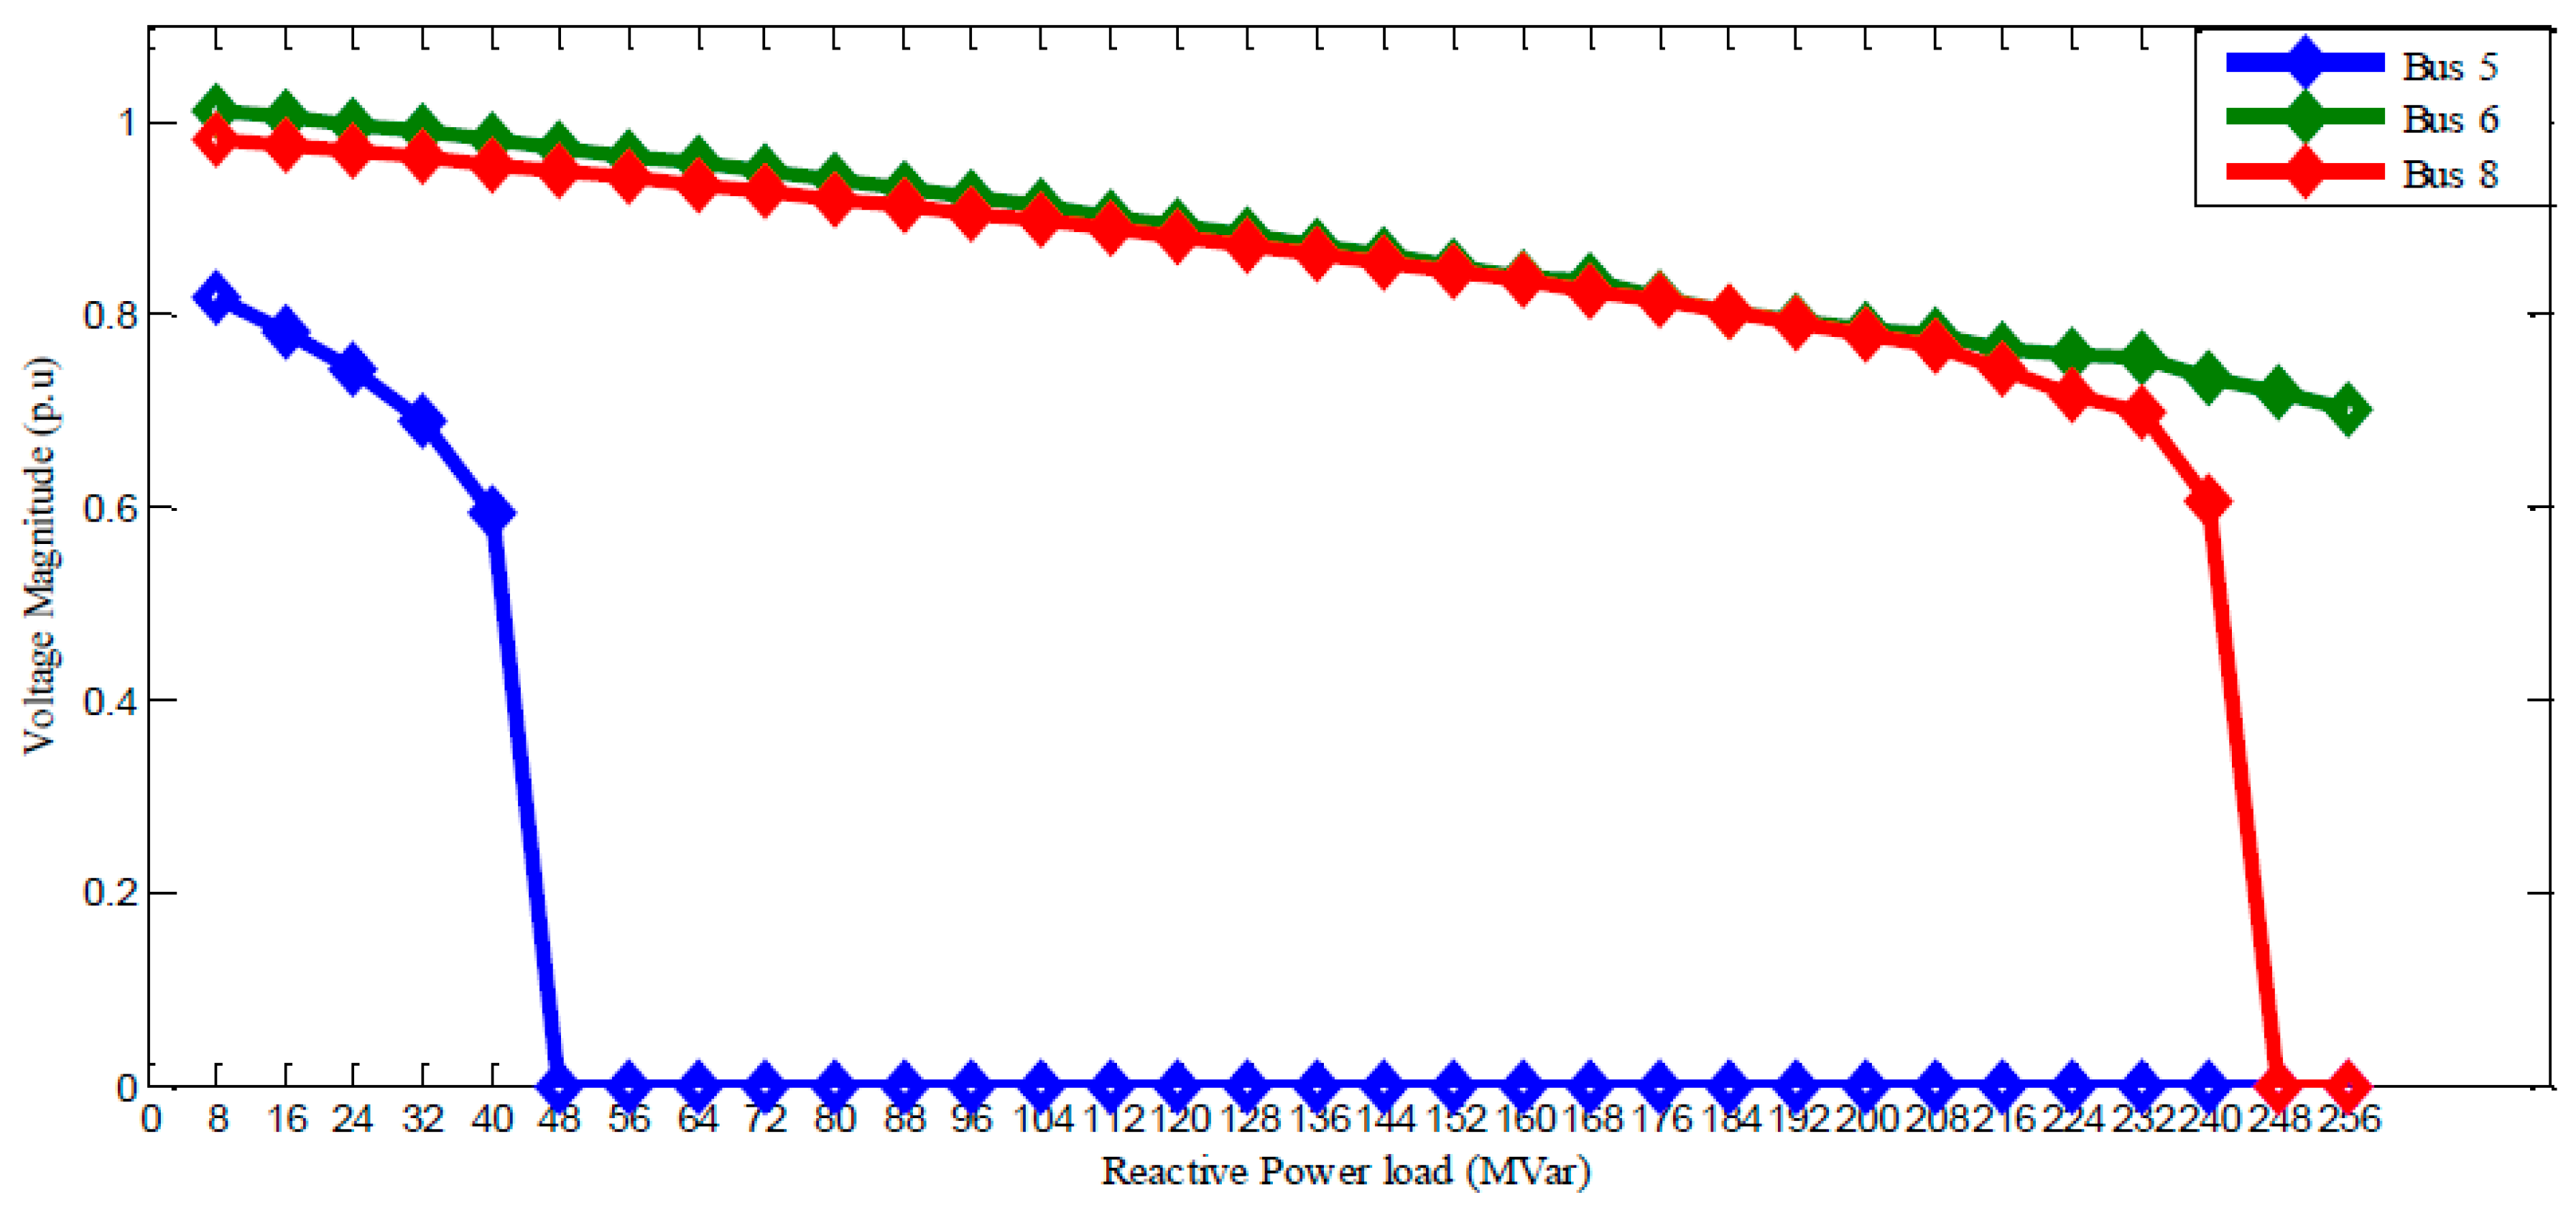
Figure 4.
Voltage magnitudes of the IEEE 30-bus power system.

Table 1.
Results of the traditional voltage collapse proximity index (VCPI) for the 9-bus system.
| Qmax (MVar) | Bus No | Traditional VCPI Method | Total Computation Time (s) | Ranking Order |
|---|---|---|---|---|
| 40 | 5 | 0.5235 | 3.396875 | 1st |
| 256 | 6 | 0.4752 | 23.886528 | 3rd |
| 240 | 8 | 0.5063 | 22.758630 | 2nd |
Table 2.
Results of the proposed performance voltage bus index (PVBI) for the 9-bus test system. PVDBI: performance voltage deviation index.
Table 2.
Results of the proposed performance voltage bus index (PVBI) for the 9-bus test system. PVDBI: performance voltage deviation index.
| Bus No | Qmax (MVar) | Number of Step Size | Proposed PVDBI | Proposed PVBI 10−4 | Total Computation Time (s) | Ranking Order |
|---|---|---|---|---|---|---|
| 5 | 40 | 5 | 0.4060 | 20.3000 | 2.569802 | 1st |
| 6 | 256 | 32 | 0.7933 | 0.9684 | 20.109783 | 3rd |
| 8 | 240 | 30 | 0.8286 | 1.1508 | 18.094562 | 2nd |
Table 3.
Results of the conventional modal analysis technique (CMAT) of the WSCC 9-bus test system.
| Load Bus | Eigenvalues | Mode | CMAT | Rank | Computational Time (s) |
|---|---|---|---|---|---|
| 4 | 38.3118 | 1 | 0.0002 | 6th | |
| 5 | 34.7552 | 2 | 0.8535 | 1st | |
| 6 | 29.8090 | 3 | 0.0016 | 5th | 0.559172 |
| 7 | 9.1099 | 4 | 0.0631 | 3rd | |
| 8 | 5.2841 | 5 | 0.0731 | 2nd | |
| 9 | 0.1919 | 6 | 0.0067 | 4th |
Table 4.
Results of the Proposed improved modal analysis technique (IMAT) of the WSCC 9-bus power system.
Table 4.
Results of the Proposed improved modal analysis technique (IMAT) of the WSCC 9-bus power system.
| Load Bus | Eigenvalues | Mode | Proposed IMAT | Rank | Computational Time (s) |
|---|---|---|---|---|---|
| 4 | 37.7712 | 1 | 0.0004 | 6th | |
| 5 | 34.3277 | 2 | 0.8558 | 1st | |
| 6 | 29.7026 | 3 | 0.0024 | 5th | 0.490854 |
| 7 | 9.0171 | 4 | 0.0533 | 3rd | |
| 8 | 5.3754 | 5 | 0.0806 | 2nd | |
| 9 | 1.4946 | 6 | 0.0067 | 4th |
Table 5.
Results of the VCPI for the IEEE 30-bus power system.
| Qmax (MVar) | Bus No | Traditional VCPI Method | Total Computation Time (s) | Ranking Order |
|---|---|---|---|---|
| 102 | 23 | 0.2470 | 21.549021 | 4th |
| 108 | 24 | 0.0826 | 24.209167 | 5th |
| 25 | 27 | 0.4030 | 15.709843 | 1st |
| 35 | 29 | 0.2779 | 19.089312 | 3rd |
| 31 | 30 | 0.3225 | 18.563290 | 2nd |
Table 6.
Results of the proposed PVBI of the IEEE 30-bus power system.
| Bus No | Qmax (MVar) | Number of Step Size | Proposed PVDBI | Proposed PVBI 10−4 | Total Computation Time (s) | Ranking Order |
|---|---|---|---|---|---|---|
| 23 | 102 | 55 | 1.253418 | 2.234257 | 20.870932 | 4th |
| 24 | 108 | 58 | 0.234238 | 0.373943 | 22.760321 | 5th |
| 27 | 25 | 14 | 0.751936 | 21.48388 | 13.039880 | 1st |
| 29 | 35 | 21 | 0.800705 | 10.893945 | 17.903762 | 3rd |
| 30 | 31 | 18 | 0.61050 | 10.940860 | 16.409832 | 2nd |
Table 7.
Results of the CMAT for the IEEE 30-bus power system.
| Load Bus | Eigenvalues | Mode | CMAT | Rank | Computational Time (s) |
|---|---|---|---|---|---|
| 7 | 109.7610 | 1 | 0.0003 | 23rd | |
| 8 | 98.2275 | 2 | 0.0004 | 22nd | |
| 9 | 65.8089 | 3 | 0.0005 | 21st | 0.923476 |
| 10 | 48.9036 | 4 | 0.0002 | 24th | |
| 11 | 37.9613 | 5 | 0.0026 | 20th | |
| 12 | 35.1885 | 6 | 0.0040 | 17th | |
| 13 | 33.3827 | 7 | 0.0107 | 10th | |
| 14 | 23.0648 | 8 | 0.0072 | 13th | |
| 15 | 22.9861 | 9 | 0.0041 | 16th | |
| 16 | 18.8202 | 10 | 0.0159 | 9th | |
| 17 | 17.0175 | 11 | 0.0172 | 8th | |
| 18 | 15.5751 | 12 | 0.0022 | 19th | |
| 19 | 13.6245 | 13 | 0.0050 | 15th | |
| 20 | 12.8474 | 14 | 0.0071 | 14th | |
| 21 | 11.2777 | 15 | 0.0034 | 18th | |
| 22 | 0.4921 | 16 | 0.0083 | 11th | |
| 23 | 1.1468 | 17 | 0.0193 | 7th | |
| 24 | 1.6633 | 18 | 0.0080 | 12th | |
| 25 | 2.8717 | 19 | 0.0376 | 6th | |
| 26 | 7.9392 | 20 | 0.1140 | 5th | |
| 27 | 4.0336 | 21 | 0.2045 | 2nd | |
| 28 | 6.9975 | 22 | 0.1099 | 4th | |
| 29 | 5.1742 | 23 | 0.1997 | 3rd | |
| 30 | 6.0380 | 24 | 0.2178 | 1st |
Table 8.
Results of the suggested IMAT for the IEEE 30-bus power system.
| Load Bus | Eigenvalues | Mode | Proposed IMAT | Rank | Computational Time (s) |
|---|---|---|---|---|---|
| 7 | 101.5484 | 1 | 0.0002 | 23rd | |
| 8 | 79.0143 | 2 | 0.0003 | 22nd | |
| 9 | 59.9206 | 3 | 0.0005 | 21st | 0.809821 |
| 10 | 44.7144 | 4 | 0.0001 | 24th | |
| 11 | 30.8457 | 5 | 0.0027 | 18th | |
| 12 | 29.7287 | 6 | 0.0030 | 17th | |
| 13 | 28.1175 | 7 | 0.0080 | 10th | |
| 14 | 21.2441 | 8 | 0.0061 | 14th | |
| 15 | 17.7133 | 9 | 0.0031 | 16th | |
| 16 | 16.8427 | 10 | 0.0125 | 9th | |
| 17 | 13.5606 | 11 | 0.0137 | 8th | |
| 18 | 13.1216 | 12 | 0.0016 | 20th | |
| 19 | 11.3142 | 13 | 0.0037 | 15th | |
| 20 | 10.2906 | 14 | 0.0062 | 13th | |
| 21 | 9.7484 | 15 | 0.0026 | 19th | |
| 22 | 0.4481 | 16 | 0.0072 | 11th | |
| 23 | 1.0261 | 17 | 0.0180 | 7th | |
| 24 | 1.2531 | 18 | 0.0068 | 12th | |
| 25 | 2.4551 | 19 | 0.0354 | 6th | |
| 26 | 3.3246 | 20 | 0.1133 | 4th | |
| 27 | 4.1938 | 21 | 0.2458 | 1st | |
| 28 | 4.7525 | 22 | 0.0971 | 5th | |
| 29 | 5.9044 | 23 | 0.1960 | 3rd | |
| 30 | 5.5165 | 24 | 0.2161 | 2nd |
Table 9.
Results of the VCPI for the IEEE 57-bus power system.
| Qmax (MVar) | Bus No | Traditional VCPI Method | Voltage Mag. (p.u.) | Total Computation Time (s) | Ranking Order |
|---|---|---|---|---|---|
| 180 | 12 | 0.3584 | 0.6734 | 83.525160 | 8th |
| 24 | 25 | 0.4826 | 0.5601 | 14.947784 | 5th |
| 114 | 27 | 0.4004 | 0.5794 | 68.497318 | 7th |
| 21 | 30 | 0.5002 | 0.5491 | 12.975753 | 4th |
| 17 | 31 | 0.7400 | 0.5069 | 7.010215 | 1st |
| 20 | 32 | 0.5021 | 0.5226 | 10.208482 | 3rd |
| 19 | 33 | 0.6327 | 0.5176 | 9.462271 | 2nd |
| 36 | 57 | 0.4203 | 0.5758 | 21.478248 | 6th |
Table 10.
Results of the proposed PVBI of the IEEE 57-bus power system.
| Bus No | Qmax (MVar) | Number of Step Size | Proposed PVDBI | Proposed PVBI 10−4 | Voltage Mag. (p.u.) | Total Computation Time (s) | Ranking Order |
|---|---|---|---|---|---|---|---|
| 12 | 180 | 60 | 1.9853 | 1.83824 | 0.6734 | 76.987023 | 8th |
| 25 | 24 | 11 | 0.6402 | 24.25000 | 0.5601 | 12.690832 | 5th |
| 27 | 114 | 41 | 1.7494 | 3.74283 | 0.5794 | 56.89705 | 7th |
| 30 | 21 | 10 | 0.8453 | 40.25238 | 0.5491 | 11.098412 | 4th |
| 31 | 17 | 6 | 0.5300 | 51.960784 | 0.5069 | 5.809732 | 1st |
| 32 | 20 | 9 | 0.8774 | 48.744444 | 0.5226 | 8.892109 | 3rd |
| 33 | 19 | 8 | 0.7607 | 50.046053 | 0.5176 | 7.091207 | 2nd |
Table 11.
Results of the CMAT for the IEEE 57-bus power system.
| Load Bus | Eigenvalues | Mode | CMAT | Rank | Computational Time (s) |
|---|---|---|---|---|---|
| 8 | 167.0587 | 1 | 0.00028 | 46th | |
| 9 | 117.2839 | 2 | 0.00012 | 49th | 1.709213 |
| 10 | 100.1632 | 3 | 0.00049 | 43rd | |
| 11 | 96.9489 | 4 | 0.00090 | 36th | |
| 12 | 83.4685 | 5 | 0.00089 | 37th | |
| 13 | 81.8242 | 6 | 0.00082 | 38th | |
| 14 | 63.5906 | 7 | 0.0010 | 35th | |
| 15 | 59.2406 | 8 | 0.00038 | 45th | |
| 16 | 57.7710 | 9 | 0.00026 | 47th | |
| 17 | 52.9183 | 10 | 0.000071 | 50th | |
| 18 | 51.8406 | 11 | 0.00018 | 48th | |
| 19 | 43.5320 | 12 | 0.0025 | 30th | |
| 20 | 43.1314 | 13 | 0.0048 | 24th | |
| 21 | 36.4075 | 14 | 0.0083 | 19th | |
| 22 | 35.8421 | 15 | 0.0084 | 18th | |
| 23 | 32.3515 | 16 | 0.0089 | 17th | |
| 24 | 32.4130 | 17 | 0.0173 | 11th | |
| 25 | 28.7774 | 18 | 0.0940 | 5th | |
| 26 | 25.5944 | 19 | 0.0144 | 14th | |
| 27 | 25.0823 | 20 | 0.0041 | 26th | |
| 28 | 21.7844 | 21 | 0.0017 | 33rd | |
| 29 | 17.7898 | 22 | 0.00073 | 41st | |
| 30 | 16.4373 | 23 | 0.1233 | 4th | |
| 31 | 15.4034 | 24 | 0.1687 | 1st | |
| 32 | 15.1964 | 25 | 0.1582 | 3rd | |
| 33 | 14.0792 | 26 | 0.1618 | 2nd | |
| 34 | 0.2184 | 27 | 0.0328 | 6th | |
| 35 | 0.5586 | 28 | 0.0255 | 7th | |
| 36 | 0.8936 | 29 | 0.0202 | 10th | |
| 37 | 1.0088 | 30 | 0.0165 | 13th | |
| 38 | 1.1925 | 31 | 0.0074 | 20th | |
| 39 | 1.5095 | 32 | 0.0167 | 12th | |
| 40 | 2.2811 | 33 | 0.0204 | 9th | |
| 41 | 2.5580 | 34 | 0.0063 | 21st | |
| 42 | 3.3895 | 35 | 0.0105 | 16th | |
| 43 | 3.7053 | 36 | 0.0020 | 32nd | |
| 44 | 4.1351 | 37 | 0.0054 | 22nd | |
| 45 | 4.5815 | 38 | 0.0021 | 31st | |
| 46 | 5.4765 | 39 | 0.0026 | 29th | |
| 47 | 5.8164 | 40 | 0.0046 | 25th | |
| 48 | 6.6397 | 41 | 0.0053 | 23rd | |
| 49 | 7.3517 | 42 | 0.0039 | 27th | |
| 50 | 7.8873 | 43 | 0.0031 | 28th | |
| 51 | 8.6792 | 44 | 0.0013 | 34th | |
| 52 | 9.1597 | 45 | 0.00081 | 39th | |
| 53 | 12.3263 | 46 | 0.0008 | 40th | |
| 54 | 11.5016 | 47 | 0.00060 | 42nd | |
| 55 | 10.7510 | 48 | 0.00039 | 44th | |
| 56 | 10.9852 | 49 | 0.0129 | 15th | |
| 57 | 10.9553 | 50 | 0.0254 | 8th |
Table 12.
Results of the suggested IMAT for the IEEE 57-bus power system
| Load Bus | Eigenvalues | Mode | Proposed IMAT | Rank | Computational Time (s) |
|---|---|---|---|---|---|
| 8 | 117.6642 | 1 | 0.00021 | 47th | |
| 9 | 90.2499 | 2 | 0.00085 | 35th | 1.035109 |
| 10 | 79.5325 | 3 | 0.00037 | 44th | |
| 11 | 76.8631 | 4 | 0.00073 | 37th | |
| 12 | 66.0945 | 5 | 0.00063 | 39th | |
| 13 | 60.5387 | 6 | 0.00066 | 38th | |
| 14 | 58.9733 | 7 | 0.00082 | 36th | |
| 15 | 50.1497 | 8 | 0.00031 | 45th | |
| 16 | 52.2588 | 9 | 0.00019 | 48th | |
| 17 | 42.3857 | 10 | 0.000053 | 50th | |
| 18 | 40.9070 | 11 | 0.00012 | 49th | |
| 19 | 39.8208 | 12 | 0.0029 | 28th | |
| 20 | 35.3923 | 13 | 0.0055 | 21st | |
| 21 | 28.2427 | 14 | 0.0083 | 18th | |
| 22 | 27.6232 | 15 | 0.0082 | 19th | |
| 23 | 23.6718 | 16 | 0.0088 | 17th | |
| 24 | 24.2669 | 17 | 0.0191 | 11th | |
| 25 | 22.1195 | 18 | 0.0814 | 5th | |
| 26 | 21.0441 | 19 | 0.0164 | 14th | |
| 27 | 18.7207 | 20 | 0.0042 | 25th | |
| 28 | 16.0007 | 21 | 0.0014 | 33rd | |
| 29 | 14.5588 | 22 | 0.0005 | 42nd | |
| 30 | 13.1264 | 23 | 0.1143 | 4th | |
| 31 | 12.5574 | 24 | 0.1669 | 1st | |
| 32 | 11.2184 | 25 | 0.1539 | 3rd | |
| 33 | 11.0863 | 26 | 0.1602 | 2nd | |
| 34 | 10.6553 | 27 | 0.0423 | 6th | |
| 35 | 9.8133 | 28 | 0.0320 | 7th | |
| 36 | 9.3805 | 29 | 0.0237 | 10th | |
| 37 | 0.1920 | 30 | 0.0184 | 13th | |
| 38 | 0.5041 | 31 | 0.0071 | 20th | |
| 39 | 0.7385 | 32 | 0.0187 | 12th | |
| 40 | 0.8344 | 33 | 0.0238 | 9th | |
| 41 | 1.1019 | 34 | 0.0051 | 22nd | |
| 42 | 1.2206 | 35 | 0.0109 | 16th | |
| 43 | 1.8570 | 36 | 0.0016 | 31st | |
| 44 | 2.0165 | 37 | 0.0050 | 23rd | |
| 45 | 7.6179 | 38 | 0.0015 | 32nd | |
| 46 | 8.1450 | 39 | 0.0020 | 30th | |
| 47 | 7.9238 | 40 | 0.0037 | 26th | |
| 48 | 2.6906 | 41 | 0.0046 | 24th | |
| 49 | 2.8162 | 42 | 0.0031 | 27th | |
| 50 | 3.3008 | 43 | 0.0023 | 29th | |
| 51 | 3.9684 | 44 | 0.00094 | 34th | |
| 52 | 4.3339 | 45 | 0.0006 | 41st | |
| 53 | 4.8112 | 46 | 0.00061 | 40th | |
| 54 | 6.3361 | 47 | 0.00046 | 43rd | |
| 55 | 6.1087 | 48 | 0.00028 | 46th | |
| 56 | 5.3311 | 49 | 0.0157 | 15th | |
| 57 | 5.4760 | 50 | 0.0291 | 8th |
© 2017 by the authors. Licensee MDPI, Basel, Switzerland. This article is an open access article distributed under the terms and conditions of the Creative Commons Attribution (CC BY) license (http://creativecommons.org/licenses/by/4.0/).
Share and Cite
MDPI and ACS Style
Adebayo, I.; Sun, Y. New Performance Indices for Voltage Stability Analysis in a Power System. Energies 2017, 10, 2042. https://doi.org/10.3390/en10122042
AMA Style
Adebayo I, Sun Y. New Performance Indices for Voltage Stability Analysis in a Power System. Energies. 2017; 10(12):2042. https://doi.org/10.3390/en10122042
Chicago/Turabian StyleAdebayo, Isaiah, and Yanxia Sun. 2017. "New Performance Indices for Voltage Stability Analysis in a Power System" Energies 10, no. 12: 2042. https://doi.org/10.3390/en10122042
Note that from the first issue of 2016, this journal uses article numbers instead of page numbers. See further details here.