1. Introduction
The European Union (EU) climate and energy policy has established targets for the year 2020 on efficiency, CO
2 reduction and the increase of renewable energy deployment [
1,
2,
3,
4]. The energy supply system represents a powerful element that can help achieving such environmental targets. Transmission and Distribution (T&D) infrastructure efficiency can and has to be increased in order to achieve the best system performance allowed by state-of-the-art technology. In addition, increasing T&D grids’ efficiency would also bring benefits at the production side, since it could allow operating generation plants at their best from an environmental point of view. In this context, attention to innovation and the improvement of all of the processes in energy conversion and transportation, as long as the energy usage is at the utility scale, has become a primary issue attracting the interest of those who want to invest in the improvement and modernization of the European electricity infrastructure.
Improving efficiency in the EU energy delivery system is a task that involves field specialists in all of the Member Countries. Many studies have been carried out by universities and research centers, electrical companies, international agencies for energy saving and international workgroups. As a main example, a general simulation tool, called PRIMES, has been proposed in the recent past to assess the impact of EU policies on the power sector [
5].
Of course, the EU policy targets open a wide set of possible fields of implementation of interventions and investments, even if the attention is focused on the electricity field. Among these, the one related to the improvement of the European T&D infrastructure is one of the most important and promising due to its extension and impact on all three goals of the EU 2020 targets.
By the way, there exists a few examples of applicative methodologies to assess the impact of improving actions on the EU T&D electricity system to help with meeting the EU 2020. A study pointed out the market implication of new line realization on the EU electricity market, but no reference is made to the EU 2020 targets [
6]. Nevertheless, the attention of the EU on this subject is strong; for this reason, the European Electricity Grid Initiative (EEGI), one of the European industrial initiatives under the Strategic Energy Technologies Plan (SET-PLAN), is issued to propose a nine-year European research, development and demonstration (RD&D) program to accelerate innovation and the development of electricity networks of the future in Europe. The program focuses on system and technology innovation and addresses the challenge of integrating new technologies under real-life working conditions [
7].
The SET-PLAN supports European energy and climate policies through technology innovation. It aims at coordinating efforts at the national and EU level through joint strategic planning and effective implementation mechanisms. European Industrial Initiatives are industry-driven strategic technology alliances to address key low-carbon energy technologies [
8].
One of the most important aspects of this European task force is the definition, validation, updating and usage of Key Performance Indicators (KPIs) in order to assess and evaluate the impact of different proposed projects on both environmental and technical issues. This aspects are discussed inside the Work Package 3 (WP3) named Monitor [
9].
Following the guidelines provided by the European Union, the aim of the present article is that of proposing a methodology to define and evaluate environmentally-oriented KPIs that will be directly related to the EU 2020 targets [
10]. From a literature point of view, there exists a gap to be filled, since no methodology or indicators have been proposed in order to provide support to the decisions that have to be made by the EU task forces regarding the action to be sponsored and supported. The aim of the present article is, therefore, that of providing the definition of suitable KPIs related to the EU 2020 targets and a flexible methodology to calculate the proposed KPIs in accordance with different improving actions to be performed on the T&D infrastructure. The methodology is derived in order to be applied to both transmission and distribution networks. For the sake of brevity, the paper will provide the results coming from simulations performed on transmission networks in order to achieve the following goals:
Verify that the KPIs’ definition is well posed, i.e., it is able to identify the key point one is focusing on and represents a useful tool to produce a ranking among different interventions on the grid;
Verify that the KPIs can be either calculated (by means of a simulation in an ex-ante evaluation of the effectiveness of the proposed idea) or measured and, as a consequence, propose an efficient methodology for the evaluation of the KPIs;
Provide a tool that could be helpful in optimizing a “smarting action” on the electric network; for example, if a project is mainly focused on the installation of a device or technology, the proposed methodology will help to find out the best configuration in terms of amount, position, number and mode of operation.
To achieve all of these objectives, after the definition of the proposed KPIs (
Section 2), a set of possible “sample” interventions on the grid will be discussed and detailed (
Section 3) with reference to the following three different action classes:
new power and/or ICT components, in terms of replacement and additional installations;
new network operation strategies;
new control strategies.
Section 4 will be dedicated to the full description of the proposed methodology, while
Section 5 will propose the results of the methodology application on a benchmark transmission network providing the ranking of the interventions described in
Section 3. Some conclusive remarks and policy implications are then proposed in
Section 6.
2. EU 2020-Oriented KPIs’ Definition
As far as smarting actions are concerned, KPIs can be defined and evaluated in order to assess several performance aspects of the electricity grid. The first benefit of KPIs can be associated with environmental and energy-saving aspects (EU 2020 targets [
11]), namely:
Each aspect raised in the previous list can be associated with a well-defined measurable quantity that will allow the calculations of the corresponding KPI. As far as the KPIs’ definition is concerned, it is possible to point out how two possible definitions are equally applicable: one is based on the incremental benefits obtained on the KPIs driving quantities with respect to their initial values, whereas the other normalizes the benefits to common base quantities related to actual network operation.
The EU 2020 targets aim at a 20% increasing of the network efficiency, a 20% amount of renewable generation with respect to the total energy demand and a 20% reduction of the GHG emissions. Considering these goals, the efficiency and the GHG KPIs will be defined on an incremental basis, as the percentage refers to an initial reference condition, while the renewable generation penetration KPI refers to a common base, which is the total energy demand of the system.
2.1. Power Saving
From an analytical point of view, this KPI will be defined as the difference between the power losses of an electric grid before (
Pjb) and after (
Pja) a generic smarting intervention divided by
Pjb, i.e.,:
2.2. Share of Renewable Energy Sources KPI
The second aspect related to the sustainability of the T&D network concerns the increasing of Renewable Energy Sources (RES) in the grid. The RES hosting capacity is the maximum amount of power coming from renewable sources that the grid is capable of managing according to service quality and security criteria. According to the EU 2020 guidelines, this KPI is calculated considering the so called Share of RES (SoR), defined as follows:
being, respectively:
RESHCb(a) the RES hosting capacity before (after) the smarting intervention and
PL the network active power request.
2.3. CO2 Emission Reduction KPI
Another important aspect in the environmental performance of the electricity system lays in the emission of GHG from traditional polluting power plants, commonly of thermoelectric type. This KPI is mainly related to the electricity transmission system, as long as large thermoelectric production sites are typically connected to High Voltage (HV) transmission grids, but the progressive diffusion of distributed energy resources, such as small production sites or microgrids, may require the application of this indicator also to distribution networks.
This KPI can then be written as:
where
CO2a(b) is the GHG hourly emission after (before) the intervention. To quantify the
CO2i emission of the
i-th thermoelectric power plant (
CO2i), it is necessary to know the actual electricity power production,
Pci.
CO2i can be written as:
being
and
the coefficient of emission and oxidation of the fuel and
ηeli and
ηti, respectively, the electric and thermodynamic efficiencies of the process (it is worth noticing that the efficiency of the thermodynamic process is not constant, but depends on the electricity production of the plant
Pci; here, this relation has been obtained by interpolation on tabled data [
12]).
Typical values for the emission and the oxidation coefficients for methane (CH
4), coal and oil are reported in Equation (5); as can be seen, the emission coefficients has a stronger dependency on the adopted fuels rather than the oxidation ones [
13].
the typical rated value of
ηel and
ηt, are reported in Equation (6) (for the thermodynamic efficiency combined cyle, CC, Turbogas Generators, TG, and steam one have been considered:
3. Smarting Interventions on the Electricity Grid
Generation, transmission, distribution and utilization are the basic subsystems of the electric power infrastructure, presently under different multiple controls and management. System operators are in charge of coping with the technical challenges proposed by the electricity market and for managing emergency conditions. In this context, manufactures play an important role, since they design and produce power components, control systems and protection devices.
Formerly, electricity power grids could be made up of a limited variety of components; however, recent advances in technology have been extending the flexibility of applications. Today, utilities can take advantage of the so-called T&D state-of-the-art technologies, which represent alternative solutions to the consolidated architecture of the electricity grids [
14].
Examples of possible smarting actions that are considered in this study are grouped and explicitly presented hereafter:
the application of Flexible AC Transmission System (FACTS) devices;
the increasing of network rated voltage;
the control of reactive power from renewable generation.
The three considered interventions are related to three main categorizes of action, namely the installation of state-of-the-art devices, the optimization of the actual operation of the system and the implementation of new control and management strategies for production units.
This list of actions, in combination with the previously-proposed KPIs, generate a KPI-intervention matrix that summarizes the area of investigation of the present study and allows evaluating the different impact of each action on every single KPI.
4. Methodology Description
The proposed methodology is based on the application of the classical Optimal Power Flow (OPF) algorithm [
15] to obtain the greatest benefit of the intervention in order to achieve the maximum impact on the considered KPI. The OPF problem is constrained by a set of equality equations describing the physical electric power flow laws and limits on electricity variables. Nevertheless, in the presence of an intervention that drastically changes the topology of the network (e.g., the application of FACTS devices), the classical load flow equations need to be revisited, as will be detailed in the following subsections.
4.1. Modelling of FACTS Devices
FACTS devices allow introducing degrees of freedom to the system that can in principle be used to match the environmental and quality targets defined in the previous sections. FACTS devices are, at present, applied to increase the reliability of electric grids and reduce power delivery costs; they improve power transmission quality and efficiency mainly by supplying reactive power to the grid [
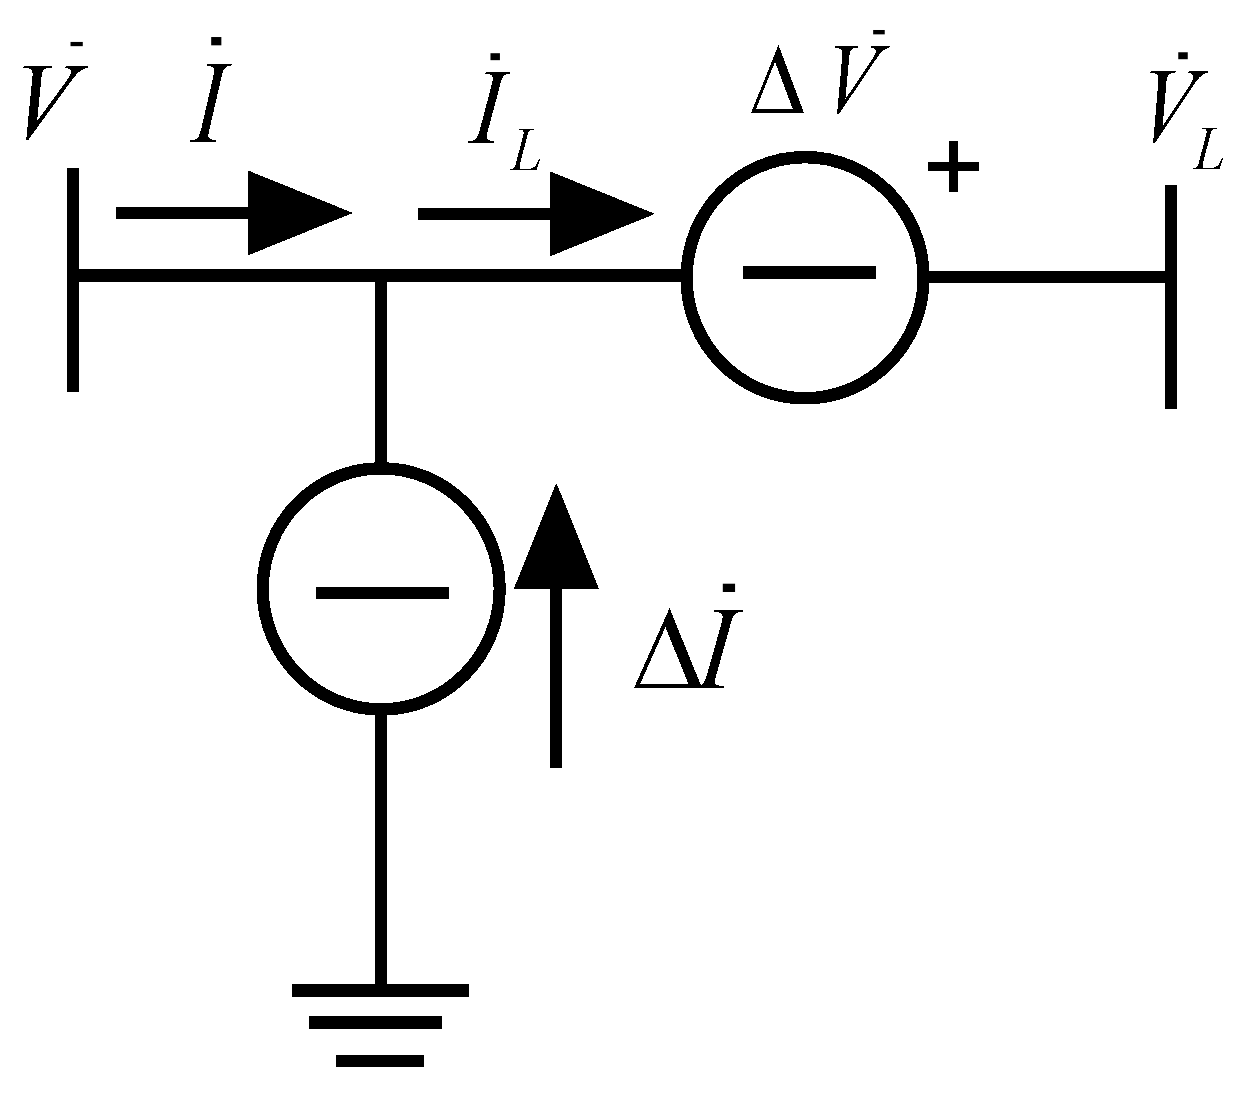
16]. Nevertheless, nowadays, it is necessary to enlarge the view of FACTS devices and to study the effectiveness of their application to pursue environmental targets that are becoming more and more important. FACTS devices are commonly classified into shunt and series compensation, but it is also possible to combine the effects of these two configurations into a single unit. As proposed in [
16,
17], from a static point of view, it is possible to model the effect of the compensators as single/combined voltage or current sources (depending on whether one is considering a series, shunt or combined device) as depicted in
Figure 1.
Series, shunt and combined devices could account either for active configurations, that is with the supply of active power, as well, or for reactive ones only delivering reactive power. In terms of Degrees of Freedom (DoF), one can state that [
17]:
reactive series and reactive shunt can provide 1 DoF;
active series and active shunt can provide 2 DoF;
combined reactive can provide 3 DoF;
combined active can provide 4 DoF.
In this representation, the quantities and are the effects of the compensation; () is the voltage (current) at the sending node; and () is the voltage (current) at the receiving one.
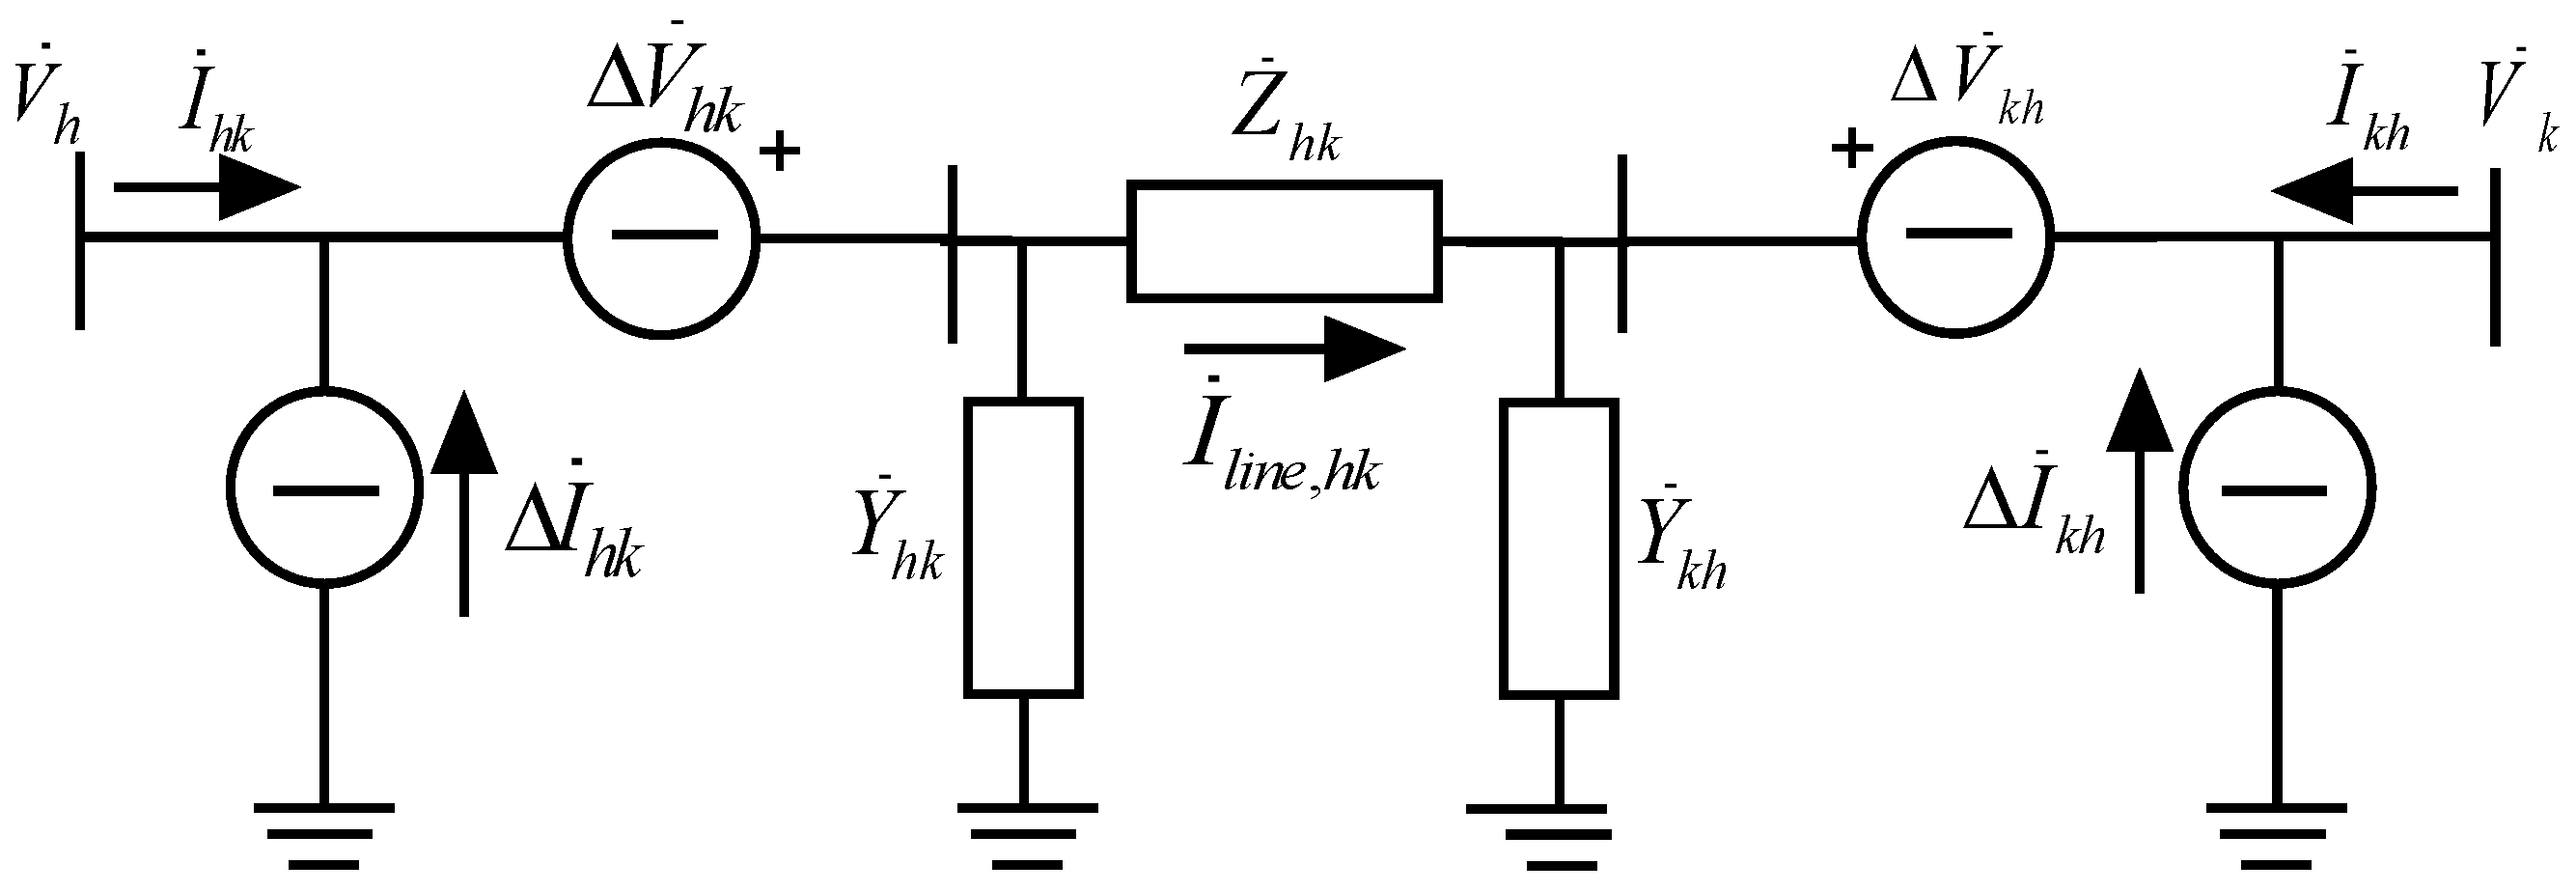
The proposed modelling takes into account the possibility of implementing FACTS devices at each end of every line of the system, as shown in
Figure 2, which represents the general model of a branch with the FACTS compensator at its terminals.
On the basis of the configuration proposed above, it is now possible to draw a general formulation for the problem of investigating the FACTS impact on the KPIs defined in the previous sections.
From a mathematical point of view, the problem can be formulated as follows: find out the values of
and
to be inserted at each termination of each branch of the network, which maximize an objective function constrained by the load-flow equations, that is to say:
where
f is a real function of the node voltages
and of the shunt and series compensations
and
selected in dependence of the KPI under investigation (in principle, the function
f could be the KPI itself). The constraints of the problem are represented by the load-flow equations [
18]:
where the expression of the current
as a function of the variables of the problem is the following:
Inserting Equation (9) into Equation (8), one obtains the explicit formulation of the load flow constraints. The insertion of the FACTS devices adds (complex) degrees of freedom, thus enabling us to set up an optimization problem, which would be meaningless without those devices, as the conventional load-flow has usually only one feasible solution.
In addition to these constraints, the formulation takes into account:
the static current limit on every line;
the upper and lower limits for the node voltages;
the limits on the maximum amplitude of the current and voltage compensations (related to the FACTS sizing);
the limits on the real power produced by those devices, that is to say:
4.2. Variation of the Transmission Voltage Level
The voltage levels of distribution and transmission network have a strong and significant effect on the means of operation of the electricity system itself. The increasing of the voltage level in electricity systems is usually associated with positive effects, as it could reduce the losses and the circulating currents improving, at the same time, the voltage profile of the network busses. To assess the impact of such intervention on the different issues previously presented, an optimization multivariable approach is not necessary, as, by definition, there is only one degree of freedom (i.e., the voltage level); as a consequence, a set of different load flow problems will be solved changing the voltage base value. With reference to the transmission system, the voltage will be considered variable between 400 kV and 800 kV [
19].
4.3. Reactive Power Regulation of Renewable Generation
The recent growth in the number and power of renewable generation units asks for a significant change in the means of operation of the electricity system related to the stochastic behavior of their power production. Up to now, renewable generation units have been operated in order to maximize the active power coming from RES without putting much consideration into their possible role as ancillary services suppliers. However, because of the distributed nature of these resources, they can become crucial in upgrading the quality benefit of the T&D networks, since the new frontier of the inverters’ control will allow one to fully exploit the potential of renewable generation by regulating also their reactive power injection [
20]. In the present study, the effect of controlling the reactive power of renewable generation units will be analyzed referring once again to the multivariable optimization problem (7)–(10), in which all of the compensations
and
are nullified, and the RES reactive powers (i.e., the imaginary parts of the left-hand side of (8)) are optimized in a certain range defined by the device rating. As a consequence, this intervention generates a number of degrees of freedom potentially equal to the number of renewable units present in the grid.
4.4. Methodology Limitation
The limitation of the proposed methodology is not related to the three typologies of intervention mentioned. Those represent three current aspects of investigation proposed from the various EU task forces. The proposed methodology can be extended to any intervention on the grid that can be associated with parametric variation of the network model in accordance with the extended representation of
Figure 2. The impact of such variation can be assessed and optimized accounting for a dedicated OPF problem of the kind of the one defined in Equation (7). The current development of the numerical algorithm for the resolution of OPF problems will allow extension to possible fields of application beyond linear or quadratic problems, since computational time is not a primary aspect as for the control applications. Topological variation of the network, such as the erection of a new line, cannot be managed by the proposed methodology, since this would change the structure of the OPF problem.
5. Simulation and Results
5.1. Test Case Network Definition
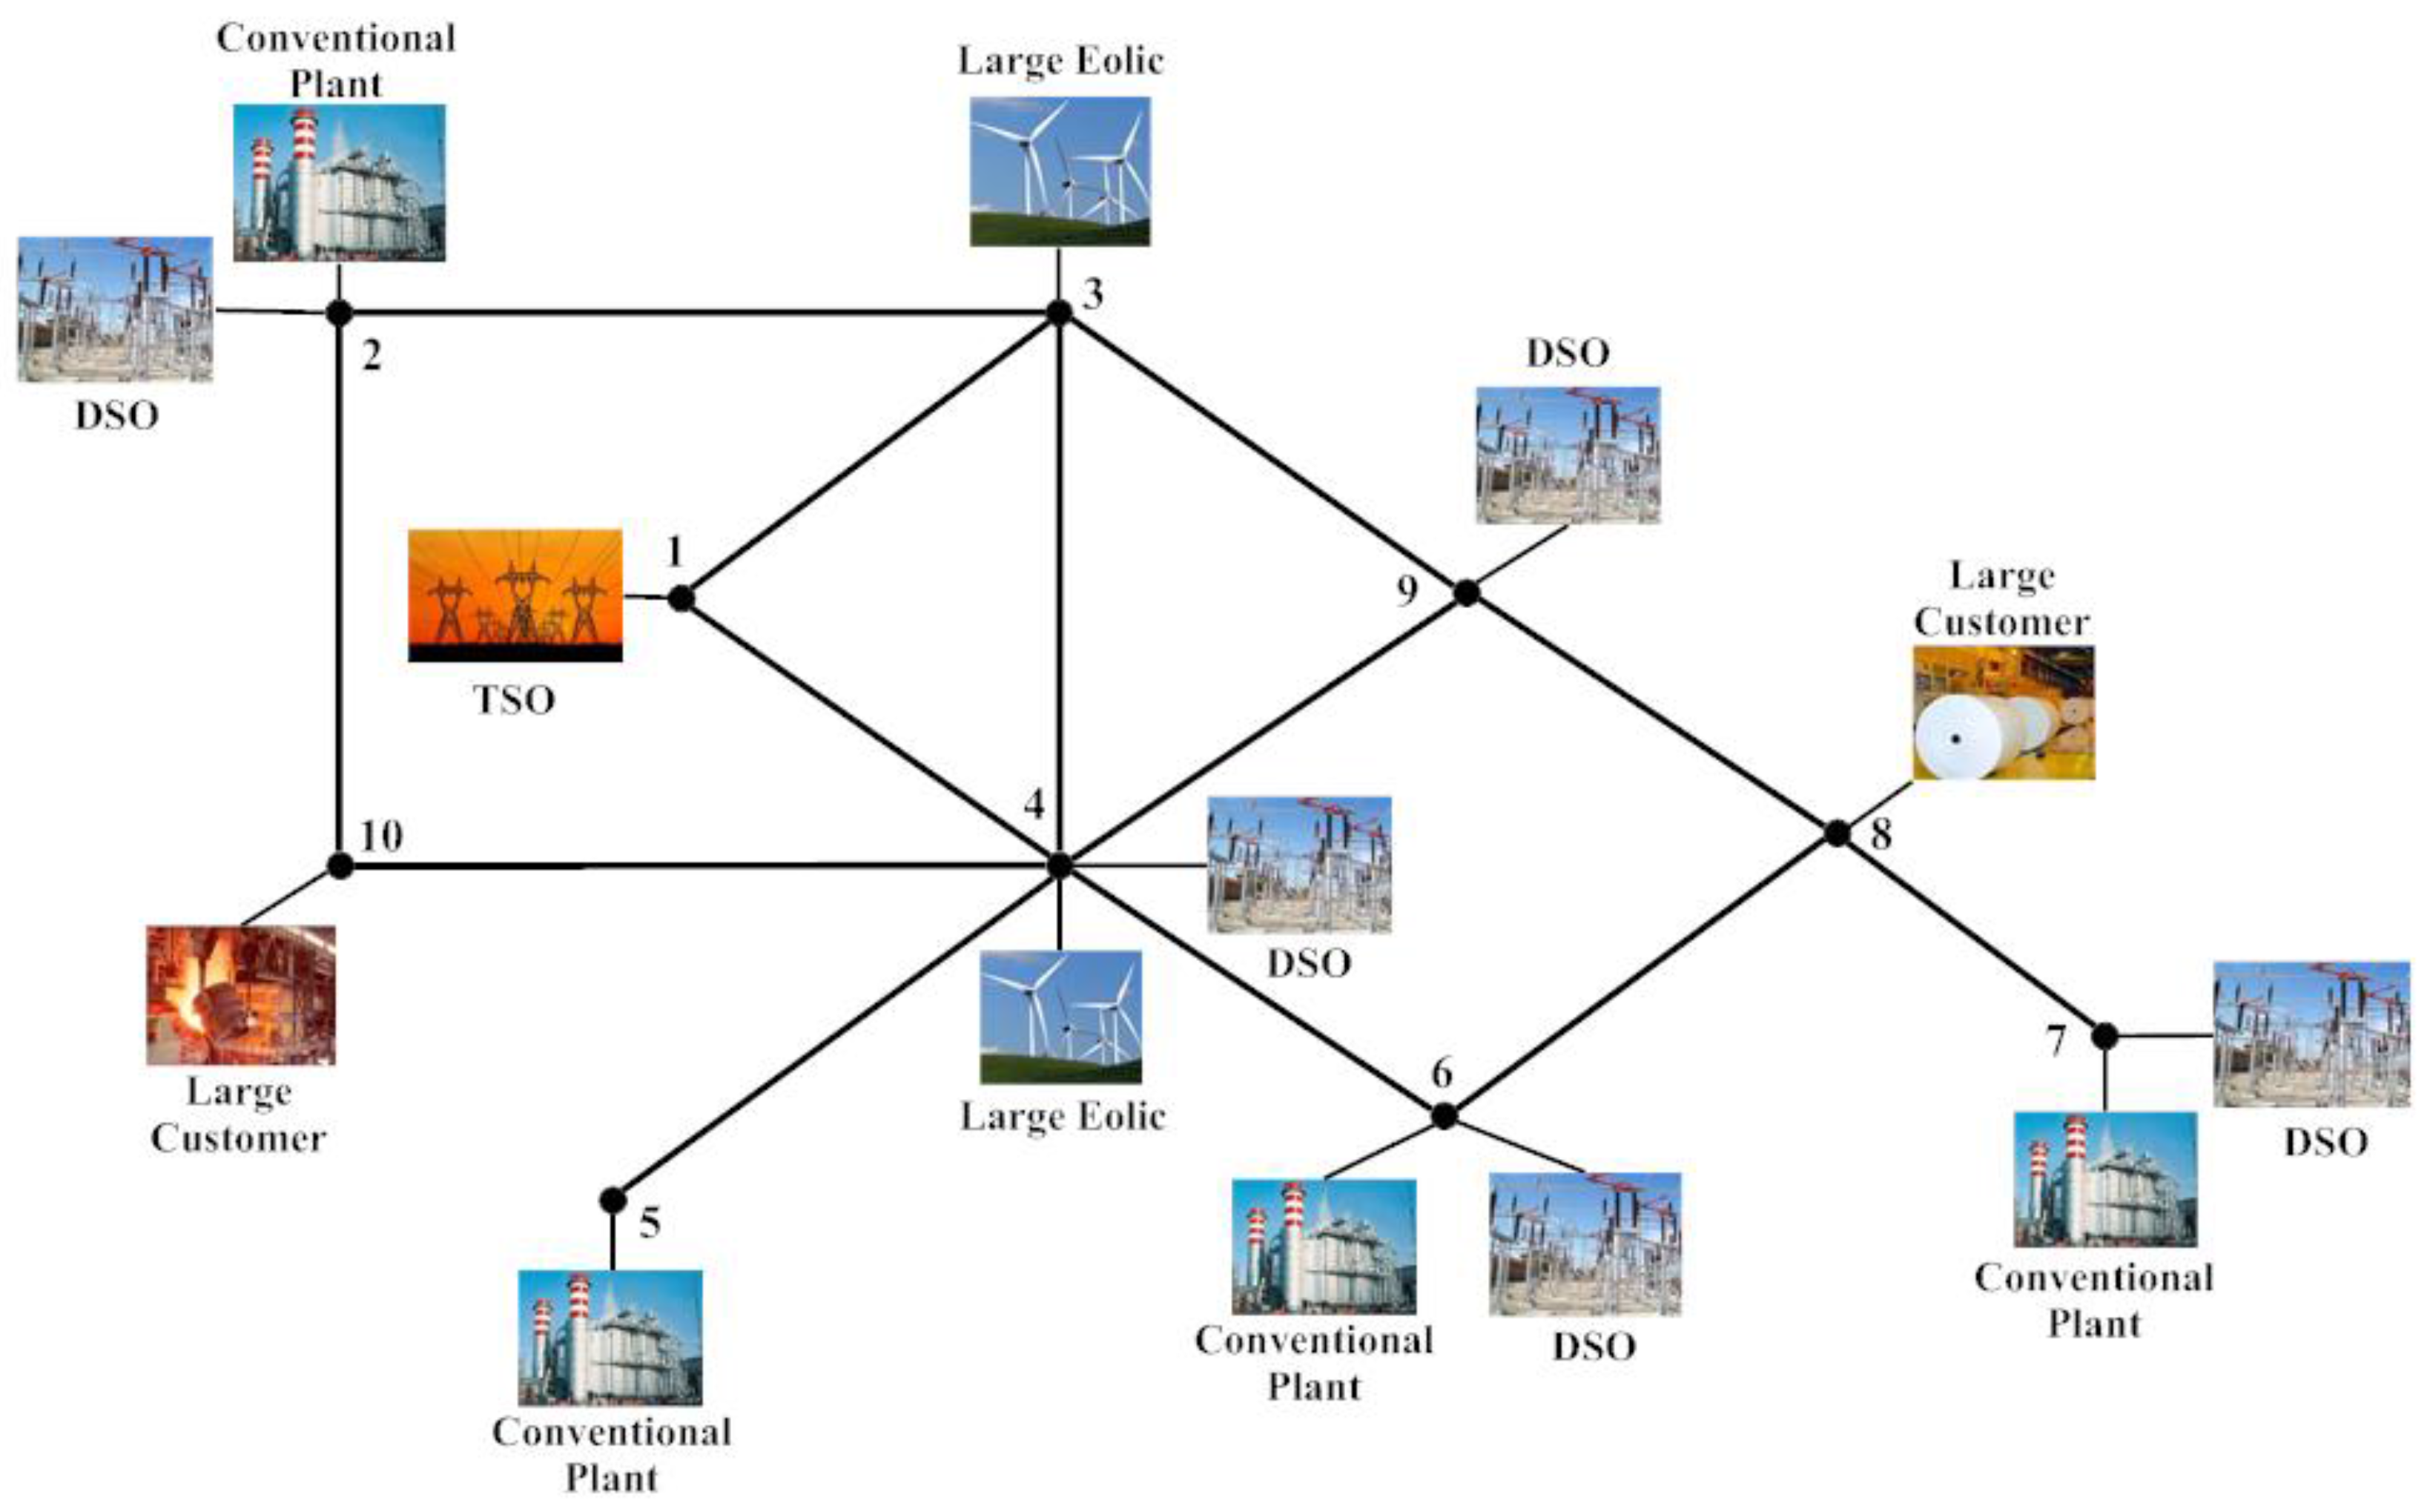
The proposed methodology has been tested on a transmission benchmark networks. The considered transmission network is a modified Cigré 10-bus benchmark network [
21] (from now on CGTN, Cigré Transmission Network), and its structure is shown in
Figure 3. For the sake of brevity, simulations on a distribution benchmark network are omitted here, since the results mainly recall those obtained on the transmission benchmark network. It is worth noticing that the methodology could be equally applied to a distribution network by simply changing the network topology and main parameters, but keeping the same formulation.
The network is operated at the rated voltage of 225 kV, and its main characteristics are reported in
Table 1, where
X and
R are respectively the reactance and the resistance of each line and
Imax is the maximum admissible current.
The grid players are: thermoelectric conventional plants, large customers connected directly to the transmission network, large wind farms, several Distribution System Operators (DSOs) and a neighbor Transmission System Operator (TSO). Their main data are reported in
Table 2, where
Pmin and
Pmax are respectively the limits of the active power capability, while
P and
Q are the injected active and reactive power in the reference operational scenario.
Table 3 and
Table 4 contain respectively the nodal voltage magnitude and the line actual loading percentage characterizing the working scenario described in
Table 2 (red lines are those equal or close to their maximum rating).
As can be seen, all of the voltages are within the normal range of operation, i.e., (0.95, 1.05) p.u., while two lines are very close to their loading limits.
5.2. Power Saving KPI Results
The function to be minimized in this section is represented by the system total Joule losses. They can be expressed as a function of the electric variables of the system, including those introduced by the intervention. The objective function for the power saving KPI can be written as:
where
n is the total number of grid busses and
Rhk and
Ihk are respectively the per unit resistance and current of the generic “h-k” network branch.
5.2.1. Application of FACTS Devices for Network Losses Reduction
The application of FACTS devices to the CGTN network has been performed with respect to both active and reactive ideal Unified Power Flow Controller (UPFC), combined FACTS with respectively four and three degrees of freedom. The investigation has explored the whole set of possible locations for the component, namely 26, in order to evaluate the effects on the power saving KPI in the best possible location. The values of ΔImax and ΔVmax appearing in (10) have been set to 20% of the network p.u. base values, i.e., 45 kV and 108 A, while Pcompmax is 4 MW (0 MW for the case of the reactive device).
Table 5 summarizes the results in terms of optimal location, losses and operating conditions of the compensator considering both its active and reactive versions.
It is worth noticing that in both cases, the best location is the same, with the FACTS device located at Bus 3 on the interconnection 3–2. The application of active compensation gives a much reduced improvement of the system efficiency in spite of the necessity of storing a relevant amount of power. In both cases, the absolute loss reduction is equal to almost 1 MW. From the obtained results, it is possible to calculate the power saving KPI in accordance with (1), obtaining a value of 4.6% for the active combined FACTS and 4.4% for the reactive combined one. The results obtained by the power saving KPI evaluation confirm the almost identical impact of the intervention on system efficiency, giving an indication of the possibility of applying a reactive combined compensation instead of an active one.
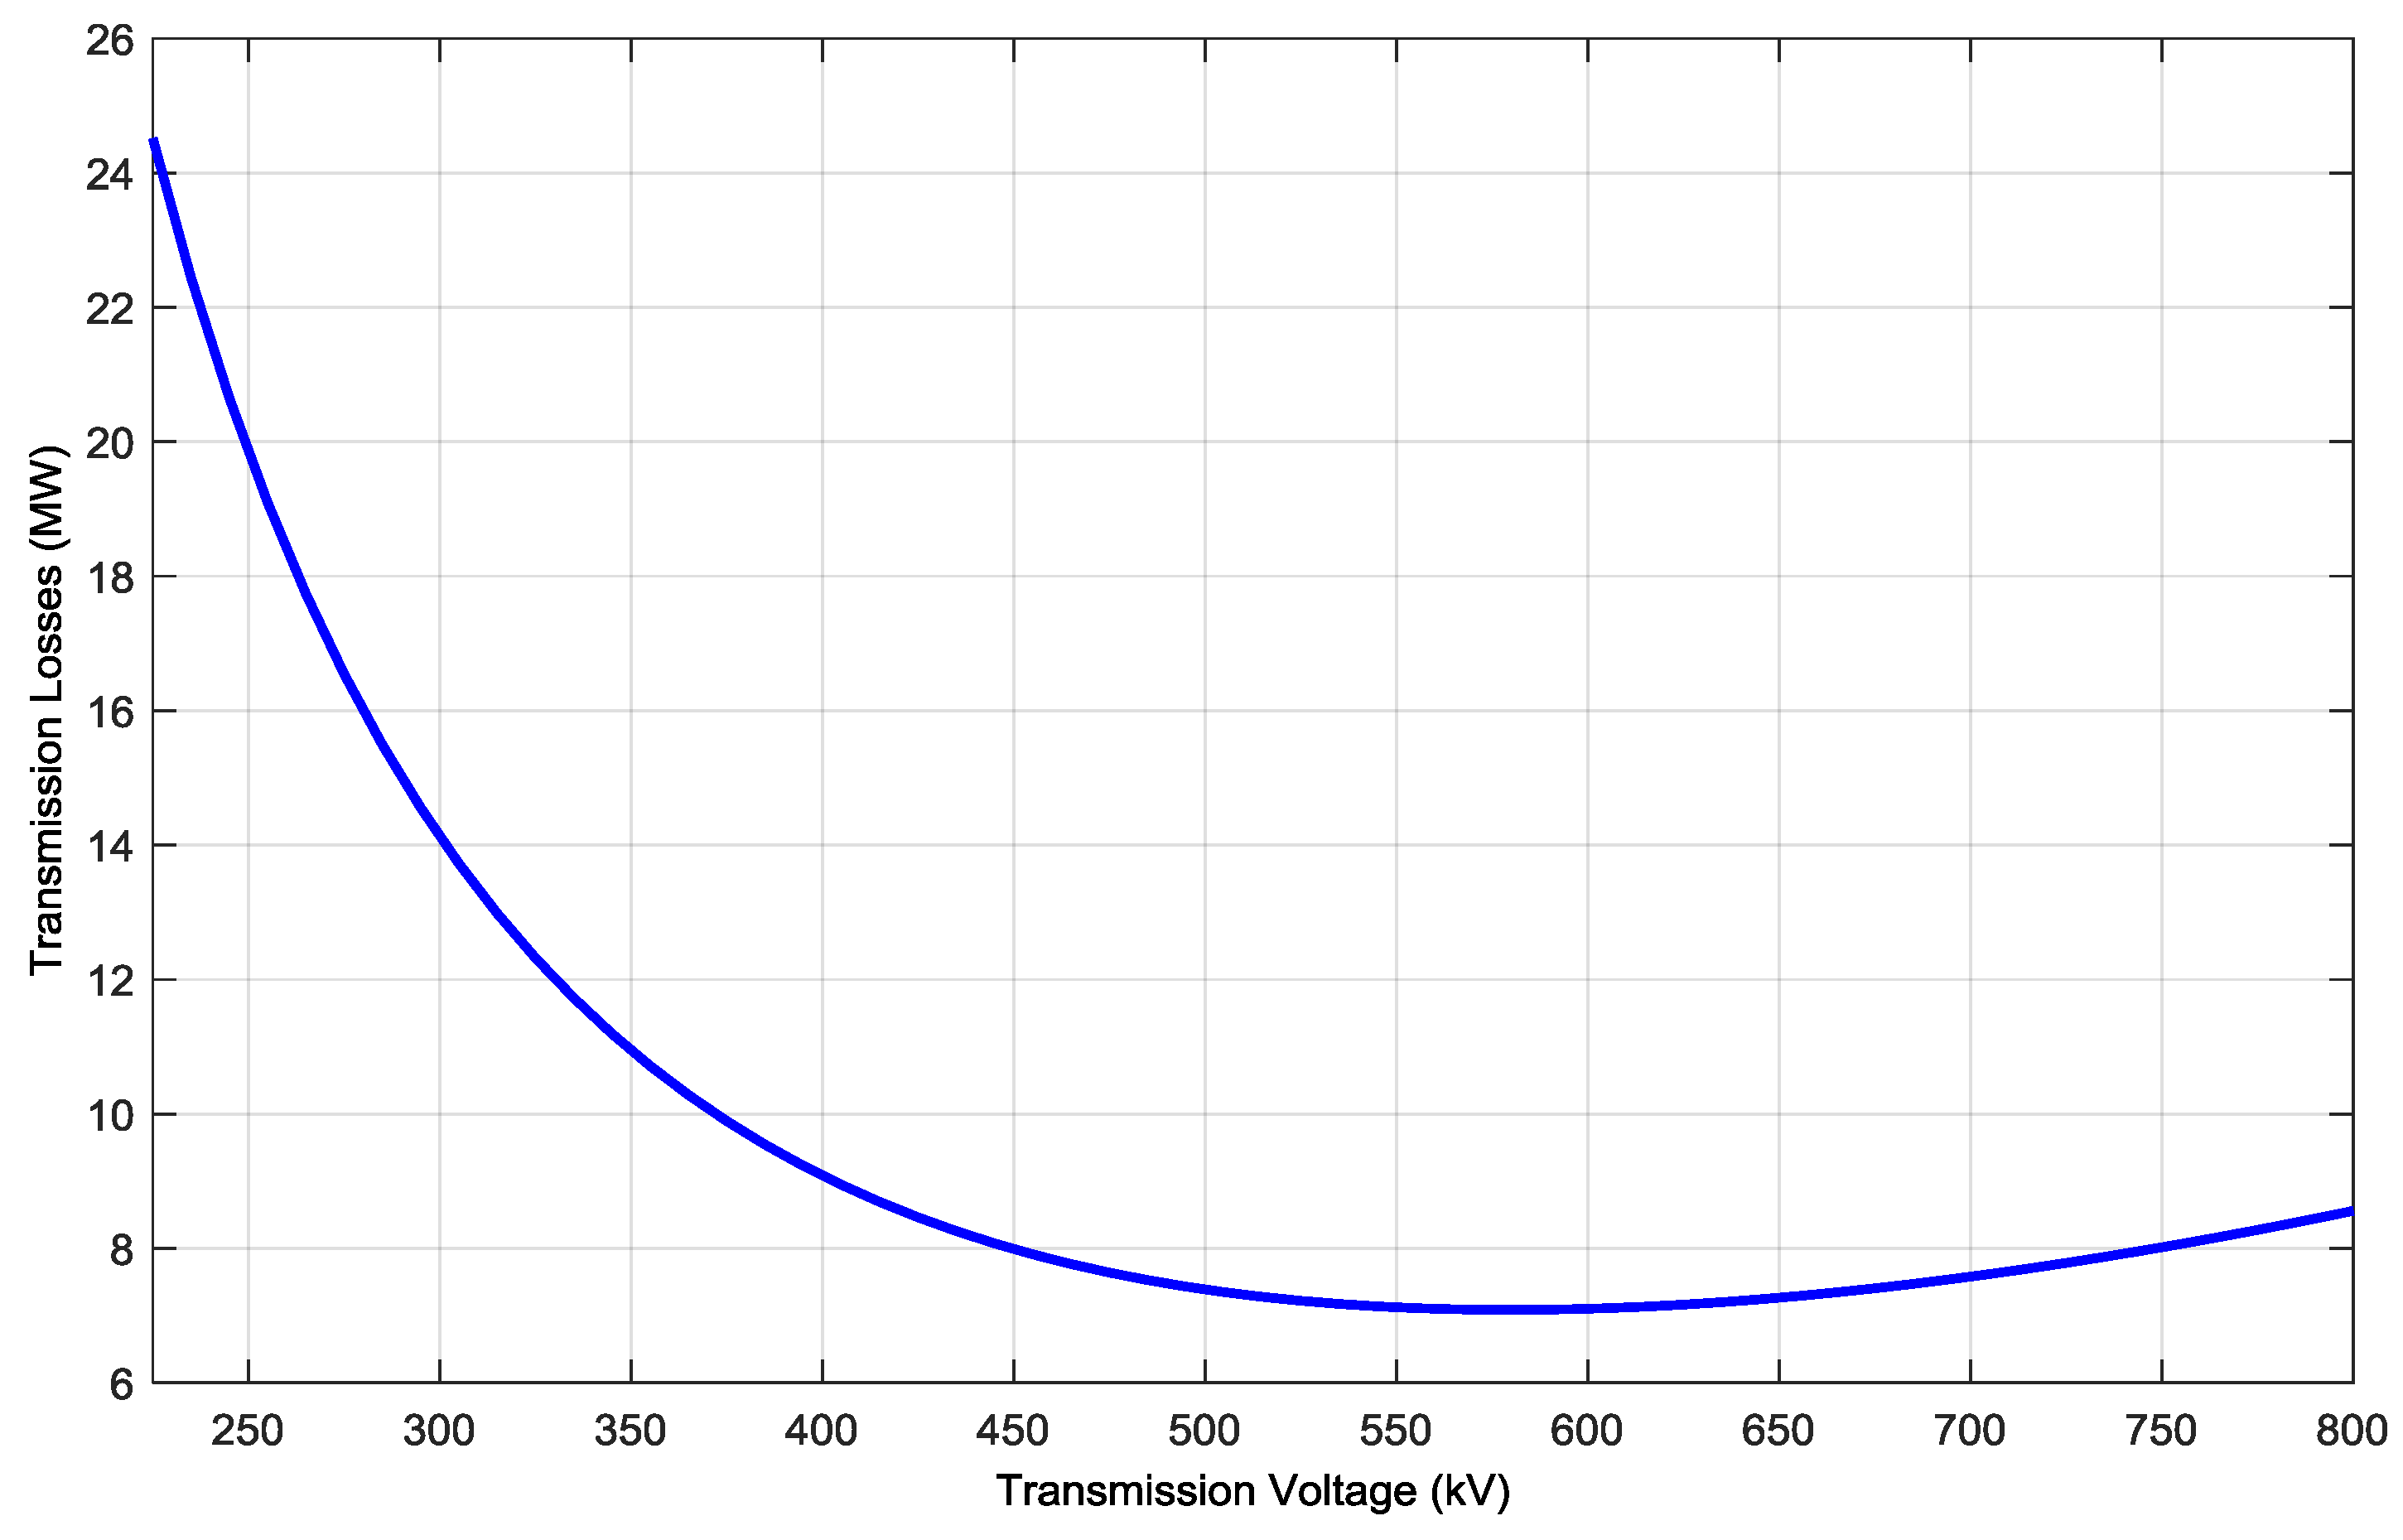
5.2.2. Increasing Transmission Rated Voltage for Network Loss Reduction
The analysis of the variation of the transmission voltage for the benchmark network of
Figure 3 has been performed considering the variation of the total losses of the system as a function of the transmission voltage. The starting point is, of course, 225 kV, which represents the rated transmission voltage of the benchmark network. Because of the relevant number of busses and branches, it is impossible to obtain an explicit analytical expression connecting the system losses to the transmission voltage. For this reason, the problem has been solved implementing a numerical algorithm, considering a voltage range between 225 kV and 800 kV, sufficiently wide in order to highlight relevant behaviors of the quantities under investigation.
Figure 4 depicts the variation of the total losses of the system in accordance with the adopted transmission voltage.
The minimum value of the system losses, equal to 7.08 MW, occurs at 575 kV. Nevertheless, examining the figure, it is apparent that the system losses are lower than 8 MW for a significantly wide range of rated voltages, from 450–750 kV. Increasing the transmission voltage over 800 kV will reduce the effectiveness of the intervention, and continuing to increase it could also lead the system to a situation even worse than the original one. The power saving KPI value for the intervention under investigation is calculated on a loss value of 8 MW in order to allow a flexible range of the new transmission voltage of approximately 300 kV, providing a value equal to 67.4%.
5.2.3. Reactive Power Control of Renewable Generation Units for Network Loss Reduction
The considered test case network is characterized by the presence of two renewable generation units located at Buses 3 and 4, i.e., two large wind power plants. The reference operation scenario is obtained imposing the present usual praxis for renewable generations [
20], that is: maximum active power deliverable from the power plant and no reactive power injection. The aim of the present study was that of analyzing the effect from the introduction of a novel operation criterion for the renewable generation allowing the generation/consumption of reactive power from the energy converter (more and more requested by several TSOs and DSOs). This action can be implemented in the optimization problem simply by relaxing the constraint of no reactive power exchange at the point of common coupling of each renewable generation unit. Such reactive power can be now chosen in a range determined by the inverter capability curve and the maximum allowable power factor (here set to 0.9 lagging or leading). With the aforementioned constraints, the optimization algorithm asks the wind generator at Bus 3 to produce 145 MVAR and the one at Bus 4 to inject 60 MVAR with an active power production of 300 MW and 124 MW, respectively. The results obtained from the regulation of the renewable reactive power generation are reported in
Table 6.
From the results obtained by the optimization analysis, it is possible to calculate the power saving KPI for this third intervention as equal to 2.6%.
5.3. Reduction of the CO2 Emissions KPI Results
In order to better emphasize the effects of the proposed actions on GHG emission reduction by conventional generation units, it is necessary to introduce some minor variations to the operation scenario of the CGTN test network. These modifications are introduced in order to avoid a distorting effect caused by several conventional units already producing at their minimal technical power. The quantities that change with respect to the original operational condition are reported in
Table 7.
Moreover, one has to specify the kind of plant associated with each of the four conventional units present in the network; in our case, we are supposing that:
A steam production unit supplied by oil is placed at Bus 2;
A coal-supplied steam generation unit injects power at Bus 5;
Bus 6 presents a gas turbine generator;
Bus 7 is equipped with a combined cycle production unit.
The objective function to be minimized in the present section is the sum of the traditional power plants’ CO
2 emissions, defined as:
Starting from the modified reference scenario described in
Table 7, the total CO
2 hourly emission is 1031 tCO
2/h. The maximum emission calculated in accordance with (12) is equal to 1915 tCO
2/h. These values are obtained with reference to the specific maximum production for the different conventional power plants detailed in the description of CGTN.
5.3.1. Application of FACTS Devices for CO2 Emission Reduction
Table 8 reports the results obtained for the CO
2 KPI thanks to the adoption of the combined active/reactive FACTS devices.
In both cases, the location that allows the highest reduction of the GHG emissions is at Bus 10 on Line 10–2. The results highlight that the two different typologies of FACTS devices produce approximately the same effect, with a reduction of the CO2 emission of almost 160 tCO2/h. Once again, the application of active FACTS devices introduces a very limited improvement with respect to the reactive ones. According to the obtained results, it is possible to assess the CO2 emission KPI within reason as 15.7% for both active and reactive compensation.
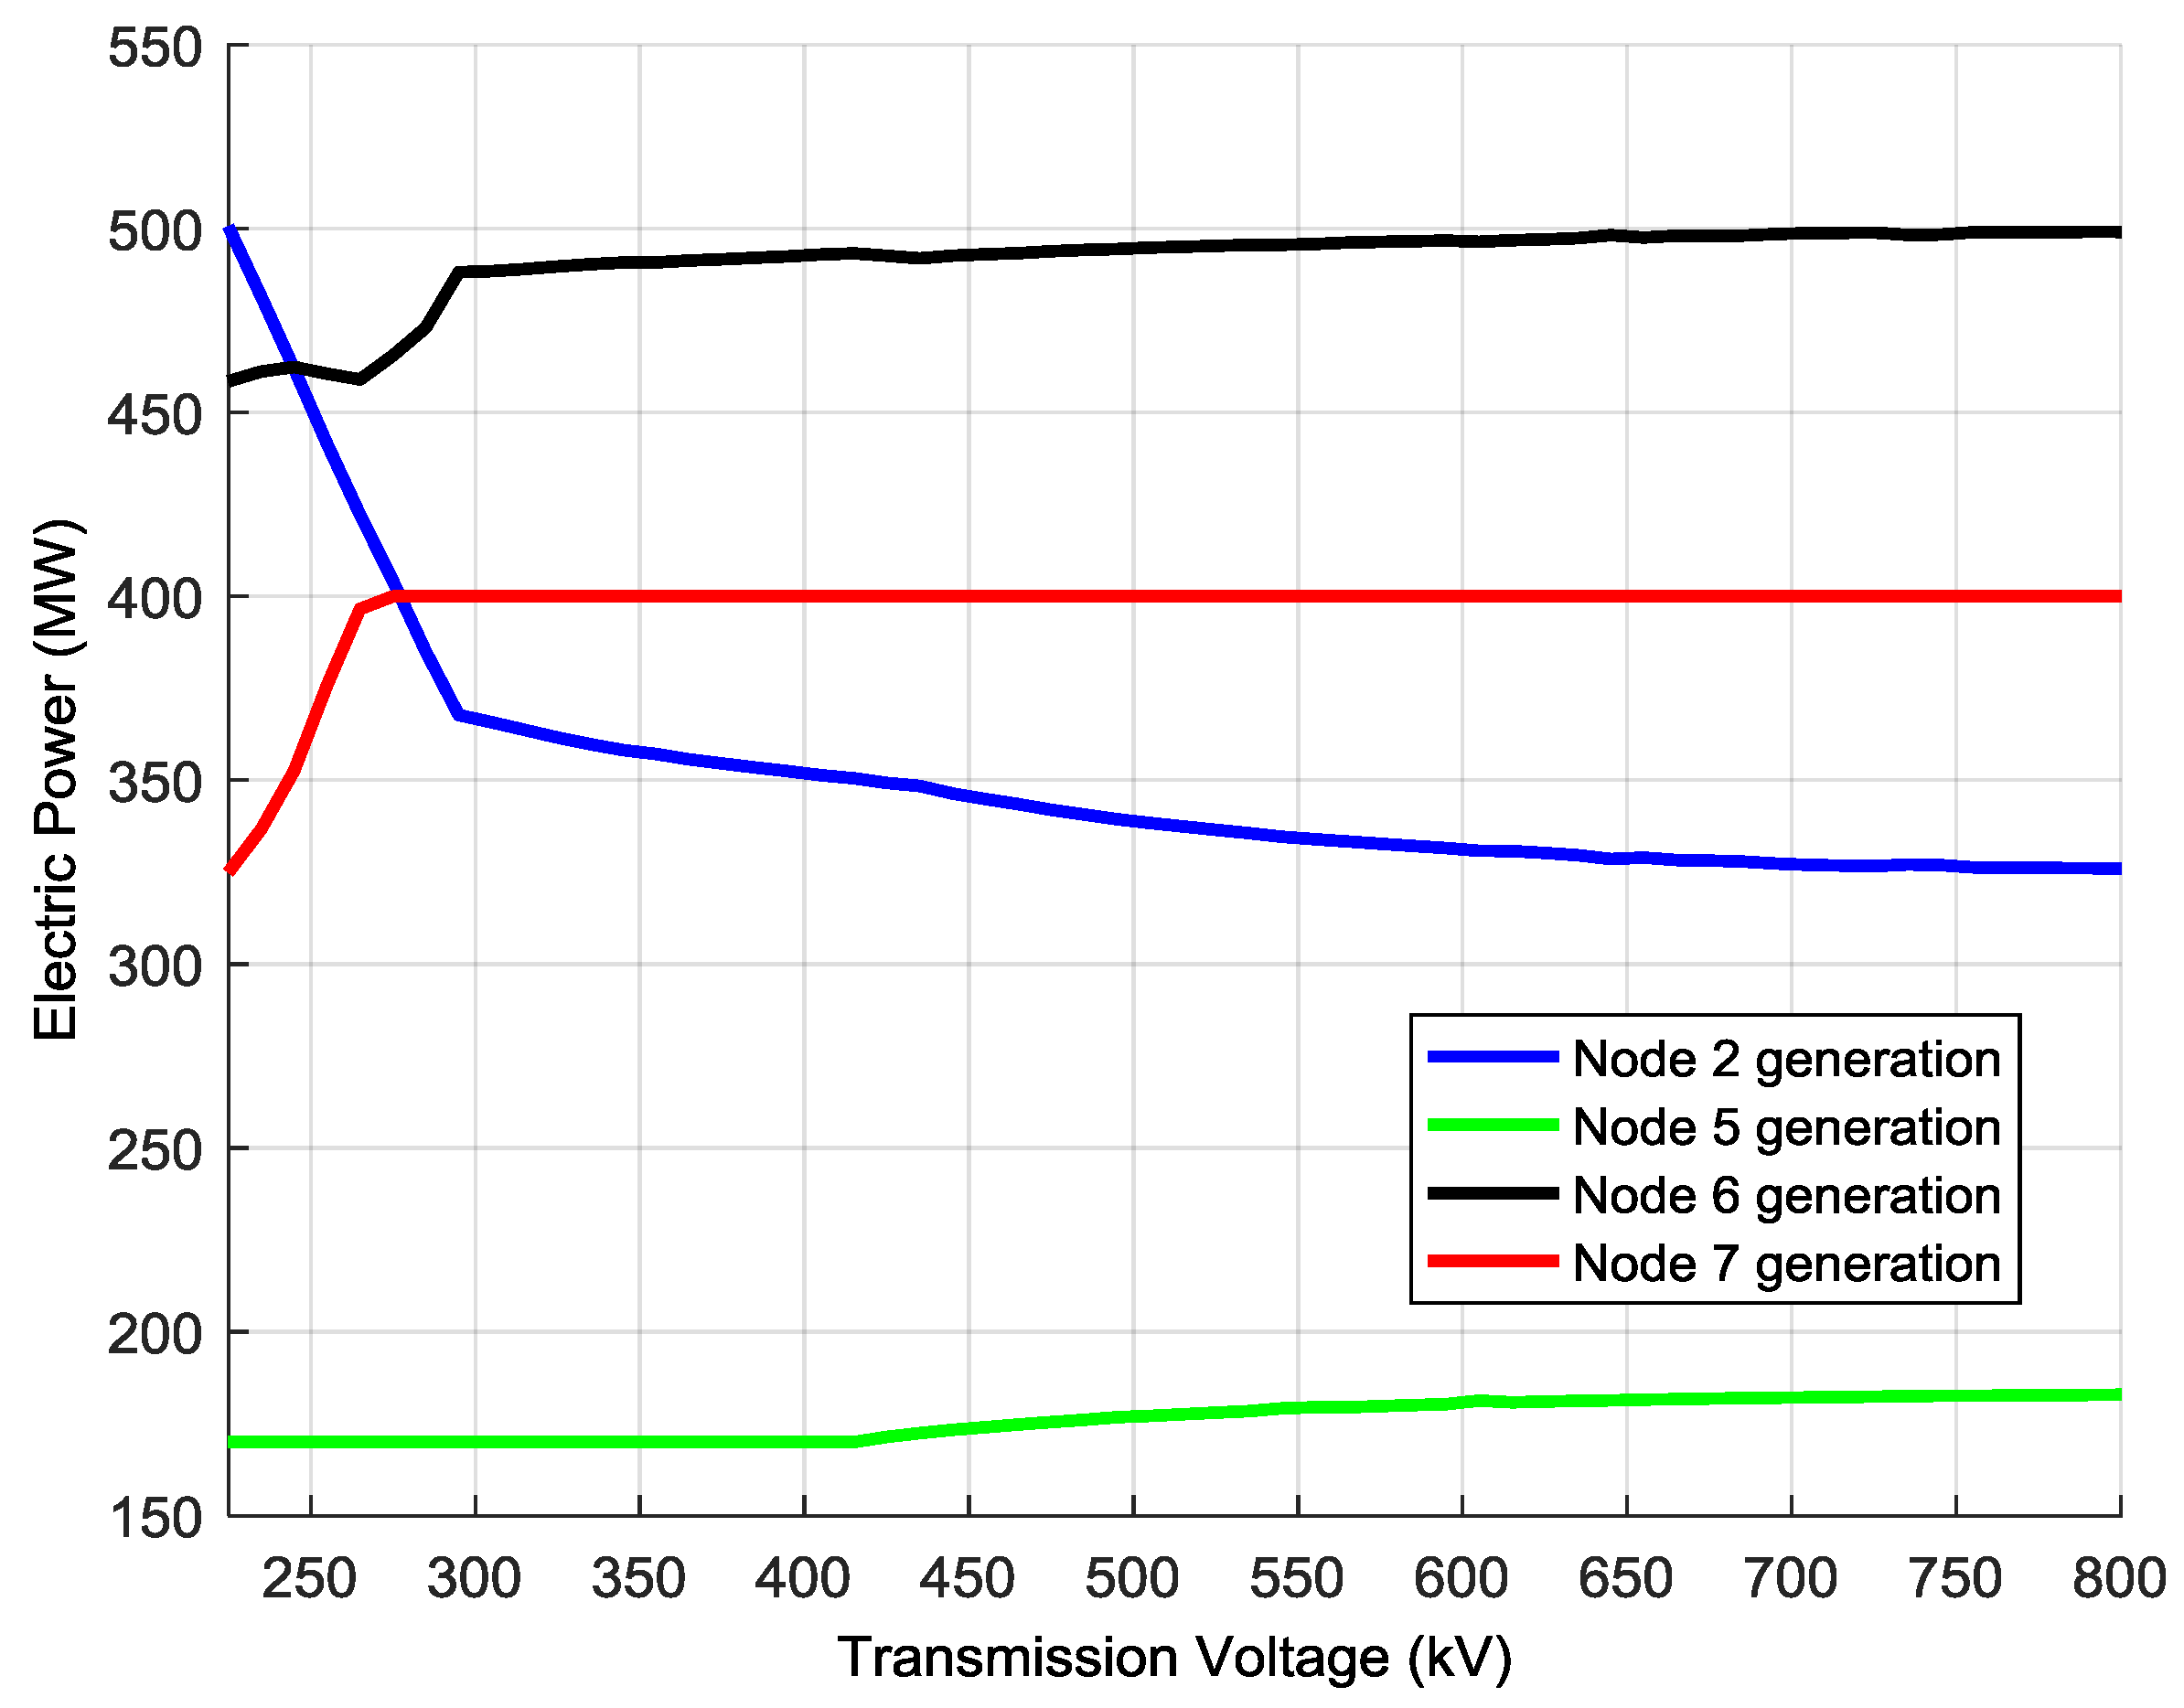
5.3.2. Increasing of Distribution Voltage for CO2 Emission Reduction
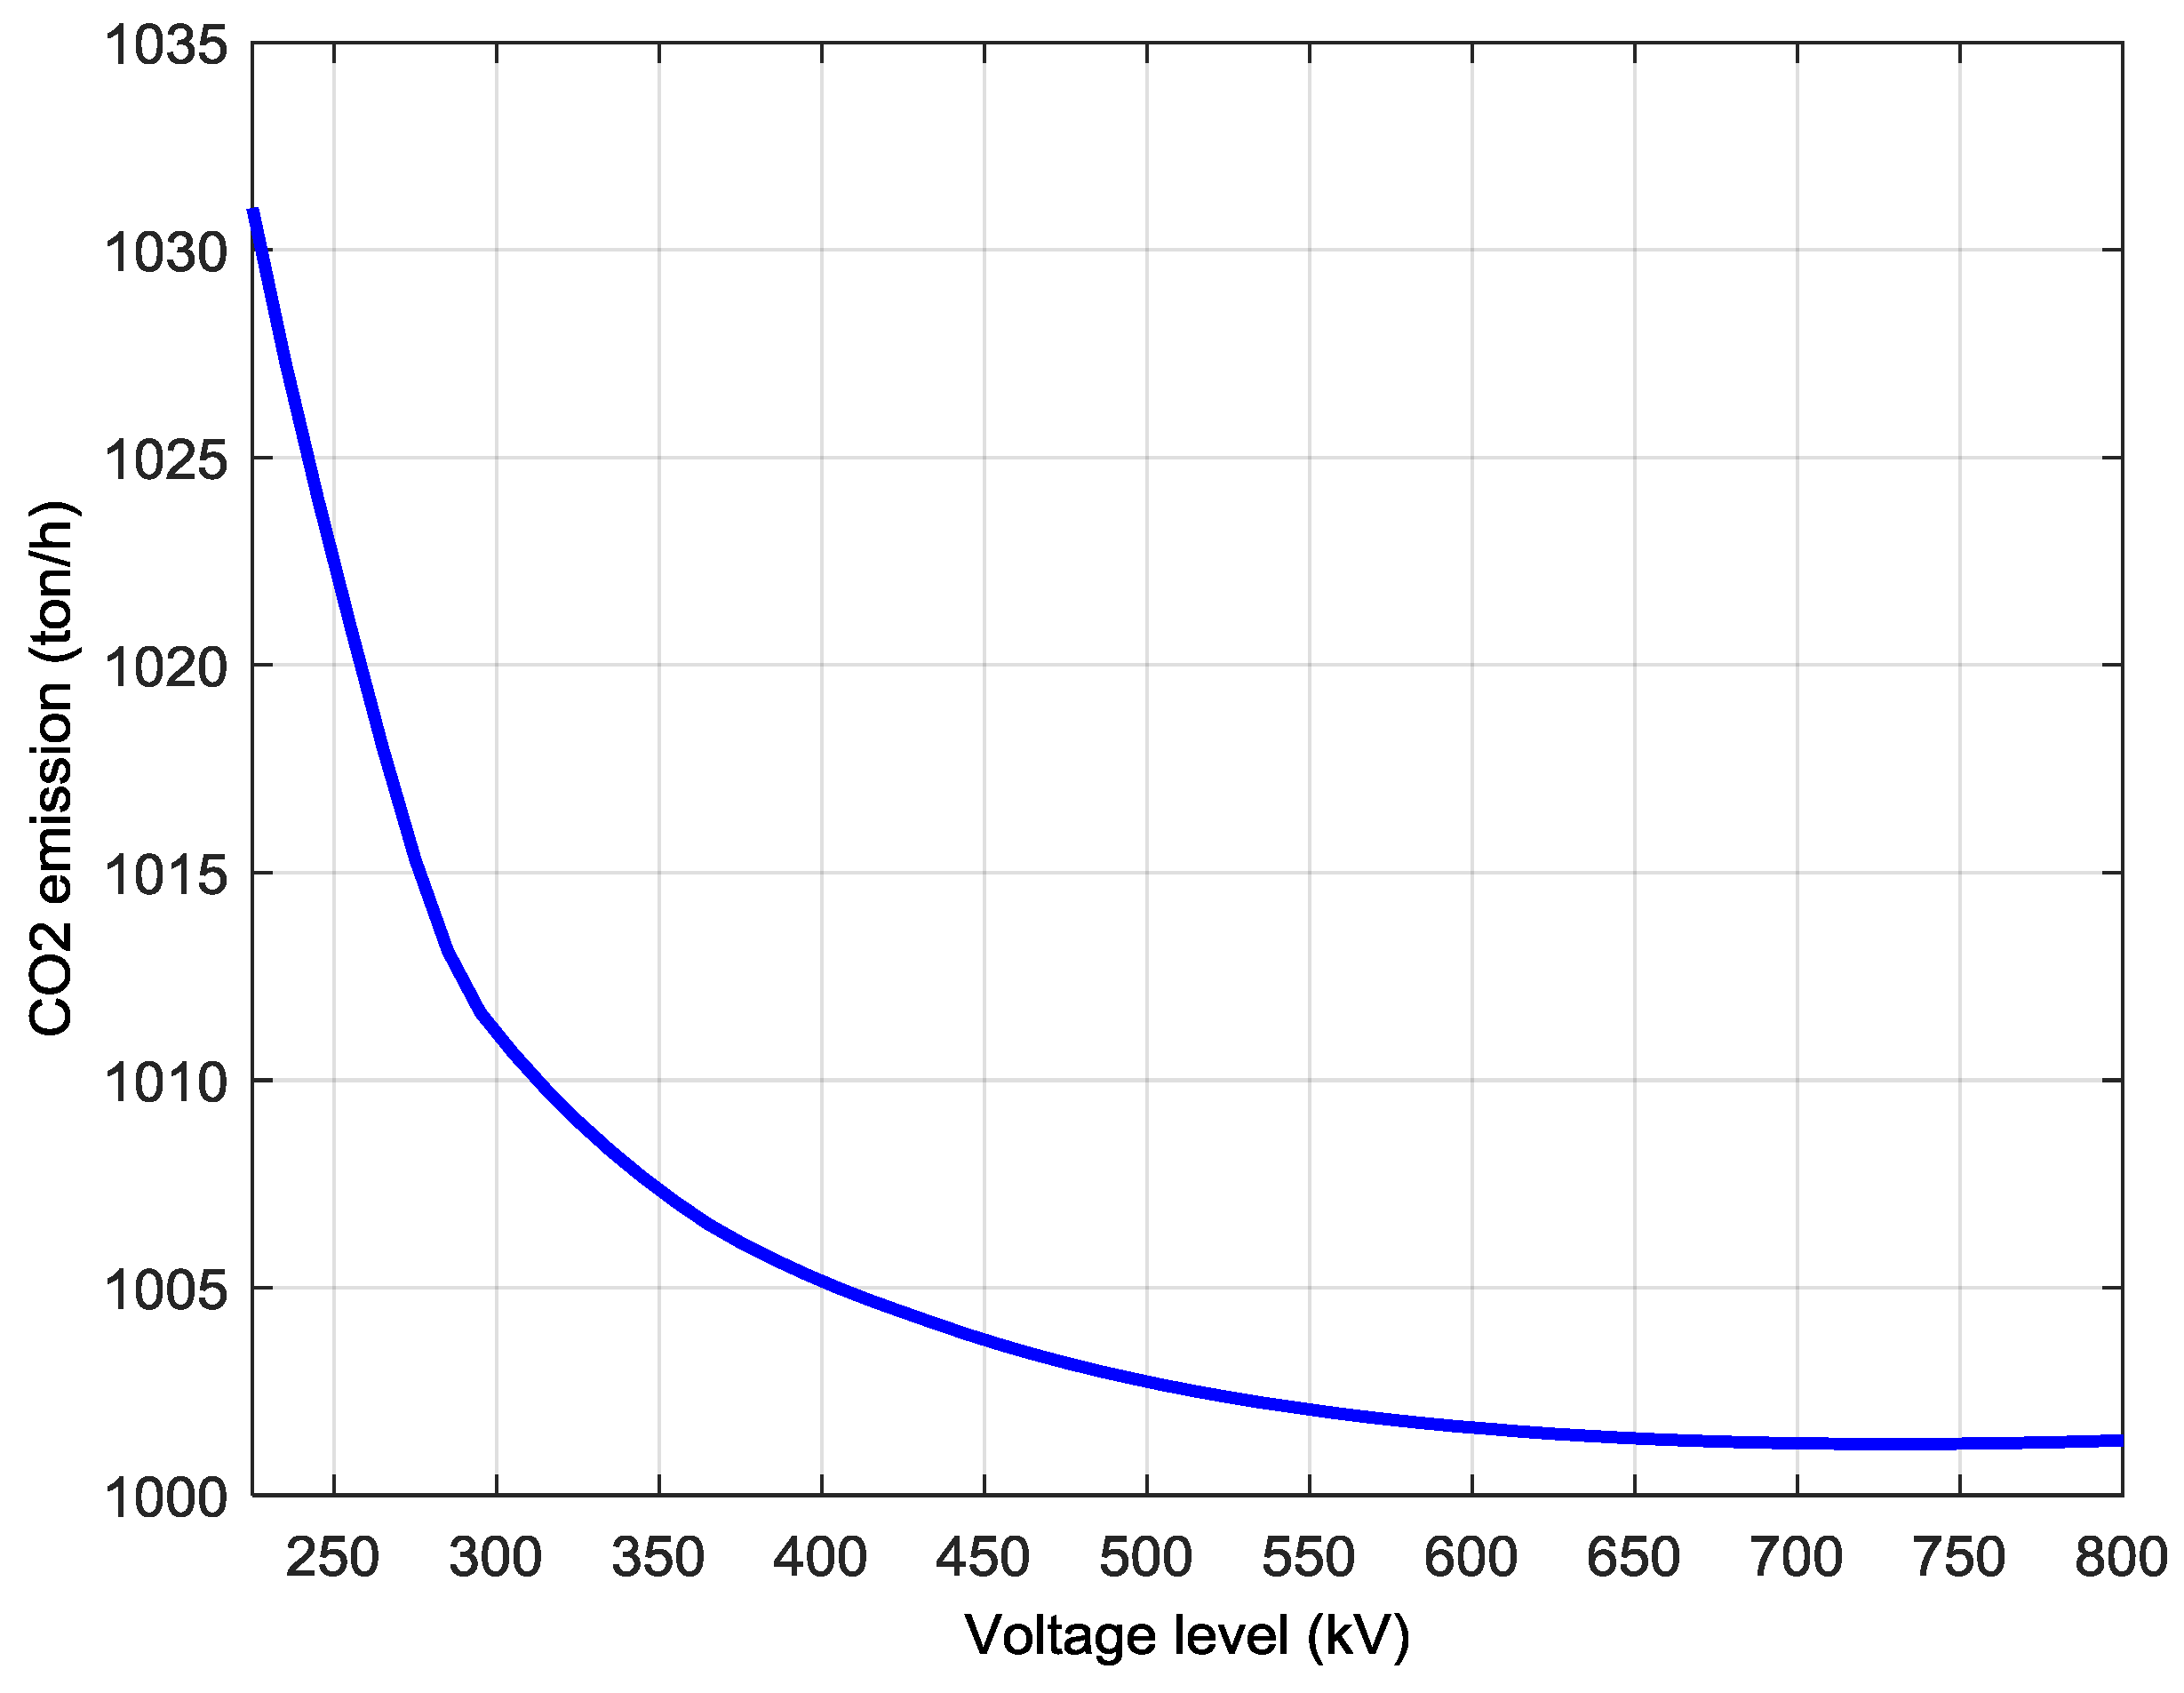
With specific reference to the CO
2 KPI, the effect of increasing the transmission voltage on the total hourly emissions of the grid is depicted in
Figure 5.
As can be seen upon examining the graph, the quantity of hourly polluting emissions exhibits a decreasing trend whose limit is almost 1000 t/h.
Figure 6 shows how the more polluting power plant, i.e., the one placed at Bus 2, slowly tends to reduce its production in favor of the combined cycle unit (Bus 7) and turbo-gas generators (Bus 6).
The effect of increasing the transmission voltage on GHG emission can be evaluated using the KPI defined in (3), obtaining a value of 2.9%.
5.3.3. Renewable Reactive Power Control for CO2 Emission Reduction
Table 9 reports the results obtained with the implementation of a reactive control strategy of renewable generation within the limits described in the previous section.
The reactive power from renewable generation units allows optimizing the benefit of the polluting generation in order to reduce the amount of GHG. This effect is quantified by the KPI of (3) within reason of 8.1%.
5.4. Share of RES KPI Results
The objective of the SoR KPI, as detailed in the previous sections, is that of increasing the renewable Hosting Capacity (HC) of the system. For this particular case study, the function to be minimized can be expressed as:
where
Pr,k is the renewable generation of the
k-th node. The considered case study network presents a renewable generation of 424 MW despite an overall installed capacity of 600 MW. The test case scenario does not allow the increasing of renewable generation without creating lines overloading issues and inadmissible voltage profiles; so, the original RES HC is equal to 424 MW.
5.4.1. Application of FACTS Devices for the Share of RES Increasing
Table 10 reports the results obtained by the application of active and reactive combined compensations on the proposed network configuration:
By the application of a reactive compensation, one obtains an increase of 41 MW of the RES HC of the system, while, with the application of active FACTS devices, the RES hosting capacity increases of 99 MW. This corresponds to a SoR KPI evaluation equal to 12.8% for the active combined FACTS and 5.3% for the reactive one.
5.4.2. Increasing of the Distribution Voltage Level for the Share of RES Increasing
The simulations performed in
Section 5.2.2. took into account the increasing of the distribution voltage up to 800 kV. The application of the proposed methodology highlighted an optimum value of rated transmission of 450 kV. With this value, the transmission system is capable of receiving all of the renewable generation, giving an RES hosting capacity of 600 MW. This corresponds to a SoR KPI value equal to 22.7%.
5.4.3. Reactive Power Control of Renewable Generation for the Share of RES Increasing
The results derived from the implementation of the RES reactive power control are detailed in
Table 11.
The reactive power produced from the renewable generation helps to locally satisfy the reactive requests of loads; thanks to this, lines are less loaded, and the amount of renewable generation can slightly increase up to 444.5 MW. The corresponding SoR KPI evaluated is equal to 2.7%.
5.5. Overall Comparison of the Achieved Results
In order to summarize the results obtained in the previous sections, it could be useful to analyze the entries of
Table 12, which reports KPI values calculated in correspondence to each of the proposed actions on the test network.
More in detail, if one wants to improve the energy efficiency of a transmission network, it is apparent that the most effective intervention, among those considered, is the increase of the transmission voltage level. As far as the reduction of GHG is concerned, the installation of (reactive) FACTS devices appears as the most suitable smarting action among the considered ones. Increasing the transmission voltage level provides also the most relevant effect in order to increase the system HC of RES. Despite the specific conclusions of the proposed interventions, it is important to notice the good applicability of the methodology and the KPIs’ definition, which help with the identification of the action with the most relevant potential effect on the considered issues, which will of course change in accordance with the specific electricity system frame of reference.
Having in mind the main aims of the paper, this analysis pointed out that:
The KPIs’ definition is well posed in all of the cases, since it has helped to identify the key point to focus on and producing a ranking among different interventions on the grid;
It has been possible to perform an ex-ante evaluation of the KPIs (by means of simulations);
A useful methodology has been defined to optimize the “smarting action” on the electricity network (i.e., the best location of FACTS devices has been chosen; the optimum value of the voltage label has been defined and the best reactive power injection from RES evaluated).
6. Conclusions
This paper has performed an overall study for the definition and application of key performance indicators suitable for the quantification of environmental benefits provided by smarting actions for the improvement of the electricity EU transmission and distribution network. KPIs are also thought of as a decision support tool for the ranking of different proposals in order to assign financing and economic support to those projects that have the more effective impact on environmental targets in accomplishing the 2020 EU targets. The present article details a comprehensive definition of a methodology for the quantification of the KPIs in accordance with the actions taken into account. The proposed methodology is based on the application of optimal power flow algorithms, which represent a powerful and flexible tool for the evaluation of several situations and targets. The proposed methodology could thus help support the definition of specific policy at the national and international level in order to support the most promising and effective actions. The availability of such a tool is very important, since the effectiveness of a single intervention may change in accordance with the specific network configuration of the frame of reference; it is then important to have a flexible tool available that allows providing a technical ranking of several interventions in a well-defined context. In the present form, the methodology can also provide useful information about the optimal benefit of the considered intervention and so acting as support for the actual implementation and pre-design.
Simulations performed on a transmission Cigré benchmark network highlighted the validity of the proposed KPI definition in order to point out the effectiveness of sample interventions in the specific case study. Future development of this work could account for the extension of the KPIs’ definition to different goals, such as those related to power quality or the security of the energy supply, in order to extend the field of evaluation of smarting actions and improving projects beyond the environmental EU 2020 targets.


