1. Introduction
The formation of soot particles from the combustion of conventional and bio-derived fuels is a topic that attracts considerable interest because of the negative impact on human health, air quality, and climate change [
1,
2,
3]. For this reason soot formation in combustion has long been investigated and debated over the years. Numerous experimental and numerical efforts have been devoted in order to achieve a better understanding of the chemistry and physics involved in the soot formation process, with the aim of achieving low-emission combustion technologies.
It is well established that carbonaceous particulate matter formed in combustion consists of a broad class of compounds whose size, nanostructure, and chemical composition strongly depend on the combustion conditions [
4]. The difficulty in describing the soot formation/evolution originates from the complexity of the flame environment; the very short time scale of the entire process, of the order of tens of milliseconds; and from the large variety of parameters such as pressure, temperature, fuel composition, and the extent of premixing that influence the kinetics of the soot mechanism [
5].
When hydrocarbon molecules are burnt in non-stoichiometric conditions, pyrolytic and oxidative reactions lead to the formation of benzene and larger polycyclic aromatic hydrocarbons (PAHs), which in turn promote the formation of carbonaceous nanoparticles. Particle nucleation, i.e., the transition from gas-phase compounds to solid particles, is the first, though more complex, step in the soot formation process and is still an object of ongoing studies [
6,
7,
8,
9]. Several mechanisms have been proposed and are currently being debated for particle inception. These include physical clustering of pericondensed aromatic hydrocarbons or oligomers of aromatic hydrocarbons (i.e., compounds with high molecular mass characterized by aromatic functionalities linked by aliphatic bonds) through van der Walls’ forces or even the formation of curved fullerenic-like structures [
6,
7].
Once formed, just-nucleated nanoparticles can coagulate or coalesce and be subject to surface growth by the addition of gas-phase compounds. In addition, soot particles further modify their chemical/structural composition due to carbonization and oxidation reactions occurring in the combustion environment.
Hence, flame-formed soot particles can assume distinct chemical and physical properties since each of these processes is effective in influencing the overall chemical/structural characteristics.
At the early stages of soot nucleation and growth, depending on flame conditions such as flame temperature and particle residence time, the particle size distribution can evolve from a unimodal distribution to a bimodal distribution, with a first mode typically composed by particles of few nanometers in diameter, i.e., d
p ≈ 2–3 nm, and a second mode composed by larger particles of the order of tens of nanometers. It is thought that such a bimodal shape is the result of competitive effects of particle nucleation and coagulation [
6,
7,
8,
9]. In addition, recent studies pointed out that the particle growth by coagulation of the first particle mode co-occurs with a strong variation of their optical properties [
10,
11]. Also, it has been already demonstrated that carbonization and oxidation have a significant impact on the soot particle overall makeup [
12,
13]. In this regard, the fact that soot ‘maturity’ affects the particle optical property is well known [
8].
From a diagnostic point of view the development of new methods able to capture both particle concentration and properties is particularly valuable. It is worth noticing that changes in particles’ optical properties, for instance emissivity, might be a crucial point when optical diagnostics are used to investigate the soot formation process in combustion, as recently pointed out by Kholghy et al. [
14], as well as their impact on the atmosphere and climate [
3]. Thermophoretic particle densitometry (TPD) is a method used to measure soot volume fraction in flame, which was first developed by McEnally et al. [
15] and later adopted in other works [
16]. Our group extended this method to measure particle emissivity simultaneously with volume fraction and to correlate its change to particle carbonization in premixed flames [
17].
Most of the works on soot formation have been done in premixed or coflow and counterflow flames, which furnish ideal conditions to investigate the details of the chemical physical process. However more complex flame conditions are of major relevance from a practical point of view. Several practical combustion systems use partially premixed flames; this is the case with domestic appliance and Bunsen-type burners, gas turbine and staged combustors, and turbulent and spray combustors. In these systems, the fuel containing sub stoichiometric amounts of air burns with an initially separated oxidizer.
The effect of partial premixing on soot formation has been previously investigated experimentally by laser induced incandescence [
18] and light absorption [
19]. The works done in ethylene flames have shown that, as consequence of oxygen addition, the soot volume fraction initially increases because of the enhancement of the local radical pool, and the modification in the hydrocarbon chemistry reaches a maximum and then decreases.
A set of flames with a different amount of partial premixing, originally investigated by McEnally et al. [
18], has been selected as the target flames (ISF-3 Co-flow2) at the International Sooting Flame (ISF) Workshop [
20], and a wide data-base is available for soot, major species, and flame structure. Nevertheless the effect of the fuel partial premixing on the soot formation is still far to be completely understood and one major question remains open; beside soot concentration, is soot composition also affected by the premixing? To answer to this question, it is important to investigate the early formation of particles in the fuel side of the flame. To shed light on this point in this work, we have exploited the potentiality of the TPD technique to simultaneously monitor the soot volume fraction and emissivity as function of premixing. Indeed, previous works performed in non-premixed diffusion flame as well as in premixed laminar flame [
17] have shown that TPD is particularly powerful in investigating the early stages of particle formation, whereas it fails to follow soot particles in strongly oxidant environments. This point has been here further discussed by comparing the results of TPD with the OH radical concentration evaluated by a detailed kinetic mechanism and showing that including the OH oxidation in the mass balance equation for TPD allows the evaluation of the particle volume fraction in a moderately oxidative flame region.
3. Results and Discussion
TPD is a method developed by McEnally et al. [
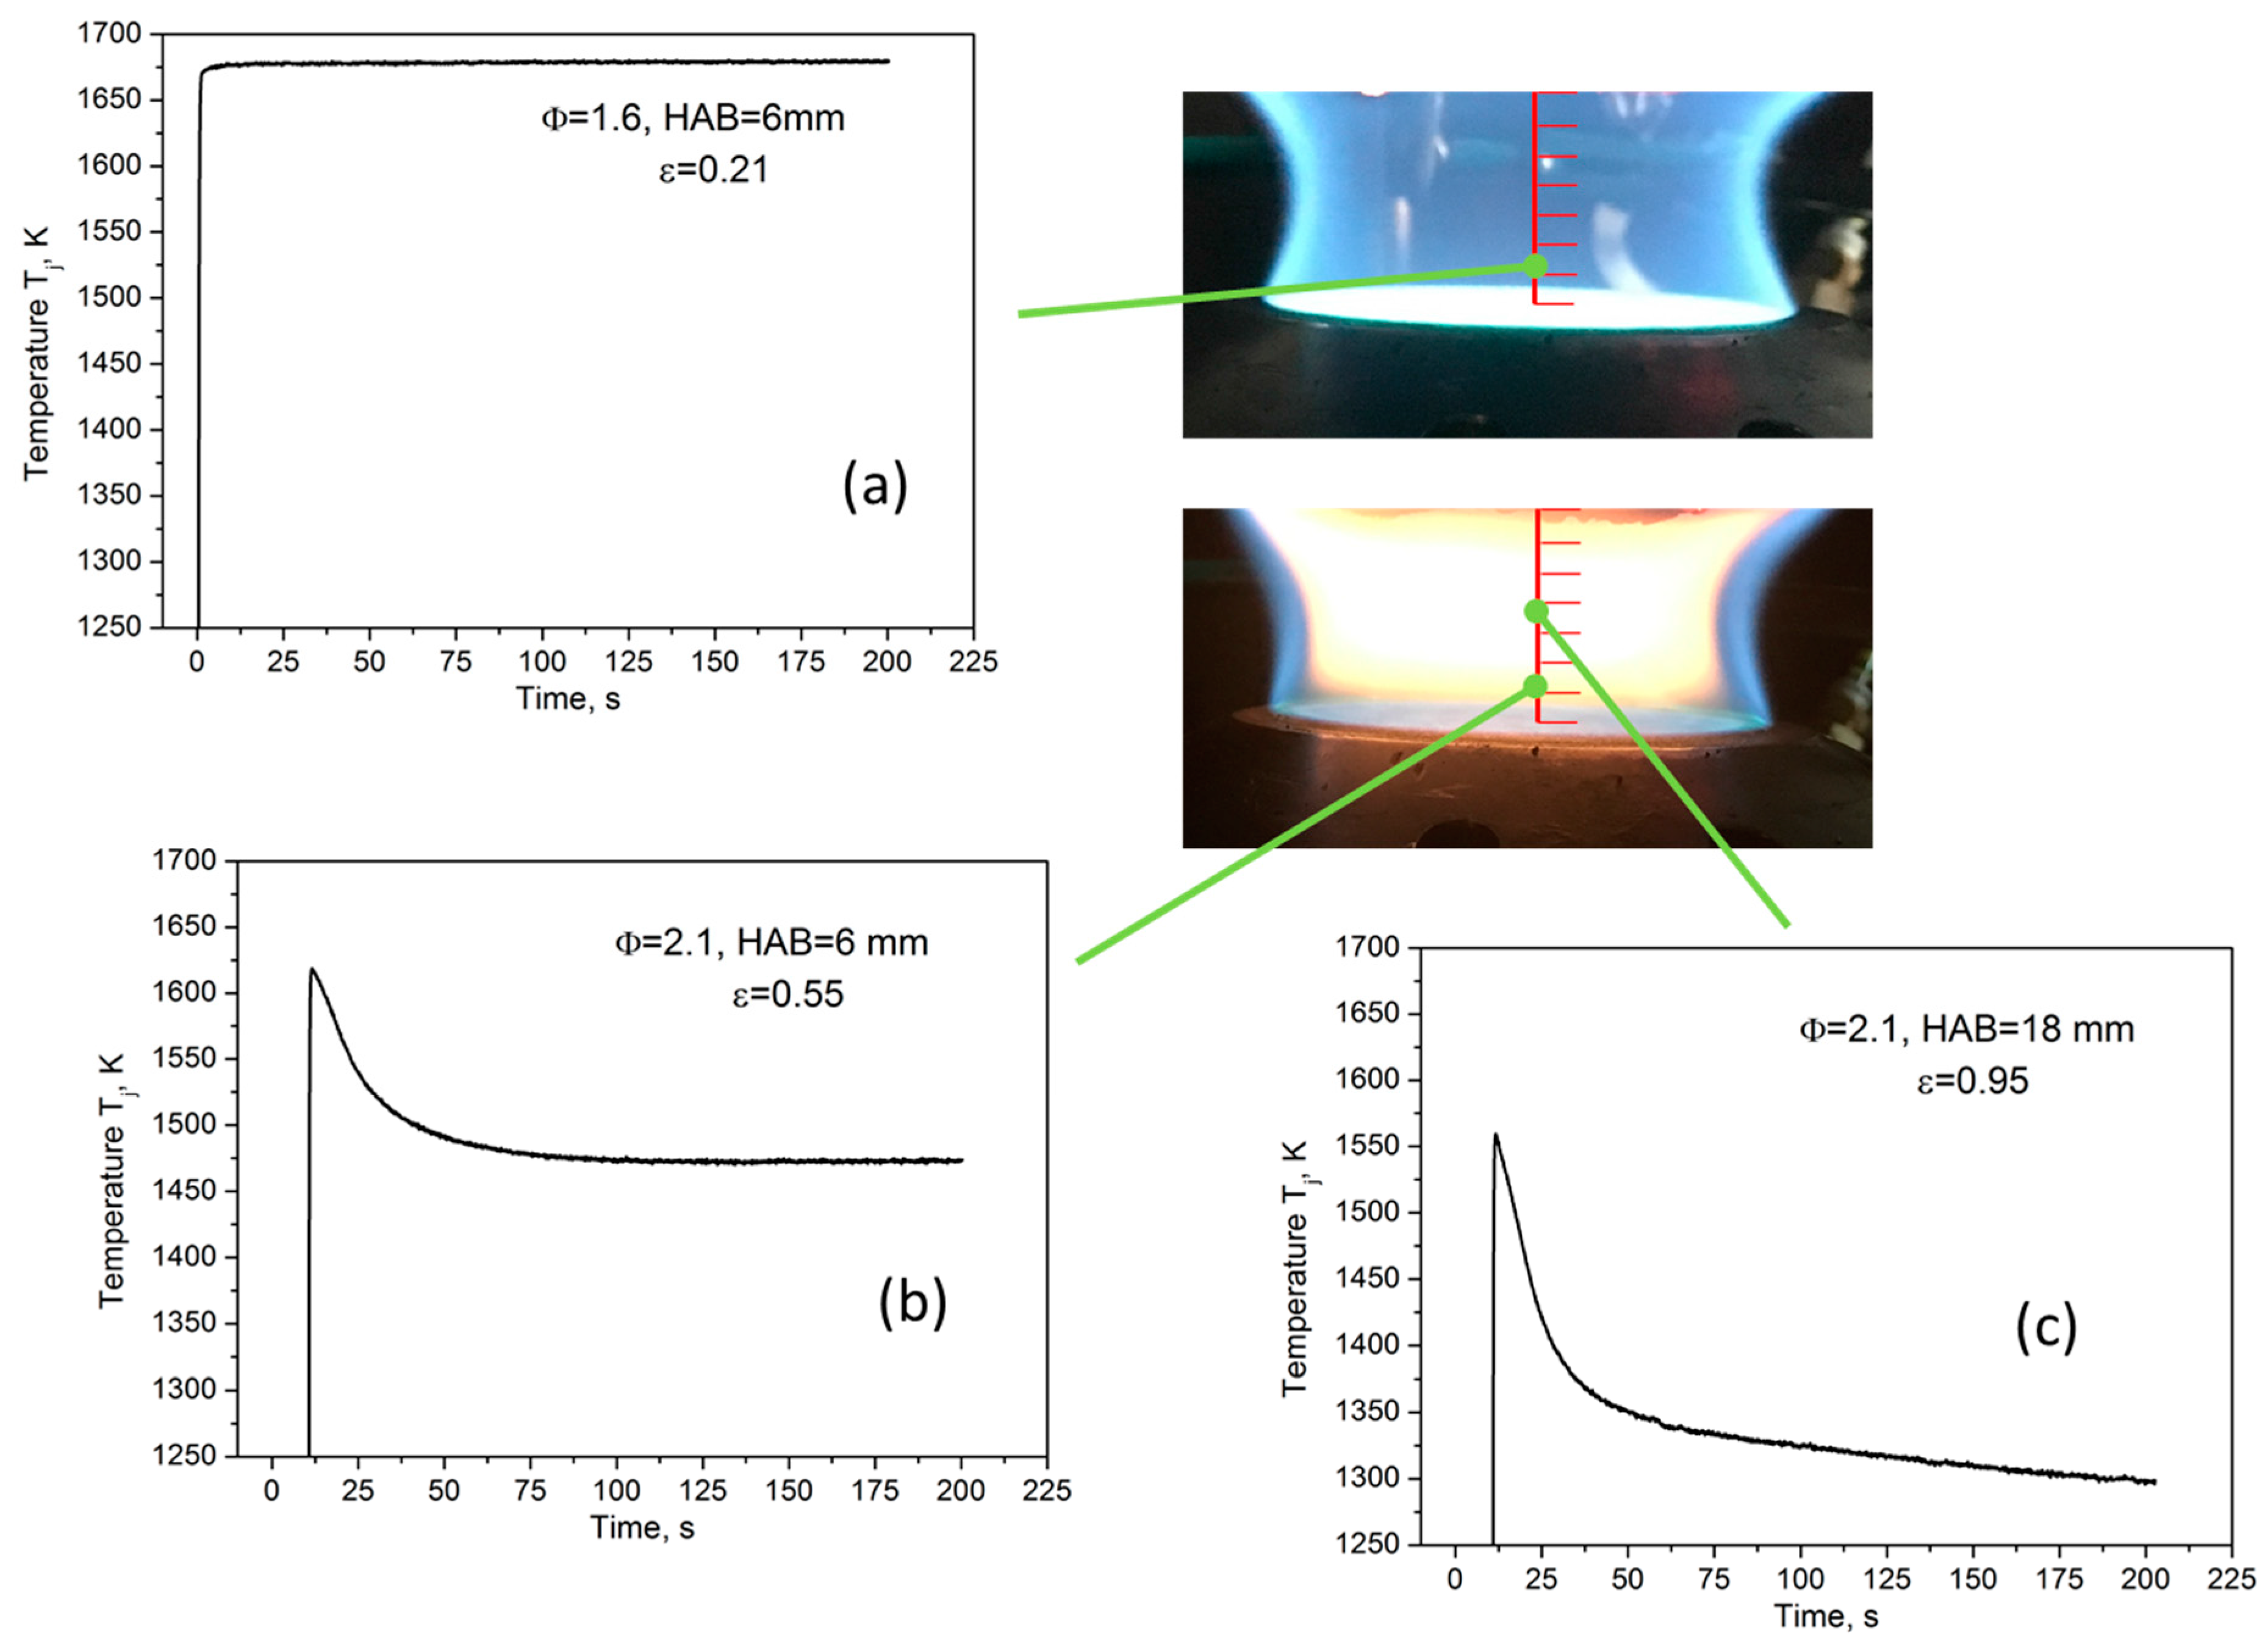
15] for soot particle volume fraction measurements. It is based on the analysis of the temperature-time history produced by inserting a thermocouple in a flame that contains a certain amount of soot particles. Indeed, the temperature trend is sensitive to the particle loading of a flame. The procedure to analyze TPD data is clear, considering the measurements performed in three exemplary regions of premixed flames at different heights above the burner (HAB), reported in
Figure 1. In a soot-free region of a flame, the temperature measured over time by the thermocouple rapidly inserted in flame, T
j(t), after an initial fast increase, reaches a constant value when the thermal equilibrium is reached (see
Figure 1a) and the gas temperature, T
g, can be obtained from it, according to the energy balance at the thermocouple junction [
15]:
where ε
j is the junction emissivity, σ is the Stefan-Boltzman constant, Nu
j is the junction Nusselt number, d
j is the junction diameter, and K
g0 = K
g/T
g, where K
g is the gas thermal conductivity. By contrast, in a soot-containing region of the flame, the temperature profile, after reaching a maximum value, decreases in time, as reported in
Figure 1b,c. Such a decrease is due to the thermophoretic deposition of carbonaceous particles on the bead of the thermocouple, which results in an increase of both the emissivity ε
j and the diameter d
j of the junction. Interestingly, the effect on T
j(t) of each of these two quantities can be analyzed separately considering two distinct stages in the temperature-time plot. During the first one, identified as the ‘variable-emissivity stage’, the temperature sharply drops since the emissivity of the junction ε
j changes from the value for clean thermocouple to the value of the depositing particles until a layer of particles is deposited on the junction. In this stage, the variation in time of the emissivity is more rapid than the variation of the diameter, so the thermocouple bead size can be considered constant and equal to that of the clean thermocouple. Once the junction is uniformly coated by particles, ε
j reaches the value of the particle emissivity. The further decrease of T
j(t) defines the second regime named the ‘variable-diameter stage’; the thermophoretic deposition of soot additionally decreases the temperature since the junction bead size increase affects the thermal energy balance.
The ‘variable-emissivity’ and the ‘variable-diameter’ regimes can be identified from the two different slopes in the T
j(t) profile, as evidenced by
Figure 1b,c.
Particle emissivity can be determined from the first region of the curve by again solving the energy balance, Equation (1), at the thermocouple junction at the time when the transition for the two regimes occurs, t*, considering ε
j as the unknown quantity (while T
g is the flame temperature obtained by using as the maximum of T
j(t) the value given by the extrapolation of the curve at t = 0 as explained in [
16]).
Figure 1a reports the temperature profile measured in absence of particulate matter, which refers to a laminar premixed ethylene/air flame with Φ = 1.6 and HAB = 6 mm conditions, wherein no change in the time of the temperature corresponds to a measured emissivity of the pure platinum, ε ≈ 0.2.
Figure 1b reports the curve measured in the nucleation zone of a sooting laminar premixed flame (Φ = 2.1, HAB = 6 mm,) in which particle size is of the order of few nanometers and the temperature measured by thermocouple starts decreasing immediately after its maximum value and ε reaches the value of about 0.5. While in the flame regions where a second mode in size distribution with particles of about 10 nm is present (Φ = 2.1, HAB = 18 mm), T
j(t) shows a very relevant decrease in the ‘variable-emissivity’, stage giving ε ≈ 0.95, i.e., the typical value of mature soot.
Once particle emissivity has been measured, the particle volume fraction in the flame can be evaluated from the second decreasing zone of the T
j(t) curve [
15]. Indeed, mass balance on the junction during the variable diameter stage can be written considering the thermophoretic mass flux j’’ of particles to the junction per unit time and surface area [
14]:
where f
v is the local soot volume fraction, ρ
p is the particle density, and ρ
d is the deposit density (assumed to be constant in time). The energy and mass balances can be solved to finally derive the volume fraction of particles in the flame, as described by McEnally et al. [
15]. In order to extend the technique to the region of soot precursor particles, which may have different optical properties, the particle volume fraction has been here evaluated using the value of ε determined from the ‘variable-emissivity’ zone. Indeed, the use of this value for the particle emissivity results in a good agreement with the soot volume fraction obtained by differential mobility analysism as demonstrated in [
17].
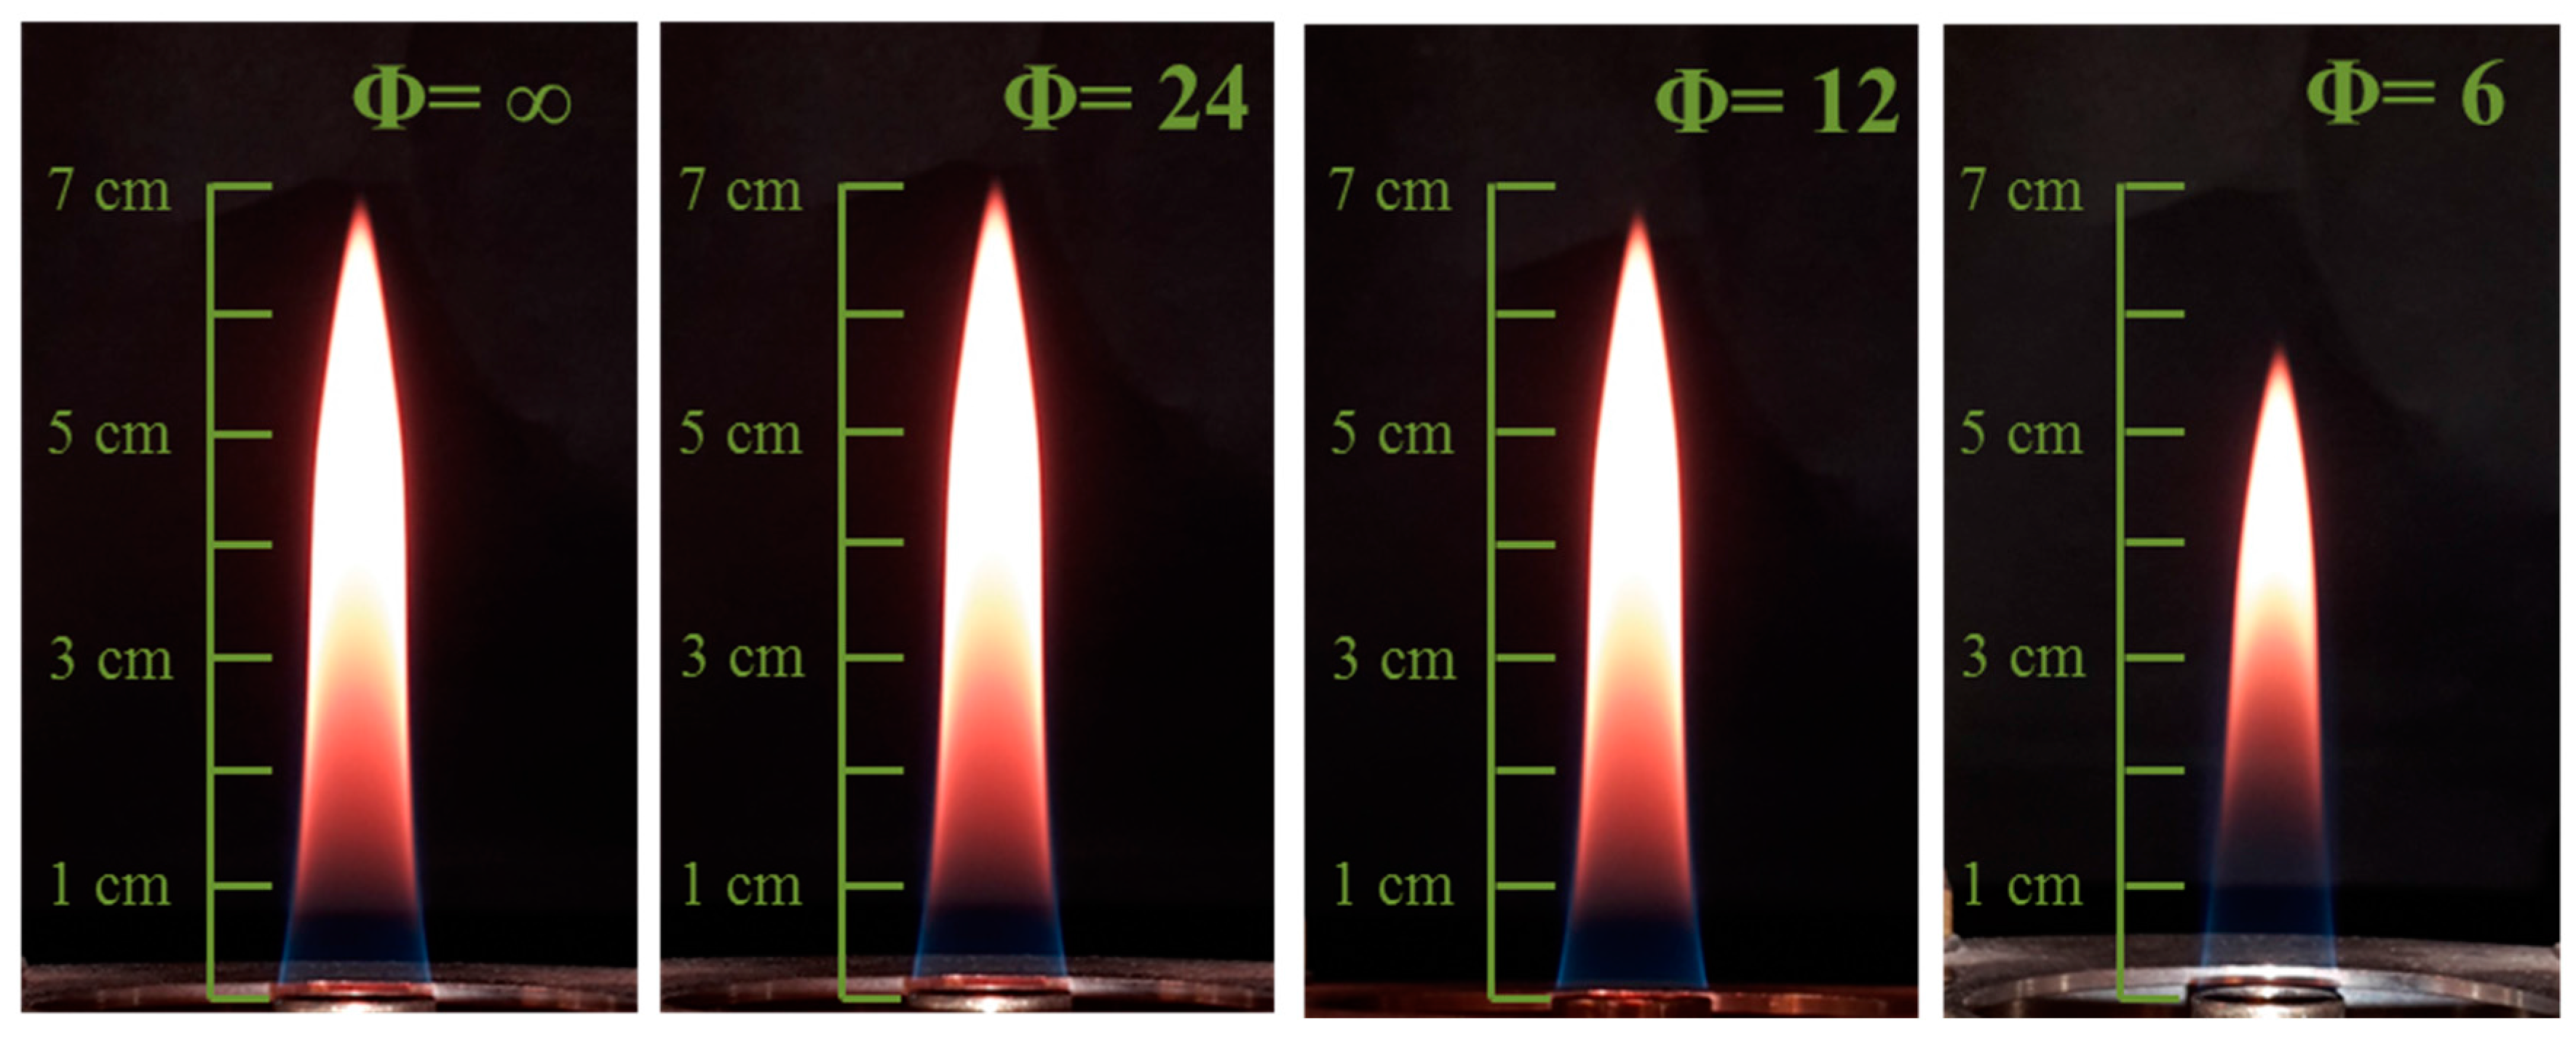
TPD measurements have been performed in a set of partially premixed coflow flames with different equivalence ratios. A picture of the four flames investigated is reported in
Figure 2.
It is worth mentioning that, in a laminar diffusion flame, the soot volume fraction is maximized in a annular region at the outer of the flame. Therefore, the thermocouple was inserted into the flame with a short insertion time, i.e., lower than 200 ms. Indeed, considering that the annular soot region is very thin, the soot deposition from this region during the insertion period is likely to be neglected.
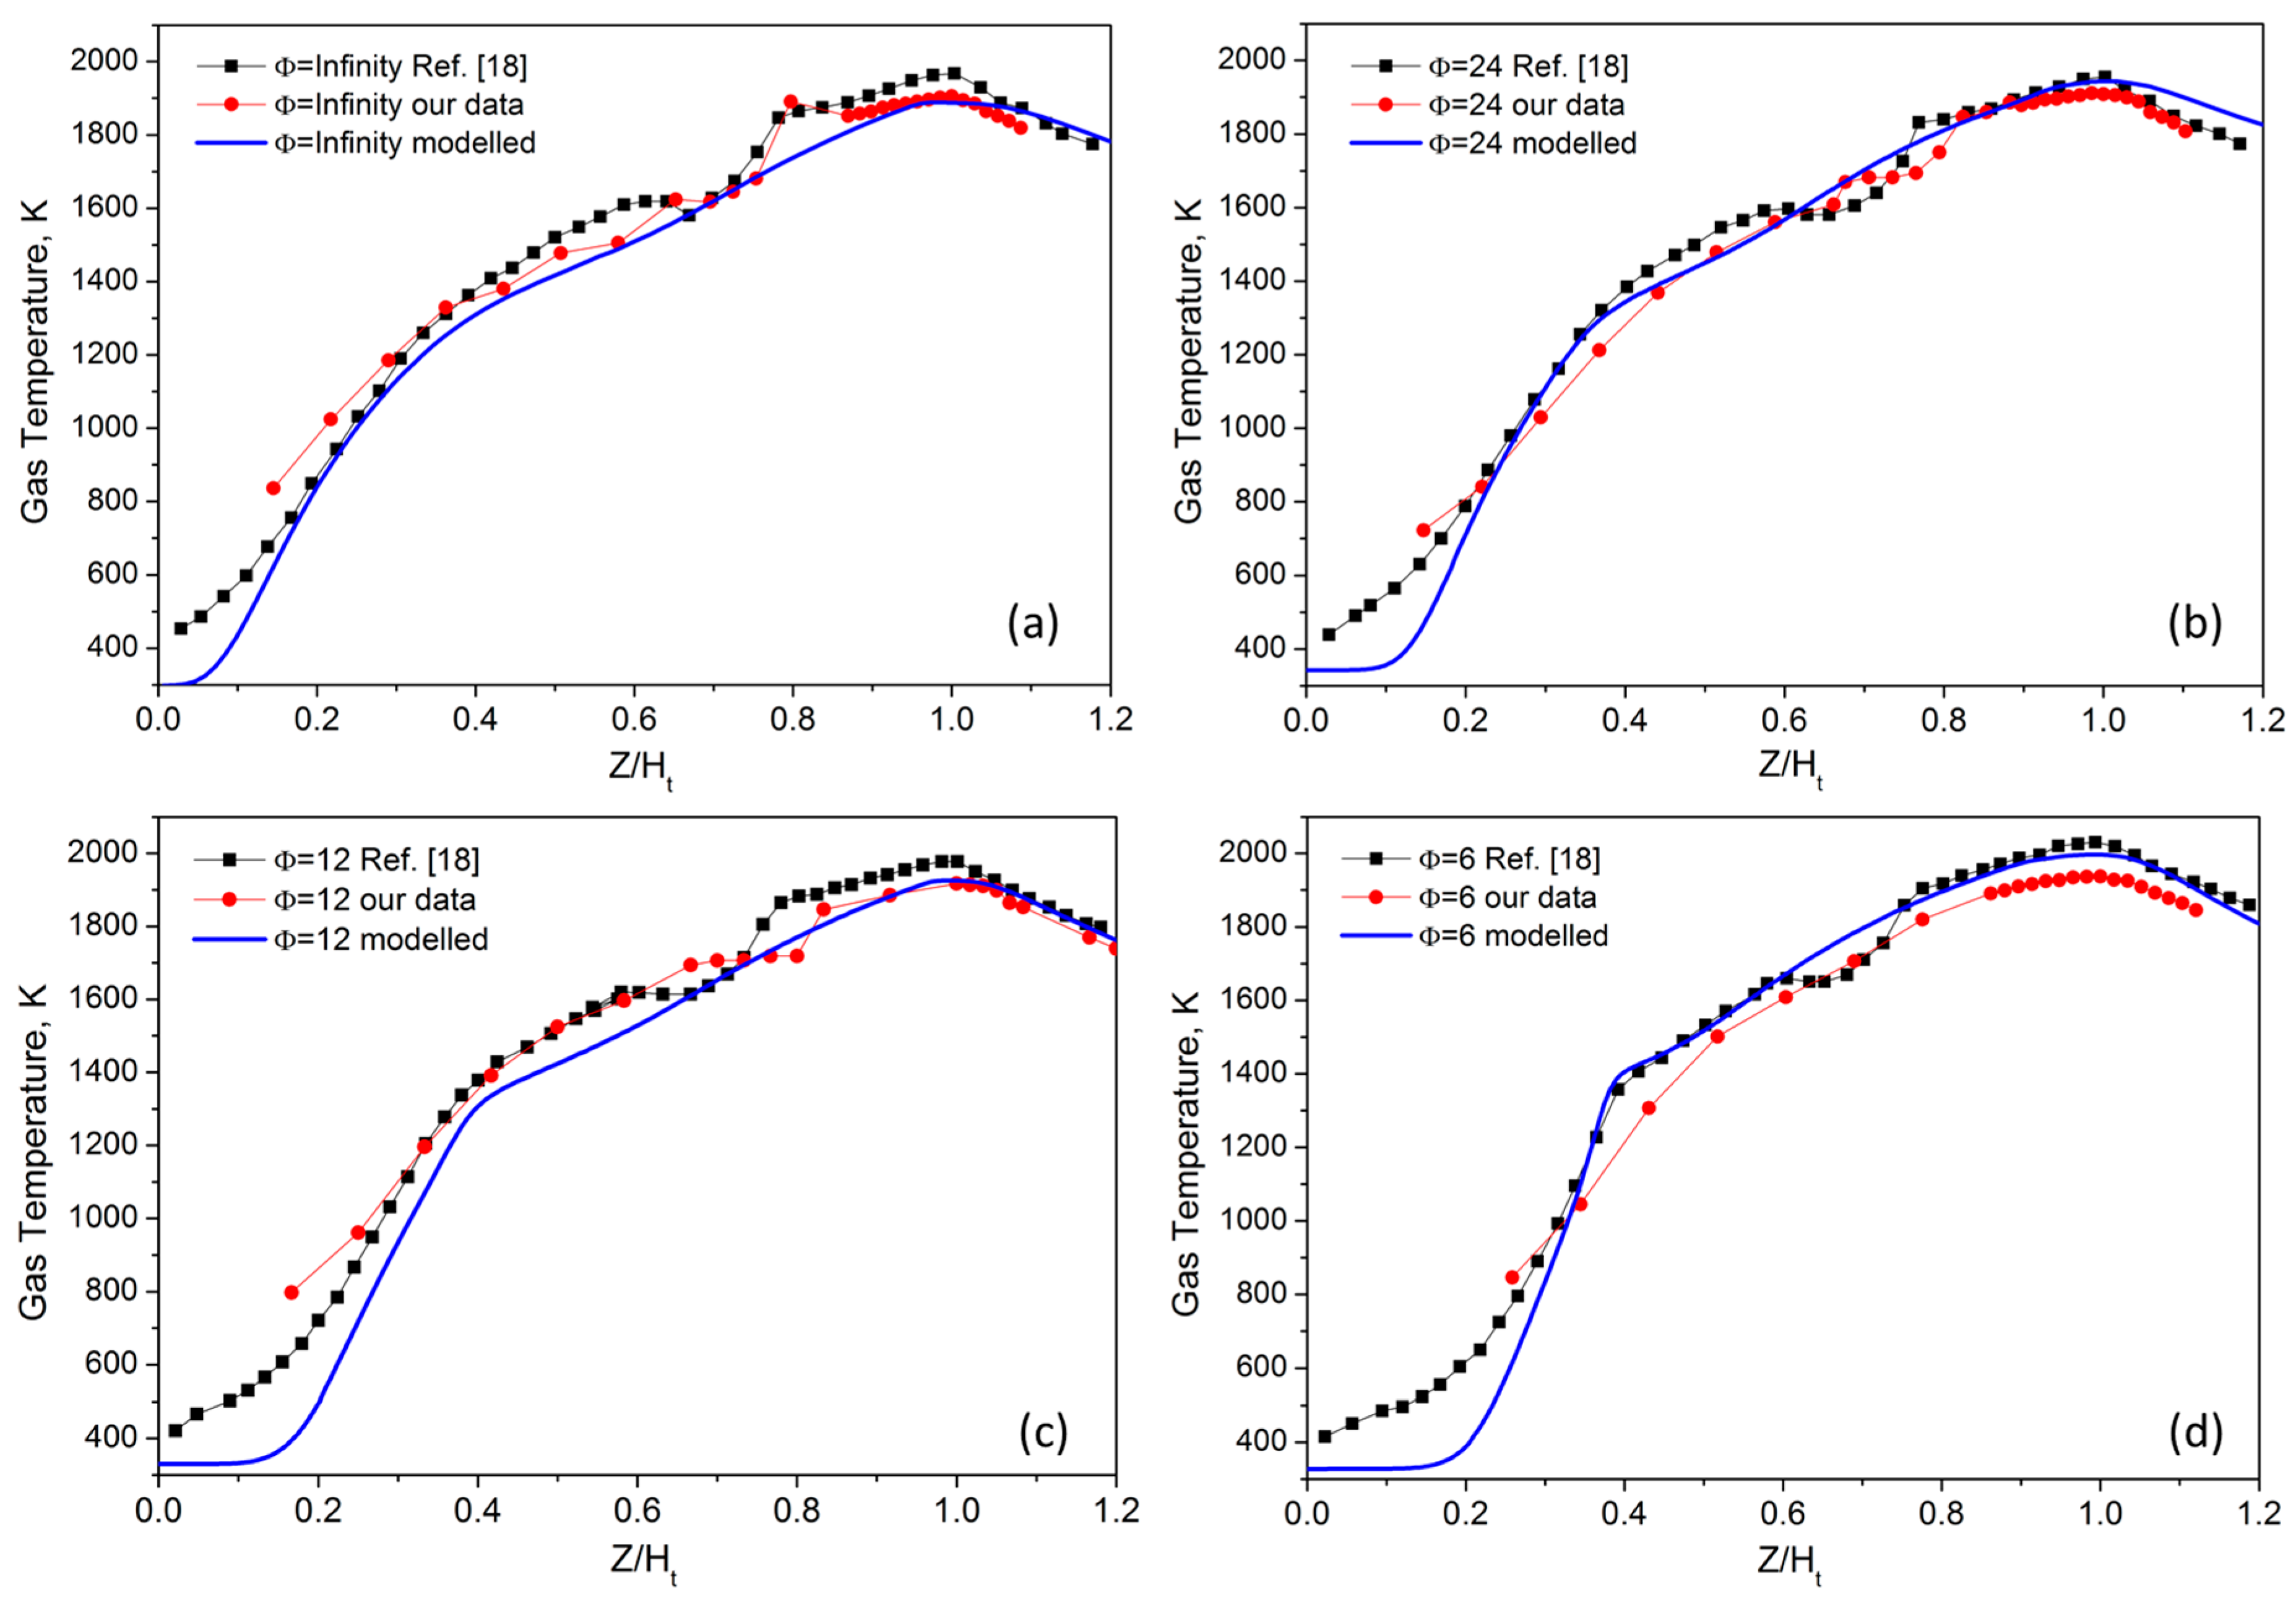
The centerline gas temperatures measured for the four investigated flames are reported in
Figure 3, together with the modeled profile and the data reported in [
18]. The effect of temperature radial distribution on the TPD response has been already discussed in detail in [
15]. All the profiles are reported in terms of the non-dimensional height Z/H
t, which is defined as the flame height normalized by the height of maximum centerline temperature. In close agreement with that previously reported [
18] these profiles are nearly similar. The two sets of experimental data are in agreement with each other and quite well reproduced by the model. The maximum flame temperature only slightly changes with increasing premixing, while more relevant is the cooling of the central region of the flames.
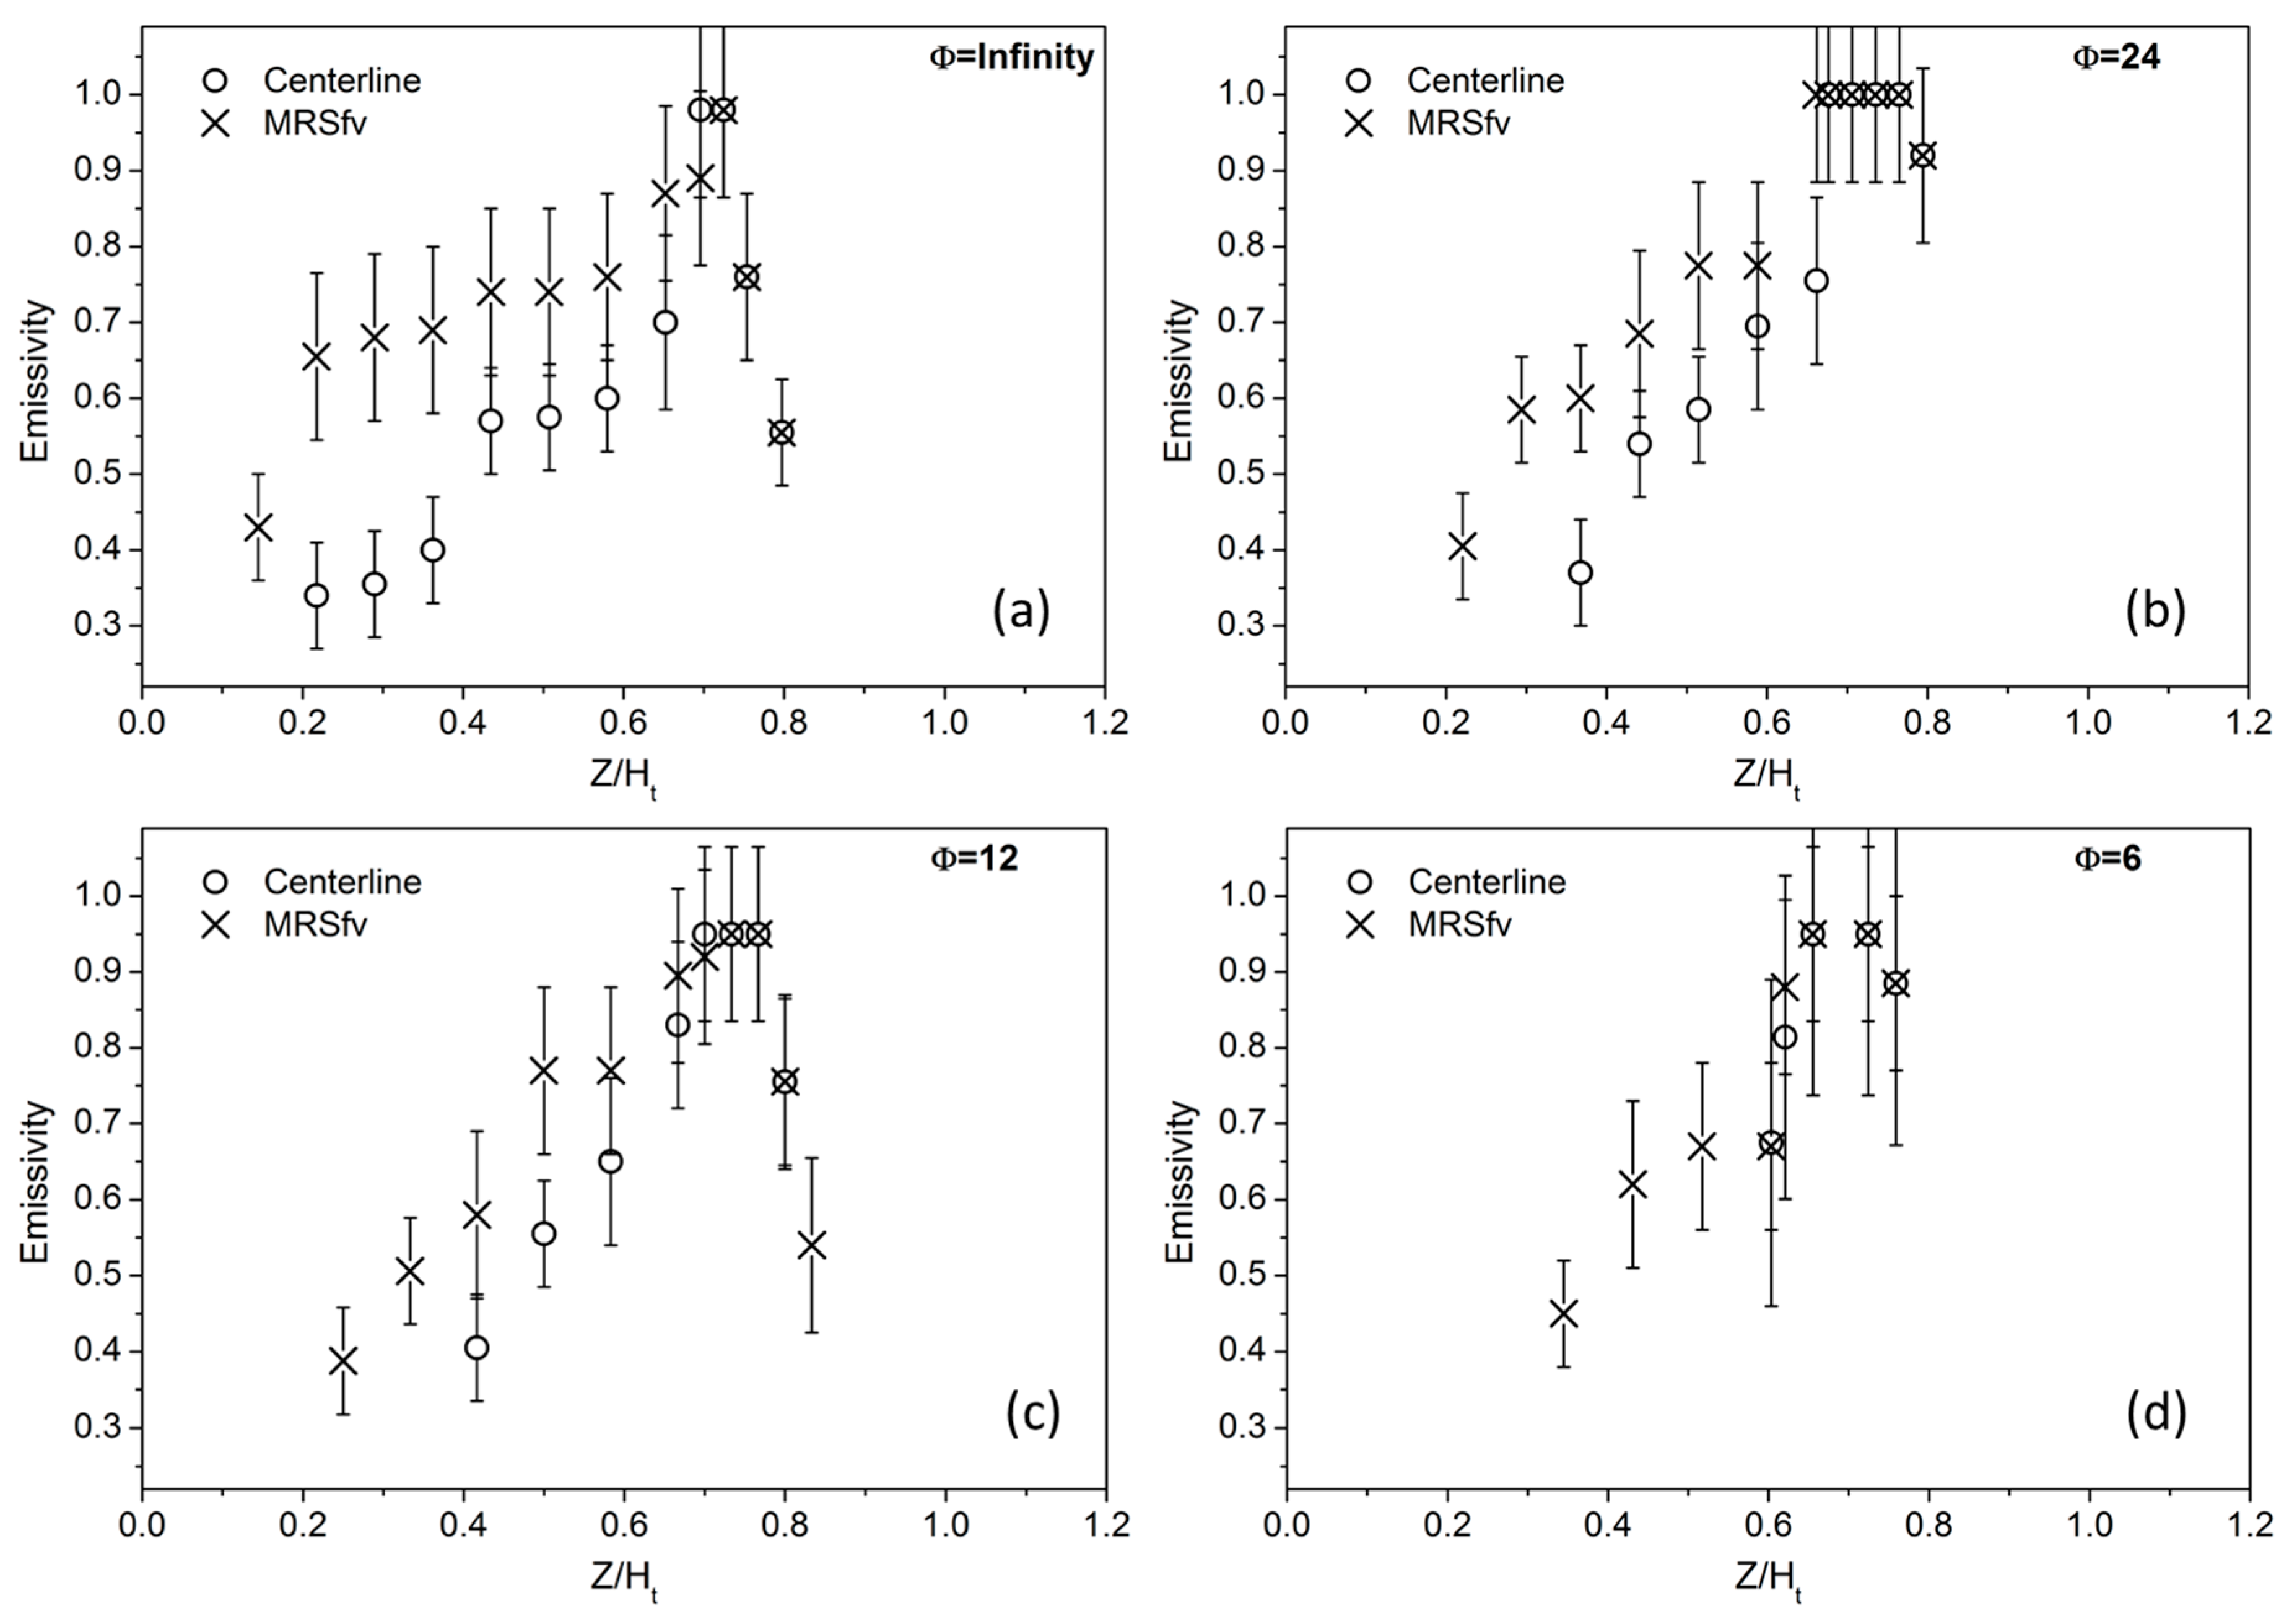
The emissivity values of the soot particles measured along two pathways, the flame centerline and the maximum radial soot volume fraction (MRSf
v) (flame wings), are reported in
Figure 4. Increasing Z/H
t, particle emissivity increases, reaching the typical value of 0.95 that is usually attributed to soot particles [
15]. Although the data are affected by a significant uncertainty, the data in
Figure 4 clearly show that, at the early stage of the soot formation process, particulate matter has a lower thermal emissivity; hence it is probably characterized by a lower emissivity-absorptivity in the infrared, as expected in a carbon compound with a more organic nature than mature soot. Particles formed along the centerline seem to have a slightly lower value of emissivity than particles produced on the wings. Here, only the first point close to the burner surface has a very low value of emissivity. Emissivity then increases more rapidly with respect to the centerline, probably because of the higher temperature experienced by the particles. Above Z/H
t = 0.7, a reduction of the emissivity is observed, which is probably due to oxidative processes. In the flames with the lower equivalence ratios, particles in the central region of the flame are hardly detected. Particle emissivity can be only measured along the wings and in the upper part of the central region, where the streamlines along the wings approach the central axis.
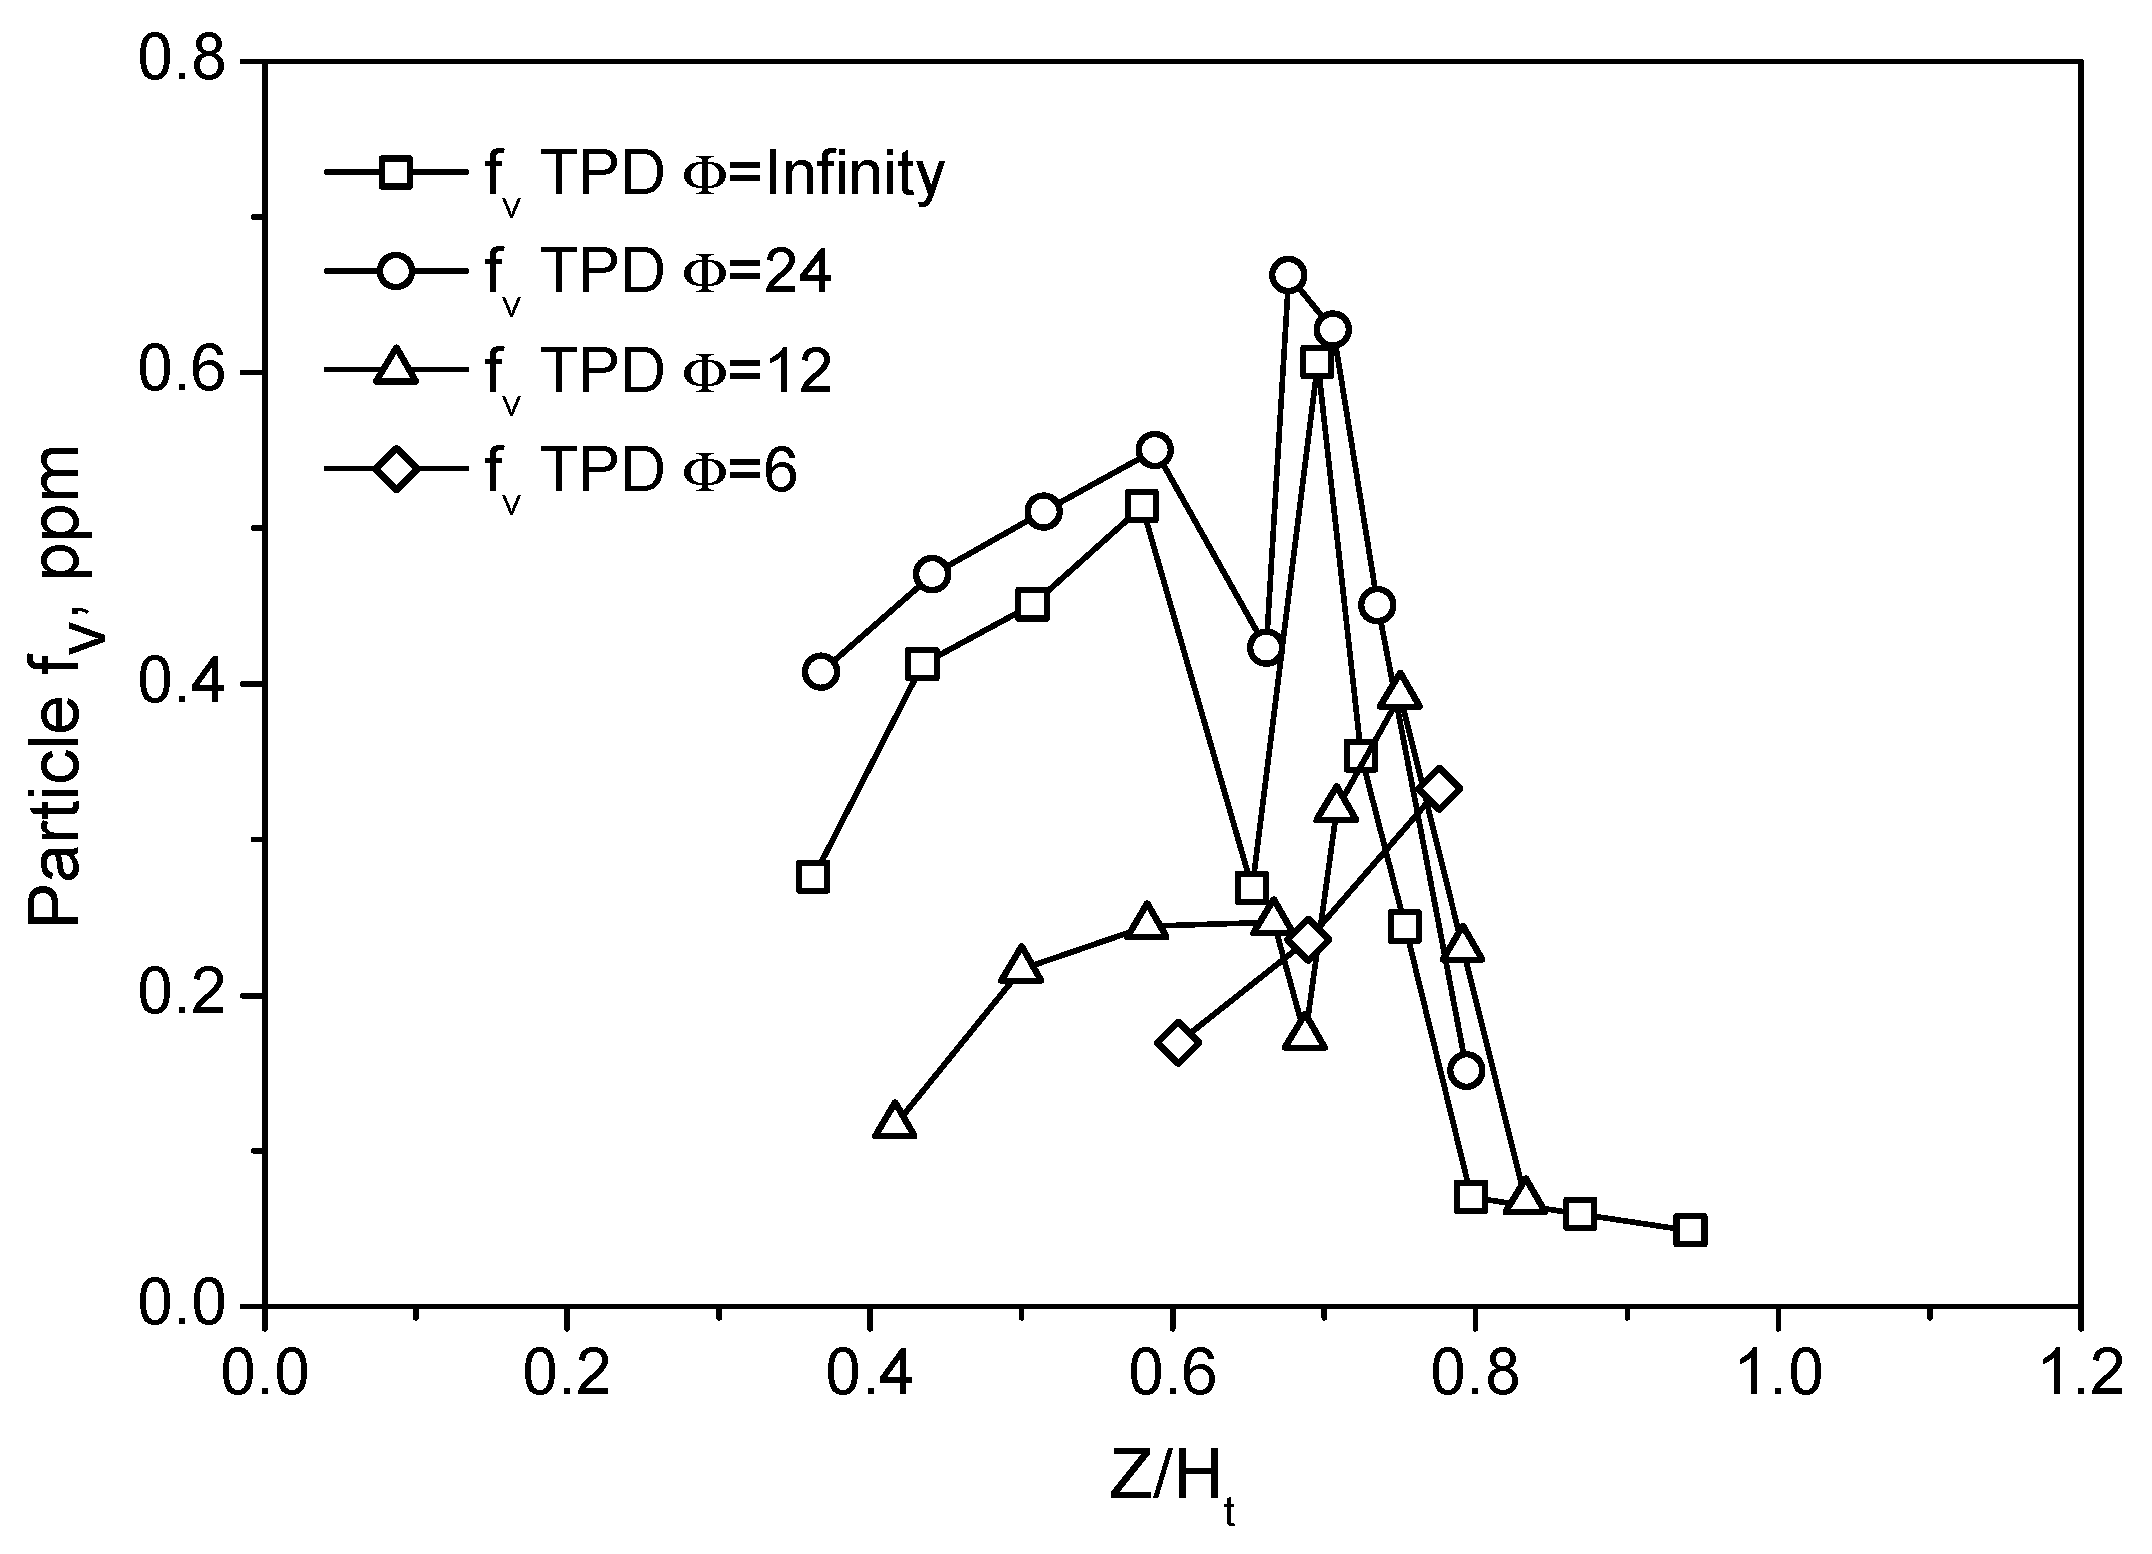
Centerline particle volume fractions in the four flames are reported in
Figure 5 as function of the non-dimensional Z/H
t. From
Figure 5, it is evident that TPD is able to measure particle f
v with a sensitivity of approximately 0.1 ppm in the center of the flame, where particles have an emissivity value lower than the typical value reported for soot [
18]. Increasing the premixing has the initial effect of increasing the particle concentration from Z/H
t~0.3. As previously hypothesized [
18,
24], this is probably due to the increase of the radical pool promoted by the oxygen addition, while the competitive effect of increasing dilution probably prevails when the primary air is further increased, and a reduction of the particles’ volume fraction is thus measured. The behavior of the curves for Z/H
t is better understood from the comparison with the OH profile discussed later.
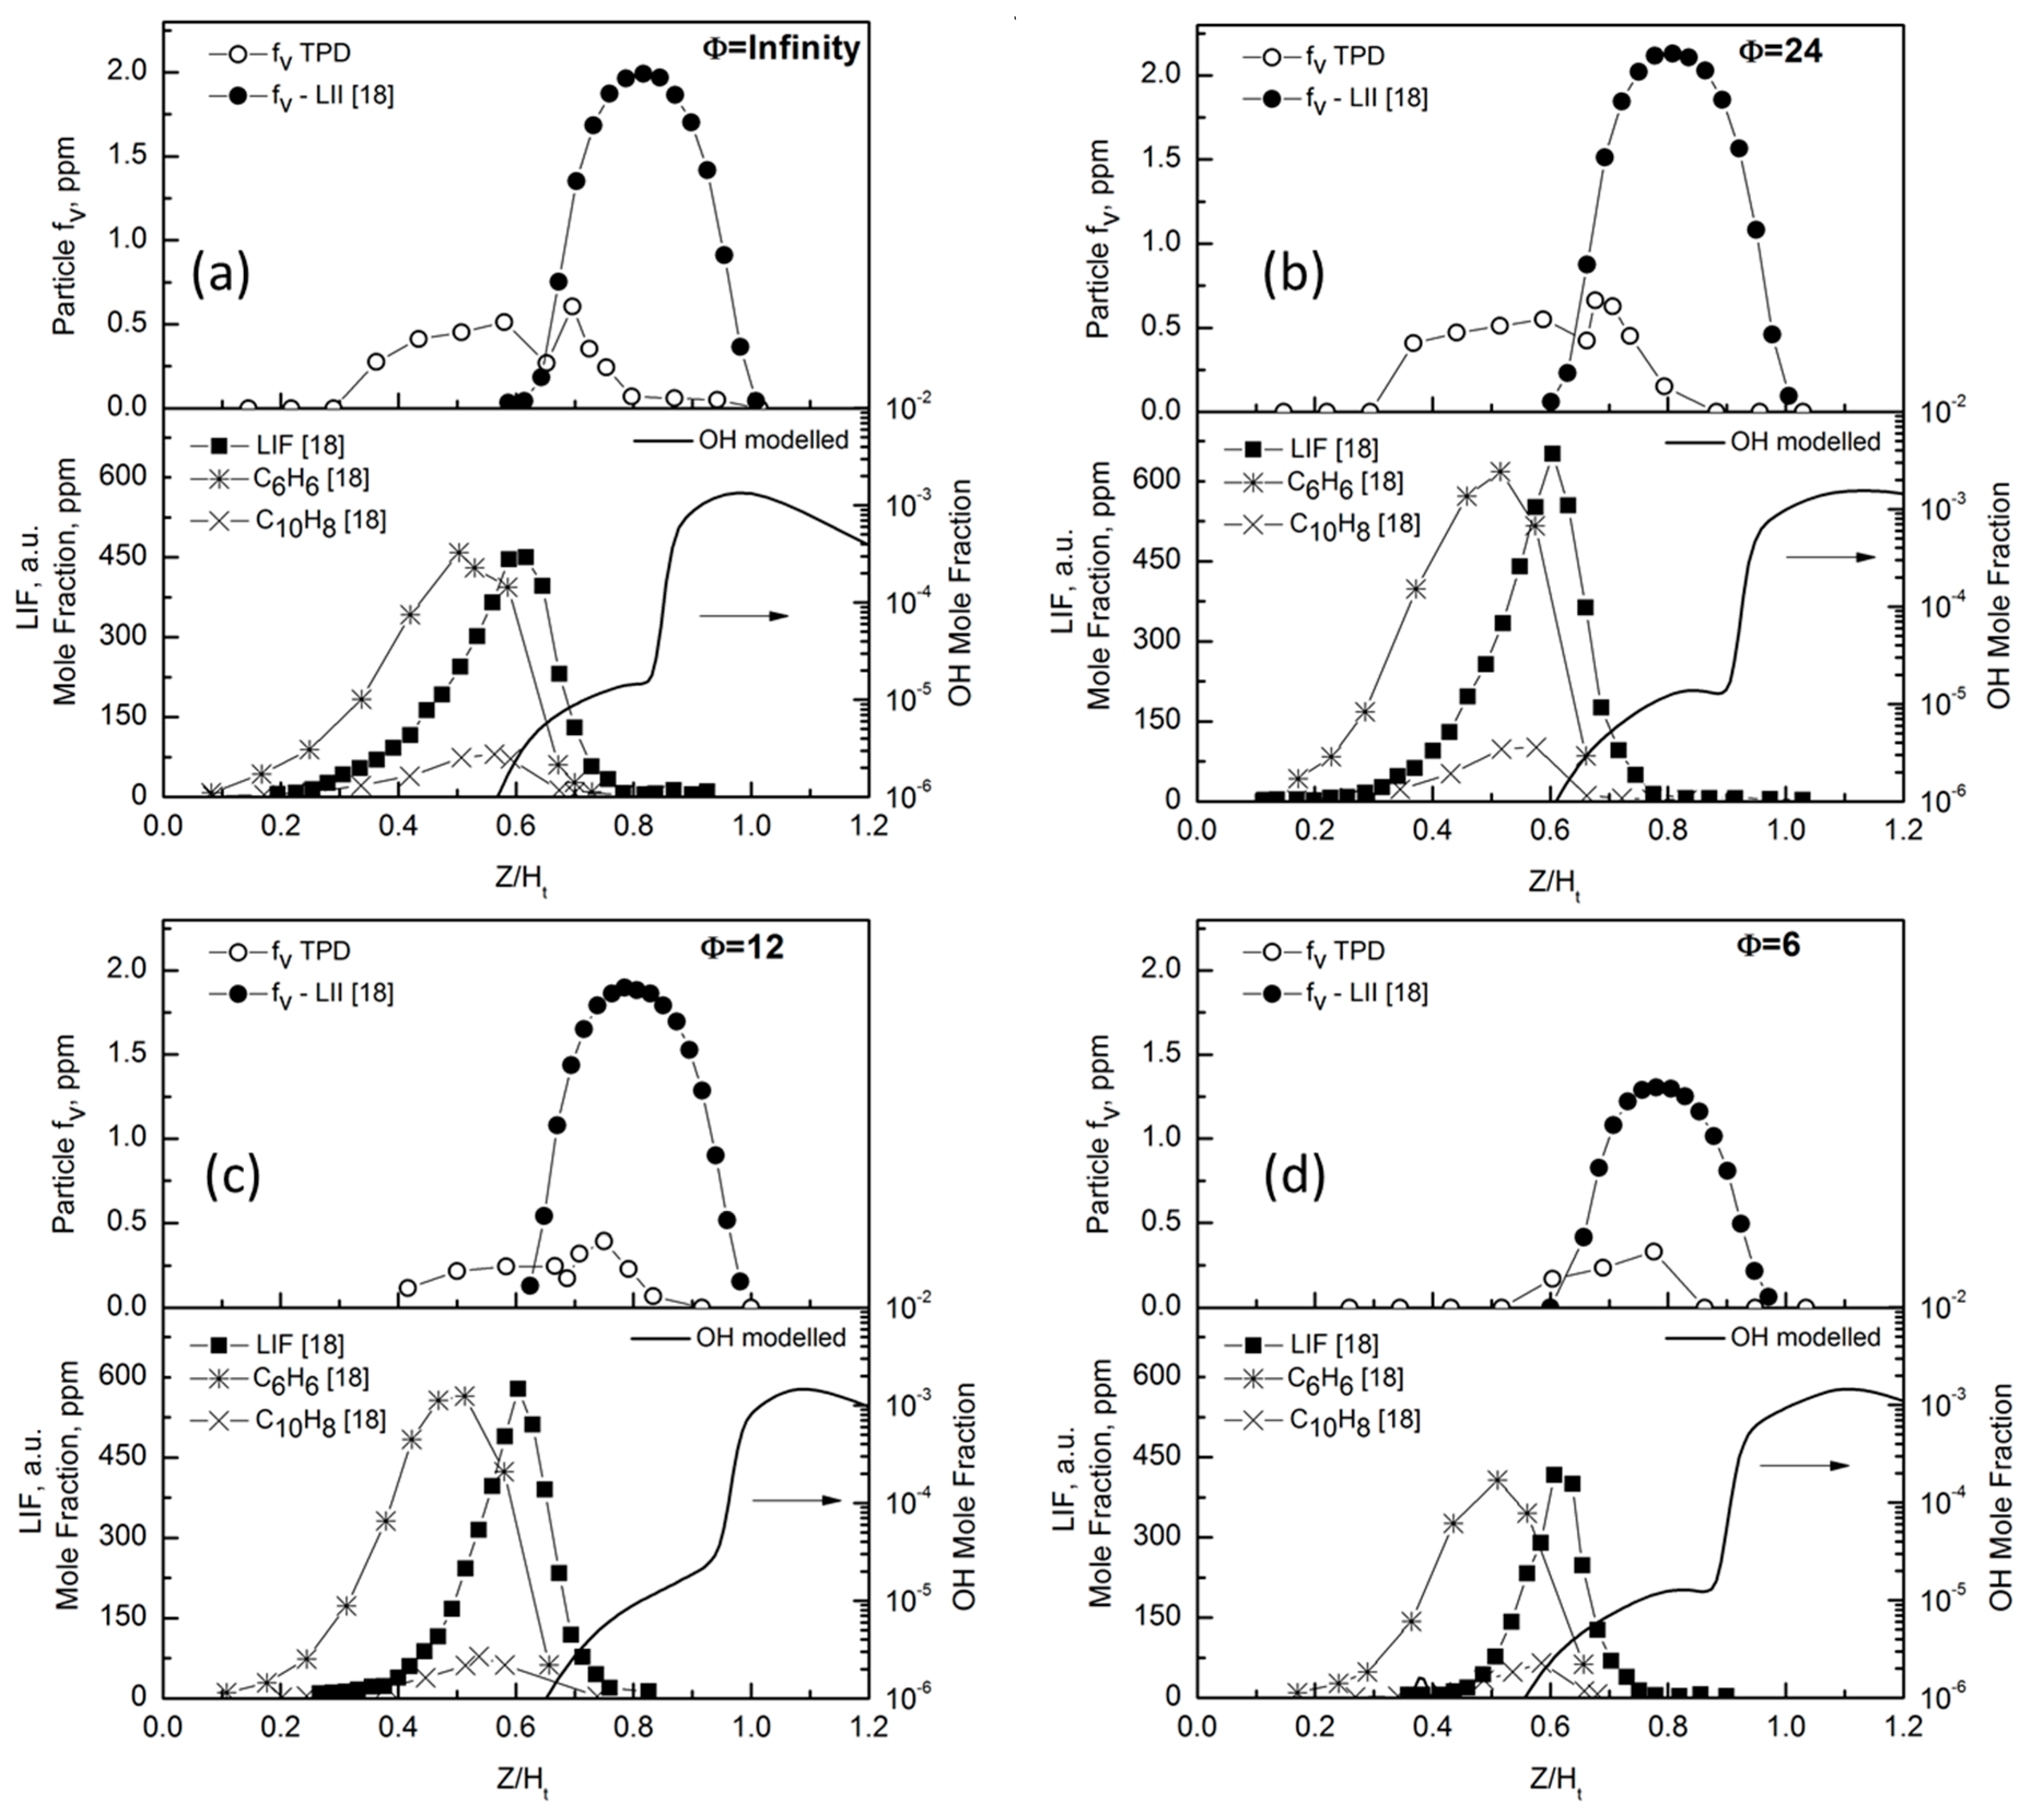
To better understand the nature of the particles measured in the central region of the flame, in
Figure 6 the f
v profiles evaluated by TPD are compared to the soot volume fractions profiles measured by laser induced incandescence (LII) together with the concentration profile of some aromatics and the laser induced fluorescence (LIF), reported in [
18]. We observe that, in all the flames, the soot volume fraction measured by TPD, f
v TPD, starts much earlier than the soot volume fraction measured by LII, f
v LII. The on-set of soot particle formation appears in a flame region rich in PAH molecules. The non-monotonic trend of f
v TPD at increasing premixing follows the same trend as major PAHs and soot LII.
It is also clear that particle volume fraction can be measured by TPD in the flame region where OH concentration is negligible, as evidenced by the modelled OH concentration profile also reported in the lower panels in
Figure 6. Particularly, when the OH mole fraction exceeds the value of 10
−6, the f
v TPD significantly deviates from the values obtained by LII and cannot be measured at the OH value of 10
−5. Indeed, in the flame region where soot oxidation occurs, an additional term needs to be considered in Equation (2) to account for the mass removal by the oxidation of the soot deposited on the thermocouple. Previous works showed that in non-smoking diffusion flames, hydroxyl radical is the dominant oxidant [
24], and the rate of OH oxidation is generally described by a collision efficiency Г
OH. This efficiency represents the fraction of OH collisions with a particle resulting in the removal of a carbon atom times the collision frequency [
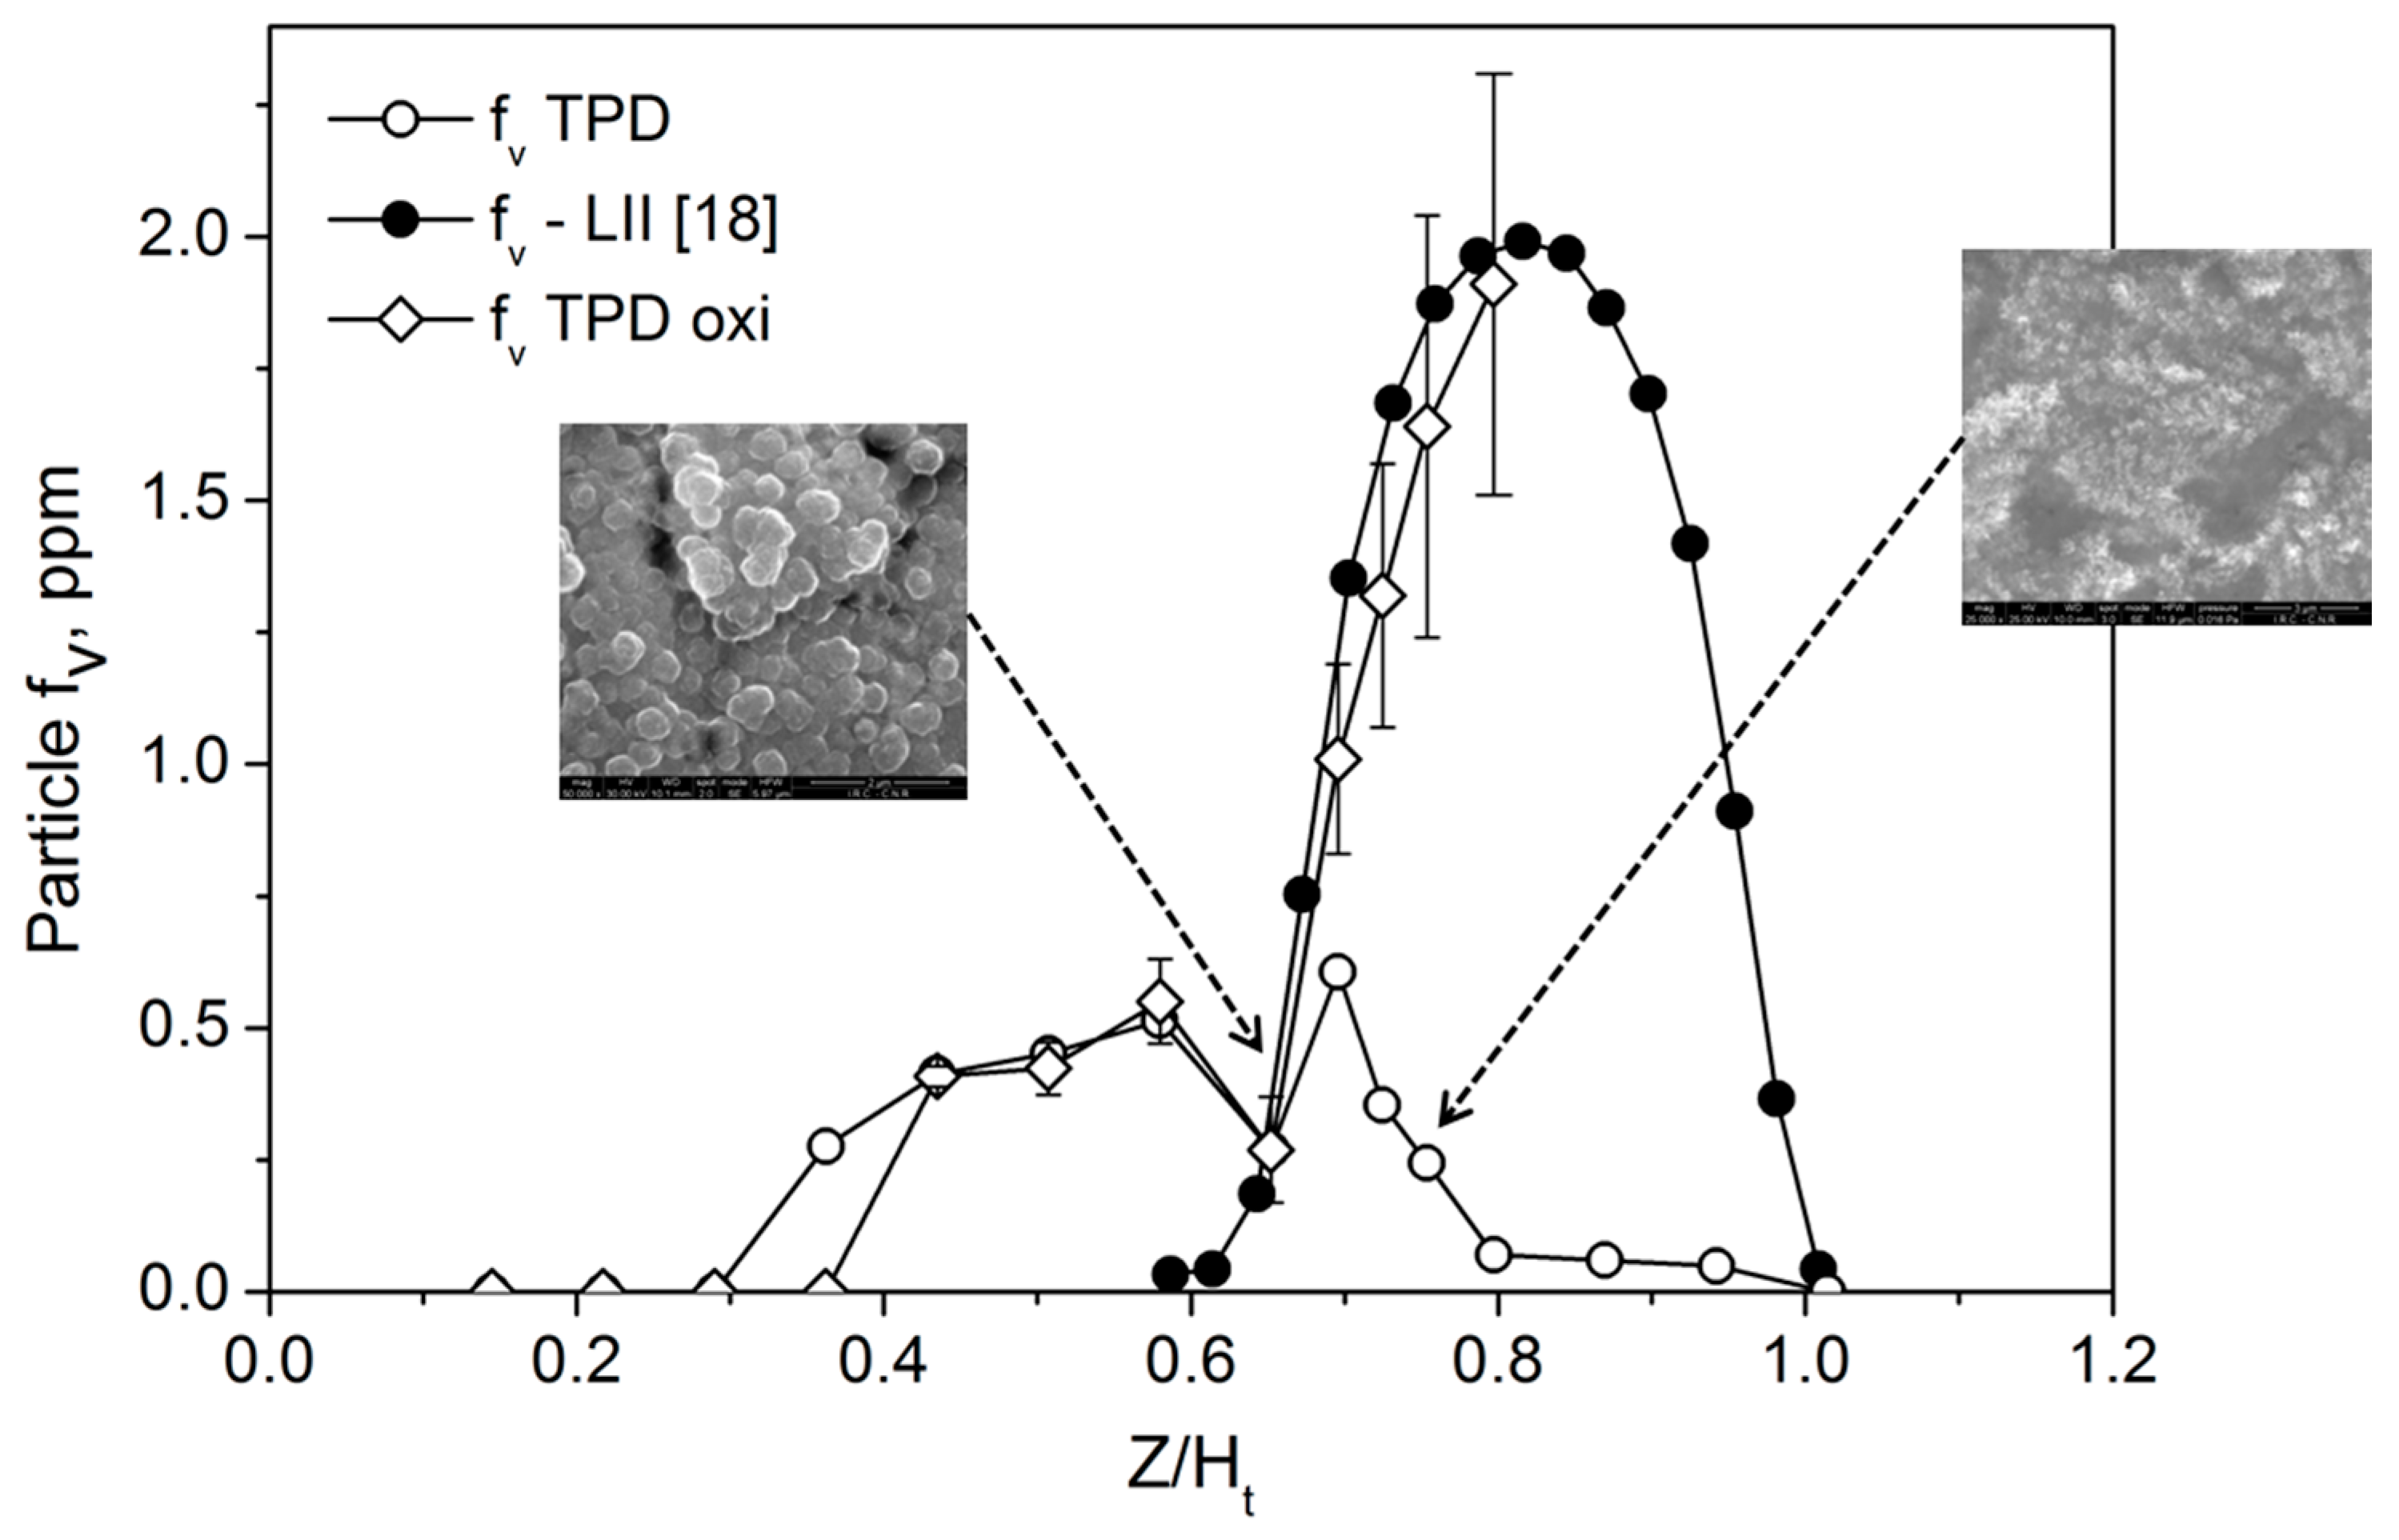
25]. Therefore, to account for the soot oxidation on the thermocouple, we included the soot oxidation rate, W, in the mass balance Equation (2). In the expression of W, we included a multiplicative factor, S, to account for the increase of the exposed surface to oxidation, with respect to πd
j2, due to surface roughness. Internal burning by OH is not expected to have a major impact due to its high surface reactivity [
25]. S was experimentally measured by AFM, measuring the ratio of the surface area of the deposit to the projected area; it ranges between S = 3 at Z/H
t = 0.6 and S = 15 at Z/H
t = 0.78. Representative SEM images of thermocouple coatings in the two conditions are also reported in the
Figure 7.
where W is the rate in kg/(m
2∙s), P
OH is the partial pressure of OH in atmospheres obtained from the model, and Г
OH is the collision efficiency assumed to be Г
OH = 0.13, as reported in the literature [
25].
Equation (3) has been added to Equation (2) to account for the mass removal of soot deposited on the thermocouple by oxidation via the OH radical. The expression of mass balance with the modeled OH thus obtained has been then coupled to the energy balance of Equation (1) to tentatively evaluate particle f
v along the axis of the flame. The results are reported in
Figure 7 as a function of the non-dimensional Z/H
t.
