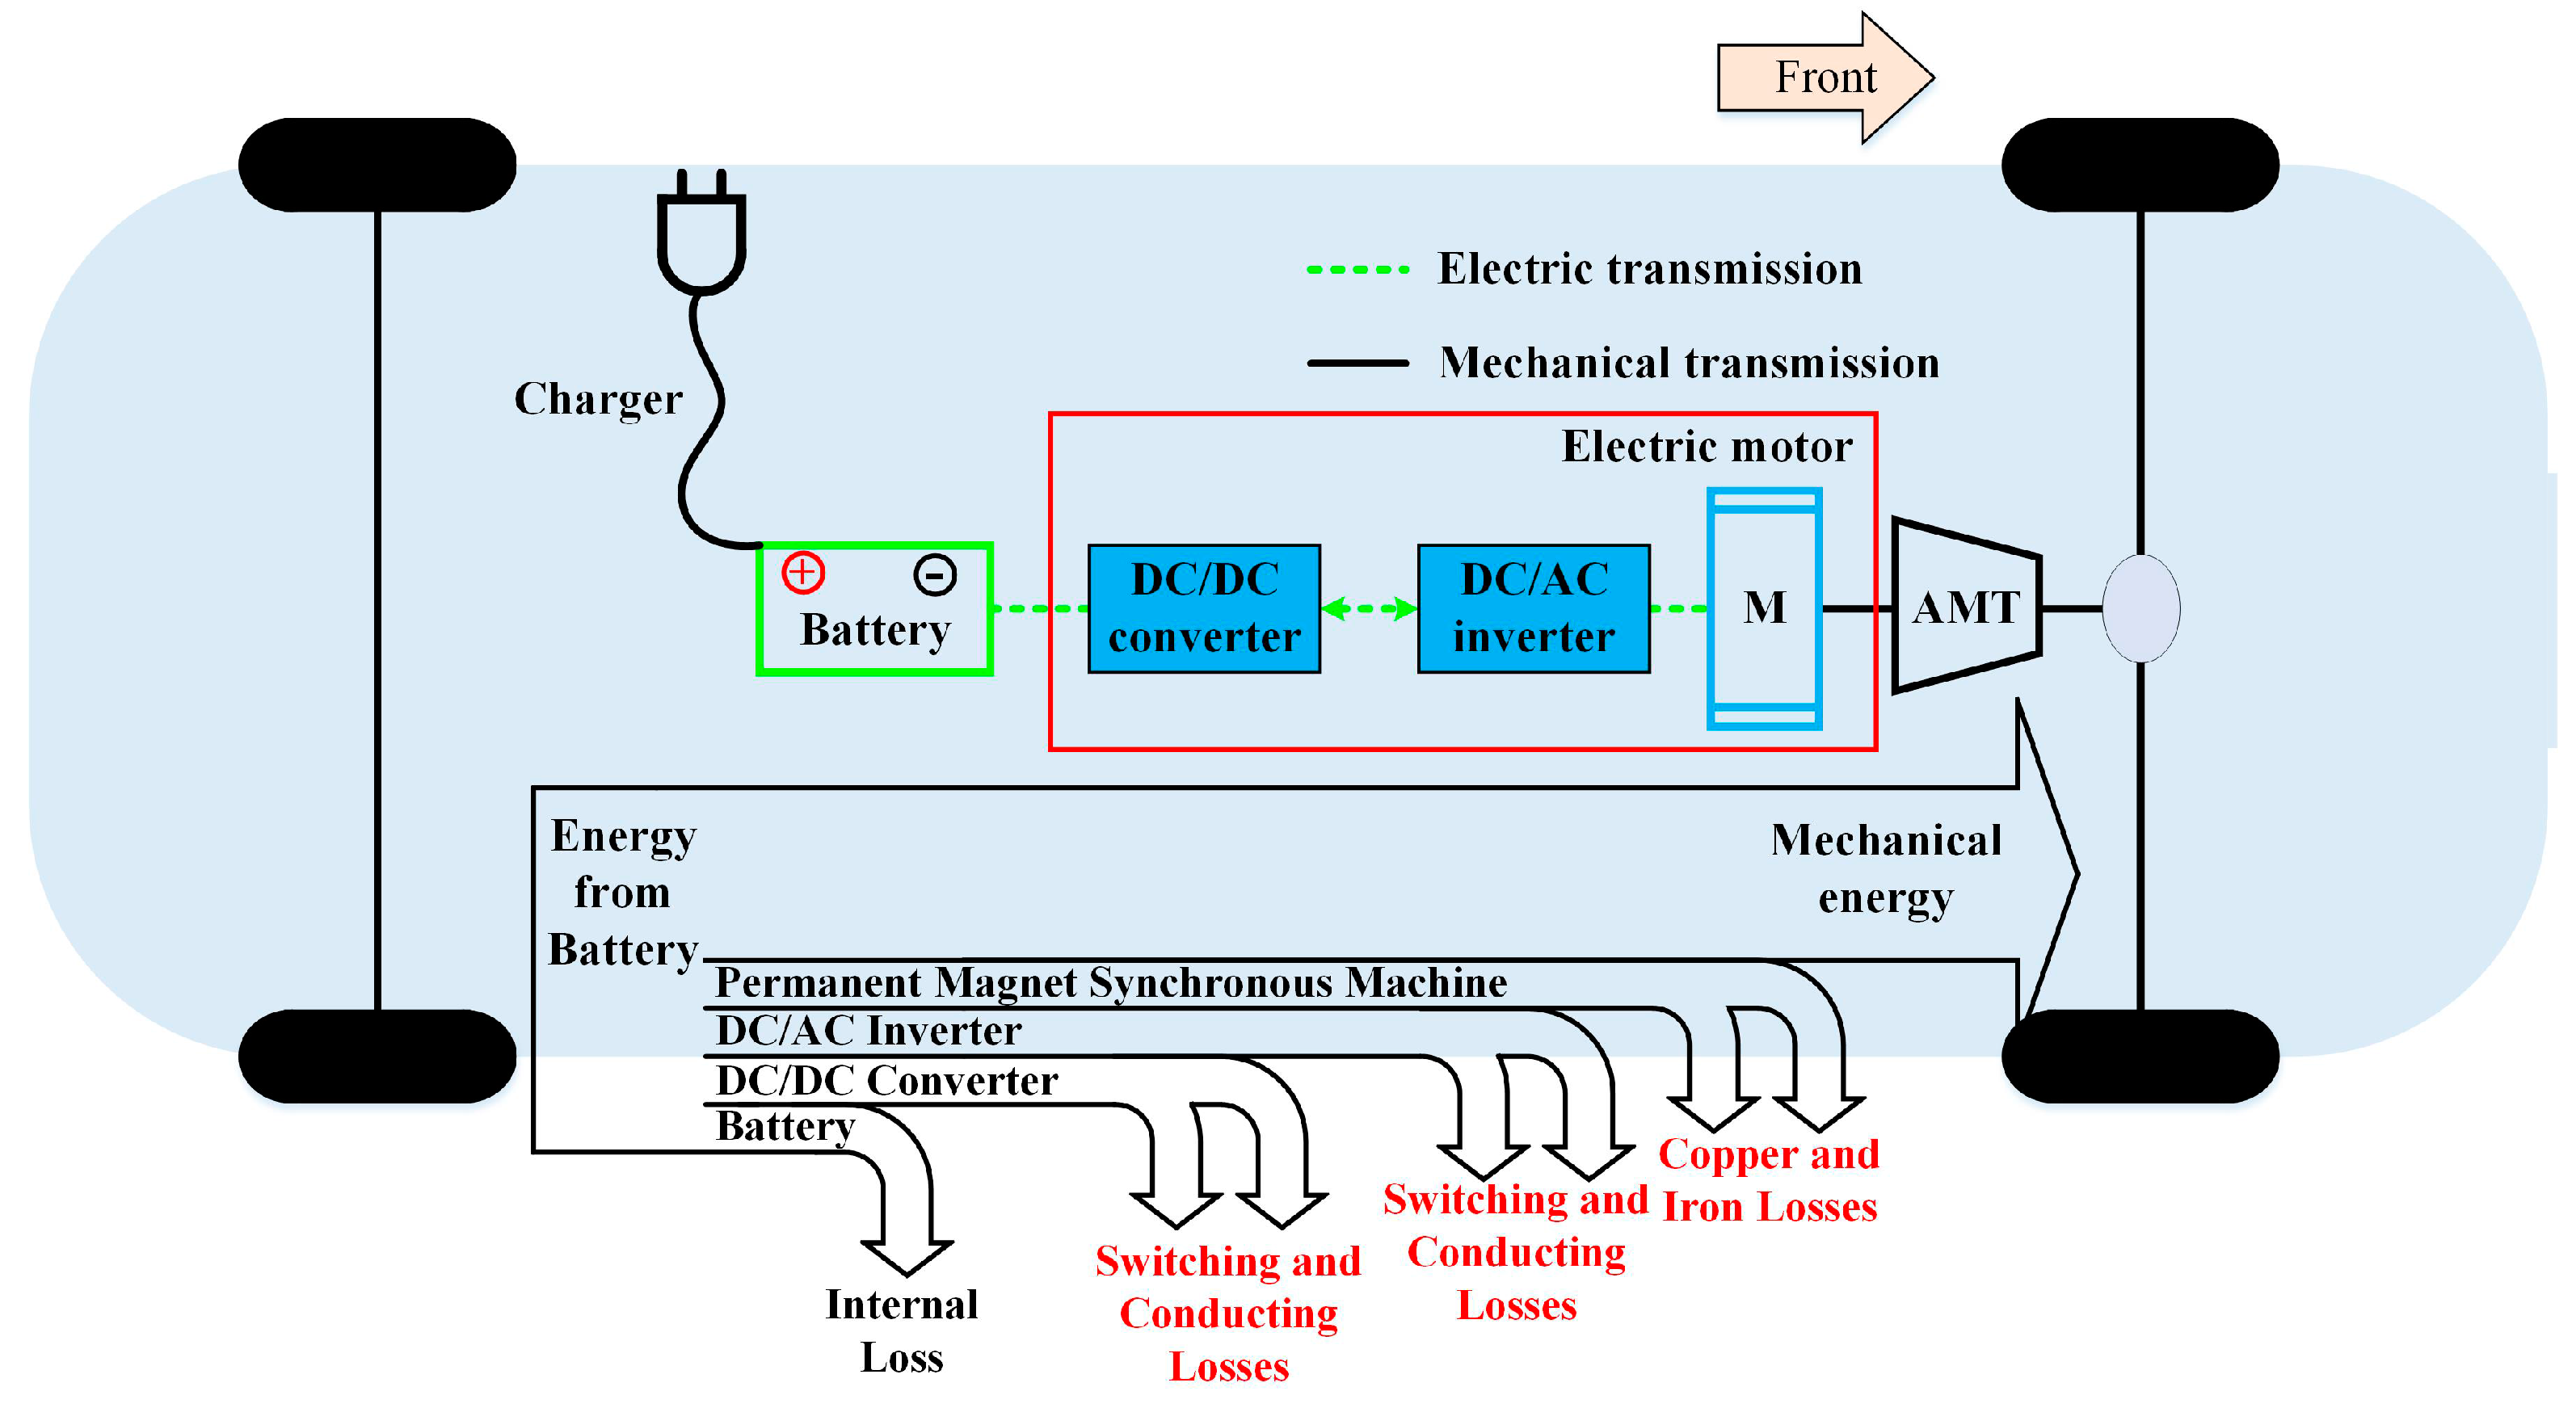
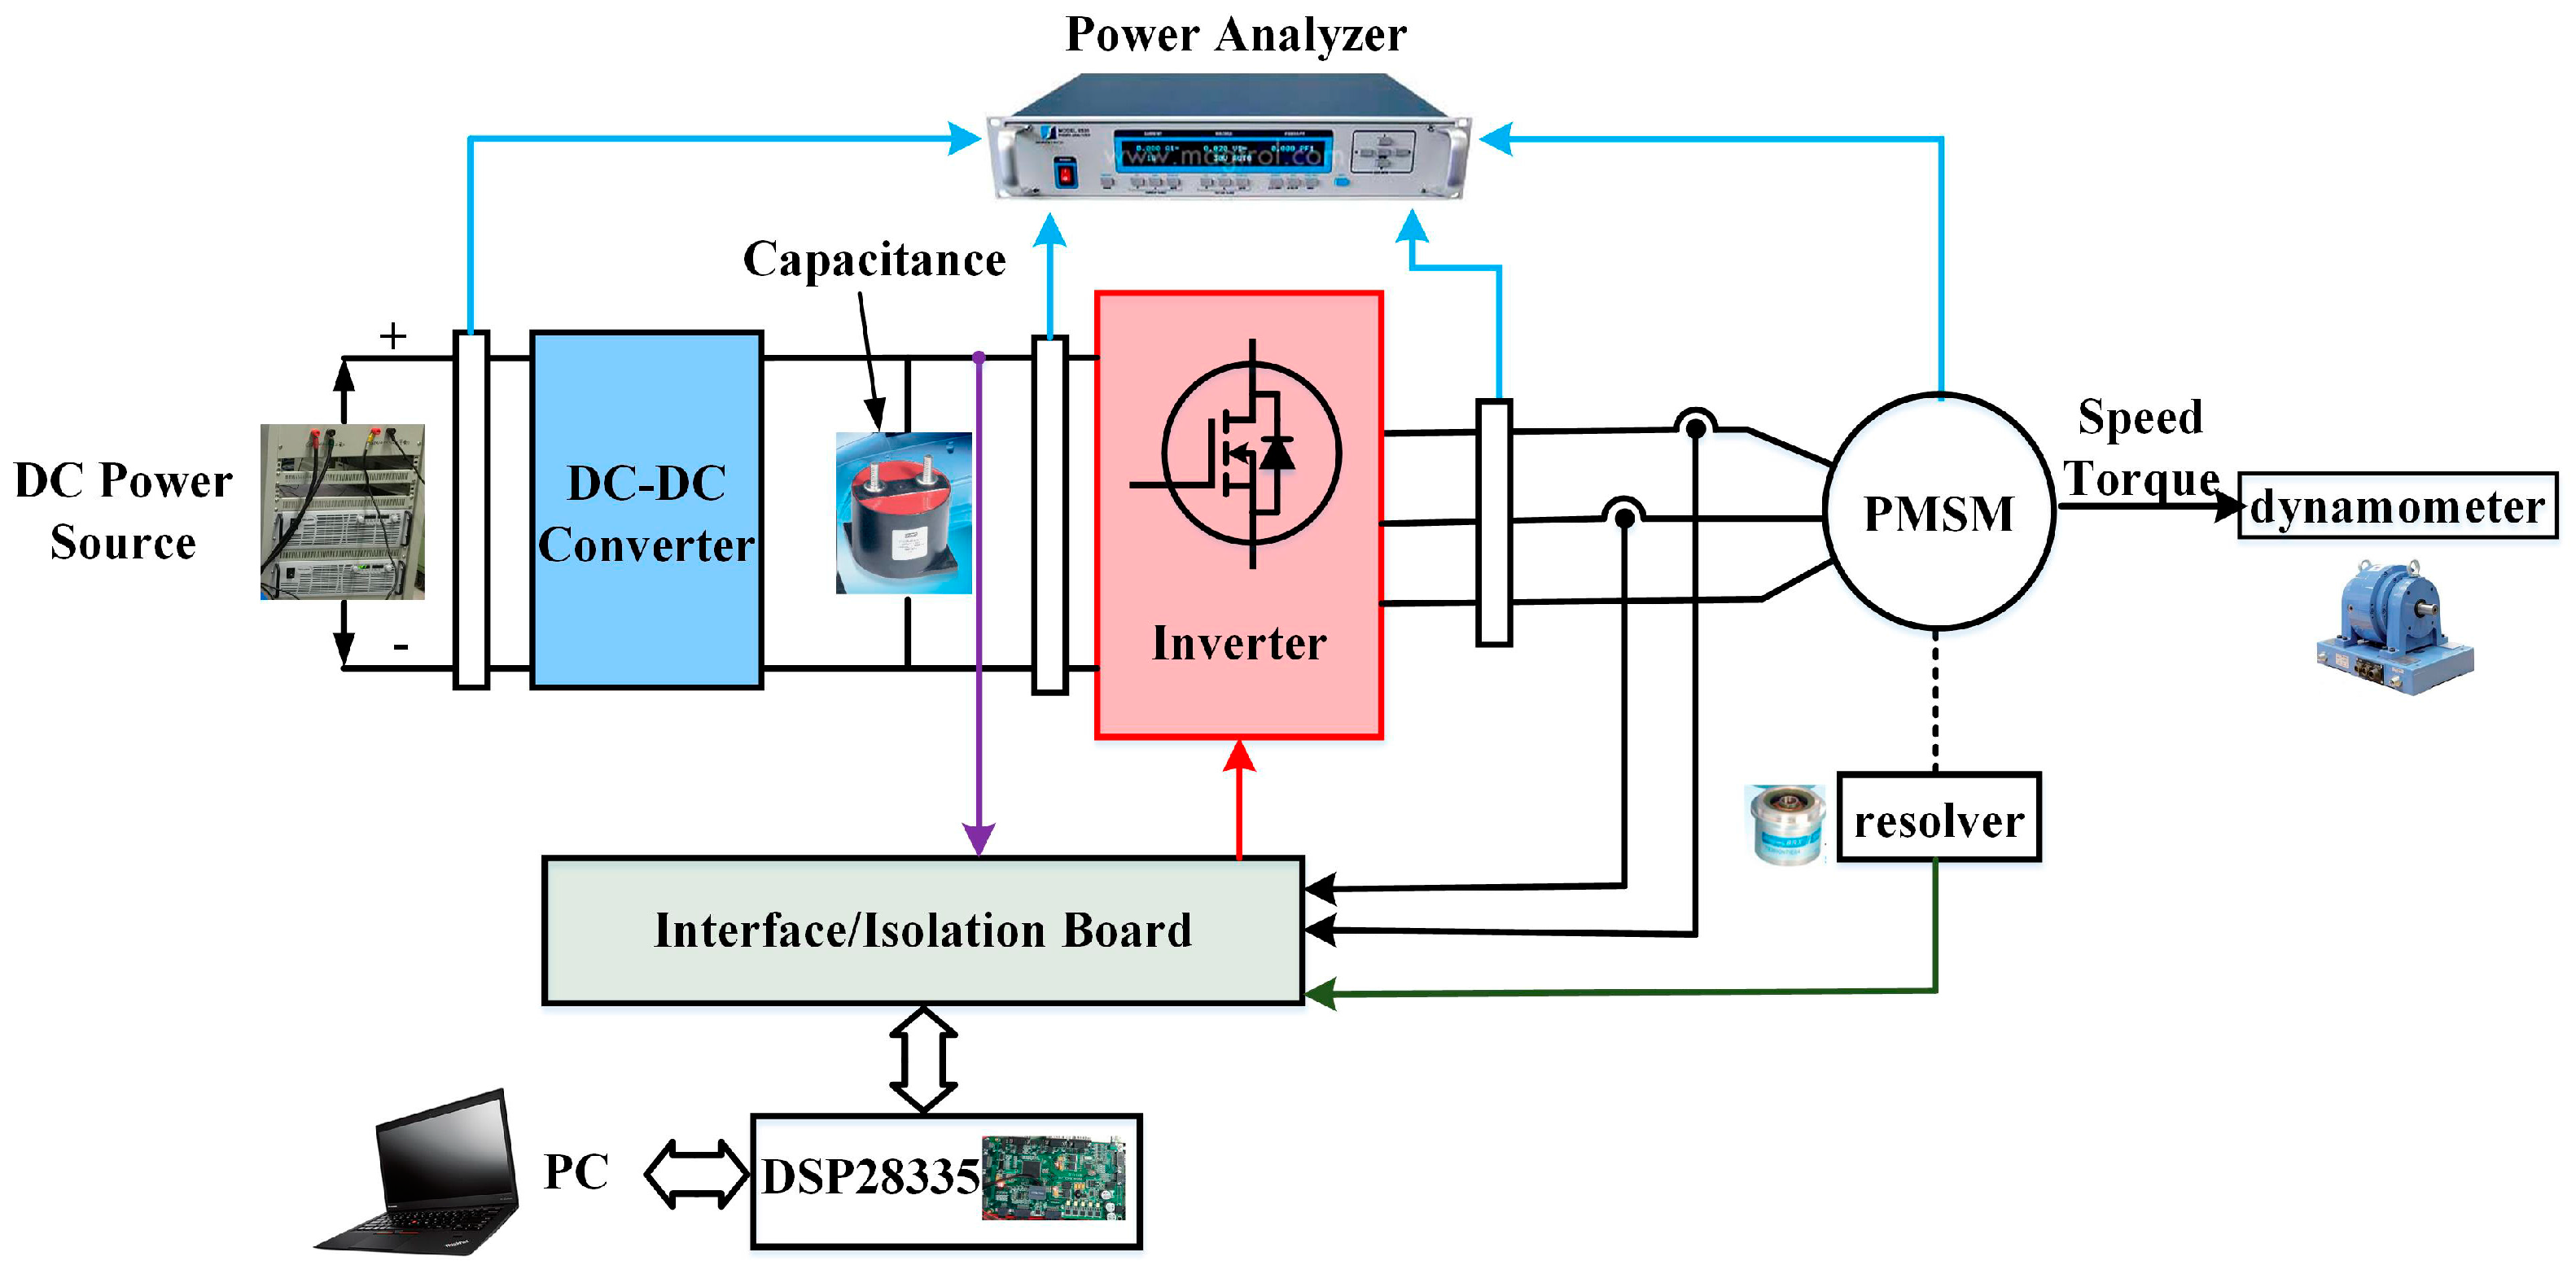
The efficiency of the powertrain system is investigated in this Section. An experimental setup for a powertrain system is shown in
Figure 6. There are three main components in the powertrain, namely the DC/DC converter, inverter, and PMSM. The main losses are switching and conduction losses of switching devices in both the DC/DC converter and the inverter, and iron loss and copper loss in the PMSM.
Both the voltages and currents of the DC/DC converter and DC/AC inverter are measured, respectively, by a Power Analyzer. Then, the efficiencies of both the converter and the inverter are obtained. Meanwhile, the output torque and speed of the motor are measured by a dynamometer, which are employed in the calculation of the efficiency of the PMSM.
3.1. Efficiency of a Buck-Boost DC/DC Converter
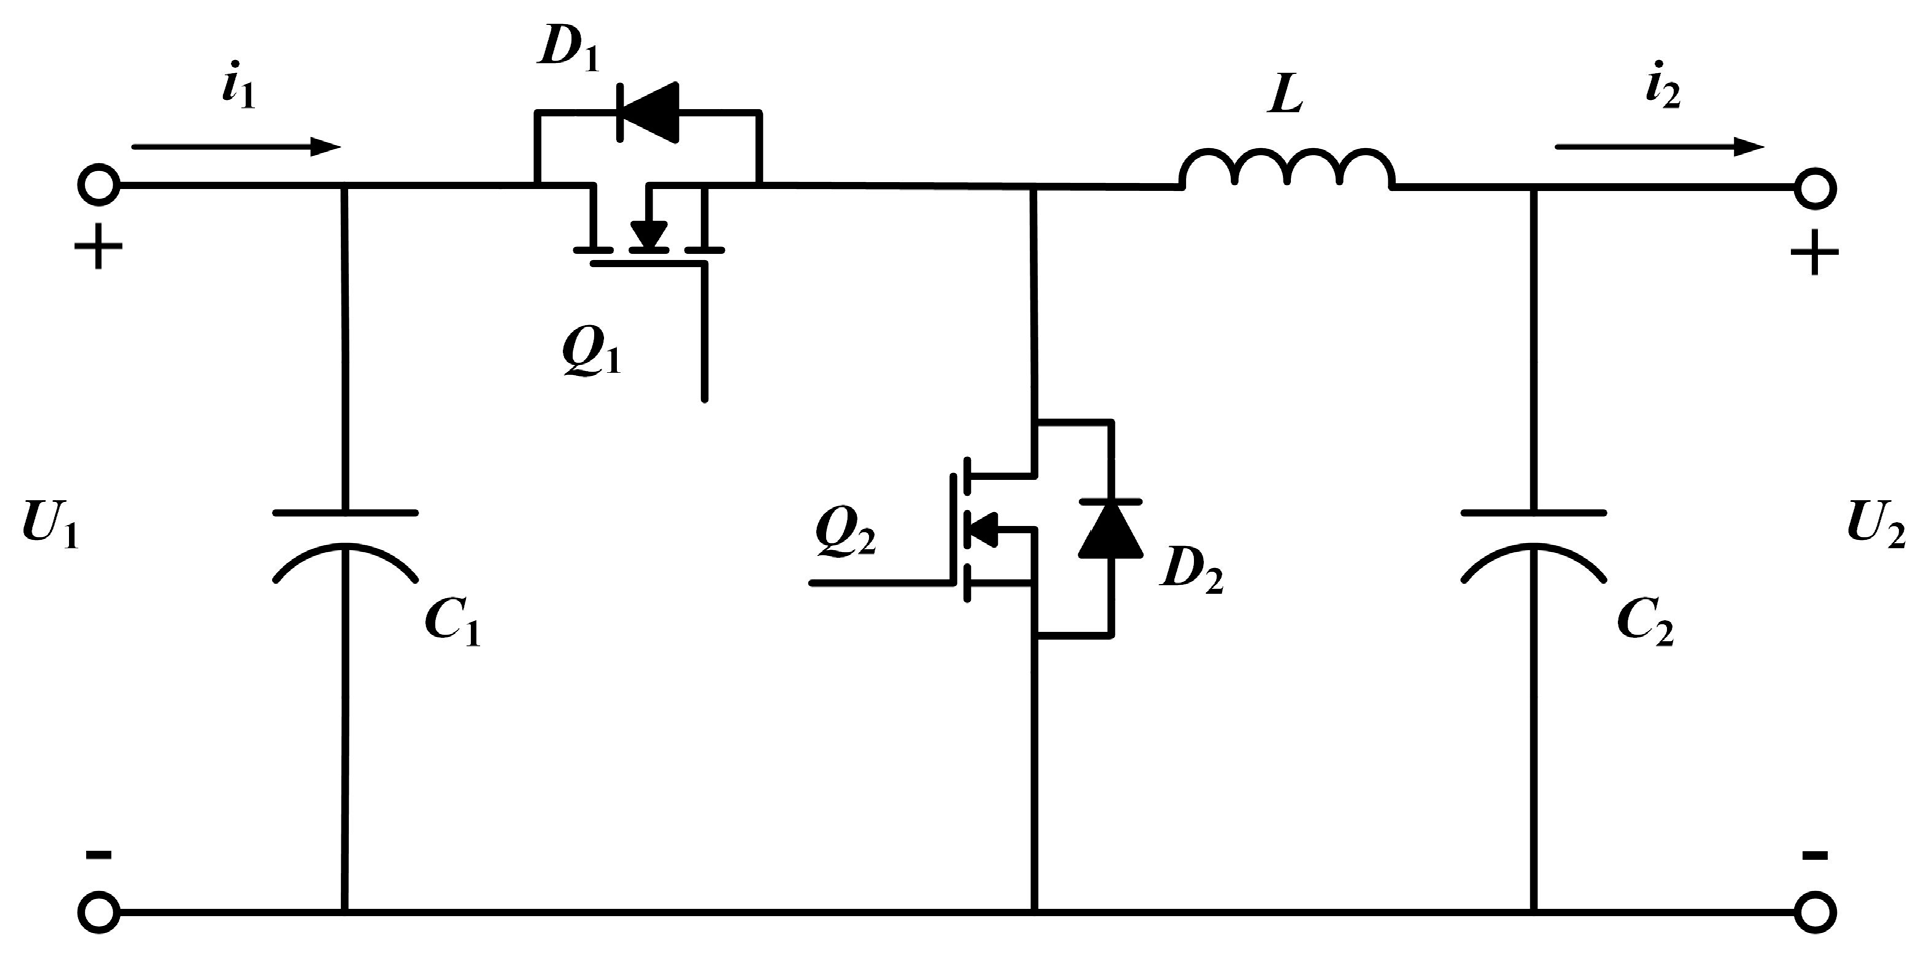
The fundamental topology of a buck-boost DC/DC converter is shown in
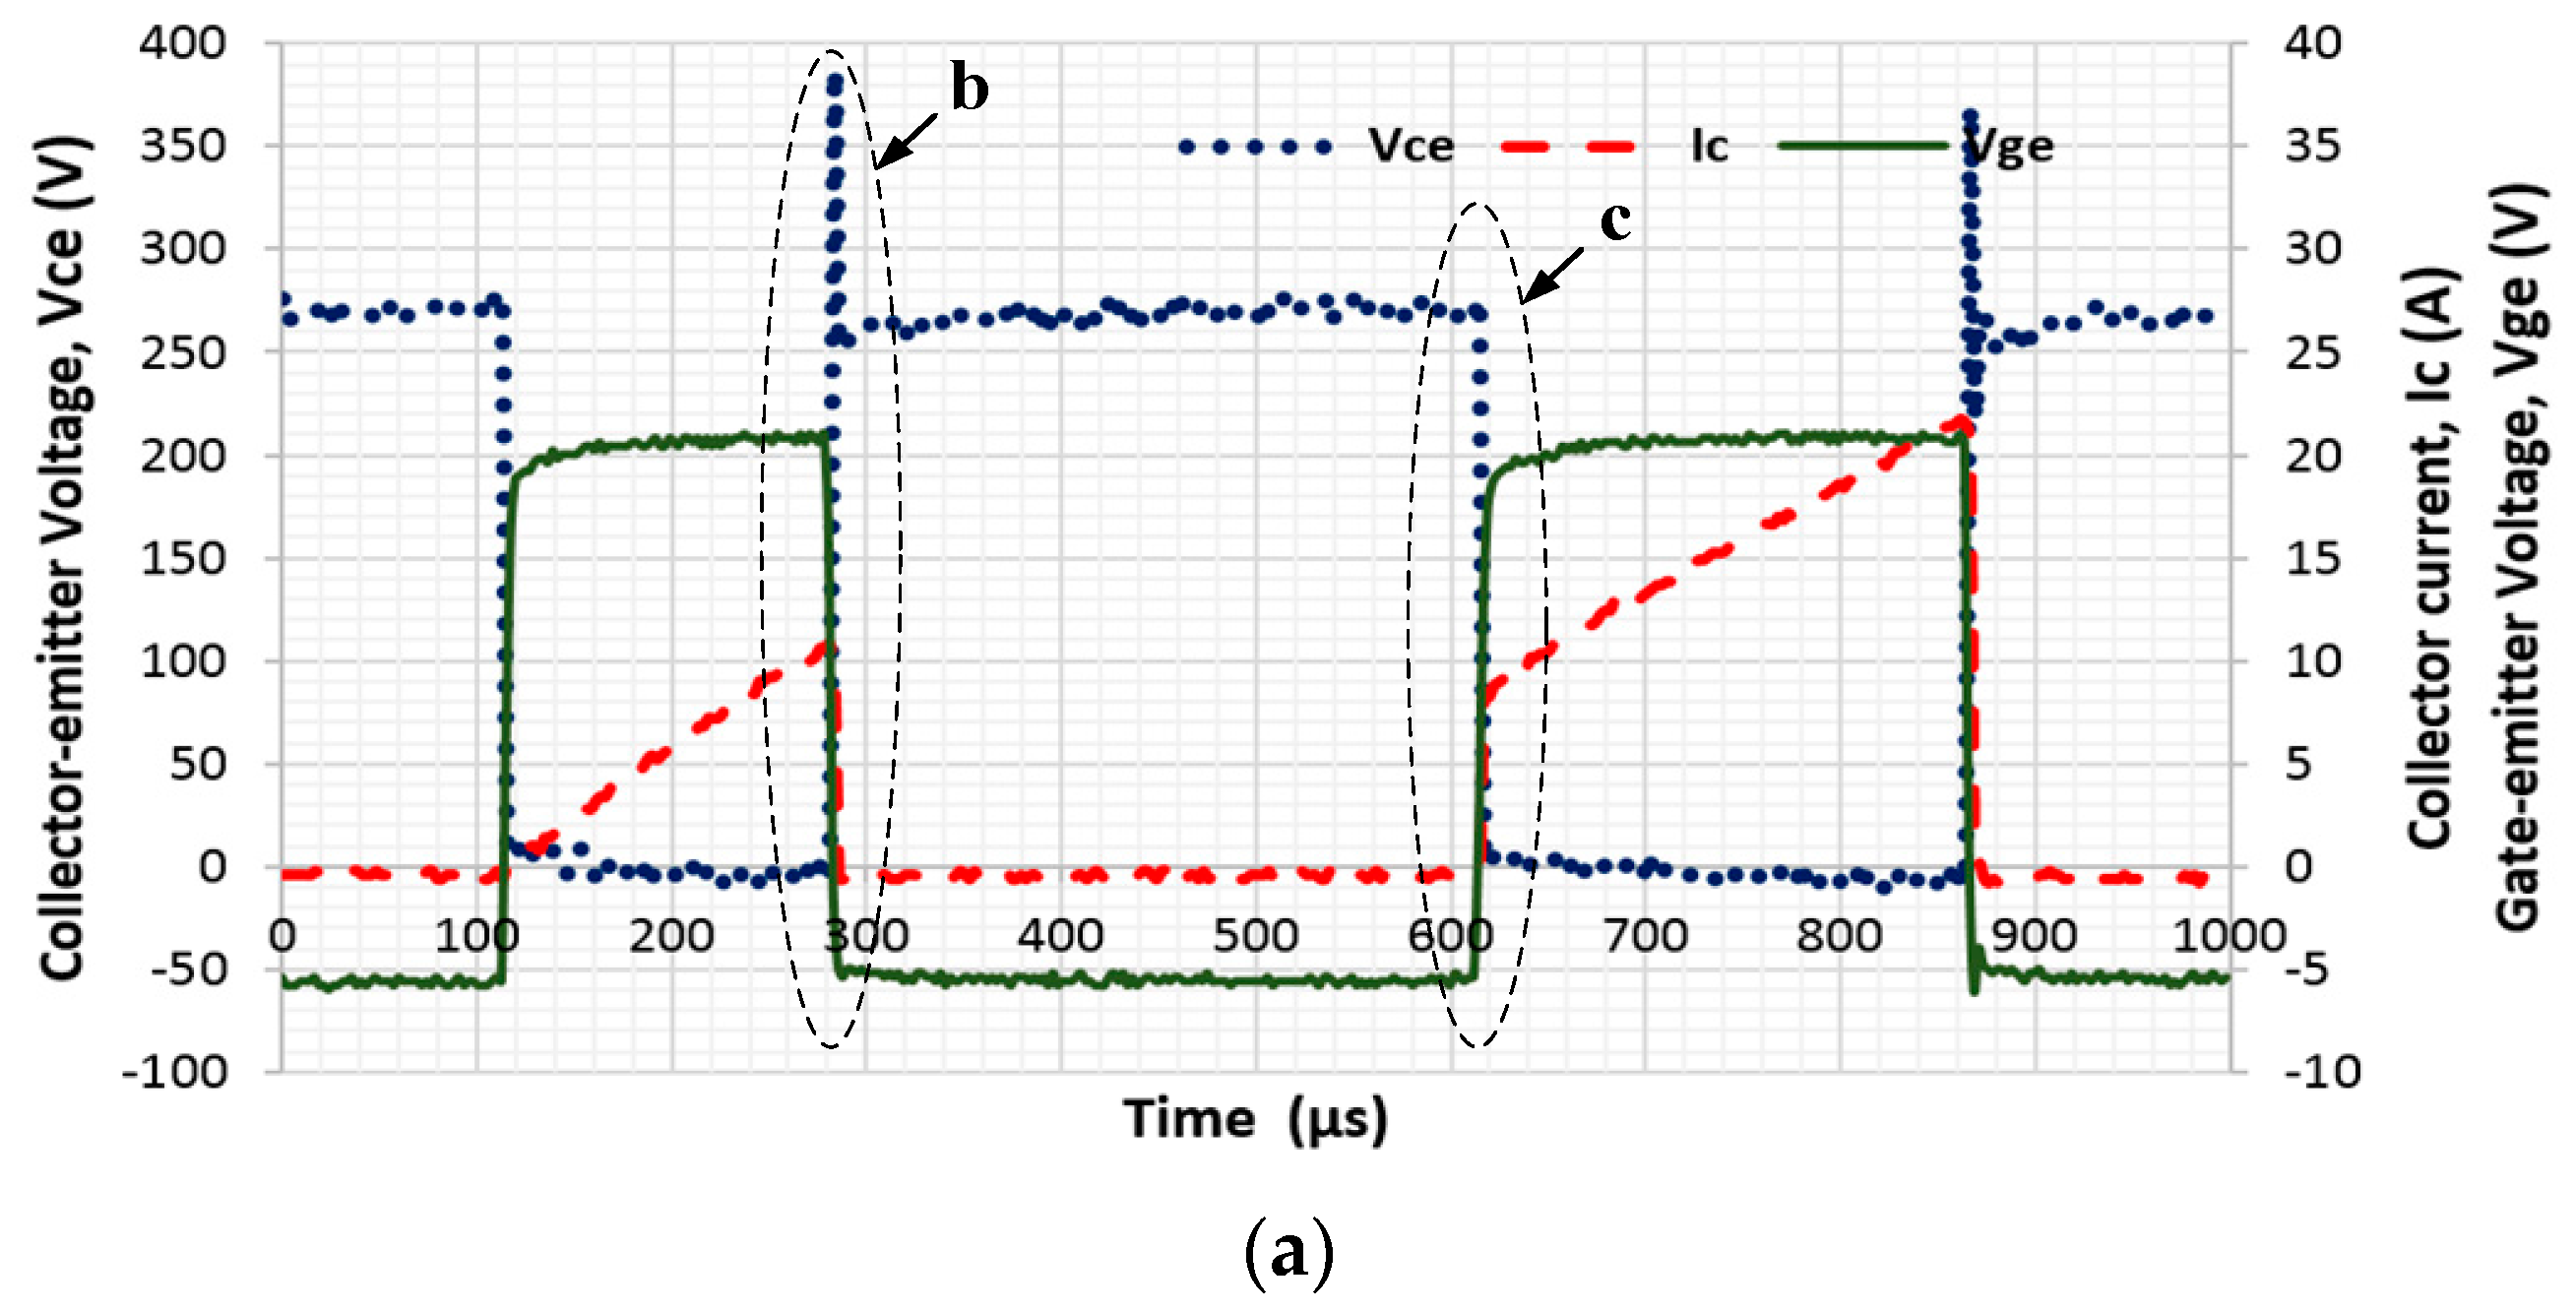
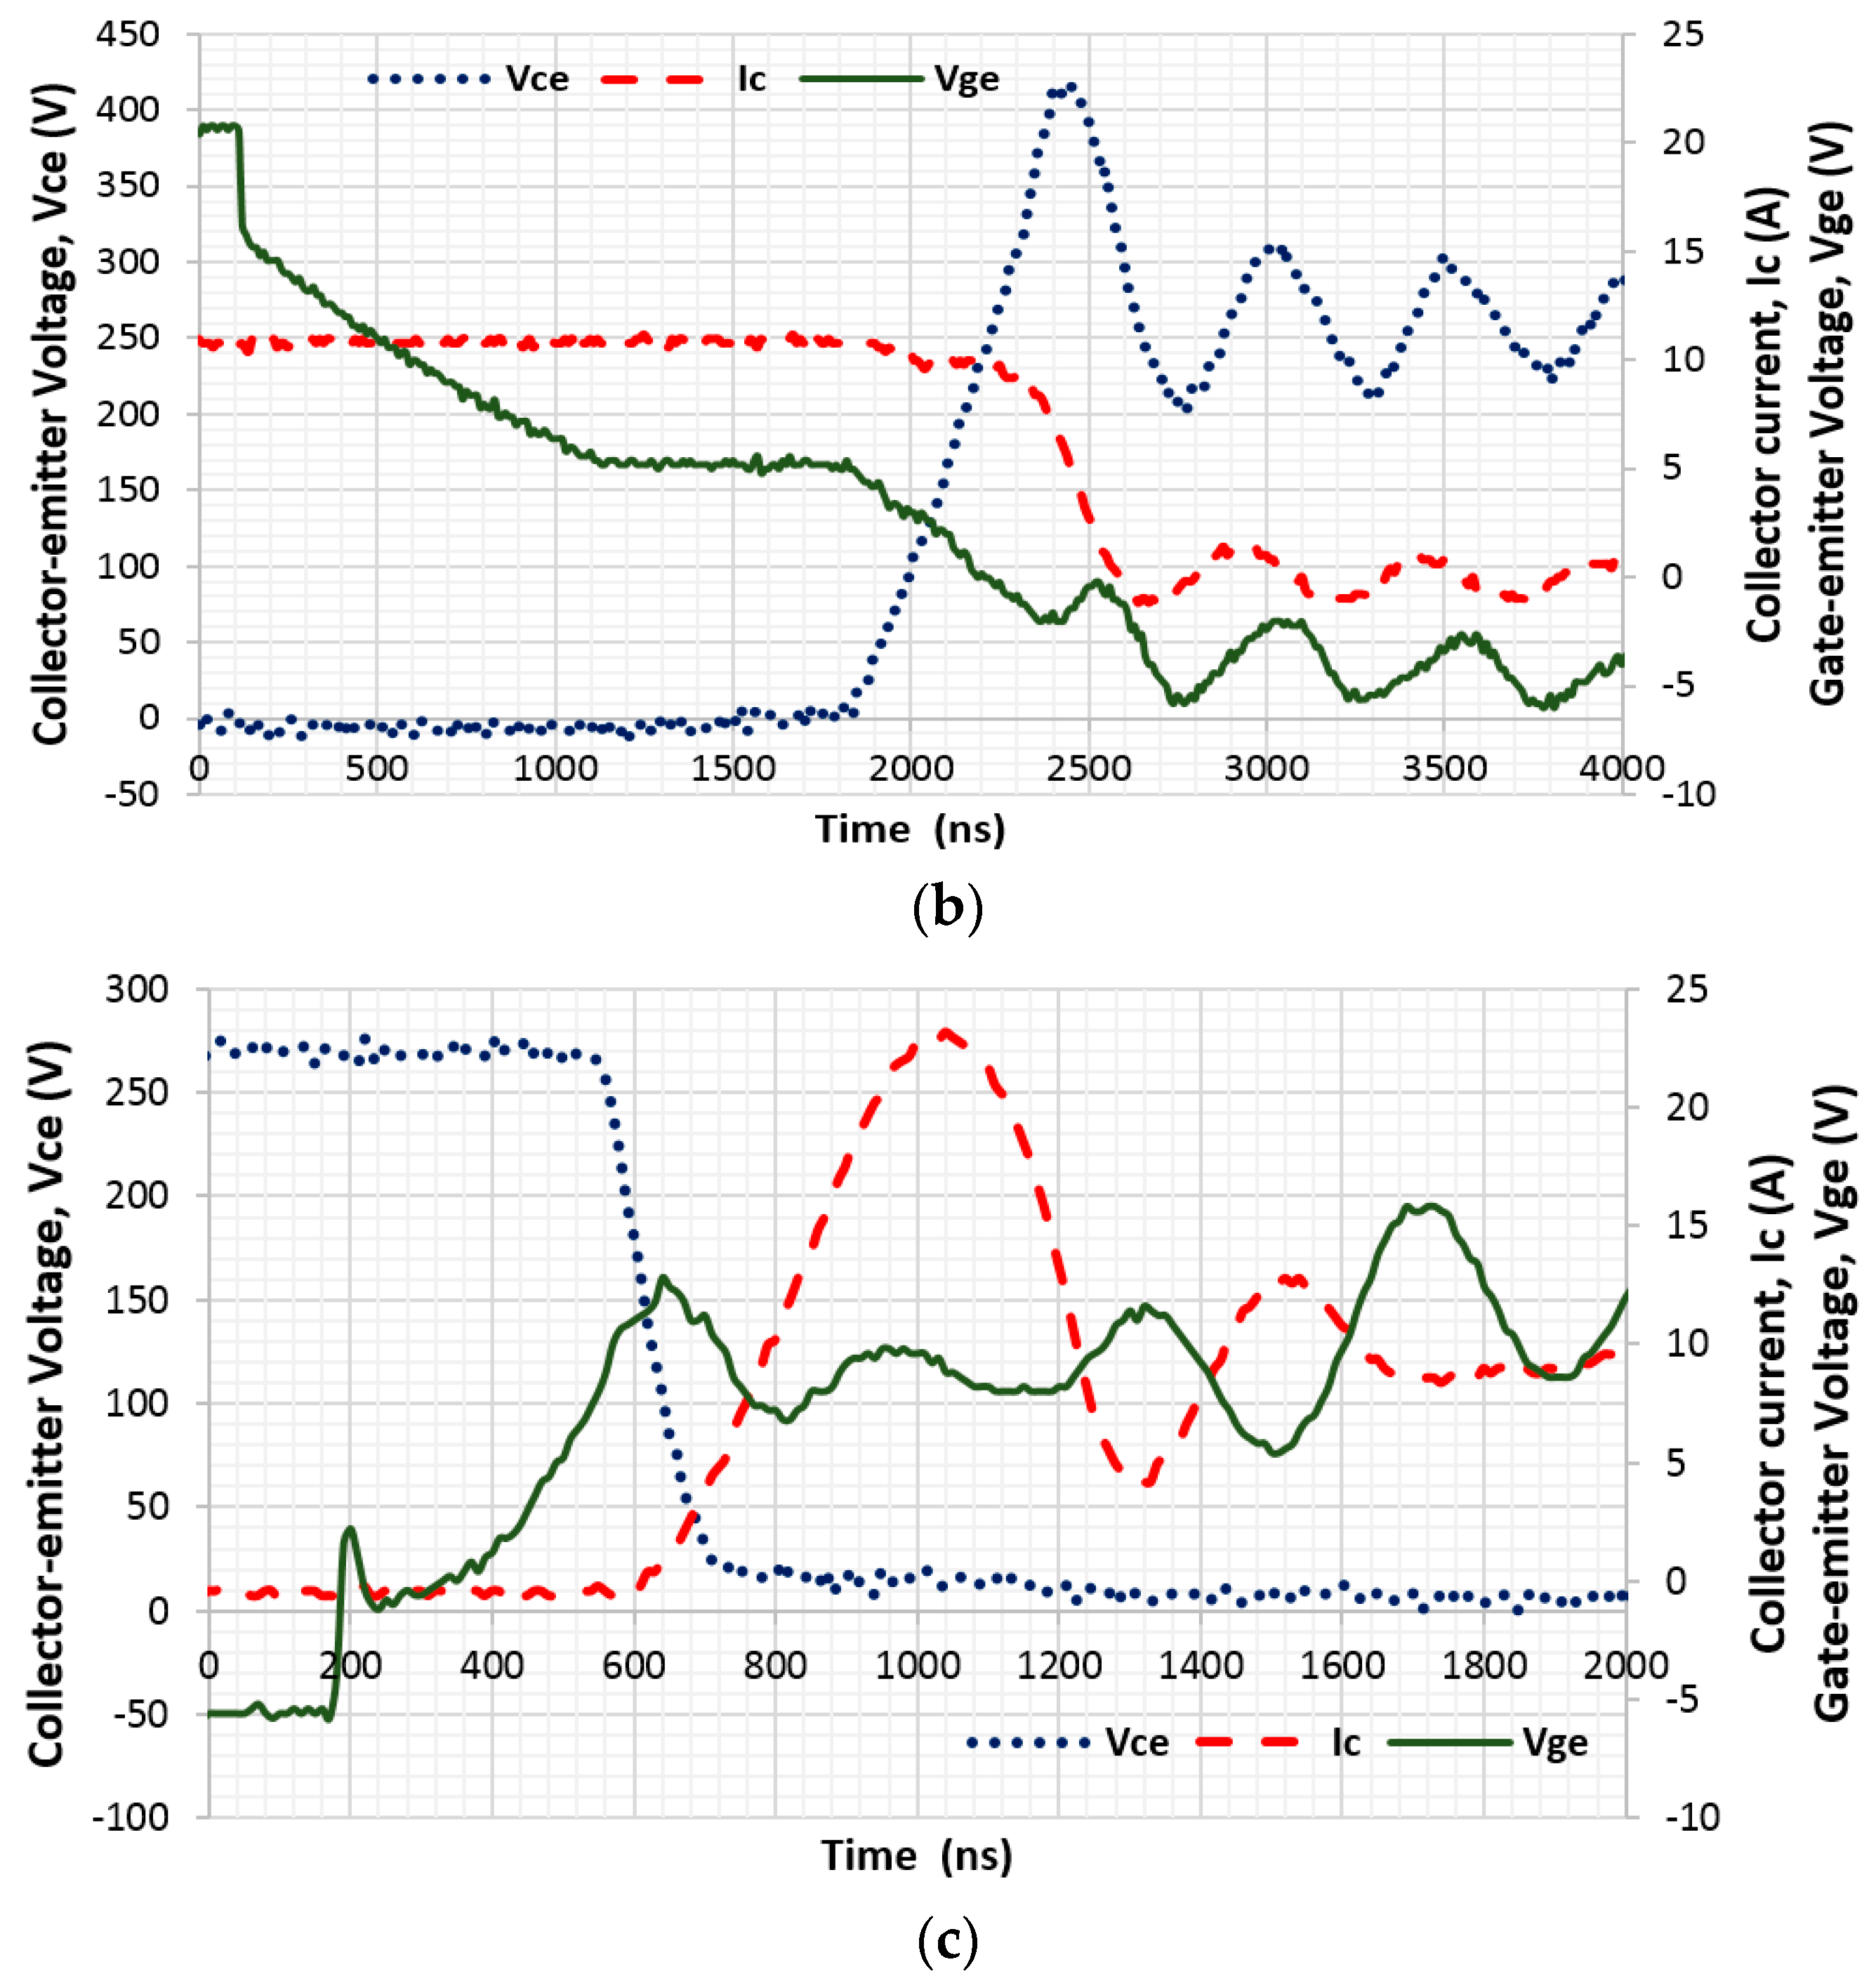
Figure 7. The buck-boost converter consists of two SiC MOSFETs (or Si IGBTs), two parallel diodes, an inductance, and two capacitors. The switching loss and conduction loss of SiC are the main contributions for the power losses of the DC/DC converter. The switching losses can be expressed as a function of the integration voltage and current during commuted intervals,
where
ET_on and
ET_off are the turn-on and turn-off losses, respectively.
t1,
t2,
t3, and
t4 represent the start and end of turn-on and turn-off, respectively. The switching losses of Si can be calculated the same as those of SiC.
The conduction loss of SiC can be calculated directly by the current and voltage,
Additionally, the power losses of the converter also contain the loss of inductance resistance and the capacitors’ equivalent series resistances (ESR). Hence, the total losses, namely the efficiency of the converter, can be measured and calculated as follows,
where
U1 and
U2 are the input and output voltages of the converter, respectively.
i1 and
i2 are the input and output currents of the converter, respectively.
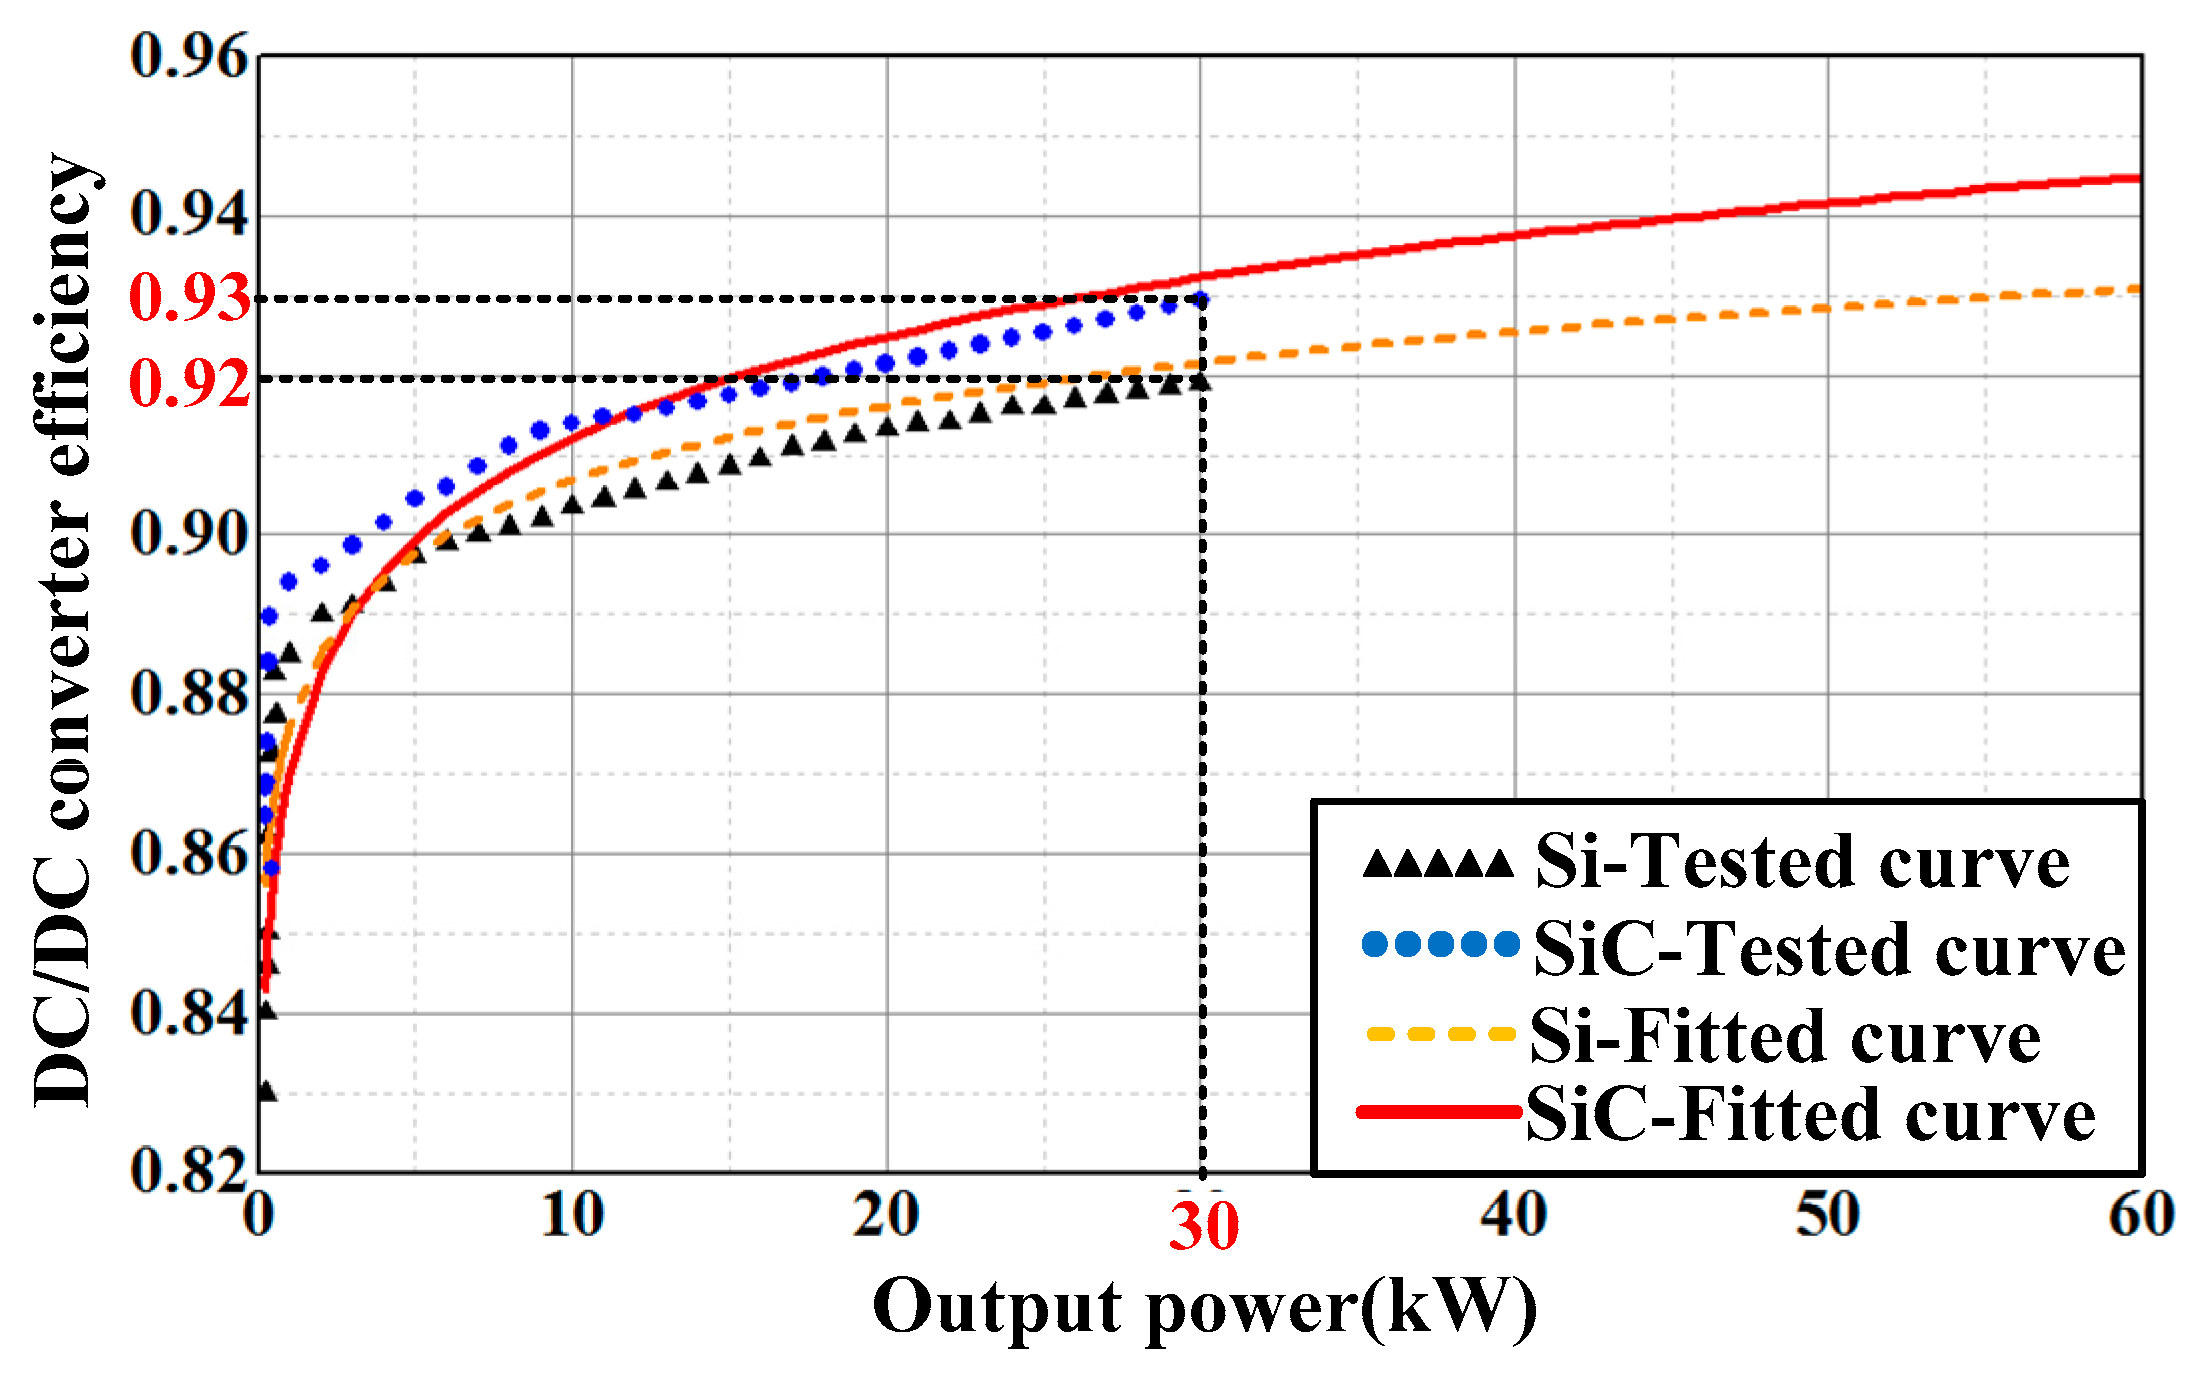
Figure 8 shows the efficiency comparison between the SiC- and Si-converters. The blue curve and black curve are measured by the experiments while the red curve and yellow curve are fitted based on the measured results. The peak efficiency of the SiC-inverter is nearly 93% at the output power of 30 kW, which is approximate 1% higher than that of the Si-converter.
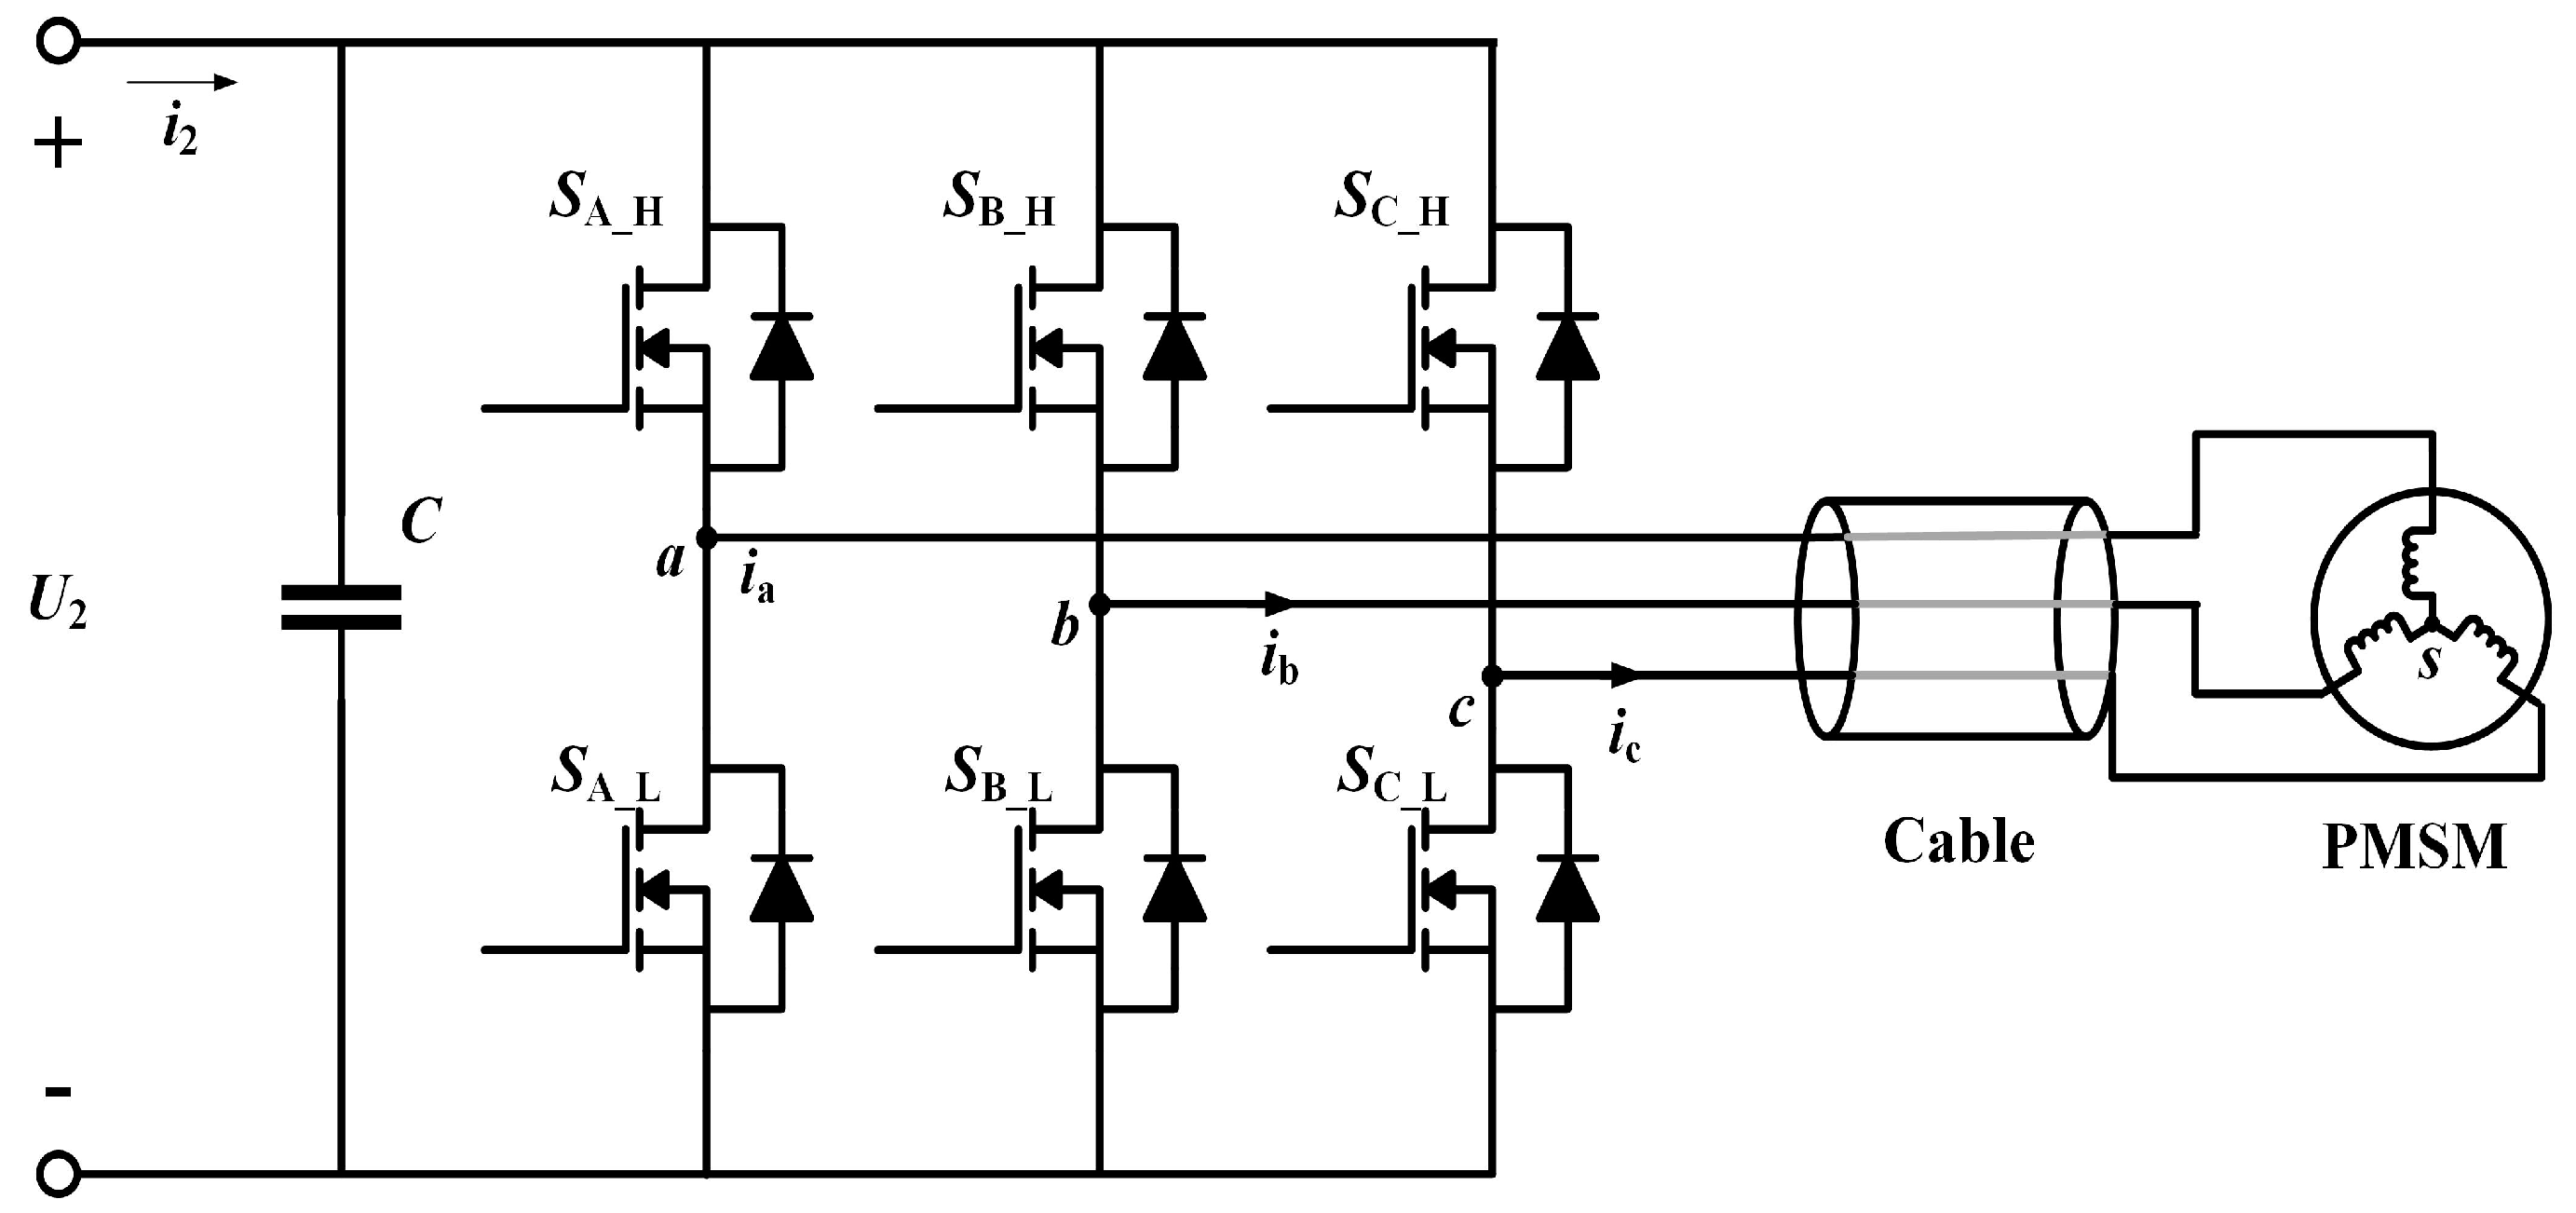
3.2. Efficiency of Inverter-PMSM
Figure 9 shows the fundamental topology of the DC/AC inverter and PMSM. The inverter contains six SiC MOSFETs (or Si IGBTs), six parallel diodes, one capacitor, etc. The switching loss and conduction loss of SiC are the main contributions for the power losses of the inverter, which is the same as that of the DC/DC converter. The loss model of the inverter can be found in Ref. [
24,
25,
26]. This Section presents the measurement method and the test results.
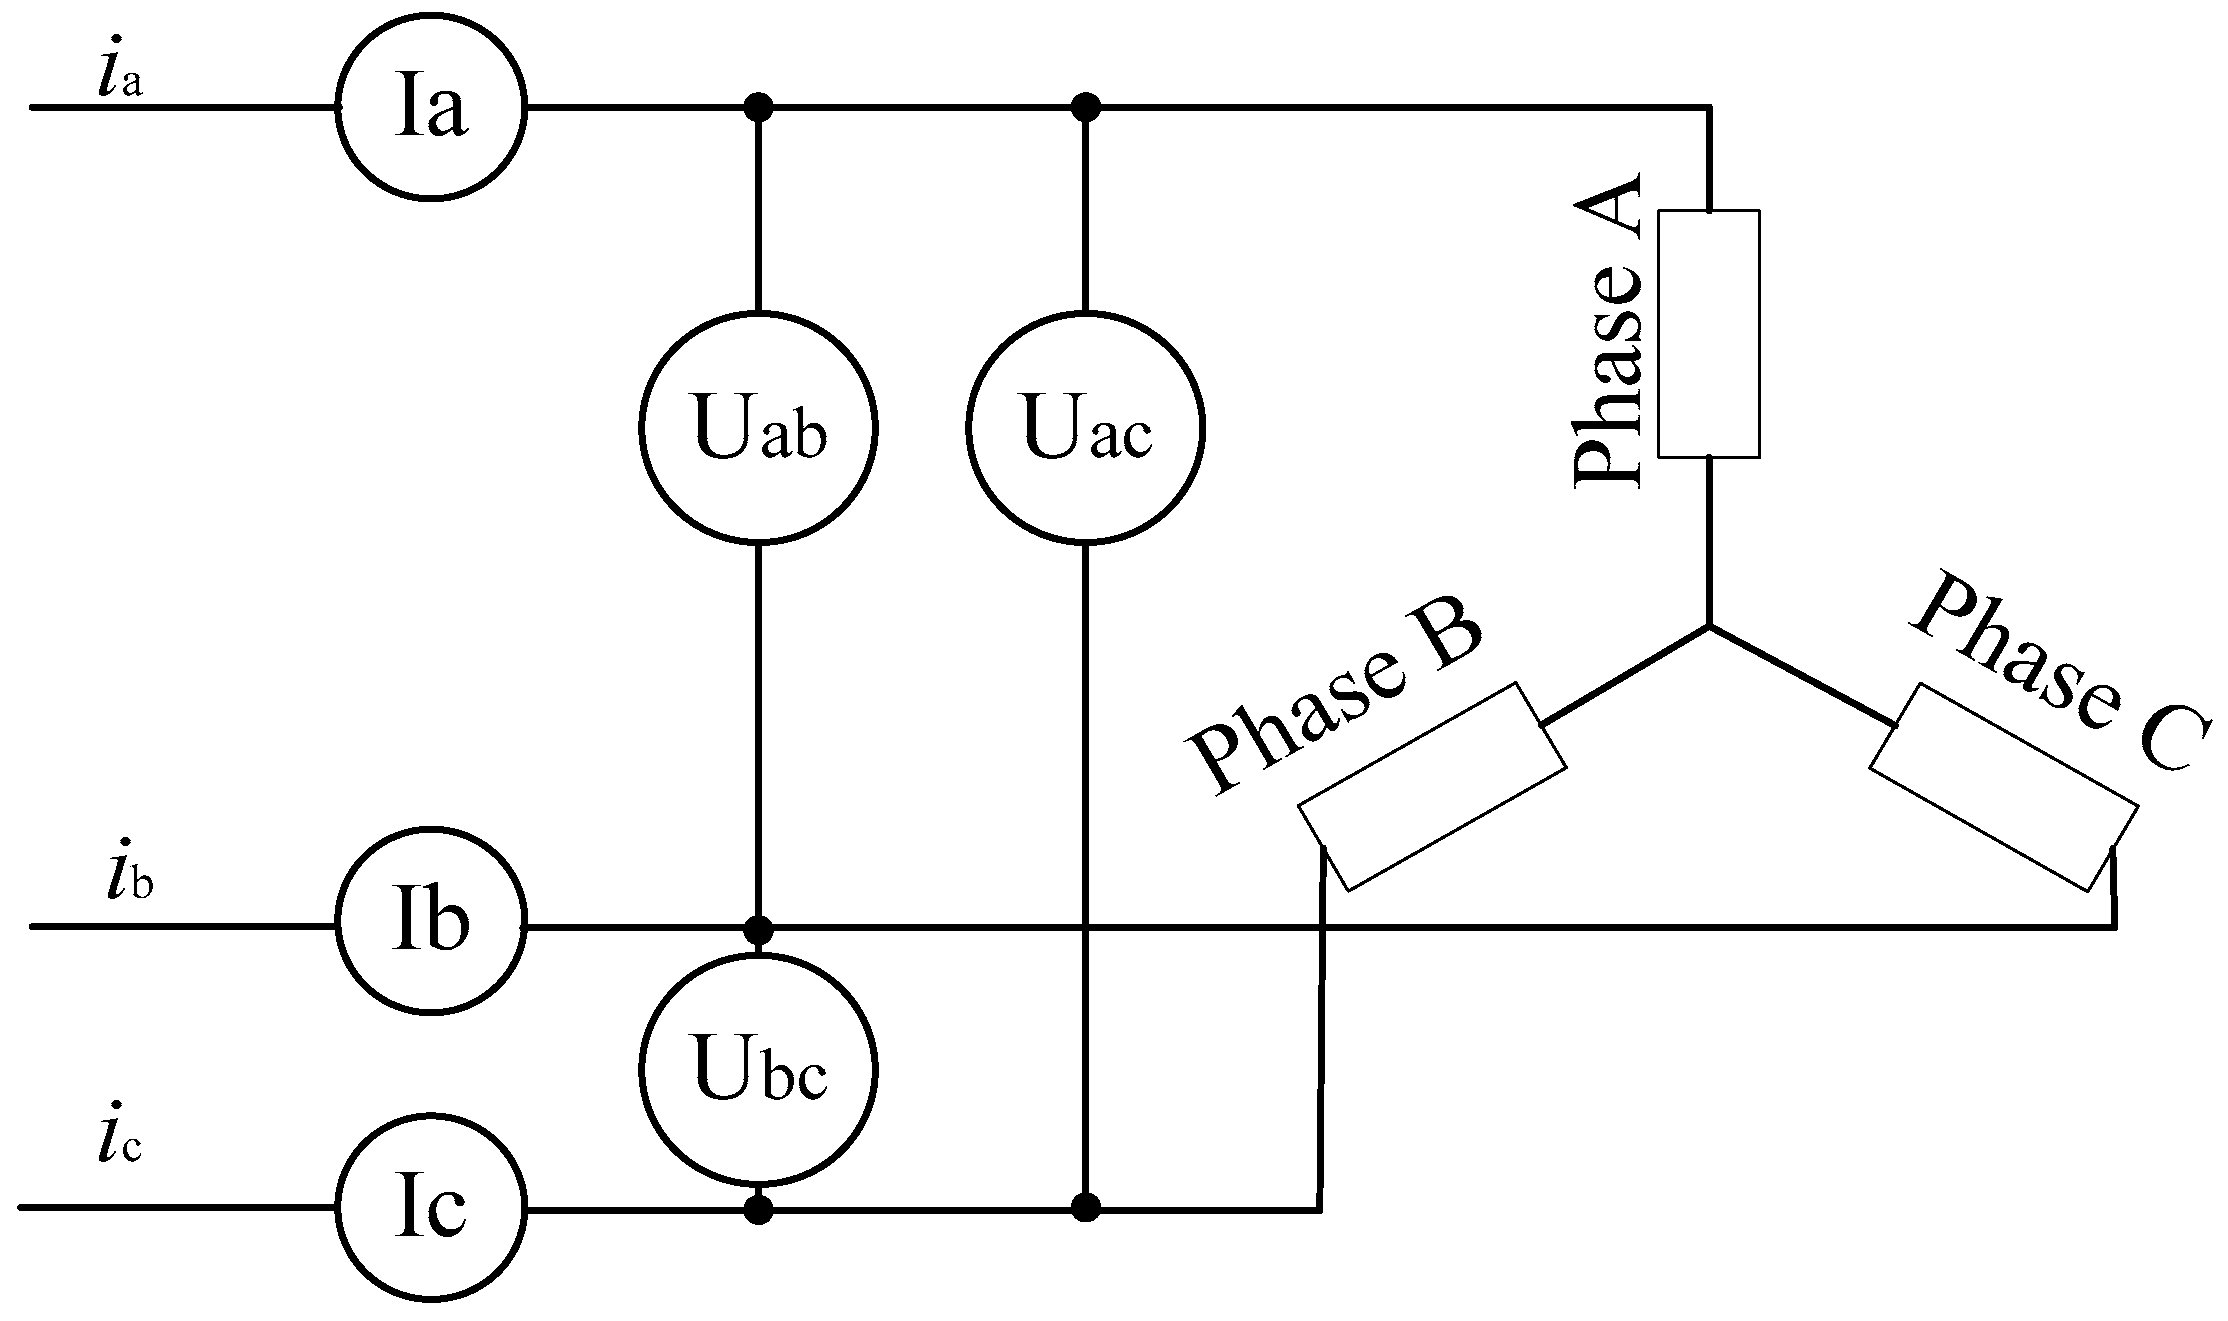
The input power of the inverter is equal to the output power of the converter, as shown in Equation (4). The output power of the inverter is equal to the input power of the motor. The measurement method is shown in
Figure 10.
ia,
ib,
ic represent the currents of Phase A, Phase B, and Phase C, respectively.
Uab,
Ubc,
Uac are the three line-line voltages. Hence, the expression of the output power of the inverter is shown in Equation (5). The efficiency of the inverter can be calculated according to Equation (6).
For the PMSM, the output power is mechanical energy, which is measured by a dynamometer. Hence, the efficiency of the motor is expressed as
where
T is the output mechanical torque of the motor and
n is the mechanical speed of the motor.
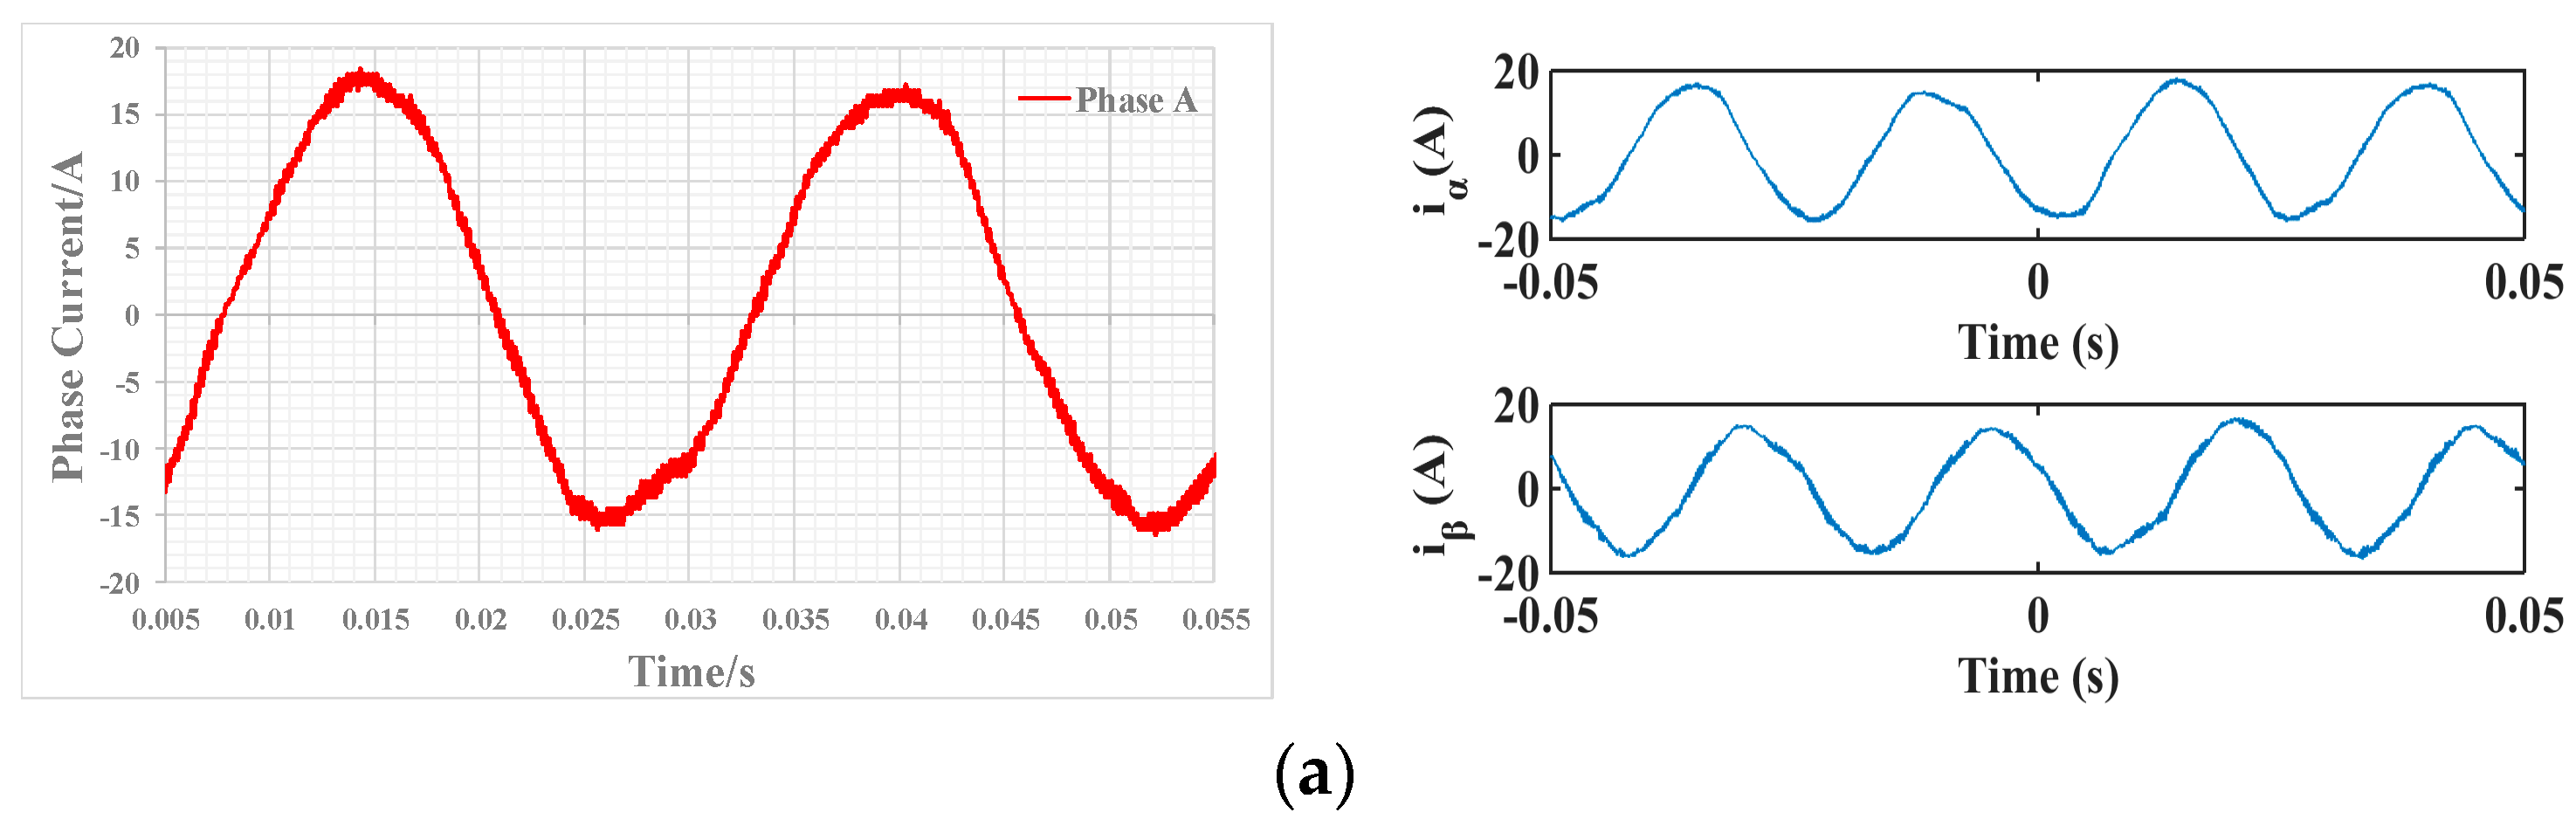
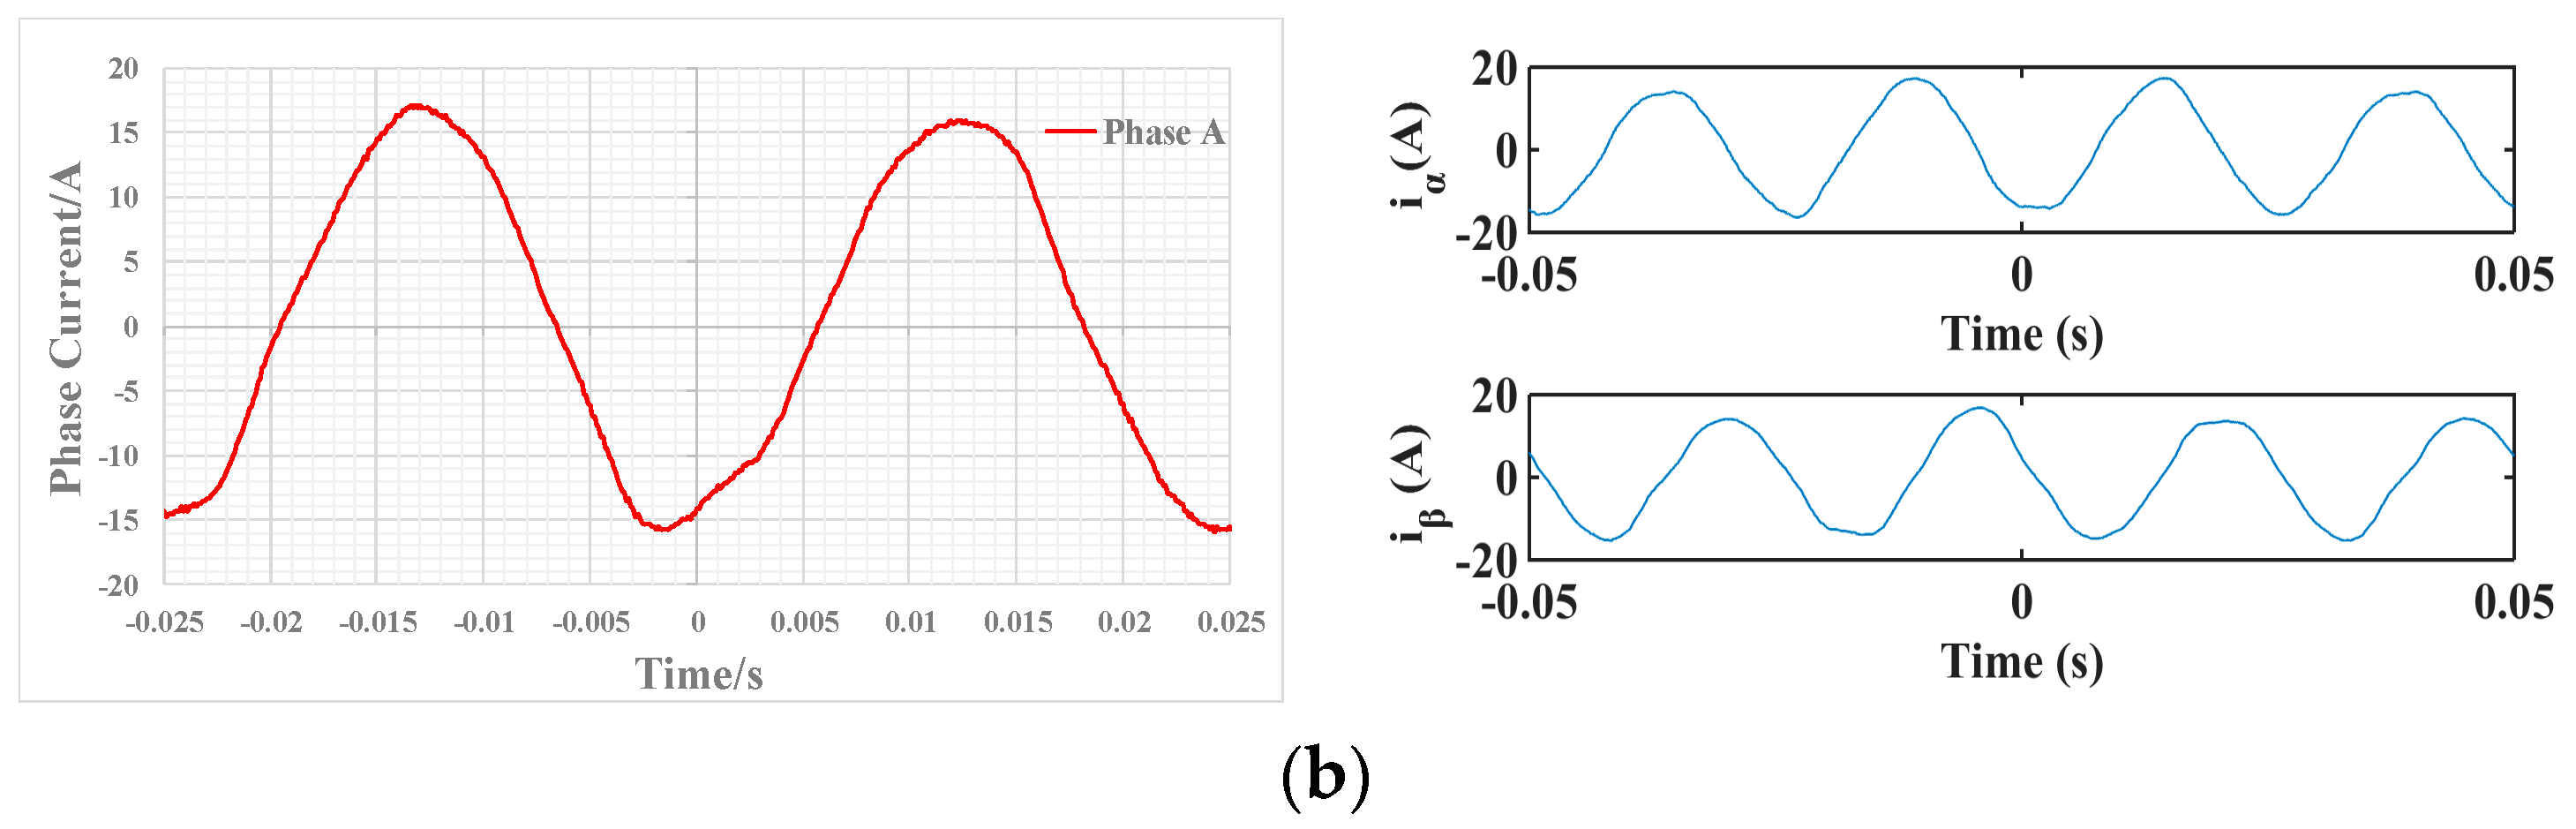
The waveforms of Phase A and the
αβ currents are shown in
Figure 11. It is clearly seen that the currents of the Si-drive system include more harmonic components, which will induce more power losses in the motor. The phase current is dependent on the output phase voltage of the inverter. The distortions of the phase voltage are contributed by the voltage-drop, turn-on time and turn-off time of the switching devices, and the dead time of the phase leg [
27,
28,
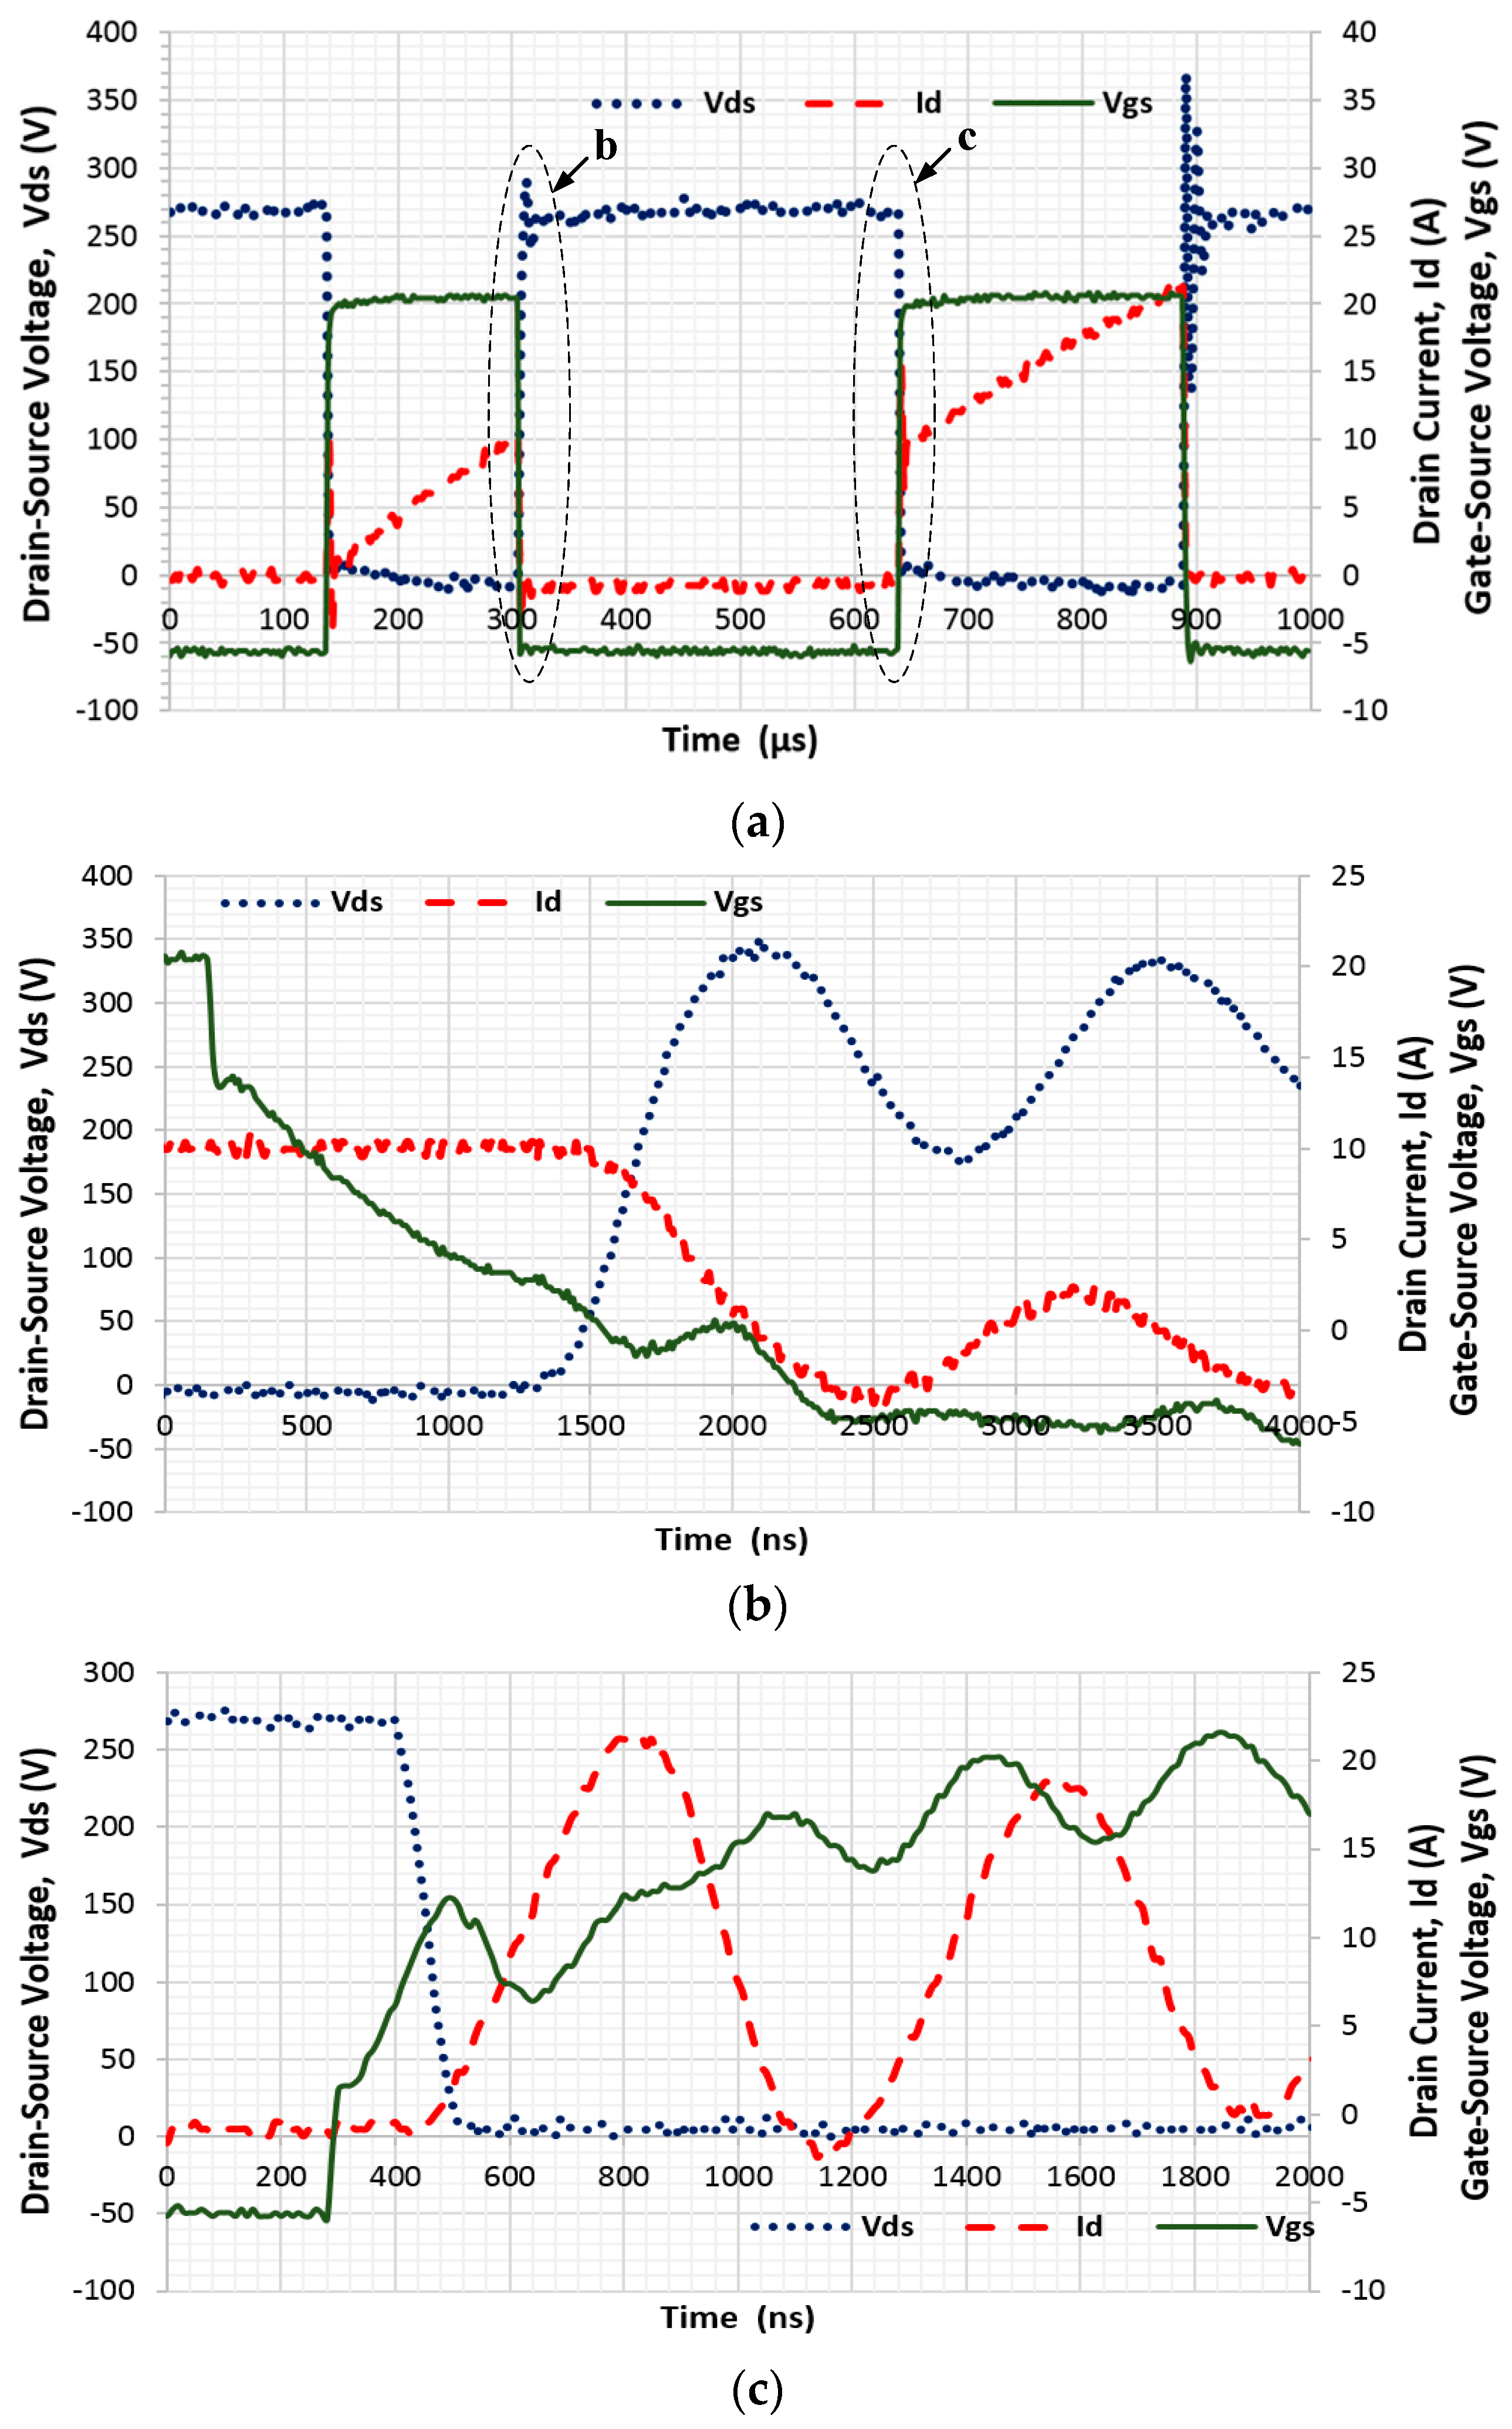
29]. The voltage-drop, turn-on time, and turn-off time of SiC MOSFETs are smaller than their Si IGBTs counterparts, which were measured and are shown in
Table 1 and
Table 2 of
Section 2 in this paper. Meanwhile, the shorter dead time could be set in the SiC-drive due to the faster turn-on and turn-off speed. Therefore, the distortions of the phase voltage of the Si-drive are more than the SiC-drive counterparts, resulting in more harmonic components in the current of the Si-drive system.
There are two main losses in the motor, namely core losses in the iron core and copper losses in the winding. Both the core losses and copper losses include two parts; one part is induced by the fundamental current, and the other part is induced by the harmonic currents [
24,
30,
31,
32]. The core losses in the motor are composed of the eddy current loss
Pe and hysteresis loss
Ph. Both types of losses are caused by variation of the flux density in the core. Bertotti’s model [
30] is shown as,
where
ke and
kh are the eddy loss coefficient and the hysteresis loss coefficient, respectively, ω
1 is the fundamental angular frequency of the applied voltage, and
n is the order of the harmonic. The peak flux density of the
nth-order harmonic
Bpcurrent,n due to the
nth-order current is predicted by [
31],
The copper losses also include the fundamental component loss and the losses related with the harmonic currents [
32]. The harmonics induce eddy currents in the conductors, which cause a non-uniform distribution of the current density within the cross-sectional area of each conductor. Such non-uniform distribution of the current density in a conductor according to its own current is called the skin effect, while that according to the currents in adjacent conductors is called the proximity effect. The expression of the copper losses can be written as follows [
32],
where
Irms is the rms current,
Rdc is the dc resistance, and
In is the rms current of the
nth current.
Rn,ac is the value of the
nth harmonic resistance, which is determined by its dc value
Rdc multiplying the ac skin and proximity gain,
where
Kn,se is the
nth resistance gain caused by the skin effect, and
Kn,pe is the
nth resistance gain caused by the proximity effect. Therefore, the phase current of the Si-drive system includes more harmonic components, resulting in more power losses in the motor.
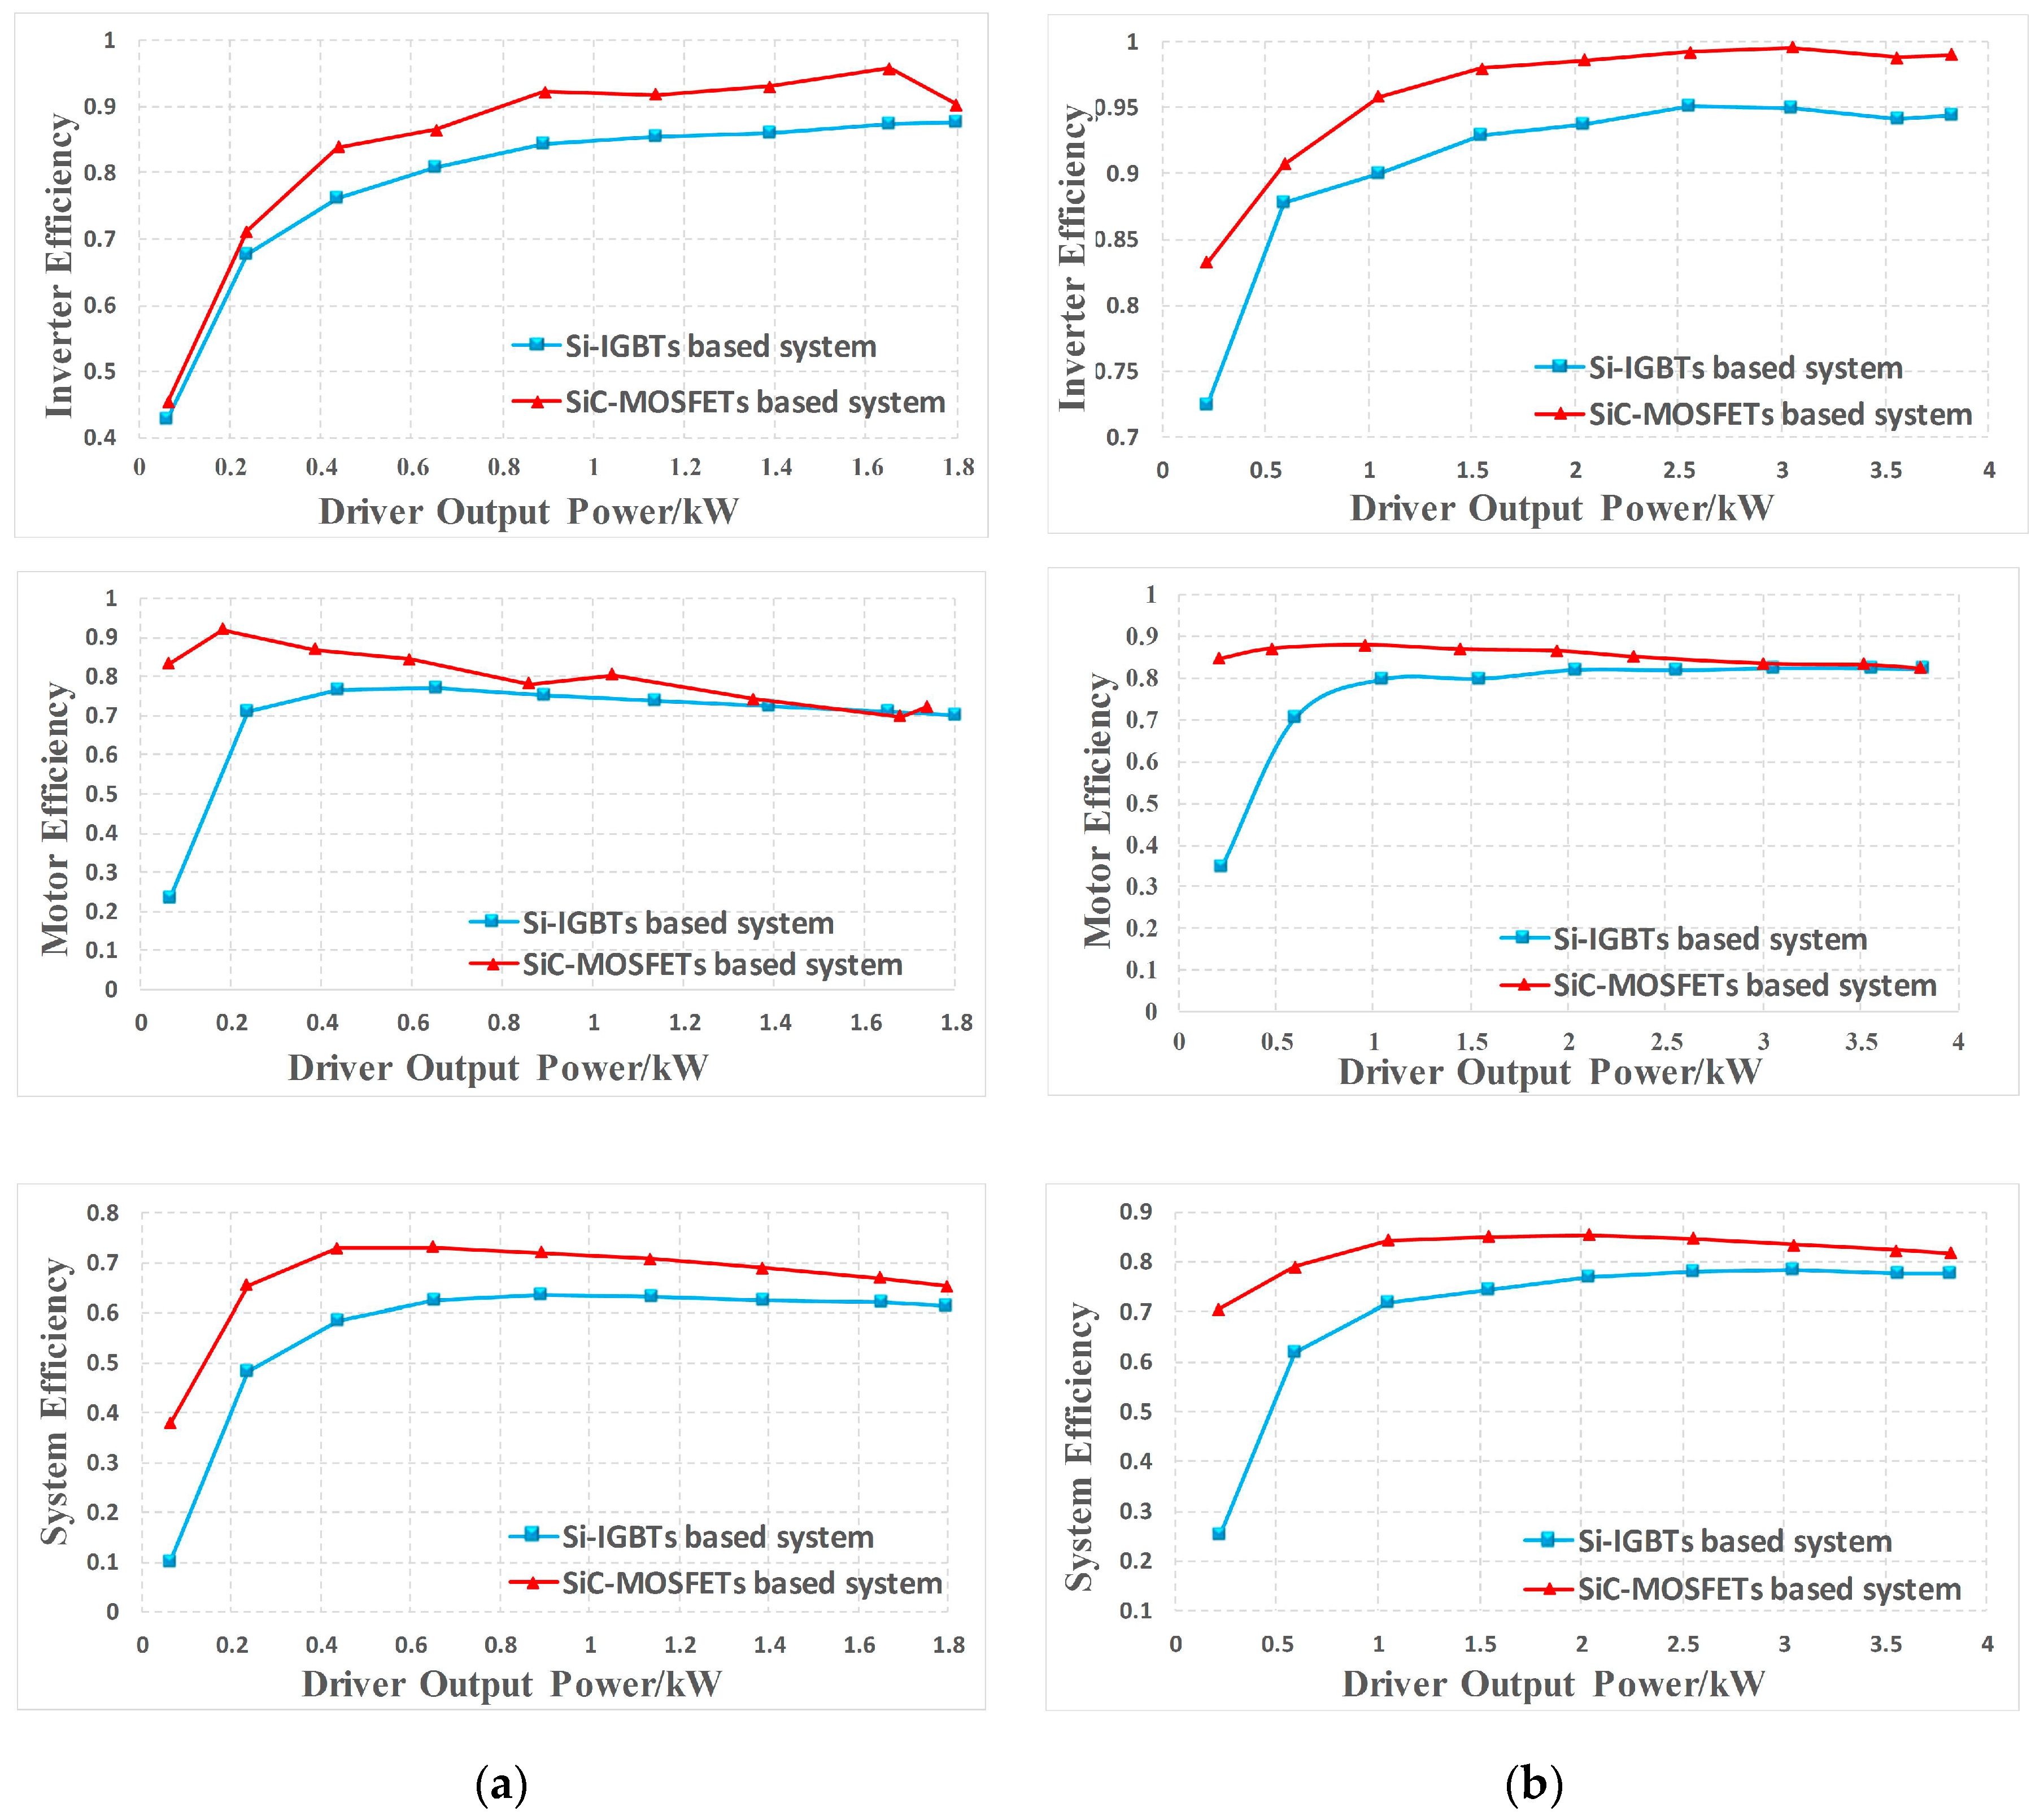
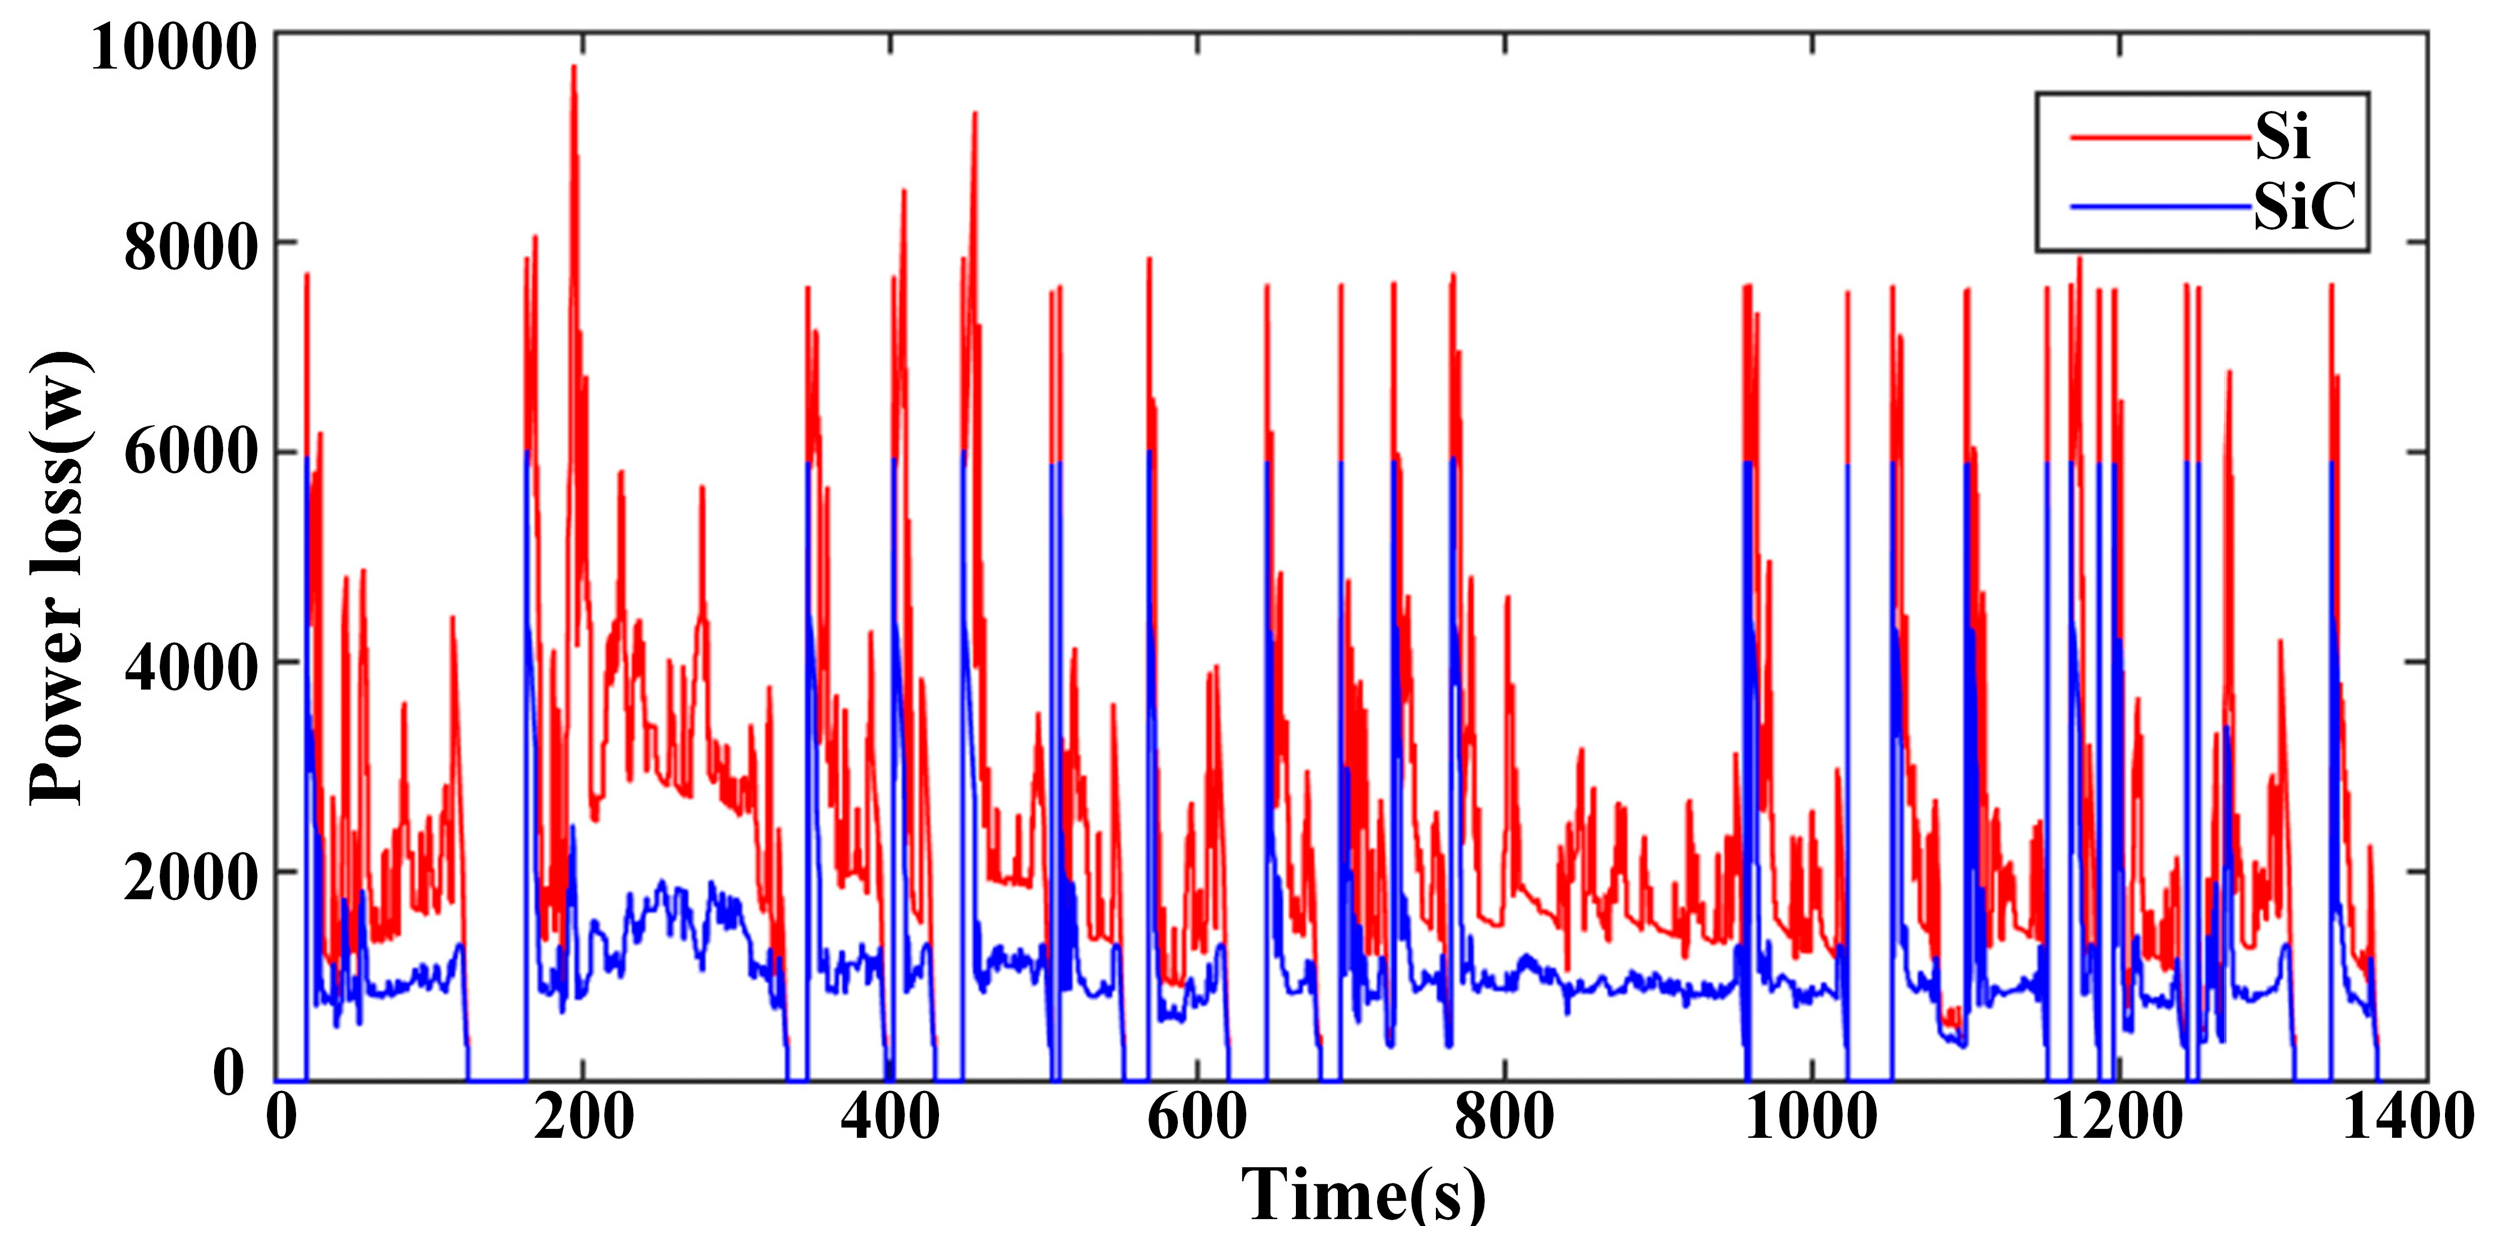
Meanwhile, the amplitude of the phase current in the Si-drive system is higher than the SiC-system counterpart when the output powers of the two systems are the same. Hence, the efficiencies of both the inverter and the motor in the SiC-drive system are higher than the Si-system counterpart as shown in
Figure 12. As a result, the efficiency of the overall inverter-motor system based on SiC is higher than that of the Si-system, especially with light loads.
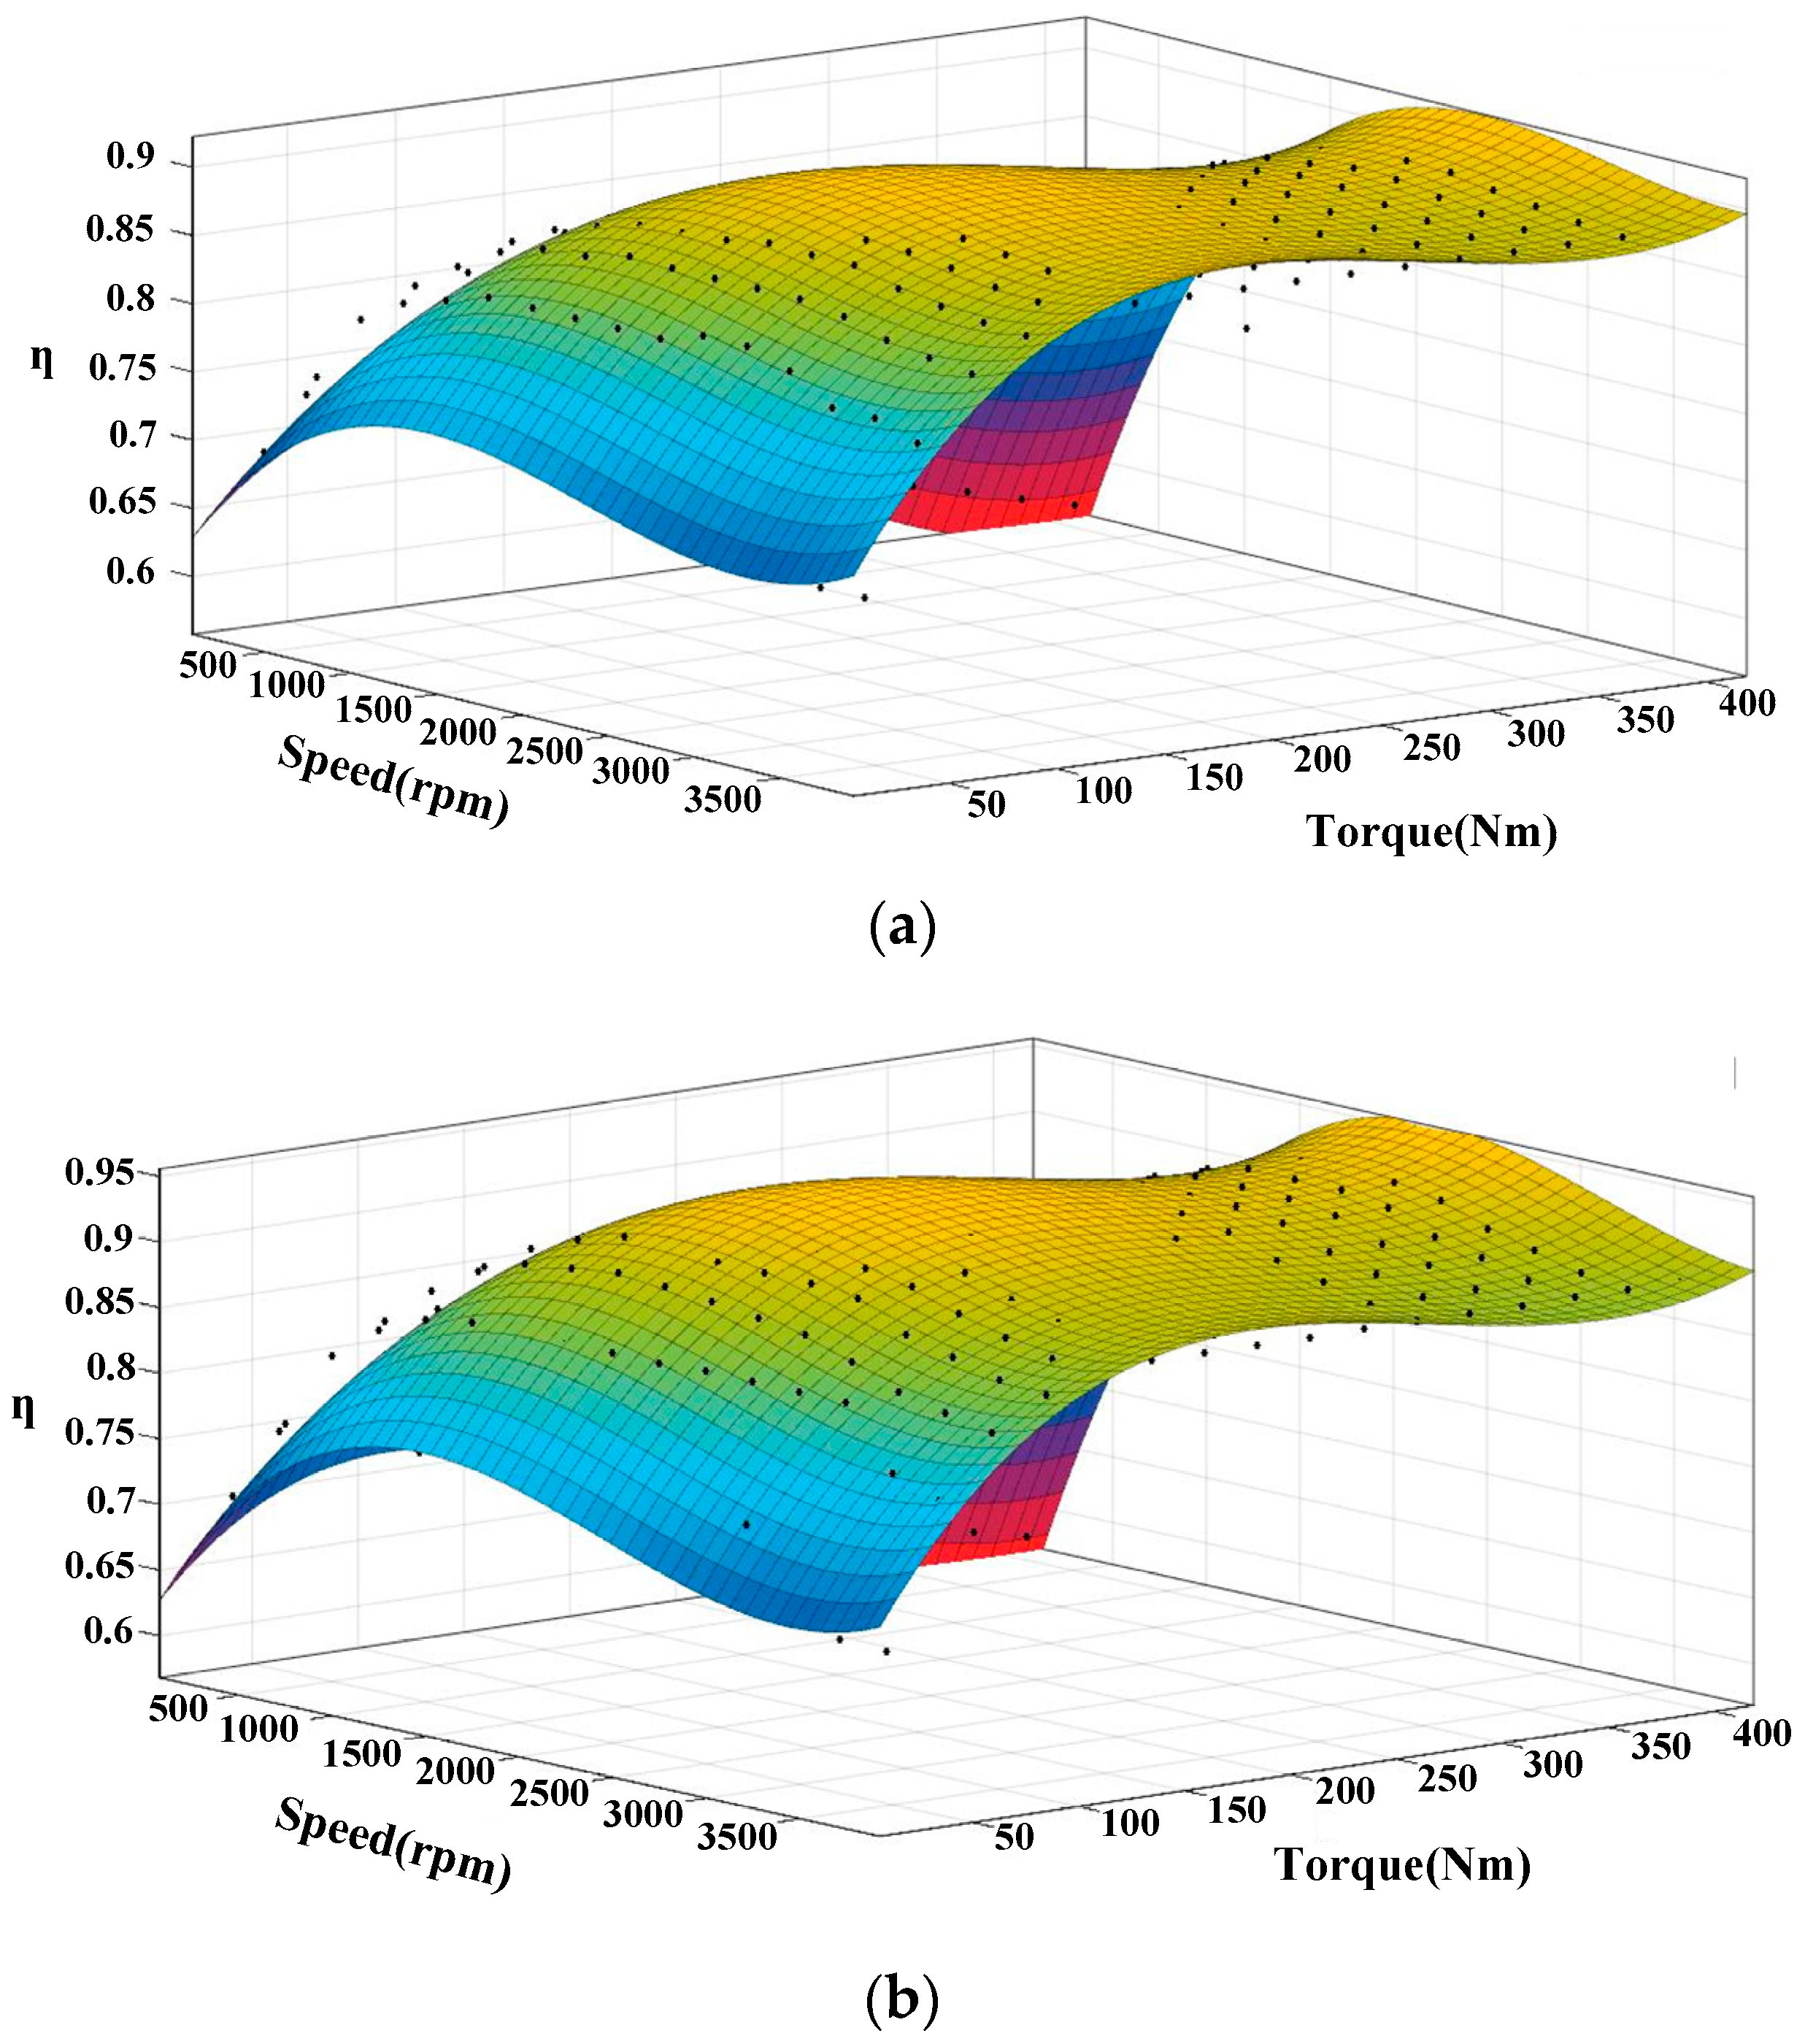
Due to the limited power rating of the dynamometer in our lab, the efficiency of the overall inverter-motor system during the full power range is expanded from the limited tested results shown in
Figure 13, which will be adopted in the next Section. When the speed was smaller than 800 rpm and the torque was below 350 N·m, the efficiency of the overall inverter-motor system was measured by experiments. Then the range of the efficiency was expanded when the speed was higher than 800 rpm and the torque was bigger than 350 N·m through fitting formulas. There are several fitting algorithms to fit formulas based on MATLAB, such as Gaussian, Interpolant, Polynomial, Wei bull, etc. Among these fitting methods, the formulas fitted by the Polynomial had the best fitting degree, and the optimal fitting degree was 0.9682. Hence, the polynomial was adopted and the corresponding fitting formulas are shown as Equations (12) and (13), respectively.


