
Separation of CO2 in a Solid Waste Management Incineration Facility Using Activated Carbon Derived from Pine Sawdust


Instituto Nacional del Carbón, INCAR-CSIC, c/Francisco Pintado Fe 26, 33011 Oviedo, Spain
*
Author to whom correspondence should be addressed.
Energies 2017, 10(6), 827; https://doi.org/10.3390/en10060827
Submission received: 30 March 2017
/
Revised: 7 June 2017
/
Accepted: 15 June 2017
/
Published: 20 June 2017
(This article belongs to the Special Issue CO2 Capture)
Abstract
:The selective separation of CO2 from gas mixtures representative of flue gas generated in waste incineration systems is studied on two activated carbons obtained from pine sawdust and compared to a commercial activated carbon. Dynamic adsorption experiments were conducted in a fixed-bed adsorption column using a binary mixture (N2/CO2) with a composition representative of incineration streams at temperatures from 30 to 70 °C. The adsorption behavior of humid mixtures (N2/CO2/H2O) was also evaluated in order to assess the influence of water vapor in CO2 adsorption at different relative humidity in the feed gas: 22% and 60%. Moreover, CO2 adsorption was studied in less favorable conditions, i.e., departing from a bed initially saturated with H2O. In addition, the effect of CO2 on H2O adsorption was examined. Experimental results showed that the CO2 adsorption capacity can be reduced significantly by the adsorption of H2O (up to 60% at high relative humidity conditions). On the other hand, the breakthrough tests over the adsorbent initially saturated with water vapor indicated that H2O is little affected by CO2 adsorption. The experimental results pointed out the biomass based carbons as best candidates for CO2 separation under incineration flue gas conditions.
1. Introduction
The disposal of municipal solid waste is one of the main urban issues. Development of integrated solid waste management facilities is necessary considering how to prevent, recycle, and manage solid waste in ways that most effectively protect human health and the environment. The European Legislation about waste disposal (Directive 2008/98/EC) has established a hierarchy of available technologies. It sets out five steps for dealing with waste, ranked according to the environmental impact:
- Waste minimization: Using less material in design and manufacture, keeping products for longer, re-use, using less hazardous materials.
- Reuse: Checking, cleaning, repairing, refurbishing, whole items or spare parts.
- Recycling: Turning waste into a new substance or product.
- Other recovery: Includes anaerobic digestion, incineration with energy recovery, and gasification and pyrolysis that produce energy (fuels, heat and power) and materials from waste and some backfilling operations.
- Disposal: Landfilling and incineration without energy recovery.
It is also important to bear in mind that not all waste is suitable for recycling (e.g., too contaminated materials or mixed materials), that materials degrade after repeated recycling and the existing demand for recycled products. If high quality recycling is not possible, the waste should be turned into energy, rather than being landfilled. In addition, some residues have to be incinerated such as potentially infectious clinical waste, treat meat and bone meal residues, drugs or polluted plastic packages. Therefore, the market for thermal treatment and energetic recovery of residual and other types of solid waste is growing continuously. Increasing waste amounts, shrinking landfill spaces in agglomerations and higher ecological standards stimulate this growth throughout the world.
Incineration is a disposal method in which solid organic wastes are subjected to combustion to convert them into residue and gaseous products. It reduces the waste volume and helps generate heat and/or electricity for commercial use. This generates a renewable energy source and reduces carbon emissions by offsetting the need for energy from fossil sources. The most common examples are municipal solid waste incineration plants, hazardous waste incineration plants, sewage sludge incineration plants and incineration plants for clinical waste or animal carcasses.
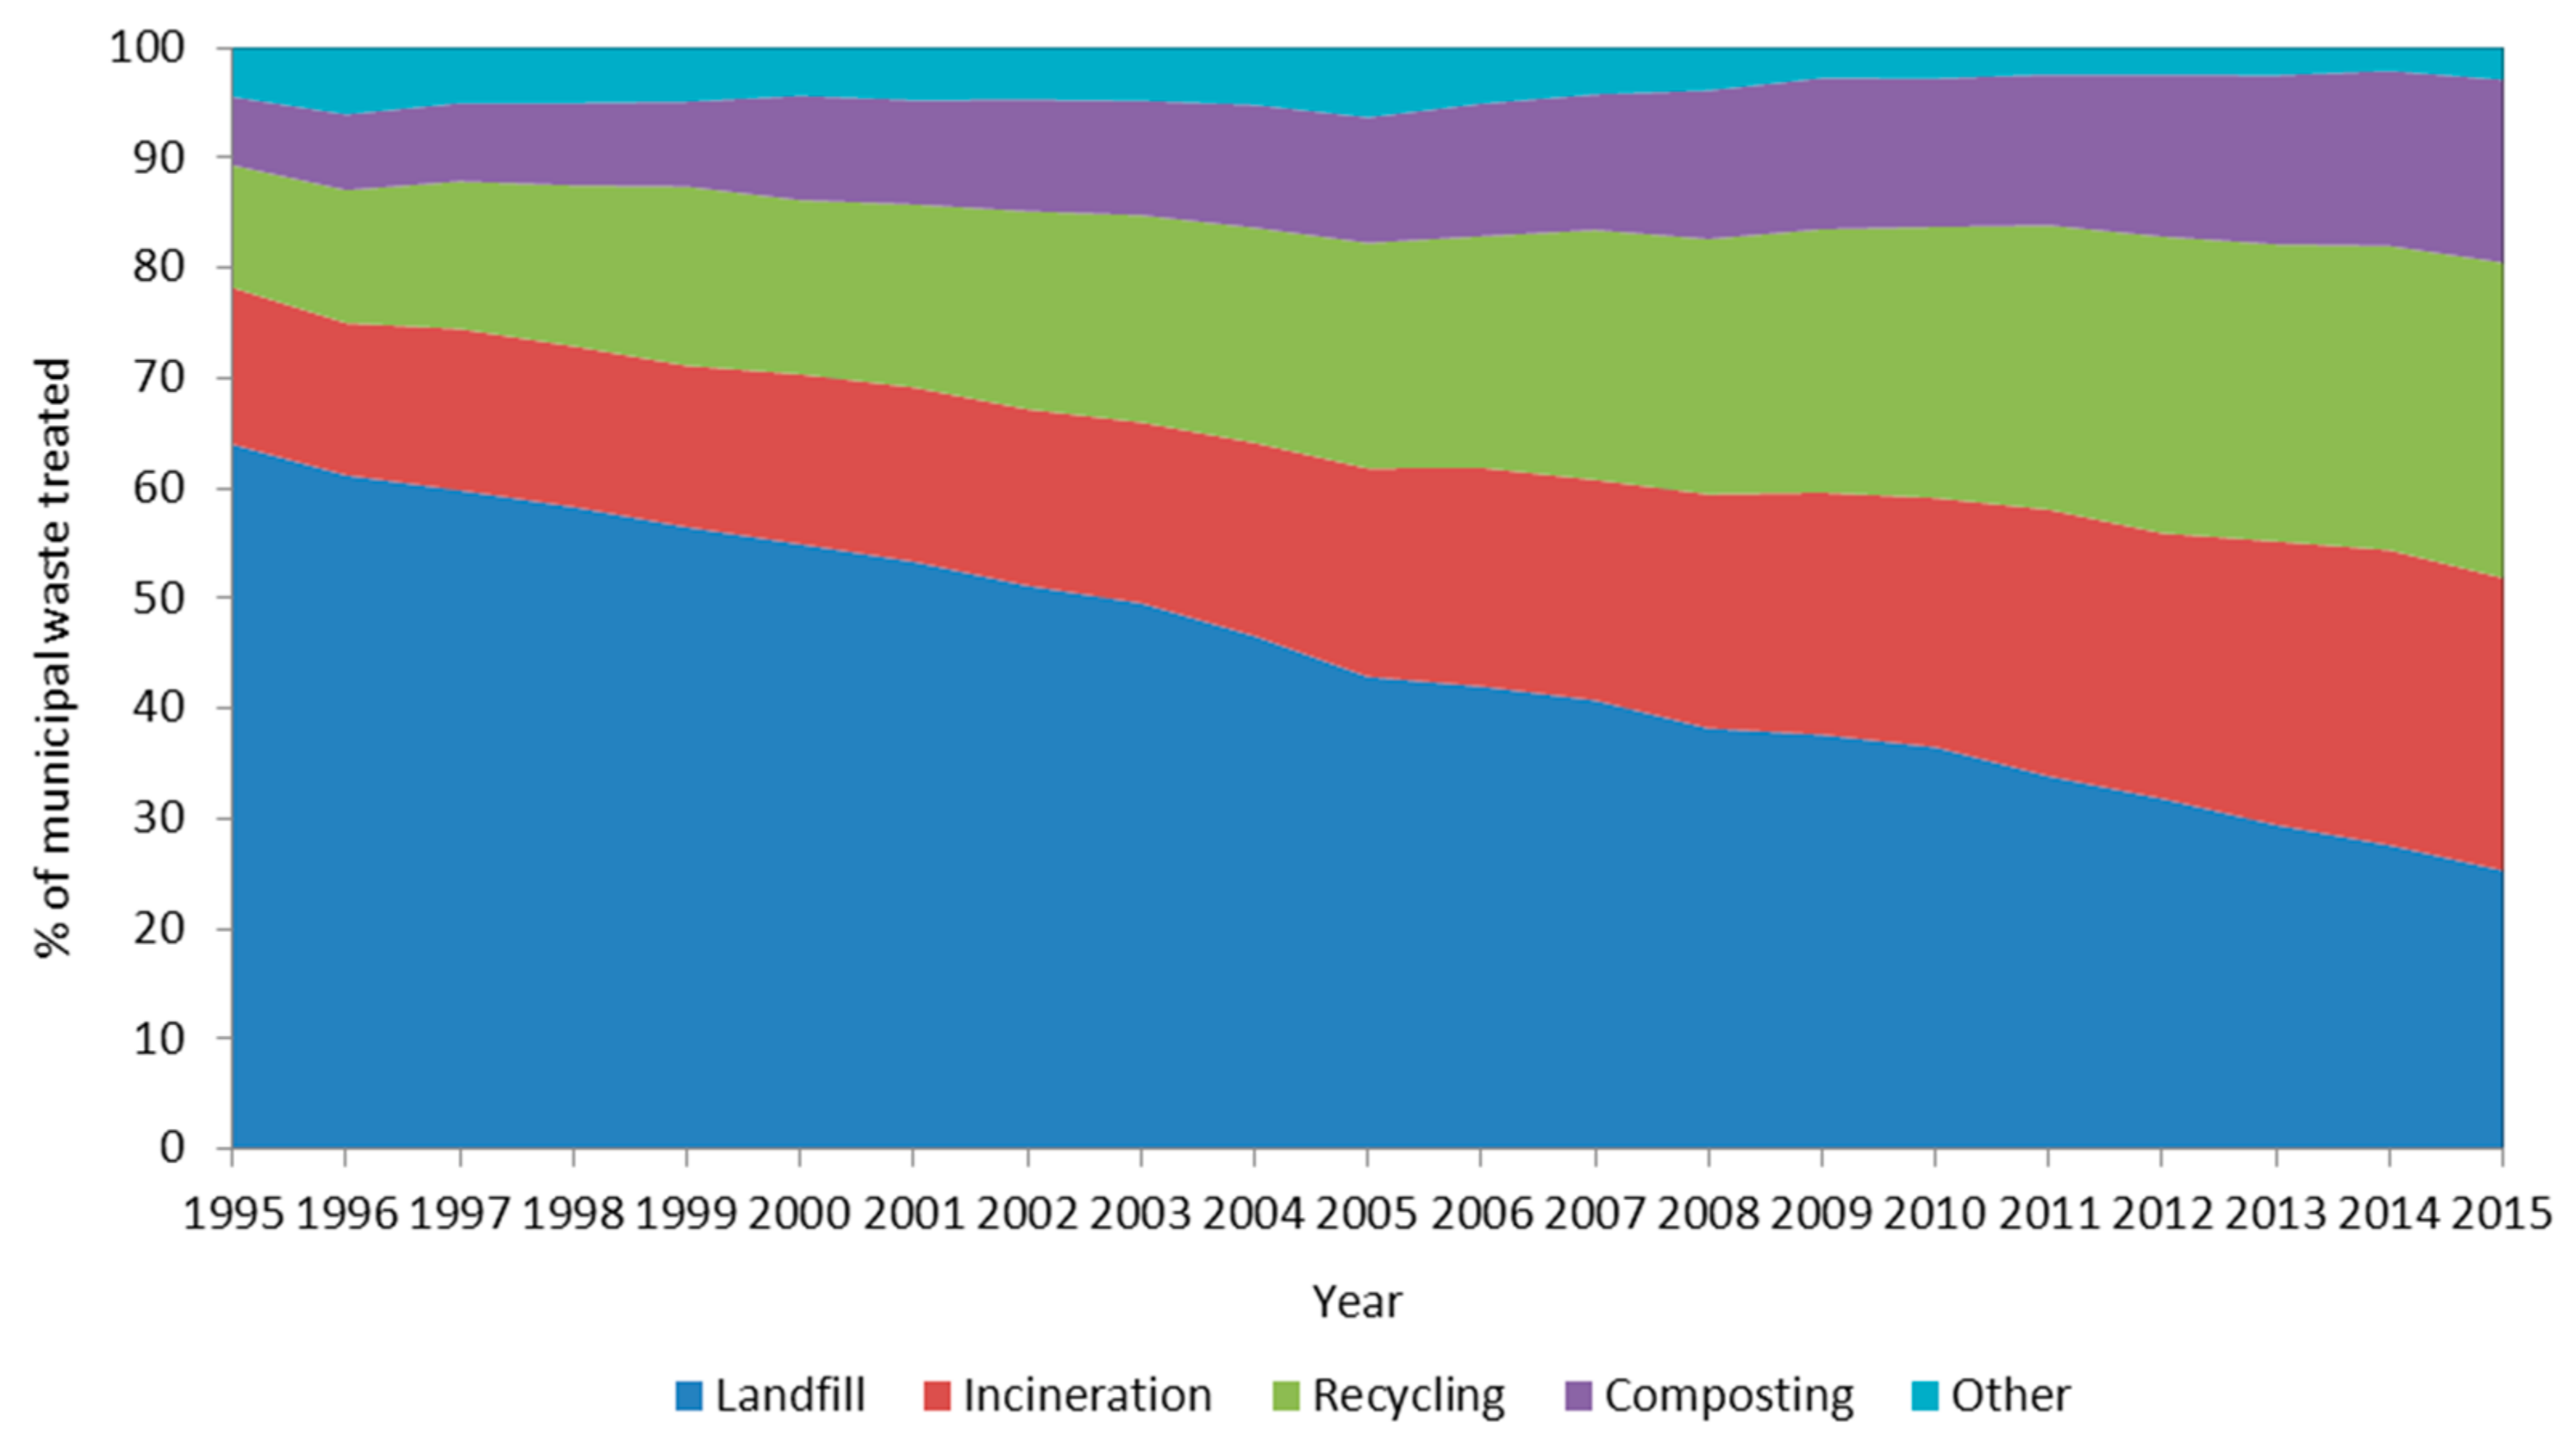
Each citizen of the European Union on average produces 477 kg of municipal waste per year. In 2015, that waste was managed by a variety of means: 25.3% was landfilled, 28.6% recycled, 26.6% incinerated, and 16.6% composted. It is important to note that the share of incinerated municipal waste in the EU has steadily increased over the time period, from 14.2% in 1995 to 26.6% in 2015 as it can be observed in Figure 1 (Eurostat, 2017).
According to the Confederation of European Waste-to-Energy Plants (CEWEP), in 2014, there were 482 incineration plants with energy recovery across Europe that treated about 88 million tonnes of household and similar wastes, remaining after waste prevention, reuse and recycling (hazardous waste is not included). Worldwide there are more than 2200 Waste-to-Energy plants active, with a disposal capacity of around 300 million tonnes of waste per year.
Waste incineration flue gas is mainly composed of N2, CO2, O2 and H2O with much lesser contents of NOx, SO2 and CO. Waste-to-Energy plants have a range of different emission abatement equipment which aims to ensure compliance with emission regulations. The contents in the raw flue gas of HCl (and volatile metal chlorides), SO2, NOx, persistent organic pollutants and heavy metals need to be removed before emission of the flue gas to the atmosphere [1,2,3]. However, CO2 in flue gas is not currently addressed by flue gas cleaning systems in incineration facilities although some pilot plant studies are being carried out [4]. In flue gas from municipal solid waste incinerators, the CO2 concentration was found to be about 6–12% [5]. It is then feasible to develop an integrated solution to reduce the emissions of CO2 from waste incineration by recovering CO2.
In order to reduce the content of CO2 in the gaseous streams, different technologies are available, such as absorption processes, membrane separation, cryogenic distillation and adsorption [6]. Adsorption-based processes that employ microporous materials constitute a very promising cost-efficient technology. Various microporous materials, such as activated carbons, zeolites and metal-organic frameworks (MOFs) have been considered to carry out the CO2 separation. The capture of CO2 using these types of dry sorbents involves gas-solid interactions where the porosity of the adsorbent, the temperature and partial pressure during adsorption and the easiness of the regeneration procedure are key drivers. Recent research has focused on improving the adsorbent characteristics but also on developing adsorption processes that are cost-effective for CO2 capture [7,8,9,10]. The utilization of activated carbons offers advantages, when compared to other non-carbonaceous adsorbents, such as high adsorption capacity at ambient conditions, low regeneration cost, long-term stability and fast kinetics.
Many references in the literature address CO2 adsorption using activated carbons in post-combustion conditions [11,12,13,14,15], mostly applied to coal-fired power plants flue gas. They offer advantages when compared to state-of-the-art technology, chemical absorption, owing to their stability, easy manufacture, lower cost and great potential to reduce the energy penalty associated to the regeneration step. Moreover, adsorption technology will show further advantages in an incineration facility where the volume of flue gas is significantly smaller. Incinerator flue gas has a lower partial pressure of CO2 and a higher partial pressure of O2 compared to coal-fired power plant flue gas [4]. To the best of authors’ knowledge, adsorption with biomass based carbons has not been previously explored for the separation of CO2 from incineration flue gases.
Another important aspect that is highlighted in this work has to do with the high water content in flue gases; hence, the impact of water vapor on CO2 capture is a critical parameter that is particularly assessed in this work. Although the adsorption equilibrium and mechanisms of water vapor adsorption on activated carbon have been widely investigated [16,17,18,19], very few studies have used fixed-bed experiments to gain insight into the adsorption dynamics of water vapor on activated carbon [20,21,22].The impact of water vapor on the capacity of biomass-based activated carbons to capture CO2 has been evaluated: adsorption equilibrium data, measured for CO2, N2, O2 and H2O, and breakthrough experiments performed under different relative humidity were conducted to explore the mutual influence of CO2 and H2O adsorption.
2. Materials and Method
Two biomass-based activated carbons were prepared by single step activation with CO2. The carbon adsorbent pellets were produced from pine sawdust alone (IH3) and from blends of pine sawdust and coal tar pitch (IH2). The preparation process is thoroughly described in a previous work [23]. Further characterization of the samples was carried out in order to assess the microporous structure of the activated carbons.
These adsorbents are compared to a commercial activated carbon, Norit R2030 CO2, with a particle size of approximately 3 mm, used for the removal of carbon dioxide out of cold storage warehouses. Its characterization can be found elsewhere [24,25].
2.1. Chemical Characterization of the Activated Carbons
The prepared carbons were subjected to ultimate analysis in order to determine their chemical composition (see Table 1). Although both materials show a high content of carbon that of IH2 is slightly greater probably due to the addition of coal tar pitch. On the other hand, IH3 contains more oxygen. The hydrogen and nitrogen contents are similar for both activated carbons and sulfur content is negligible.
2.2. Physical Properties of the Activated Carbons
The main characteristics of the prepared adsorbents calculated from the N2 adsorption isotherms at −196 °C and CO2 adsorption isotherms at 0 °C are summarized in Table 2.
CO2 uptake is closely related to the textural characteristics of the adsorbents [26]. At pressures lower than 1000 kPa, the most influential parameter on CO2 uptake is the micropore volume. As pressure approximates to atmospheric, the average narrow micropore width (L0,CO2) is also relevant.
Similar features in terms of narrow micropore width are encountered in both activated carbons, although slightly higher values of narrow micropore volume, W0,CO2, and narrow micropore surface, Smic,CO2, were obtained for IH3. The characteristic energy, E0, is practically equal for IH2 and IH3 showing the same strength in their interaction with CO2.
Comparing those activated carbons with the commercial Norit R2030, whose textural characterization has been reported previously [25], the latter presents a higher BET surface and total pore volume (Vp = 0.41 cm3/g); however the narrow micropore volume (W0,CO2 = 0.26 cm3/g) is lower than that of IH3 and higher than IH2. It also presents lower E0 and higher L0,CO2.
2.3. Adsorption Isotherms
Pure component adsorption isotherms at three different temperatures (30, 50, and 70 °C) for CO2, N2, O2 and H2O were collected.
2.3.1. CO2, N2 and O2 Isotherms
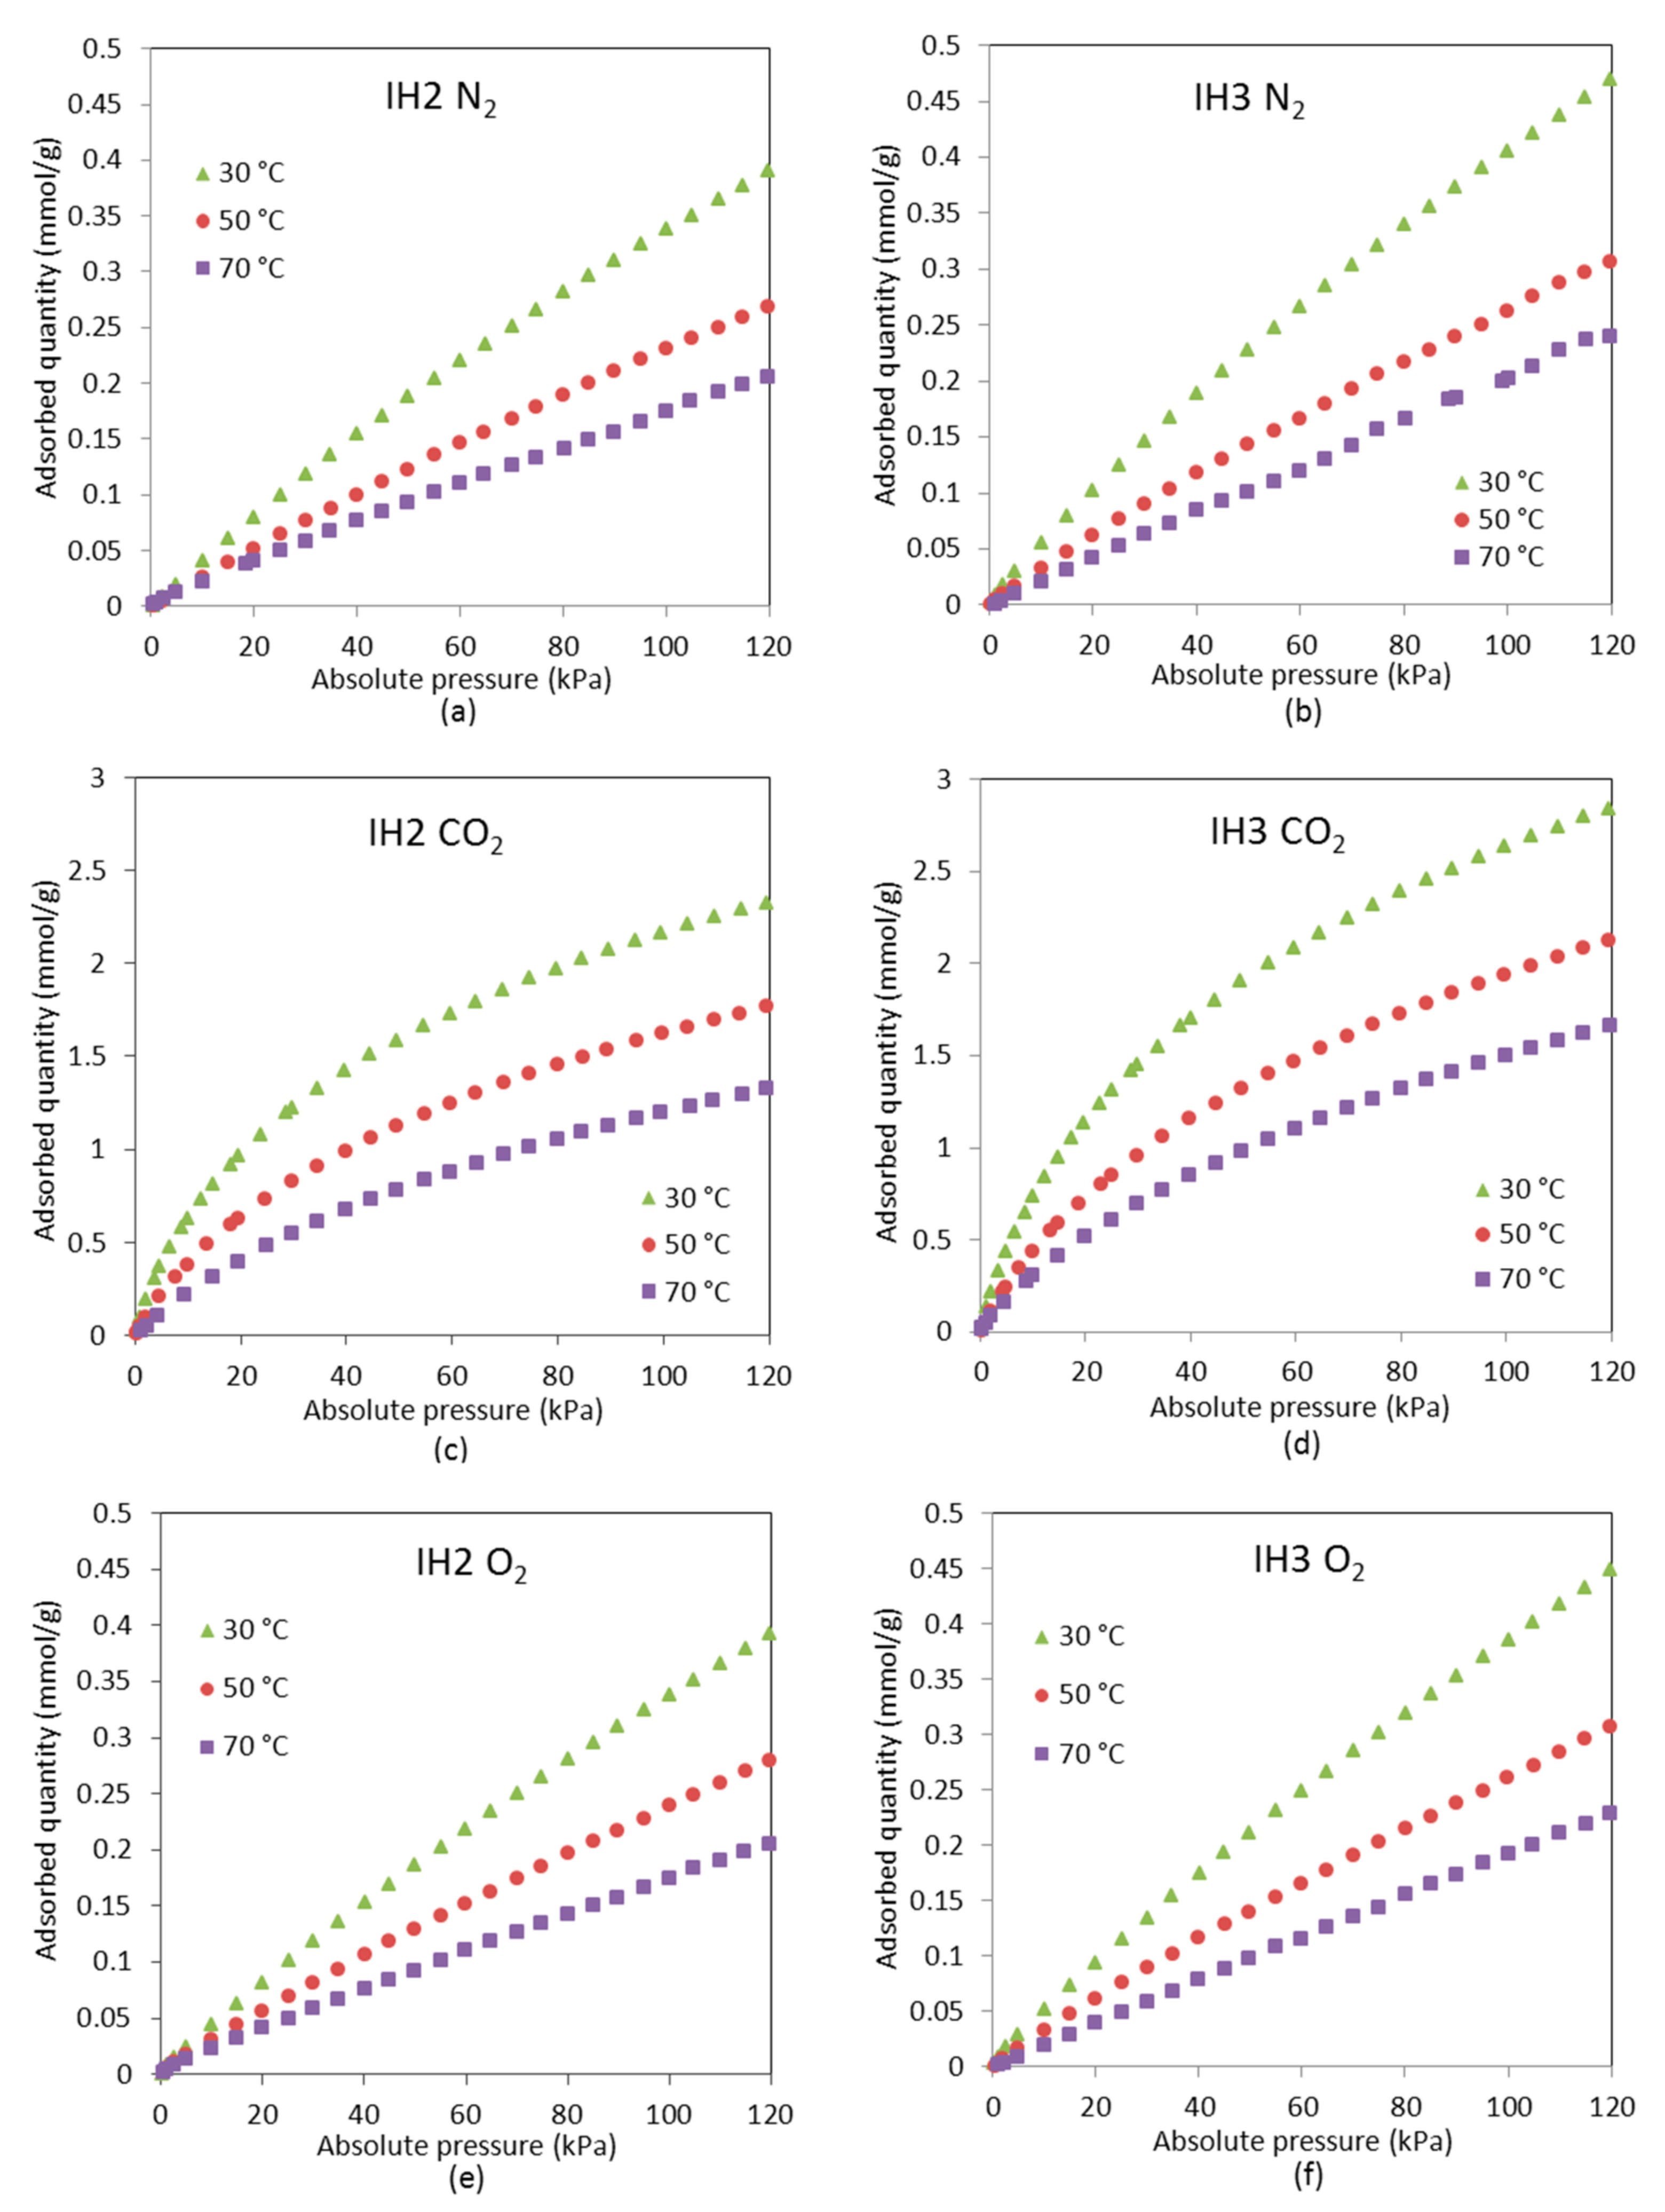
The adsorption isotherms of pure CO2, N2 and O2 were measured up to 120 kPa using a commercial adsorption apparatus (Tristar 3000 from Micromeritics, Norcross, GA, USA). Prior to adsorption measurement, the sample was outgassed overnight under vacuum at 100 °C. The experimental data are graphically presented in Figure 2.
Both carbons present greater CO2 adsorption capacity than N2 and O2 over the entire pressure range (subatmospheric pressures). Globally, the N2 and O2 isotherms exhibit linear patterns (Henry-type), characteristic of weak adsorbate-adsorbent interaction forces, whereas the CO2 adsorption isotherms can be classified as Type I, i.e., they are representative of stronger adsorbate-adsorbent interactions.
Comparing the O2 and N2 adsorption isotherms for each sample, the similarity is very remarkable. As previously mentioned, flue gas from incineration plants contains about 7–14% O2. However, due to the similar behavior of O2 and N2 adsorption on samples IH2 and IH3, in this work, a gas mixture of 8% CO2/92% N2 (or 8% CO2/90% N2/2% H2O in humid conditions) is to be evaluated in the dynamic study as representative of the incineration flue gas.
2.3.2. Water Vapor Adsorption Isotherms
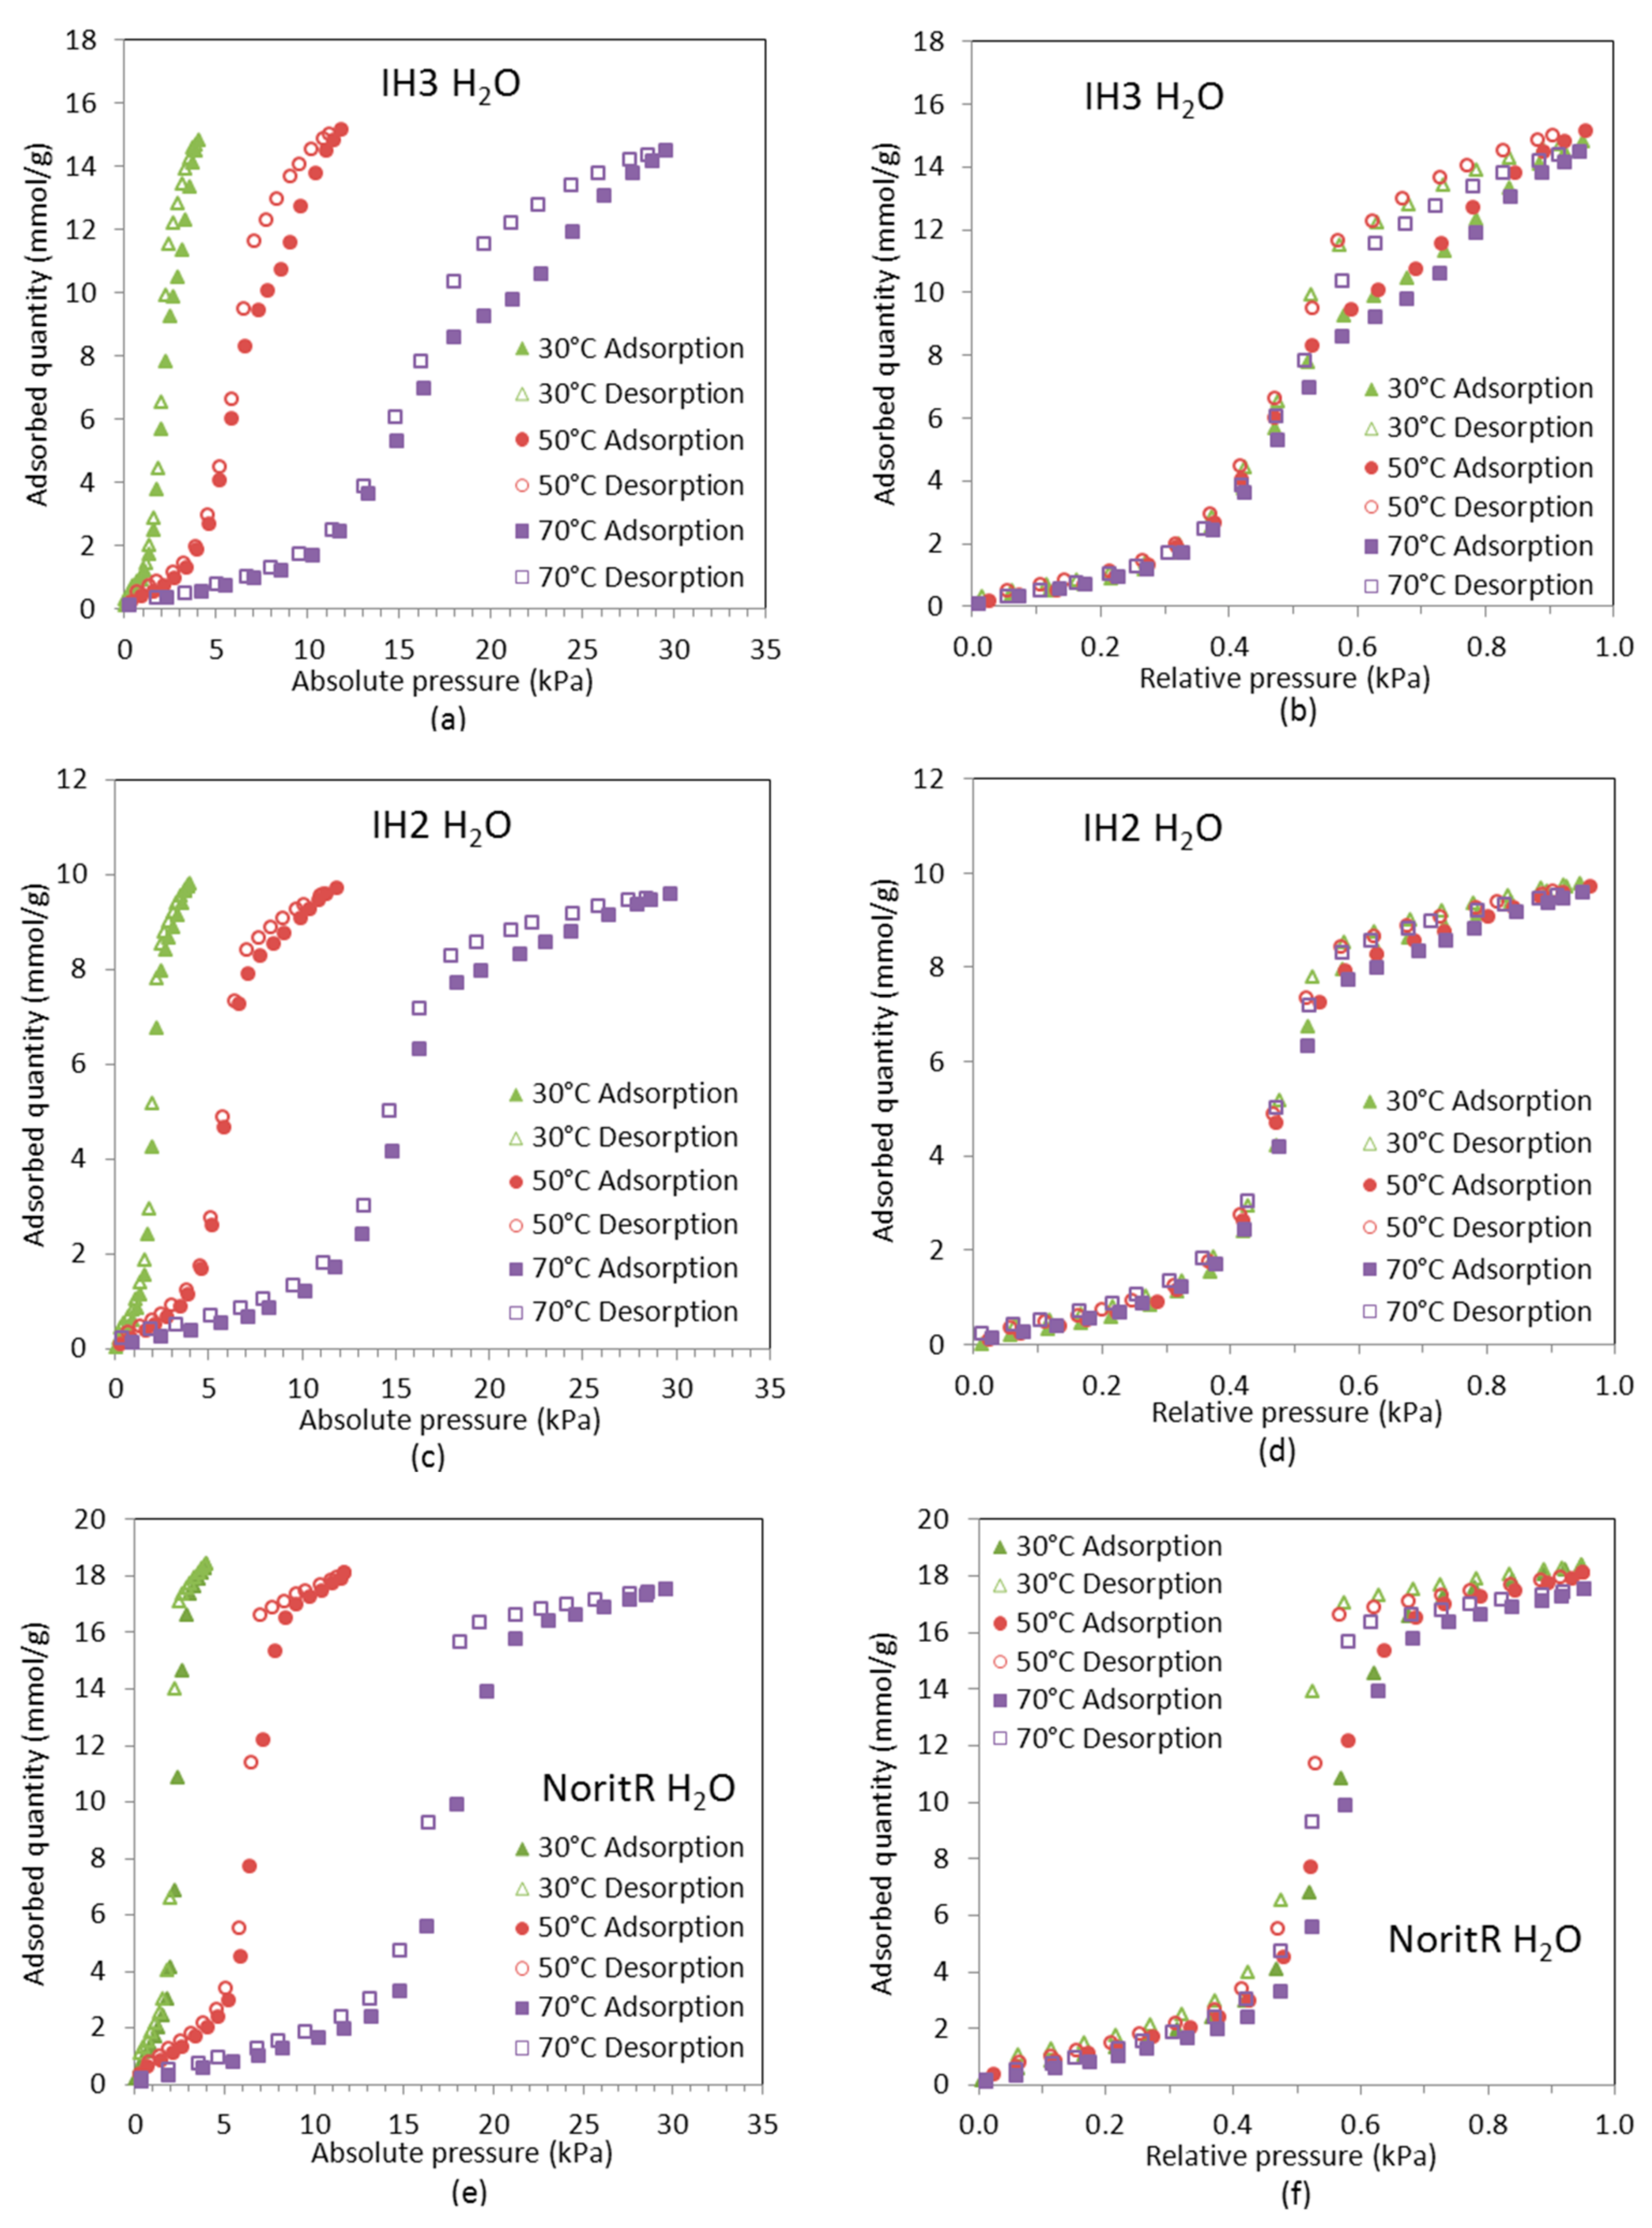
The adsorption isotherms of H2O at 30, 50, and 70 °C were measured up to the corresponding saturation pressure using a sorption analyzer (Hydrosorb 1000 HT, Quantachrome, Boynton Beach, FL, USA). Prior to the adsorption measurements, the sample was outgassed overnight under vacuum at 100 °C. During analysis, the temperature of the sample cell was controlled using a thermostatic circulating bath (Julabo, Seelbach, Germany). Figure 3 presents the water vapor adsorption isotherms for all the adsorbents tested.
Water vapor adsorption isotherms shown in Figure 3 present a Type V topology, according to the International Union of Pure and Applied Chemistry (IUPAC) classification, characterized by little water uptake at low relative pressures and the presence of a hysteresis loop over the majority of the pressure range [27]. Adsorption data have been plotted in terms of absolute pressure (Figure 3a,c,e) and relative pressure (Figure 3b,d,f) for illustrative purposes. Temperature limits the pressure range for the adsorption of water vapor due to condensation. The adsorption branches of the isotherms at the different temperatures almost overlap in the entire relative pressure range. Water vapor adsorption in ultramicropores is considered practically independent of temperature [28].
For IH2, the hysteresis loop between the adsorption and desorption branches of the H2O isotherms is narrower than for IH3 and Norit R, being almost negligible at the lowest temperature evaluated, which is related to its narrower pore size and smaller pore volume.
In adsorption processes, it is common to define a separation factor as follows:
where q (mol/kg) is the uptake and p (kPa) is the partial pressure of each component. A preliminary estimation of the selectivity factor could be made based on the pure component equilibrium data for the CO2/N2 and H2O/CO2 separation under incineration flue gas conditions. The values calculated by means of Equation (1) are shown in Table 3.
According to the results in Table 3, H2O is preferentially adsorbed on the carbons over CO2 that, at the same time, is much more adsorbed than N2. Norit R shows the greatest selectivity to H2O (nearly twice that of IH2 and IH3). Therefore, samples IH2 and IH3 seem more promising to separate CO2 under humid conditions. Moreover, the best CO2/N2 separation corresponds to IH2 at 30 °C and to IH3 when the adsorption temperature is increased to 50 °C or 70 °C.
3. Dynamic Breakthrough Experiments
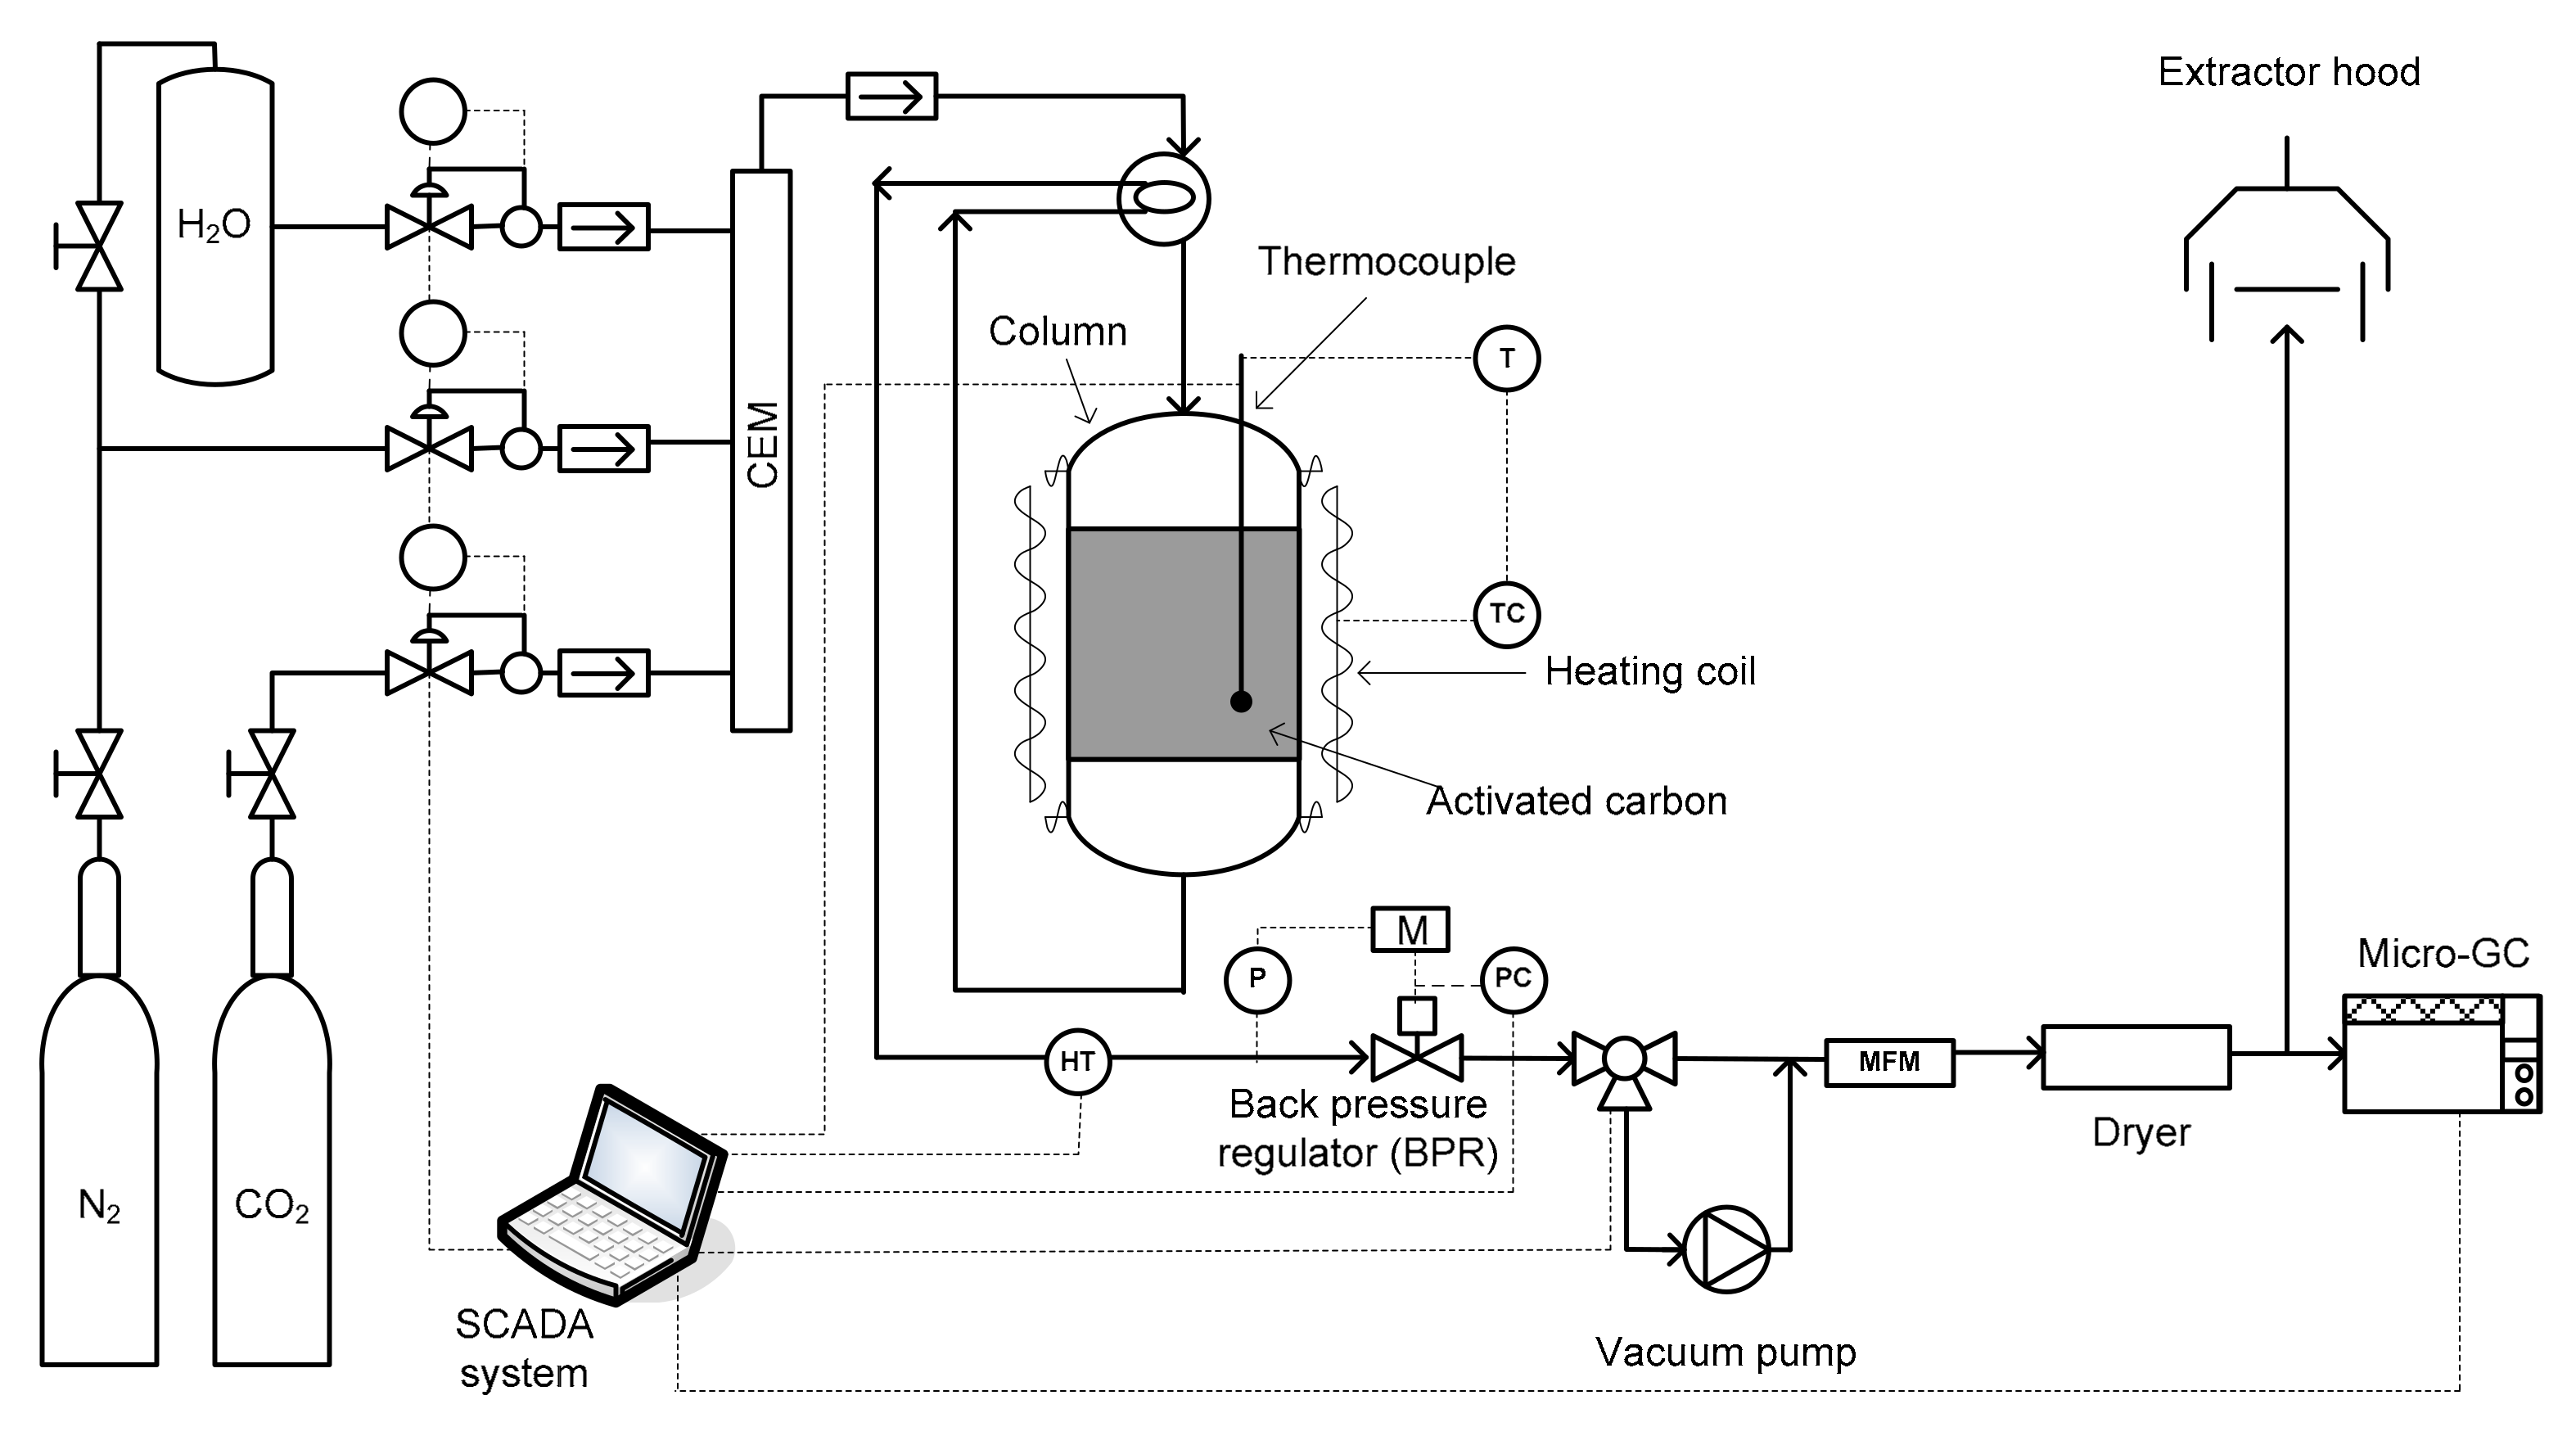
Breakthrough adsorption experiments of CO2/N2 and CO2/N2/H2O gas mixtures were conducted in a fixed-bed adsorption column. A purpose-built lab-scale rig was used; a scheme of the experimental set-up is presented in Figure 4. The adsorber (column) is a stainless steel reactor of 13 cm in height, 1.30 cm in diameter and is equipped with a porous plate located 4.7 cm from the base of the column that prevents the solids flow. A controlled evaporator mixer (CEM) coupled with a liquid delivery system (LDS) to feed liquid H2O (LIQUI-FLOW type, from Bronkhorst High Tech, Ruurlo, The Netherlands) and two mass flow controllers (El-FLOW type, from Bronkhorst High Tech) allow feeding a mixture of up to three components (CO2, N2, and H2O(v)) with the desired flow rate and composition. This gas feeding system is purposely intended to conduct experiments with a precise control of humidity conditions. A K-type thermocouple was used to continuously monitor the column temperature with an accuracy of ±1.5 °C. The temperature was controlled by coupling the heating element coiled around the reactor to an air-cooling device. The relative humidity of the gas mixture was monitored by means of a humidity and temperature sensor Hygroclip 2 (HT) from Rotronic (Bassersdorf, Switzerland). The bed pressure was controlled by means of a back-pressure regulator (BPR) located in the outlet pipe with a pressure range of 0–2.5 bar (WIKA, model A-10) in order to have great accuracy in the pressure range that is to be encountered in waste incineration conditions (accuracy ≤ ±1% of span). A vacuum system can be connected to the unit through a 3-way pneumatic valve. The vacuum line is composed of a vacuum controller coupled to a Pirani transmitter and an electromagnetic angle valve that is connected to a diaphragm pump. The mass flow rate of the effluent from the adsorbent bed was measured using a mini CORI-FLOW meter (MFM) from Bronkhorst (Ruurlo, The Netherlands). A dryer column filled with magnesium perchlorate is located after the mass flow meter, to remove water from the effluent prior to analysis by a dual channel micro-gas chromatograph (CP 4900 from Varian-Agilent Technologies, Santa Clara, CA, USA), fitted with a thermal conductivity detector (TCD) [29]. The TCD response is calibrated with CO2/N2 mixtures of known composition. Data are recorded with a Supervisory Control and Data Acquisition (SCADA) system.
3.1. Binary CO2/N2 Breakthrough Experiments
In order to evaluate the performance of the studied adsorbents to separate CO2 from CO2/N2 gas streams, the fixed-bed adsorption unit was used to run breakthrough experiments with binary gas mixtures. Before each experiment the adsorbent was dried by flowing N2 (140 cm3/min for 60 min at 150 °C and atmospheric pressure). The adsorbent was subjected to eight consecutive adsorption–desorption cycles to test the reproducibility of the system.
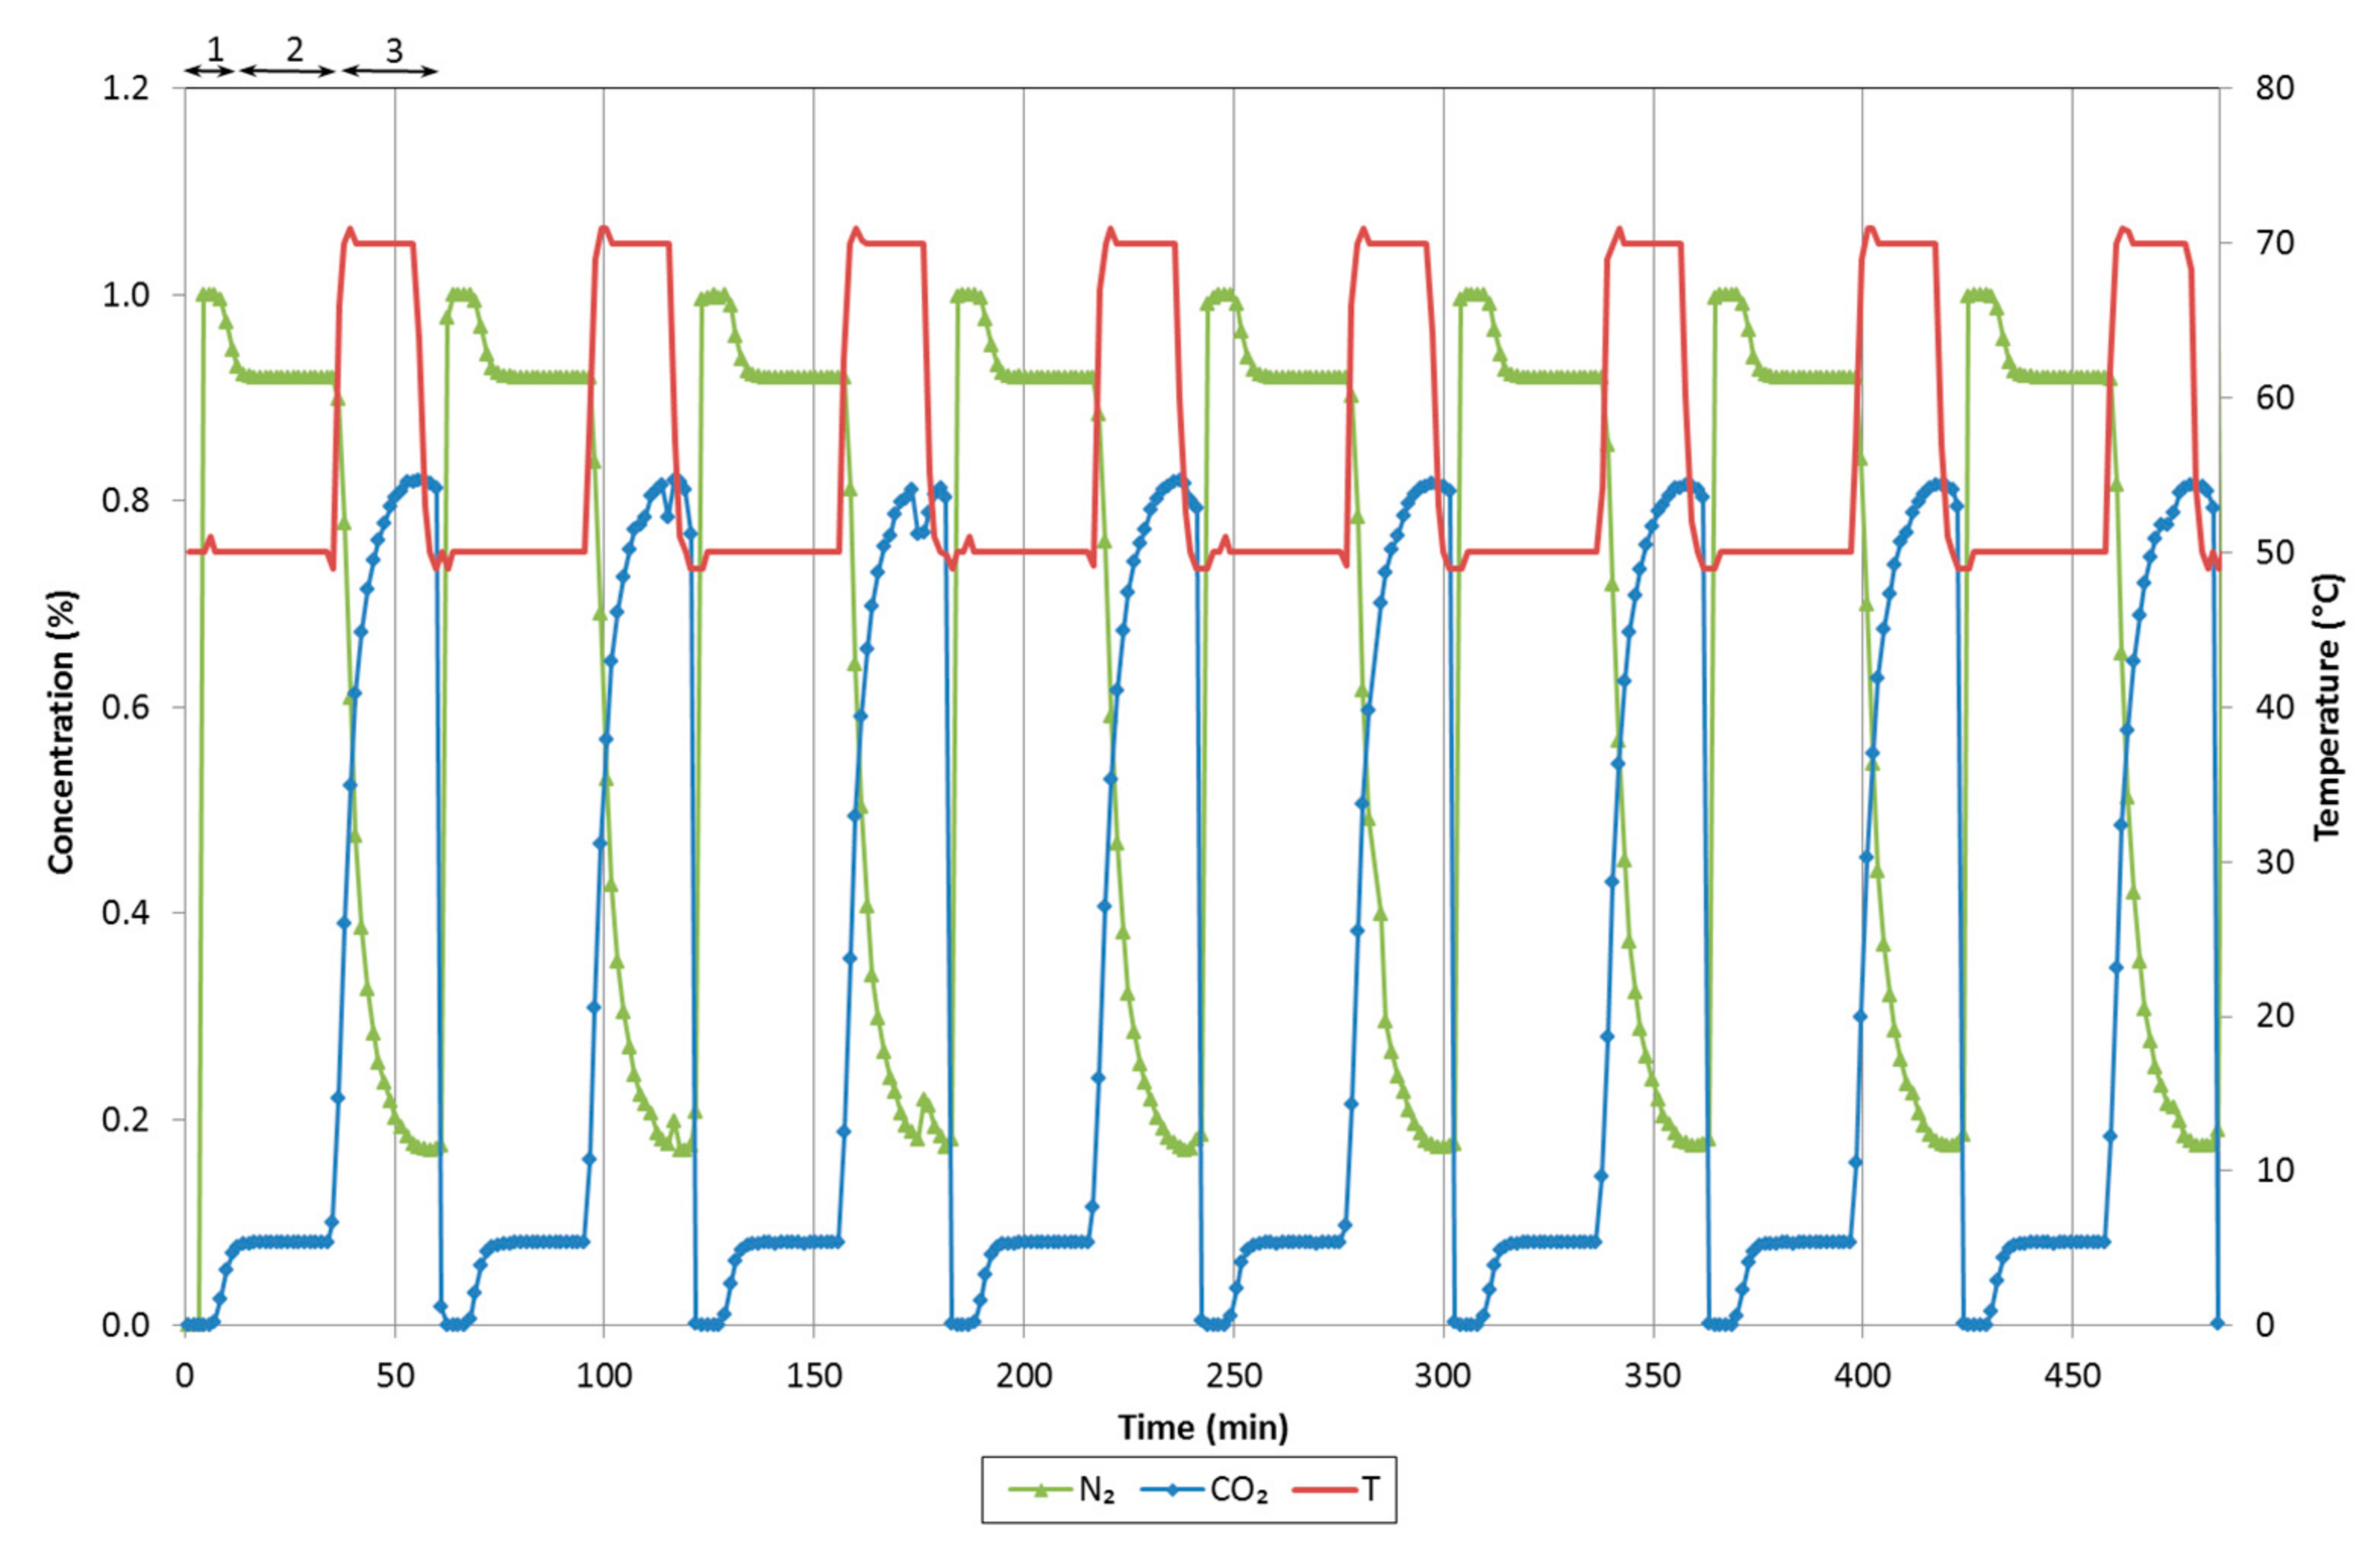
Each experimental run involved the following steps: (1) pressurization and cooling of the bed in a preconditioning step of 5 min, where 140 cm3/min (STP) of N2 was allowed to flow through the system; (2) feed gas switch to a CO2/N2 gas mixture to initiate the adsorption step for 30 min at the selected temperature; and (3) depressurization of the unit by lowering the pressure to sub-atmospheric and raising the temperature to 70 °C for 25 min to fully desorb the adsorptive gases from the column. The minimum pressure of the vacuum line was set to 0.1 kPa. The outlet gas concentrations and the bed temperature profiles for the eight consecutive adsorption–desorption cycles are shown in Figure 5.
As can be observed from the concentration profile of CO2 in Figure 5, CO2 is not detected at the beginning of the adsorption step since it is adsorbed on the solids bed. As time goes by, the outlet CO2 concentration increases until it approaches to feed concentration level, indicating that the column is saturated. During the evacuation step, the bed pressure is reduced, the temperature increased and the concentration of CO2 leaving the adsorber reaches its maximum value.
The capture capacity was evaluated as an average of the adsorption performance of the adsorbents after consecutive adsorption–desorption cycles. A mass balance was applied to the bed in each adsorption–desorption cycle to calculate the specific amount of CO2 adsorbed at equilibrium and the holdup of the gas phase was discounted applying correction factors. Detailed information about the calculation procedure can be found in [30]. The breakthrough times (time required for the CO2 concentration front to reach the bed outlet) were taken at a relative concentration (CCO₂,outlet/CCO₂,feed) of 0.05. The total amount of H2O adsorbed at the time when the saturation is reached and the breakthrough times of water vapor are estimated from the experimental breakthrough curves in the same way as CO2.
3.2. Ternary CO2/N2/H2O Breakthrough Experiments
Dynamic experiments were carried out in the fixed-bed adsorption unit with mixtures of N2, CO2, and H2O(v) at 50 °C in order to assess the influence of water vapor in CO2 adsorption. The adsorbent was subjected to eight consecutive adsorption–desorption cycles to test the reproducibility of the system. The experimental run included the same steps as in the dry experiment. The sole difference is that during the adsorption step (second step) a ternary mixture (CO2/N2/H2O) is fed to the adsorber.
During cyclic operation in an industrial process, regeneration is expected to be interrupted before completion. Therefore, the adsorbent is not fully regenerated at the beginning of each cycle. The overlapping of experimental data in Figure 6 confirms that the cyclic steady state (the molar flow rates at any time in the cycle remain the same in all subsequent cycles) is reached at the second cycle for CO2 and around the fourth cycle for water vapor.
In addition, to evaluate the effect of CO2 on H2O adsorption at different temperatures (30 and 50 °C), the ternary N2/CO2/H2O breakthrough curve is also compared to the binary N2/H2O breakthrough curve obtained in the absence of CO2. Moreover, a ternary N2/CO2/H2O breakthrough curve was obtained departing from a bed initially saturated with H2O and N2 to evaluate CO2 adsorption under less favorable conditions. In all cases, the feed flowrate was set to 143 cm3/min, the total pressure was 140 kPa and the adsorbent was initially regenerated and in equilibrium with N2 at the temperature of the experiment.
The cumulative amount of CO2 and H2O adsorbed calculated from the experimental data (qCO2 and qH2O) were compared to the pure component adsorption isotherm ( and qH2O*), respectively.
4. Results and Discussion
Dynamic breakthrough experiments to evaluate the performance of the pine sawdust based adsorbents to separate CO2 from gas mixtures representative of incineration flue gas were carried out at different temperatures in the range 30–70 °C. The characteristics of the beds of adsorbent are presented in Table 4. In all experiments, the height of the solids bed was kept approximately constant and so the mass of adsorbent varied according to the bed density. It can be observed in Table 4 that the commercial carbon, Norit R, presents the densest bed.
4.1. Binary CO2/N2 Breakthrough Experiments
Binary breakthrough adsorption experiments were performed at three temperatures (30, 50 and 70 °C) feeding a gas mixture with 8% of CO2 (balance N2). In all cases, the feed flowrate was set to 140 cm3/min, the total pressure was 140 kPa and the adsorbent was initially regenerated and in equilibrium with N2 at the experimental temperature. The results are shown in Figure 7, where C/C0 represents the ratio between the concentration leaving the adsorber at a given time (C) and that in the feed (C0).
Breakthrough experiments showed steep breakthrough curves, presenting IH3 a slightly higher slope than IH2 and Norit R. This confirms that the overall mass transfer resistance for the adsorbents is small, which is highly desirable for a rapid swing adsorption process.
The obtained breakthrough curves are translated into dynamic uptake capacity by integration, with longer breakthrough times yielding higher uptake capacities. Results are shown in Table 5. As expected, CO2 uptake decreases with temperature and the performance on a mass basis of IH3 is superior to that of IH2 which, in turn, is better than Norit R. Nevertheless, it can be observed that Norit R presents greater breakthrough times.
Figure 8 represents consecutive breakthrough curves carried out with a feed gas consisting of 8% CO2 (balance N2), at 140 kPa and 50 °C. Blue symbols correspond to CO2, whereas green ones represent N2. Symbols overlap for all the consecutive curves, indicating a good repeatability and reproducibility of the adsorption–desorption cycles.
The thermal wave observed as a consequence of CO2 adsorption is shown in Figure 8b,d,f. It is larger for IH3 due to the greater amount of CO2 adsorbed in a slightly shorter time when compared to Norit R.
4.2. Ternary CO2/N2/H2O Breakthrough Experiments
The behavior of the adsorbents under humid conditions was assessed by different experiments and compared to the previous results with dry flue gas mixtures.
4.2.1. Cyclic Operation
The CO2, N2 and H2O breakthrough curves were measured for the activated carbons under study and C/C0 (ratio between the outlet CO2, N2 or H2O concentration at a given time and that in the feed) was plotted versus time. In Figure 9 the last five consecutive cycles (Cycles 4–8), in which concentration of both CO2 and H2O can be considered stable, are represented. As far as CO2 is concerned, the adsorbents reached saturation (maximum adsorption capacity of the adsorbed components) during the adsorption step and they were practically fully regenerated during the desorption step. However, water adsorption and desorption was slower. Therefore, it is observed in Figure 9 that C/C0 for H2O at t = 0 is around 0.2 for IH3 and IH2 and 0.6 for Norit R.
Both CO2 and water vapor breakthrough curves are steeper for IH3 than for IH2, showing that the latter has greater mass transfer resistance due to diffusion based constraints associated to the less developed porosity. Norit R presents similar diffusional resistance to IH2 for CO2; however, the breakthrough times are bigger.
It is noteworthy that kinetics of H2O adsorption/desorption on Norit R are particularly slow. At 50 °C and a working partial pressure of H2O around 2.4 kPa, the adsorption capacity of Norit R, as expected from the equilibrium adsorption isotherm, is about 1.20 mmol/g. Thus, it is larger than for the other two samples: 0.79 mmol/g for IH3 and 0.56 mmol/g for IH2. Nevertheless, considerable differences can be observed between partial pressures of H2O at the beginning and the end of the adsorption stage under cyclic operation. The initial and final partial H2O pressures are 0.44 and 2.21 kPa for IH3 and 0.35 and 1.75 kPa for IH2, whereas the values obtained for Norit R are 0.56 and 0.79 kPa, respectively. This is most probably the reason why breakthrough curves of CO2 for Norit R show significant differences between the dry and wet cyclic operation and, therefore, there is a greater reduction in breakthrough times.
In addition, it is found that the shape of the water breakthrough curve of Norit R under cyclic operation is very different in comparison to biomass adsorbents IH2 and IH3. The experiment with Norit R reached low water vapor partial pressure meaning that, at the end of the adsorption step, working pressure conditions correspond to the first region of the water vapor adsorption isotherm before the steep H2O uptake. Table 6 summarizes the average CO2 uptakes and breakthrough times attained during the wet cyclic breakthrough experiments. Both IH3 and IH2 show enhanced performance in terms of CO2 adsorption under humid conditions when compared to Norit R.
A small roll-up phenomenon can be observed in the detail of the CO2 curve in Figure 9: as the front of H2O travels through the bed, part of the CO2 initially adsorbed is displaced by the adsorption of H2O. However, this is not observed for Norit R because the quantity adsorbed of H2O in each cycle is small given that the adsorption time is limited to 30 min.
4.2.2. Non-Cyclic Operation
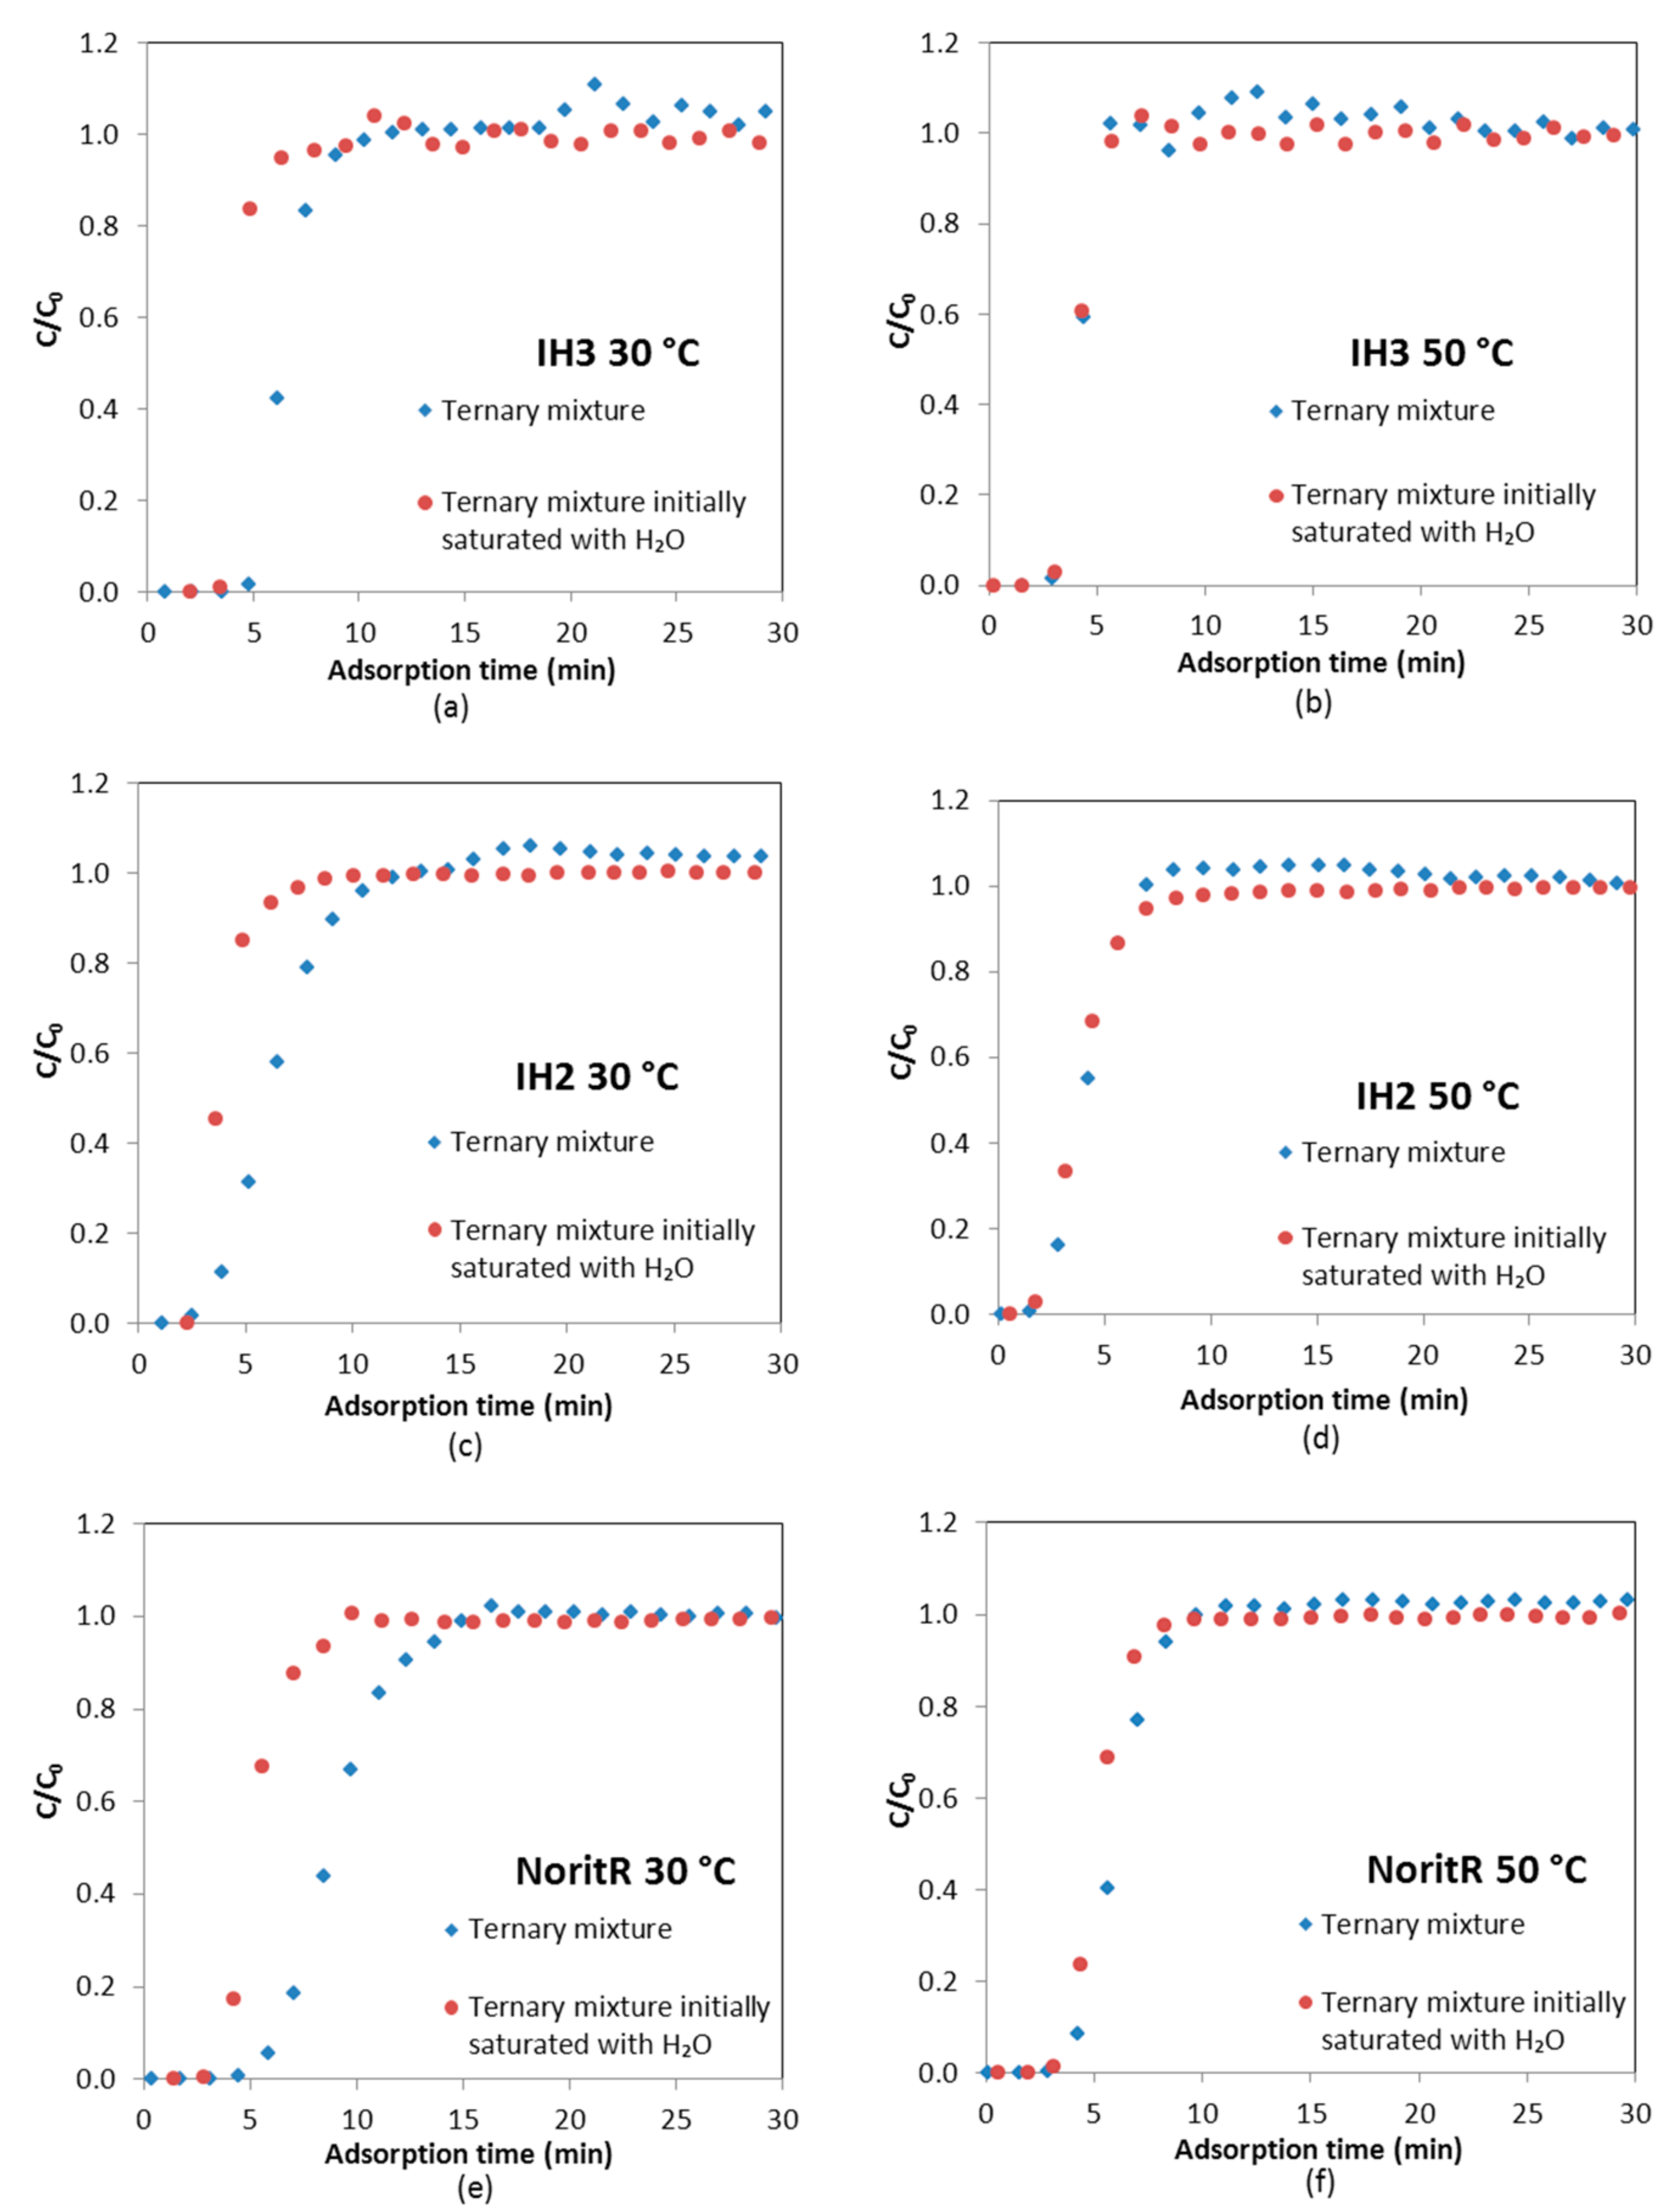
Ternary breakthrough curves were carried out using mixtures of N2, CO2 and H2O, and these were compared to binary breakthrough curves carried out with N2 and H2O mixtures to assess the influence of CO2 on H2O adsorption departing from a fully regenerated adsorbent. Moreover, the influence of H2O on CO2 adsorption was studied comparing the behavior of a ternary N2/H2O/CO2 mixture fed to a regenerated adsorbent and to an adsorbent initially saturated with H2O. To evaluate the dynamic adsorption at different relative humidity (RH), experiments were performed at 30 °C (RH ≈ 60%) and 50 °C (RH ≈ 22%).
Dynamic adsorption experiments with gas mixtures at high relative humidity were carried out. A breakthrough curve of water vapor for a binary mixture of 98% N2 and 2% H2O obtained at 30 °C is compared with the breakthrough curve for a ternary mixture of 8% CO2, 90 % N2 and 2% H2O. As can be seen in Figure 10, the shape of the breakthrough curve of H2O for a binary H2O/N2 mixture is similar to that of the ternary N2/CO2/H2O mixture fed to a fresh bed. These results indicate that H2O adsorption is little affected by CO2 adsorption.
Comparing the H2O breakthrough curves for IH3, IH2 and Norit R, it can be observed that they have slightly different shapes. This can be directly ascribed to the shape of the equilibrium adsorption isotherms. The H2O breakthrough curve of IH2 presents two uptake zones with an intermediate plateau, while, in the curves of IH3 and Norit R, the second uptake is not observed because, at the working partial pressure of water vapor (≈2.4 and 2.3 kPa, respectively), a steep rise in the H2O uptake is to take place according to the corresponding adsorption isotherms in Figure 10.
The experimental water vapor partial pressure at saturation is slightly lower for IH3 experiments than for IH2 (2.35–2.4 kPa vs. 2.55–2.6 kPa), thus, according to the pure component adsorption isotherms of H2O, both samples are expected to adsorb approximately the same amount of water (≈8 mmol/g). However, water vapor adsorption on carbon IH3 is somewhat smaller than on IH2. To the authors’ knowledge this could only be due to the cumulative error associated with the integration of the experimental data over longer times in the experiments with IH3 (1260 min for IH3 vs. 920 min for IH2). Norit R presents greater water vapor adsorption capacity and slower kinetics than the pine sawdust carbon pellets, hence water vapor breakthrough is postponed and the saturation point is reached after more than 3200 min from the beginning of the water vapor feeding.
Table 7 summarizes the water adsorption uptake and breakthrough times for experiments at 30 °C (RH ≈ 60%) and 50 °C (RH ≈ 22%). It is worth noting that the total feed flow rate and its content in H2O was the same for both experiments. Norit R presents the highest H2O adsorption capacity and much longer breakthrough times both at low and at high relative humidity conditions. On the contrary, IH2 shows shorter breakthrough times and lower water vapor uptake at a relative humidity of 22%, whereas IH3 adsorbs less water vapor under high humidity conditions. The H2O uptakes calculated for the ternary and binary mixtures at each temperature confirm the little influence of CO2 on the H2O adsorption capacity.
Under high relative humidity condition the evaluated carbons tend to lose H2O adsorption capacity when compared to the uptake estimated from the H2O equilibrium adsorption isotherms. On the contrary, low RH conditions seem to enhance the H2O uptake during the breakthrough testing, although this could be due to more uncertainty on the equilibrium data for H2O adsorption at these low partial pressures.
In addition, to further assess the influence that water holdup can represent to CO2 adsorption, a ternary mixture with 90% N2, 8% CO2 and 2% H2O was fed to the adsorbent bed previously saturated with H2O. The obtained CO2 breakthrough curve is compared to that from the ternary mixture departing from a fully regenerated adsorbent bed in Figure 11.
The CO2 concentration profiles of the adsorbents under the two evaluated conditions substantially differ and point out the influence of humidity conditions of the adsorbent bed on its CO2 capture performance. However, the slope of the CO2 breakthrough curves might suggest that mass transfer would be favored when the bed is initially saturated with H2O. A roll up effect (C/C0 > 1) that indicates the displacement of CO2 by the adsorption of H2O can be observed in Figure 11 in the case of IH2 and IH3; however, Norit R requires a longer time to discern it (around 90 min) due to its higher adsorption capacity for H2O.
Table 8 reports the CO2 uptakes and breakthrough times estimated from the ternary breakthrough experiments with initially fully wet and fresh beds. Experimental breakthrough results (qCO2) are also compared to the data from the pure component adsorption isotherms ().
The dynamic experiments carried out using ternary mixtures of CO2, N2 and H2O over a fully regenerated adsorbent bed (free of CO2 and H2O at t = 0) show no reduction in the breakthrough time for CO2, compared to the dry cases.
The CO2 adsorption capacities and breakthrough times are similar for both ternary experiments (bed initially saturated with water vapor and fully regenerated) at 50 °C and to the values previously estimated for the binary mixture experiments conducted at 50 °C. A maximum reduction of ≈20% when compared to the CO2 uptake estimated from the equilibrium CO2 adsorption isotherms is observed. However, at 30 °C CO2 adsorption capacity decreases to a great extent (a minimum reduction of ≈50% from the equilibrium CO2 adsorption isotherms) by the co-adsorption of H2O when feeding a humid gas stream to a bed saturated with water vapor. Therefore, the breakthrough time of CO2 is also reduced. This performance accounts for the equilibrium adsorption capacity for pure water vapor at the relative humidity of the feed (e.g., RH ≈ 60%) that is more than 12 times greater than the adsorption capacity for pure CO2 at the partial pressure of CO2 in the feed.
Under high relative humidity conditions, which represent the worst case scenario for the adsorption of CO2, the capacity to adsorb CO2 on Norit R seems less affected than that of IH2 and IH3 when the CO2 mixture is fed to a saturated bed. However, it can be noted that under all the evaluated conditions of relative humidity and initial conditions of the bed, IH3 generally shows higher CO2 uptake on a mass basis than the other two adsorbents.
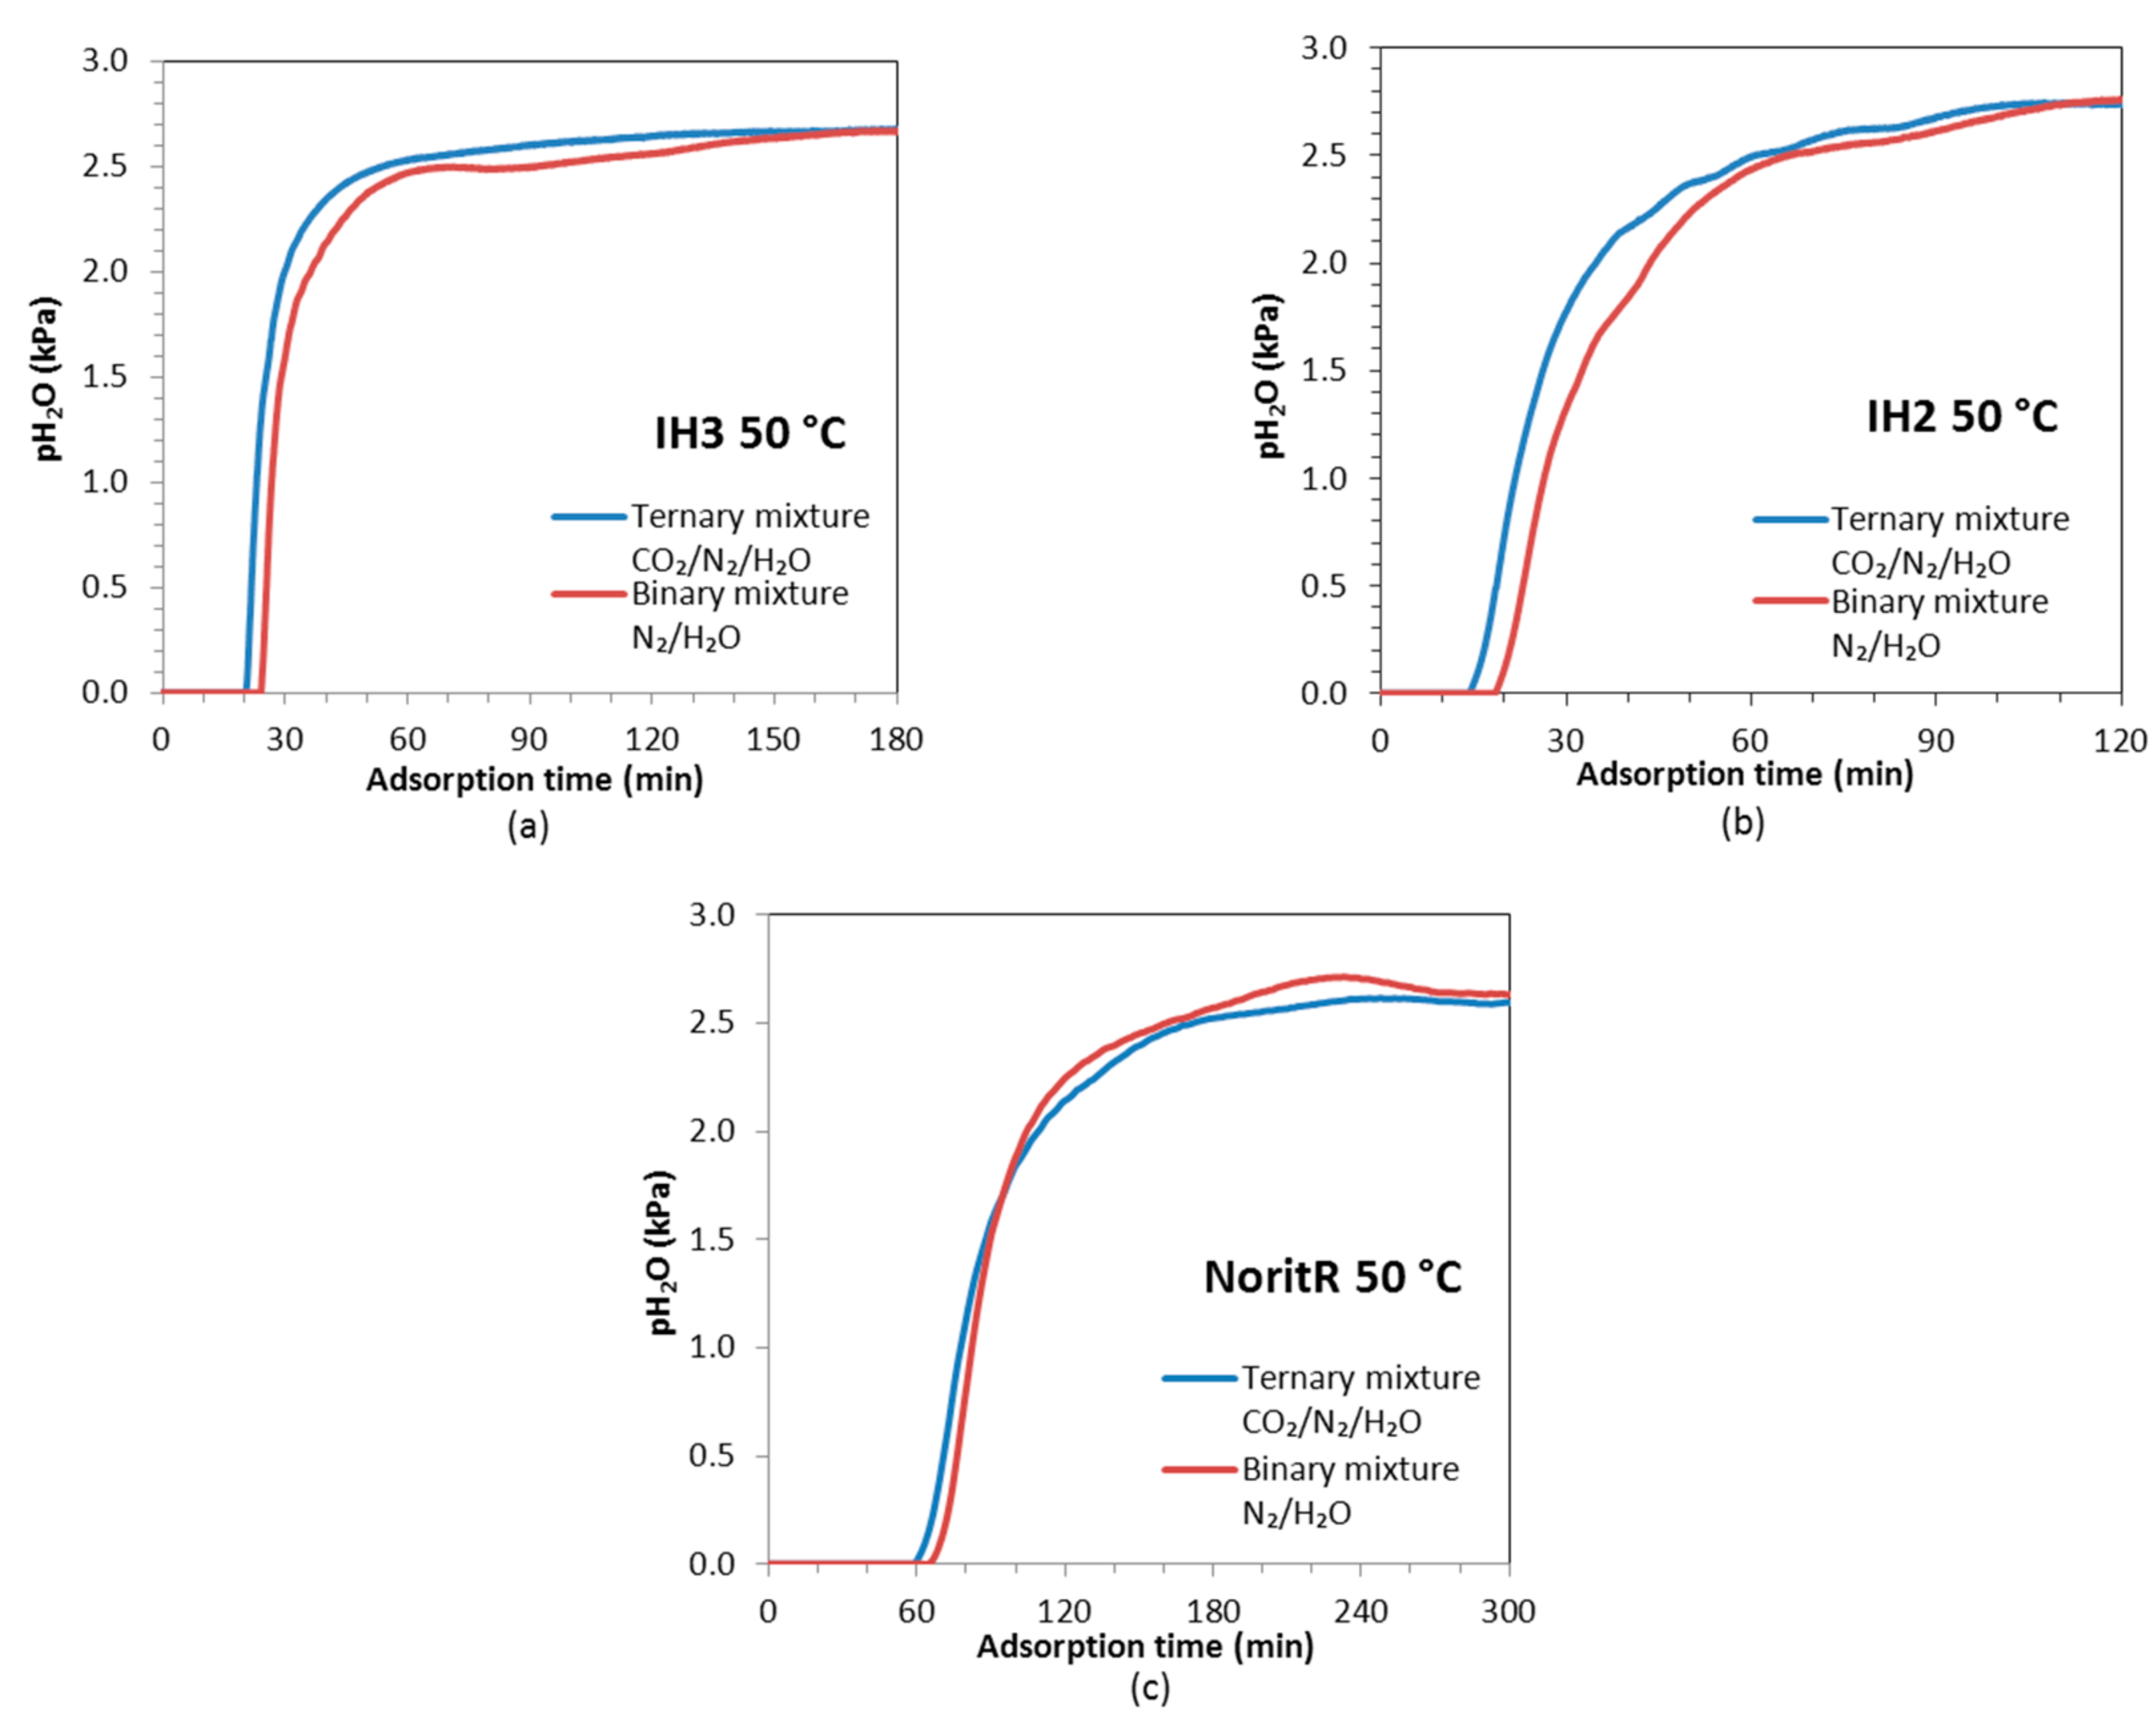
The breakthrough curves of H2O were also tested at low relative humidity (RH ≈ 22%) conditions showing a single uptake zone with a steep breakthrough (see Figure 12). When the relative humidity of the feed is low, the working pressure of water vapor is located within the first region of the adsorption isotherm before the steep uptake takes place. The shape of the H2O curves is similar for both the binary N2/H2O and ternary N2/CO2/H2O experiments; however, the H2O breakthrough is slightly anticipated for the ternary mixture due to the competitive co-adsorption of CO2.
The steeper slopes of the H2O breakthrough curves in the IH3 bed indicate less diffusional resistance for adsorption than in the other two adsorbent beds. On activated carbon IH2 the saturation point is reached after approximately 110 min, IH3 needs around 150 min and Norit R up to 240 min. In addition, the three samples adsorbed a little bit more of water vapor in the binary mixture experiment than in the ternary one, due to the absence of CO2 adsorption competition.
At 50 °C, the relative humidity of the feed is lower (RH ≈ 22%) so the equilibrium adsorption capacity for pure H2O is only 1.5 times greater than that for pure CO2 at the partial pressure of CO2 in the feed. Therefore, CO2 adsorption is barely affected by H2O adsorption in low humidity conditions. In fact, as could be observed in Figure 11, the breakthrough curves of CO2 over a fresh bed and over a bed saturated with H2O almost overlap for all the samples in the experiments at 50 °C. CO2 breaks first through the beds of IH2 and IH3 than through Norit R; however, IH3 reaches equilibrium first meaning that adsorption kinetics is faster on this sample.
The results presented herein are in good agreement with those from a previous work [21] carried out with a biomass based carbon adsorbent evaluated under post-combustion capture conditions (14% CO2 at ambient temperature). A reduction in the CO2 adsorption capacity up to 64% was found for a relative humidity in the gas feed of 95%.
5. Conclusions
Three activated carbons were examined: two were prepared departing from pine sawdust and the other is a commercial activated carbon supplied by Norit. Their behavior was evaluated for CO2 capture in a solid waste incineration facility. To the best of the authors’ knowledge, no previous studies on CO2 capture from waste incineration plants by means of adsorption have been reported.
Adsorption equilibrium was firstly studied for the components present in the flue gas stream, including water vapor, at different temperatures and up to 120 kPa. Dynamic adsorption–desorption studies in a fixed-bed system under dry and wet conditions revealed the importance of a multicomponent evaluation to assess the performance of adsorbents for a particular application. The maximum adsorption capacity for CO2 is reached in dry conditions, whereas the minimum corresponds to the case when CO2 is fed to a bed saturated with H2O at 30 °C. Therefore, the CO2 adsorption capacity is proven to be reduced down to almost 54% by the co-adsorption of H2O at high relative humidity conditions when compared to the dry experiments. On the other hand, it was shown that H2O is little affected by CO2 adsorption. In addition, it has been demonstrated that low humidity conditions do not affect the CO2 capture performance of the adsorbents.
It is, thereupon, necessary to consider the effect of water vapor for a CO2 capture process design. In swing adsorption cycles, the step times are in the order of seconds up to a few minutes. Having in mind the slow kinetics of water vapor adsorption, with a tailored cycle configuration the moisture loading can be kept low. Under cyclic operation in humid conditions, IH3 showed the highest CO2 uptake per gram of adsorbent. Even though Norit R seems promising due to its larger breakthrough time, it presents the highest H2O loading at short adsorption times which is detrimental for the CO2 separation.
All adsorbents evaluated showed good performance in terms of CO2 adsorption capacity under conditions representative of incineration flue gas; however, IH3 outperformed in adsorption kinetics and CO2 capture capacity on a mass basis.
Acknowledgments
This work has received financial support from the Spanish MINECO (Retos-Colaboración RTC-2014-2109-5) and from the Gobierno del Principado de Asturias (PCTI-GRUPIN14-079).
Author Contributions
Inés Durán conducted experimental work and data analysis. Inés Durán, Fernando Rubiera and Covadonga Pevida discussed the results and contributed to the writing of the manuscript.
Conflicts of Interest
The authors declare no conflicts of interest.
References
- Wey, M.Y.; Ou, W.Y.; Liu, Z.S.; Tseng, H.H.; Yang, W.Y.; Chiang, B.C. Pollutants in incineration flue gas. J. Hazard. Mater. 2001, 82, 247–262. [Google Scholar] [CrossRef]
- Gottschalk, J.; Buttmann, P.; Johansson, T. Modern flue-gas cleaning system for waste incineration plants. Filtr. Sep. 1996, 33, 383–388. [Google Scholar] [CrossRef]
- Quina, M.J.; Bordado, J.C.M.; Quinta-Ferreira, R.M. Air pollution control in municipal solid waste incinerators. In The Impact of Air Pollution on Health, Economy, Environment and Agricultural Sources; Khallaf, M.K., Ed.; InTech: Rijeka, Croatia, 2011; Chapter 16; pp. 331–358. [Google Scholar]
- Aouini, I.; Ledoux, A.; Estel, L.; Mary, S. Pilot Plant Studies for CO2 Capture from Waste Incinerator Flue Gas Using MEA Based Solvent. Oil Gas Sci. Technol. 2014, 69, 1091–1104. [Google Scholar] [CrossRef]
- Zevenhoven, R.; Kilpinen, P. Flue gases and fuel gases. In Control of Pollutants in Flue Gases and Fuel Gases; Helsinki University of Technology: Espoo, Finland, 2001; Chapter 2. [Google Scholar]
- Leung, D.Y.C.; Caramanna, G.; Maroto-Valer, M.M. An overview of current status of carbon dioxide capture and storage technologies. Renew. Sustain. Energy Rev. 2014, 39, 426–443. [Google Scholar] [CrossRef]
- Choi, S.; Drese, J.H.; Jones, C.W. Adsorbent materials for carbon dioxide capture from large anthropogenic point sources. ChemSusChem 2009, 2, 796–854. [Google Scholar] [CrossRef] [PubMed]
- Lee, S.Y.; Park, S.J. A review on solid adsorbents for carbon dioxide capture. J. Ind. Eng. Chem. 2015, 23, 1–11. [Google Scholar] [CrossRef]
- Samanta, A.; Zhao, A.; Shimizu, G.K.H.; Sarkar, P.; Gupta, R. Post-combustion CO2 capture using solid sorbents: A review. Ind. Eng. Chem. Res. 2011, 51, 1438–1463. [Google Scholar] [CrossRef]
- Sayari, A.; Belmabkhout, Y.; Serna-Guerrero, R. Flue gas treatment via CO2 adsorption. Chem. Eng. J. 2011, 171, 760–774. [Google Scholar] [CrossRef]
- Rashidi, N.A.; Yusup, S. An overview of activated carbons utilization for the post-combustion carbon dioxide capture. J. CO2 Util. 2016, 13, 1–16. [Google Scholar] [CrossRef]
- Radosz, M.; Hu, X.; Krutkramelis, K.; Shen, Y. Flue-gas carbon capture on carbonaceous sorbents: Toward a low-cost multifunctional carbon filter for “green” energy producers. Ind. Eng. Chem. Res. 2008, 47, 3783–3794. [Google Scholar] [CrossRef]
- Montagnaro, F.; Silvestre-Albero, A.; Rodríguez-Reinoso, F.; Erto, A.; Lancia, A.; Balsamo, M. Post-combustion CO2 adsorption on activated carbons with different textural properties. Microporous Mesoporous Mater. 2015, 209, 157–164. [Google Scholar] [CrossRef]
- Calvo-Muñoz, E.M.; García-Mateos, F.J.; Rosas, J.M.; Rodríguez-Mirasol, J.; Cordero, T. Biomass waste carbon materials as adsorbents for CO2 capture under post-combustion conditions. Front. Mater. 2016, 3, 1–14. [Google Scholar] [CrossRef]
- Balsamo, M.; Tsyntsarski, B.; Erto, A.; Budinova, T.; Petrova, B.; Petrov, N.; Lancia, A. Dynamic studies on carbon dioxide capture using lignocellulosic based activated carbons. Adsorption 2015, 21, 633–643. [Google Scholar] [CrossRef]
- Dubinin, M.M.; Zaverina, E.D.; Serpinsky, V.V. The sorption of water vapour by active carbon. J. Chem. Soc. 1955, 1760–1766. [Google Scholar] [CrossRef]
- Wang, R.; Amano, Y.; Machida, M. Surface properties and water vapor adsorption-desorption characteristics of bamboo-based activated carbon. J. Anal. Appl. Pyrolysis 2013, 104, 667–674. [Google Scholar] [CrossRef]
- Querejeta, N.; Plaza, M.; Rubiera, F.; Pevida, C. Water vapor adsorption on biomass based carbons under post-combustion CO2 capture conditions: Effect of post-treatment. Materials 2016, 9, 359. [Google Scholar] [CrossRef]
- Vagner, C.; Finqueneisel, G.; Zimny, T.; Weber, J. Water vapour adsorption on activated carbons: Comparison and modelling of the isotherms in static and dynamic flow conditions. Fuel Process. Technol. 2002, 77–78, 409–414. [Google Scholar] [CrossRef]
- Hefti, M.; Joss, L.; Marx, D.; Mazzotti, M. An experimental and modeling study of the adsorption equilibrium and dynamics of water vapor on activated carbon. Ind. Eng. Chem. Res. 2015, 54, 12165–12176. [Google Scholar] [CrossRef]
- Plaza, M.G.; Durán, I.; Querejeta, N.; Rubiera, F.; Pevida, C. Experimental and simulation study of adsorption in postcombustion conditions using a microporous biochar. 2. H2O, CO2, and N2 adsorption. Ind. Eng. Chem. Res. 2016, 55, 6854–6865. [Google Scholar] [CrossRef]
- Xu, D.; Xiao, P.; Zhang, J.; Li, G.; Xiao, G.; Webley, P.A.; Zhai, Y. Effects of water vapour on CO2 capture with vacuum swing adsorption using activated carbon. Chem. Eng. J. 2013, 230, 64–72. [Google Scholar] [CrossRef]
- Plaza, M.G.; Durán, I.; Rubiera, F.; Pevida, C. CO2 adsorbent pellets produced from pine sawdust: Effect of coal tar pitch addition. Appl. Energy 2015, 144, 182–192. [Google Scholar] [CrossRef]
- Dantas, T.L.P.; Luna, F.M.T.; Silva, I.J.; de Azevedo, D.C.S.; Grande, C.A.; Rodrigues, A.E.; Moreira, R.F.P.M. Carbon dioxide-nitrogen separation through adsorption on activated carbon in a fixed bed. Chem. Eng. J. 2011, 169, 11–19. [Google Scholar] [CrossRef]
- Pevida, C.; Plaza, M.G.; Arias, B.; Fermoso, J.; Rubiera, F.; Pis, J.J. Surface modification of activated carbons for CO2 capture. Appl. Surf. Sci. 2008, 254, 7165–7172. [Google Scholar] [CrossRef]
- Martín, C.F.; Plaza, M.G.; Pis, J.J.; Rubiera, F.; Pevida, C.; Centeno, T.A. On the limits of CO2 capture capacity of carbons. Sep. Purif. Technol. 2010, 74, 225–229. [Google Scholar] [CrossRef]
- McCallum, C.L.; Bandosz, T.J.; McGrother, S.C.; Müller, E.A.; Gubbins, K.E. A molecular model for adsorption of water on activated carbon: Comparison of simulation and experiment. Langmuir 1999, 15, 533–544. [Google Scholar] [CrossRef]
- Horikawa, T.; Sakao, N.; Do, D.D. Effects of temperature on water adsorption on controlled microporous and mesoporous carbonaceous solids. Carbon 2013, 56, 183–192. [Google Scholar] [CrossRef]
- Gil, M.V.; Álvarez-Gutiérrez, N.; Martínez, M.; Rubiera, F.; Pevida, C.; Morán, A. Carbon adsorbents for CO2 capture from bio-hydrogen and biogas streams: Breakthrough adsorption study. Chem. Eng. J. 2015, 269, 148–158. [Google Scholar] [CrossRef]
- Plaza, M.G.; Durán, I.; Querejeta, N.; Rubiera, F.; Pevida, C. Experimental and simulation study of adsorption in postcombustion conditions using a microporous biochar. 1. CO2 and N2 adsorption. Ind. Eng. Chem. Res. 2016, 55, 3097–3112. [Google Scholar] [CrossRef]
Figure 1.
Municipal waste management by type of treatment, EU-27 (%), 1995–2015 (Source: Eurostat).

Figure 2.
N2 (a,b); CO2 (c,d); and O2 (e,f) adsorption isotherms at 30, 50, and 70 °C up to 120 kPa on samples IH2 and IH3.
Figure 2.
N2 (a,b); CO2 (c,d); and O2 (e,f) adsorption isotherms at 30, 50, and 70 °C up to 120 kPa on samples IH2 and IH3.

Figure 3.
Water vapor adsorption isotherms of the prepared carbons and the commercial Norit R2030 at 30, 50 and 70 °C up to the corresponding saturation pressure (full symbols correspond to the adsorption branch and empty symbols to the desorption branch): absolute pressure (a,c,e); and relative pressure (b,d,f).

Figure 4.
Experimental setup for the dynamic adsorption experiments.

Figure 5.
Example of eight adsorption–desorption cycles at 50 °C for a mixture of 8/92 vol % CO2/N2.
Figure 5.
Example of eight adsorption–desorption cycles at 50 °C for a mixture of 8/92 vol % CO2/N2.

Figure 6.
Example of eight adsorption–desorption cycles at 50 °C for a mixture of 8/90/2 vol % CO2/N2/H2O.
Figure 6.
Example of eight adsorption–desorption cycles at 50 °C for a mixture of 8/90/2 vol % CO2/N2/H2O.
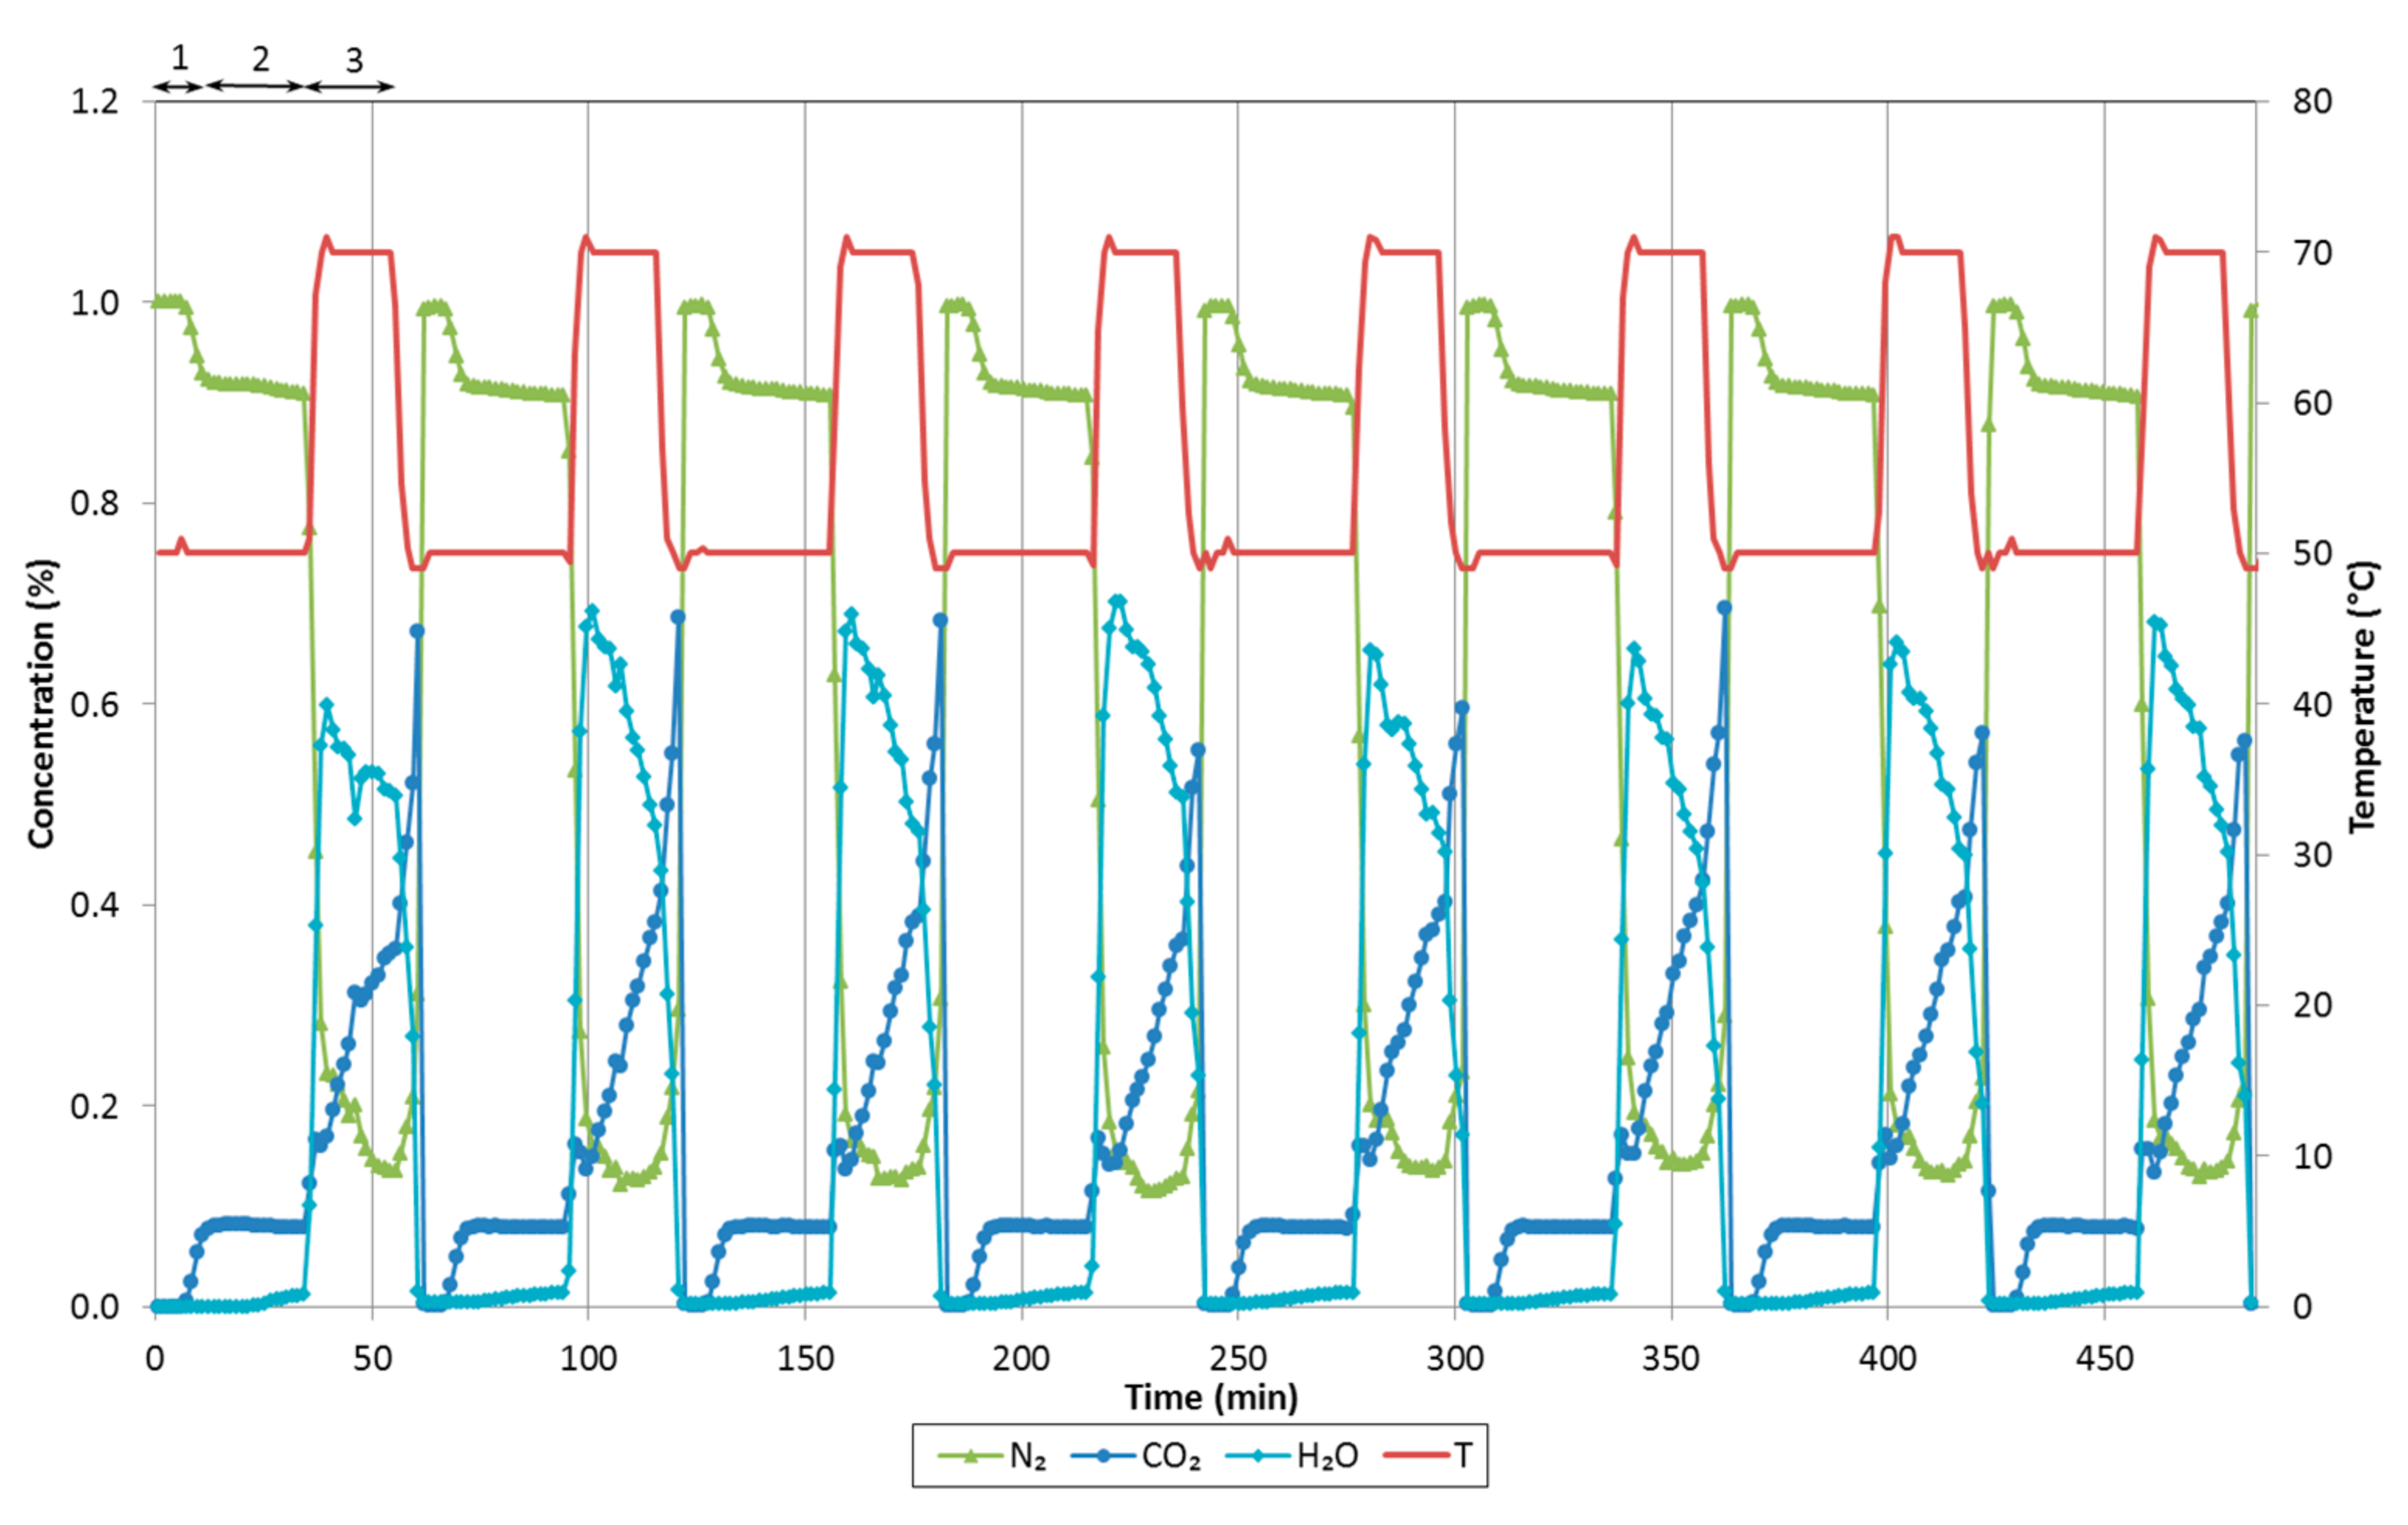
Figure 7.
Breakthrough curves of CO2 at different temperatures (30, 50 and 70 °C) for samples: (a) IH3; (b) IH2; and (c) Norit R.
Figure 7.
Breakthrough curves of CO2 at different temperatures (30, 50 and 70 °C) for samples: (a) IH3; (b) IH2; and (c) Norit R.
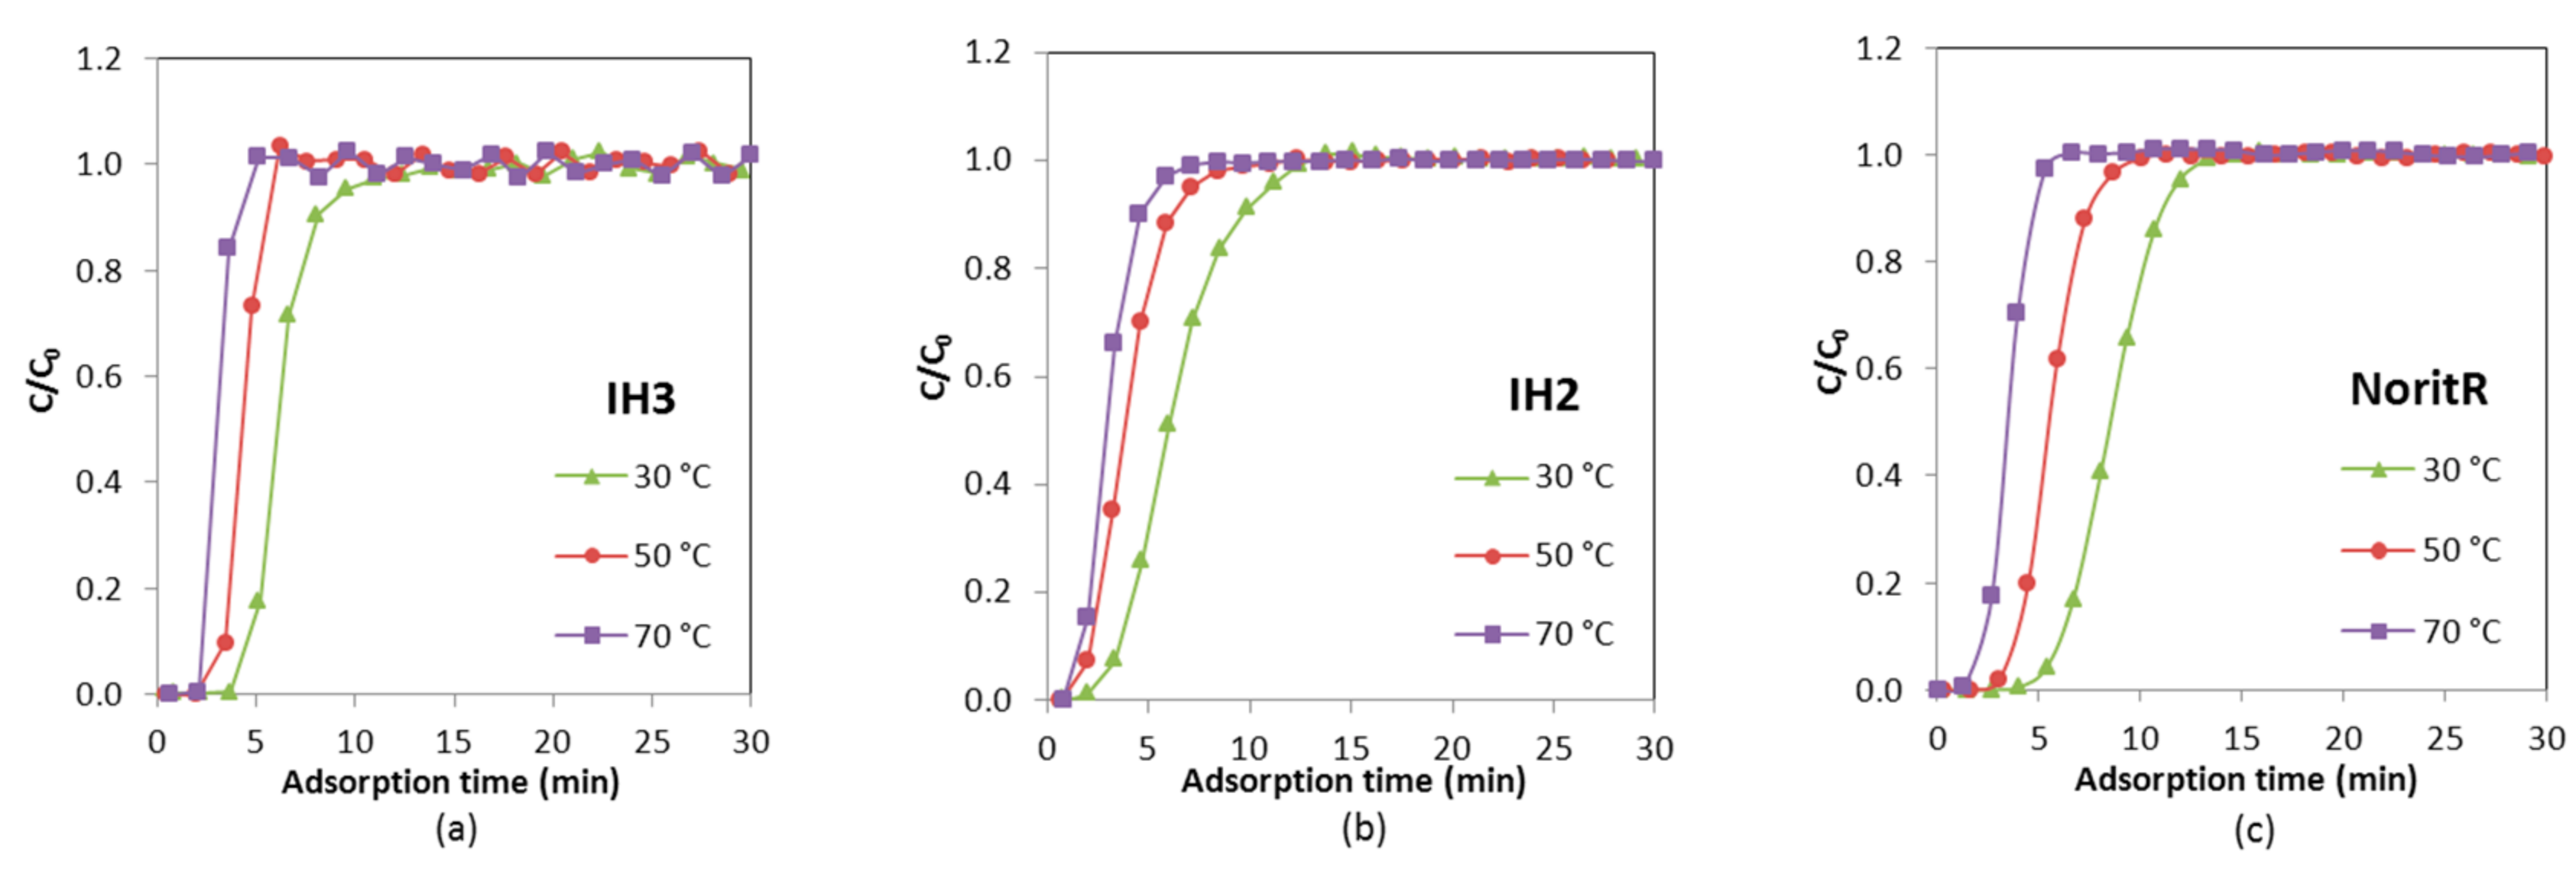
Figure 8.
Comparison of N2 and CO2 concentration profiles during the binary experiments with a CO2/N2 mixture (8/92 vol %) for: (a) IH3; (c) IH2; and (e) Norit R at 50 °C for the consecutive cycles; and thermal wave observed during the adsorption step for samples: (b) IH3; (d) IH2; and (f) Norit R.
Figure 8.
Comparison of N2 and CO2 concentration profiles during the binary experiments with a CO2/N2 mixture (8/92 vol %) for: (a) IH3; (c) IH2; and (e) Norit R at 50 °C for the consecutive cycles; and thermal wave observed during the adsorption step for samples: (b) IH3; (d) IH2; and (f) Norit R.
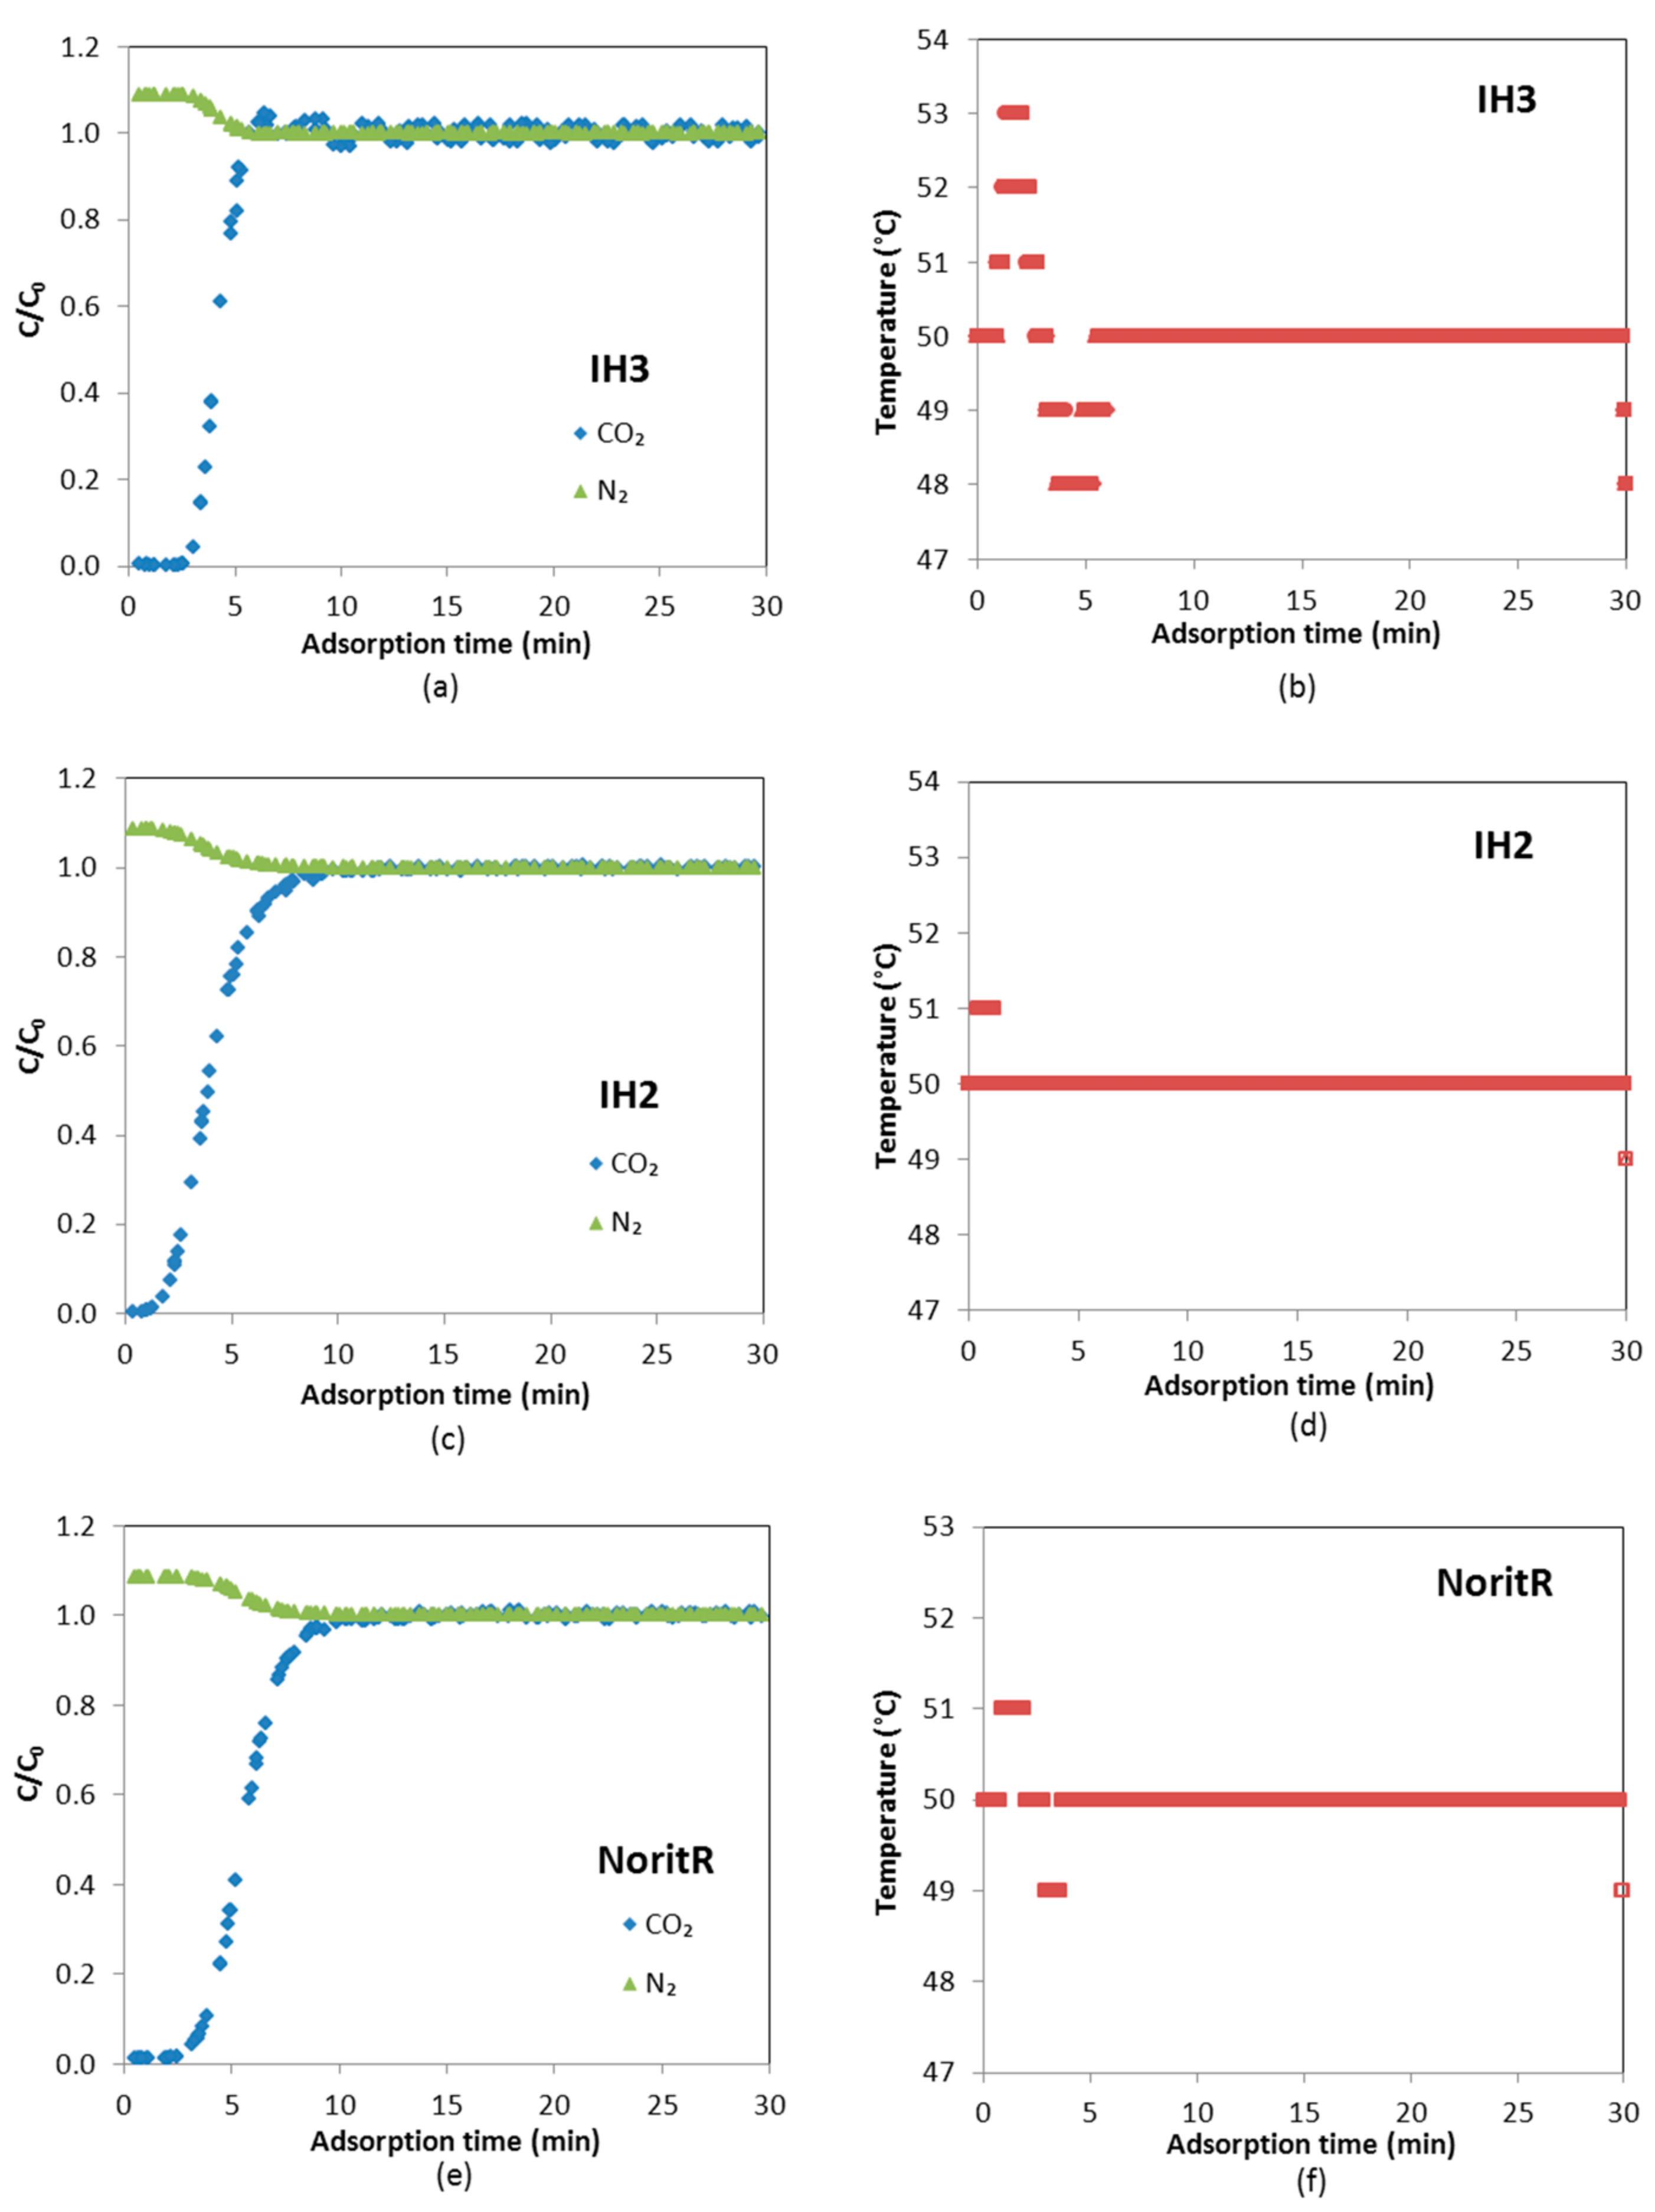
Figure 9.
Comparison of N2, CO2 and H2O concentration profiles during the ternary experiments with a CO2/N2/H2O mixture (8/90/2 vol %) for: (a) IH3; (c) IH2; and (e) Norit R at 50 °C for the fourth to eight consecutive cycles; and detail of the CO2 breakthrough curves over adsorbents: (b) IH3; (d) IH2; and (f) Norit R.
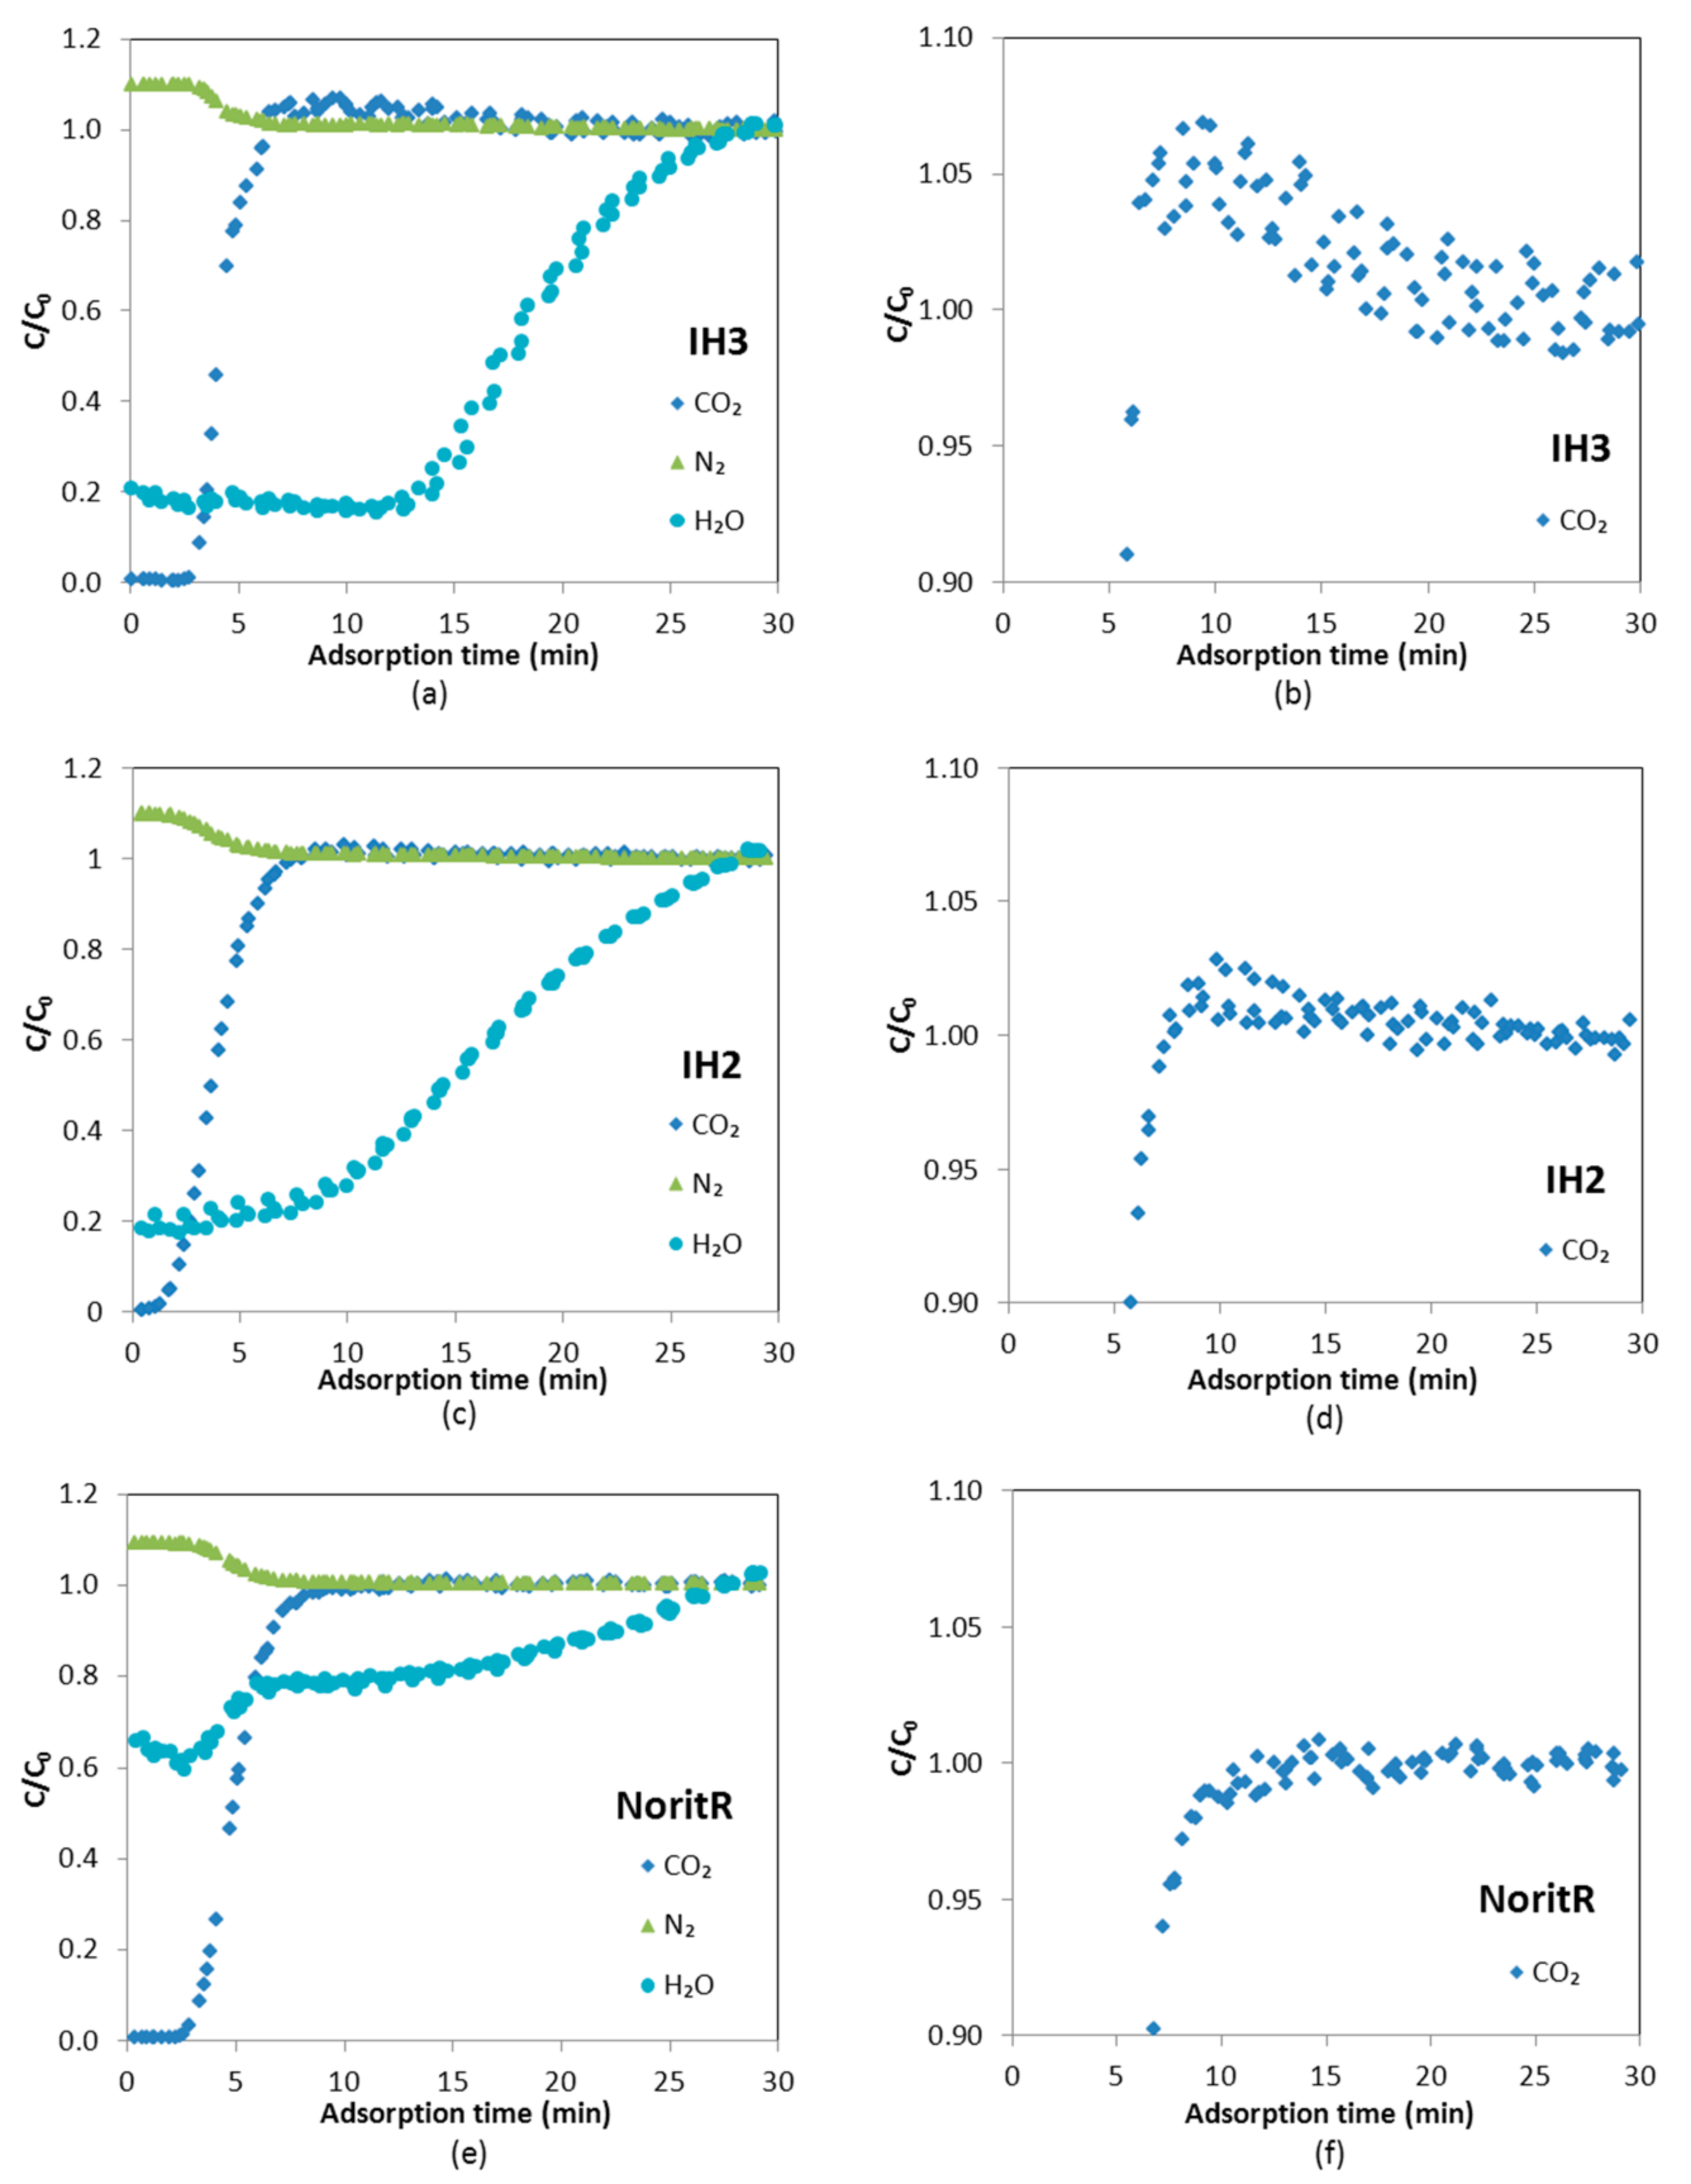
Figure 10.
Water vapor breakthrough curves at 30 °C for a ternary N2/CO2/H2O mixture (blue) and a binary H2O/N2 one (red) on: (a) IH3; (c) IH2; and (e) Norit R. Water vapor adsorption isotherms at 30 °C for: (b) IH3; (d) IH2; and (f) Norit R. The red vertical line indicates the partial pressure of H2O reached at the end of the ternary N2/CO2/H2O and binary N2/H2O experiments.
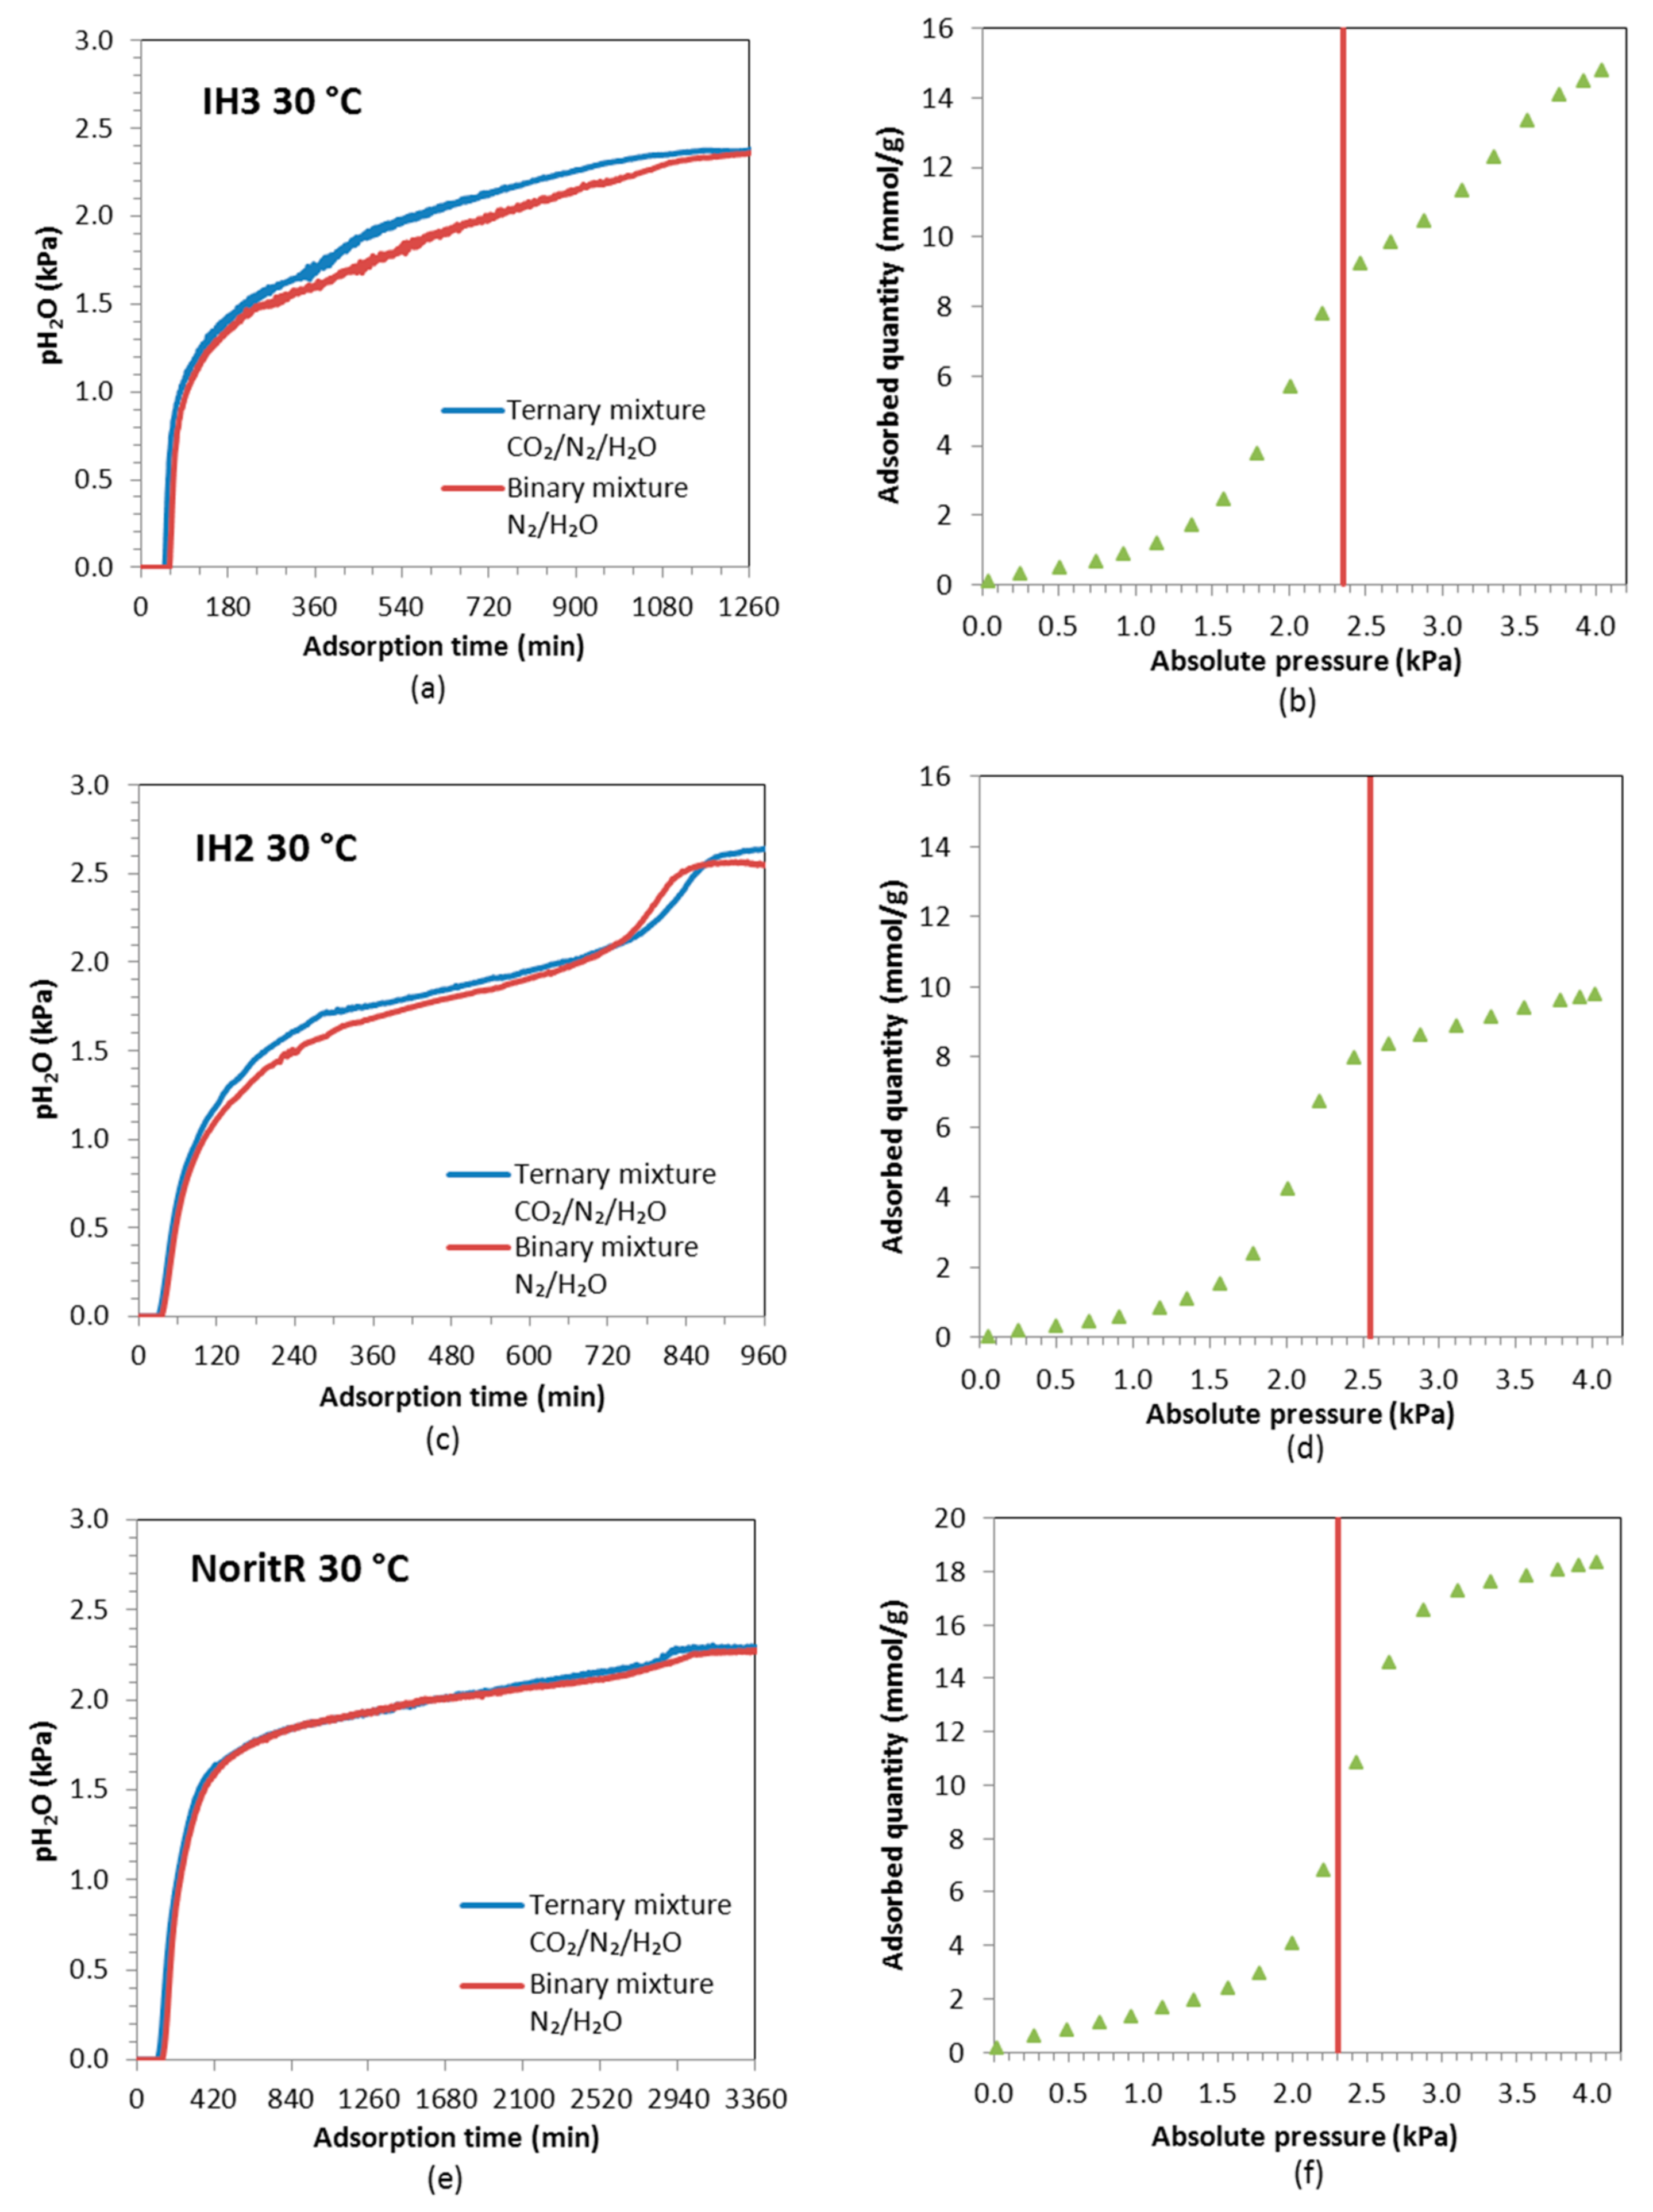
Figure 11.
CO2 breakthrough curves for ternary N2/CO2/H2O mixtures over a fully regenerated adsorbent bed (blue) and ternary mixtures fed to the adsorbent initially saturated with H2O (red) at 30 °C (a,c,e) and 50 °C (b,d,f).
Figure 11.
CO2 breakthrough curves for ternary N2/CO2/H2O mixtures over a fully regenerated adsorbent bed (blue) and ternary mixtures fed to the adsorbent initially saturated with H2O (red) at 30 °C (a,c,e) and 50 °C (b,d,f).

Figure 12.
Evolution of the partial pressure of water vapor at 50 °C over time up to saturation for a ternary N2/CO2/H2O mixture (blue) and a binary H2O/N2 one (red) for samples: (a) IH3; (b) IH2; and (c) Norit R.
Figure 12.
Evolution of the partial pressure of water vapor at 50 °C over time up to saturation for a ternary N2/CO2/H2O mixture (blue) and a binary H2O/N2 one (red) for samples: (a) IH3; (b) IH2; and (c) Norit R.


Table 1.
Ultimate analysis of IH2 and IH3.
| Sample | Elemental Analysis (wt %, daf *) | |||
|---|---|---|---|---|
| C | H | N | O | |
| IH2 | 95.10 | 1.00 | 0.62 | 3.28 |
| IH3 | 93.29 | 1.19 | 0.34 | 5.18 |
* Dry ash free basis.
Table 2.
Textural characterization by means of N2 adsorption at −196 °C and CO2 adsorption at 0 °C.
| Sample | Adsorption Isotherm N2 −196 °C | Adsorption Isotherm CO2 0 °C | ||||||||
|---|---|---|---|---|---|---|---|---|---|---|
| SBET (m2/g) | Vp (cm3/g) | W0 (cm3/g) | E0 (kJ/mol) | L0 (nm) | Smic (m2/g) | W0 (cm3/g) | E0 (kJ/mol) | L0 (nm) | Smic (m2/g) | |
| IH2 | 563 | 0.23 | 0.21 | 29.85 | 0.59 | 733 | 0.24 | 30.11 | 0.58 | 836 |
| IH3 | 788 | 0.34 | 0.30 | 25.88 | 0.75 | 811 | 0.30 | 30.06 | 0.58 | 1039 |
| Norit R | 988 | 0.41 | 0.39 | 18.97 | 1.43 | 549 | 0.26 | 28.02 | 0.65 | 823 |
Table 3.
Equilibrium selectivity factors calculated for IH3, IH2 and Norit R.
| Temperature | IH3 | IH2 | Norit R | |||
|---|---|---|---|---|---|---|
| 30 °C | 18.31 | 52.97 | 18.78 | 53.19 | 16.90 | 89.60 |
| 50 °C | 16.88 | 7.24 | 16.74 | 6.31 | 14.39 | 15.15 |
| 70 °C | 14.84 | 4.47 | 13.03 | 4.55 | 13.70 | 6.98 |
Table 4.
Bed characteristics for the breakthrough experiments.
| Bed Characteristics | IH3 | IH2 | Norit R |
|---|---|---|---|
| Mass of adsorbent (g) | 4.482 | 5.186 | 7.888 |
| Total porosity (εT) | 0.85 | 0.83 | 0.77 |
| Helium density (g/cm3) a | 1.916 | 1.897 | 2.140 |
| Apparent density (g/cm3) b | 0.611 | 0.820 | 0.845 |
| Bed diameter (cm) | 1.30 | 1.30 | 1.30 |
| Bed height (cm) | 12.0 | 12.0 | 12.1 |
| Bed density (g/cm3) | 0.281 | 0.326 | 0.491 |
a The helium density was measured in an Accupyc 1330 apparatus at 35 °C. b The apparent density was determined at 0.1 MPa in a Micromeritics Autopore IV 9500 mercury porosimeter.
Table 5.
CO2 adsorption capacities and breakthrough times from the experiments at 30, 50 and 70 °C and 140 kPa, feeding binary CO2/N2 gas mixture.
Table 5.
CO2 adsorption capacities and breakthrough times from the experiments at 30, 50 and 70 °C and 140 kPa, feeding binary CO2/N2 gas mixture.
| Temperature (°C) | IH3 | IH2 | Norit R | |||
|---|---|---|---|---|---|---|
| CO2 uptake (mmol/g ads) | tb,CO2 (min) | CO2 uptake (mmol/g ads) | tb,CO2 (min) | CO2 uptake (mmol/g ads) | tb,CO2 (min) | |
| 30 | 0.67 | 4.12 | 0.56 | 2.78 | 0.51 | 5.46 |
| 50 | 0.39 | 2.42 | 0.35 | 1.55 | 0.33 | 3.30 |
| 70 | 0.31 | 2.16 | 0.26 | 1.18 | 0.22 | 1.94 |
Table 6.
Average CO2 uptakes and breakthrough times calculated from the breakthrough adsorption cycles feeding ternary CO2/H2O/N2 gas mixtures.
Table 6.
Average CO2 uptakes and breakthrough times calculated from the breakthrough adsorption cycles feeding ternary CO2/H2O/N2 gas mixtures.
| Mixture | IH3 | IH2 | Norit R | |||
|---|---|---|---|---|---|---|
| CO2 Uptake (mmol/g) | tb,CO2 (min) | CO2 Uptake (mmol/g) | tb,CO2 (min) | CO2 Uptake (mmol/g) | tb,CO2 (min) | |
| CO2/N2 | 0.42 | 2.70 | 0.35 | 1.65 | 0.31 | 3.13 |
| CO2/H2O/N2 | 0.38 | 2.61 | 0.32 | 1.57 | 0.29 | 2.87 |
Table 7.
Adsorption capacities of water vapor and breakthrough times during non-cyclic experiments at low and high relative humidity.
Table 7.
Adsorption capacities of water vapor and breakthrough times during non-cyclic experiments at low and high relative humidity.
| Relative Humidity | Experiment | Sample | qH2O | tb,H2O | |
|---|---|---|---|---|---|
| (mmol/g ads) | (min) | ||||
| 60% | Ternary mixture N2/CO2/H2O | IH3 | 6.48 | 50.1 | −25.8 |
| IH2 | 7.39 | 37.7 | −10.6 | ||
| Norit R | 7.70 | 131.6 | +0.1 | ||
| Binary mixture N2/H2O | IH3 | 6.91 | 60.4 | −19.8 | |
| IH2 | 7.41 | 42.5 | −9.3 | ||
| Norit R | 7.75 | 156.4 | −1.9 | ||
| 22% | Ternary mixture N2/CO2/H2O | IH3 | 0.92 | 20.8 | +4.4 |
| IH2 | 0.76 | 16.0 | +16.2 | ||
| Norit R | 1.37 | 64.2 | +7.0 | ||
| Binary mixture N2/H2O | IH3 | 0.95 | 24.2 | +9.6 | |
| IH2 | 0.90 | 20.4 | +39.1 | ||
| Norit R | 1.52 | 70.3 | +14.0 |
Table 8.
Results of CO2 uptake capacity and breakthrough times for the ternary breakthrough experiments at low and high relative humidity.
Table 8.
Results of CO2 uptake capacity and breakthrough times for the ternary breakthrough experiments at low and high relative humidity.
| RH | Experiment | Sample | qCO2 | tb,CO2 | |
|---|---|---|---|---|---|
| (mmol/g ads) | (min) | ||||
| 60% | Ternary mixture N2/CO2/H2O | IH3 | 0.72 | 4.90 | −8.5 |
| IH2 | 0.59 | 3.03 | −15.3 | ||
| Norit R | 0.54 | 5.68 | −10.3 | ||
| Ternary mixture initially saturated with H2O | IH3 | 0.29 | 2.09 | −62.2 | |
| IH2 | 0.22 | 1.02 | −67.3 | ||
| Norit R | 0.30 | 3.21 | −49.1 | ||
| 22% | Ternary mixture N2/CO2/H2O | IH3 | 0.40 | 3.10 | −15.0 |
| IH2 | 0.33 | 1.86 | −20.3 | ||
| Norit R | 0.36 | 3.67 | −2.7 | ||
| Ternary mixture initially saturated with H2O | IH3 | 0.41 | 3.08 | −12.1 | |
| IH2 | 0.35 | 1.84 | −15.2 | ||
| Norit R | 0.30 | 3.34 | −17.3 |
© 2017 by the authors. Licensee MDPI, Basel, Switzerland. This article is an open access article distributed under the terms and conditions of the Creative Commons Attribution (CC BY) license (http://creativecommons.org/licenses/by/4.0/).
Share and Cite
MDPI and ACS Style
Durán, I.; Rubiera, F.; Pevida, C. Separation of CO2 in a Solid Waste Management Incineration Facility Using Activated Carbon Derived from Pine Sawdust. Energies 2017, 10, 827. https://doi.org/10.3390/en10060827
AMA Style
Durán I, Rubiera F, Pevida C. Separation of CO2 in a Solid Waste Management Incineration Facility Using Activated Carbon Derived from Pine Sawdust. Energies. 2017; 10(6):827. https://doi.org/10.3390/en10060827
Chicago/Turabian StyleDurán, Inés, Fernando Rubiera, and Covadonga Pevida. 2017. "Separation of CO2 in a Solid Waste Management Incineration Facility Using Activated Carbon Derived from Pine Sawdust" Energies 10, no. 6: 827. https://doi.org/10.3390/en10060827
Note that from the first issue of 2016, this journal uses article numbers instead of page numbers. See further details here.