

A Stochastic Programming Approach for the Planning and Operation of a Power to Gas Energy Hub with Multiple Energy Recovery Pathways

 ,
,  ,
, 

Abstract
1. Introduction
Literature Review
2. Method
2.1. Stochastic Hourly Ontario Electricity Price Data
2.2. Stochastic Hourly Hydrogen Demand Data
2.3. Two-Stage Stochastic Optimization Formulation
- : Annual operating and maintenance cost of an electrolyzer unit.
- : Annual cost of a tank storage unit.
- : Annual cost of a compressor unit.
- : Hourly electricity for different scenarios ($ per kWh).
- : Unit transmission cost of electricity ($ per kWh).
- : Unit cost of water ($ per liter).
- : Water consumed per kmol of hydrogen produced (liter per kmol).
- : Energy consumed per kmol of hydrogen compressed (kWh per kmol) [37].
- : Transmission cost per MMBtu of energy transmitted through natural gas pipelines. This includes the cost of running compressors along the natural gas pipeline [38].
- : Unit market price of hydrogen ($ per kmol).
- The annual cost of buying and transmitting electricity to electrolyzers and compressors.
- Annual cost of buying water for H2 production
- Annual cost of distributing H2 through the natural gas distribution system.
- Annual clawback cost associated with participating and failing to provide demand response in the ancillary service market.
- Annual cost associated with the hydrogen purchased from a third party vendor.
- : The unit selling price of hydrogen when hydrogen is sold to the refueling station ($ per kmol) [39].
- : Market price of natural gas. In this case it is assumed to be the Henry Hub Spot Price ($ per MMBtu). Hydrogen injected into the distribution line is sold to the natural gas utility that distributes it to its end users on an energy basis at this price.
- : Carbon tax credit earned per kg of CO2 emissions offset ($ per kg CO2) [40].
- Annual revenue from selling hydrogen to fuel cell vehicles.
- Annual revenue from selling hydrogen to the natural gas utility on an energy value basis.
- Annual revenue from providing the demand response service.
- Annual revenue earned from offsetting CO2 emissions at the end user and using a cleaner method in comparison to SMR for producing H2.
2.4. Stochastic Programming Concepts: EVPI and VSS
3. Results
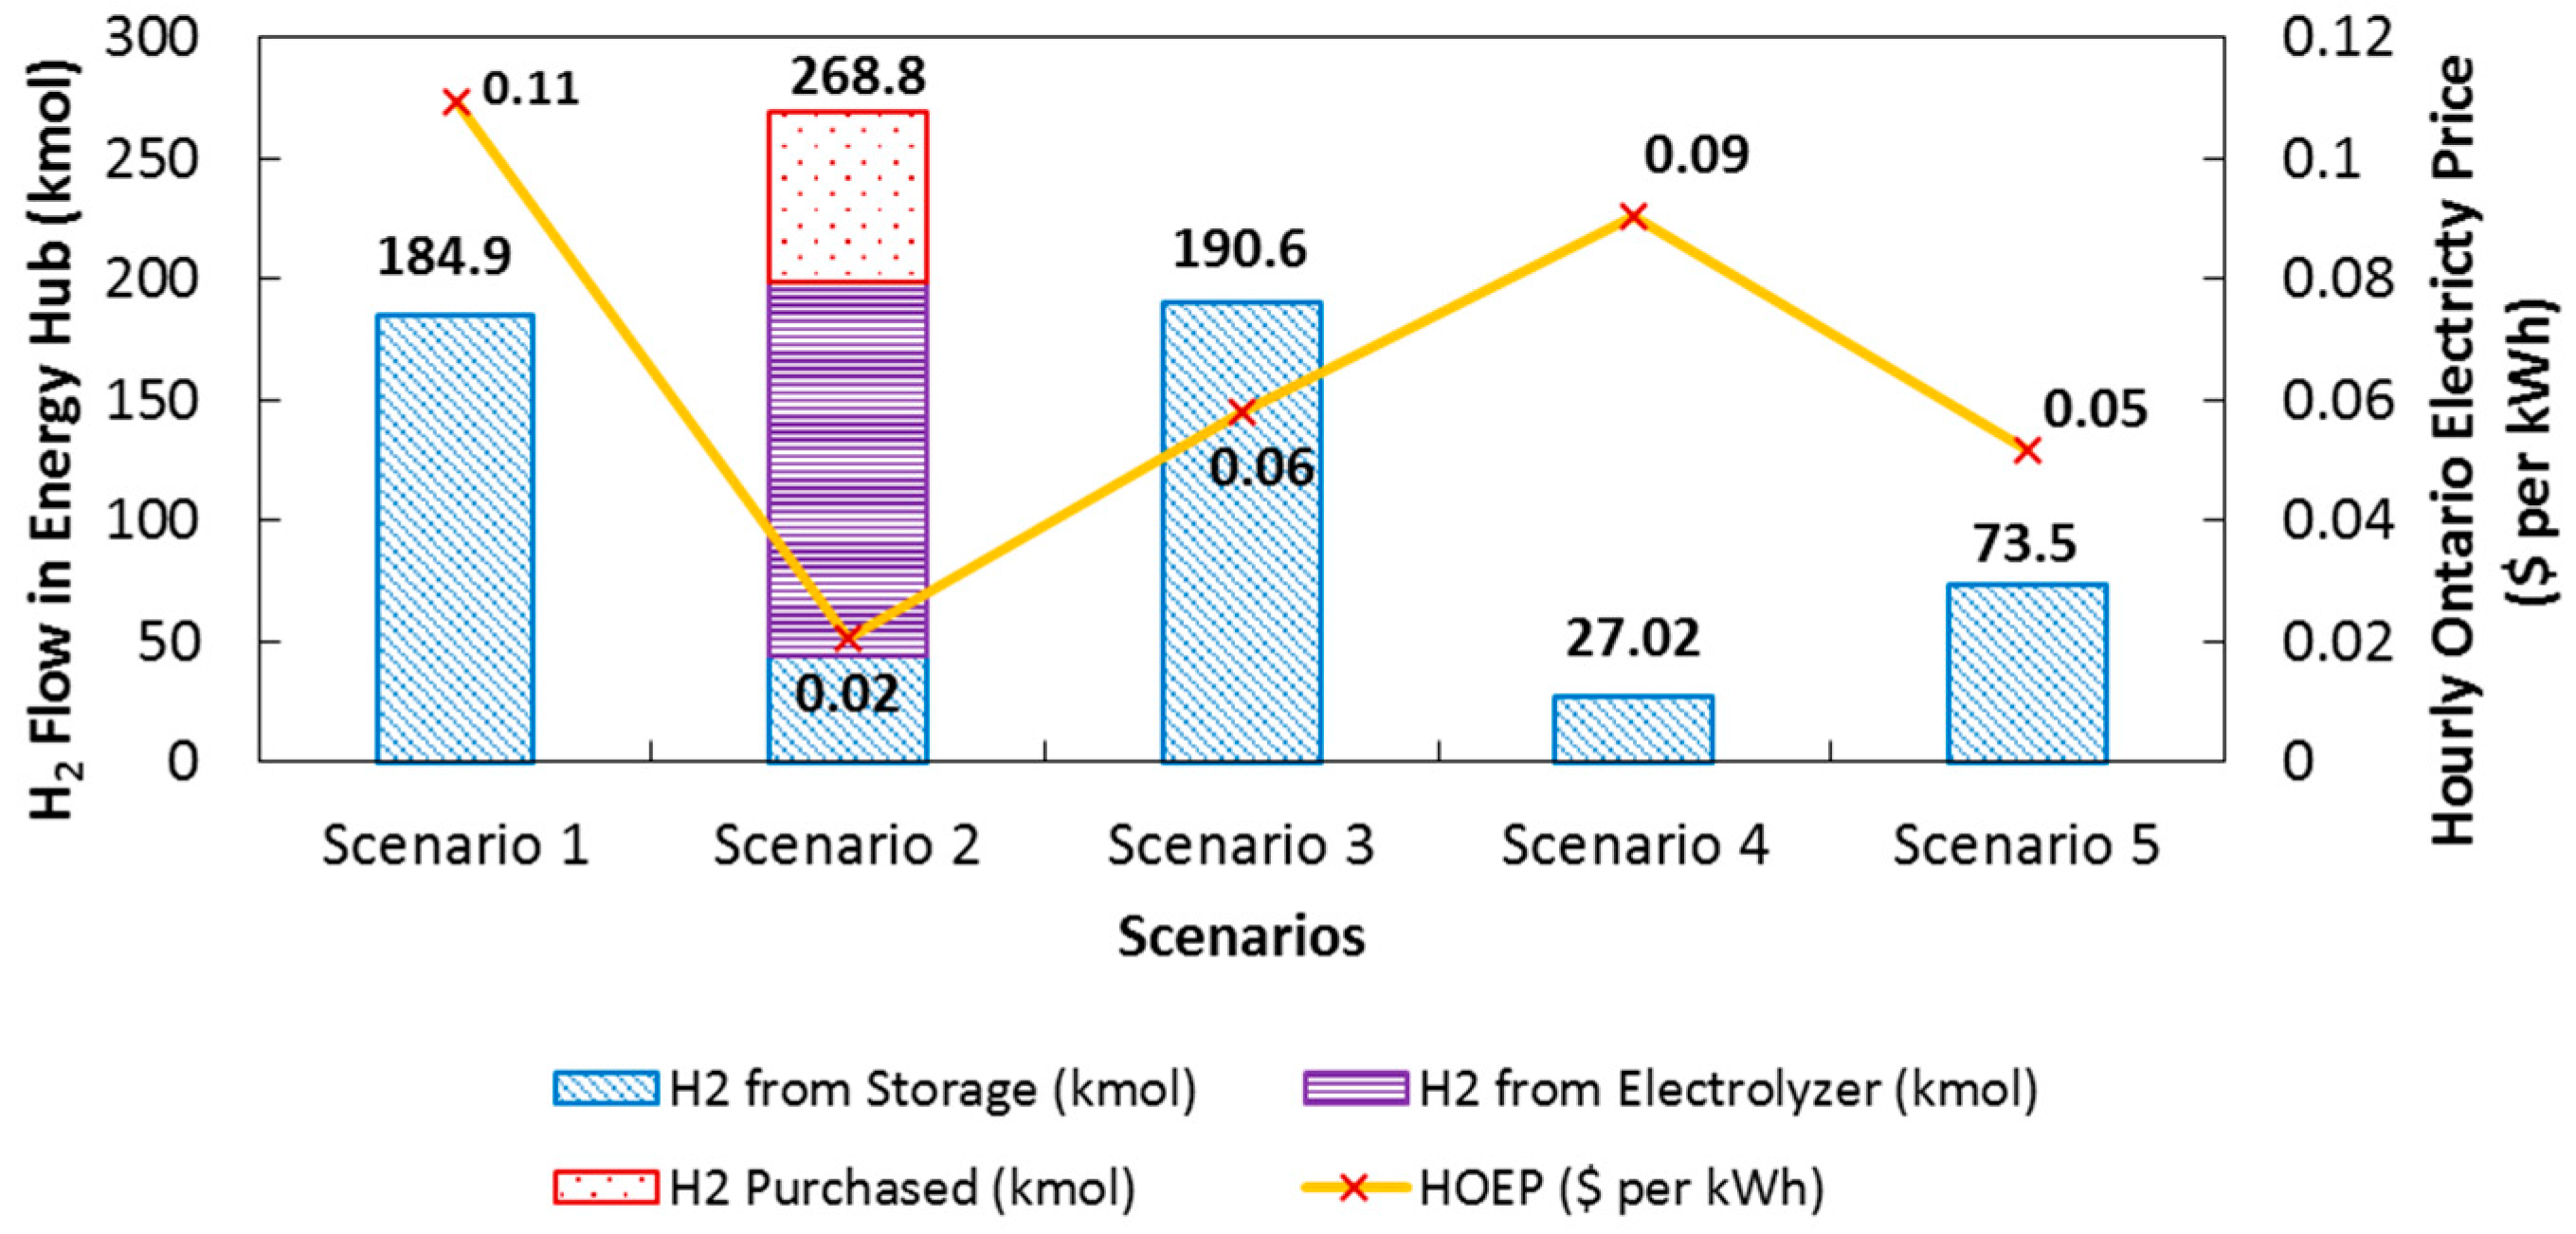
- Probabilistic scenario 1: High electricity price ($0.11 per kWh), and moderately high hydrogen demand (184.9 kmol).
- Probabilistic scenario 2: Low electricity price ($0.02 per kWh), and high hydrogen demand (268.8 kmol).
- Probabilistic scenario 3: Moderately high electricity price ($0.06 per kWh) and hydrogen demand (190.6 kmol).
- Probabilistic scenario 4: High electricity price ($0.09 per kWh) and low hydrogen demand (27.02 kmol).
- Probabilistic scenario 5: Moderately high electricity price ($0.05 per kWh), and low hydrogen demand (73.5 kmol).
4. Conclusions
Acknowledgments
Author Contributions
Conflicts of Interest
Appendix A. List of Variables
| Variables | Description |
| Hydrogen gas produced (kmol) | |
| Hydrogen flow bypassing storage (kmol) | |
| Energy consumed (kWh) | |
| Hydrogen output from tank storage (kmol) | |
| Hydrogen purchased from market (kmol) | |
| Short fall in meeting hydrogen demand (kmol) | |
| Hydrogen inflow to the tank (kmol) | |
| Hydrogen injected into pressure reduction station (kmol) | |
| Natural gas flowing through pressure reduction station (kmol) | |
| Number of electrolyzers on-site | |
| Number of pre-storage compressor modules on-site | |
| Number of tanks on-site | |
| Amount of energy consumption reduced (kWh) | |
| Energy consumption reduced to provide demand response (kWh) | |
| Maximum amount of hydrogen stored on-site (kmol) | |
| Stored hydrogen inventory on-site (kmol) | |
| Amount of natural gas offset at the pressure reduction station (kmol) | |
| Total CO2,e emissions associated with production and purchase of hydrogen (kg) | |
| Total CO2,e emissions curbed while substituting natural gas with hydrogen and from not using steam methane reforming to produce on-site hydrogen. (kg) | |
| Net CO2,e emissions offset (kg) | |
| Clawback cost for not offering scheduled demand response ($ per kWh) | |
| Operating and maintenance cost of booster compressor modules that includes electricity consumption and transmission charges ($) | |
| Annual revenue loss in selling hydrogen at natural gas spot price ($) | |
| Annual revenue earned from meeting hydrogen demand ($) | |
| The additional annual revenue that can be earned when hydrogen as a transportation fuel is sold at $17 per kmol | |
| The additional annual revenue that can be earned when hydrogen as a transportation fuel is sold at $20 per kmol | |
| Annual average capacity factor of electrolyzers | |
| Binary variables | |
| Not Sure how to define it: Product of geometric series of constant ratio 2 and capacity factor variable |
Appendix B. List of Indices
| Indices | Description |
| Represents hour of the year | |
| Represents a particular scenario for electricity price as well as hydrogen demand | |
| Number of terms in the geometric series |
Appendix C. List of Parameters
| Parameter | Description | Value |
| First term of the geometric series | 1 | |
| Recurrence ration of the geometric series | 2 | |
| Time Variant Stochastic Parameter | Percentage of total number of refueling events (%) | |
| Time Variant Stochastic Parameter | Refueling Amount of hydrogen (kmol) | |
| Confidential | Electrolyzer efficiency factor (kmol per kWh) | |
| 0 | Minimum operating level of an electrolyzer module (kWh) | |
| 1000 | Maximum operating level of an electrolyzer module (kWh) | |
| Binary parameter depicting hours in which demand response should be provided. | ||
| 1000 | Minimum demand response to be provided in an hour (kWh) | |
| 0.0215 | Incentive received for providing demand response ($ per kWh) | |
| Time series data for the period of November 2012–October 2013 | Natural gas energy demand (kmol) | |
| 0.05 | Upper limit on acceptable fraction of hydrogen injection to natural gas pipeline | |
| 19.5 | Minimum storage capacity of tank module (kmol) | |
| 45.4 | Maximum storage capacity of tank module (kmol) | |
| 0.272 | Higher heating value of hydrogen (MMBtu per kmol) | |
| 0.805 | Higher heating value of natural gas (MMBtu per kmol) | |
| 21 | Maximum flow handling capacity of pre-compressor storage (kmol) | |
| 0.00001 | Very small number | |
| Time series value of Emission factor of power grid between November 2012–October 2013 | Emission factor of power grid in Ontario (kg CO2 per kWh) | |
| 54.203 | Well-to-Wheel emission factor of natural gas (kg CO2,e per kmol of NG) | |
| 18 | Emission factor of steam methane reforming process for hydrogen production (kg CO2,e per kmol H2) | |
| Confidential | Amortized electrolyzer capital cost ($) | |
| Confidential | Annual operating and maintenance cost of electrolyzer cost ($) | |
| $30,421.5 | Amortized capital cost of tank ($) | |
| $25,442 | Amortized capital cost of pre-storage compressor ($) | |
| Time Variant Stochastic Parameter | Hourly Ontario electricity price ($ per kWh) | |
| $0.008 per kWh | Transmission service charge ($ per kWh) | |
| 0.00314 | Unit cost of Water ($ per liter) | |
| Confidential | Water consumption rate of electrolyzer (liter per kmol) | |
| 2.5042 | Energy consumption factor of pre-storage compressor (kWh per kmol H2) | |
| 0.055 | Natural gas pipeline system service charge ($ per MMBtu) | |
| 13.88 | Market price of hydrogen ($ per kmol) purchased | |
| 8 | Selling price of H2 ($ per kmol) | |
| Time series data for the period of November 2012–October 2013 | Henry Hub Natural gas spot price ($ per MMBtu) | |
| 0.015 | Carbon credit ($ per kg CO2,e) | |
| 17 | Lower limit on selling price of H2 ($ per kmol) | |
| 20 | Upper limit on selling price of H2 ($ per kmol) | |
| 0.65 | Lower limit on annual average capacity factor of electrolyzer | |
| 43800 | Product of number of hours in a year (8760) and total number of scenarios (5) considered in the stochastic study) |
References
- De Boer, H.S.; Grond, L.; Moll, H.; Benders, R. The application of power-to-gas, pumped hydro storage and compressed air energy storage in an electricity system at different wind power penetration levels. Energy 2014, 72, 360–370. [Google Scholar] [CrossRef] [Scilit]
- Viktorsson, L.; Heinonen, T.J.; Skulason, B.J.; Unnthorsson, R. A step towards the hydrogen Economy—A life cycle cost analysis of A hydrogen refueling station. Energies 2017, 10, 763. [Google Scholar] [CrossRef] [Scilit]
- Walker, S.B.; Mukherjee, U.; Fowler, M.; Elkamel, A. Benchmarking and selection of power-to-gas utilizing electrolytic hydrogen as an energy storage alternative. Int. J. Hydrog. Energy 2016, 41, 7717–7731. [Google Scholar] [CrossRef] [Scilit]
- Götz, M.; Lefebvre, J.; Mörs, F.; McDaniel Koch, A.; Graf, F.; Bajohr, S.; Reimert, R.; Kolb, T. Renewable power-to-gas: A technological and economic review. Renew. Energy 2016, 85, 1371–1390. [Google Scholar] [CrossRef] [Scilit]
- Astiaso Garcia, D.; Barbanera, F.; Cumo, F.; Di Matteo, U.; Nastasi, B. Expert opinion analysis on renewable hydrogen storage systems potential in Europe. Energies 2016, 9, 963. [Google Scholar] [CrossRef] [Scilit]
- Rönsch, S.; Schneider, J.; Matthischke, S.; Schlüter, M.; Götz, M.; Lefebvre, J.; Prabhakaran, P.; Bajohr, S. Review on methanation—From fundamentals to current projects. Fuel 2016, 166, 276–296. [Google Scholar] [CrossRef] [Scilit]
- Otto, A.; Robinius, M.; Grube, T.; Schiebahn, S.; Praktiknjo, A.; Stolten, D. Power-to-steel: Reducing CO2 through the integration of renewable energy and hydrogen into the German steel industry. Energies 2017, 10, 451. [Google Scholar] [CrossRef] [Scilit]
- Mukherjee, U.; Walker, S.; Fowler, M.; Elkamel, A. Power-to-gas in a demand-response market. Int. J. Environ. Stud. 2016, 73, 390–401. [Google Scholar] [CrossRef] [Scilit]
- Juan, A.A.; Mendez, C.A.; Faulin, J.; de Armas, J.; Grasman, S.E. Electric Vehicles in Logistics and Transportation: A Survey on Emerging Environmental, Strategic, and Operational Challenges. Energies 2016, 9, 86. [Google Scholar] [CrossRef] [Scilit]
- Franzitta, V.; Curto, D.; Rao, D.; Viola, A. Hydrogen Production from Sea Wave for Alternative Energy Vehicles for Public Transport in Trapani (Italy). Energies 2016, 9, 850. [Google Scholar] [CrossRef] [Scilit]
- Blanco-Fernández, P.; Pérez-Arribas, F. Offshore Facilities to Produce Hydrogen. Energies 2017, 10, 783. [Google Scholar] [CrossRef] [Scilit]
- Liu, H.; Almansoori, A.; Fowler, M.; Elkamel, A. Analysis of Ontario’s hydrogen economy demands from hydrogen fuel cell vehicles. Int. J. Hydrog. Energy 2012, 37, 8905–8916. [Google Scholar] [CrossRef] [Scilit]
- Kim, J.; Lee, Y.; Moon, I. Optimization of a hydrogen supply chain under demand uncertainty. Int. J. Hydrog. Energy 2008, 33, 4715–4729. [Google Scholar] [CrossRef] [Scilit]
- Almansoori, A.; Shah, N. Design and operation of a stochastic hydrogen supply chain network under demand uncertainty. Int. J. Hydrog. Energy 2012, 37, 3965–3977. [Google Scholar] [CrossRef] [Scilit]
- Dayhim, M.; Jafari, M.A.; Mazurek, M. Planning sustainable hydrogen supply chain infrastructure with uncertain demand. Int. J. Hydrog. Energy 2014, 39, 6789–6801. [Google Scholar] [CrossRef] [Scilit]
- Nunes, P.; Oliveira, F.; Hamacher, S.; Almansoori, A. Design of a hydrogen supply chain with uncertainty. Int. J. Hydrog. Energy 2015, 40, 16408–16418. [Google Scholar] [CrossRef] [Scilit]
- Taljan, G; Fowler, M.; Cañizares, C.; Verbič, G. Hydrogen storage for mixed wind–nuclear power plants in the context of a hydrogen economy. Int. J. Hydrog. Energy 2008, 33, 4463–4475. [Google Scholar] [CrossRef] [Scilit]
- Han, J.; Ryu, J.; Lee, I. Multi-objective optimization design of hydrogen infrastructures simultaneously considering economic cost, safety and CO2 emission. Chem. Eng. Res. Des. 2013, 91, 1427–1439. [Google Scholar] [CrossRef] [Scilit]
- De-León Almaraz, S.; Azzaro-Pantel, C.; Montastruc, L.; Domenech, S. Hydrogen supply chain optimization for deployment scenarios in the midi-pyrénées region, France. Int. J. Hydrog. Energy 2014, 39, 11831–11845. [Google Scholar] [CrossRef] [Scilit]
- Birge, J.R.; François, L. Introduction to Stochastic Programming, 2nd ed.; Mikosch, T.V., Resnick, S.I., Robinson, S.M., Eds.; Springer: New York, NY, USA, 2011. [Google Scholar]
- Independent Electricity System Operator (IESO). Historical Hourly Ontario Electricity Price; IESO: Toronto, ON, USA, 2017; Available online: http://www.ieso.ca/Pages/Power-Data/Data-Directory.aspx# (accessed on 15 January 2017).
- Greene, D.L.; Leiby, P.N.; James, B.; Perez, J.; Melendez, M.; Milbrandt, A.; Unnasch, S.; Rutherford, D.; Hooks, M. Analysis of the Transition to Hydrogen Fuel Cell. Vehicles & the Potential Hydrogen Energy Infrastructure Requirements; No. ORNL/TM-2008/30; Oak Ridge National Laboratory: Oak Ridge, TN, USA, 2008.
- Population by Year, by Province and Territory: Statistics Canada. 2016. Available online: http://www.statcan.gc.ca/tables-tableaux/sum-som/l01/cst01/demo02a-eng.htm (accessed on 10 January 2017).
- US and World Population: United States Census Bureau. 2017. Available online: http://www.census.gov/popclock/ (accessed on 10 January 2017).
- Population of Census Metropolitan Areas: Statistics Canada. 2016. Available online: http://www.statcan.gc.ca/tables-tableaux/sum-som/l01/cst01/demo05a-eng.htm (accessed on 10 January 2017).
- Sprik, S.; Kurtz, J.; Ainscough, C.; Peters, M.; Jeffers, M.; Saur, G. Performance Status of Hydrogen Stations and Fuel Cell Vehicles: 2015 Fuel Cell Seminar and Energy Exposition; California State University: Los Angeles, CA, USA, 2015. [Google Scholar]
- Histogram of Fueling Amounts Vehicle and Infrastructure: National Renewable Energy Laboratory. 2011. Available online: http://www.nrel.gov/hydrogen/docs/cdp/cdp_39.jpg (accessed on 10 January 2017).
- Harvey, R.; Hydrogenics Corporation (Mississauga, ON, Canada). Interviewee, Electrolyzer Specifications: Personal communication with Hydrogenics [Interview], 2014.
- Independent Electricity System Operator (IESO). Demand-Response Pilot Program: Program Details; IESO: Toronto, ON, USA, 2015; Available online: http://www.ieso.ca/Documents/procurement/DR-Pilot-RFP/IESO-Demand_Response_Pilot_Program-Program_Details.pdf (accessed on 12 October 2015).
- Independent Electricity System Operator (IESO). Demand Response-Pre Auction Report; IESO: Toronto, ON, USA, 2015; Available online: http://reports.ieso.ca/public/DR-PreAuction/PUB_DR-PreAuction.xml (accessed on 11 November 2015).
- Melaina, M.; Antonia, O.; Penev, M. Blending Hydrogen into Natural Gas. Pipeline Networks: A Review of Key Issues; No. NREL/TP-5600–51995; National Renewable Energy Laboratory: Golden, CO, USA, 2013.
- Parks, G.; Boyd, R.; Cornish, J.; Remick, R. Hydrogen Station Compression, Storage, and Dispensing Technical Status and Costs; No. NREL/BK-6A10-58564; National Renewable Energy Laboratory: Golden, CO, USA, 2014.
- Toyota. 2016 Mirai Product Information. Available online: http://toyotanews.pressroom.toyota.com/releases/2016+toyota+mirai+fuel+cell+product.htm (accessed on 10 December 2016).
- Olateju, B.; Monds, J.; Kumar, A. Large scale hydrogen production from wind energy for the upgrading of bitumen from oil sands. Appl. Energy 2014, 118, 48–56. [Google Scholar] [CrossRef] [Scilit]
- ICF International. Life Cycle Greenhouse Gas Emissions of Natural Gas: A Literature Review of Key Studies Comparing Emissions from Natural Gas and Coal; ICF International: Toronto, ON, USA, 2012. [Google Scholar]
- Shaner, M.R.; Atwater, H.A.; Lewis, N.S.; McFarland, E.W. A Comparative Techno-economic Analysis of Renewable Hydrogen Production Using Solar Energy. R. Soc. Chem. 2016, 9, 2354–2371. [Google Scholar] [CrossRef] [Scilit]
- National Renewable Energy Laboratory. H2A Hydrogen Delivery Infrastructure Analysis Models and Conventional Pathway Options Analysis Results; Interim Report No. DE-FG36–05GO15032; Office of Energy Efficiency & Renewable Energy: Washington, DC, USA, 2008.
- Union Gas. M -12 Schedule C Fuel Rates; Union Gas: Chatham-Kent, ON, Canada, 2014. [Google Scholar]
- Hydrogen and Fuel Cells: The U.S. Market Report; National Hydrogen Association, and Technology Transition Corporation: Washington, DC, USA, 2010.
- Huffington Post. Alberta Extends Climate Change Rules, Including $15 Tonne Carbon Levy. 19 December 2014. Available online: http://www.huffingtonpost.ca/2014/12/19/alberta-climate-change_n_6357480.html (accessed on 2 March 2016).
- Narayan, A.; Ponnambalam, K. Risk-Averse Stochastic Programming Approach for Microgrid Planning Under Uncertainty. Renew. Energy 2017, 101, 399–408. [Google Scholar] [CrossRef] [Scilit]
- Gasoline and Fuel Oil, Average Retail Prices by Urban Center (Monthly) (Toronto)—Statistics Canada. 2017. Available online: http://www.statcan.gc.ca/tables-tableaux/sum-som/l01/cst01/econ152h-eng.htm (accessed on 18 January 2017).
- Toyota Mirai: Market List Price. 2016. Available online: http://www.caranddriver.com/toyota/mirai (accessed on 10 December 2016).
- Electric Vehicle Incentive Program: Ontario Ministry of Transportation. 2017. Available online: http://www.mto.gov.on.ca/english/vehicles/electric/electric-vehicle-incentive-program.shtml (accessed on 16 January 2017).

| Probability Density Function | Fall | Winter | Spring | Summer |
|---|---|---|---|---|
| α = 4.5 × 10⁸ β = 4.04 × 10⁶ γ = −4.04 × 10⁶ | α = 25.88 β = 0.26 γ = −0.22 | α = 3.88 × 10⁸ β = 3.3 × 10⁶ γ = −3.3 × 10⁶ | α = 104.4 β = 0.86 γ = −0.83 |
| Results | Expected Value (EV) Solution | Recourse Problem (RP) Solution | Expected Value of Using EV Solution (EEV) |
|---|---|---|---|
| Objective Function: Net Cost ($ per year) | −8,959,896 | −9,184,269 | −9,079,992 |
| Power to Gas System Capacity (MWel) | 16 | 17 | 16 |
| Compressed H2 Storage Capacity (kg) | 1958 | 1869 | 1958 |
| H2 Purchased (kg per year) | 0 | 1814.142 | 3824.110 |
| H2 Produced (kg per year) | 1,814,492 | 1,813,770 | 1,811,761 |
| Results | Probabilistic Scenario 1 | Probabilistic Scenario 2 | Probabilistic Scenario 3 | Probabilistic Scenario 4 | Probabilistic Scenario 5 | Recourse Problem (RP) Solution |
|---|---|---|---|---|---|---|
| Objective Function: Net Cost ($ per year) | −9,223,532 | −9,374,547 | −9,260,914 | −9,128,371 | −9,220,037 | −9,184,269 |
| H2 Purchased (kg per year) | 1382.2 | 3113.7 | 1409.3 | 0 | 5145.1 | 1814.142 |
| H2 Produced (kg per year) | 1,799,690.4 | 1,834,056.8 | 1,817,535.6 | 1,792,841.6 | 1,822,748.4 | 1,813,770 |
© 2017 by the authors. Licensee MDPI, Basel, Switzerland. This article is an open access article distributed under the terms and conditions of the Creative Commons Attribution (CC BY) license (http://creativecommons.org/licenses/by/4.0/).
Share and Cite
Mukherjee, U.; Maroufmashat, A.; Narayan, A.; Elkamel, A.; Fowler, M. A Stochastic Programming Approach for the Planning and Operation of a Power to Gas Energy Hub with Multiple Energy Recovery Pathways. Energies 2017, 10, 868. https://doi.org/10.3390/en10070868
Mukherjee U, Maroufmashat A, Narayan A, Elkamel A, Fowler M. A Stochastic Programming Approach for the Planning and Operation of a Power to Gas Energy Hub with Multiple Energy Recovery Pathways. Energies. 2017; 10(7):868. https://doi.org/10.3390/en10070868
Chicago/Turabian StyleMukherjee, Ushnik, Azadeh Maroufmashat, Apurva Narayan, Ali Elkamel, and Michael Fowler. 2017. "A Stochastic Programming Approach for the Planning and Operation of a Power to Gas Energy Hub with Multiple Energy Recovery Pathways" Energies 10, no. 7: 868. https://doi.org/10.3390/en10070868
APA StyleMukherjee, U., Maroufmashat, A., Narayan, A., Elkamel, A., & Fowler, M. (2017). A Stochastic Programming Approach for the Planning and Operation of a Power to Gas Energy Hub with Multiple Energy Recovery Pathways. Energies, 10(7), 868. https://doi.org/10.3390/en10070868

