Power Transformer Spatial Acoustic Radiation Characteristics Analysis under Multiple Operating Conditions
Abstract
:1. Introduction
2. Theory and Computational Model
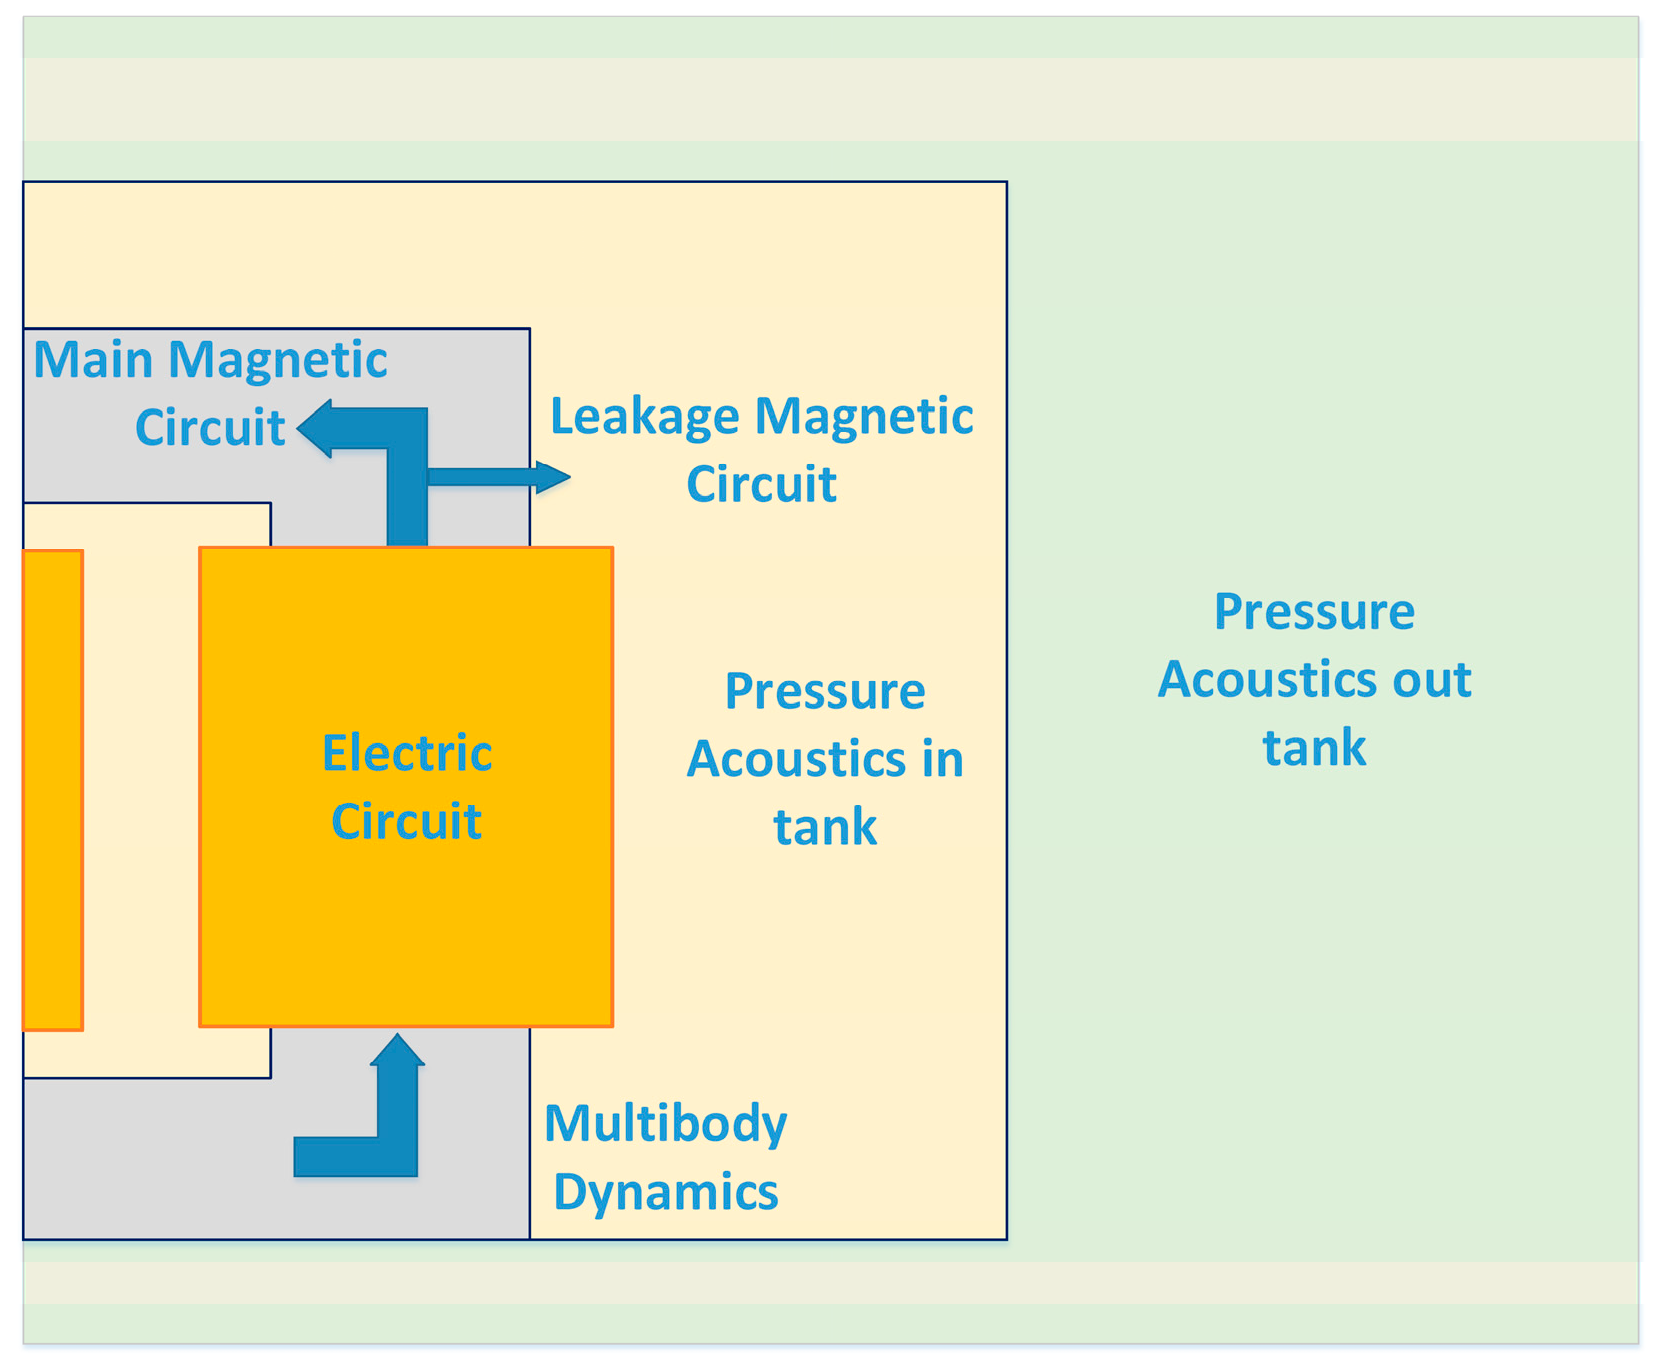
2.1. Coupling Equations
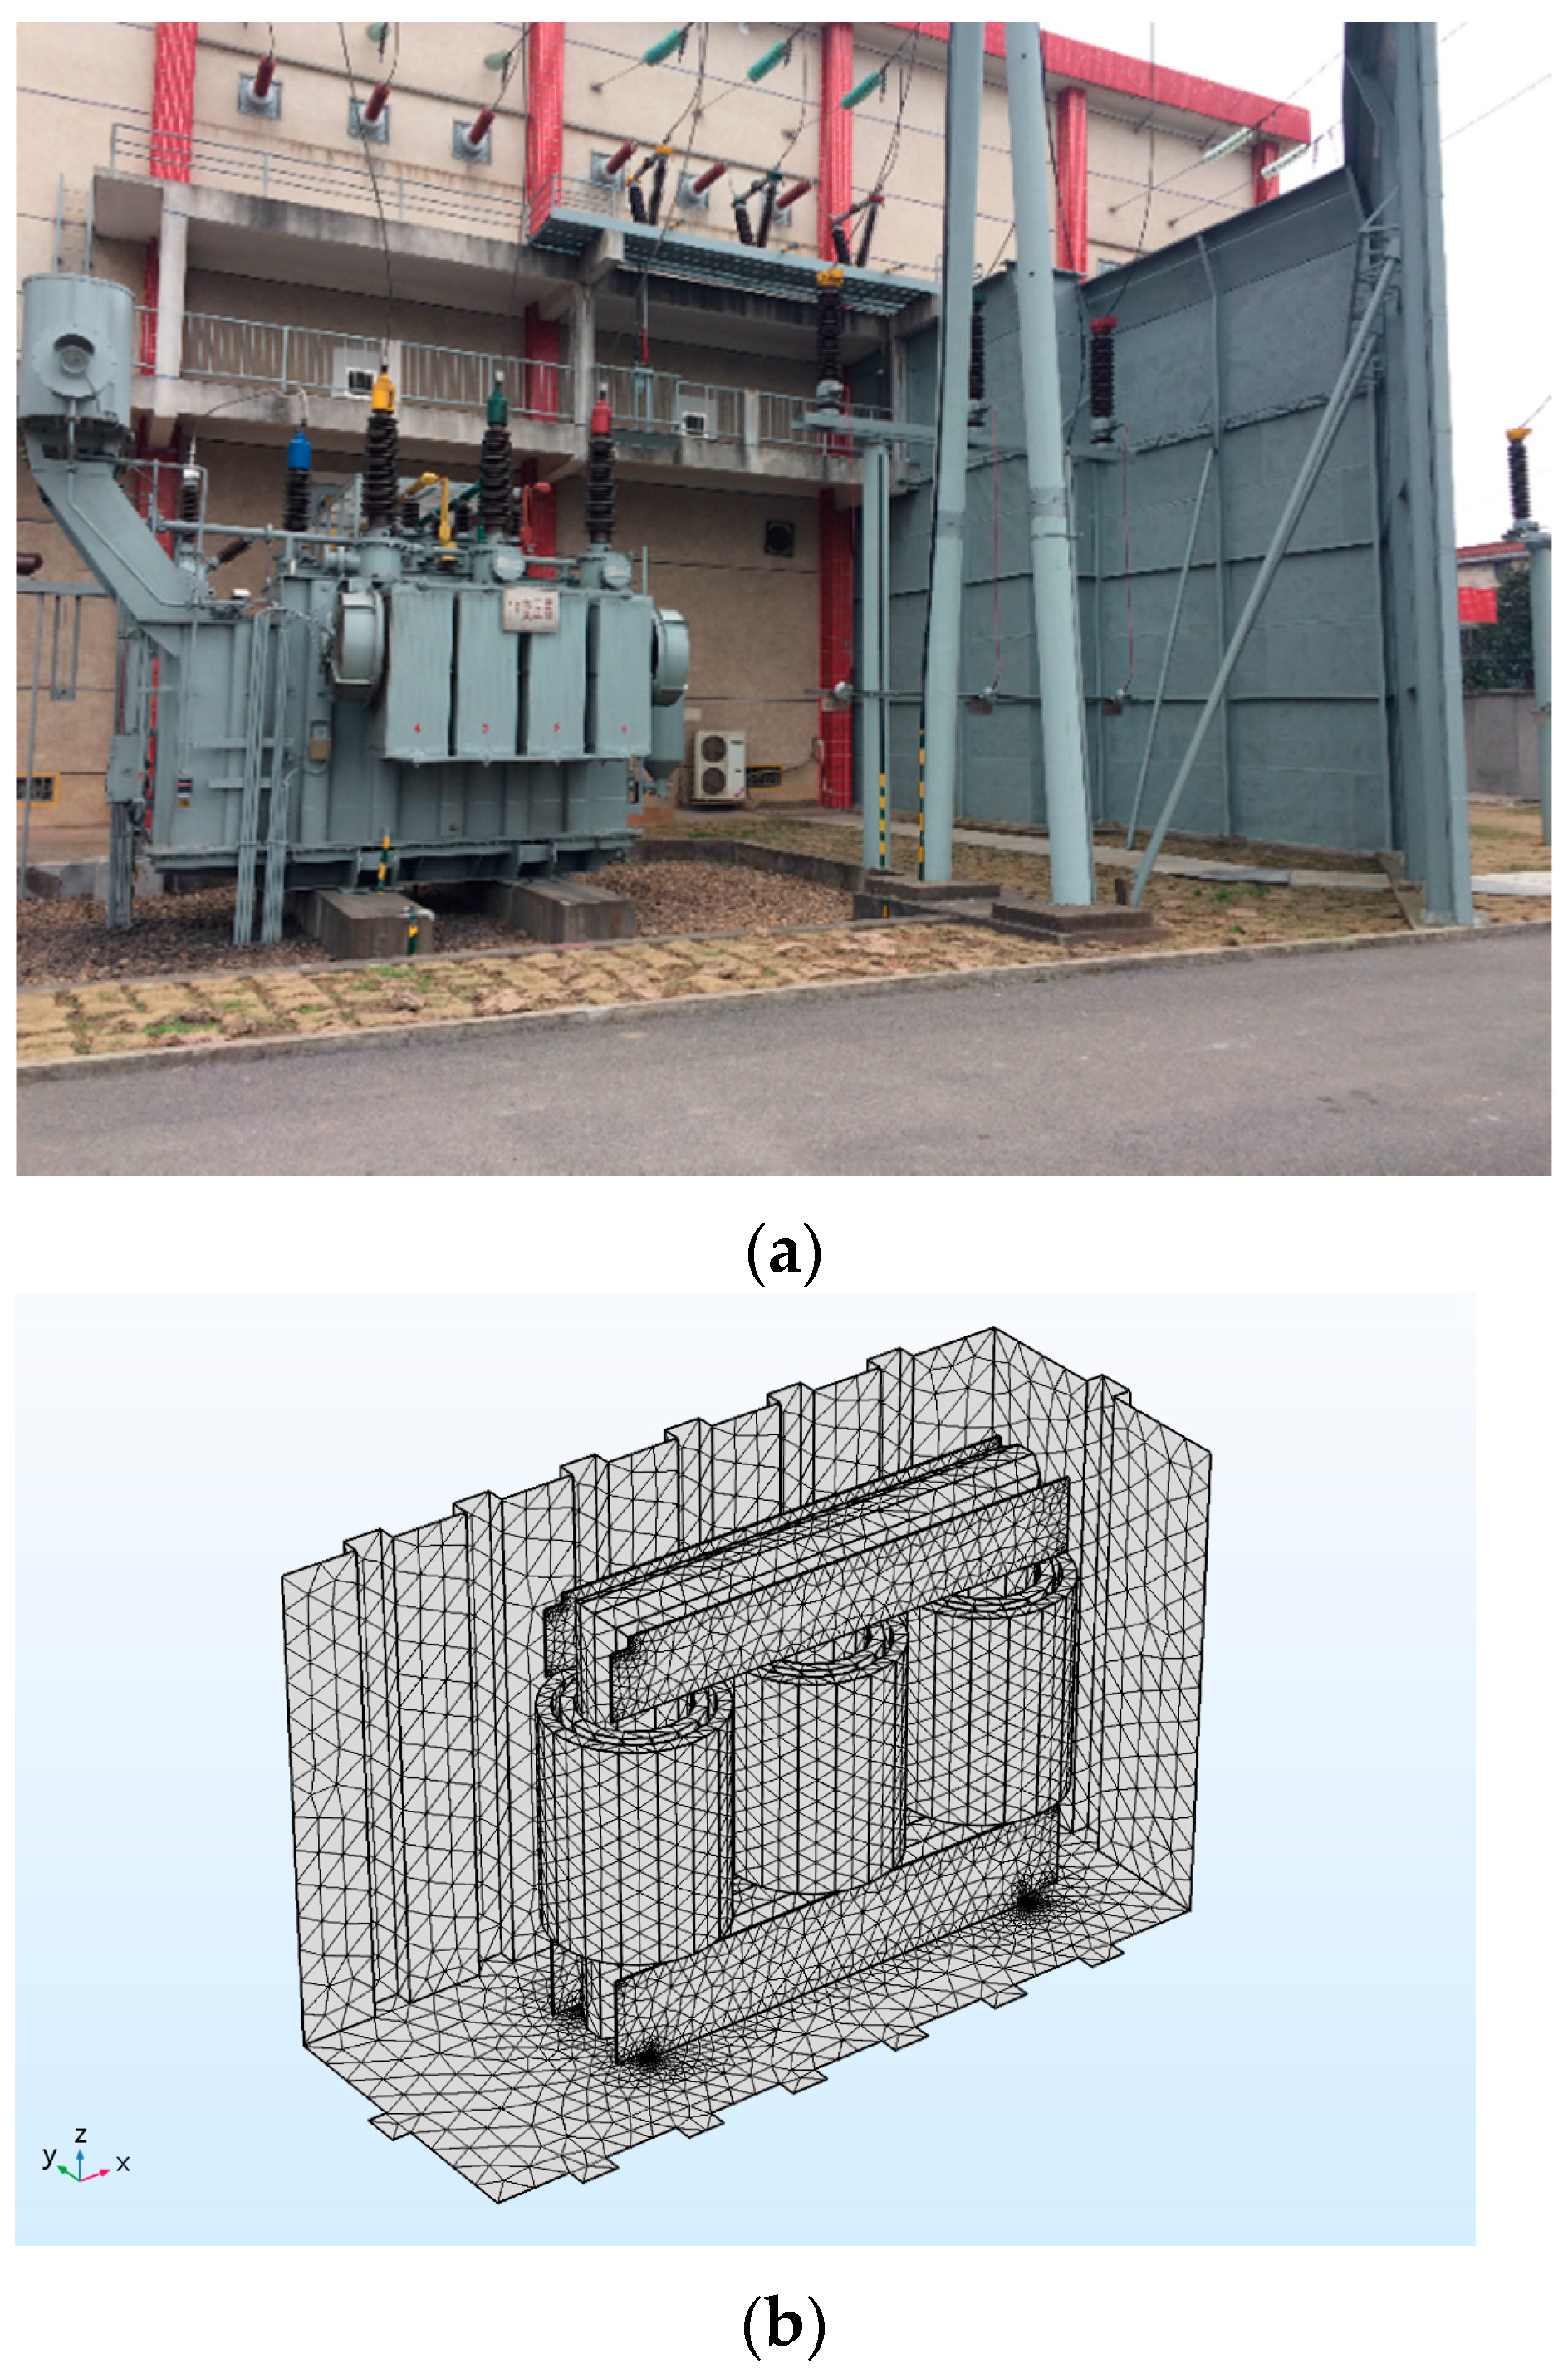
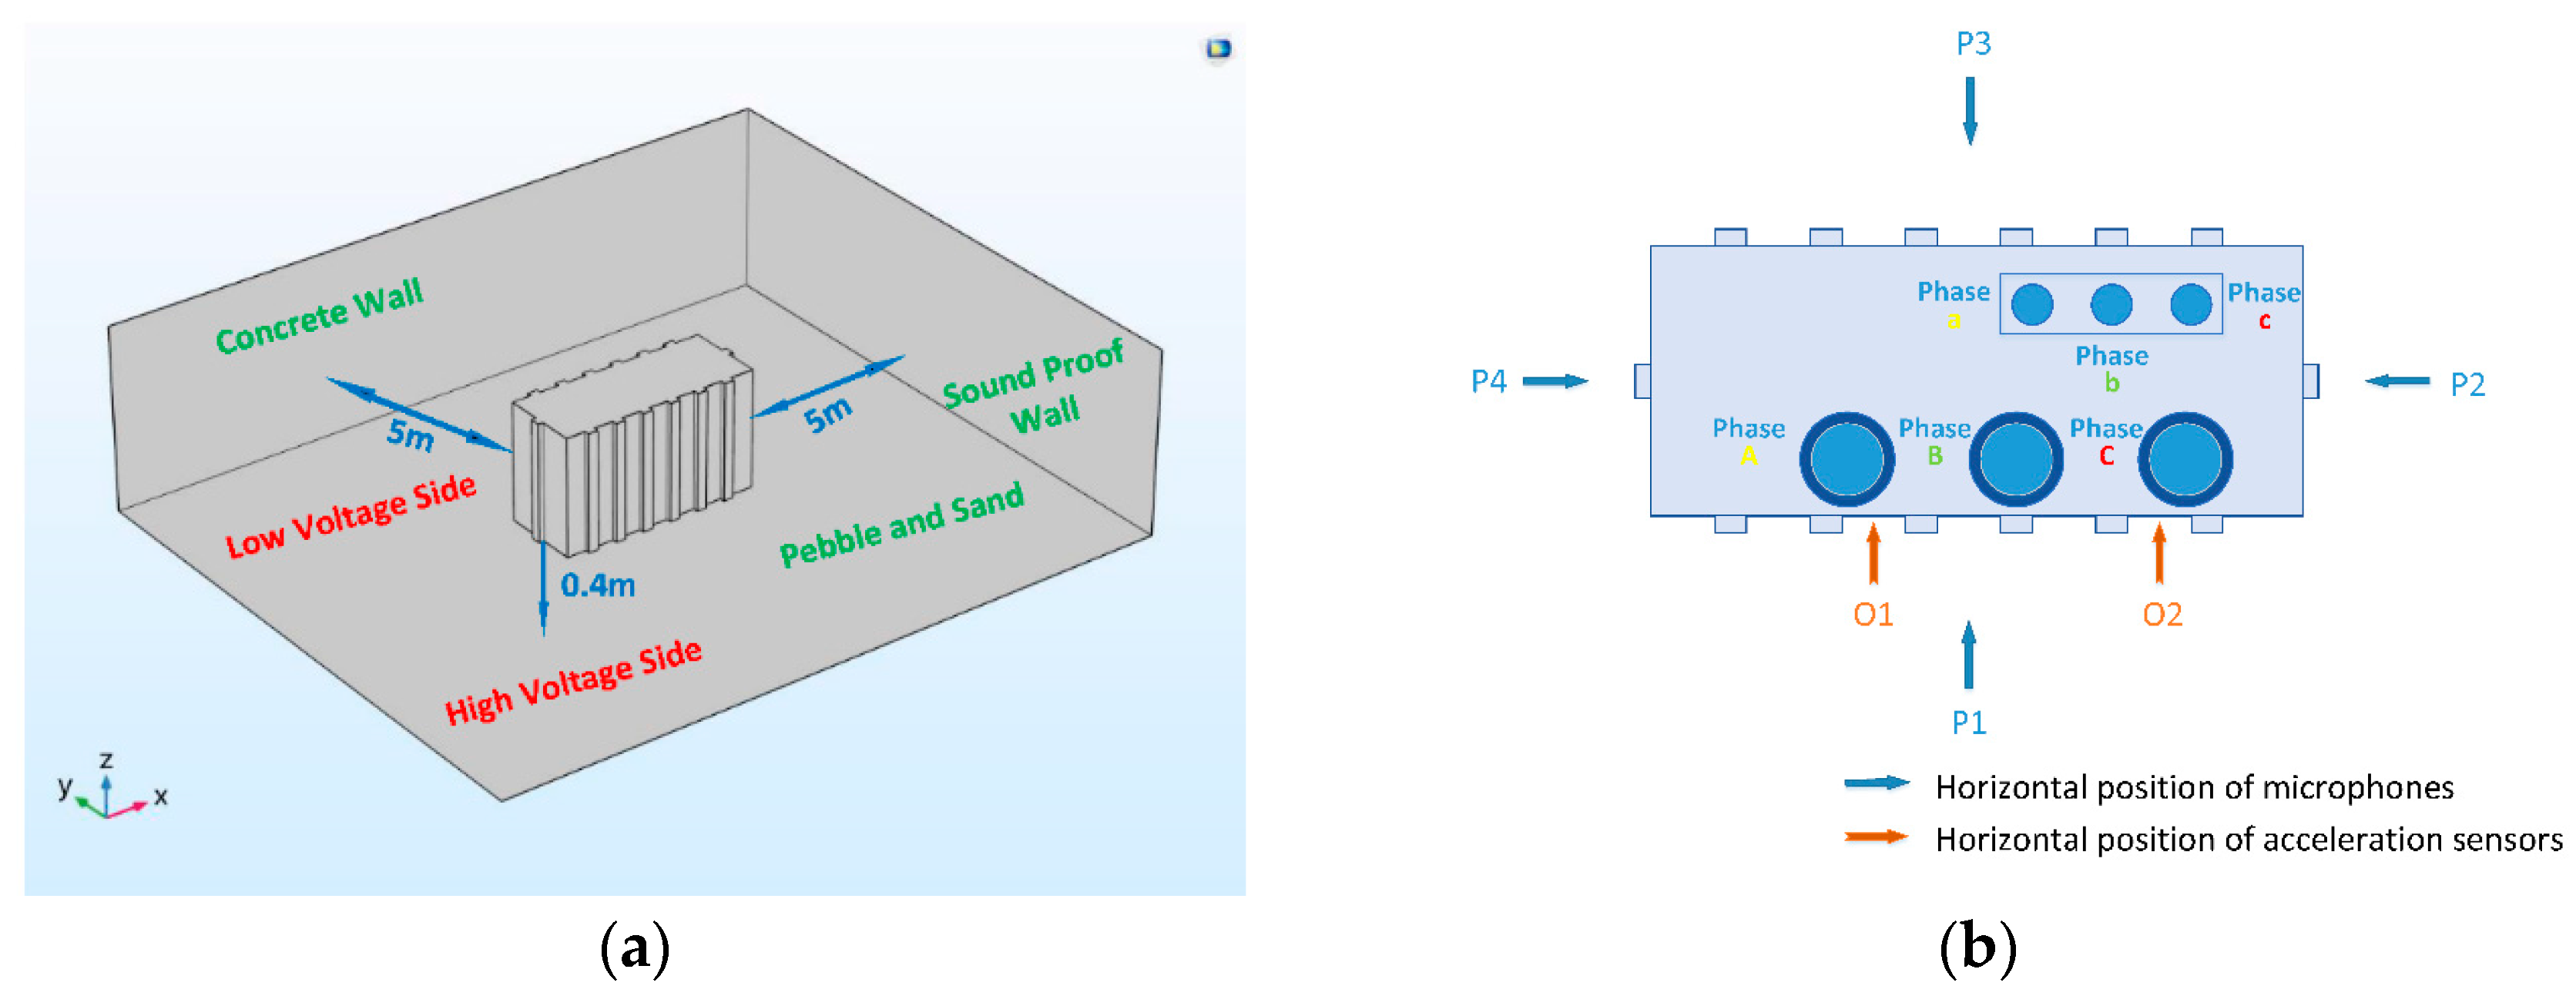
2.2. Computational Model
3. Verification
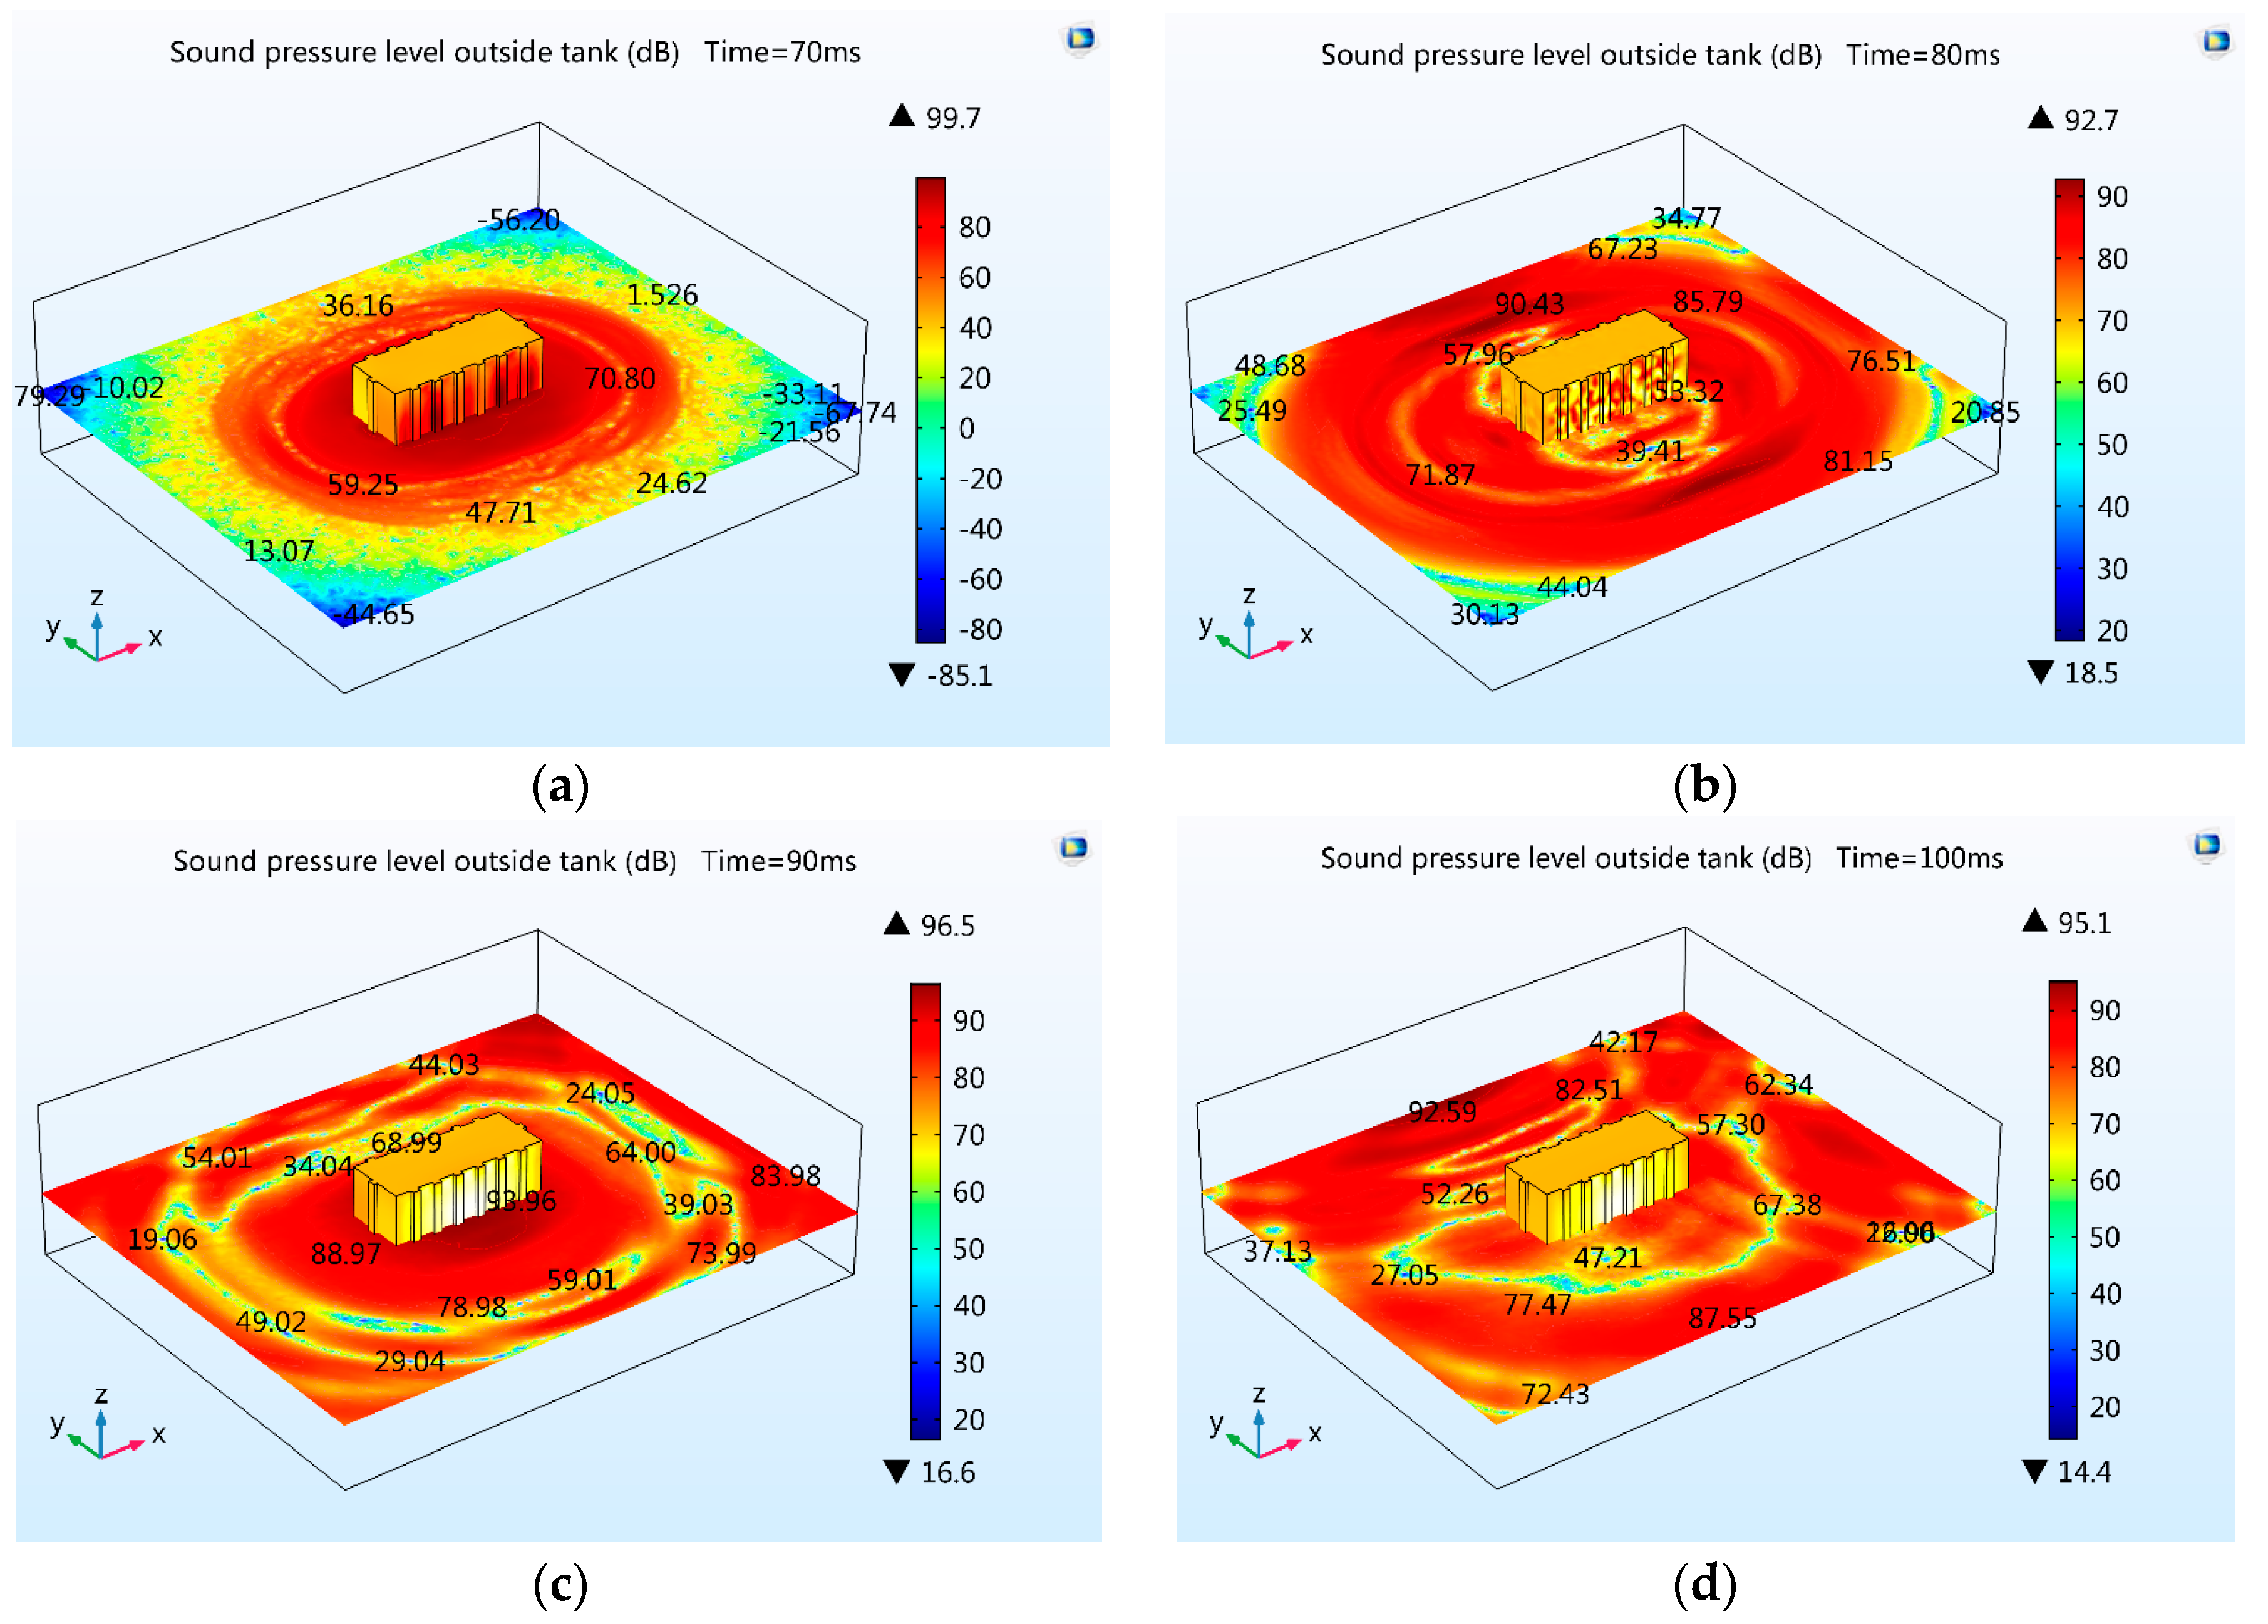
3.1. Verification in Time Domain
3.2. Verification in Frequency Domain
4. Analysis and Discussion
4.1. Far-Field Analysis
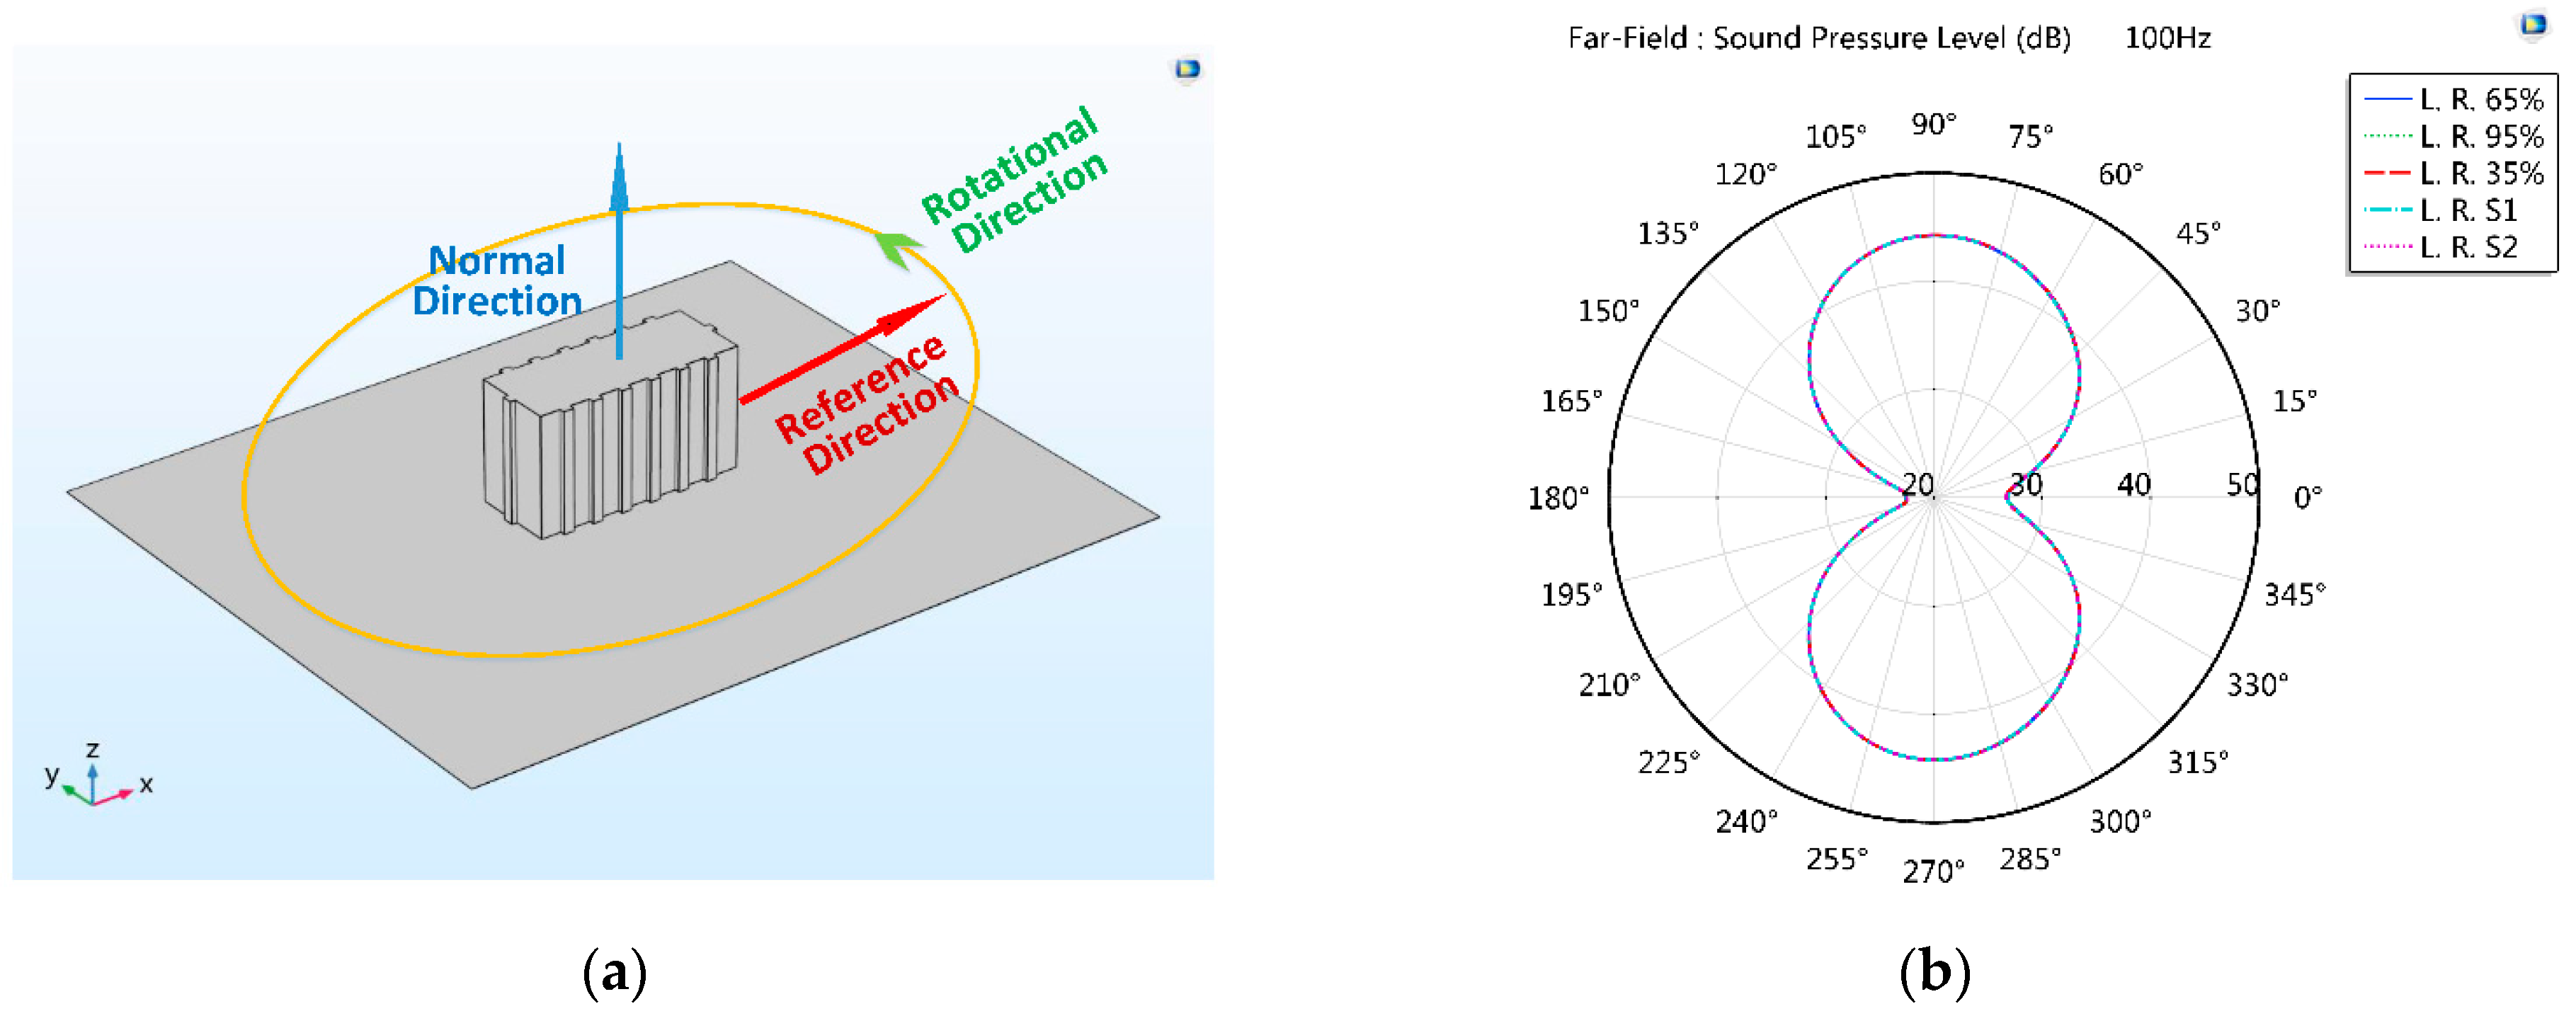
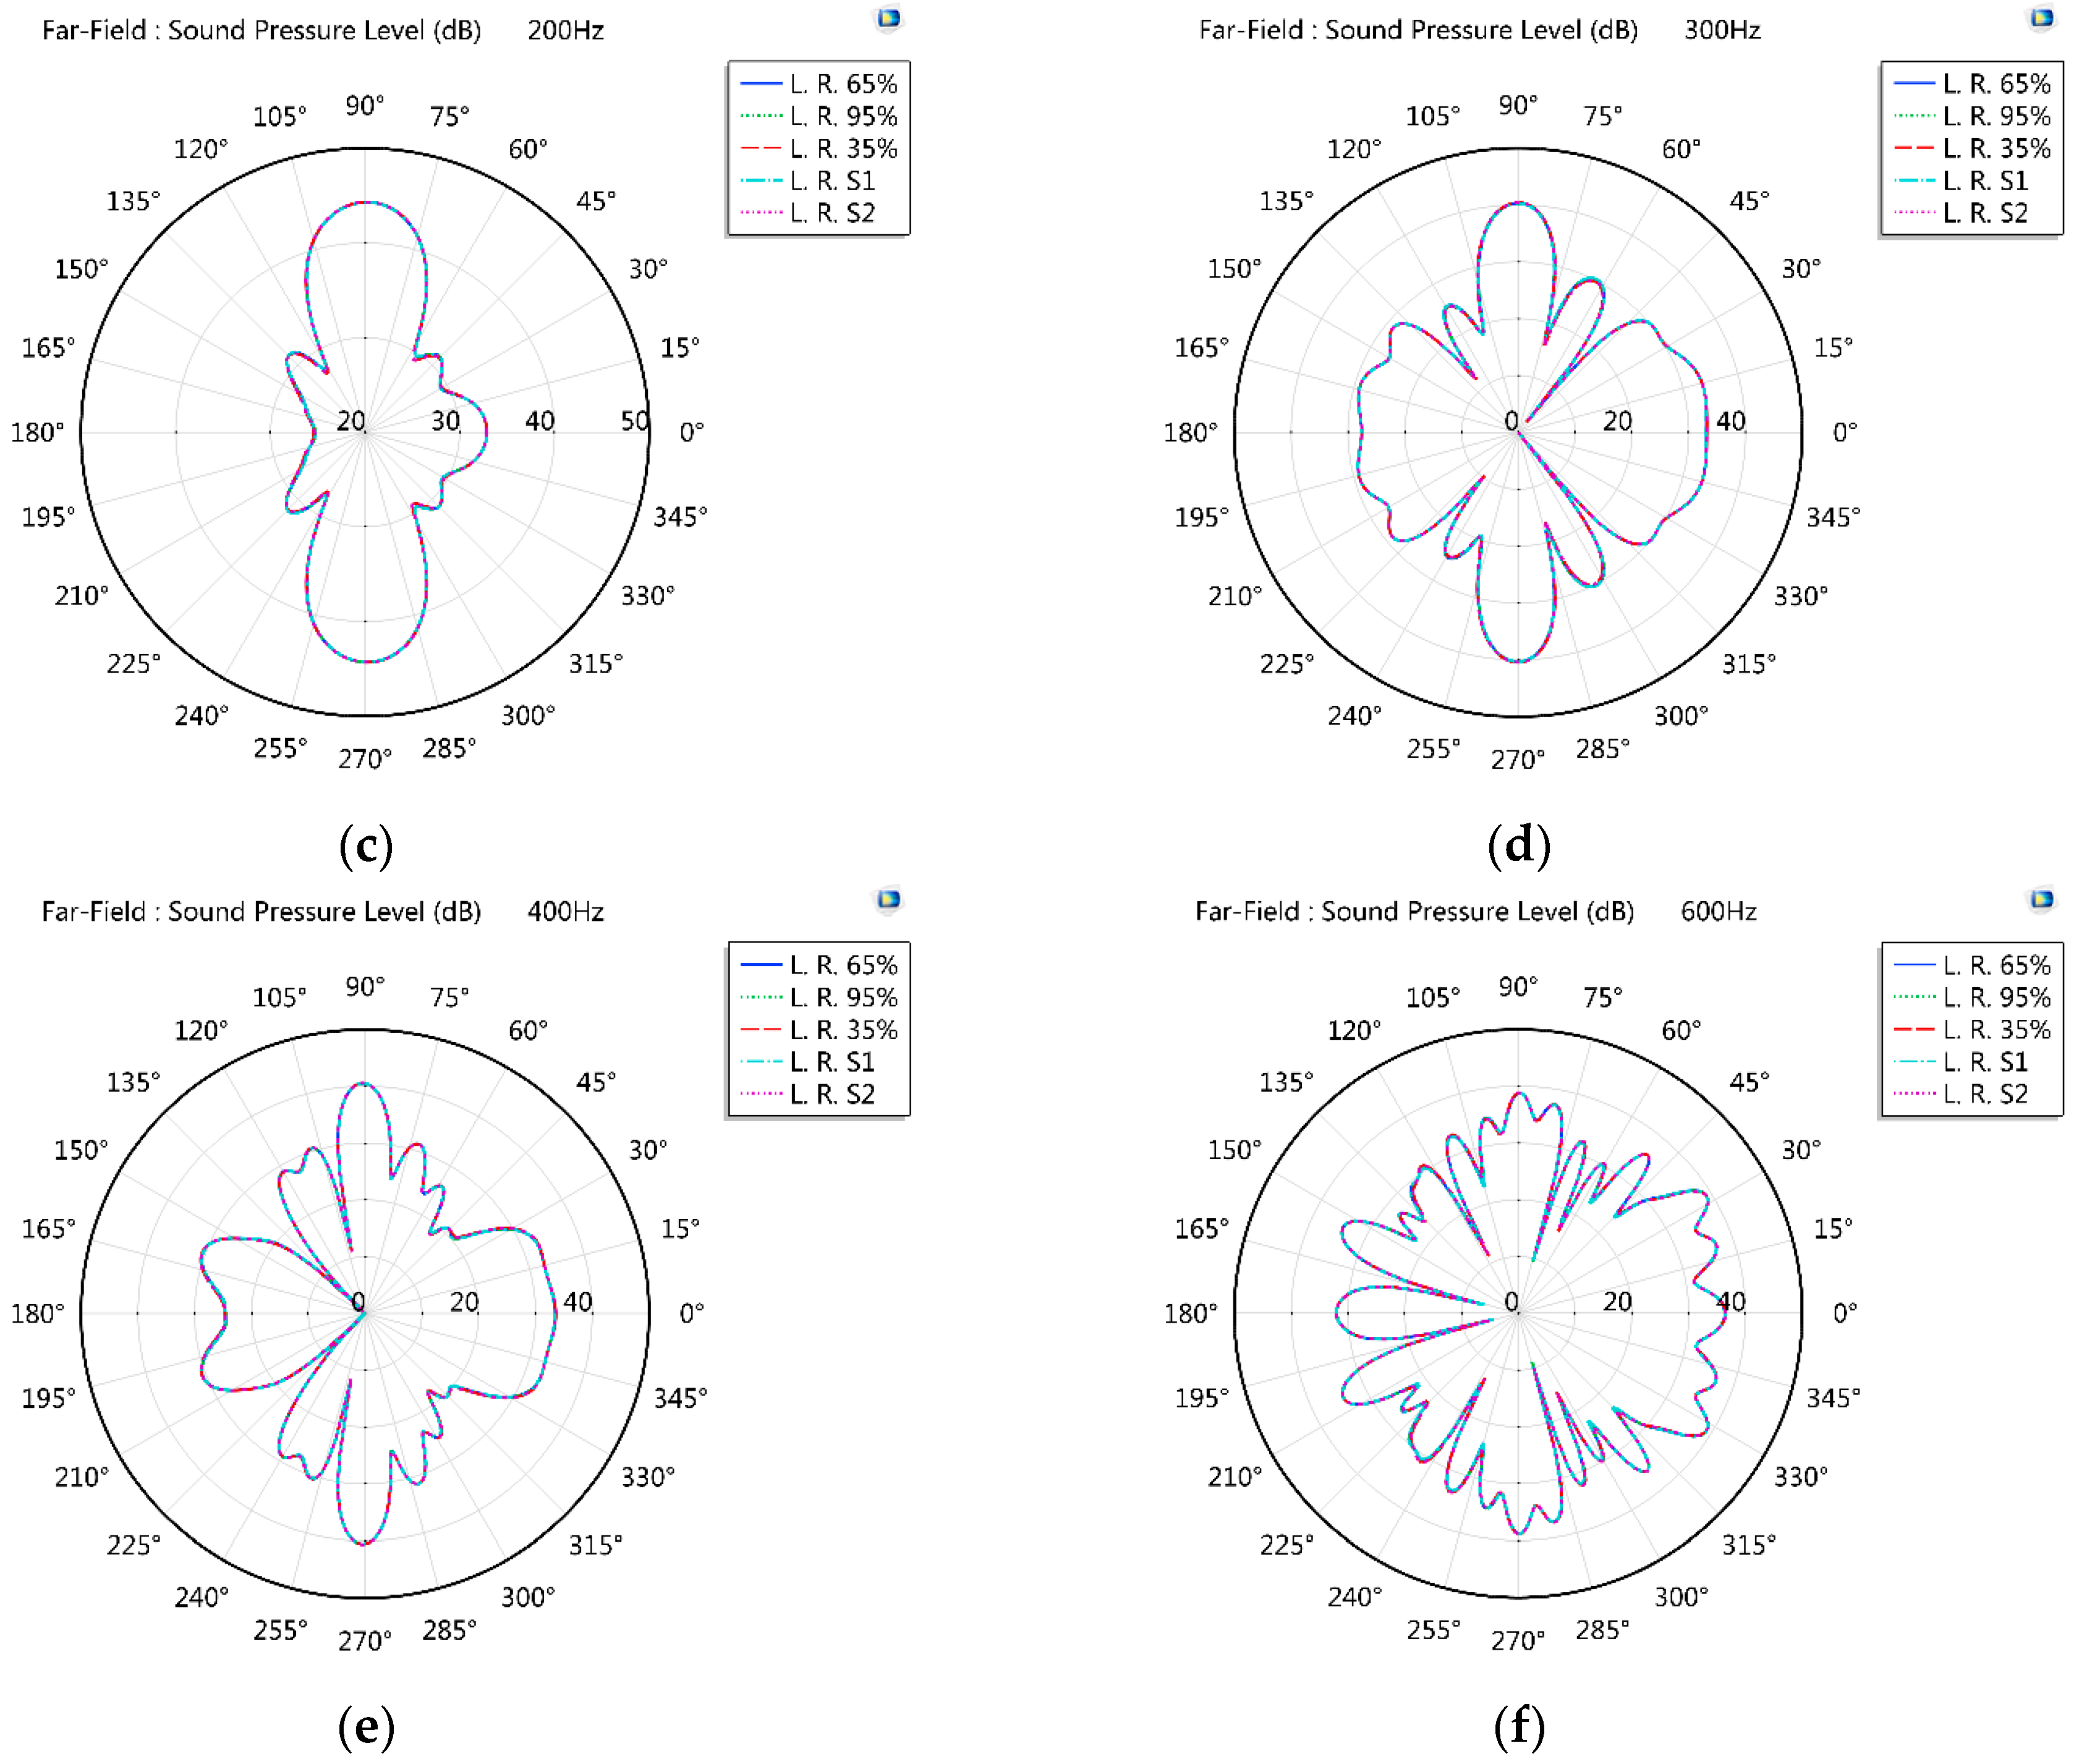
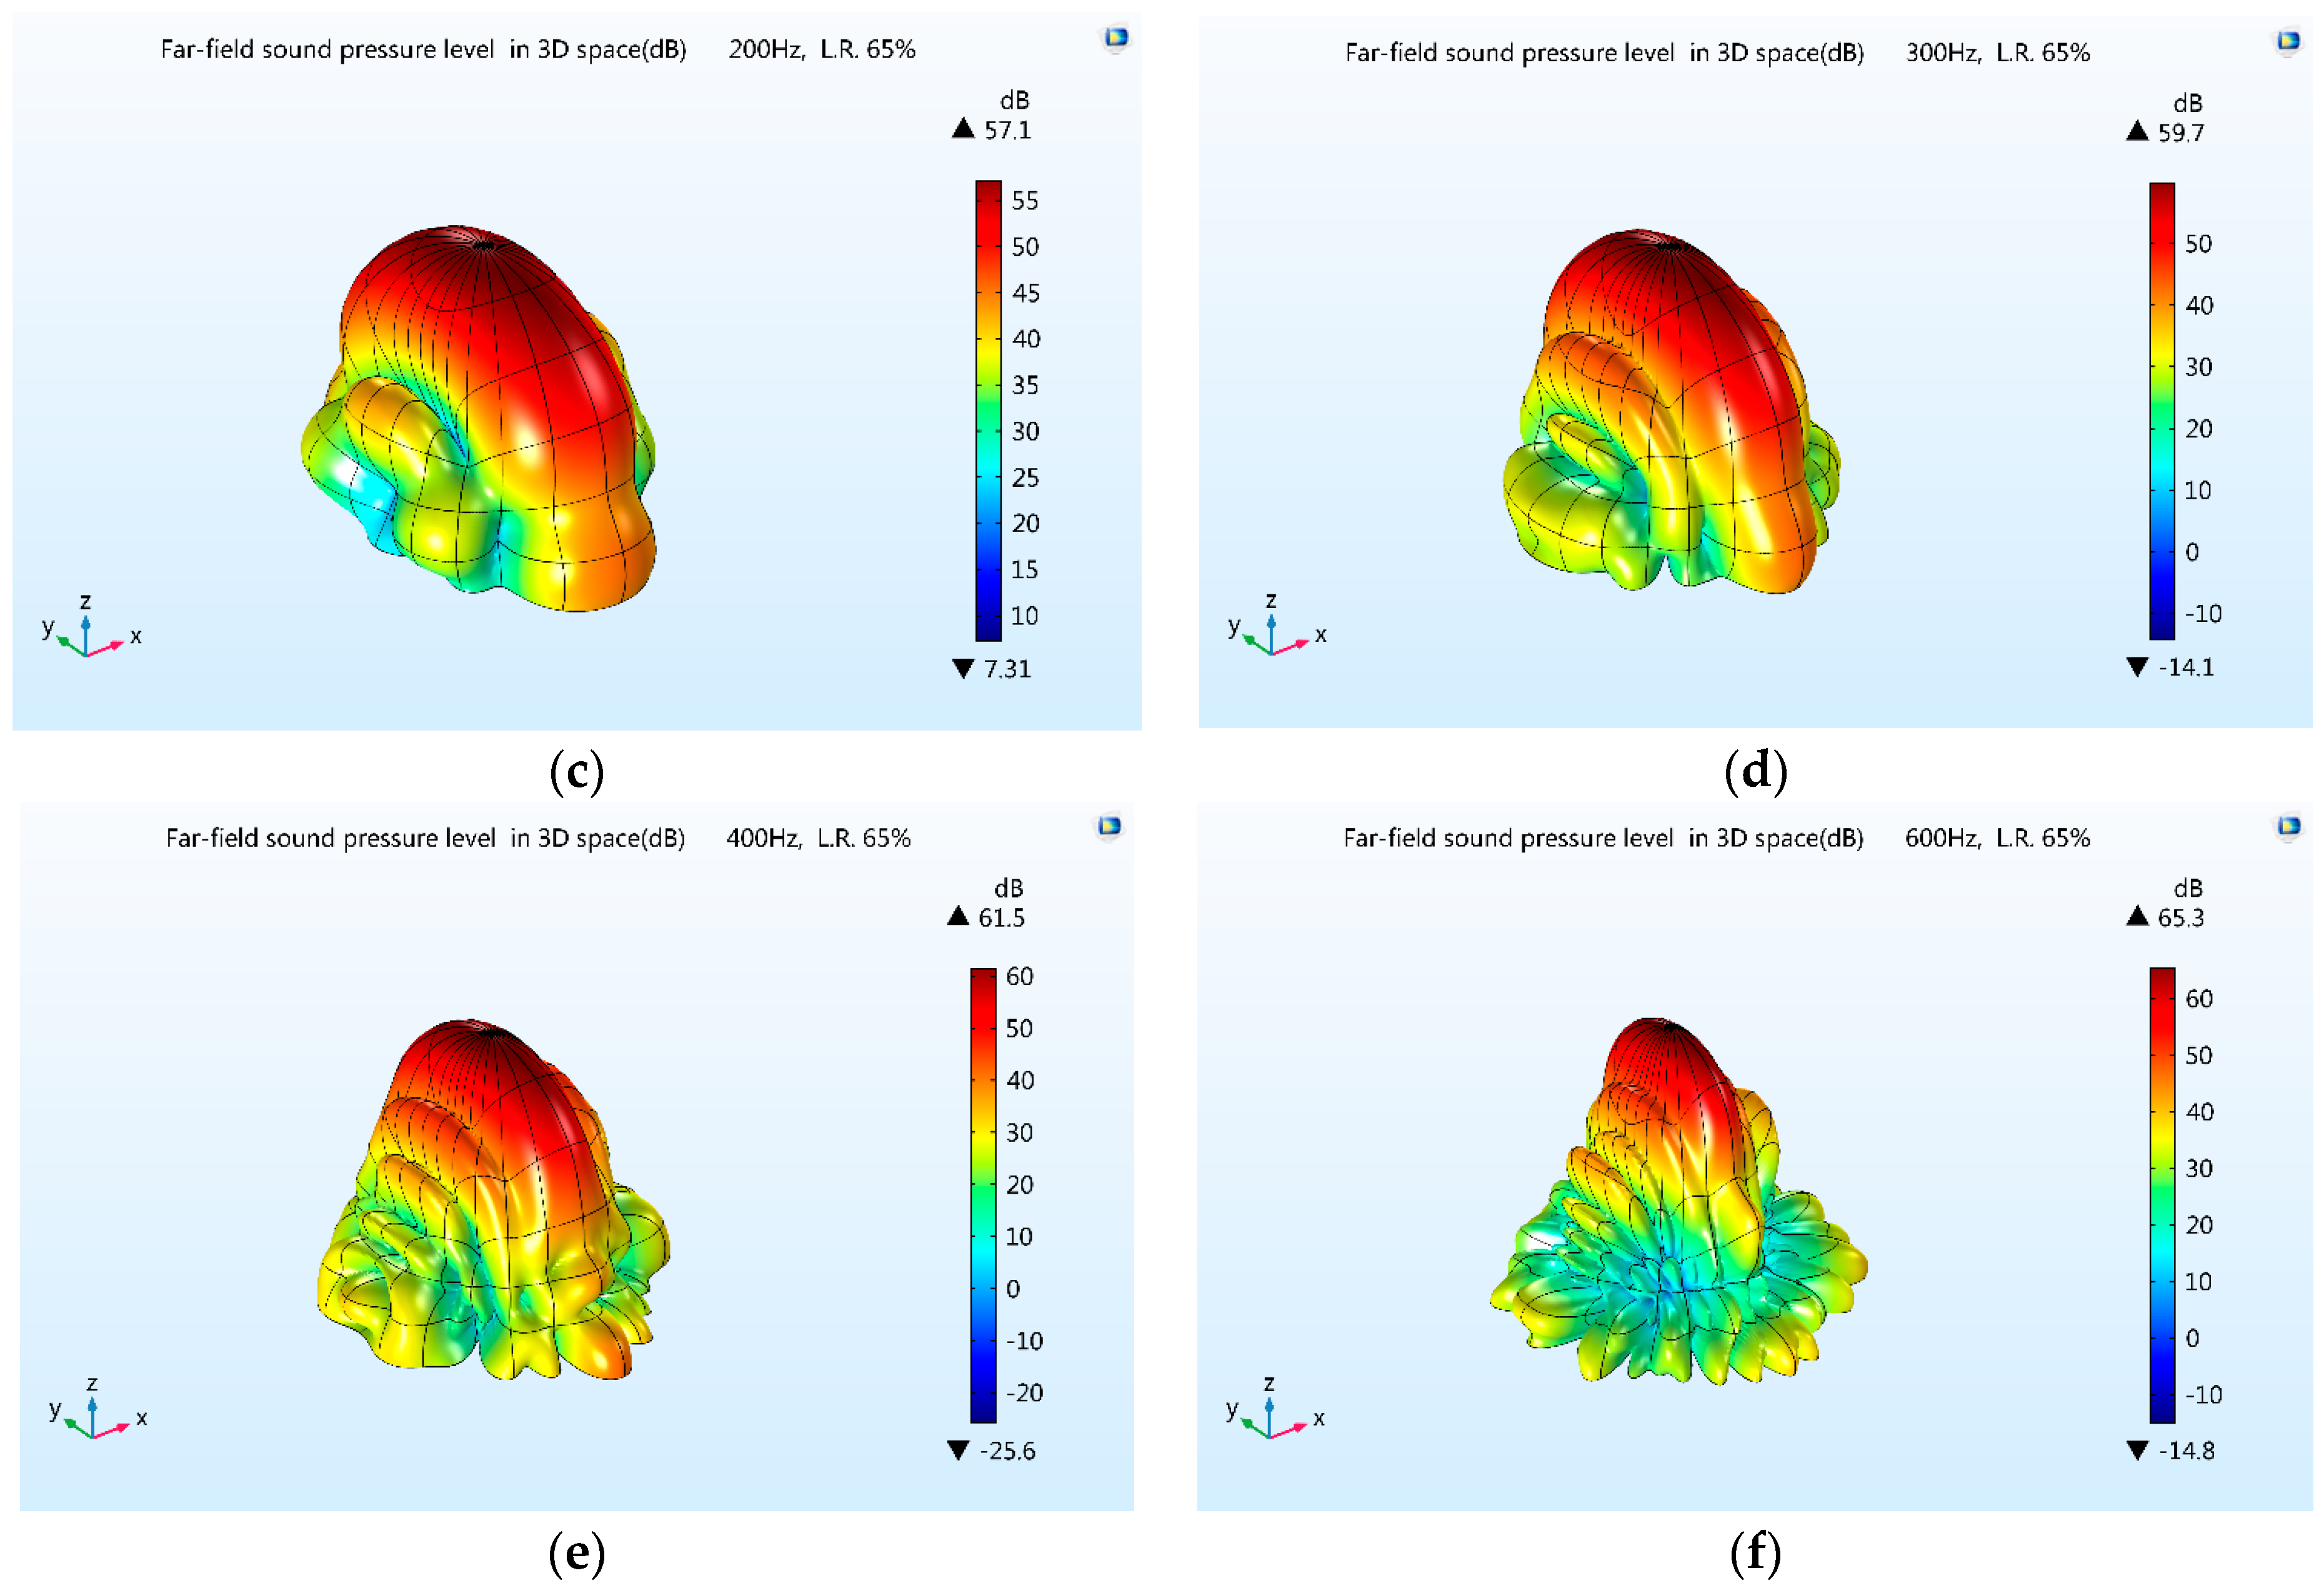
- At a certain frequency, along with the increase of polar angle, the changing trends about the sound pressure level of different load rate are almost accordant, at the same time, the slight differences at certain angles exists. For example, at the frequency of 200 Hz, the sound pressure level values of load rates of 35% at 55 degrees, 123 degrees, 237 degrees and 305 degrees, are slightly less than the corresponding values of the other four load rate situations. Similar difference also exists in 400 Hz situation as shown in Figure 6e, among the values at 135 degrees.
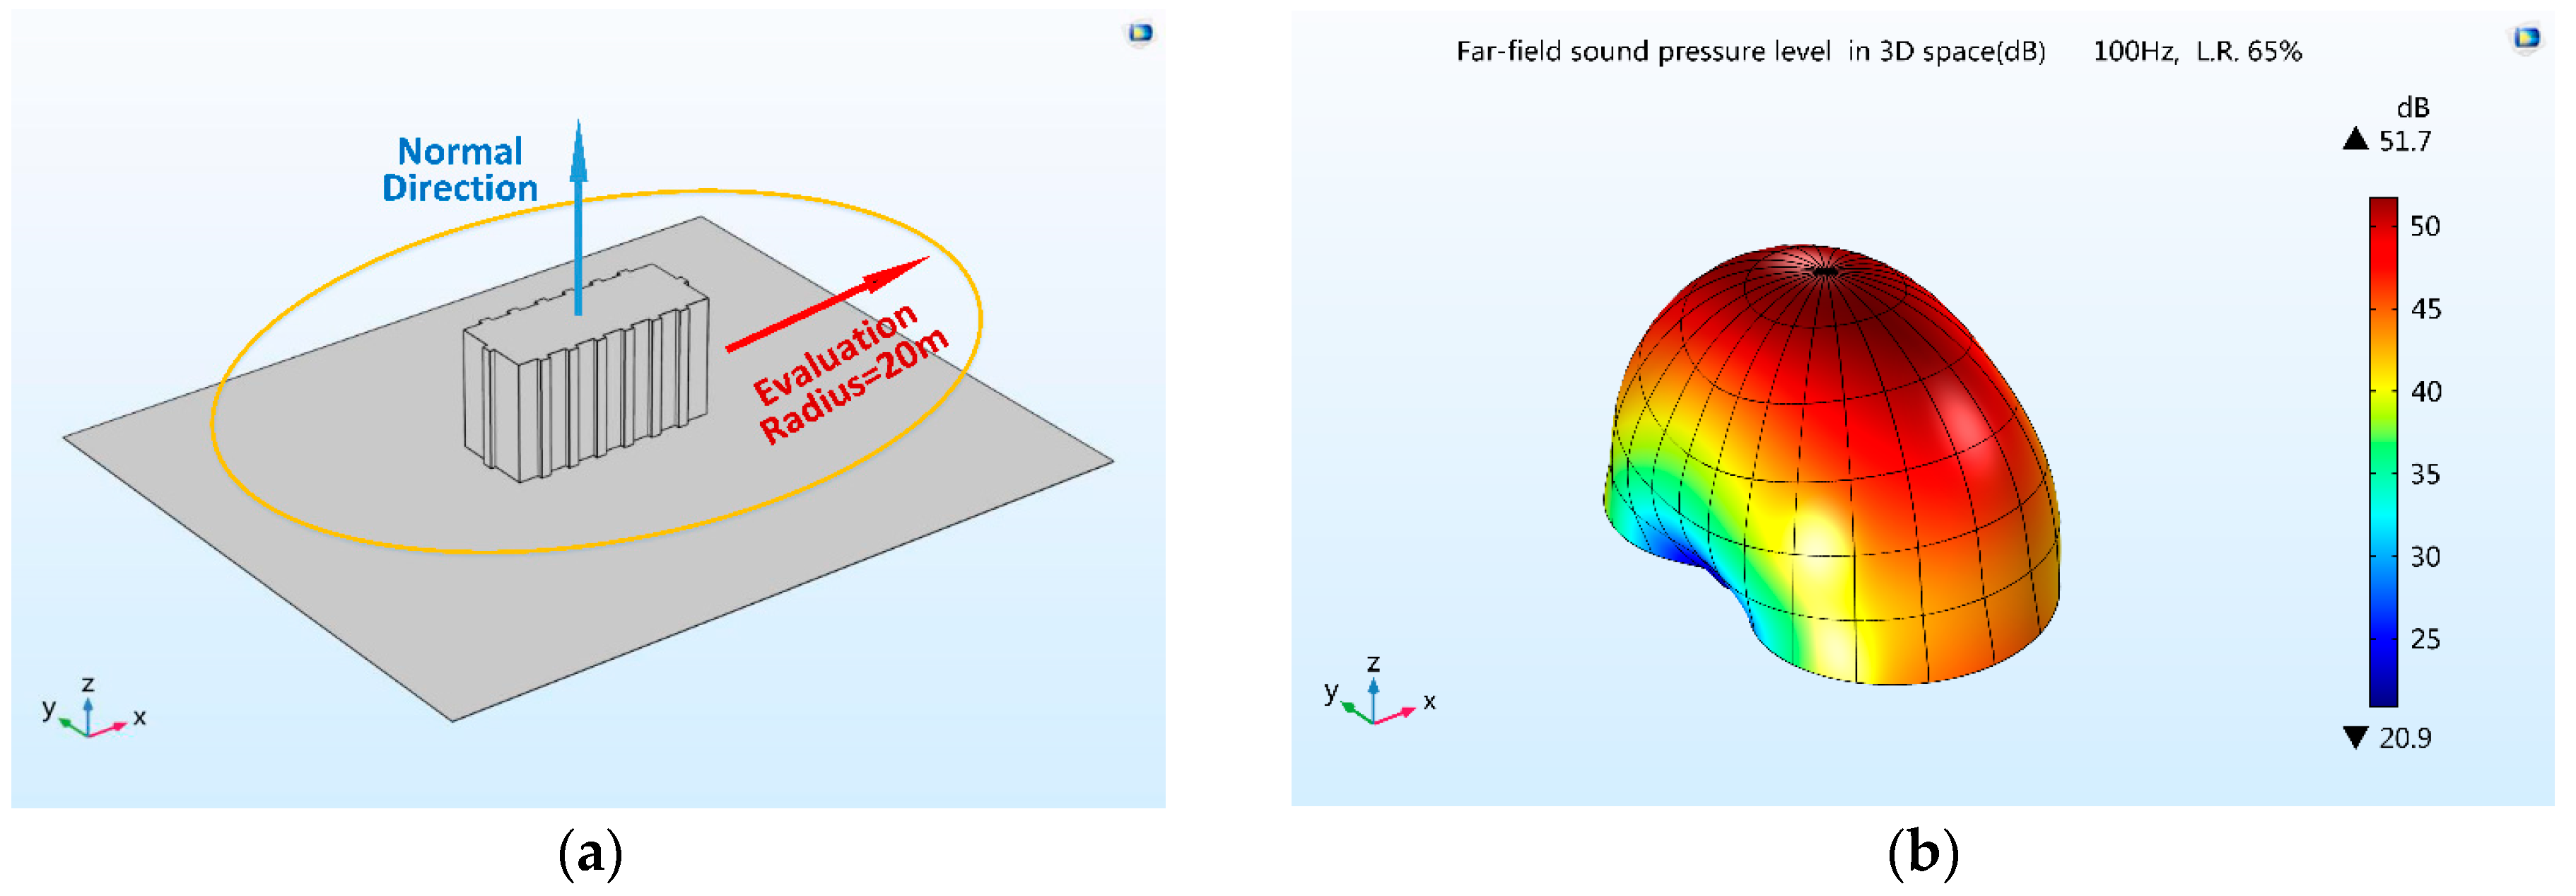
- With increasing frequency, the progressively smaller wavelengths compared to the size of the power transformer makes the sound pressure level response gradually non-uniform: the graph of 100 Hz in Figure 6b can be roughly regarded as two crossed ellipses, while the graph shape of 600 Hz in Figure 6f is more irregular, but the five graphs are almost symmetrical along the 0 to 180 degree axis.
- The maximum sound pressure level in the 45 degree sector region on both sides of the X directions are less than the values in corresponding regions on both sides of the Y directions. The difference are particularly obvious in the situations of 100 Hz and 200 Hz, in which the differentials are even greater than 20 dB.
- In five far-field figures, along with the x-axis, the sound pressure levels in the 45 degree sector region on both sides of increasing X direction are overall greater than the corresponding values of decreasing X directions. The differential of these two values on the same diameter is greater than 3 dB or more.
4.2. Directivity Analysis
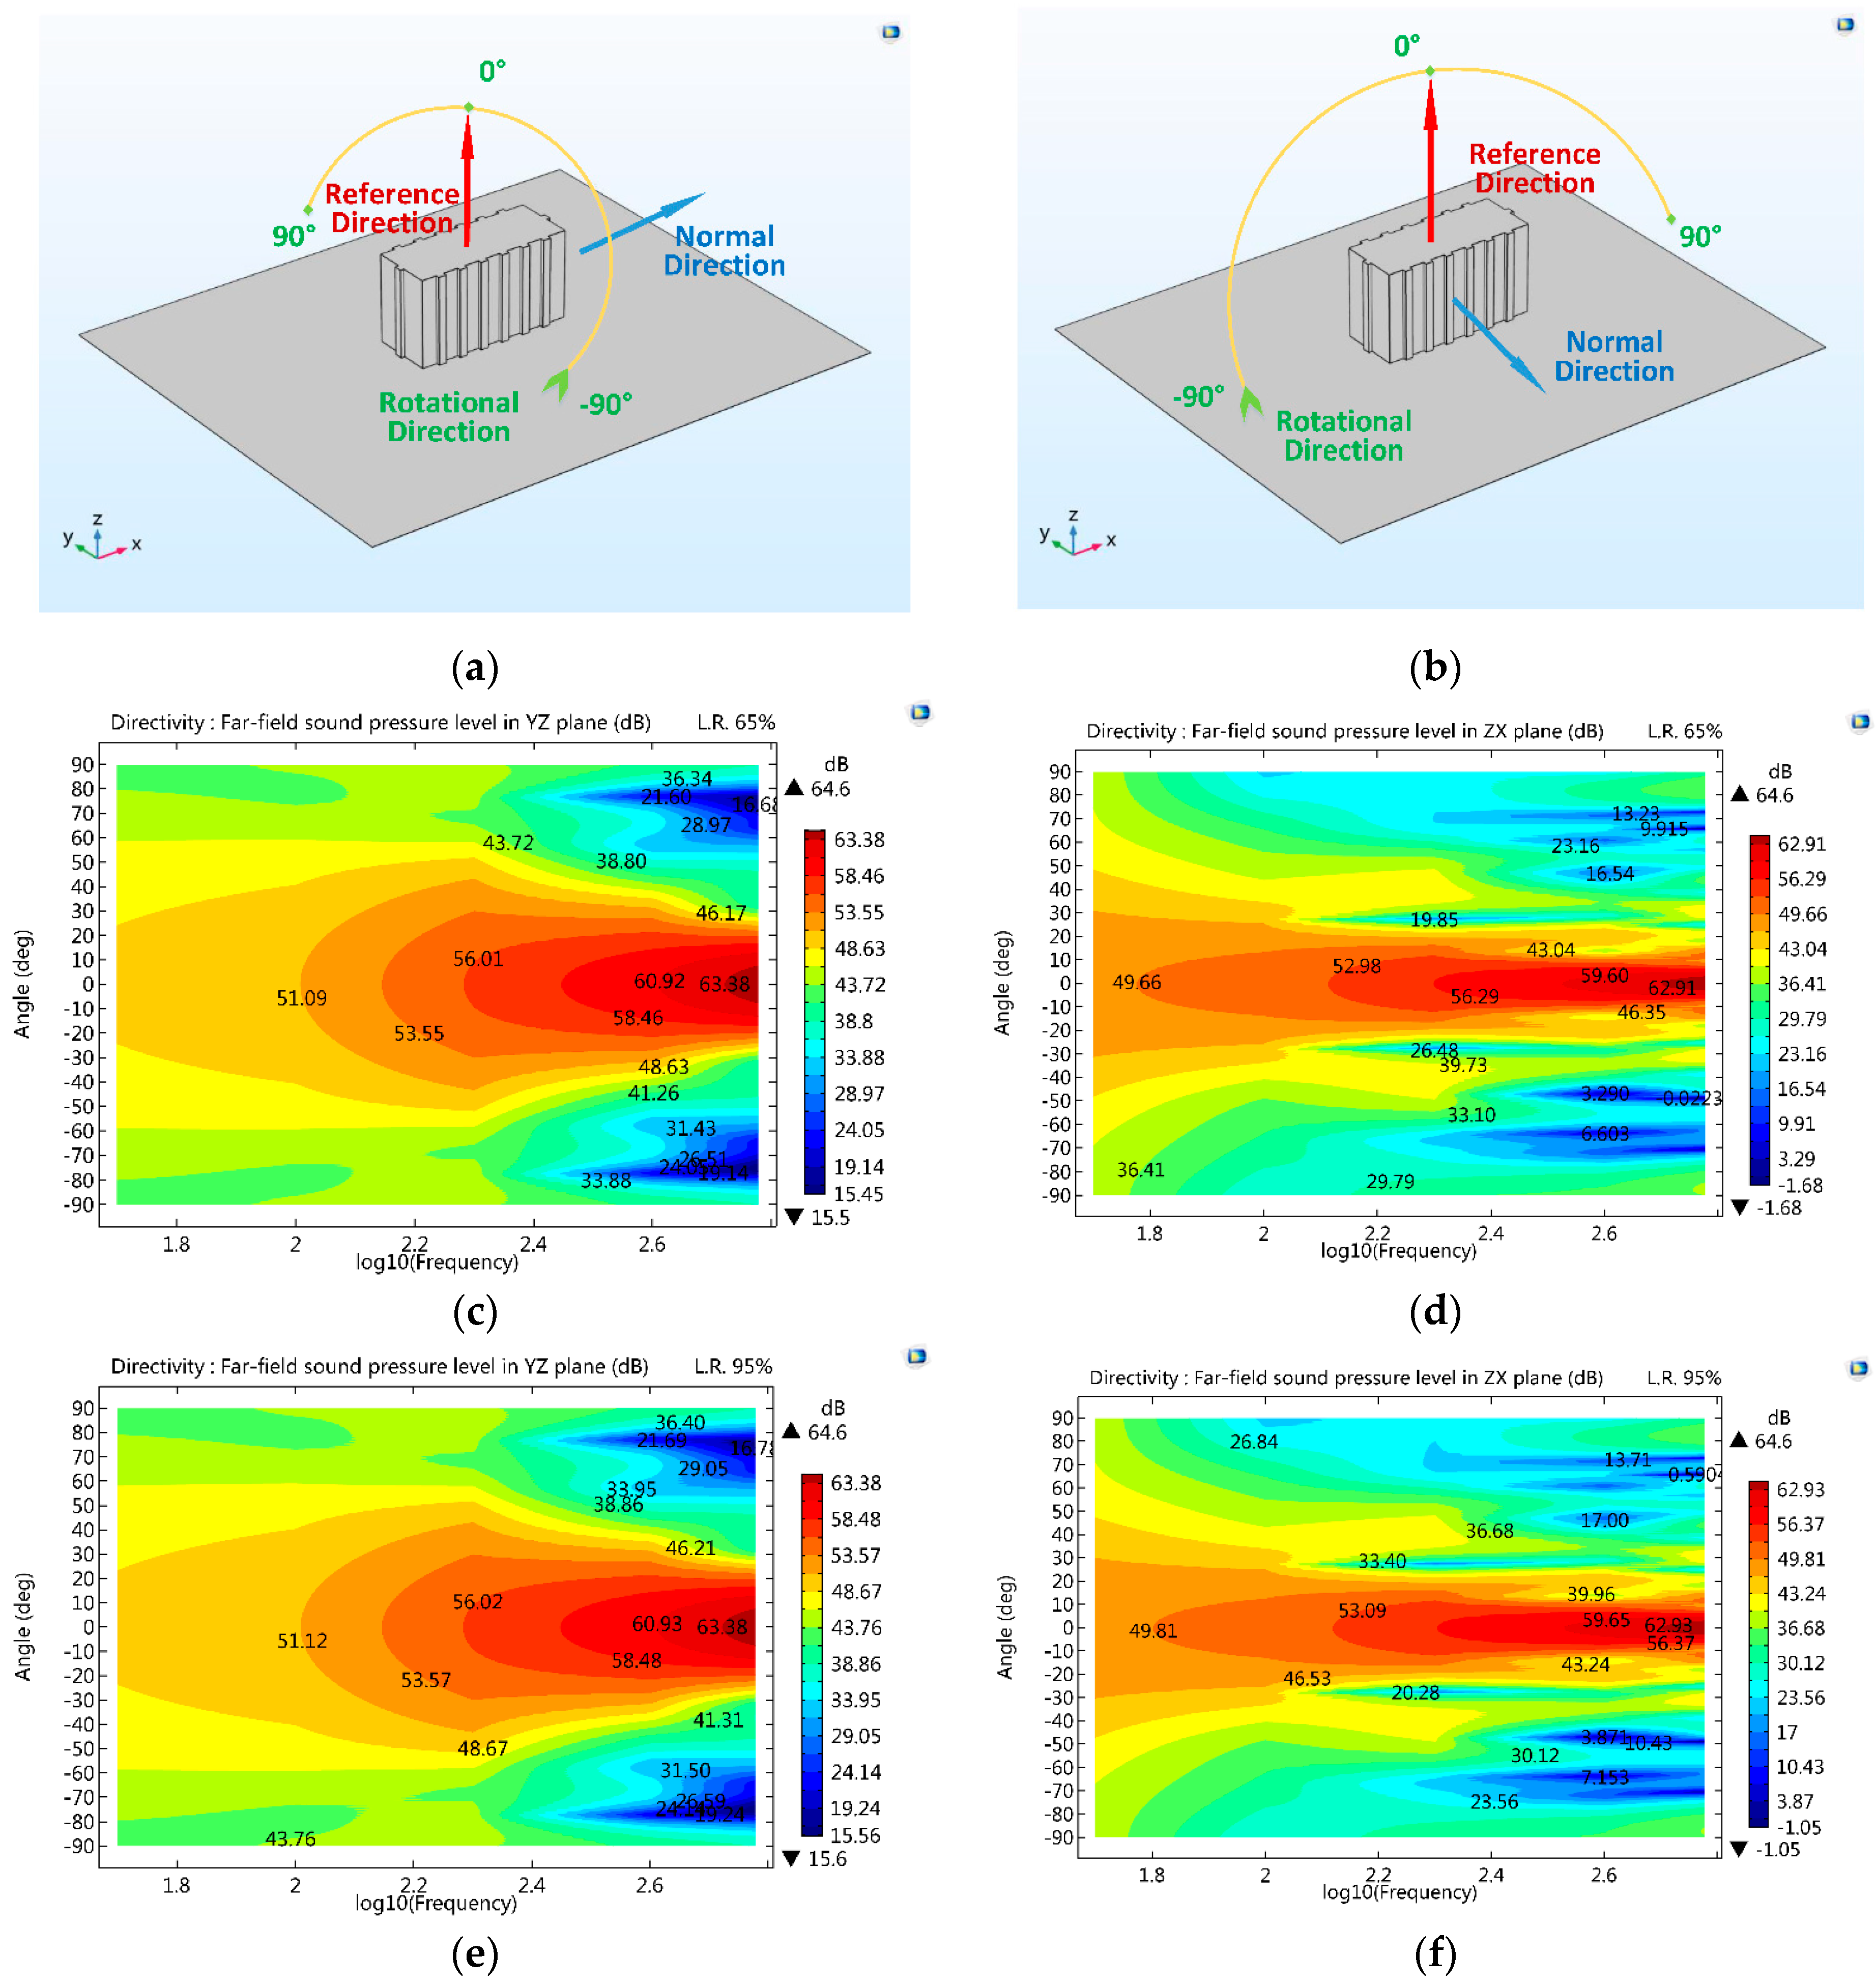
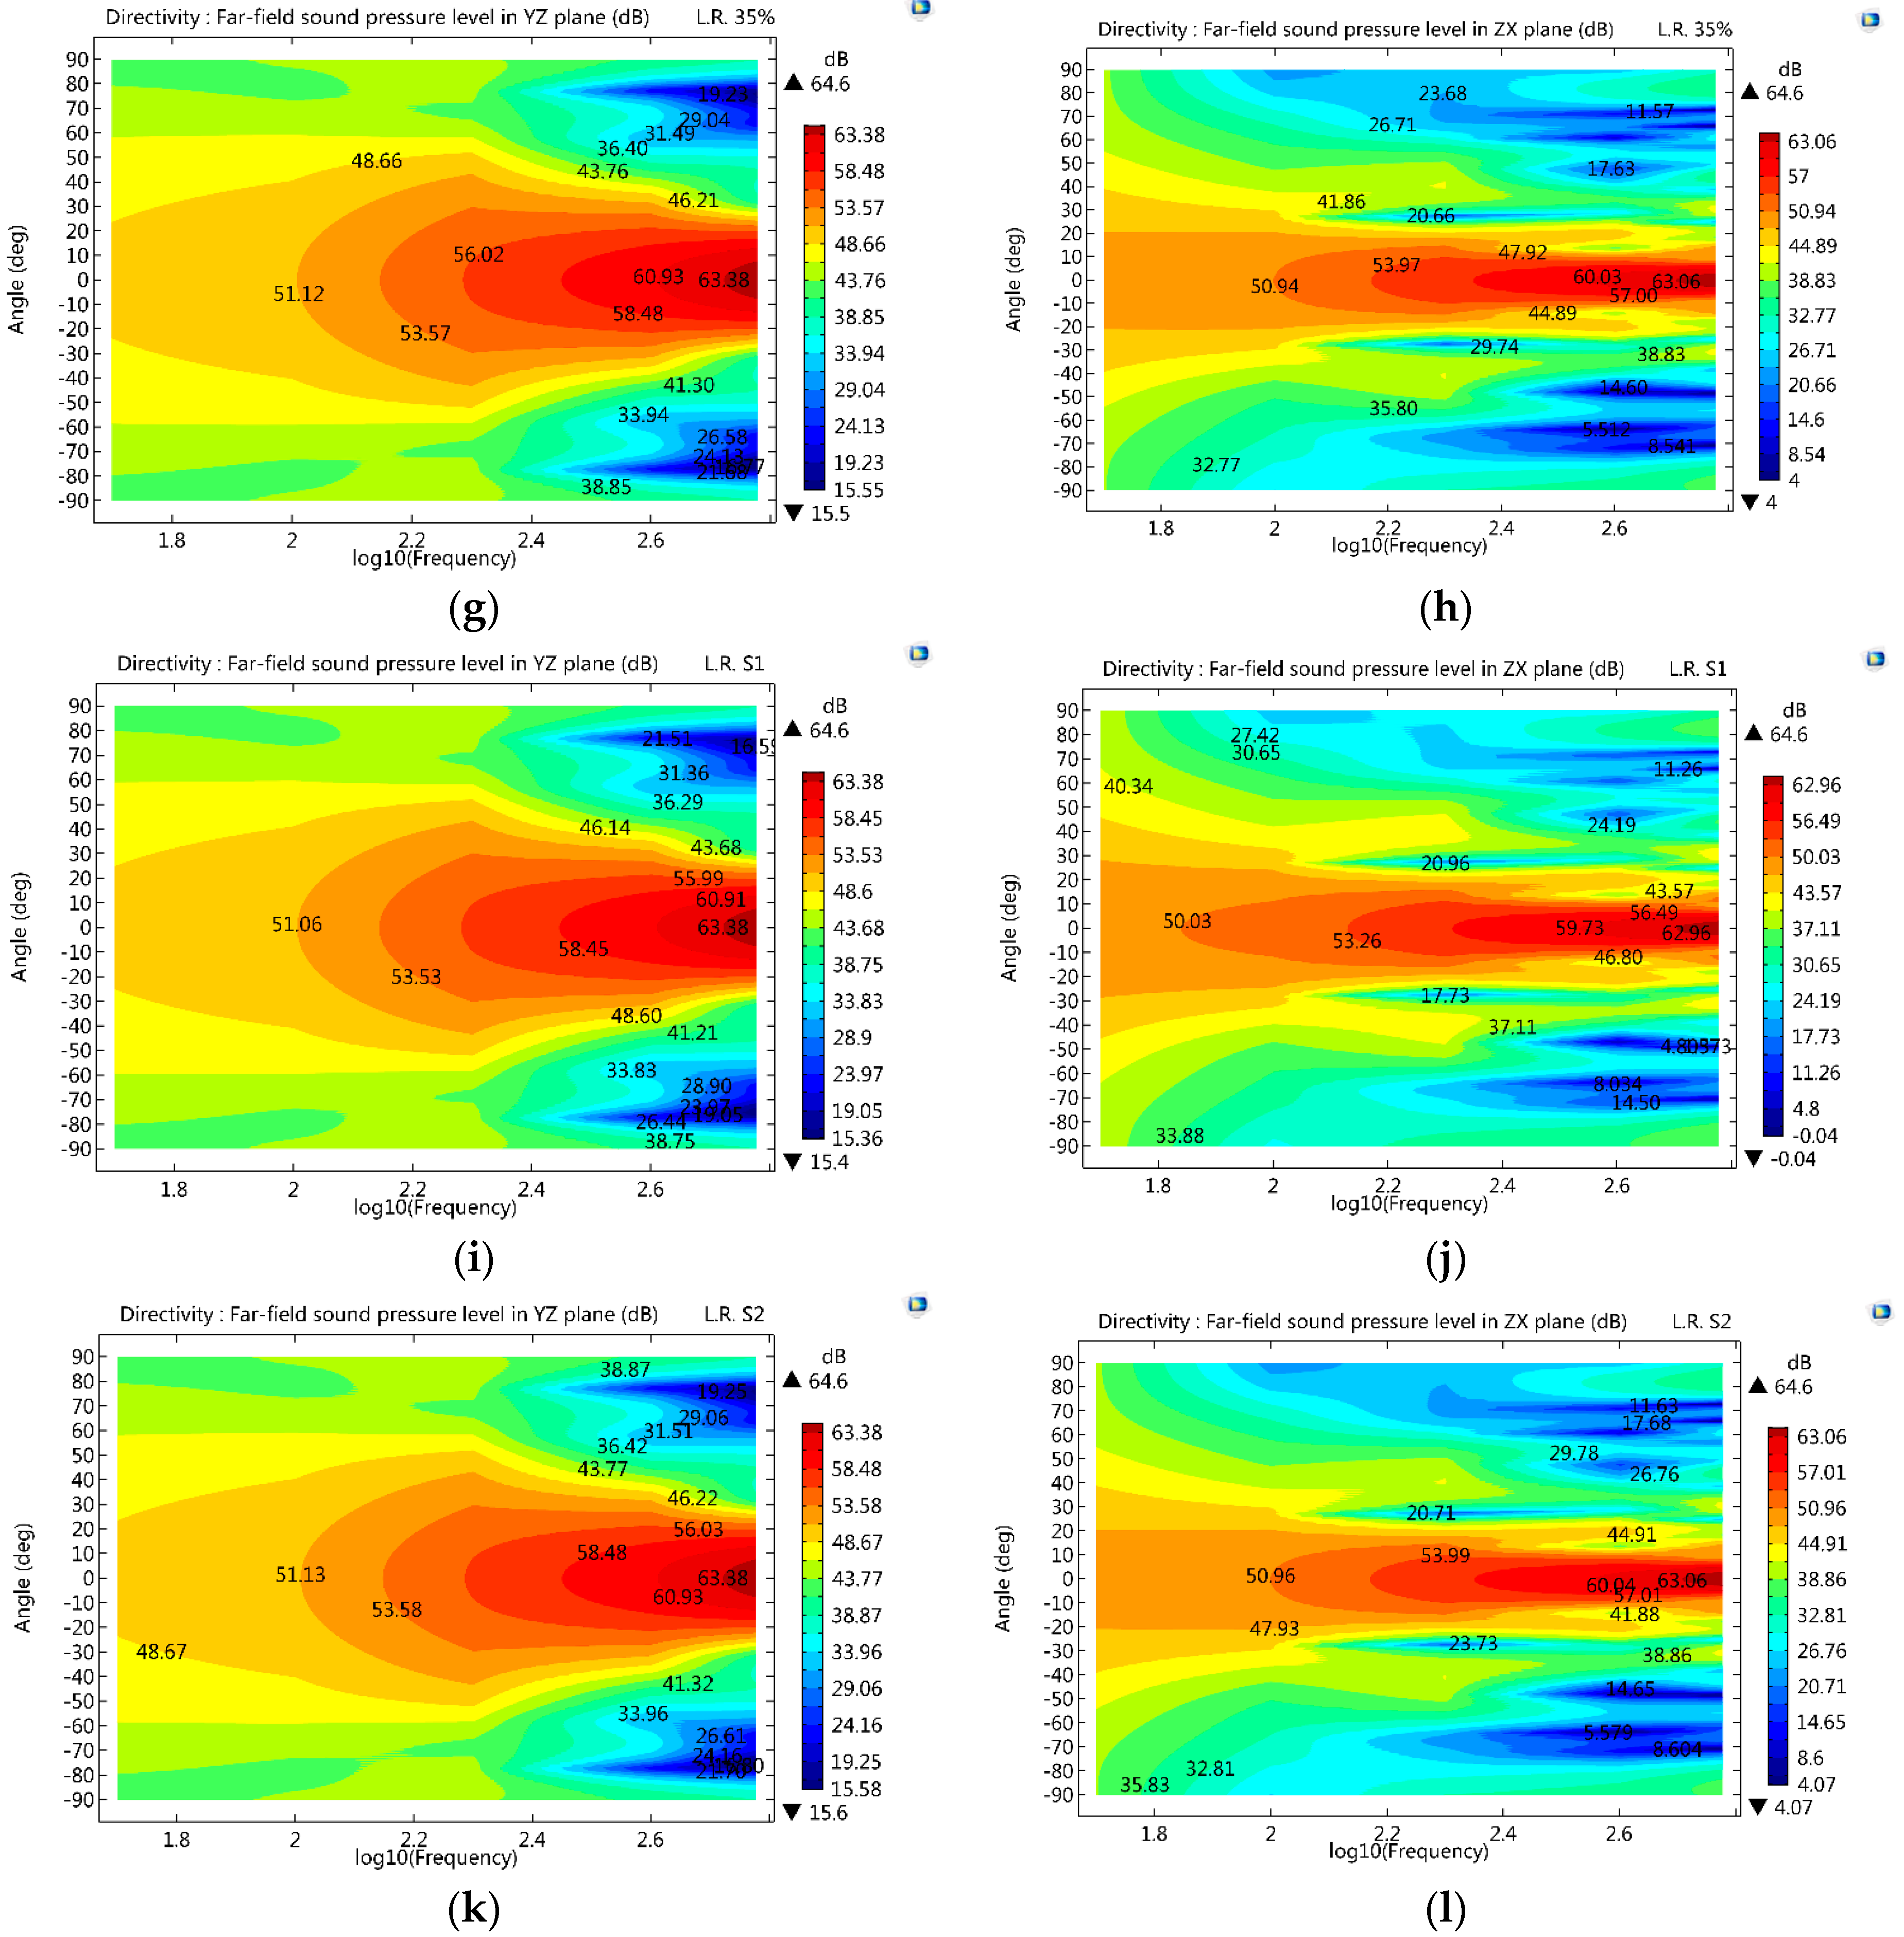
- The impact of changing load rate on the far-field sound pressure level in a particular series of vertical planes can be observed through the values of contours, while the discrepancy is not obvious. For example, in the five ZX planes directivity plots, when the angle is 0 degrees, the 100 Hz sound pressure levels from Situation (1) to Situation (5) respectively are 49.66 dB, 49.81 dB, 50.94 dB, 50.03 dB, and 47.93 dB, and the difference values are within 3.1 dB;
- With the increase of frequency, the sound pressure levels in adjacent areas of 0 degrees concurrently increased, and these adjacent areas in the YZ planes (±20 degree along the 0 degree axis) are larger than the adjacent areas in ZX planes (±20 degree along the 0 degree axis), while the sound pressure level in other regions decreased with the increasing of frequency;
- The directivity plots in YZ planes owns axial symmetry generally, but in ZX planes the directivity plots are asymmetrical, specifically, at the same frequency, the sound pressure level in the range from 60 degrees to 90 degrees is greater than the corresponding values in the range from −60 degrees to −90 degrees.
4.3. Discussion
5. Application
- The far-field sound pressure level in the regions beside two long sides of oil tank are greater than the sound pressure level in the regions beside two short side, especially at 100 Hz and 200 Hz as shown in Figure 8b,c, so for the new buildings being planned around the substation, the designer should bypass the regions adjacent to the two long sides, or use them only for commercial construction; while for the positioning selection of sound proof walls inside substation, regions beside two long sides would be preferred locations.
- In the region beside one short side of the oil tank which is closer to the core, the sound pressure level is higher than the sound pressure level at the opposite side at certain frequencies, so during the new building site selection in the power substation, this area should be excluded to reduce the reflective noise.
- As shown in Figure 8b–f, the sound pressure level above oil tank grows with the frequency increase while in the region around the tank side wall, the sound pressure level decreases with the frequency increase.
6. Conclusions
- Assuming the core clamp and windings clamps works well, the impact of changed power transformer load rate on the far-field sound pressure level exists, while the discrepancy is not obvious.
- In the horizontal region around the power transformer, the distribution of sound pressure level in the far-field is asymmetrical. To reduce the noise influence, urban planners should bypass the regions beside the two long sides of the oil tank, or at least prevent residential usage.
- For high-rise building design around the power substation, sound insulation design about high frequencies of noise for the upper part should be enhanced, while for the lower part, analogous designs aiming at low frequencies of noise should be strengthened.
Acknowledgments
Author Contributions
Conflicts of Interest
References
- Abramic, A.; Kotsev, A.; Cetl, V.; Kephalopoulos, S.; Paviotti, M. A Spatial Data Infrastructure for Environmental Noise Data in Europe. Int. J. Environ. Res. Public Health 2017, 14, 726. [Google Scholar] [CrossRef] [PubMed]
- Ehlert, K. Perceptions of public primary school teachers regarding noise-induced hearing loss in South Africa. S. Afr. J. Commun. Disord. 2017, 64, e1–e12. [Google Scholar] [CrossRef] [PubMed]
- International Organization for Standardization (ISO). Acoustics—Description, Measurement and Assessment of Environmental Noise; ISO 1996-1:2016; ISO: Geneva, Switzerland, 2016. [Google Scholar]
- Hsu, C.-H.; Lee, S.-L.; Lin, C.-C.; Liu, C.-S.; Chang, S.-Y.; Hsieh, M.-F.; Huang, Y.-M.; Fu, C.-M. Reduction of Vibration and Sound-Level for a Single-Phase Power Transformer With Large Capacity. IEEE Trans. Magn. 2015, 51, 1–4. [Google Scholar] [CrossRef]
- Girgis, R.; Bernesjo, M. Contributions to Differences between On-Site and Factory-Measured Noise Levels of Power Transformers. IEEE Trans. Power Deliv. 2015, 30, 82–88. [Google Scholar] [CrossRef]
- Mizokami, M.; Kurosaki, Y. Noise variation by compressive stress on the model core of power transformers. J. Magn. Magn. Mater. 2015, 381, 208–214. [Google Scholar] [CrossRef]
- Shilyashki, G.; Pfützner, H.; Hamberger, P.; Aigner, M.; Kenov, A.; Matkovic, I. Spatial distributions of magnetostriction, displacements and noise generation of model transformer cores. Int. J. Mech. Sci. 2016, 118, 188–194. [Google Scholar] [CrossRef]
- Zhu, L.; Yang, Q.; Yan, R.; Zhang, X.; Yang, Y. Research on Dynamic Vibration of Transformer with Wireless Power Transfer System Load. IEEE Trans. Magn. 2015, 51, 1–4. [Google Scholar] [CrossRef]
- Jin, M.; Pan, J. Vibration characteristics of a disk-type winding simulated by coupled concentric rings. Appl. Acoust. 2016, 101, 104–114. [Google Scholar] [CrossRef]
- Jin, M.; Pan, J. Vibration transmission from internal structures to the tank of an oil-filled power transformer. Appl. Acoust. 2016, 113, 1–6. [Google Scholar] [CrossRef]
- Jing, Z.; Hai, H.; Pan, J.; Yanni, Z. Identification of the nonlinear vibration system of power transformers. Meas. Sci. Technol. 2017, 28, 015005. [Google Scholar] [CrossRef]
- Liu, D.; Du, B.; Yan, M.; Wang, S. Suppressing Noise for an HTS Amorphous Metal Core Transformer by Using Microperforated Panel Absorber. IEEE Trans. Appl. Superconduct. 2016, 26, 1–5. [Google Scholar] [CrossRef]
- Zhao, W.; Chen, L.; Zheng, C.; Liu, C.; Chen, H. Design of absorbing material distribution for sound barrier using topology optimization. Struct. Multidiscip. Optim. 2017, 56, 315–329. [Google Scholar] [CrossRef]
- Sung, W.P.; Hu, S.; Chen, S.Y.; Zou, H.S.; Li, T.N.; Kao, J.C.M. Research on the application of active sound barriers for the transformer noise abatement. MATEC Web Conf. 2016, 44, 02059. [Google Scholar]
- Fan, R.; Su, Z.; Cheng, L. Modeling, analysis, and validation of an active T-shaped noise barrier. J. Acoust. Soc. Am. 2013, 134, 1990–2003. [Google Scholar] [CrossRef] [PubMed]
- Ertl, M.; Voss, S. The role of load harmonics in audible noise of electrical transformers. J. Sound Vib. 2014, 333, 2253–2270. [Google Scholar] [CrossRef]
- Tanaka, H.; Yamashita, D.; Member, S.; Niimura, T.; Member, S.; Yokoyama, R. Transformer Noise Level Optimization based on Reverse Calculation Problem and Linear Programming. In Proceedings of the 2008 IEEE Power and Energy Society General Meeting—Conversion and Delivery of Electrical Energy in the 21st Century, Pittsburgh, PA, USA, 20–24 July 2008; pp. 1–7. [Google Scholar]
- Girgis, R.S.; Garner, K.; Bernesjo, M.; Anger, J. Measuring no—Load and load noise of power transformers using the Sound Pressure and Sound Intensity methods—Part-I: Outdoors measurements. In Proceedings of the 2008 IEEE Power and Energy Society General Meeting—Conversion and Delivery of Electrical Energy 21st Century, Pittsburgh, PA, USA, 20–24 July 2008; pp. 1–8. [Google Scholar] [CrossRef]
- Alves, J.; Silva, L.; Remoaldo, P. The Influence of Low-Frequency Noise Pollution on the Quality of Life and Place in Sustainable Cities: A Case Study from Northern Portugal. Sustainability 2015, 7, 13920–13946. [Google Scholar] [CrossRef] [Green Version]
- Girgis, R.S.; Bernesjö, M.S.; Thomas, S.; Anger, J.; Chu, D.; Moore, H.R. Development of ultra-low-noise transformer technology. IEEE Trans. Power Deliv. 2011, 26, 228–234. [Google Scholar] [CrossRef]
- Moses, A.J.; Anderson, P.I.; Phophongviwat, T. Localized Surface Vibration and Acoustic Noise Emitted From Laboratory-Scale Transformer Cores Assembled From Grain-Oriented Electrical Steel. IEEE Trans. Magn. 2016, 52, 1–15. [Google Scholar] [CrossRef]
- Niu, W.; Li, N.; Chen, S.; Tang, S.; Hu, Y.; Cai, J.; Lv, L.; Jin, C.; Bai, Z.; Zhong, H. Experimental study of the evaporative cooling system in a low-noise power transformer. In Proceedings of the 2012 China International Conference on Electricity Distribution (CICED), Shanghai, China, 10–14 September 2012; Volume 8562, pp. 1–4. [Google Scholar]
- Galbrun, L. Space averaging of vibration level differences measured in lightweight building structures. Appl. Acoust. 2011, 72, 205–209. [Google Scholar] [CrossRef]
- He, Z.C.; Li, E.; Liu, G.R.; Li, G.Y.; Cheng, A.G. A mass-redistributed finite element method (MR-FEM) for acoustic problems using triangular mesh. J. Comput. Phys. 2016, 323, 149–170. [Google Scholar] [CrossRef]
- International Electrotechnical Commission (IEC). Power Transformers—Part 7: Loading Guide for Oil-Immersed Power Transformers; IEC 60076-7:2005; IEC: Genevacity, Switzerland.
- Teng, J.-H.; Liao, S.-H.; Leou, R.-C. Three-Phase Harmonic Analysis Method for Unbalanced Distribution Systems. Energies 2014, 7, 365–384. [Google Scholar] [CrossRef]
- Seo, H.-C. New Adaptive Reclosing Technique in Unbalanced Distribution System. Energies 2017, 10, 1004. [Google Scholar] [CrossRef]
- Biçen, Y.; Aras, F.; Kirkici, H. Lifetime Estimation and Monitoring of Power Transformer Considering Annual Load Factors. IEEE Dielectr. Electr. Insul. Soc. 2014, 21, 1360–1367. [Google Scholar] [CrossRef]
- Pérez, E.I.; Rada, J.B. Design and Costs Estimation of Electrical Substations Based on Three-Dimensional Building Blocks; Springer: Berlin/Heidelberg, Germany, 2010; pp. 574–583. [Google Scholar]
- Yucheng, X. Power Transformer Manual, 2nd ed.; China Machine Press: Beijing, China, 2014. [Google Scholar]

| Operation Parameter | Geometric Parameter (mm) | ||||
|---|---|---|---|---|---|
| Rated frequency | Core | Length | Height | Diameter | |
| 50 Hz | 2560 | 2310 | 500 | ||
| Rated capacity | Low-voltage winding | Inside diameter | Outside diameter | Height | Turns |
| 31,500 kVA | 560 | 688 | 1157 | 131 | |
| Rated voltage | High-voltage winding | Inside diameter | Outside diameter | Height | Turns |
| 110/10.5 kV | 762 | 902 | 1139 | 792 | |
| Short circuit impedance | Tank | Length | Width | Height | |
| 13.26% | 4100 | 1600 | 2470 | ||
| Measure Point | A1 | A2 | ||||
|---|---|---|---|---|---|---|
| Data Type | Max | Min | Mean in Time Frame | Max | Min | Mean in Time Frame |
| Calculated value ca (m/s2) | 4.282 | −3.996 | 1.427 | 3.862 | −3.776 | 1.486 |
| Measured value μa (m/s2) | 4.708 | −4.382 | 1.354 | 4.303 | −4.137 | 1.529 |
| Relative Error γa | 9.05% | 8.81% | 5.39% | 10.25% | 8.73% | 2.81% |
| Frequency (Hz) | 100 | 200 | 300 | 400 | 600 | |||||||
|---|---|---|---|---|---|---|---|---|---|---|---|---|
| Data Type | Cs | μs | Cs | μs | Cs | μs | Cs | μs | Cs | μs | Pae | |
| Measuring Point and Data (dB) | ① | 63.46 | 68.02 | 62.82 | 64.25 | 50.82 | 59.16 | 46.58 | 40.54 | 51.82 | 51.82 | 7.59% |
| ② | 62.12 | 69.06 | 53.27 | 64.62 | 49.58 | 50.08 | 43.00 | 40.54 | 46.56 | 49.06 | 7.96% | |
| ③ | 64.97 | 71.82 | 63.04 | 64.62 | 59.65 | 56.93 | 42.57 | 37.02 | 37.02 | 43.04 | 9.15% | |
| ④ | 64.37 | 71.50 | 62.06 | 68.26 | 51.50 | 47.90 | 45.06 | 40.54 | 44.97 | 49.06 | 9.21% | |
| Situation | Phase A | Phase B | Phase C |
|---|---|---|---|
| (1) L.R. 65% | 65% | 65% | 65% |
| (2) L.R. 95% | 95% | 95% | 95% |
| (3) L.R. 35% | 35% | 35% | 35% |
| (4) L.R. S1 | 65% | 95% | 65% |
| (5) L.R. S2 | 65% | 95% | 35% |
© 2018 by the authors. Licensee MDPI, Basel, Switzerland. This article is an open access article distributed under the terms and conditions of the Creative Commons Attribution (CC BY) license (http://creativecommons.org/licenses/by/4.0/).
Share and Cite
Ying, L.; Wang, D.; Wang, J.; Wang, G.; Wu, X.; Liu, J. Power Transformer Spatial Acoustic Radiation Characteristics Analysis under Multiple Operating Conditions. Energies 2018, 11, 74. https://doi.org/10.3390/en11010074
Ying L, Wang D, Wang J, Wang G, Wu X, Liu J. Power Transformer Spatial Acoustic Radiation Characteristics Analysis under Multiple Operating Conditions. Energies. 2018; 11(1):74. https://doi.org/10.3390/en11010074
Chicago/Turabian StyleYing, Liming, Donghui Wang, Jinwei Wang, Guodong Wang, Xiaowen Wu, and Jiangtao Liu. 2018. "Power Transformer Spatial Acoustic Radiation Characteristics Analysis under Multiple Operating Conditions" Energies 11, no. 1: 74. https://doi.org/10.3390/en11010074
APA StyleYing, L., Wang, D., Wang, J., Wang, G., Wu, X., & Liu, J. (2018). Power Transformer Spatial Acoustic Radiation Characteristics Analysis under Multiple Operating Conditions. Energies, 11(1), 74. https://doi.org/10.3390/en11010074


