Article

Application of Wind as a Renewable Energy Source for Passive Cooling through Windcatchers Integrated with Wing Walls

by
Payam Nejat
1,2,*,
Fatemeh Jomehzadeh
2,3,
Hasanen Mohammed Hussen
4,
John Kaiser Calautit
5 and
Muhd Zaimi Abd Majid
2
1
Advanced Building and Environment Research (ABER) Group, Johor Bahru 81300, Malaysia
2
School of Civil Engineering, Universiti Teknologi Malaysia (UTM), Johor Bahru 81300, Malaysia
3
School of Engineering, University of Tarbiat, Mashhad 510255, Iran
4
Faculty of Mechanical Engineering, University of Technology (UOT), Baghdad 35023, Iraq
5
Mark Group Research House, University Park, Nottingham NG7 2RD, UK
*
Author to whom correspondence should be addressed.
Energies 2018, 11(10), 2536; https://doi.org/10.3390/en11102536
Submission received: 16 July 2018 / Revised: 24 August 2018 / Accepted: 23 September 2018 / Published: 23 September 2018
(This article belongs to the Special Issue Building Energy Use: Modeling and Analysis)

Abstract

:
Generally, two-third of a building’s energy is consumed by heating, ventilation and air-conditioning systems. One green alternative for conventional air conditioner systems is the implementation of passive cooling. Wing walls and windcatchers are two prominent passive cooling techniques which use wind as a renewable resource for cooling. However, in low wind speed regions and climates, the utilization of natural ventilation systems is accompanied by serious uncertainties. The performance of ventilation systems can be potentially enhanced by integrating windcatchers with wing walls. Since previous studies have not considered this integration, in the first part of this research the effect of this integration on the ventilation performance was assessed and the optimum angle was revealed. However, there is still gap of this combination; thus, in the second part, the impact of wing wall length on the indoor air quality factors was evaluated. This research implemented a Computational Fluid Dynamics (CFD) method to address the gap. The CFD simulation was successfully validated with experimental data from wind tunnel tests related to the previous part. Ten different lengths from 10 cm to 100 cm were analyzed and it was found that the increase in wing wall length leads to a gradual reduction in ventilation performance. Hence, the length does not have a considerable influence on the indoor air quality factors. However, the best performance was seen in 10 cm, that could provide 0.8 m/s for supply air velocity, 790 L/s for air flow rate, 39.5 1/h for air change rate, 107 s for mean age of air and 92% for air change effectiveness.

1. Introduction

Buildings, which account for 40% of global energy consumption [1,2], play a significant role in increasing greenhouse gas emissions which are going to rise further due to urbanization and population growth [3]. Buildings consume energy in many parts; but more than two-thirds of this energy is used for heating, air conditioning (HVAC) and ventilation [4].
Furthermore, many studies have revealed the relation between air conditioning systems and problems relevant to indoor air quality (IAQ). Organic dusts can contribute to the growth of different fungi in fans which lead to contamination of condensate trays and cooling coils. As a result of dirty filters serious contamination problems may occur [5,6]. Hence, “Sick Building Syndrome” as well as metabolic diseases are more likely to occur [7,8]. Sick building syndrome symptoms are 30–200% more abundant in buildings that are air-conditioned than in those without air conditioners [9]. Long-term exposure to unfavorable IAQ may bring occupants detrimental consequences such as illnesses and poor performance [10]. As reported by the U.S. Environmental Protection Agency [9], one of the top five environmental health risks is indoor air pollution. The significance of retaining a good quality indoor environment comes from the fact that people spend approximately 80 to 90% of the time in indoor residential and work locations [11,12].
Natural ventilation (NV) systems, as a passive cooling strategy, are suitable alternatives for energy consumption reduction, and due to their capability to reduce the problems of common air conditioning systems, these systems have become alternatives for cooling and ventilation systems [13].
A recent study estimated natural ventilation can be used effectively in 1854 locations around the world by calculating the natural ventilation (NV) hours. Moreover, Building Energy Simulation (BES) shows the world’s 60 biggest cities have considerable potential for energy saving by natural ventilation [14].
In current decades cities have faced with a fast growth in population and urbanization, so it is critical to investigate potential ways for achieving considerable energy savings in the building sector by applying natural ventilation [15] which is a vital sustainable answer to reduce the energy use in buildings, while providing thermal comfort, and keeping the indoor environment healthy [16].
A windcatcher, a natural ventilation system, is one of the traditional elements mounted on buildings, which operates by exploiting renewable energy of wind, and as windcatchers lack moving parts, their noise and maintenance cost is minimum [17]. In the Middle East, the utilization of windcatchers dates back to thousands of years ago (Figure 1) [18,19]. Archaeological investigations have revealed evidence of windcatcher use near the historical site of Tappeh Chackmaq (Shahrood, Iran) which dates to 4000 BC [20]. The application of modern windcatchers specifically in populous indoor environments including schools or workplaces such as office buildings is now widely prevalent [21]. The UK is one of the countries benefitting from the installation of more than 7000 windcatchers in recent years [22].
Apart from the windcatcher, wing walls are another design solution to lead the outdoor air flow toward internal space of the building by projecting portions of the walls perpendicularly from the openings [23]. What causes the flow of ambient wind into and out of the room is the wind pressure difference between the wing walls’ windward and leeward surfaces [24]. Therefore, it has been proposed that employing a wing wall can contribute to ventilation enhancement [25]. A light pressure gradient generated along a wall due to oblique wind blow to a wall is exploitable when the windward side is equipped with two lateral openings. Accordingly, the airflow is pushed inside by positive pressure and negative pressure induces it to exit contributing to generation of an artificial air movement within the building [26,27].
Although windcatchers have considerable advantages, their application in regions with low speed wind has been less beneficial [28]. As a result, the focus of previous studies was generally on windcatchers employed in regions where the wind speed is medium to high (3 to 5 m/s). Thus, in low wind speed conditions such as dense urban environments, implementation of windcatchers is not efficient and studies on windcatchers are quite limited.
However, wing walls are especially operative on sites where outdoor wind velocity is low and wind directions are variable [29] because the wing walls amplify the pressure difference through the openings that improves air exchange [30]. Thus, the current study proposes that when a windcatcher is integrated with a wing wall, the natural ventilation rate should improve under low wind speed conditions.
In our previous research [31] it was found that the integration of a two sided windcatcher with a wing wall (TWIW) can improve the ventilation performance of the windcatcher under low wind speed conditions and different wing wall angles (5° to 70°) were examined. It was revealed that wing walls in the range of 15° to 30° had the most positive effect on the ventilation parameters. Building on previous works, this paper aims to study the effect of the length of wing wall on the ventilation performance of windcatchers. In addition, the work will assess several ventilation parameters to better understand the indoor airflow characteristics including the mean age of air (MAA), air change rate and air change effectiveness (ACE) (it should be noted that only selected parameters which influence air quality were analyzed in this paper).

2. Literature Review

In this section, previous studies which investigated the windcatcher and wing wall are presented briefly. It should be noted that there are no studies which have considered the effect of a combination of windcatcher and wing wall.
In a study conducted by Afshin et al. [32], a two-sided windcatcher underwent wind tunnel experimental in several wind angles ranging from 0° to 90° to assess its ventilation performance. The model was a typical two-sided windcatcher in the city of Yazd (Iran) with the scale reduced to 1:50. The investigation revealed that for all wind speeds, 55° and 39° are the wind angles at which the transition angles of windward opening and house window occurred, respectively. Accordingly, it was inferred that chimney-like performance of windcatcher occurs when wind angle exceeds the windward transition angle (α = 55°) and as the wind was perpendicular to the opening of windcatcher, the ventilation rate was maximum.
Ghadiri et al. [33] investigated the wind-induced cross ventilation in a building with a two-sided windcatcher and an openable window at different wind directions (0°–90°) with 15 degree intervals in a wind tunnel at 10 to 20 m/s wind speed. The effect of several computational parameters such as the turbulence model, the size of domain and resolution of the grid was also explored. The CFD results were validated against published experimental data. It was discovered that the airflow rate was decreased on the leeward side of the windcatcher and through the window opening.
Another study by Montazeri et al. [34] aimed to investigate the performance of a two-sided windcatcher utilizing a reduced-scale model (1:40). The measurement of volumetric airflow and the pressure coefficient of all surfaces of the model for different air incident angles was carried out in an open-circuit wind tunnel. In addition, numerical and analytical CFD models for the experimental setup was developed for the accuracy validation and favorable agreement among the results was observed. The study demonstrated that short-circuiting is revealed in the windcatcher when the incidence angle of the wind is high and when this angle is 60, short-circuiting is maximum. Moreover, it was established that two-sided windcatchers are capable of amending the natural ventilation in buildings. The comparison of one-sided and two-sided windcatchers suggested the suitability of employing one-sided windcatchers where a prevailing wind direction exists.
Chandra et al. [35] studied the wing walls performance in a full-scale experimental building as well as in models at the Florida Solar Energy Center. They evaluated two vertical walls situated nearby windows. The air flow rate inside a room equipped with wing walls and without them was measured. It was figured out that wing walls could generate zones of positive and negative pressure at the room openings when the angle at which wind blows to the walls is different from the normal condition. It was concluded from this study that wing walls are effective elements capable of providing ventilation for rooms.
Mak et al. [36] did a numerical investigation of wing wall ventilation performance under different wing wall sizes, wind velocities and wind directions. The result indicated that the wind angle between 40° to 70° is the ideal angle at which a wing wall performs best. The study also demonstrated that larger wing wall (1.5 m) or higher wind velocity (5 m/s) can lead to generation of greater pressure differences between two window openings, higher average air velocity inside the room, and a higher ventilation flow rate. It was also concluded that the performance of wing walls is satisfactory only in single-sided ventilation. In cross-ventilation, natural ventilation might be negatively affected due to the function of the wing wall rather than performing well.
Integration of a wing wall with a balcony was investigated by Mozaffari [37] which included twenty distinct configurations divided into five classes of Malaysian medium-rise residential buildings. What she studied was the air flow rate in regard to the position, size and wind wall angle in the balcony in 0° and 45°. It was found in the study that the indoor air velocity can be boosted up to three times with a middle positioned-wing wall in comparison with a typical balcony configuration. Furthermore, she figured out that the maximum ventilation performance occurred in the wind angle of 45°.
From the review of the literature, it can be concluded that some studies have paid attention to windcatchers and wing walls separately; however, none of them have studied the effect of windcatcher integration with wing walls. Thus, current study represents an opportunity to investigate this research gap.

3. Materials and Methods

This research employed Computational Fluid Dynamics (CFD) modelling which is established to be reliable in terms of evaluating the ventilation and thermal performance of windcatchers [38].
As shown in Figure 2, the model was composed of a rectangular cuboid with 6 m length, 4 m width and 3 m height which represents a small room. The windcatcher was comprised of two channels separated by an internal partition wall. The windcatcher height was 1.5 m. The size of openings and cross-sections of windcatcher were 1 m by 1 m. The height and size of opening was based on typical windcatcher size as described in [39,40]. The research consisted of two main phases including validation with experimental data and CFD study of windcatcher which are discussed in detail in the following sub-sections.

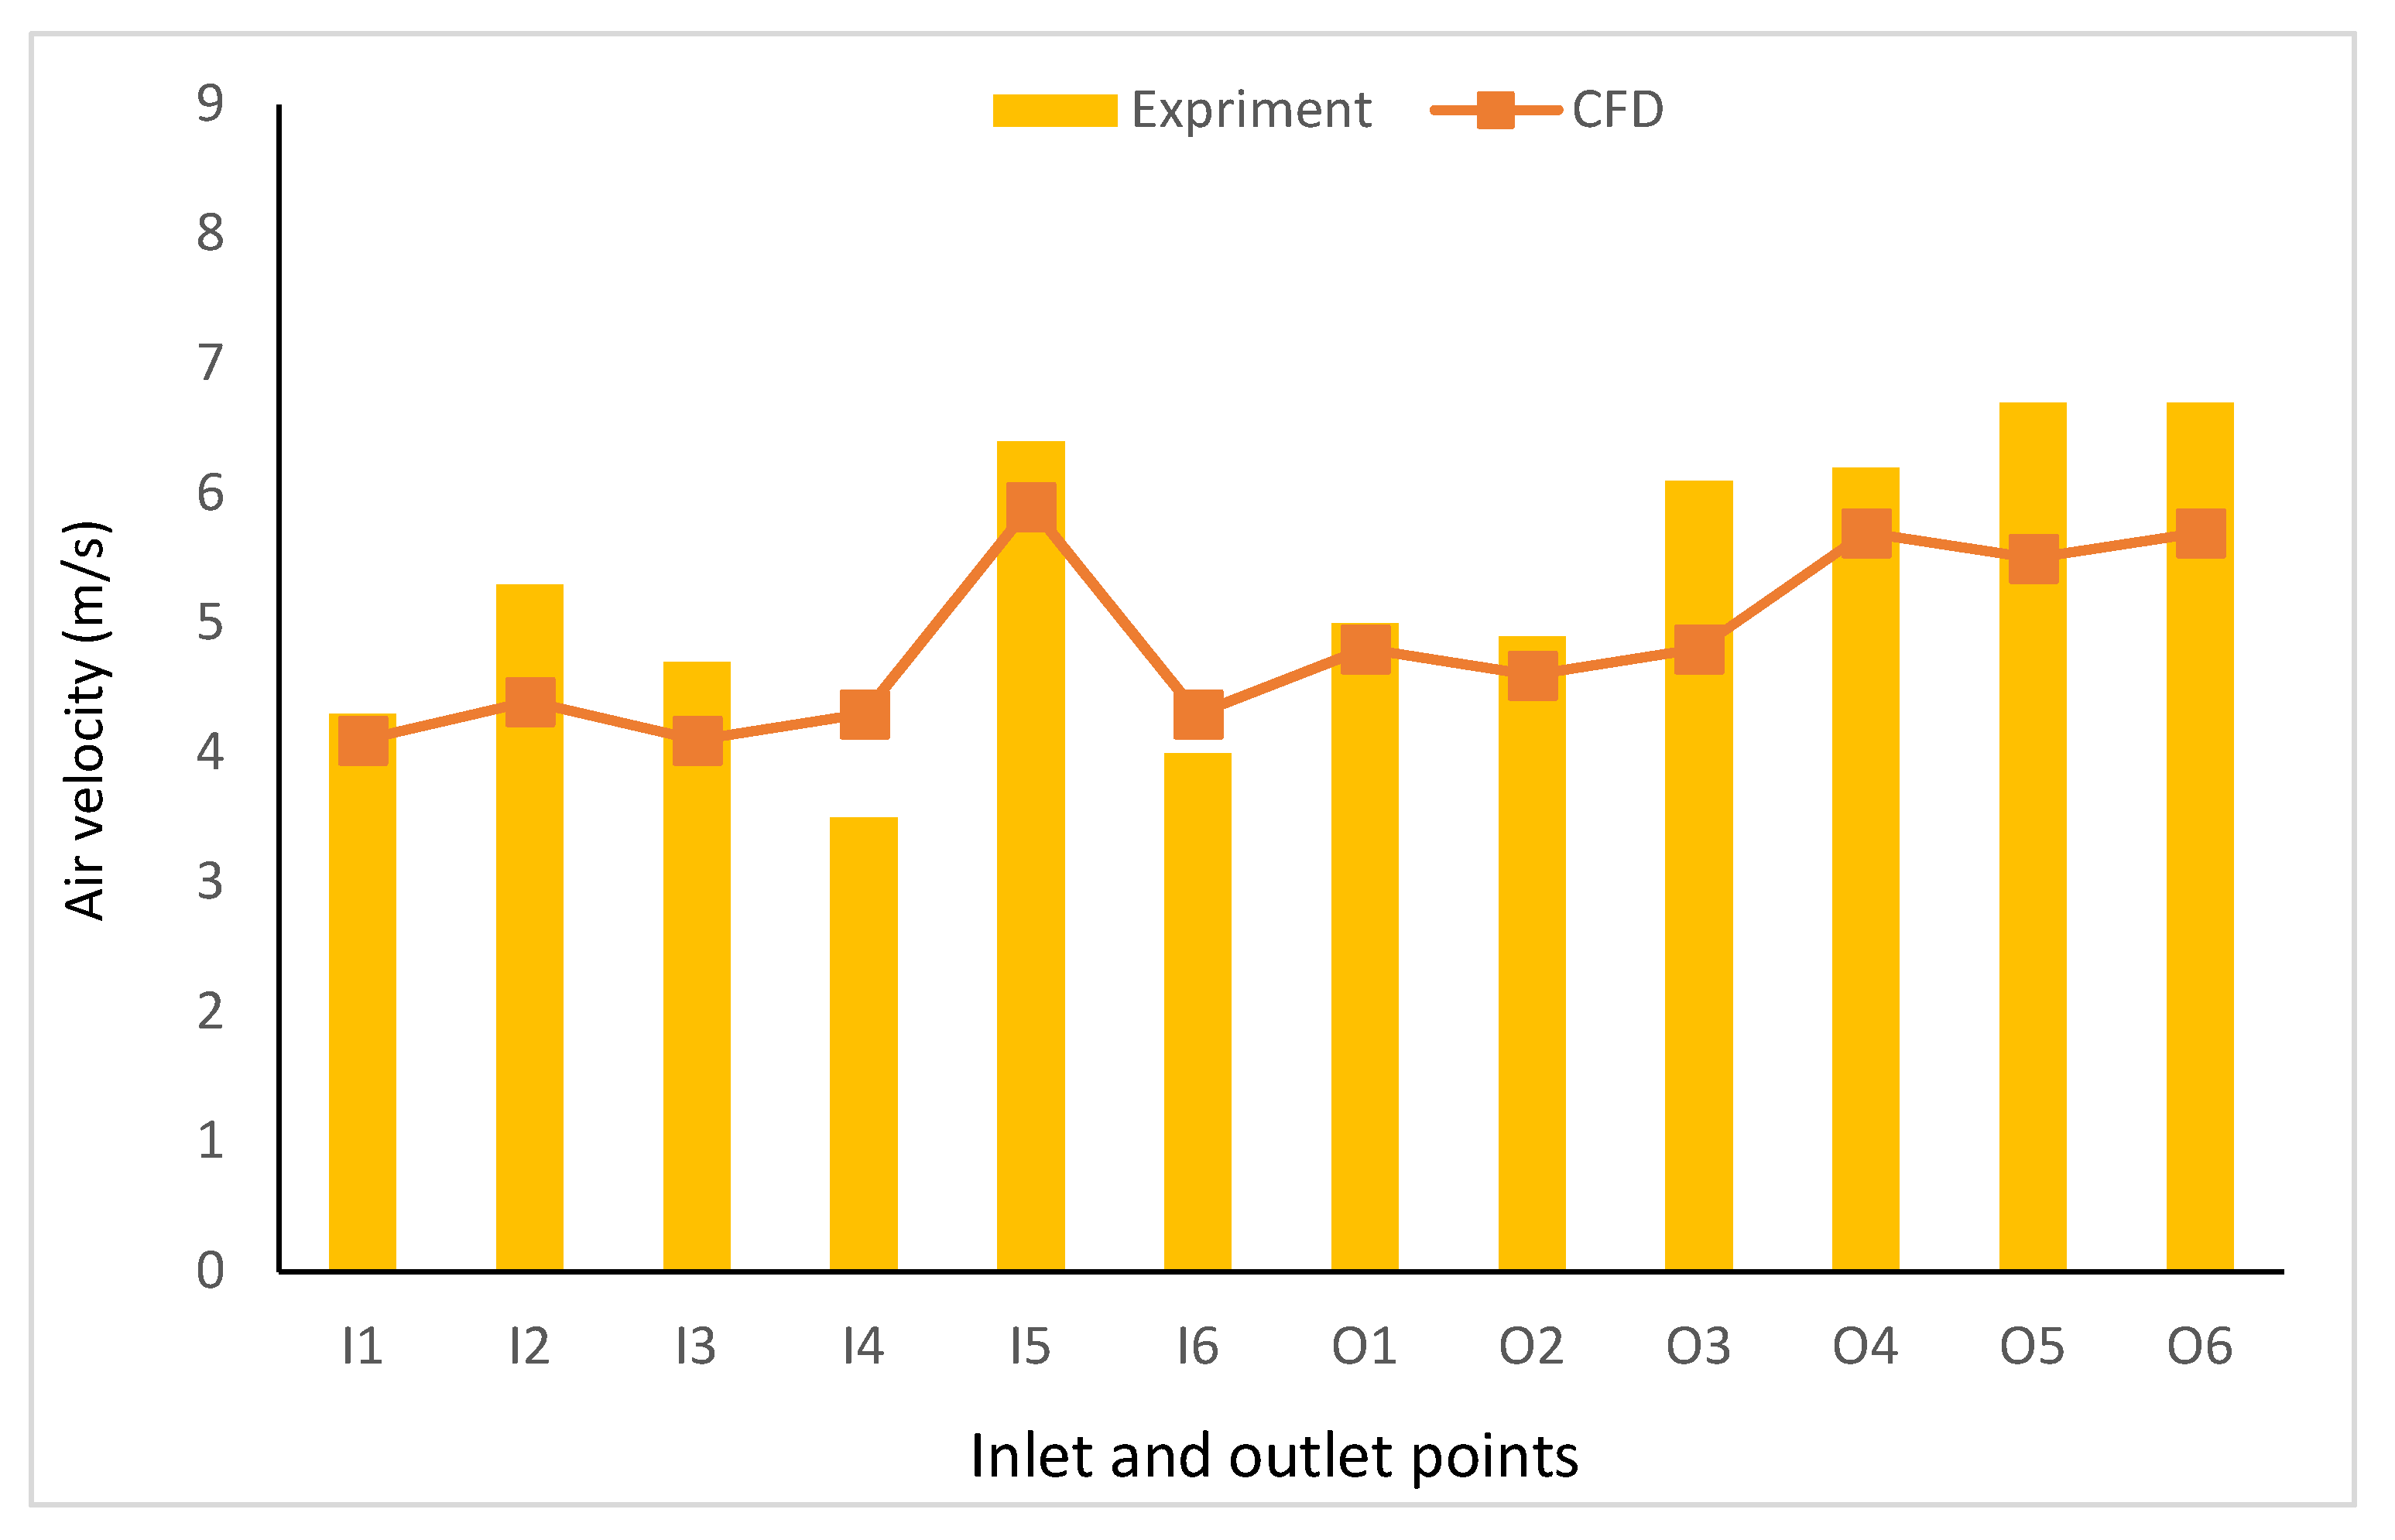
3.1. Validation with Experimental Data

For the first phase, validation of numerical method was conducted by making comparison between the obtained results and experimental wind tunnel testing data of reference [31]. The test was carried out in the wind tunnel of University Technology Malaysia. Figure 3 illustrates the 1:10 scaled model used in the wind tunnel investigation. This research was based on Malaysian climate conditions where the average wind speed is 2.5 m/s. Thus, the wind speed in wind tunnel was set to 25 m/s to attain the Reynolds number similarity regarding the model scale of 1:10. Nevertheless, the wind speed was adjusted to 10 m/s in consideration of safety and the strength of models. The details of the experiment can be found in [31].

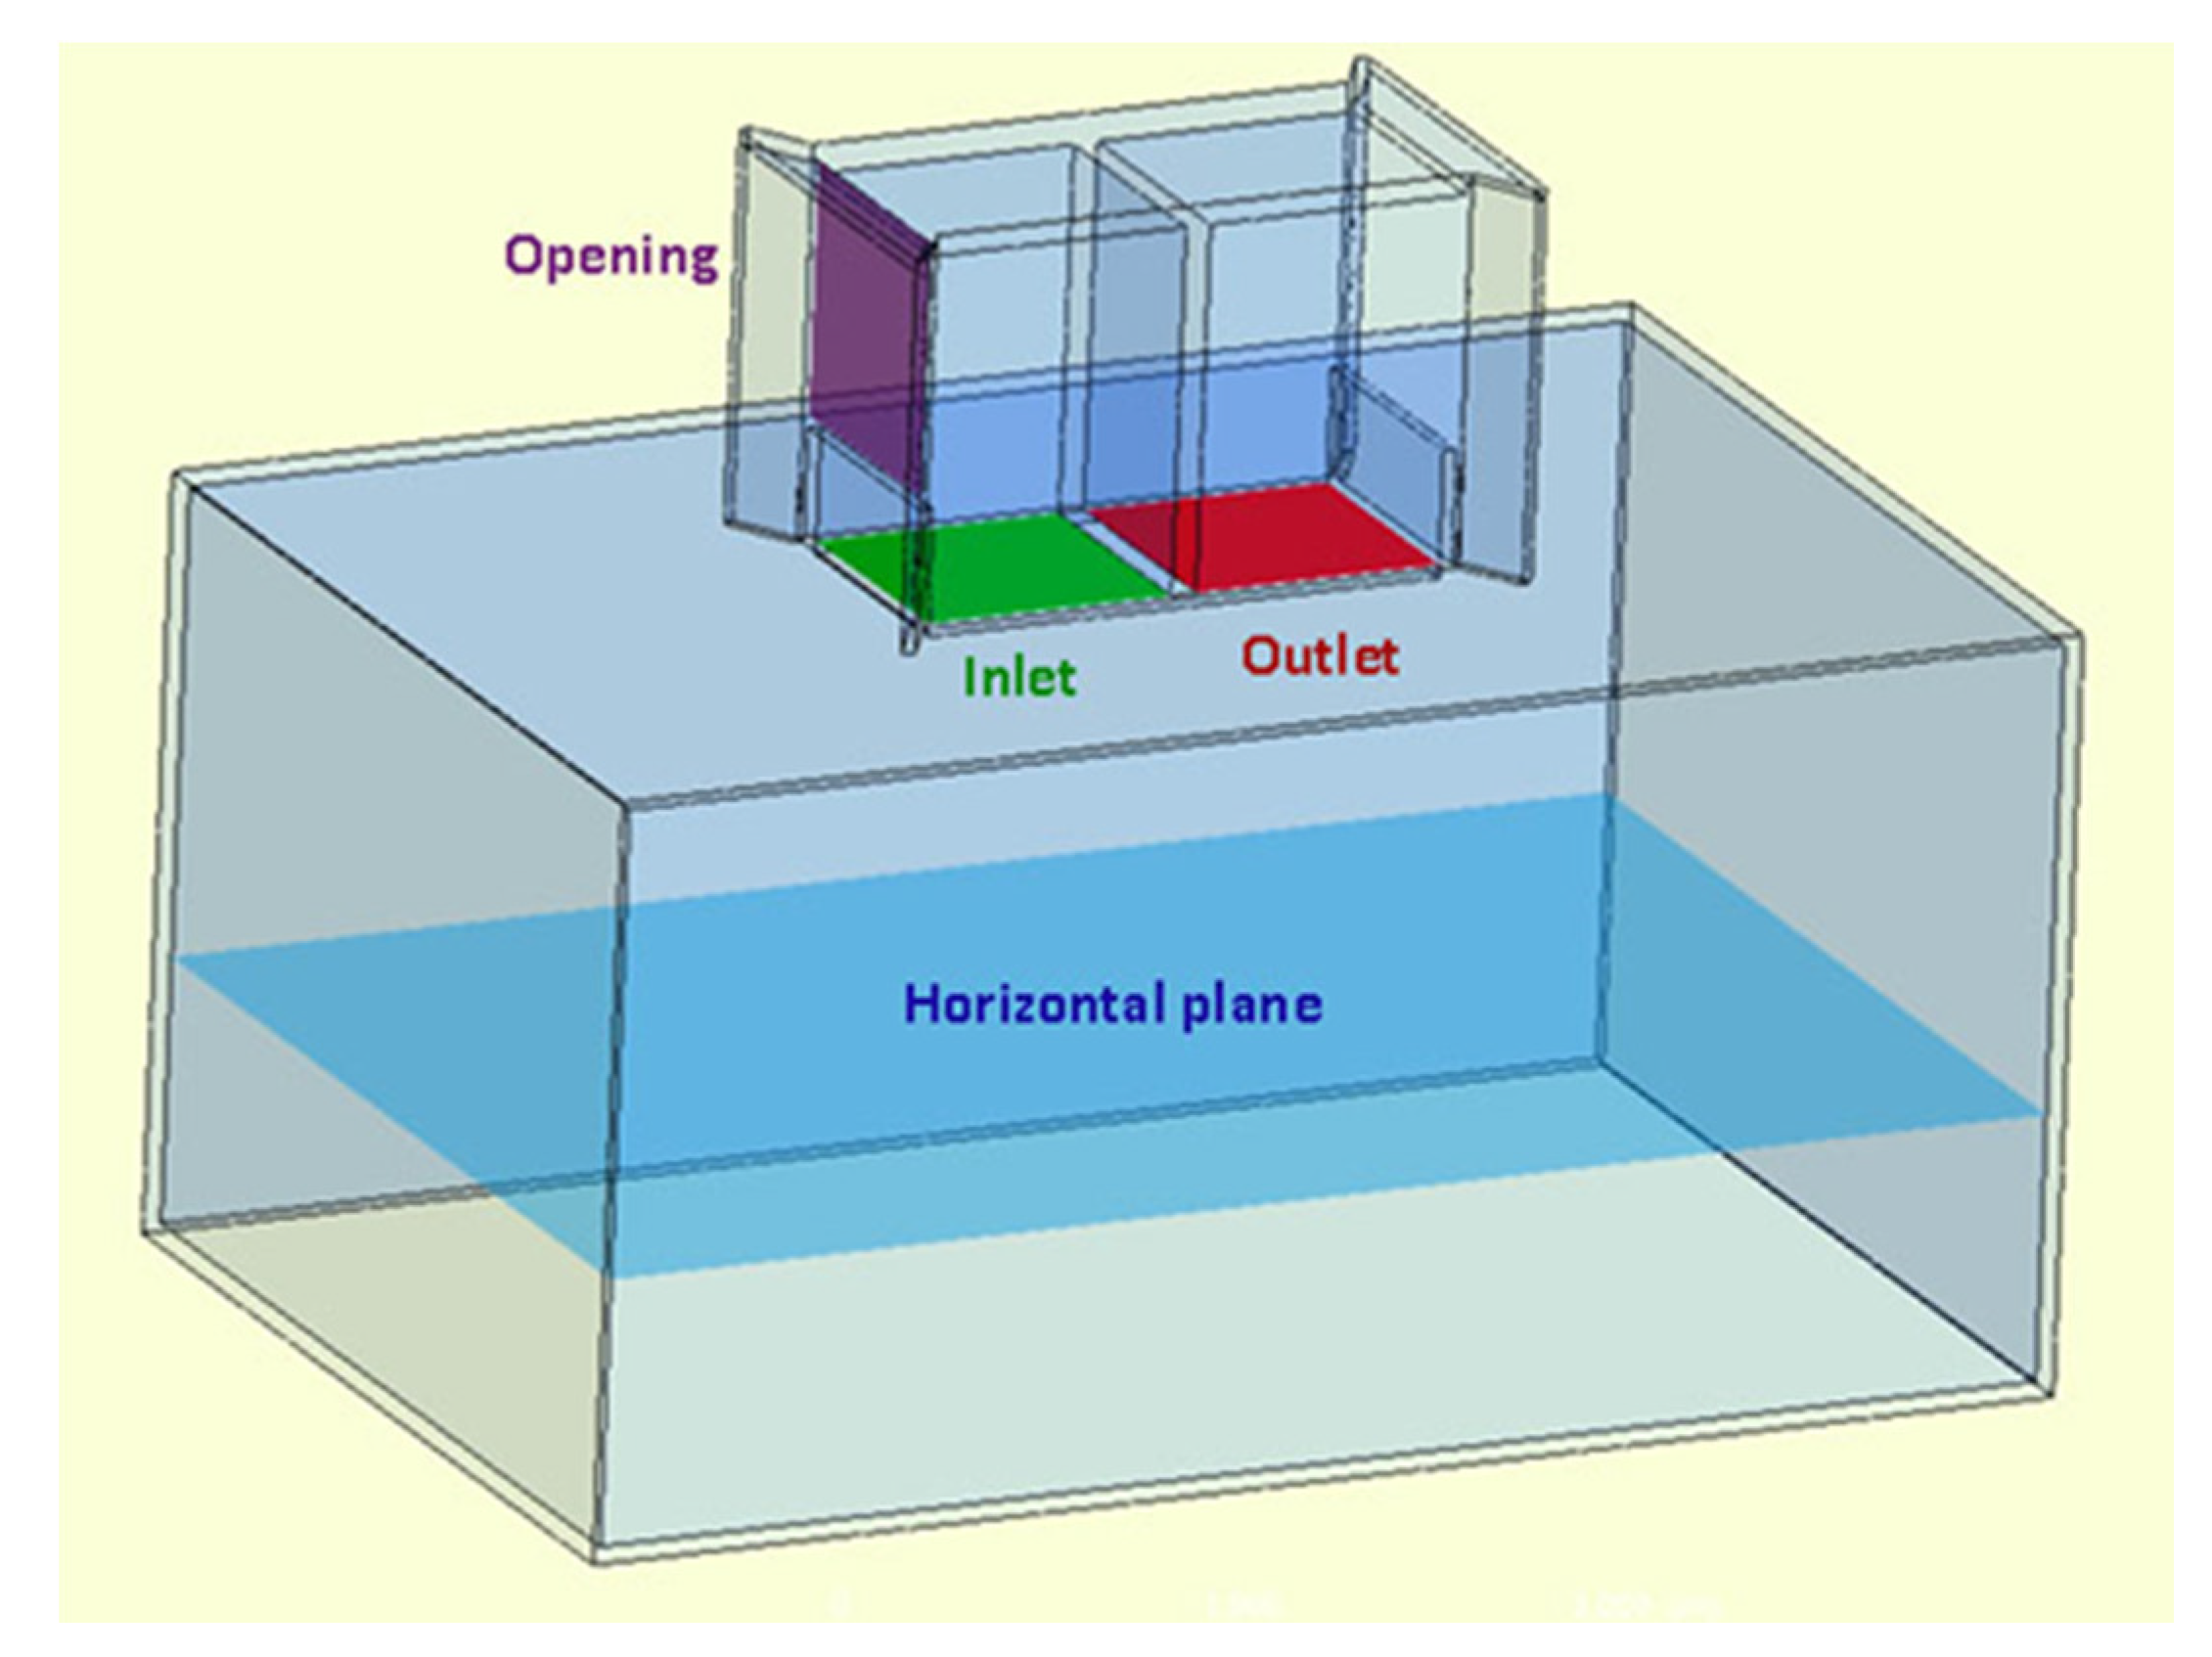
3.2. CFD Study of Windcatcher Performance

In the second phase, the windcatcher performance was investigated in low wind speed conditions with regard to supply rates, airflow distribution and other IAQ factors. The flow equations were solved by employing the CFD code ANYSS FLUENT applied to steady Reynolds-Averaged Navier-Stokes (RANS) and three-dimensional computations. The methods used in the computational model included the control volume method together with the Semi-Implicit Method for Pressure-Linked Equations (SIMPLE) velocity-pressure coupling algorithm with the second order upwind discretization. All simulations were done in steady state with an isothermal state (only wind-driven was considered as the main force for ventilation). The governing equations are presented below:
  ρ t + × ( ρ u ) = 0  
where ρ is density, t is time and u refers to fluid velocity vector.
Momentum conservation:
( ρ u ) t + × ( ρ u u ) =   p + ρ g + × ( μ u ) × τ t  
where p presents the pressure; g, vector of gravitational acceleration; μ , molecular dynamic viscosity; and τ t , the divergence of the turbulence stresses that explains auxiliary stresses as a result of velocity fluctuations.
Turbulence kinetic energy (K):
( ρ K ) t + × ( ρ K u ) =   × [ α k μ e f f   K ] +   G K +   G b     ρ ε  
Energy dissipation rate (ε):
  ( ρ ε ) t + × ( ρ ε u ) =   × [ α ε μ e f f   ε ] +   C 1 ε ε K ( G k +   C 3 ε G b   )   C 2 ε ρ ε 2 K  
where Gk indicates source of turbulent kinetic energy ascribed to average velocity gradient; Gb, source of turbulent kinetic energy caused by buoyancy force; α k and α ε , turbulent Prandtls numbers; and C, C and C represent empirical model constants.
The COST 732 guideline [41] for studies of environmental wind flow was the instruction upon which the position and size of the computational domain in the current study was based. The COST 732 recommended that the domain lateral extension (the distance between the computational domain lateral boundaries and building sidewalls) for a building with height of H should be 5H (Figure 4). For the inlet, the boundary has to extend 5H in flow direction as well, whilst for the outlet, extension of the domain behind the building should be 15H to provide the flow with a condition to re-develop in back of the wake region, since fully developed flow is commonly presumed as the boundary condition in steady RANS calculations. The vertical extension ranging from 4H to 10H with consideration of the blockage effect is proposed by COST 732 [41], hence 5H was selected to minimize the blockage effect.

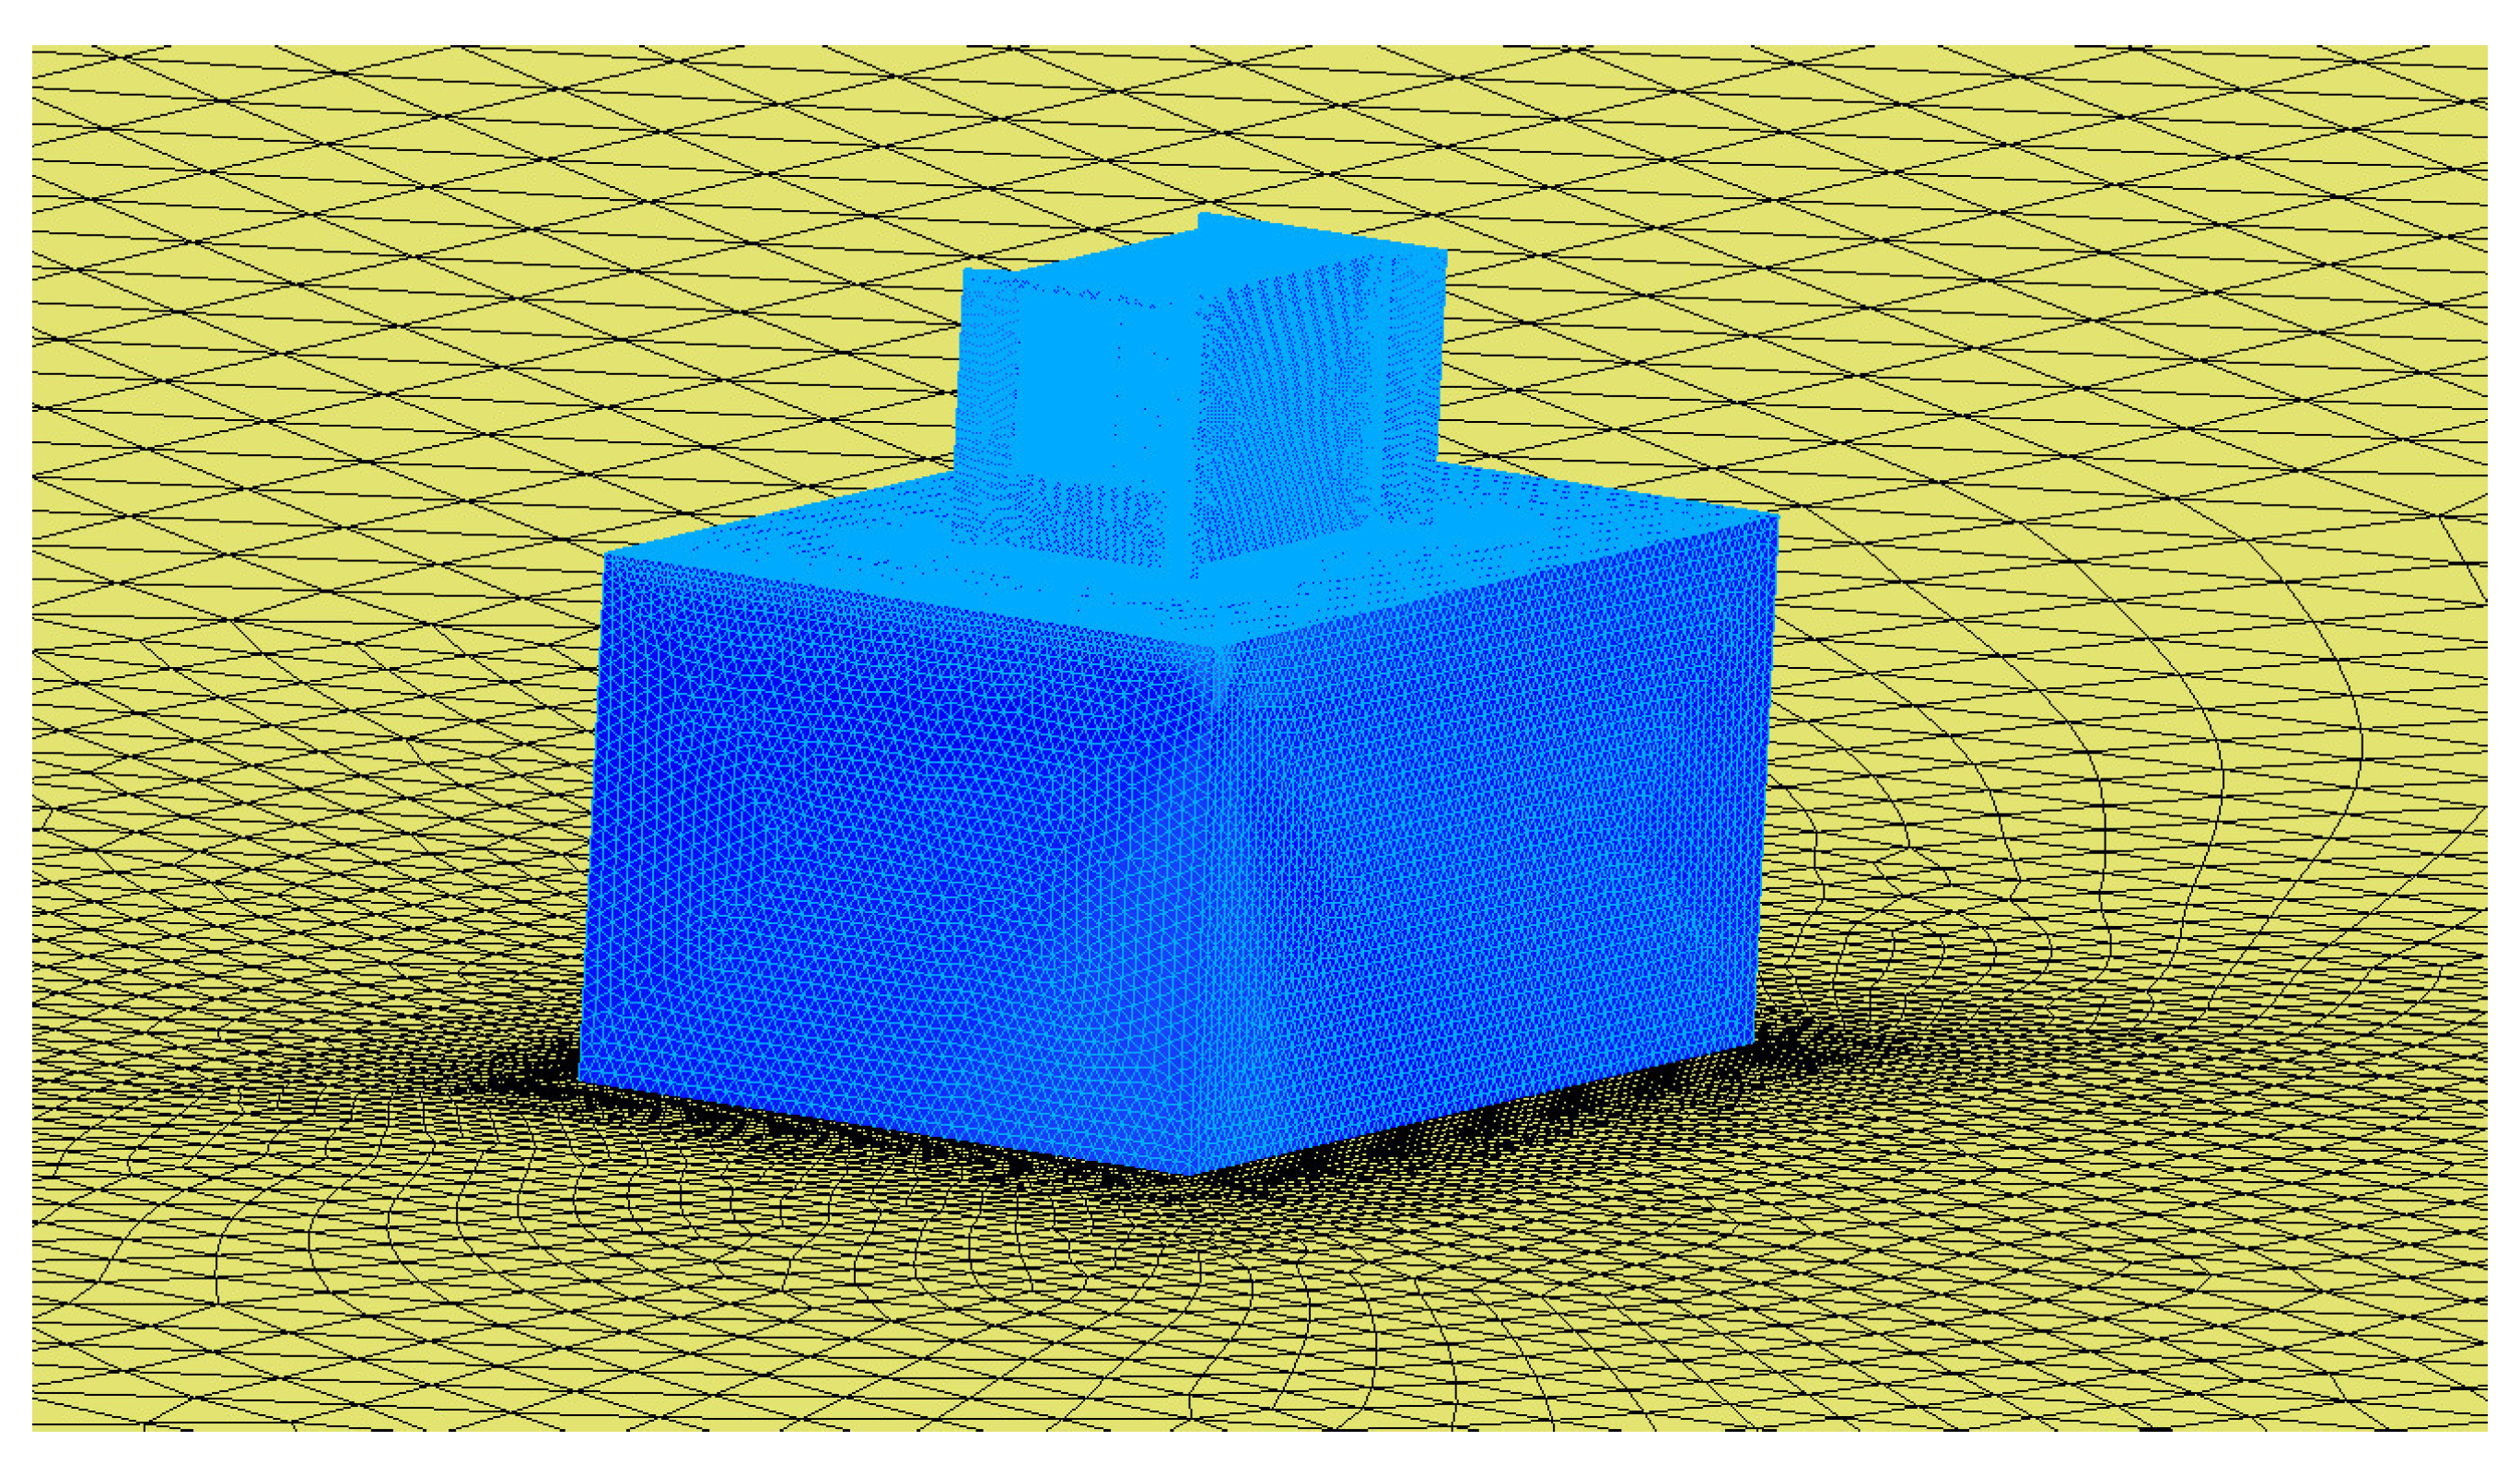
3.2.1. Mesh Generation

The production of the computational grid was carried out by utilizing the Gambit 2.4.6 software (Canonsburg, PA, USA) and then exported to ANSYS FLUENT (16, ANSYS, Canonsburg, PA, USA) for simulation. Since the geometry shape was complex, a non-uniform mesh was applied for the computational volumes (Figure 5). The meshed model consisted of 6.5 million elements and 1.5 million nodes. To ensure the accurate capture of the flow field in the simulations, the mesh refinement around the windcatcher and openings was done. Flux balance and grid sensitivity analysis are the methods on which the mesh was based and will be described in Section 4.1.1.

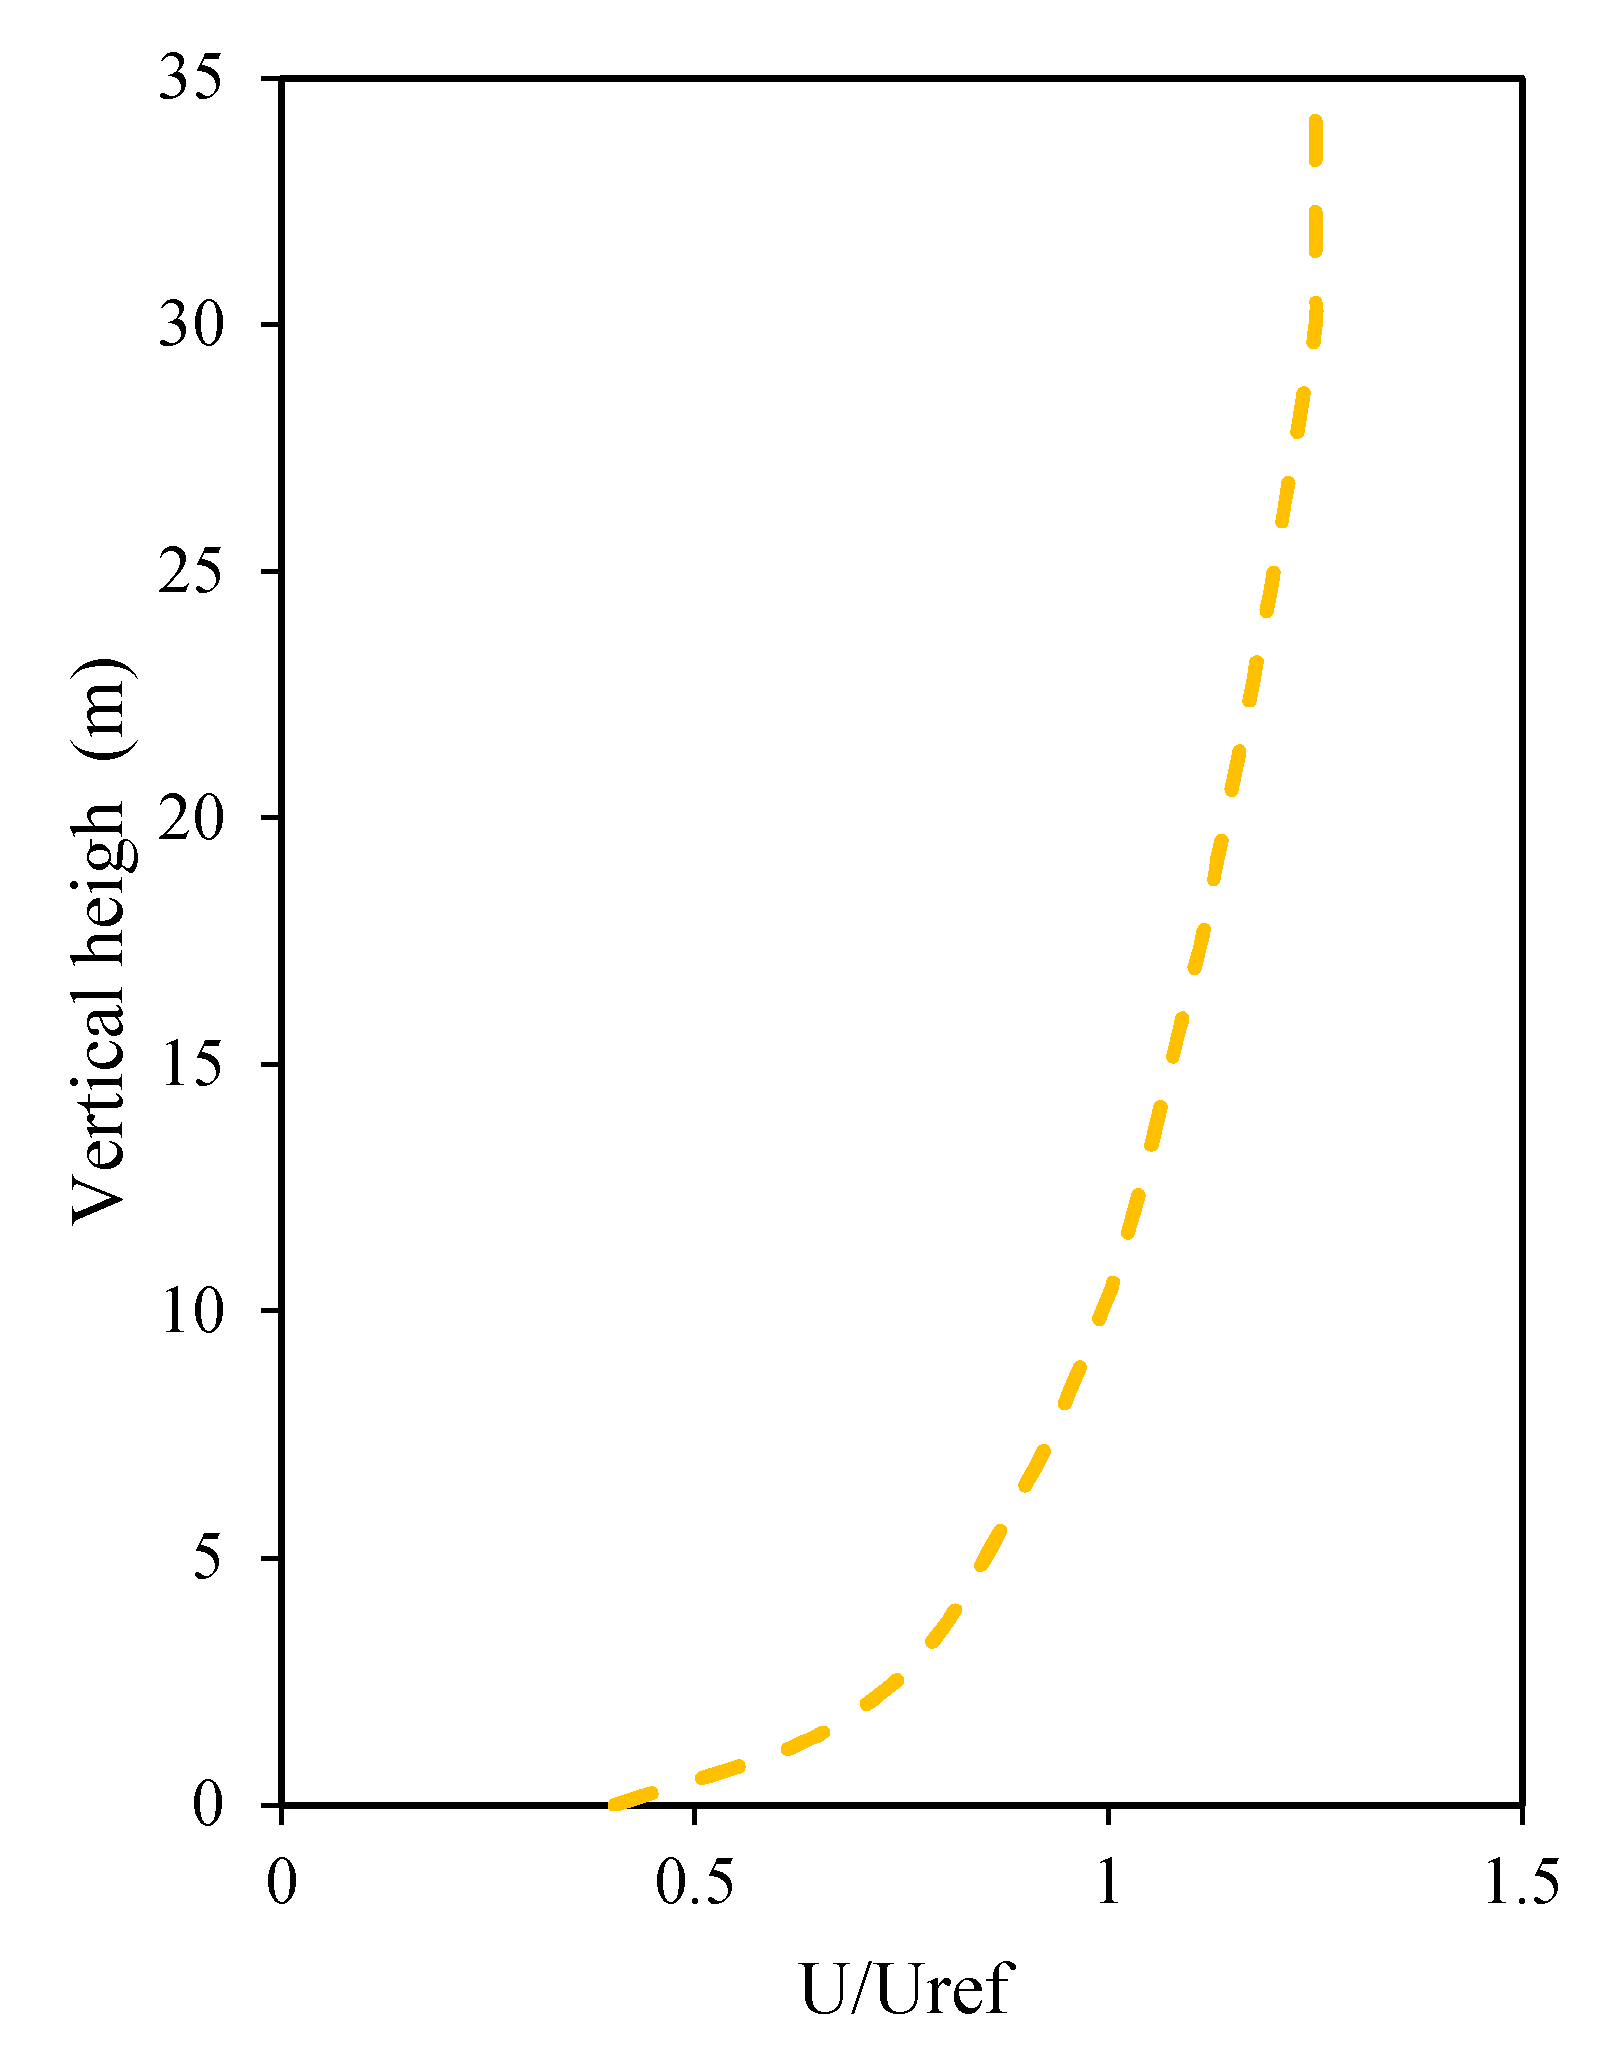
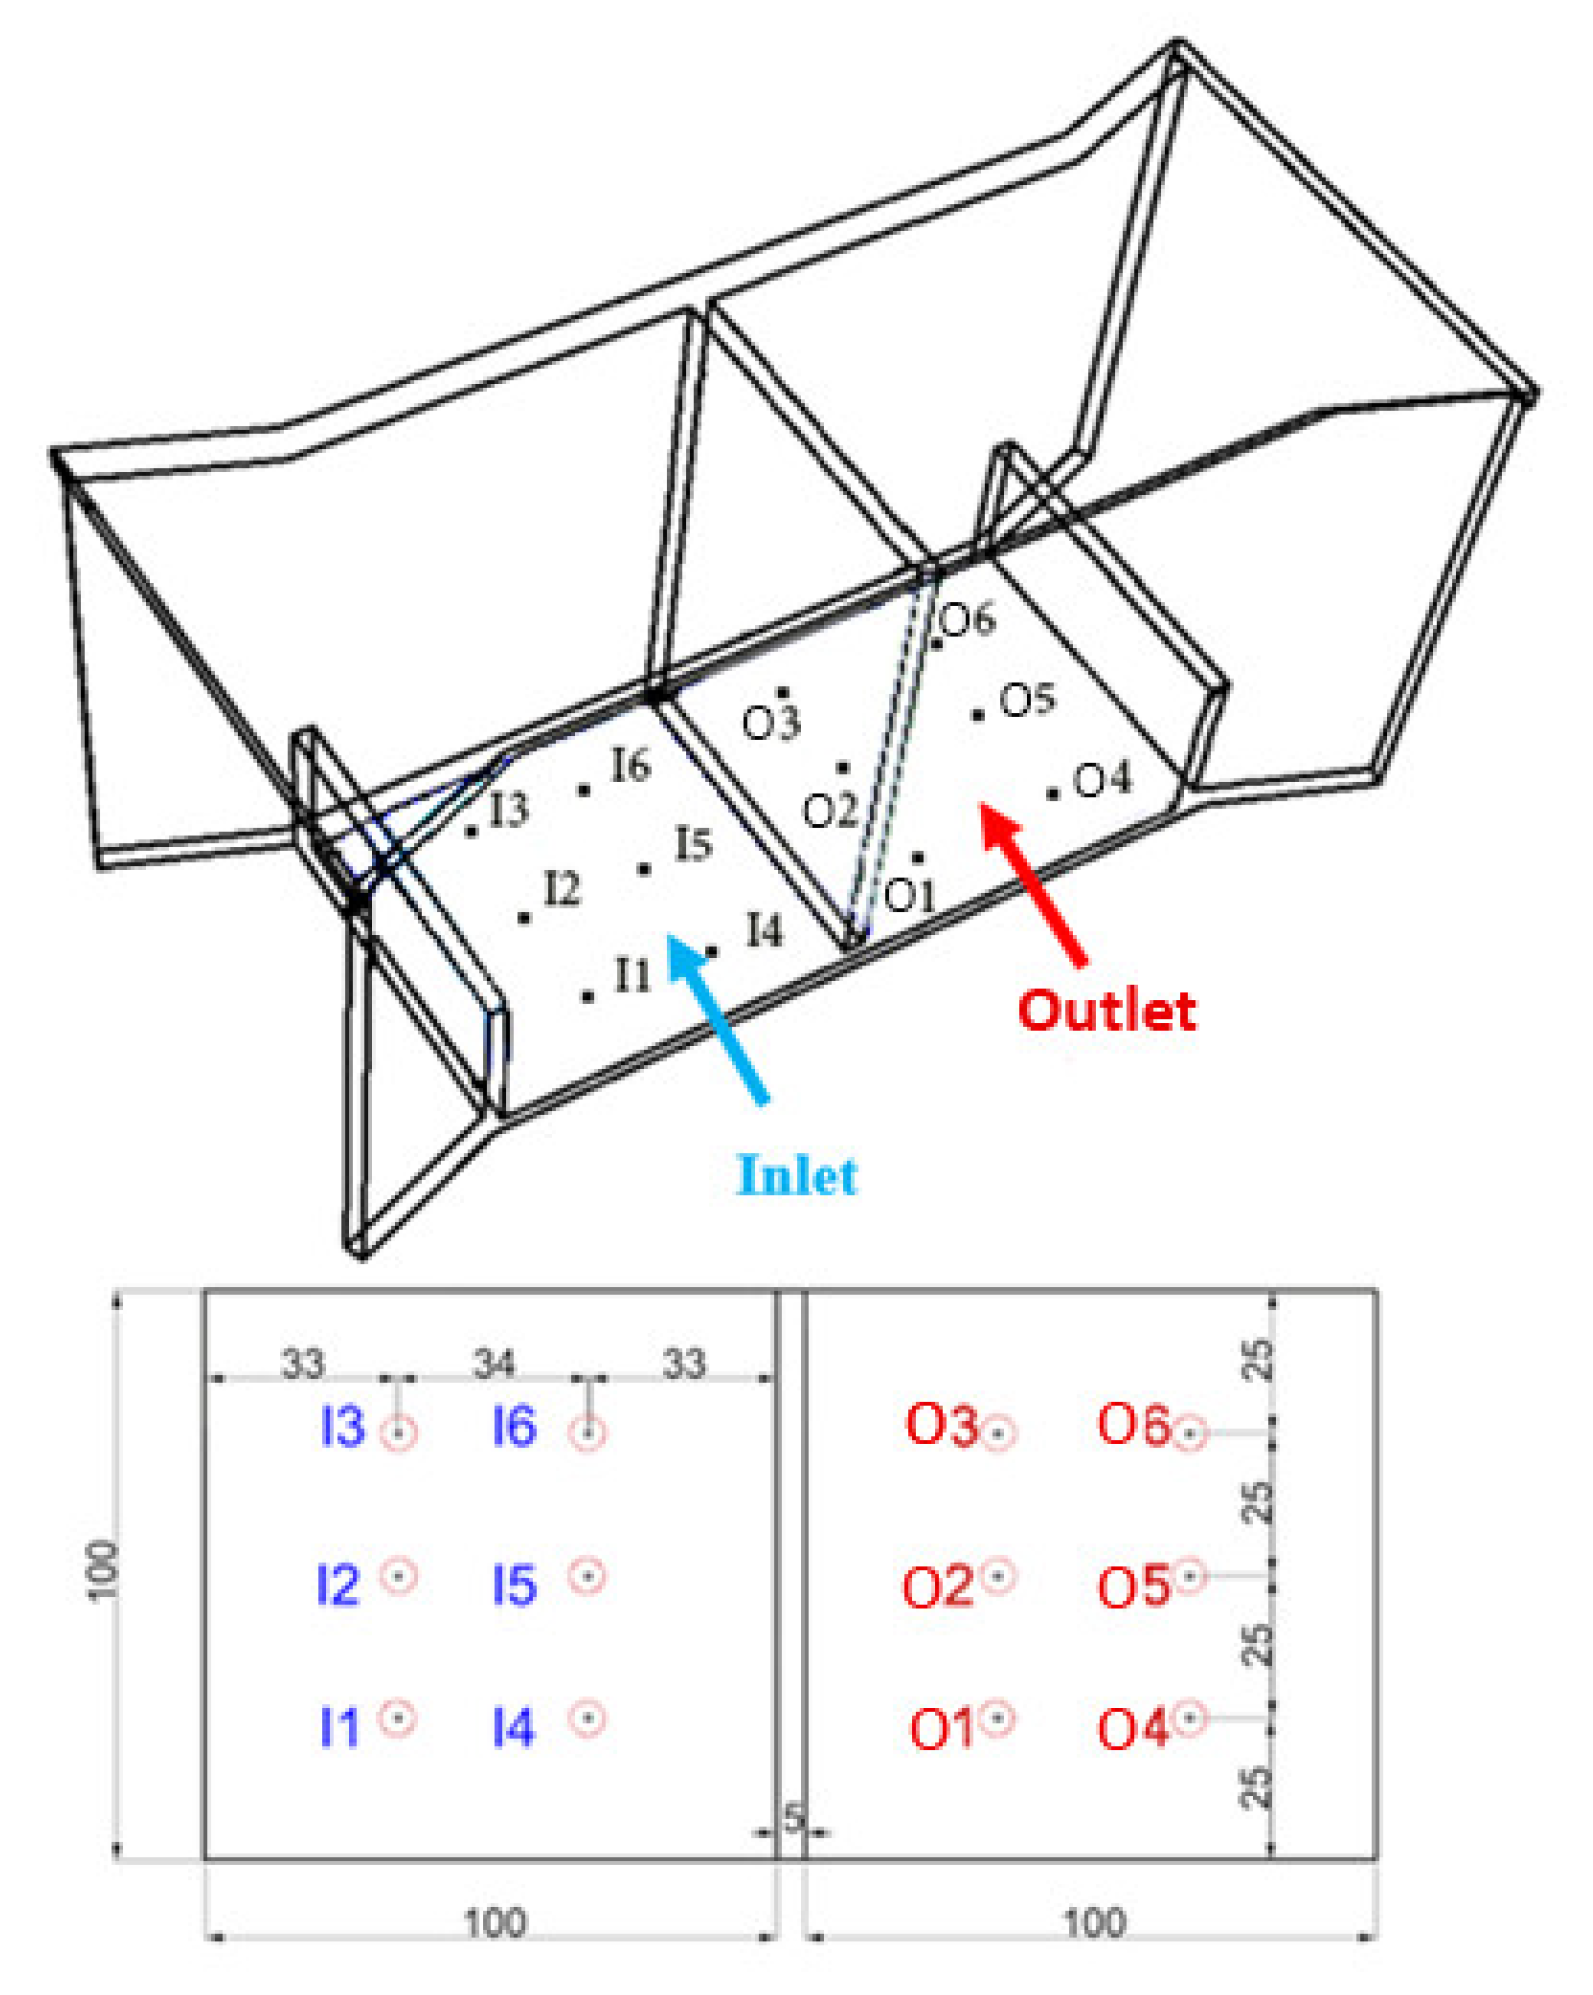
3.2.2. Boundary Conditions

Guidelines of AIJ [42] and COST 732 [41] were the two sources used to specify the boundary conditions. The turbulent kinetic energy k and the airflow velocity U were imposed at the inlet which were based on [43], with the approaching flow streamwise velocity that obey the power law with an exponent of 0.25 corresponding to a sub-urban terrain. Regarding the wind speed range in regions with low wind speed, the velocity was 2.5 m/s at 10 m. Assumption of local equilibrium of Pk = ε contributed to acquisition of The values of ε for the k-epsilon turbulence models [41]. Apart from ground or bottom wall that had its wall functions adjusted for roughness, other wall boundaries applied the standard wall functions (Table 1) [44]. On the basis of [45], this has to be determined by a roughness constant Cs together with an equivalent sand-grain roughness height ks. The horizontal non homogeneity of the ABL was limited by adapting sand-grain roughness height and roughness constant to the inlet profiles, following the equation of [46]:
  k s = 9.793 z 0 C s  
where z 0 represents the aerodynamic roughness length of the sub-urban terrain (Figure 6). The selected values of a roughness constant and sand-grain roughness height were 1.0 and 1.0 mm, respectively. The top and the sides of the domain were designed as symmetry boundary conditions representing zero gradient and zero normal velocity for the variables at the top and side wall. Zero statistic pressure was applied at the boundary wall.
In this study, mean age of air (MAA) was another factor for indoor air quality in which the concept of age of air defined by Sandberg was employed and could be described as the elapsed duration since entrance of air into the space from an opening [47].
In the current study, the estimation of the local mean age of air resulted from solving the equation of user-defined scalar (UDS) transport. The diffusivity of the UDS transport equation was assumed as:
(2.88 × 10⁻⁵)ρ + μeff/Sct
with ρ indicating the density of the air; μeff, the effective viscosity of the air; and Sct, the turbulent Schmidt number which is 1.2 in this study. The related boundary conditions was set to 0 for inlet and outlet diffusers of Windcatcher. For the convection and diffusion terms of the scalar transport equation, Second-order discretization is applied.

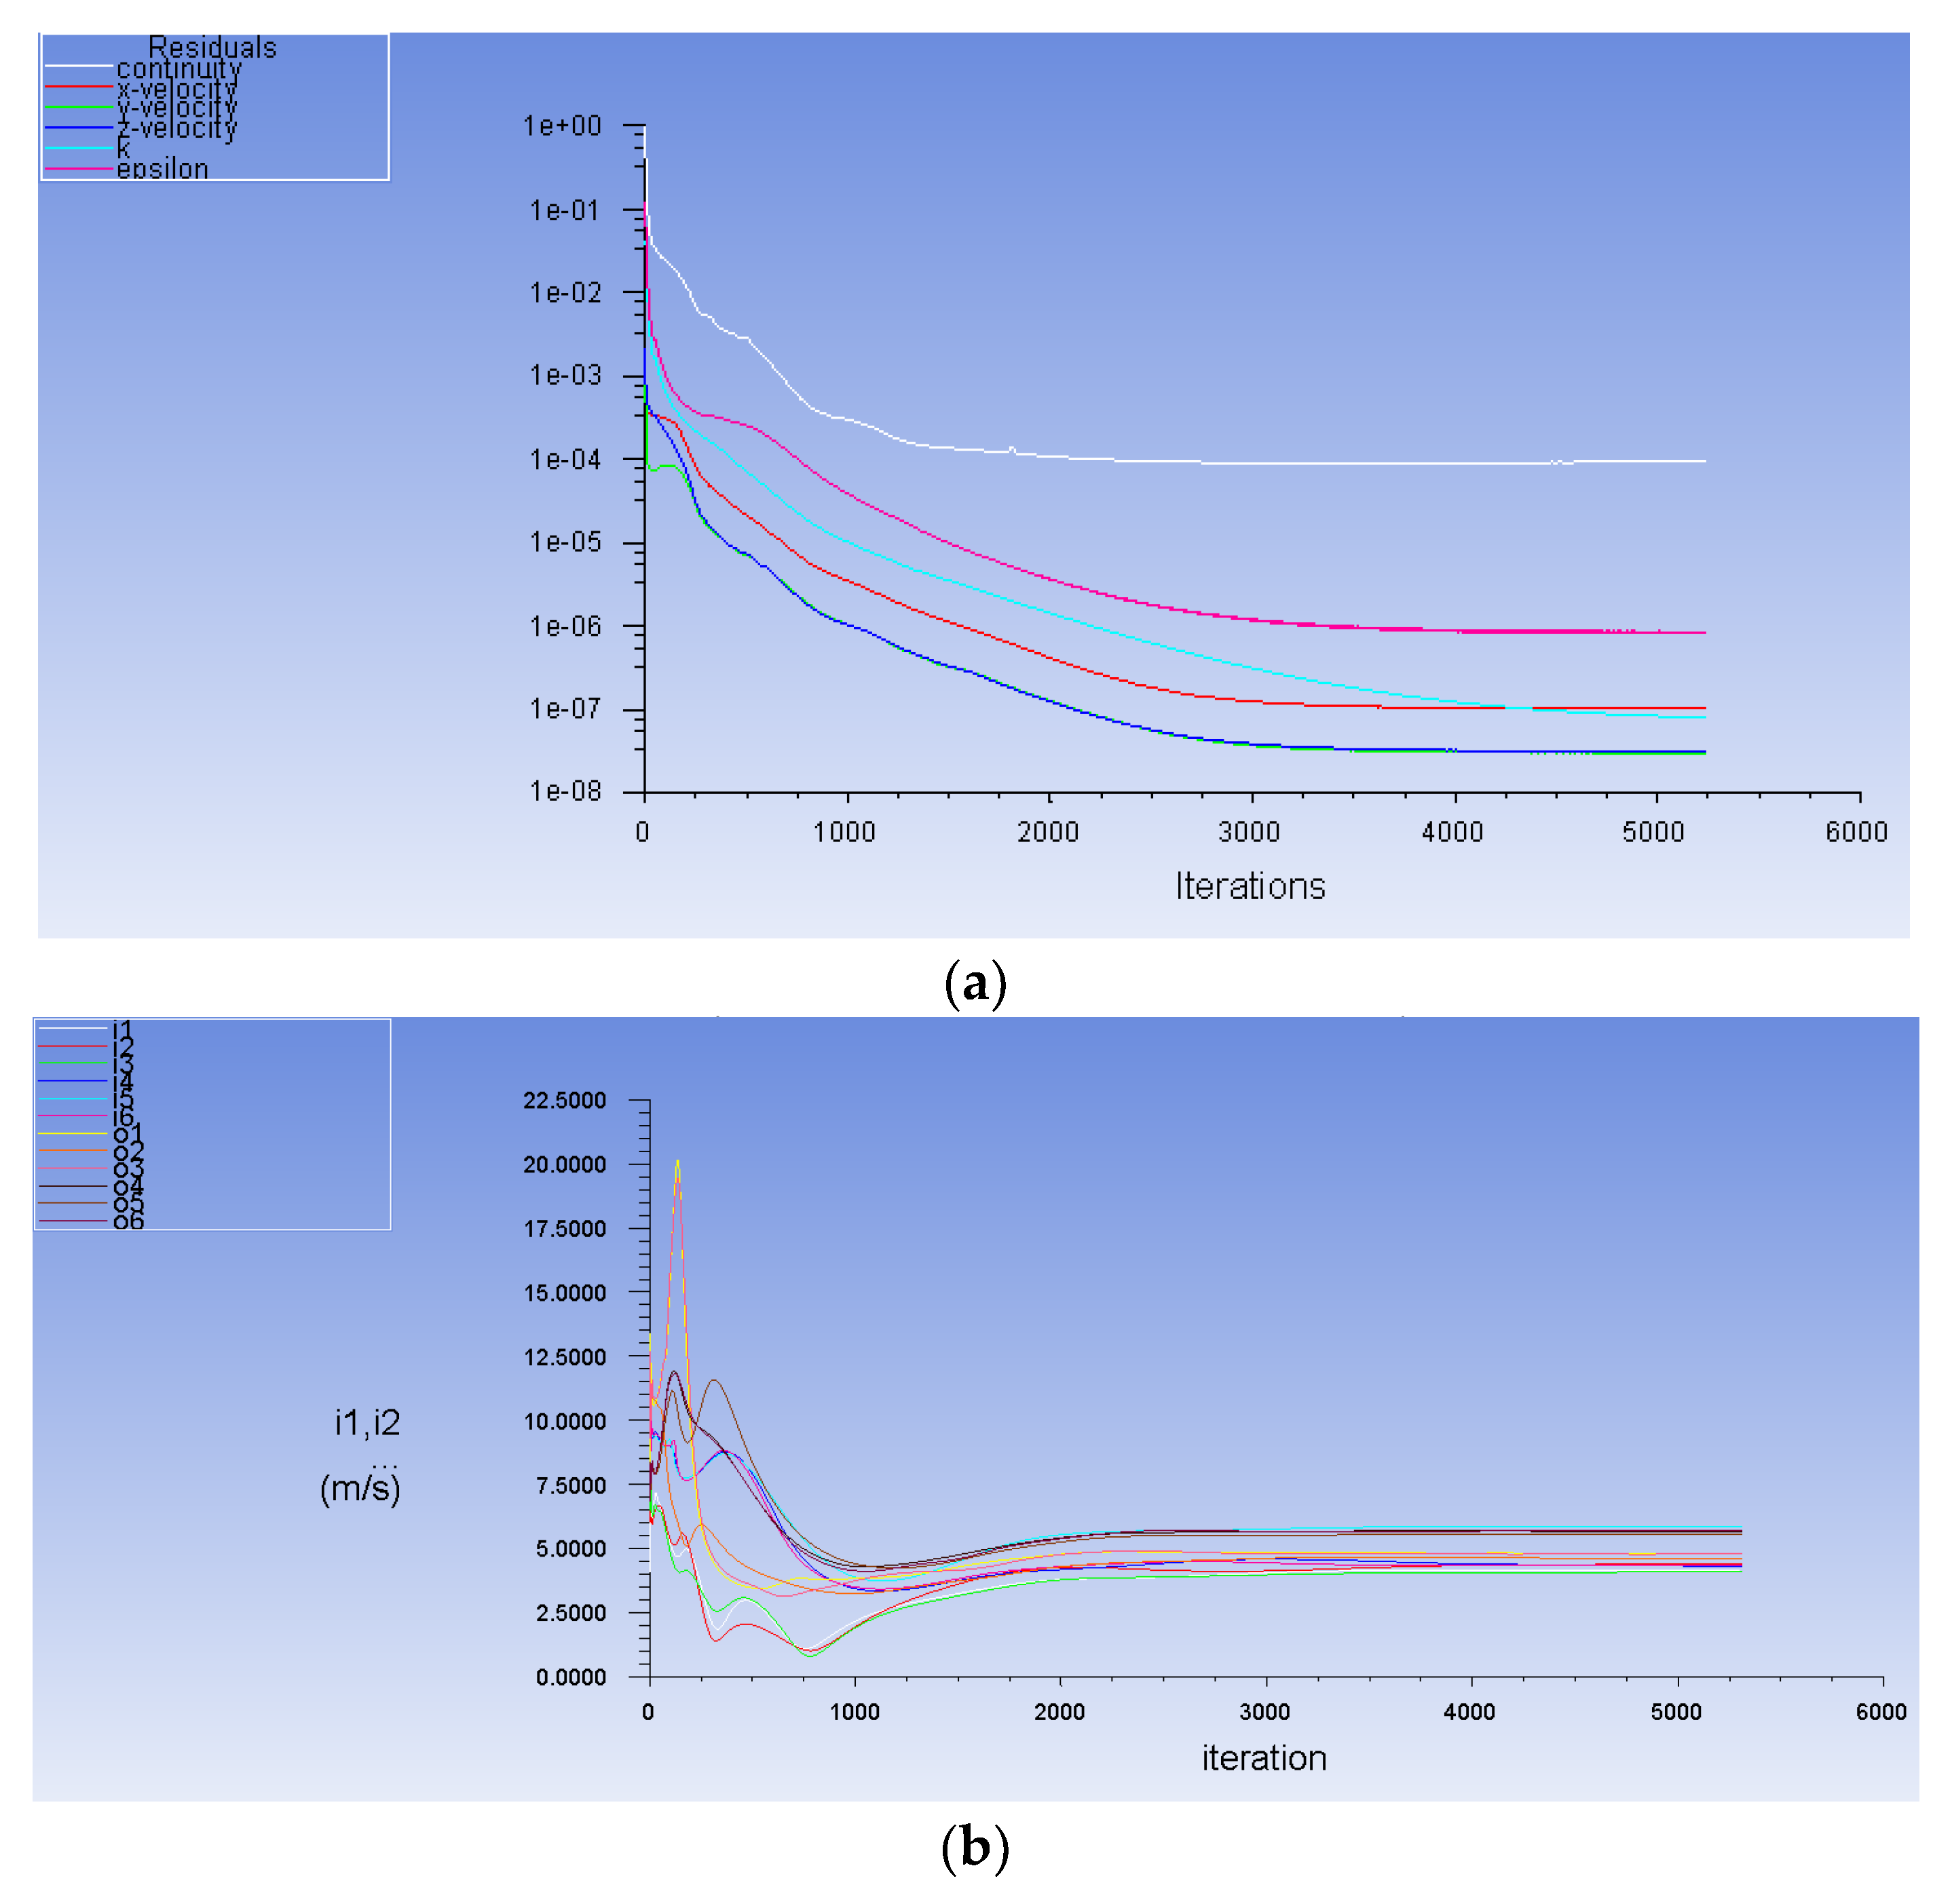
3.2.3. Solution Convergence and Flux Balance

Since no common metrics are available to decide solution convergence, it is significant to consider investigative residual levels along with relevant variables [48]. This study monitored the solution convergence and relevant variables (Figure 7), and absence of changes between iterations led to completion of the solution. The property conservation was checked if achieved, which was performed by conducting mass flux for the converged solution, besides monitoring solution variables and residuals. For the selected boundary zones, computing the mass flow rate was carried out utilizing the flux report panel in FLUENT. For simulating a wind catcher, the mass flow rate balance was below <1% of smallest flux through domain boundary.

4. Results and Discussion

The results of CFD simulation, which were obtained from the performance of the windcatcher, are presented in this section. At first, the CFD model was compared against the experimental data of previous study conducted by authors to validate the computational model. In the next stage, windcatcher with different wing wall lengths were assessed. The aim was to analyze the effects of different length of wing wall on the indoor air quality factors.

4.1. Validation and Sensitivity Analysis

It is of paramount importance to make validation study prior to conducting CFD simulation in detail since numerical simulation is always followed by uncertainty and errors [49]. The numerical method was validated by comparing the CFD results and the experimental data acquired from wind tunnel testing of TWIW scaled model published by authors in the previous study [31].
The windcatcher utilized in the previous study had similar geometrical construction and the simulation using the same CFD code and model set up. The comparison between air velocity of CFD and that of experiment shown in Figure 8 was made in six points, I1 to I6, in inlet diffuser together with six points, O1 to O6, in outlet diffuser.
Figure 9 compares the CFD simulation results against wind tunnel experimental data of small scaled model in the wind speed of 10 m/s. Air flow distribution between inlet (I) points is uneven, particularly the airflow adjacent to the partition wall (I4–I6) with the airflow speed significantly higher at the center (I5) and a similar trend can be observed for both the CFD modelling and experimental data. Whereas in the exhaust channel (O), the airflow near the partition wall (O1–O3) was at a lower speed in comparison with the airflow near the exhaust opening (O4–O6). A similar trend can be observed for the experiment except for point O3 which can be attributed to error in measurement or positioning/angle of the hot wire anemometer in the channel. The average difference between the different points was 7%; hence, it was established that the simulation’s accuracy was reasonable enough to carry out the study.

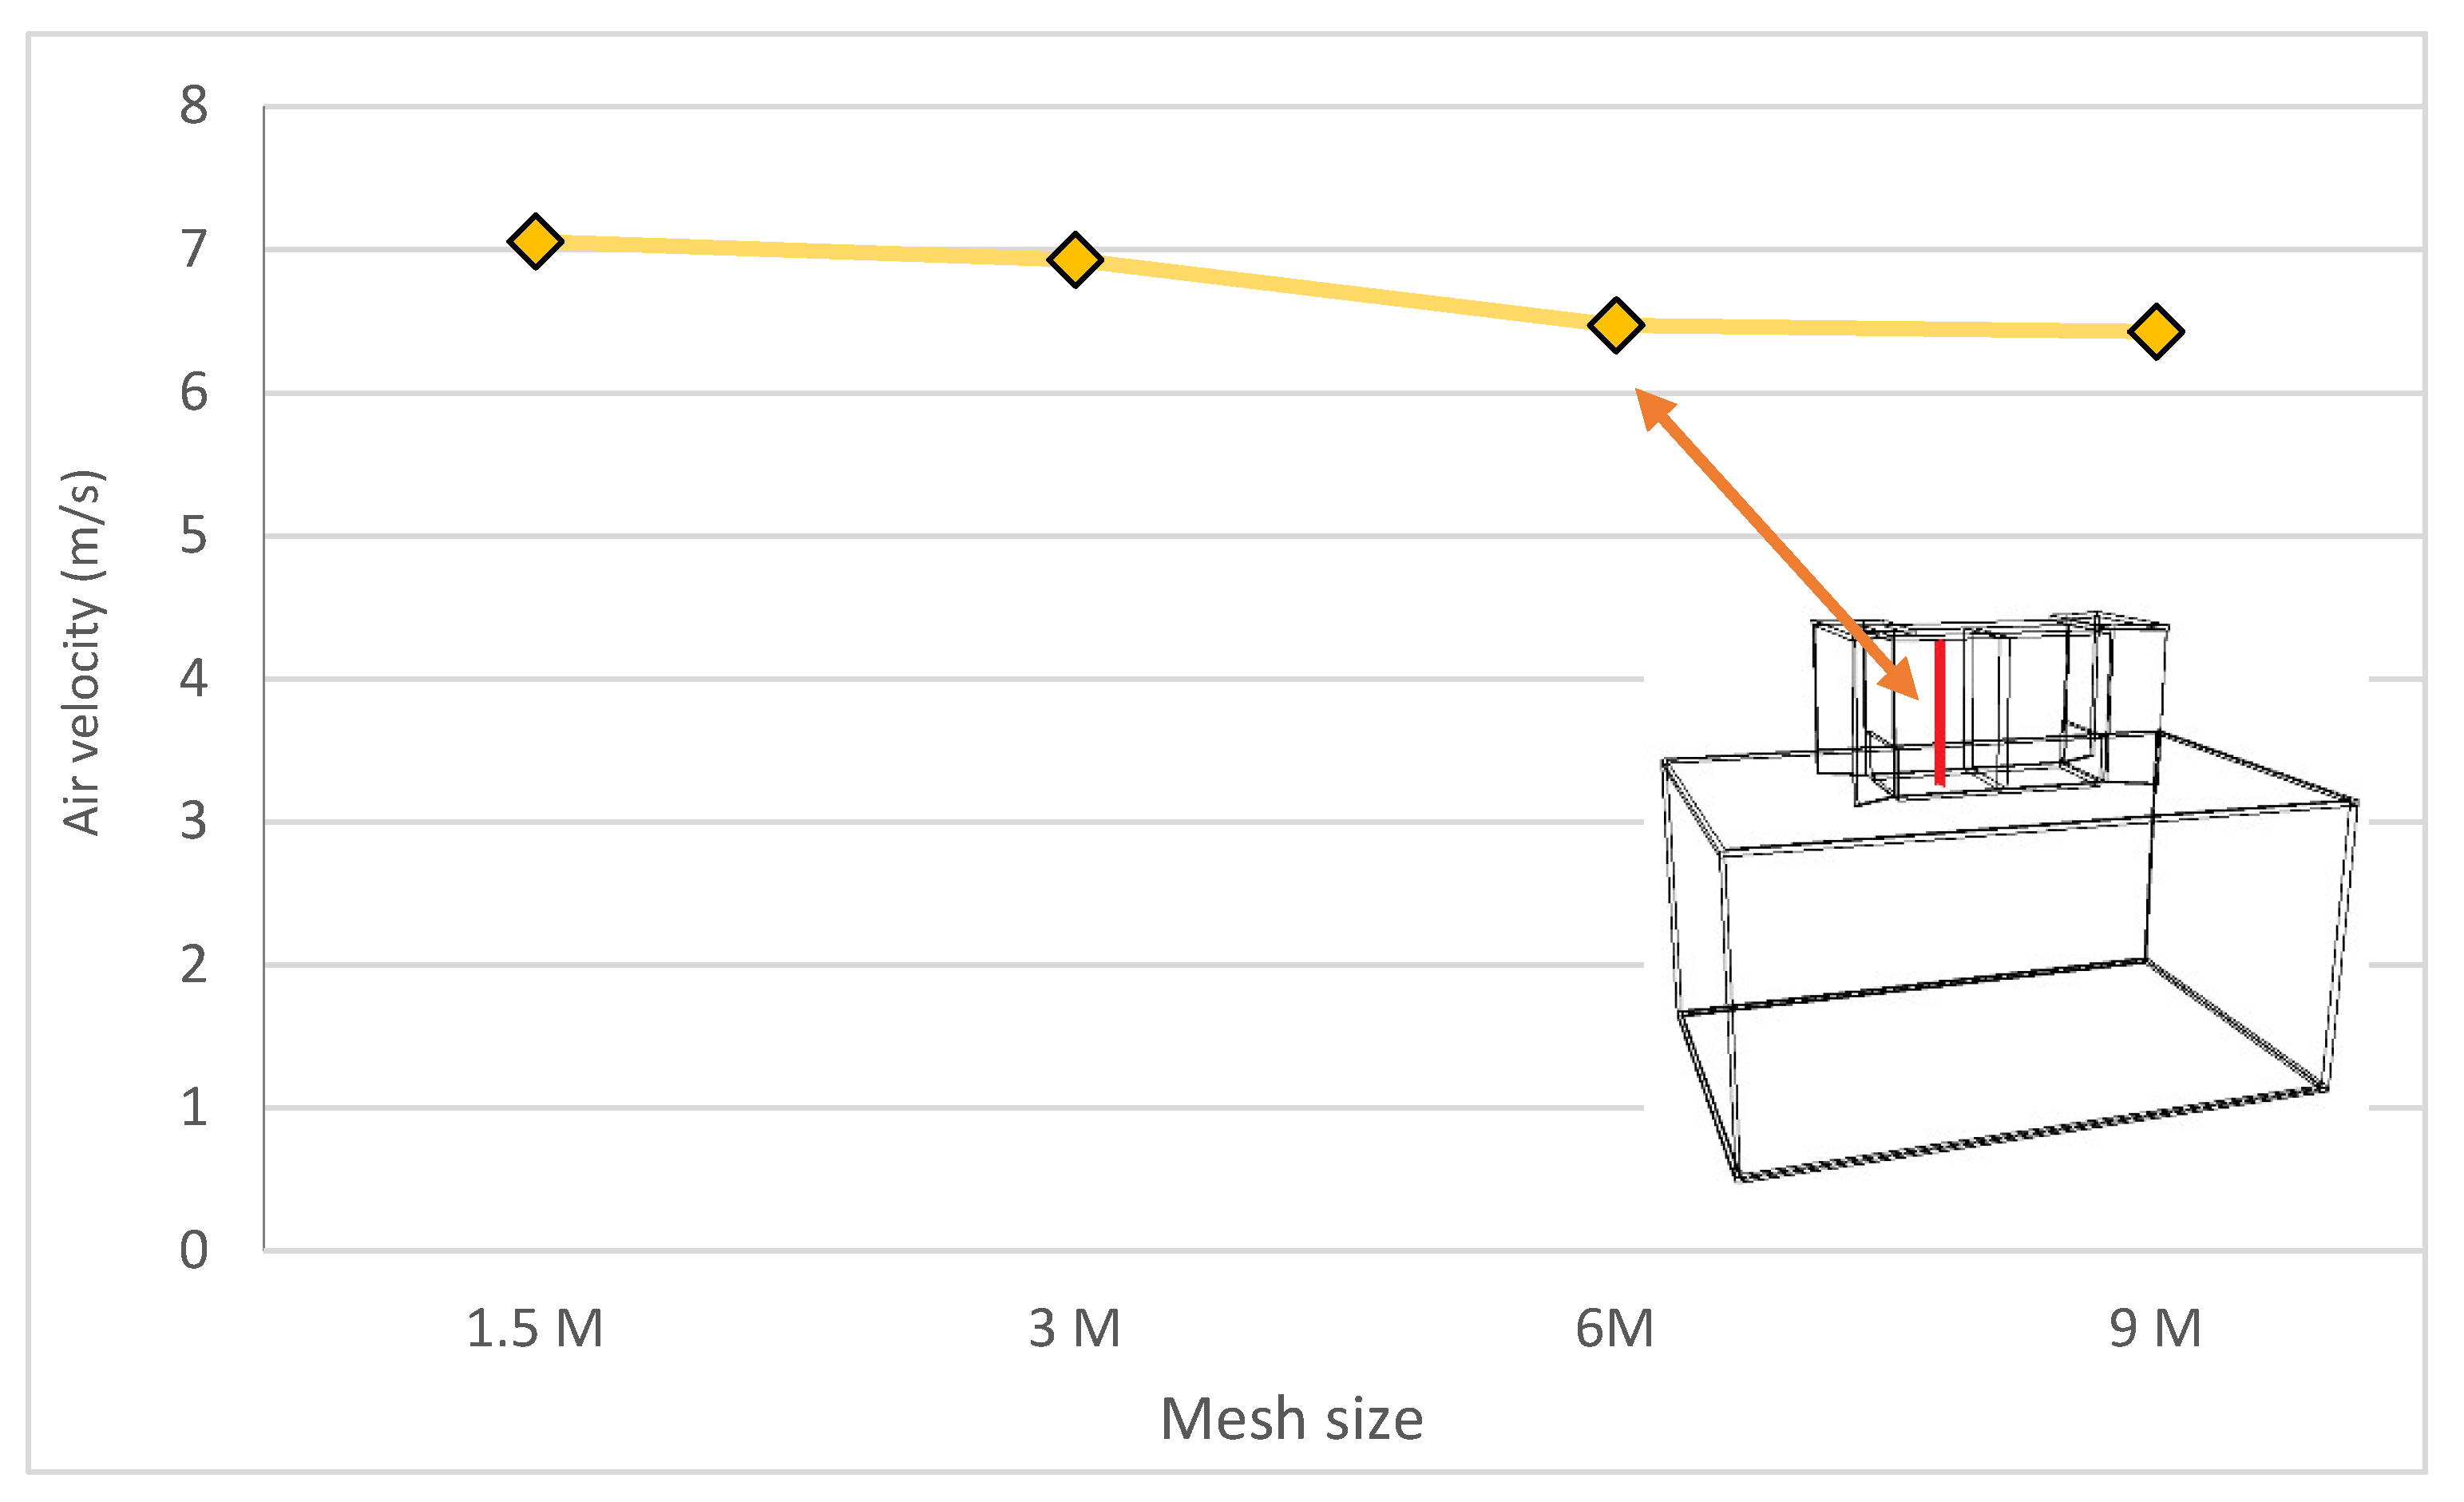
4.1.1. Sensitivity Analysis

Grid Adaption

The independency of the numerical model from the grid size was assessed by evaluating different number of grids (1.5, 3, 6 and 9 million elements). A mesh sensitivity analysis was the basis of the computational mesh which was performed by further simulations with same boundary conditions and domain but different mesh sizes. The error indicator was presumed to be the area-weighted average value of the inflow velocity in the vertical height of the windcatcher inlet channel (Figure 10) due to grid refinement from 1.5 million coarse elements to 9 million fine ones. The maximum error between fine and medium mesh did not exceed 1%. Hence, no notable effect was observed when numerical model with finer mesh was repeated. Therefore, applying the medium mesh (6 million) was accurate enough and finer mesh was not necessary.

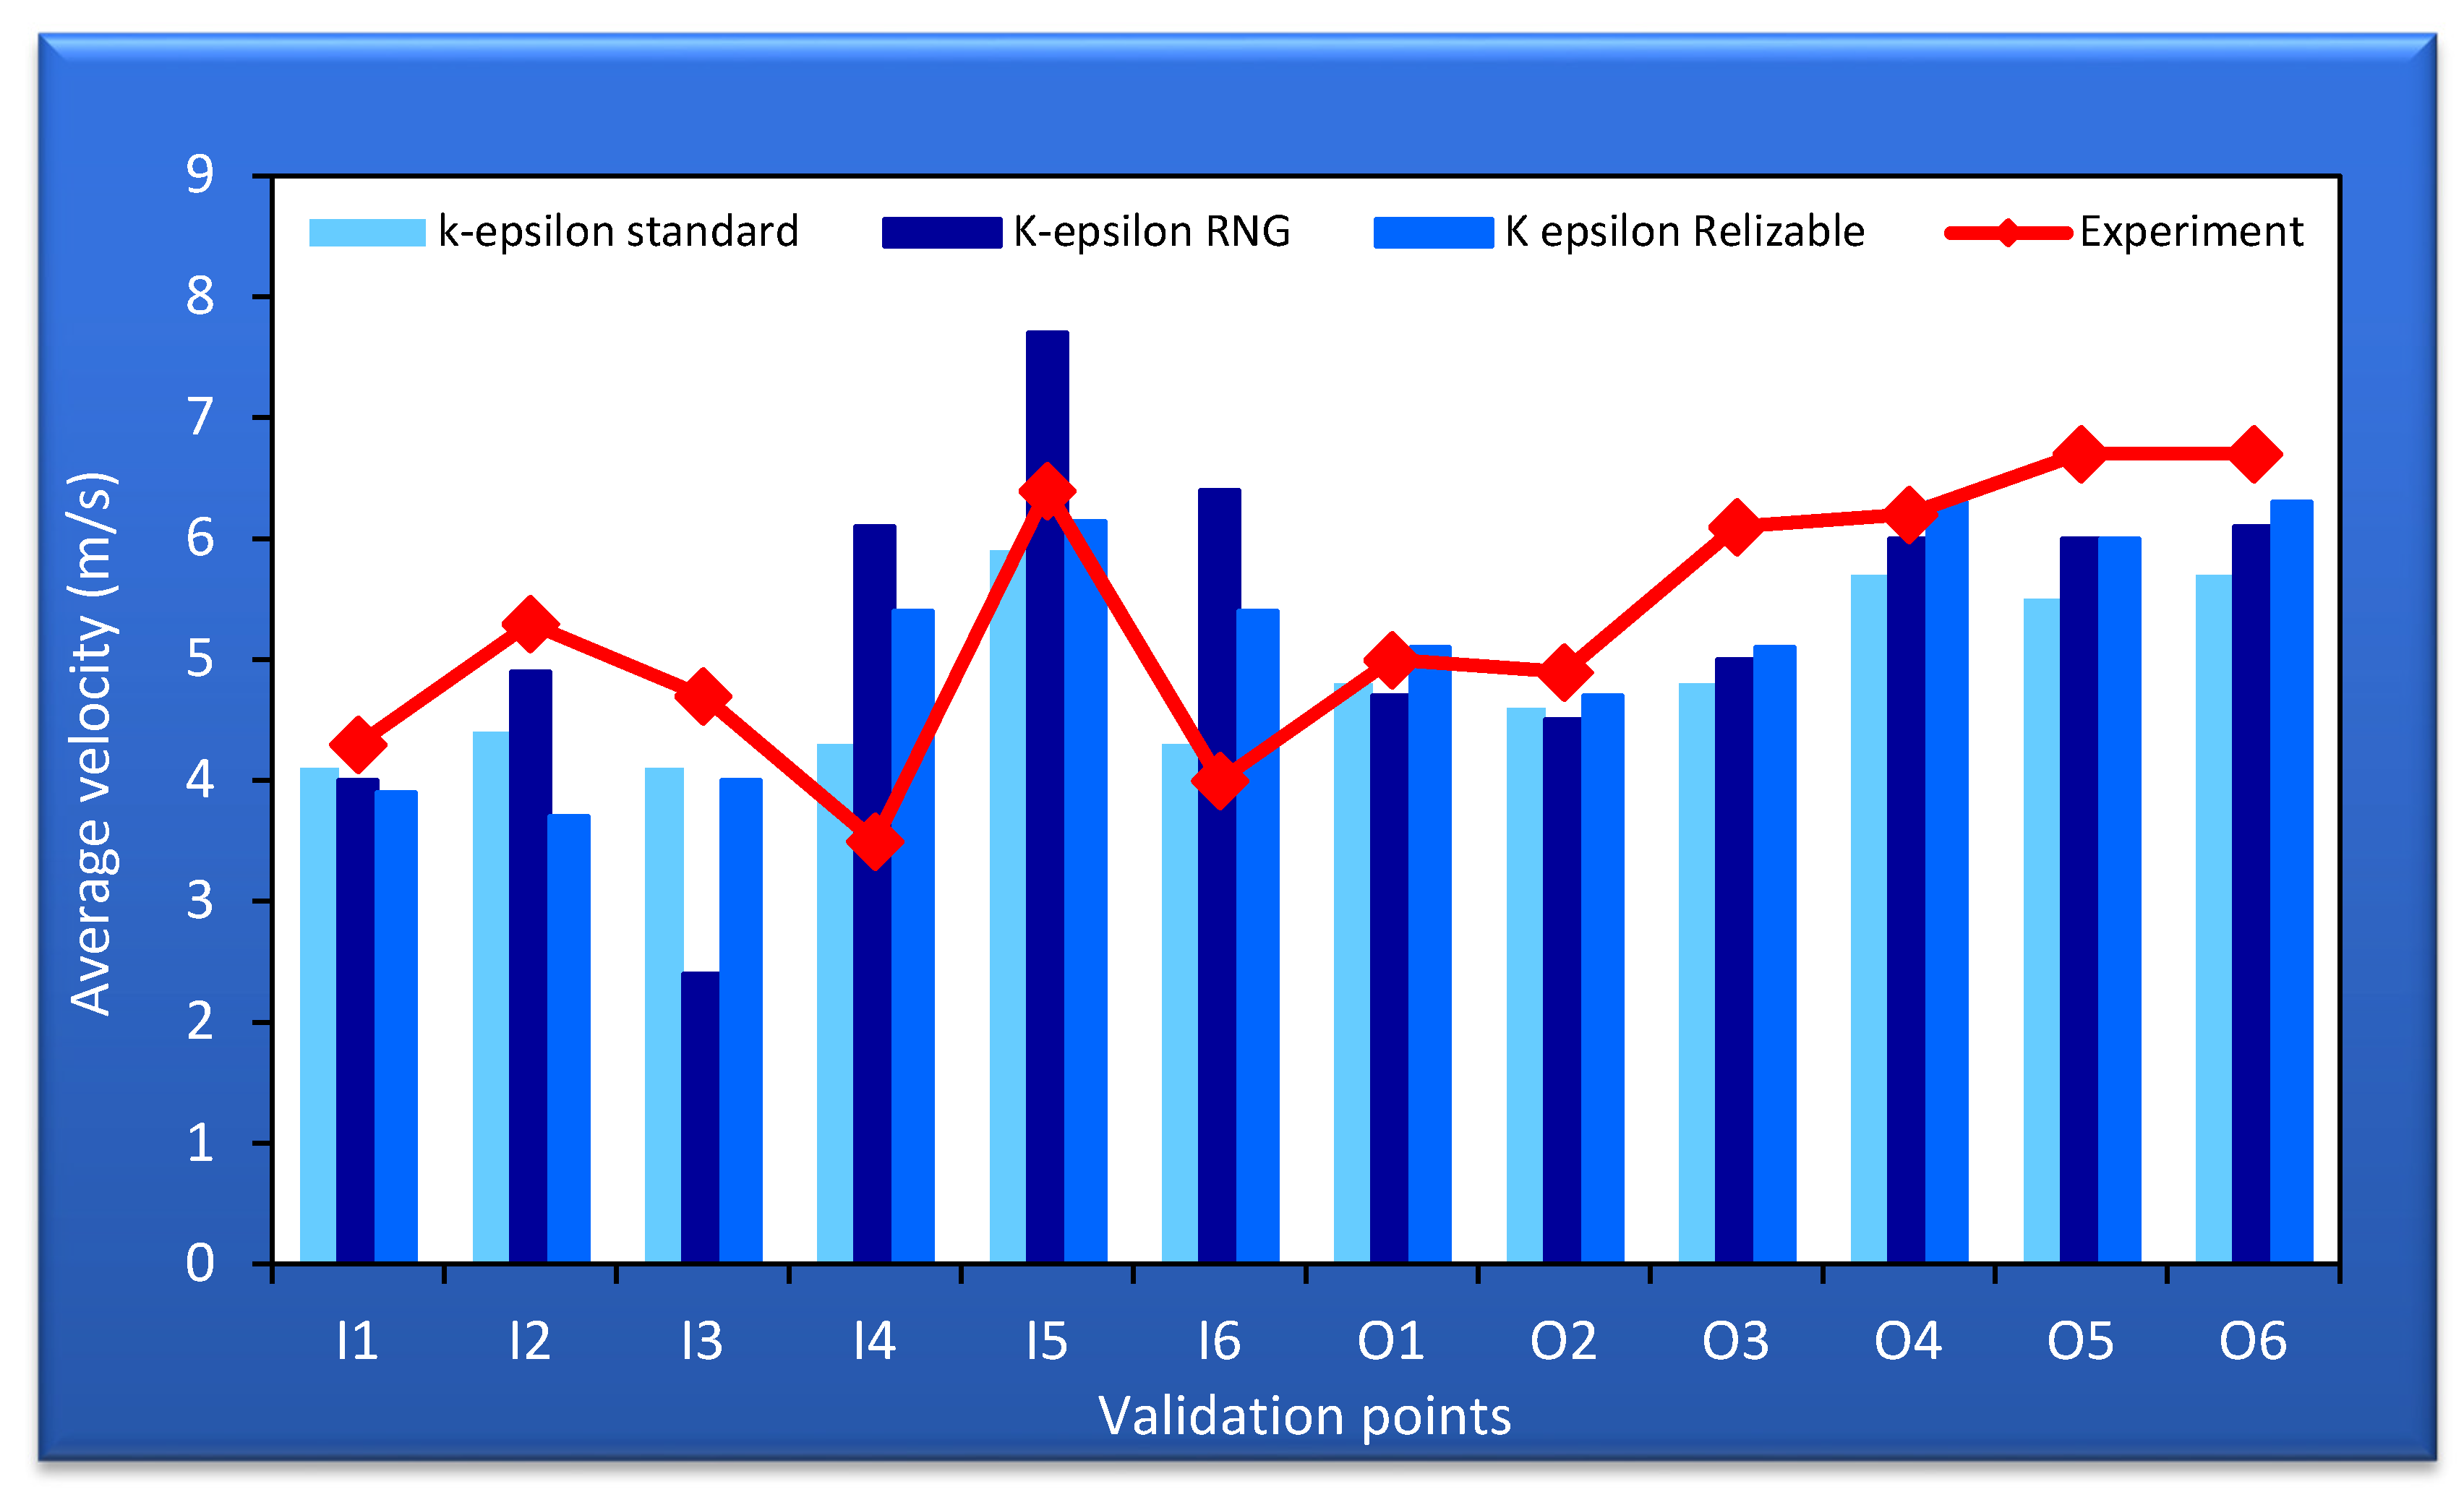
Sensitivity Analysis of Turbulence Model

It is fundamentally important to validate turbulence model to ensure CFD simulation is reliable. Verifying the capability of the selected turbulence model to render the most precise flow prediction was the purpose of turbulence sensitivity analysis. Therefore, the following three turbulence models were appraised: (1) the standard k-ε (Sk-ε) model, (2) the realizable k-ε (Rk-ε) model and (3) the renormalization group k-ε model (RNG k-ε). Figure 11 illustrates the predictions of the three different turbulence models on the airflow velocity in I and O points of inlet and outlet channels of model. The experimental data is ideally in accordance with the standard k-ε model; therefore, it is preferred over the other two models. The experimental data and mentioned model had a difference average of 7% (below the other two). Thus, as standard k-ε model was consistent with preceding studies about windcatchers in reference of [8,50].

4.2. The Effect of Wing Wall Length on Ventilation Performance.

The length was the parameter for wing wall design in this study as illustrated in Figure 2. In order to create diverse windcatcher configurations, ten distinct lengths for wing wall were employed. Figure 12 depicts the different planes in which the parameters of indoor air quality were appraised with the purpose of evaluating the windcatcher’s ventilation performance. The inlet and 1.1 m horizontal planes were used to calculate and display the contours of different IAQ factors. The opening plane (the purple one) was defined as the start time of air traveling inside the model for mean age of air (MAA) calculation.

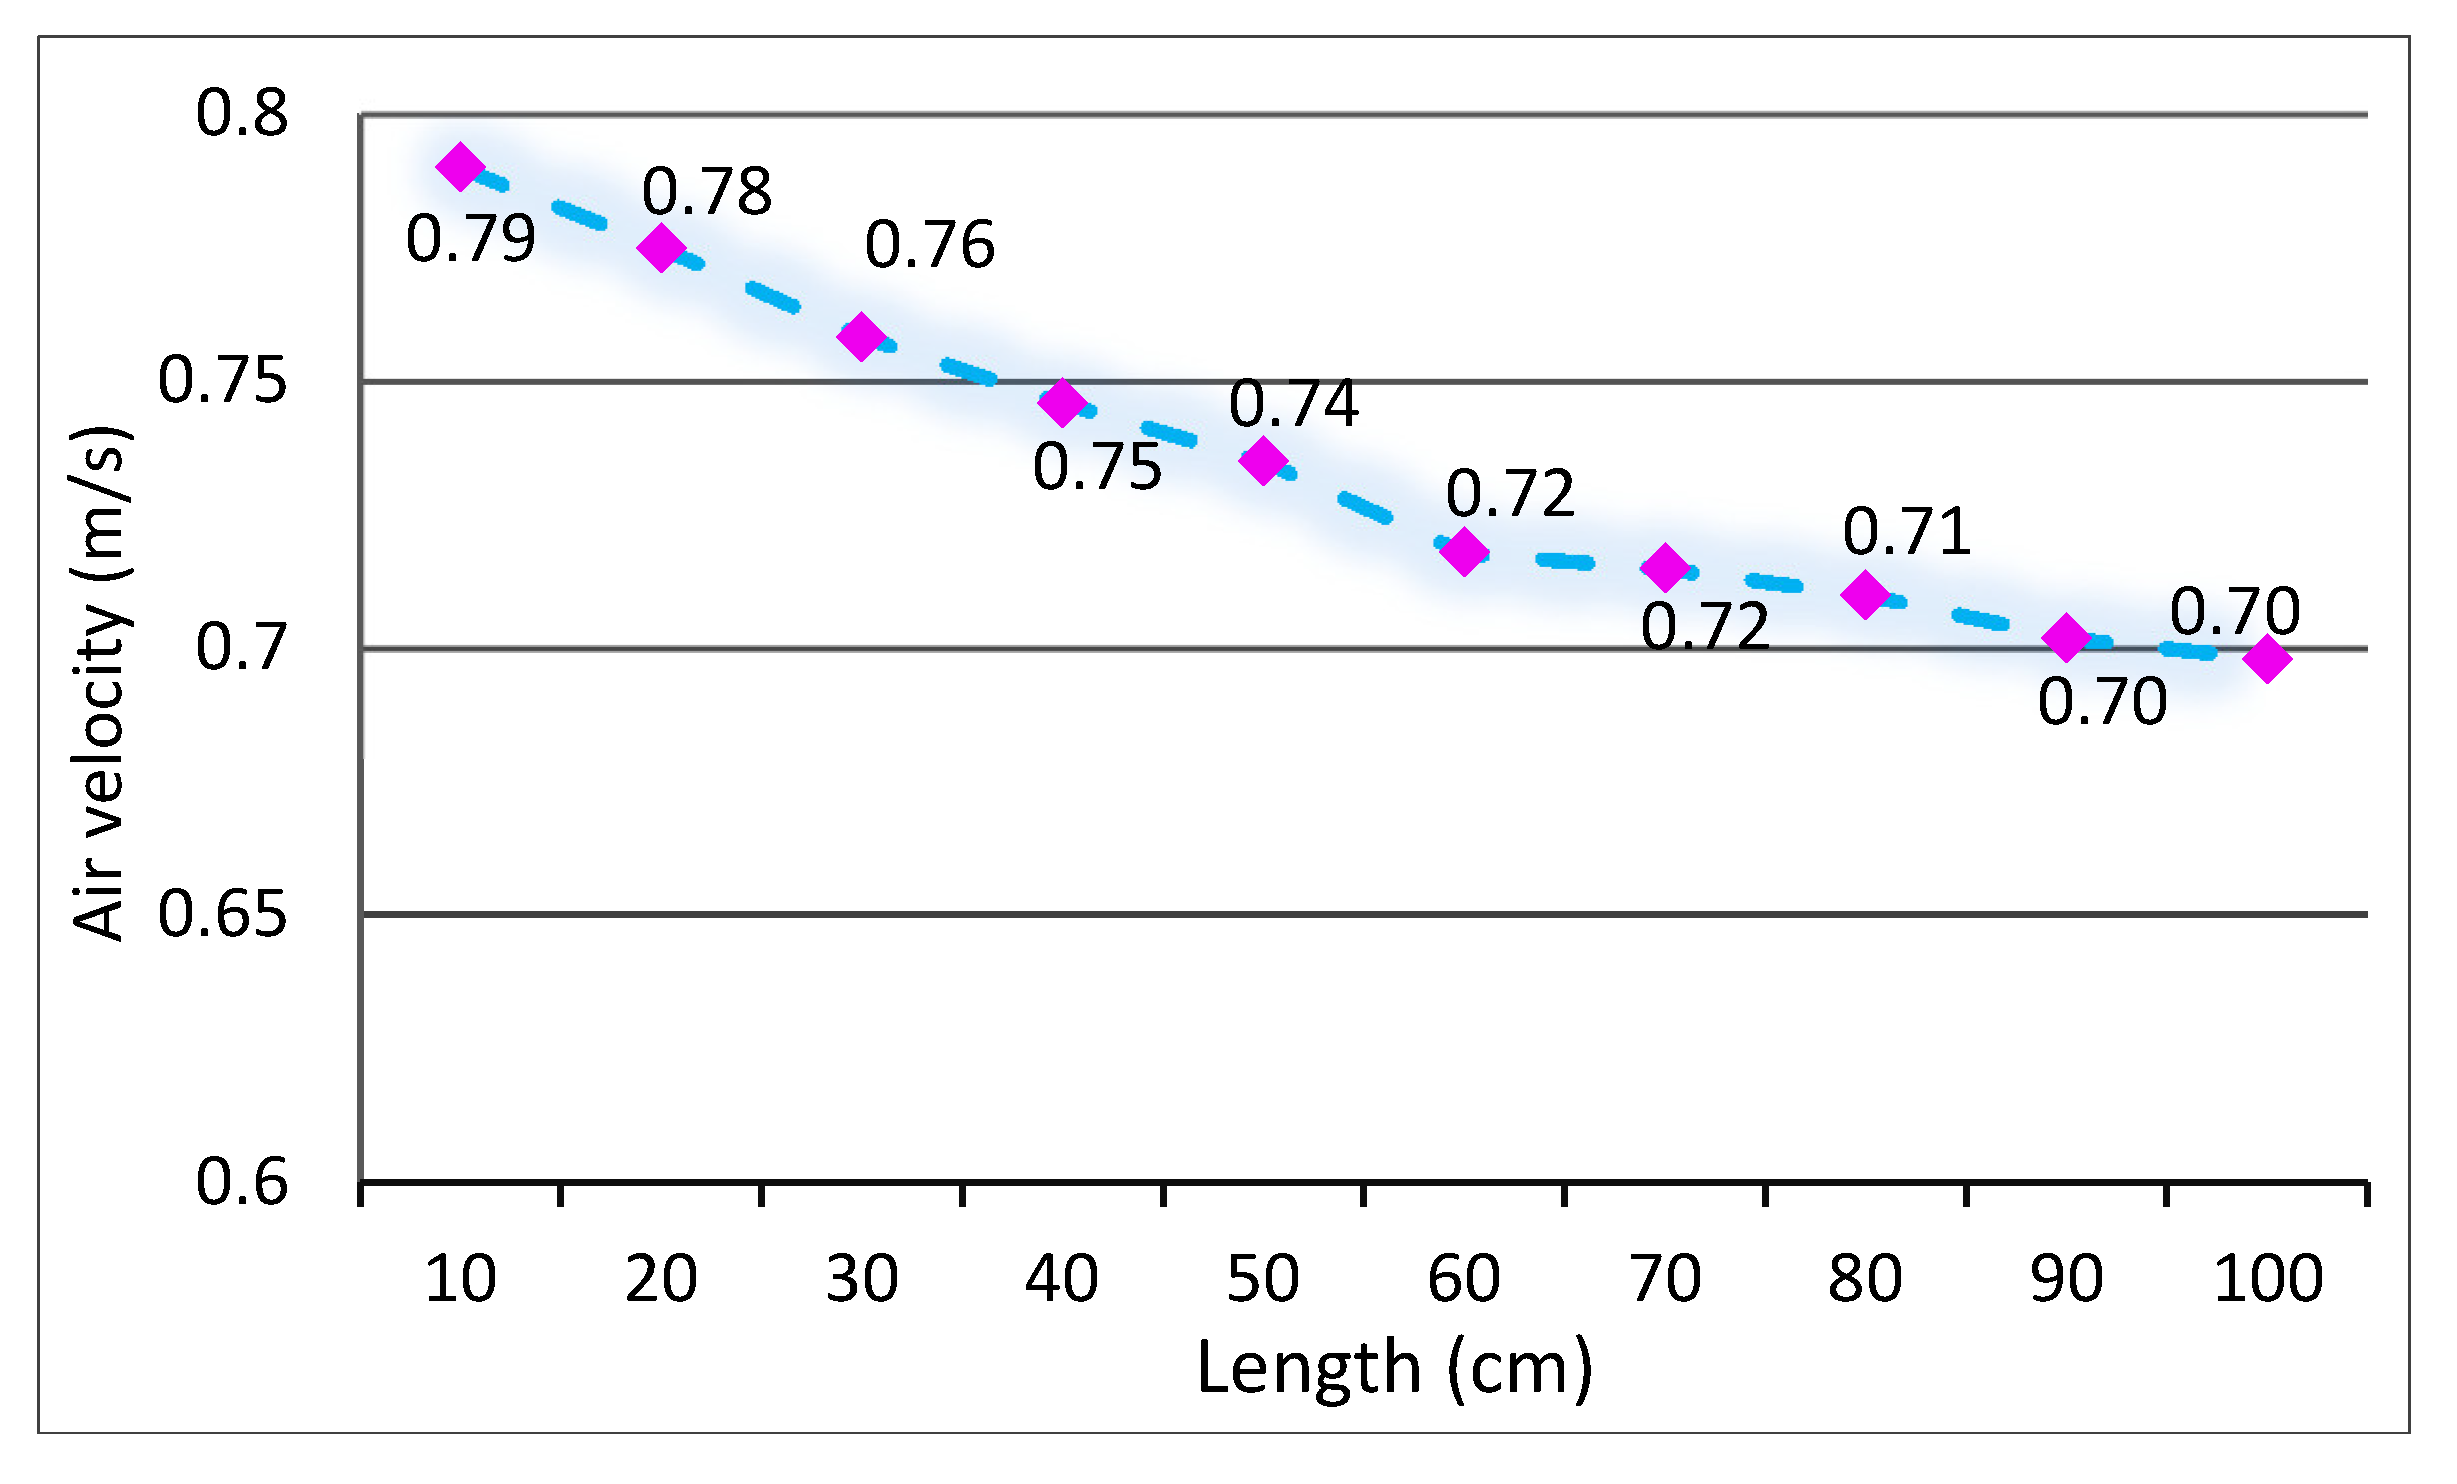
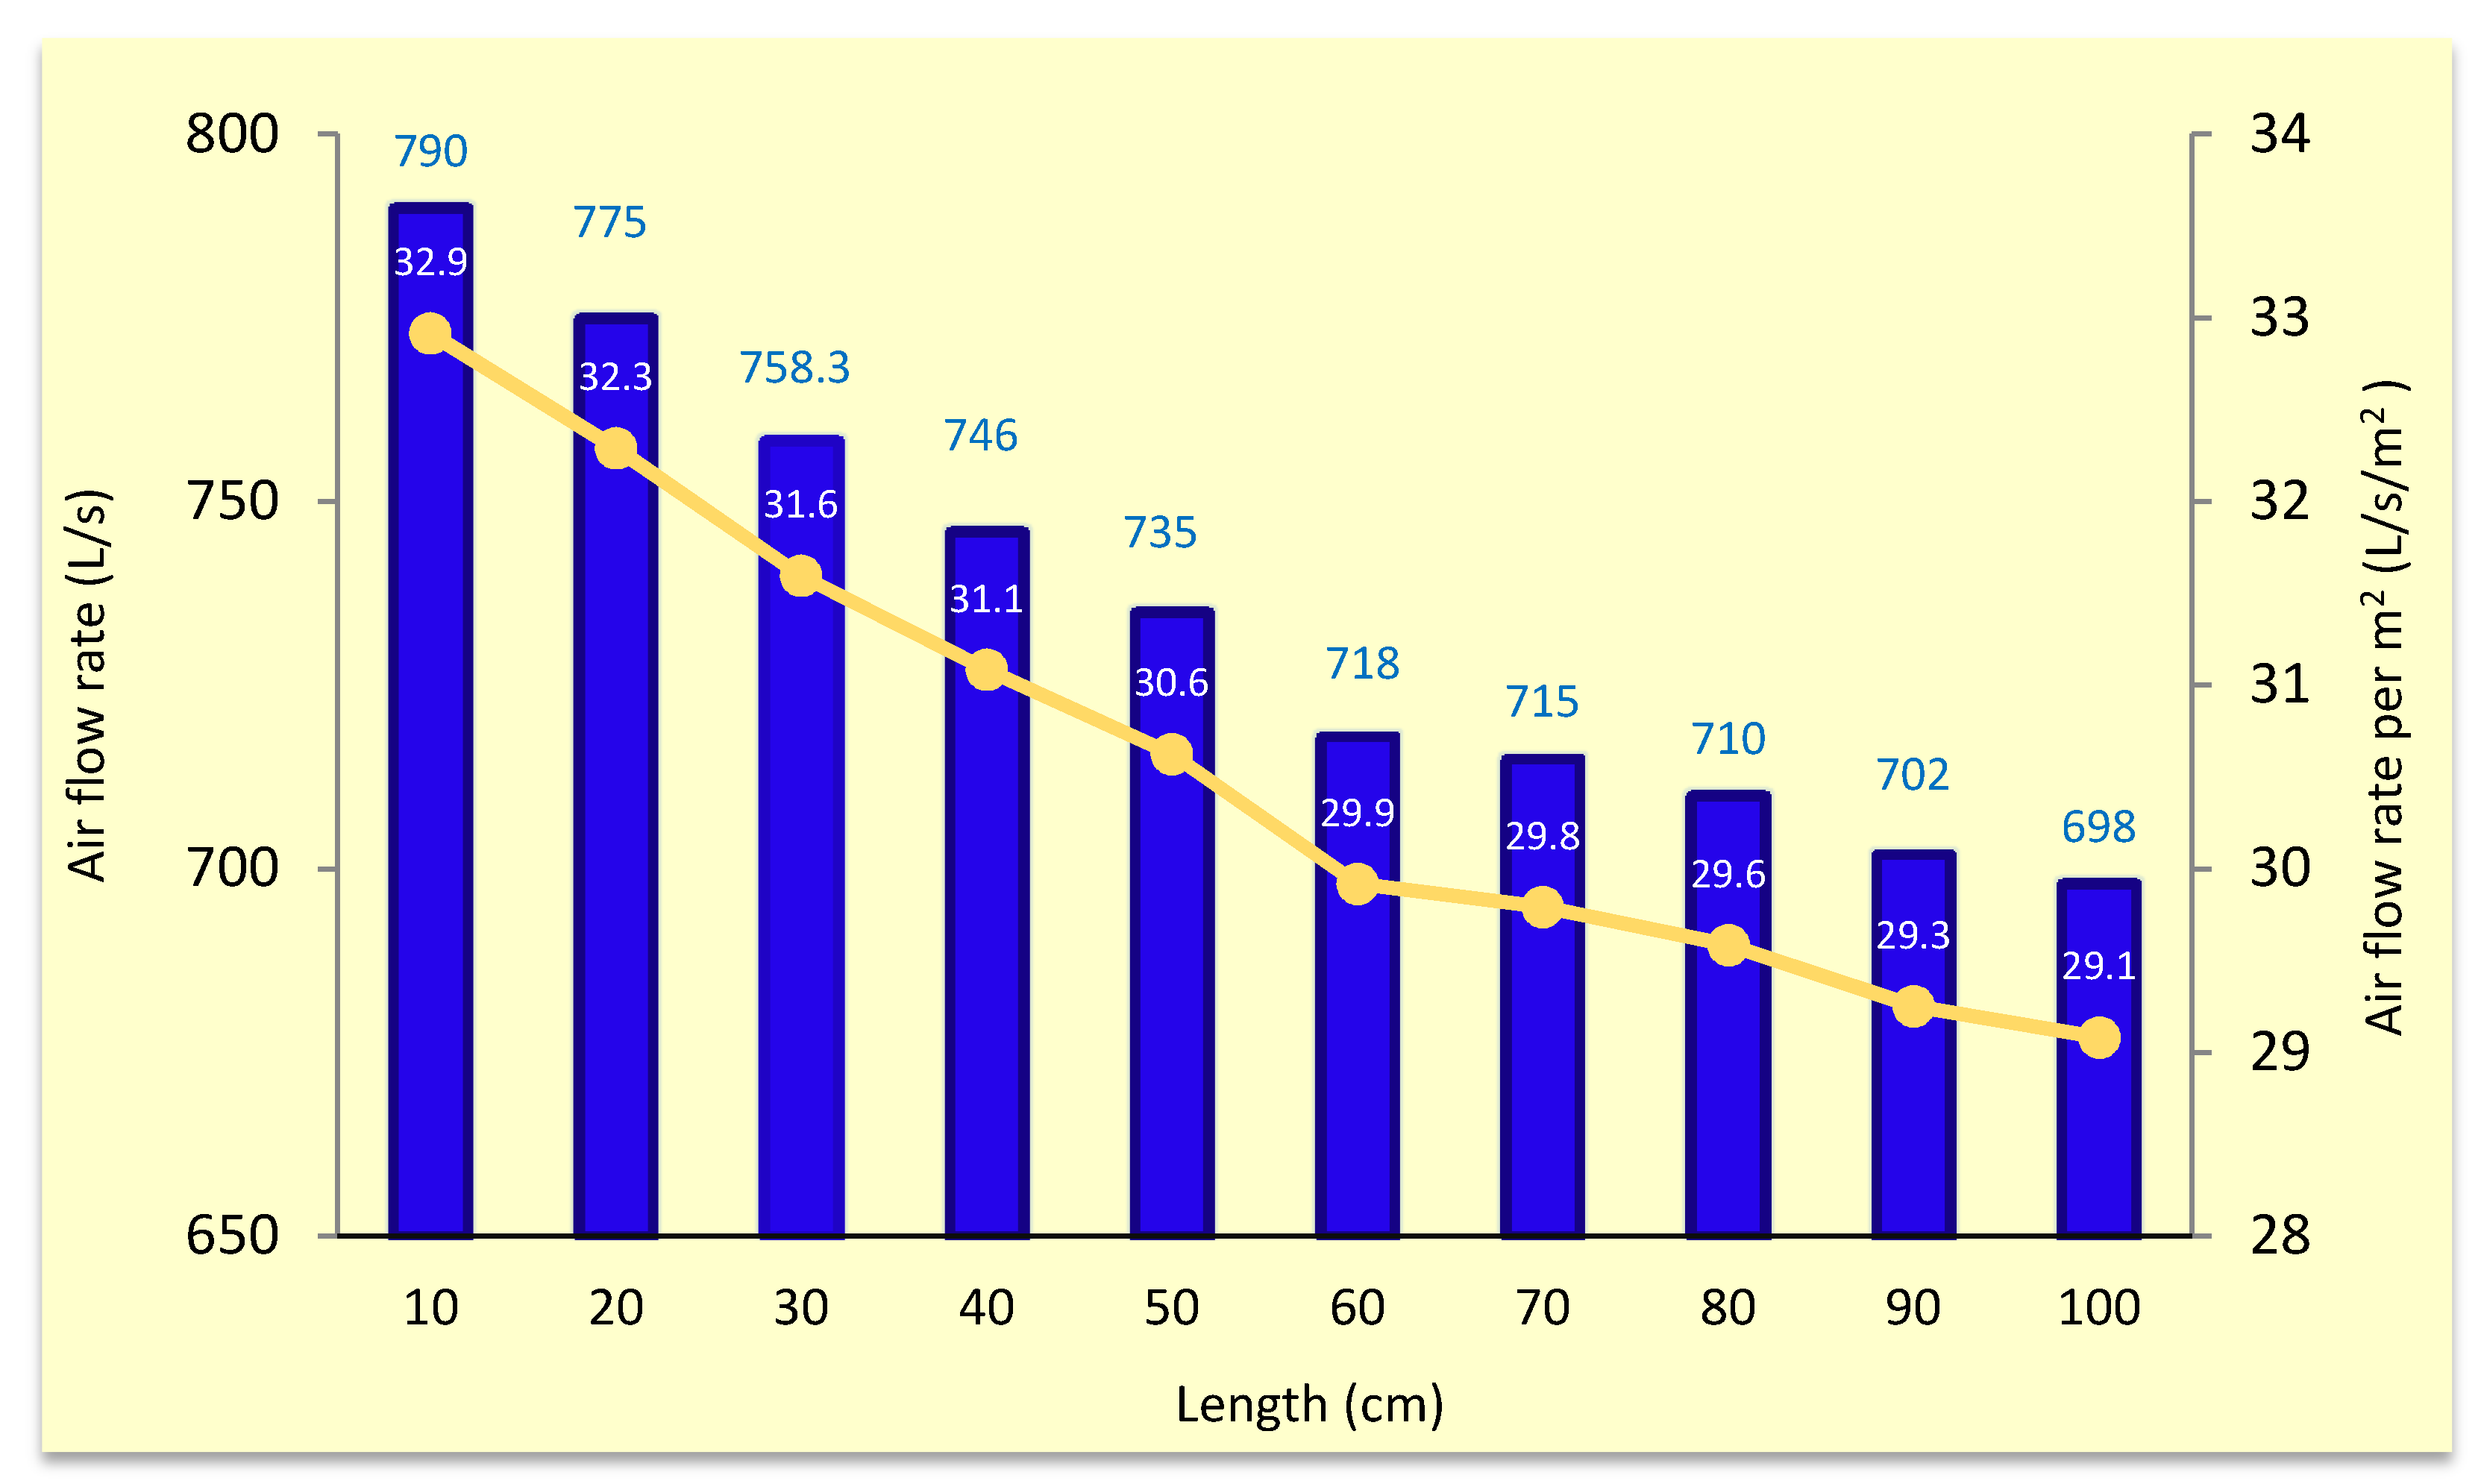
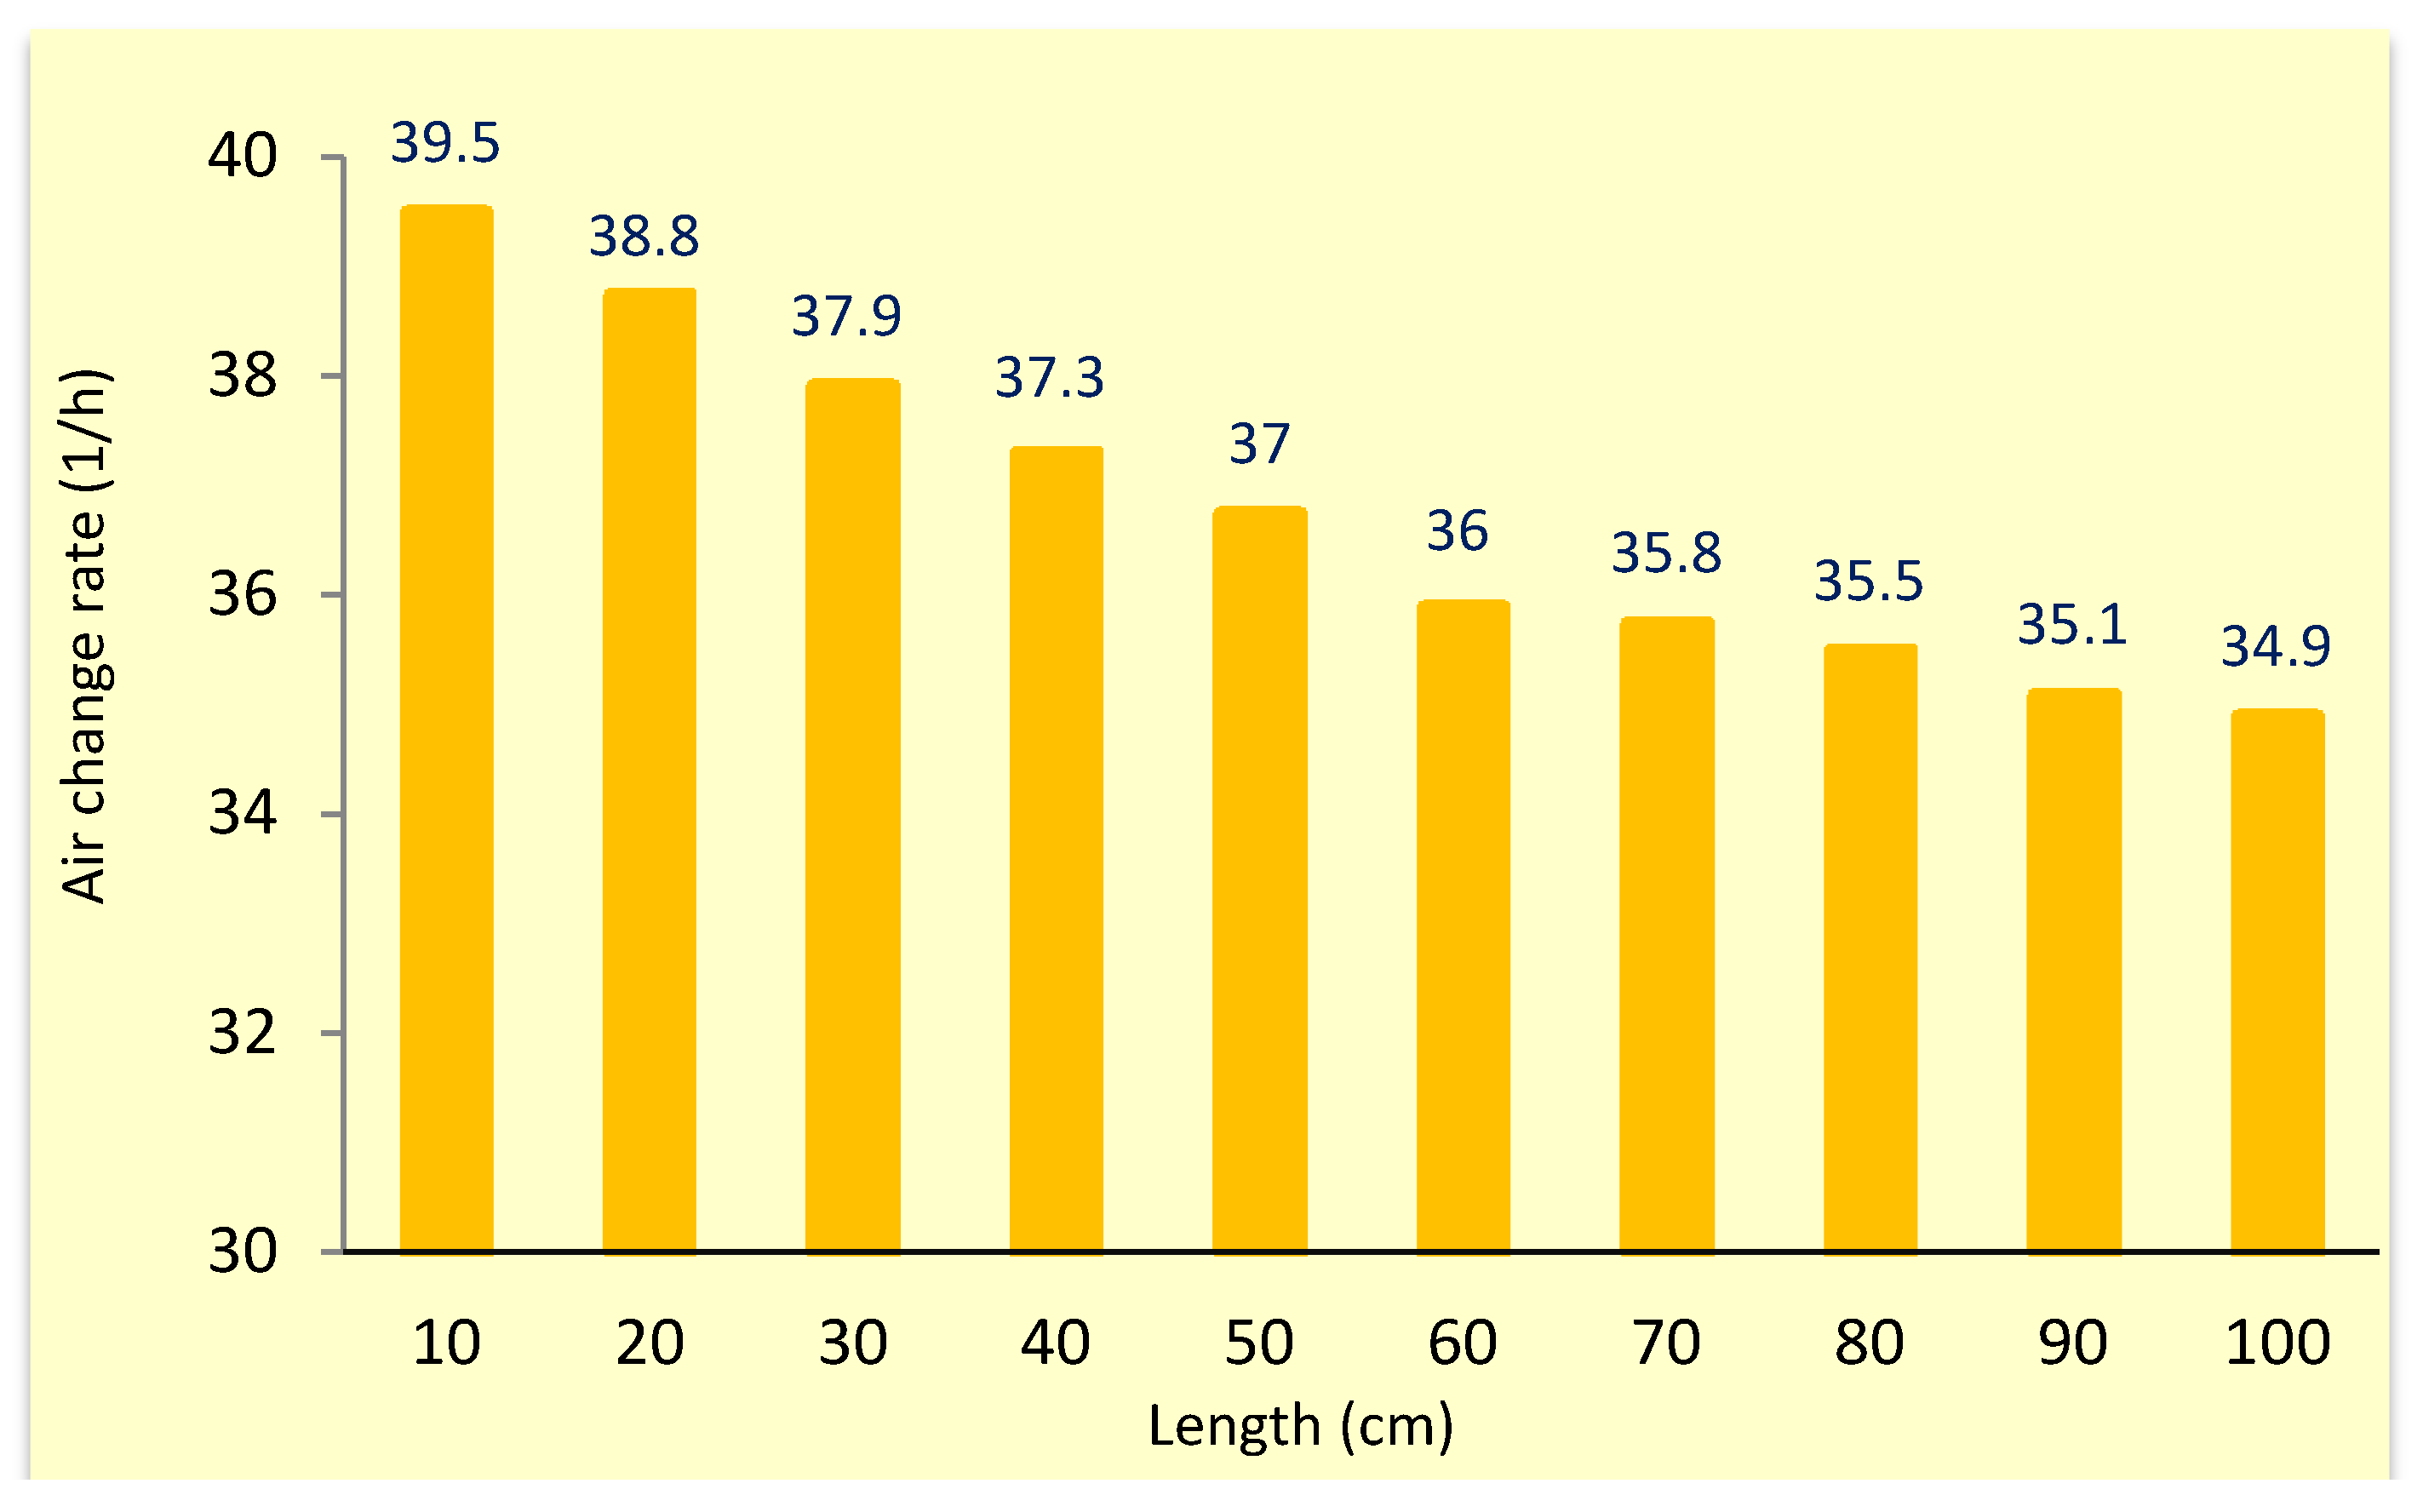
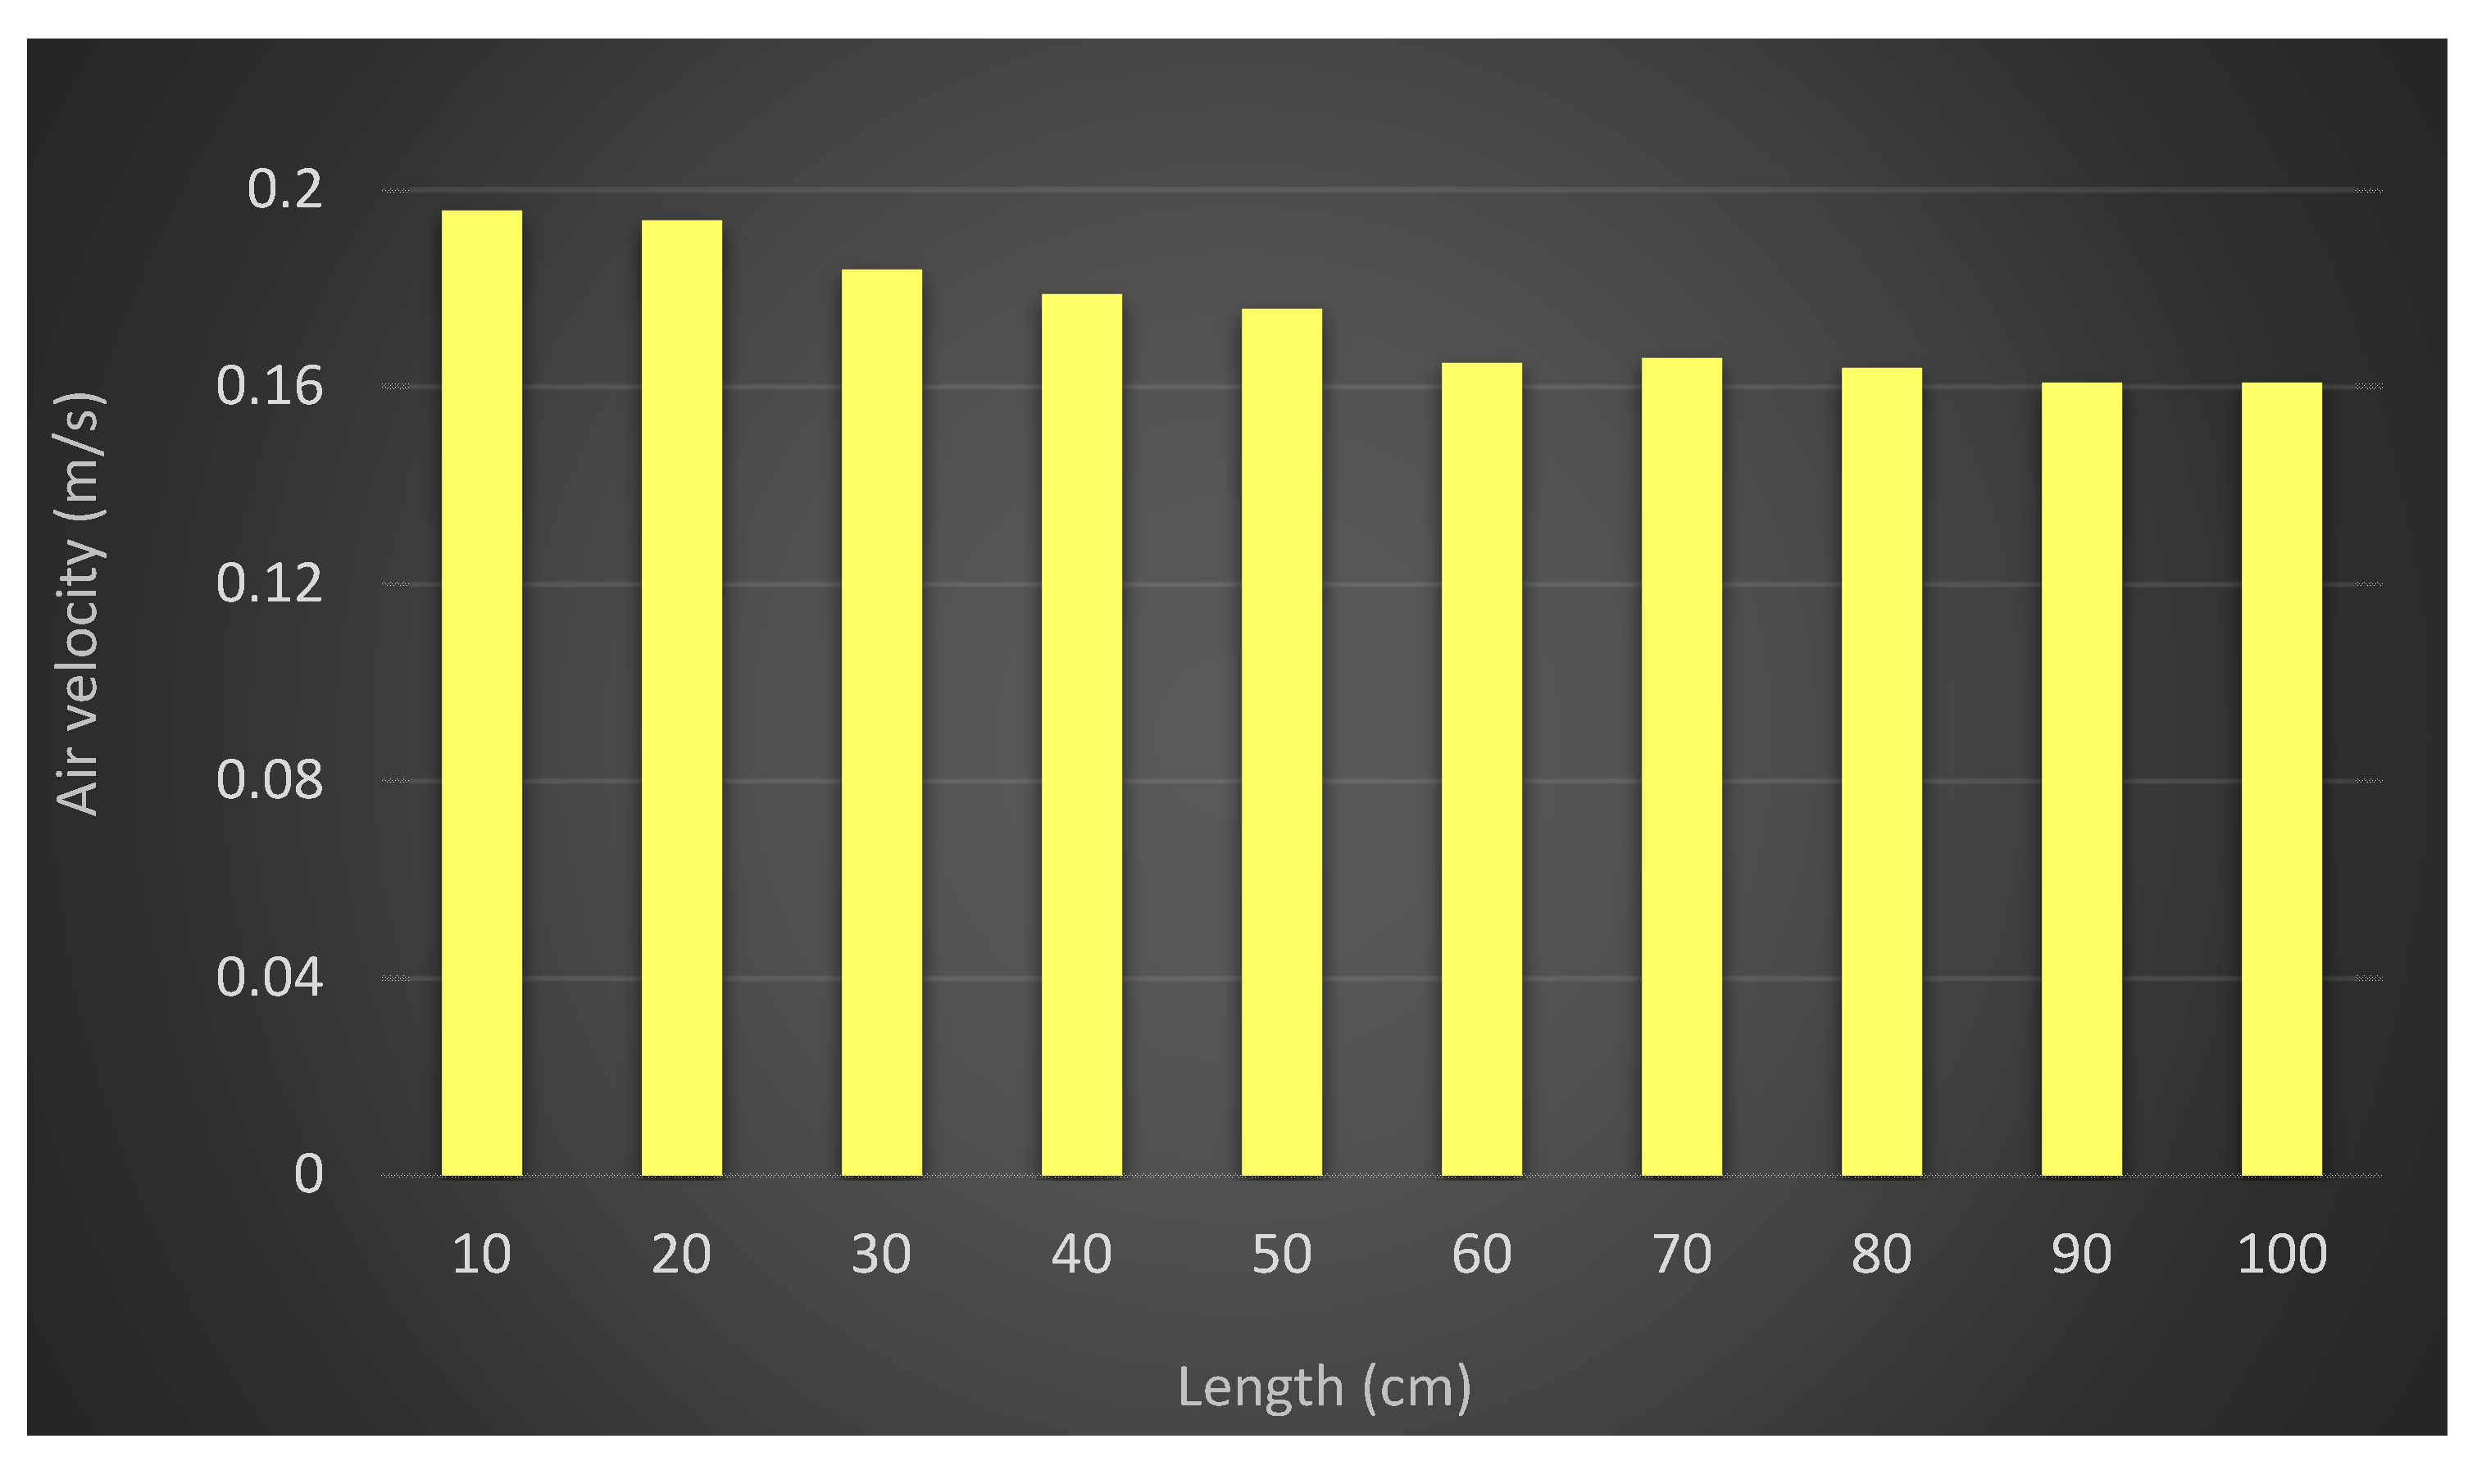
4.2.1. Air Flow in Inlet

Evaluation and comparison of the ventilation performance among various wing wall configuration were made by calculating the airflow velocity average inside the inlet channel as it can manifest the windcatcher’s capability to provide buildings with fresh air.
The simulation outcomes for TWIW’s inlet air velocity in various wing wall lengths from 10 cm to 100 cm with 10 cm increments in outdoor wind speed of 2.5 m/s is portrayed in Figure 13.
From the above graph, it is revealed that the air velocity pattern demonstrates a steady decrease from model with 10 cm wing wall length to 100 cm; thus, the maximum (0.79 m/s) was observed in 10 cm. However, the difference between maximum and minimum was less than 12%.
Figure 14 displays the air flow rate and air flow rate per square meter of TWIW with different wing wall lengths. The air flow rate and inlet air velocity had similar pattern since the air flow rate is considered as a function of inlet air velocity. In such a way, as the length increased, the air flow rate decreased and reached its minimum value at 100 cm (698 L/s and 29.1 L/s/m2).
The following is an equation that calculation of the minimum ventilation rate (VR) in ASHARE standard 62.1 was based on:
VR = (A × Od × Rp) + (A × Ra)
where A reprents the ventilated area; Od, the density of occupants as persons per m2; Rp, the needed ventilation rate for a single individual as L/s per person; and Ra, the needed ventilation rate for one square meter as L/s/m2. Rp and Ra could be adopted for each ocupancy category type such as office in the ASHRAE standard 62.1 [51]. In case the model represents a small classroom (A = 24 m2, Od = 0.65 persons/m2, RP = 3.8 L/s per person, Ra = 0.3 L/s per m2), the minimum VR is:
(24 × 3.8 × 0.65) + (24 × 0.3) = 68 L/s
Comparison between the TWIW’s air flow rate and minimum requirement of ASHRAE 62.1 shows the TWIW’s potential to supply ten times more than standard requirement. It implies that a single TWIW is capable of fresh air provision for larger area and meet the standard as well.
The TWIW’s air change rate for several wing wall lengths is displayed in Figure 15. The air change as well as the air flow rate was directly associated with inlet air velocity. Hence the maximum air change rate (39.5 1/h) and minimum (34.9 1/h) occurred in 10 cm and 100 cm length respectively.

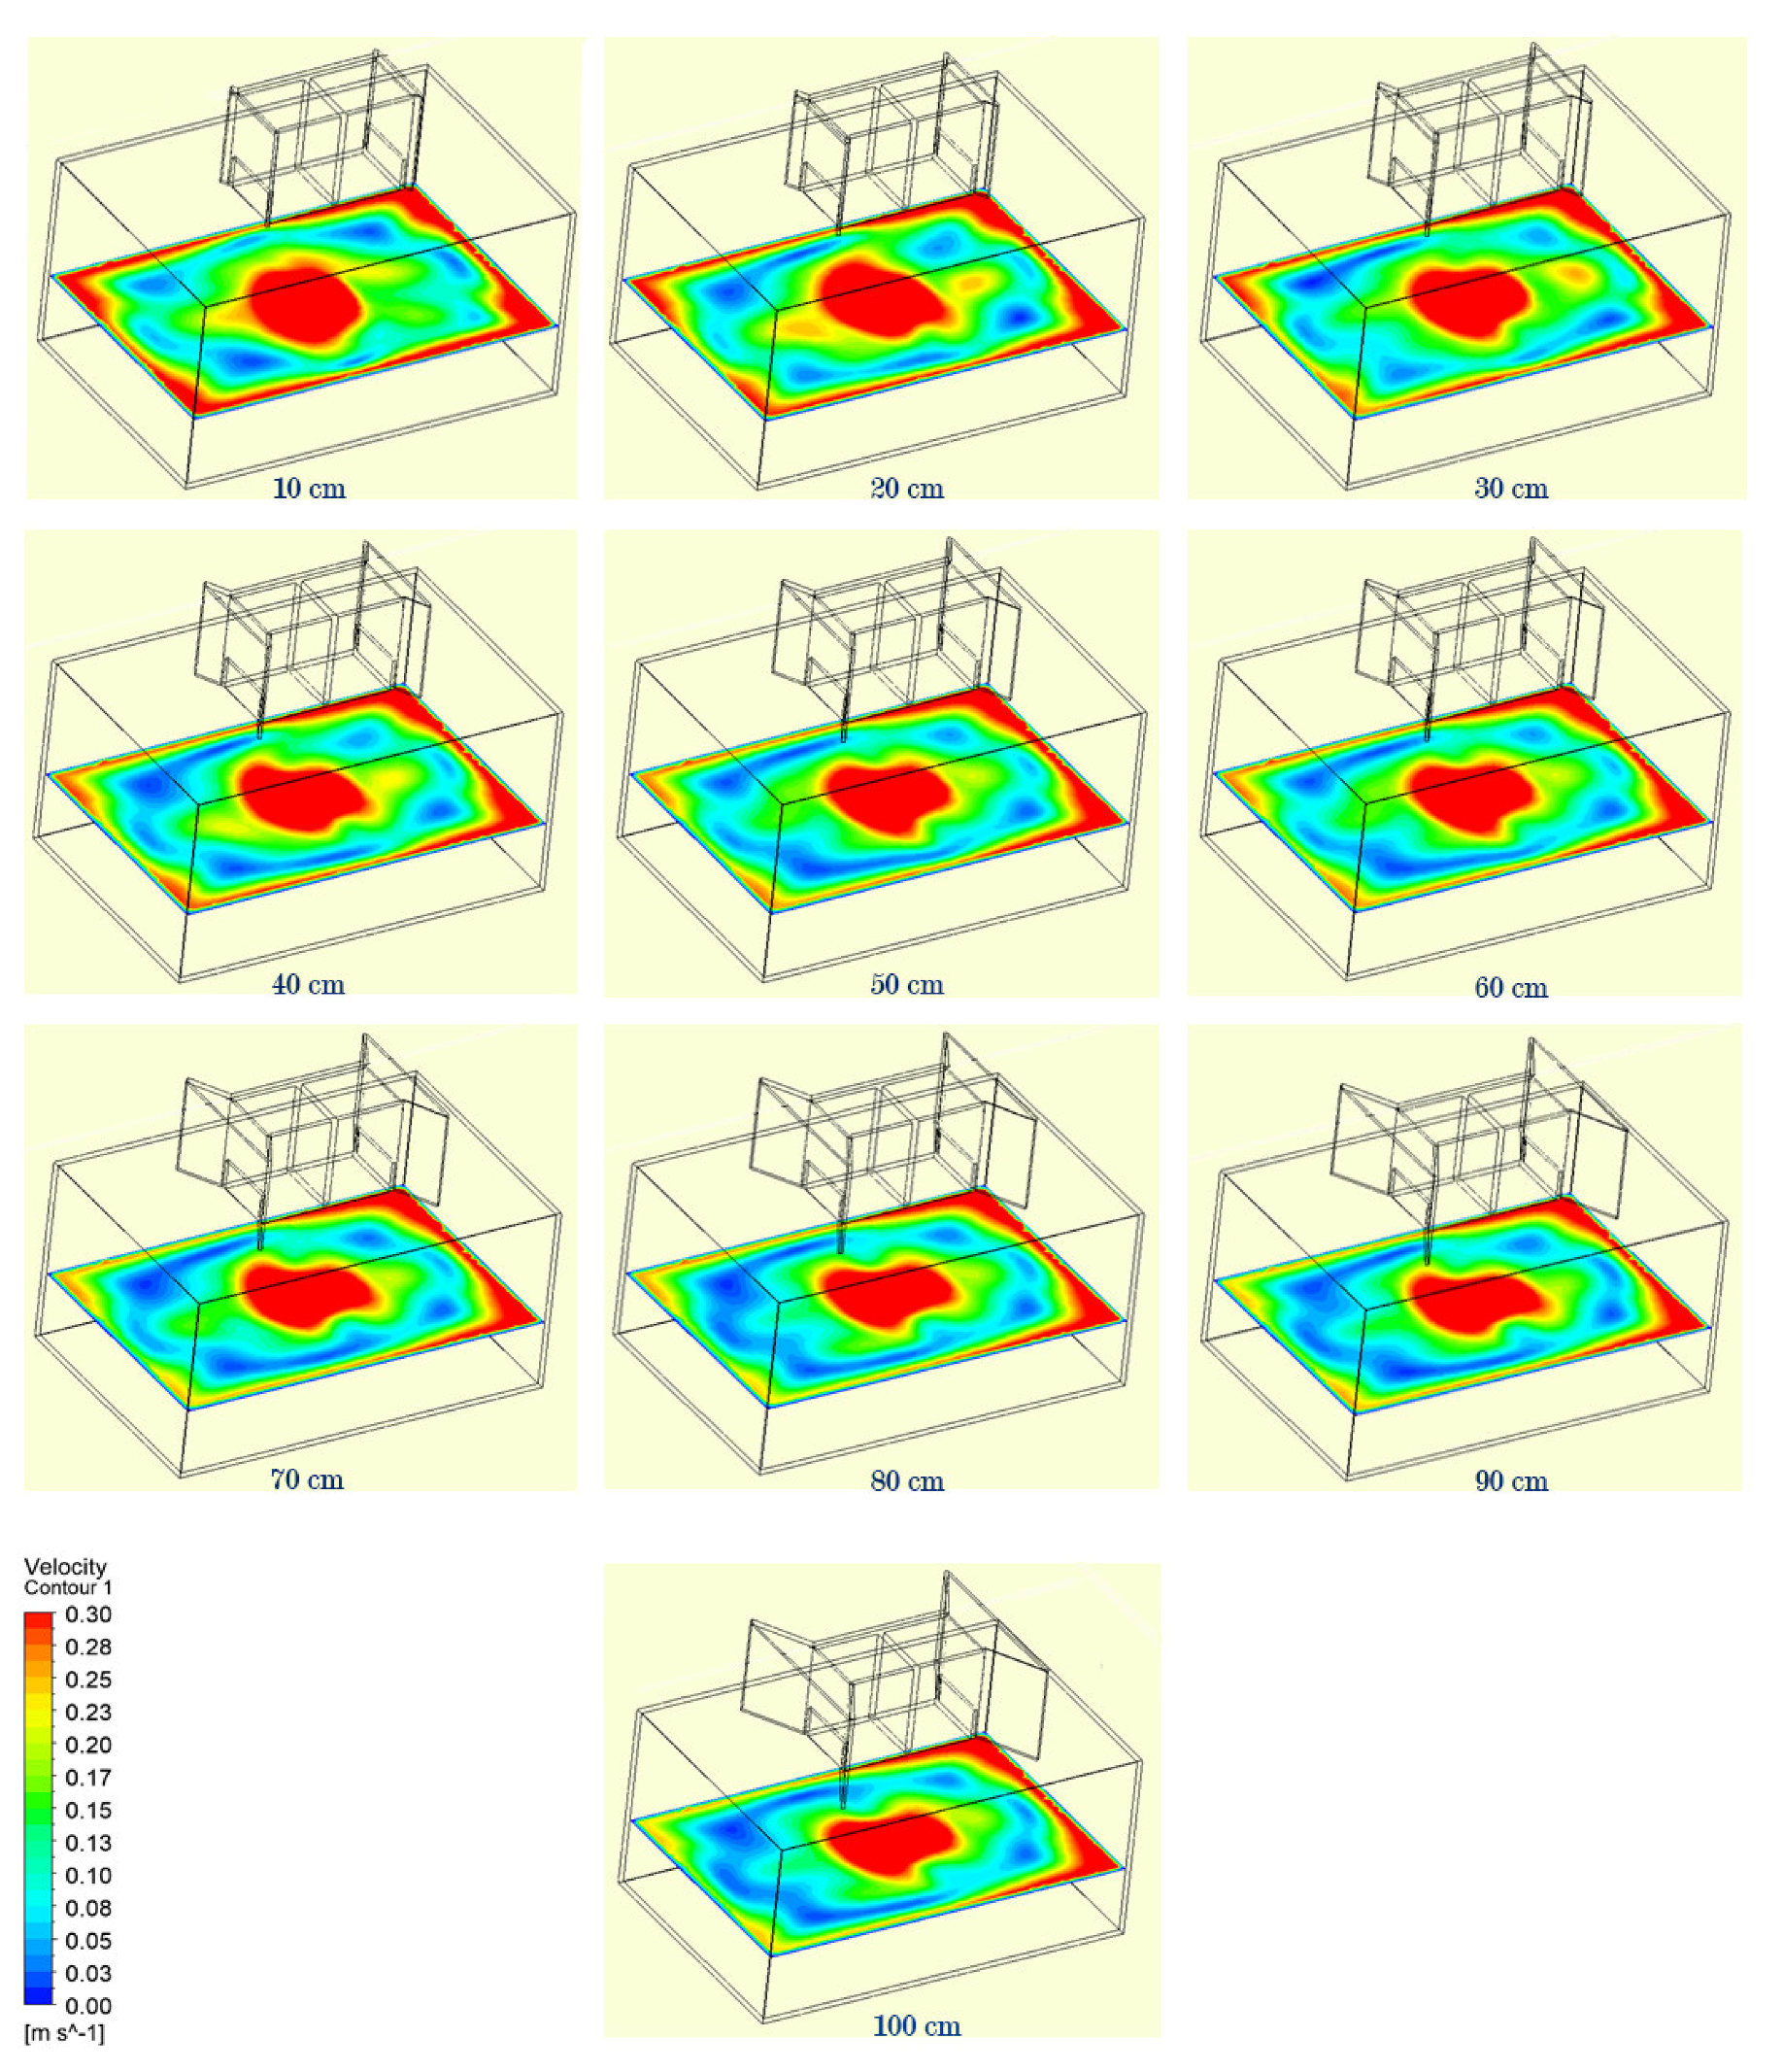
4.2.2. The IAQ Parameters on Horizontal Plane
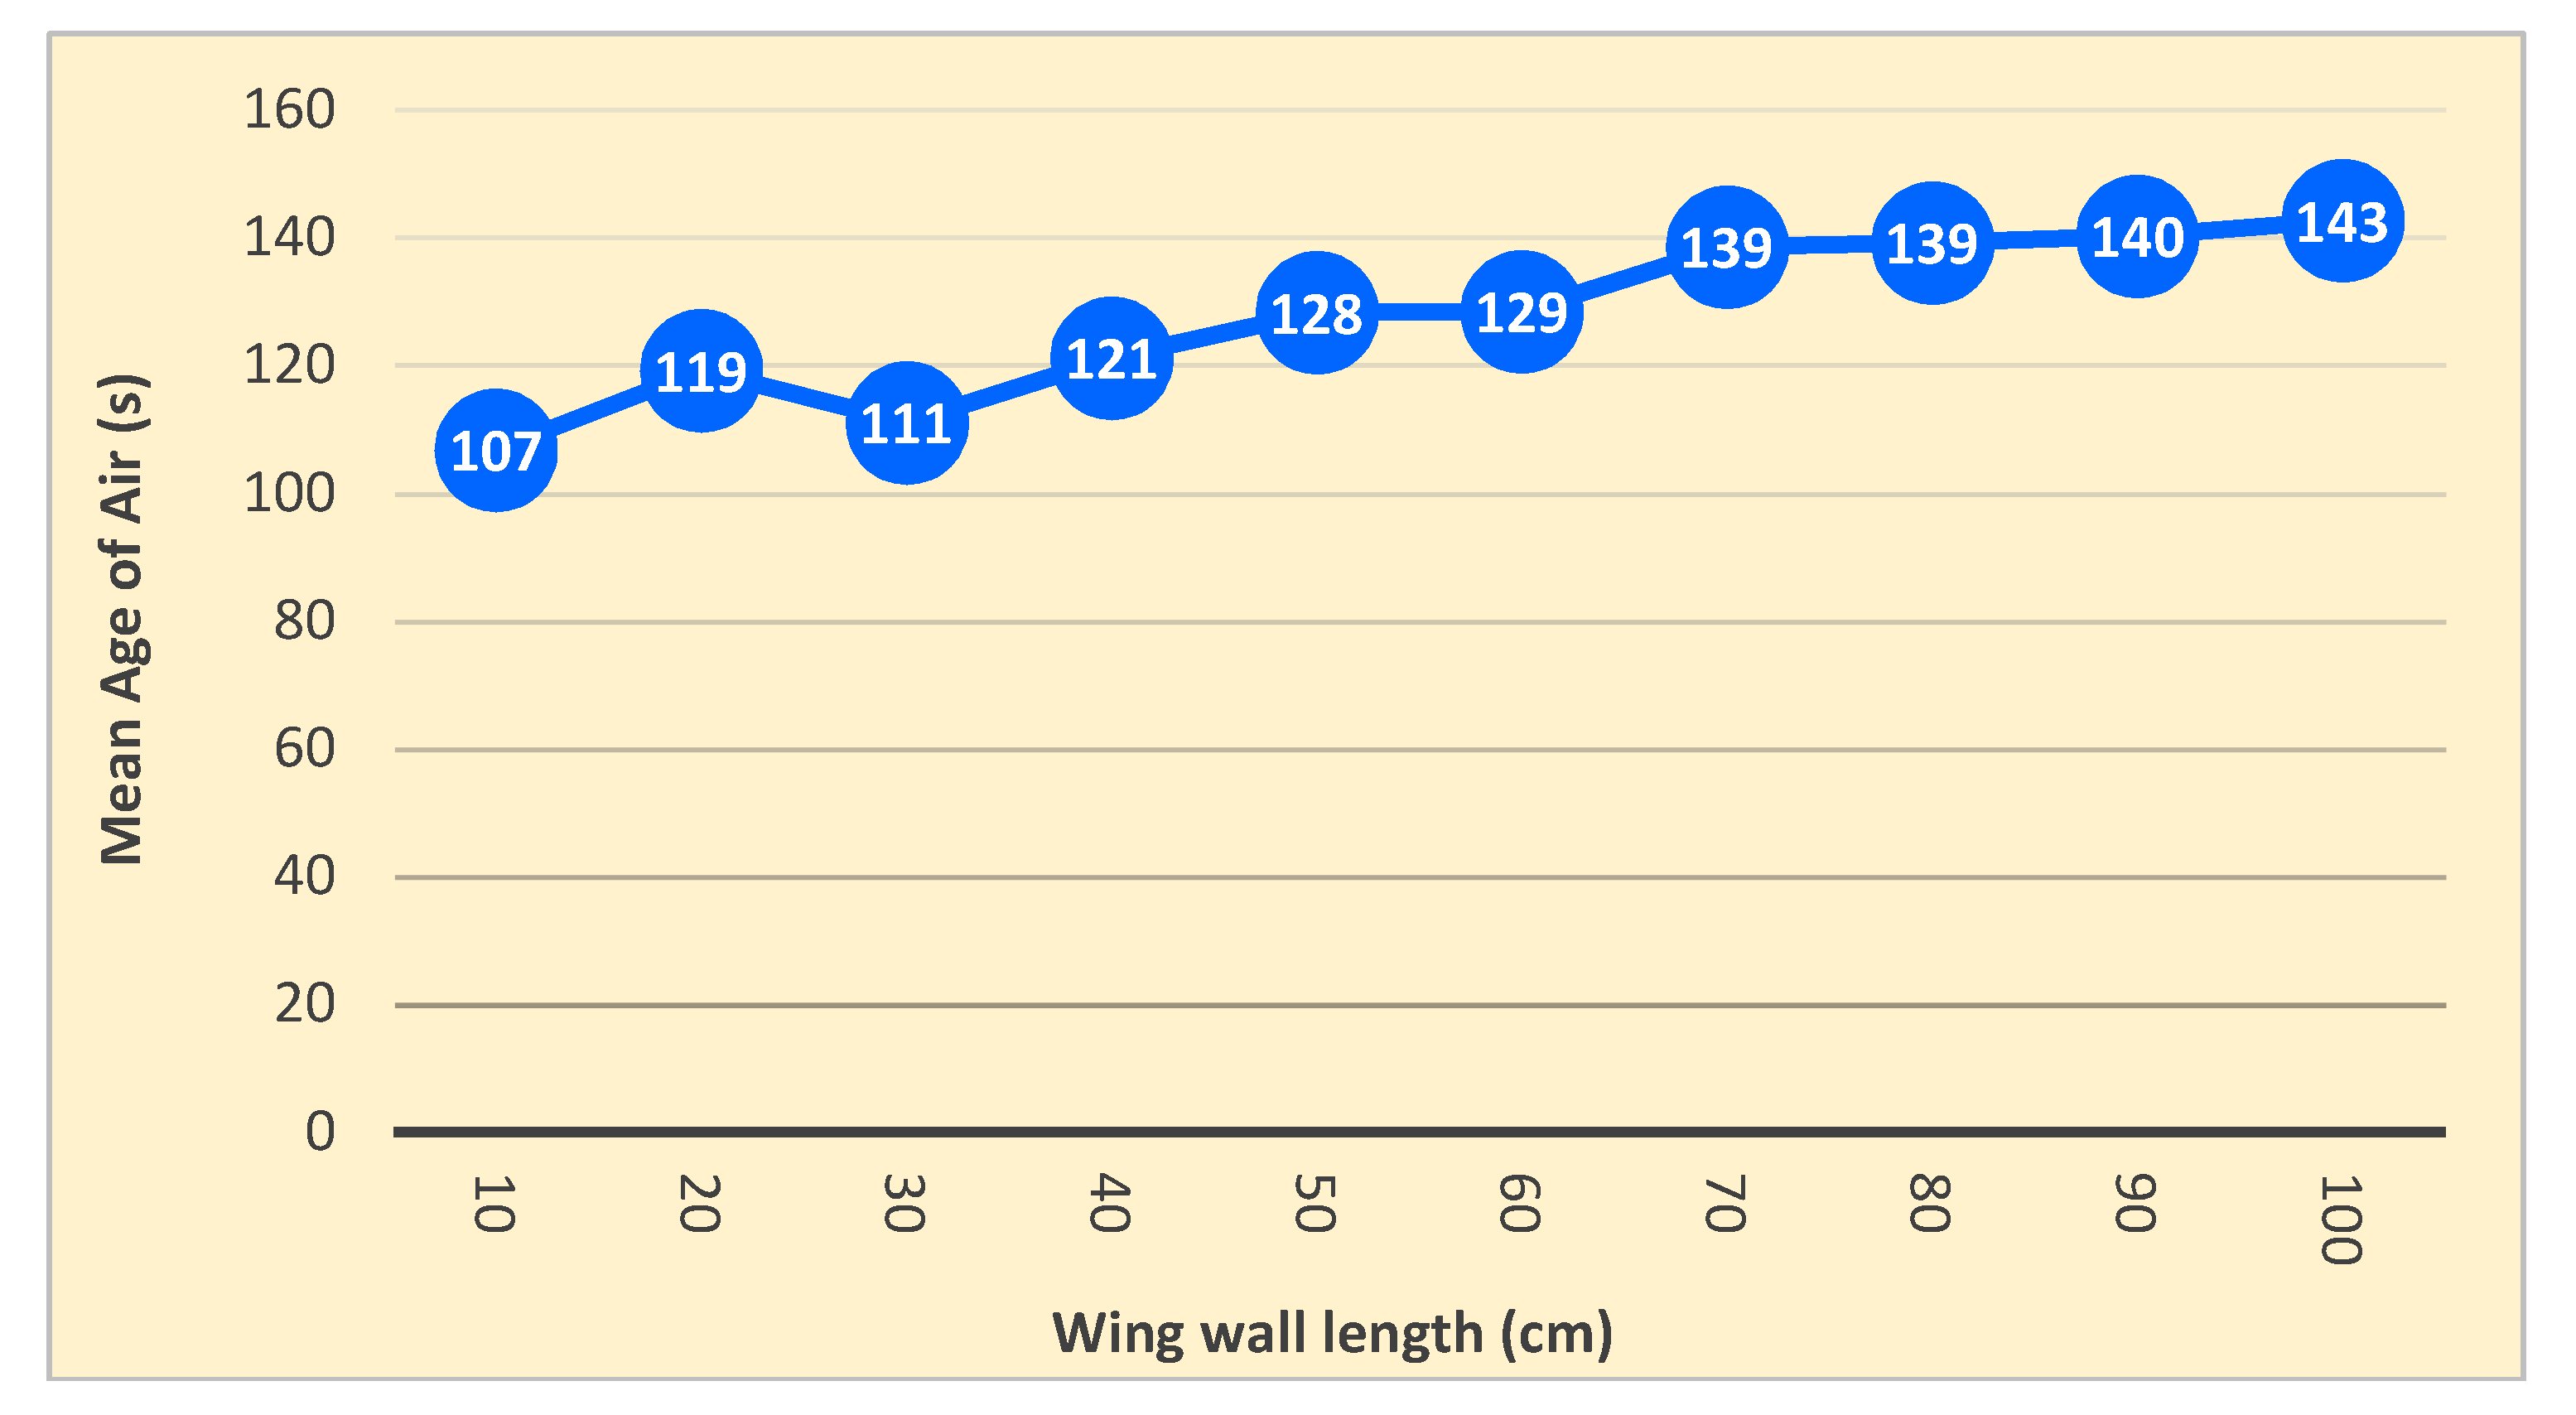
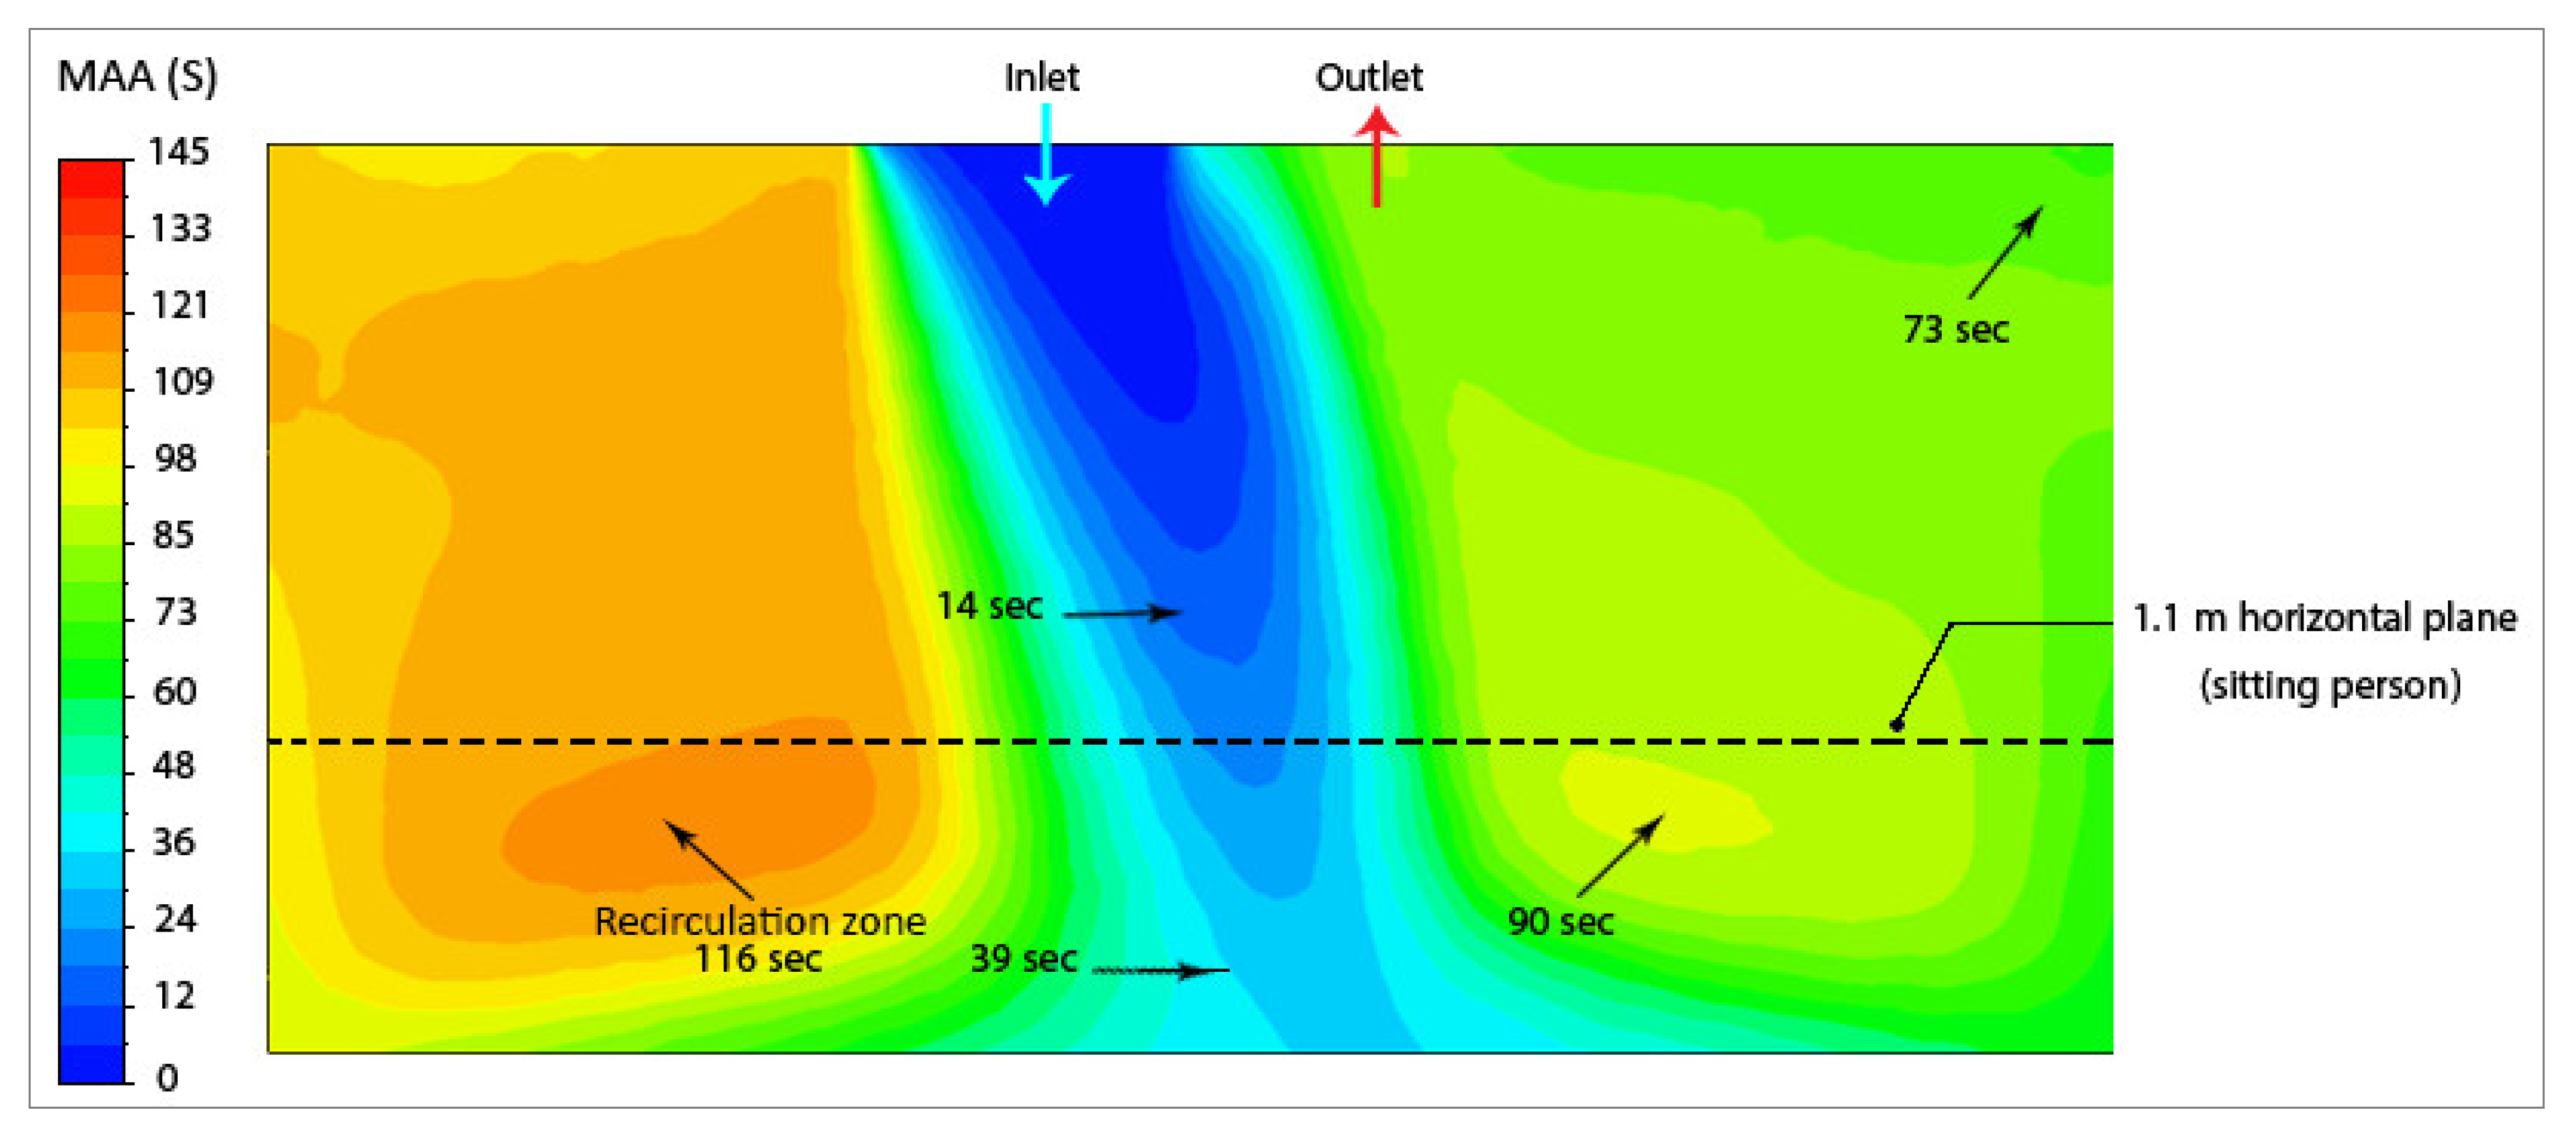
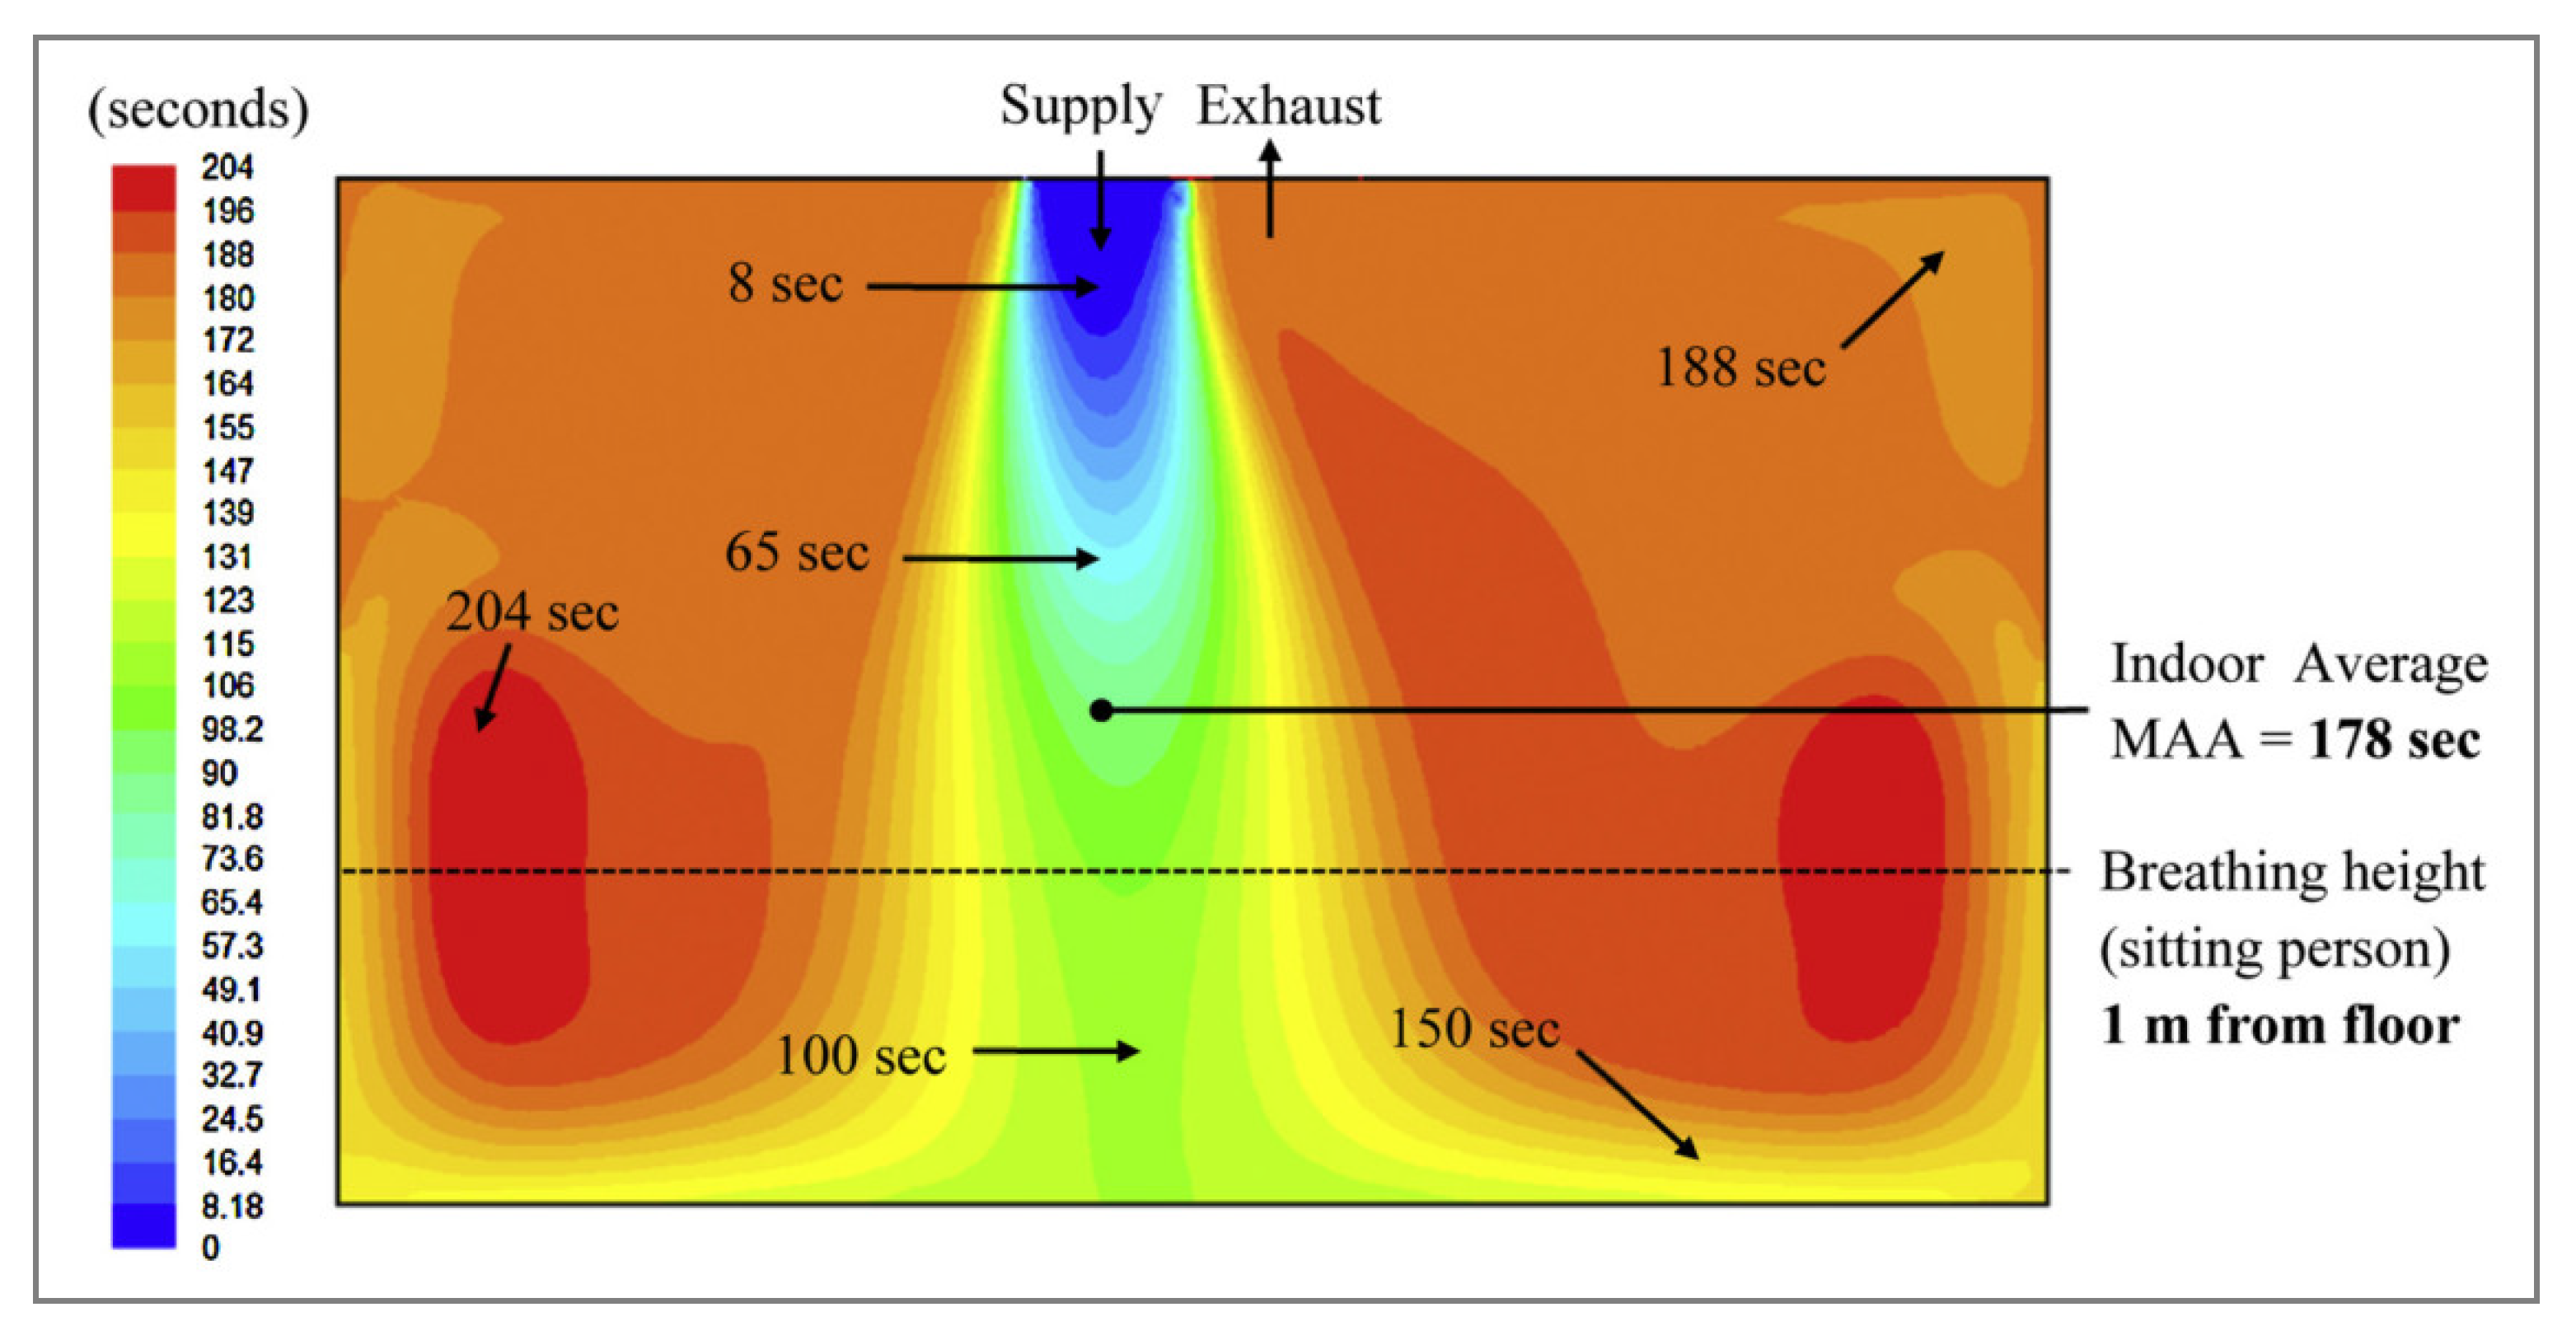
In this section, the IAQ parameters including velocity, mean age of air (MAA) and air change effectiveness (ACE) are assessed in the in 1.1 m horizontal plane as the breathing height at sitting position (the blue plane in Figure 12) with respect to the American Society of Heating, Refrigerating and Air-Conditioning Engineers (ASHRAE) standard. The air velocity contours inside the occupied zone were plotted in the 1.1 m horizontal plane in Figure 16.
The air velocity scale is illustrated on the left of the Figure 16. The colors of the domain contour were based on the range of air velocity, 0 to 0.3 m/s. The highest air velocity zone is depicted by the red color while the lowest air velocity is represented by the dark blue.
The line graph in Figure 17 illustrates the average of air velocity in 1.1 m horizontal plane in different length from 10 cm to 100 cm. Compared to inlet, Same behavior of the air flow in the horizontal plane can be seen so that there is negative (but weak) relationship between the length of wing wall and air velocity in the horizontal plane. The negligible 0.04 m/s difference between maximum and minimum values of the graph, proves that increase in length has no notable impact on the air velocity in horizontal plane.

Mean Age of Air

The ventilation quality and identification of poor ventilated spaces are assessed by mean age of air (MAA), which is described as the elapsed time since the air enters an indoor environment. The present study employed the approach explained by [47,52] to calculate the MAA through a numerical method that utilizes the CFD code Fluent.
Figure 18 indicate the MAA calculated values in 1.1 m horizontal plane at different wing wall length in which lower values appear to be more desirable. The maximum MAA was 33% higher than the minimum MAA in 10 cm length. It seems that the MAA become greater by increase in length of the wing wall which implied that smaller area of stagnant air existed at lower length.
Figure 19 depicts the MAA in the vertical plane (in the centre of room) of 10 cm model. The distribution of MAA was in concert with airflow pattern inside the room with gradual increase from the inlet along the supply jet, then getting to the maximum value in the zone of recirculation (116 s). The lowest MAA value was observed in the center of the area (blue space below the inlet) which represents a fresher air there. By contrast, high MAA values exist in areas with stagnant air or poor ventilation. At the height of 1.1 m (a sitting person’s breathing height), MAA values in windcatcher-ventilated space ranges between 30 s (centre) and 116 s.
Comparing the MAA results of windcatcher with previous studies can better reveal its performance and improvement. For instance, the research conducted by Calautit and Hughes [18] evaluated a four sided windcatcher (with 100 × 100 cm2 cross section, same as current research) placed on the top of a 5 m × 5 m × 3 m room at 3 m/s outdoor wind speed. Although the wind speed in their study was 25% higher, as Figure 20 demonstrates, the MAA generally shows relatively higher values in the vertical plane. For, instance, the MAA passed the 200 s in recirculation zone, which is 90% higher than TWIW performance. Moreover, further areas were affected by recirculation and stagnant zone on both sides of the room.
Likewise, Montazeri [47] investigated one sided and two sided windcatcher with 1.5 m height and cross-section of 1 m × 1 m in a 6 m × 8 m × 3 m room at 3 m/s wind speed. He found that in the optimum configuration, the maximum of MAA in the vertical plane (same as Figure 19) reached to 140 s which is still 20% more than TWIW results.

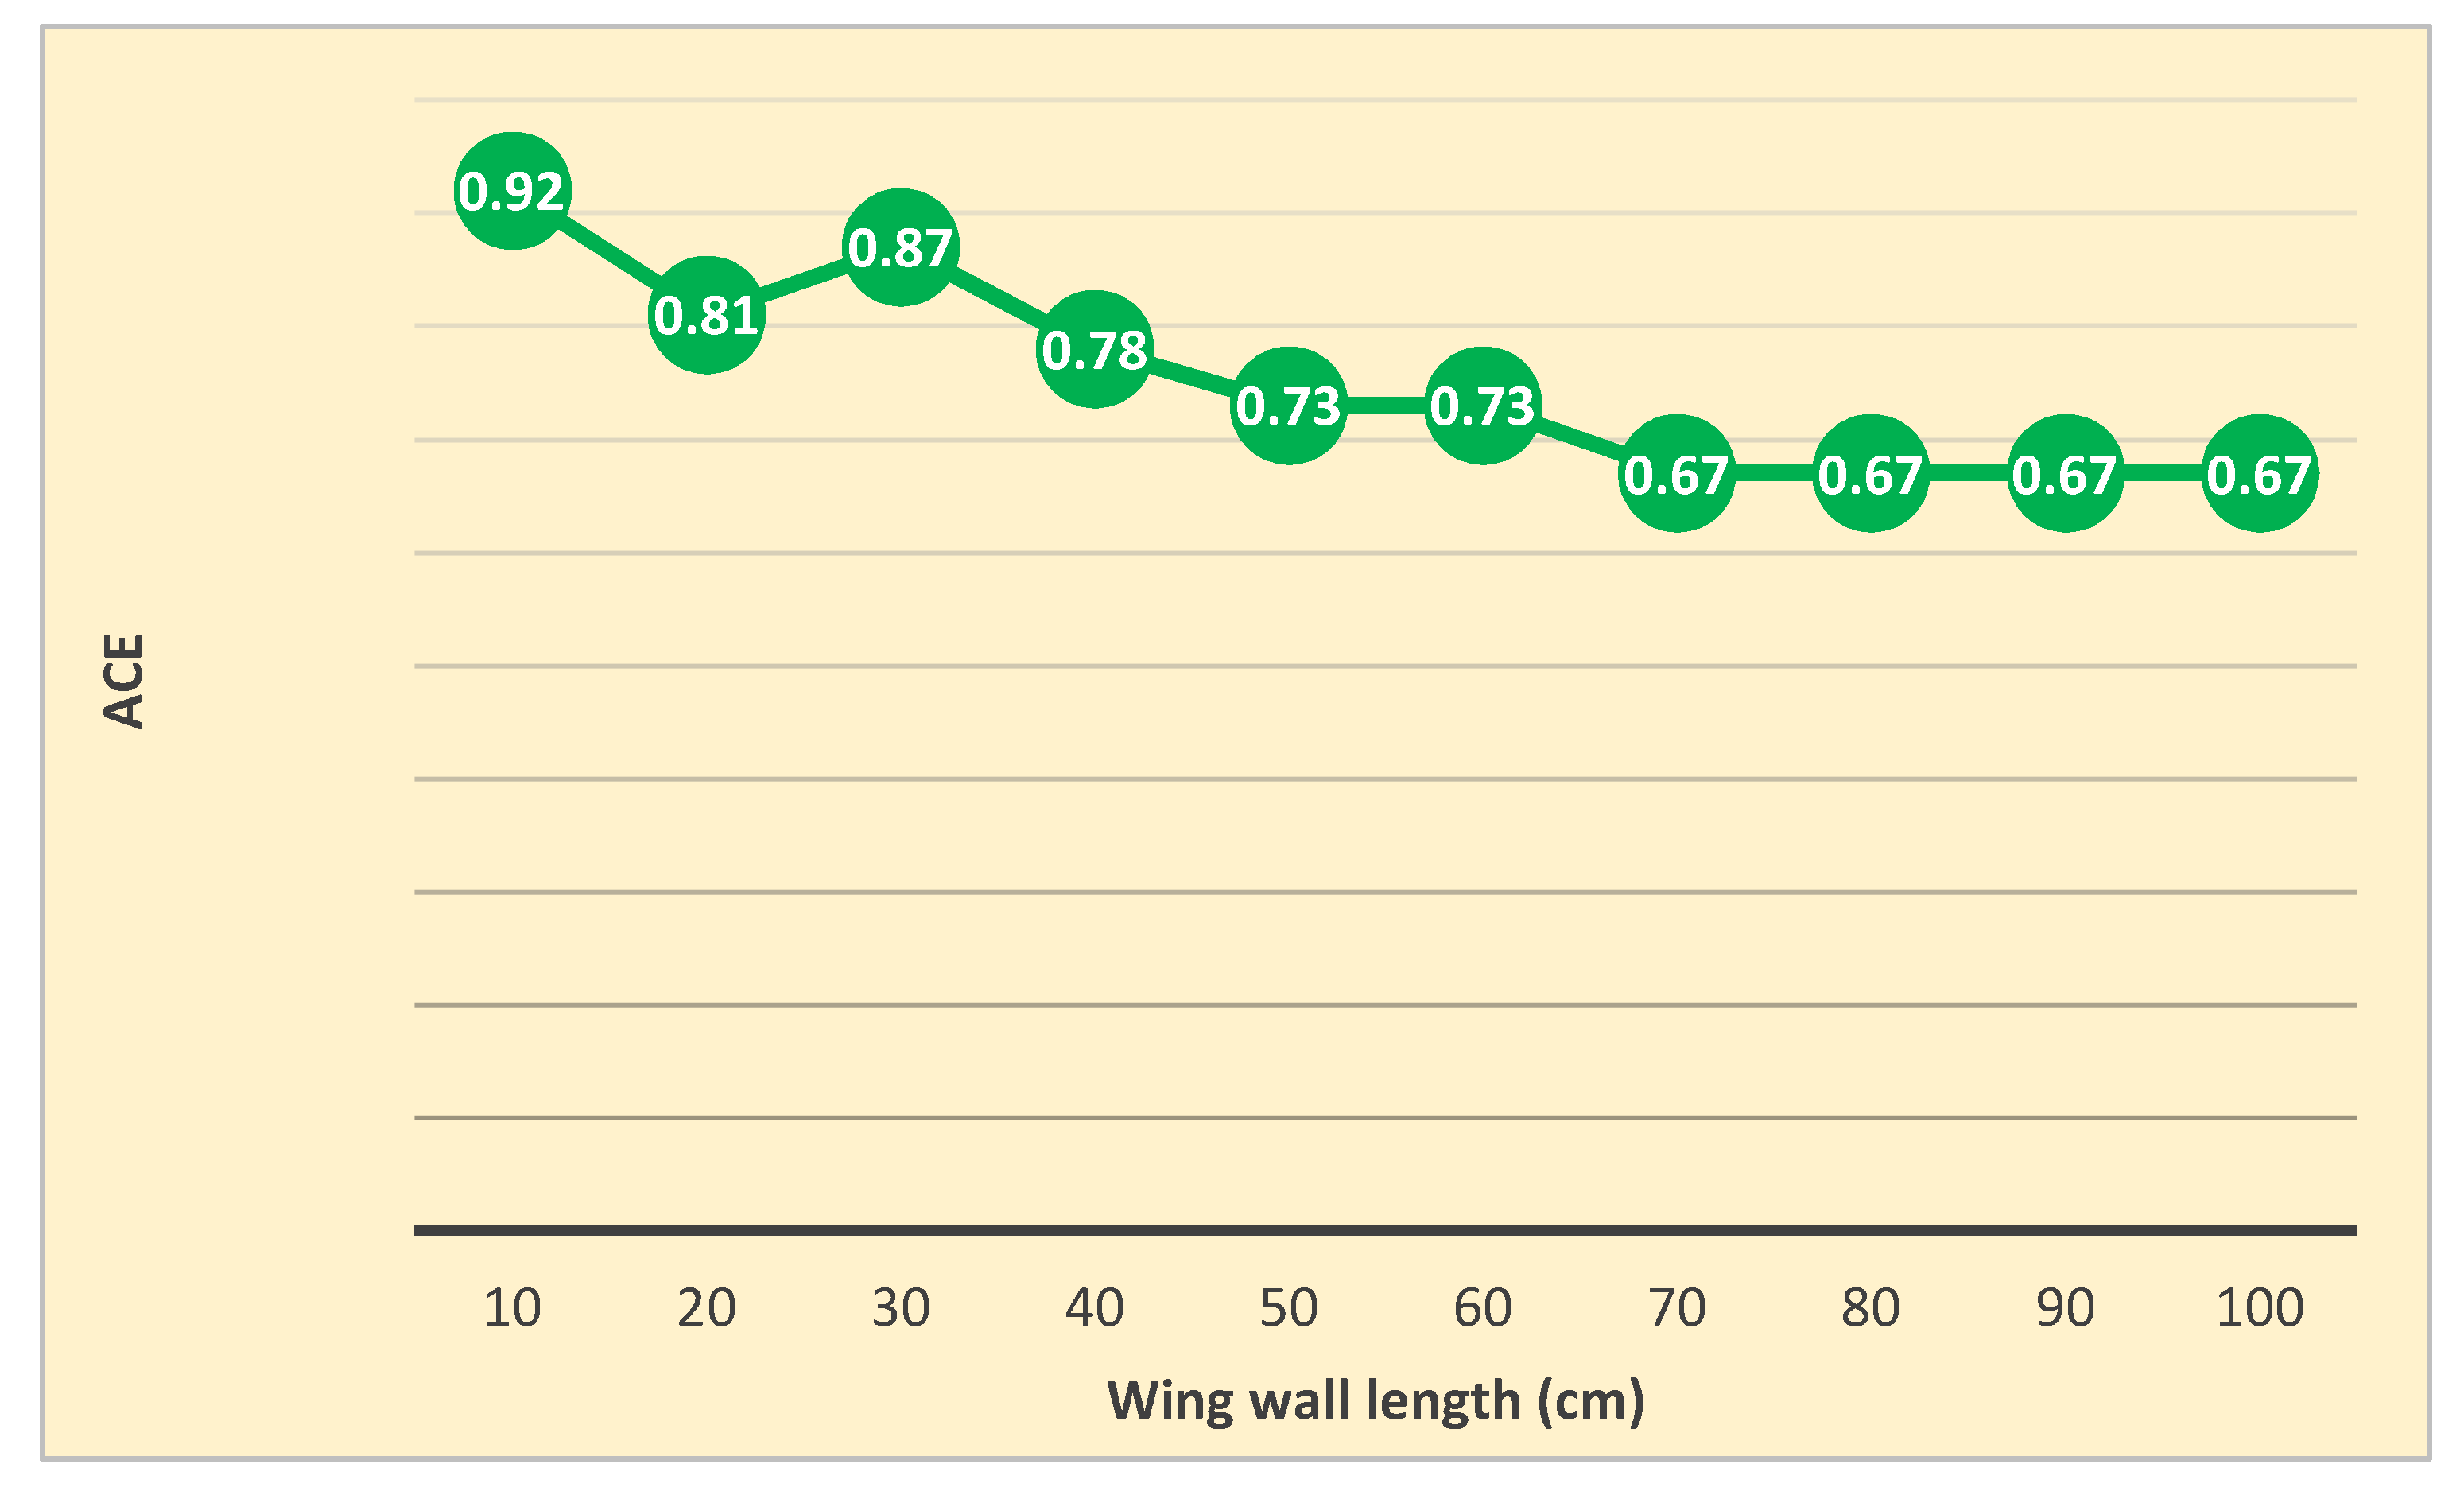
Air Change Effectiveness

Air change effectiveness (ACE) is defined as the ratio of a nominal time constant to a mean age of air [52]. This parameter yields a measure of the air distribution at the breathing height and values close to unity are indicators of perfect mixing of air distribution. A ratio of the room volume (6 × 4 × 3 m3) to the flow rate of supply air volume (m3/s) to the room is the nominal time constant. The relative air change effectiveness can also be described as the criterion of efficiency of supply air utilization ventilating the environment. In case of perfect mixing of the air in a space, the ACE value for the environment and the local ACE value for every spot of the environment will be 1.0. ACE values below 1.0 represent the air distribution being less than perfect mixing and values greater than 1.0 are indicators of better ventilation. The ACE calculated values at 1.1 m horizontal plane shown in Figure 21 ranges between 0.67 (for 80, 90 and 100 cm) and 0.92 (10 cm).

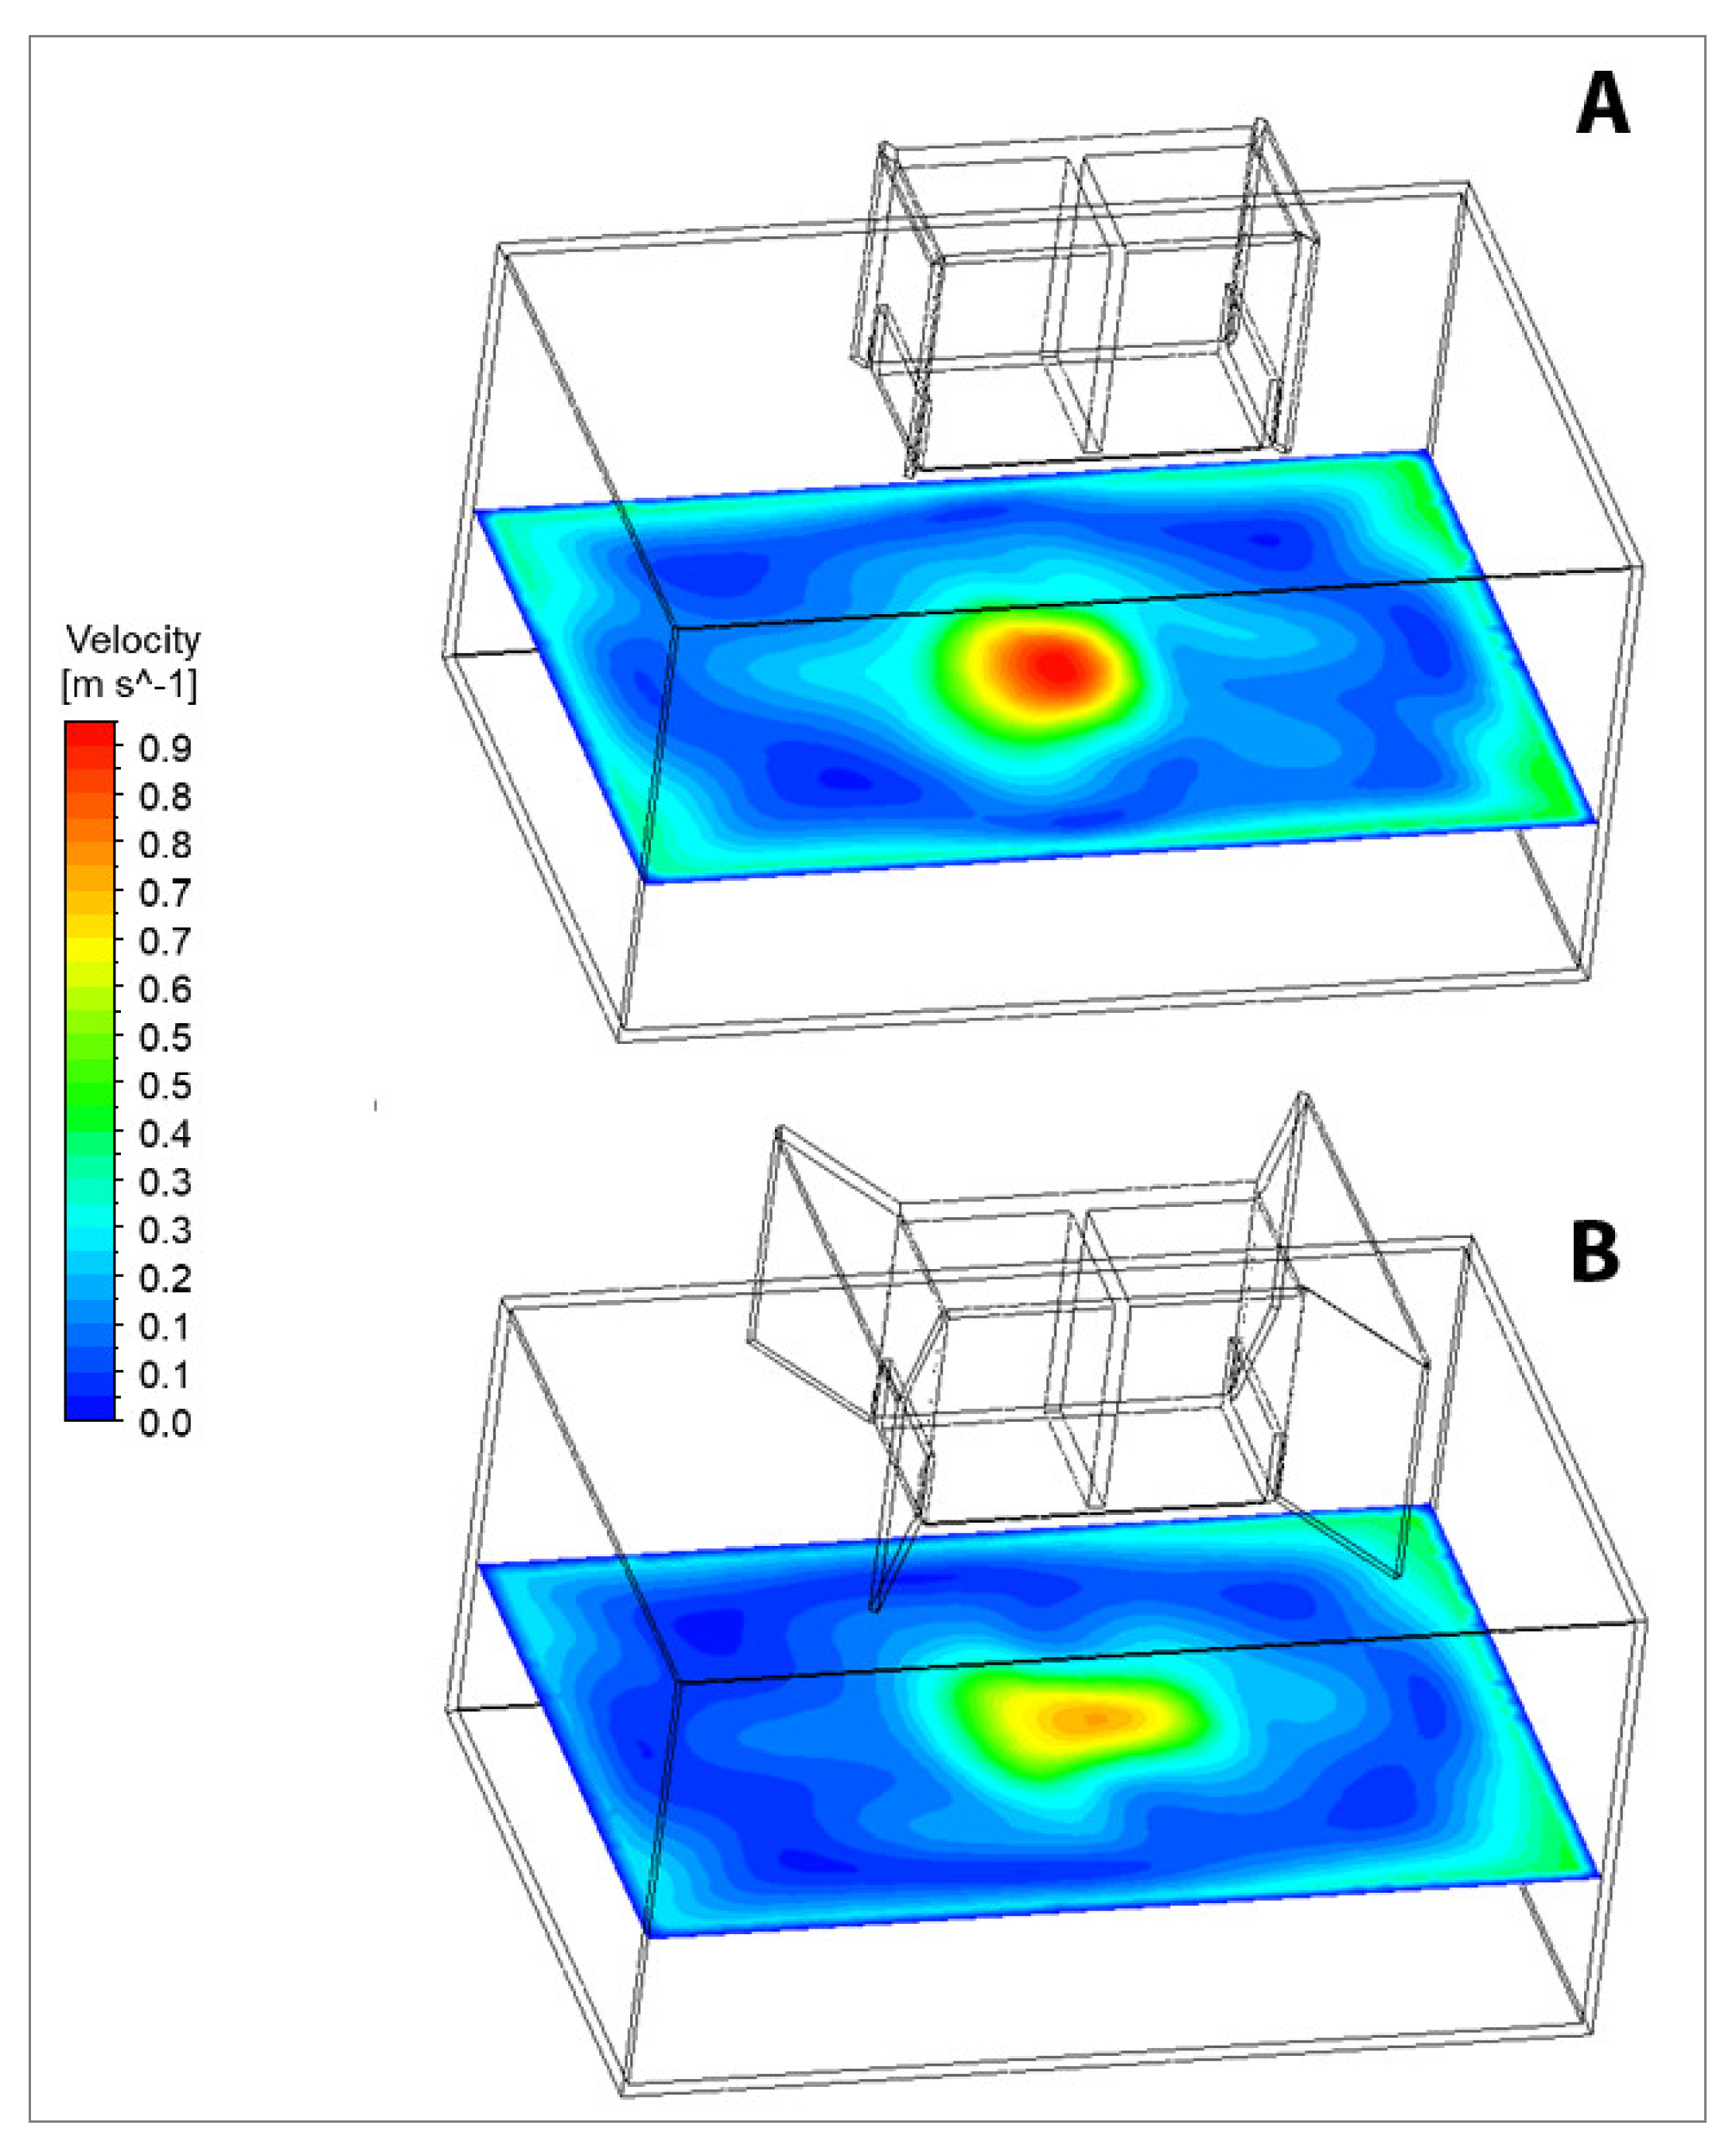
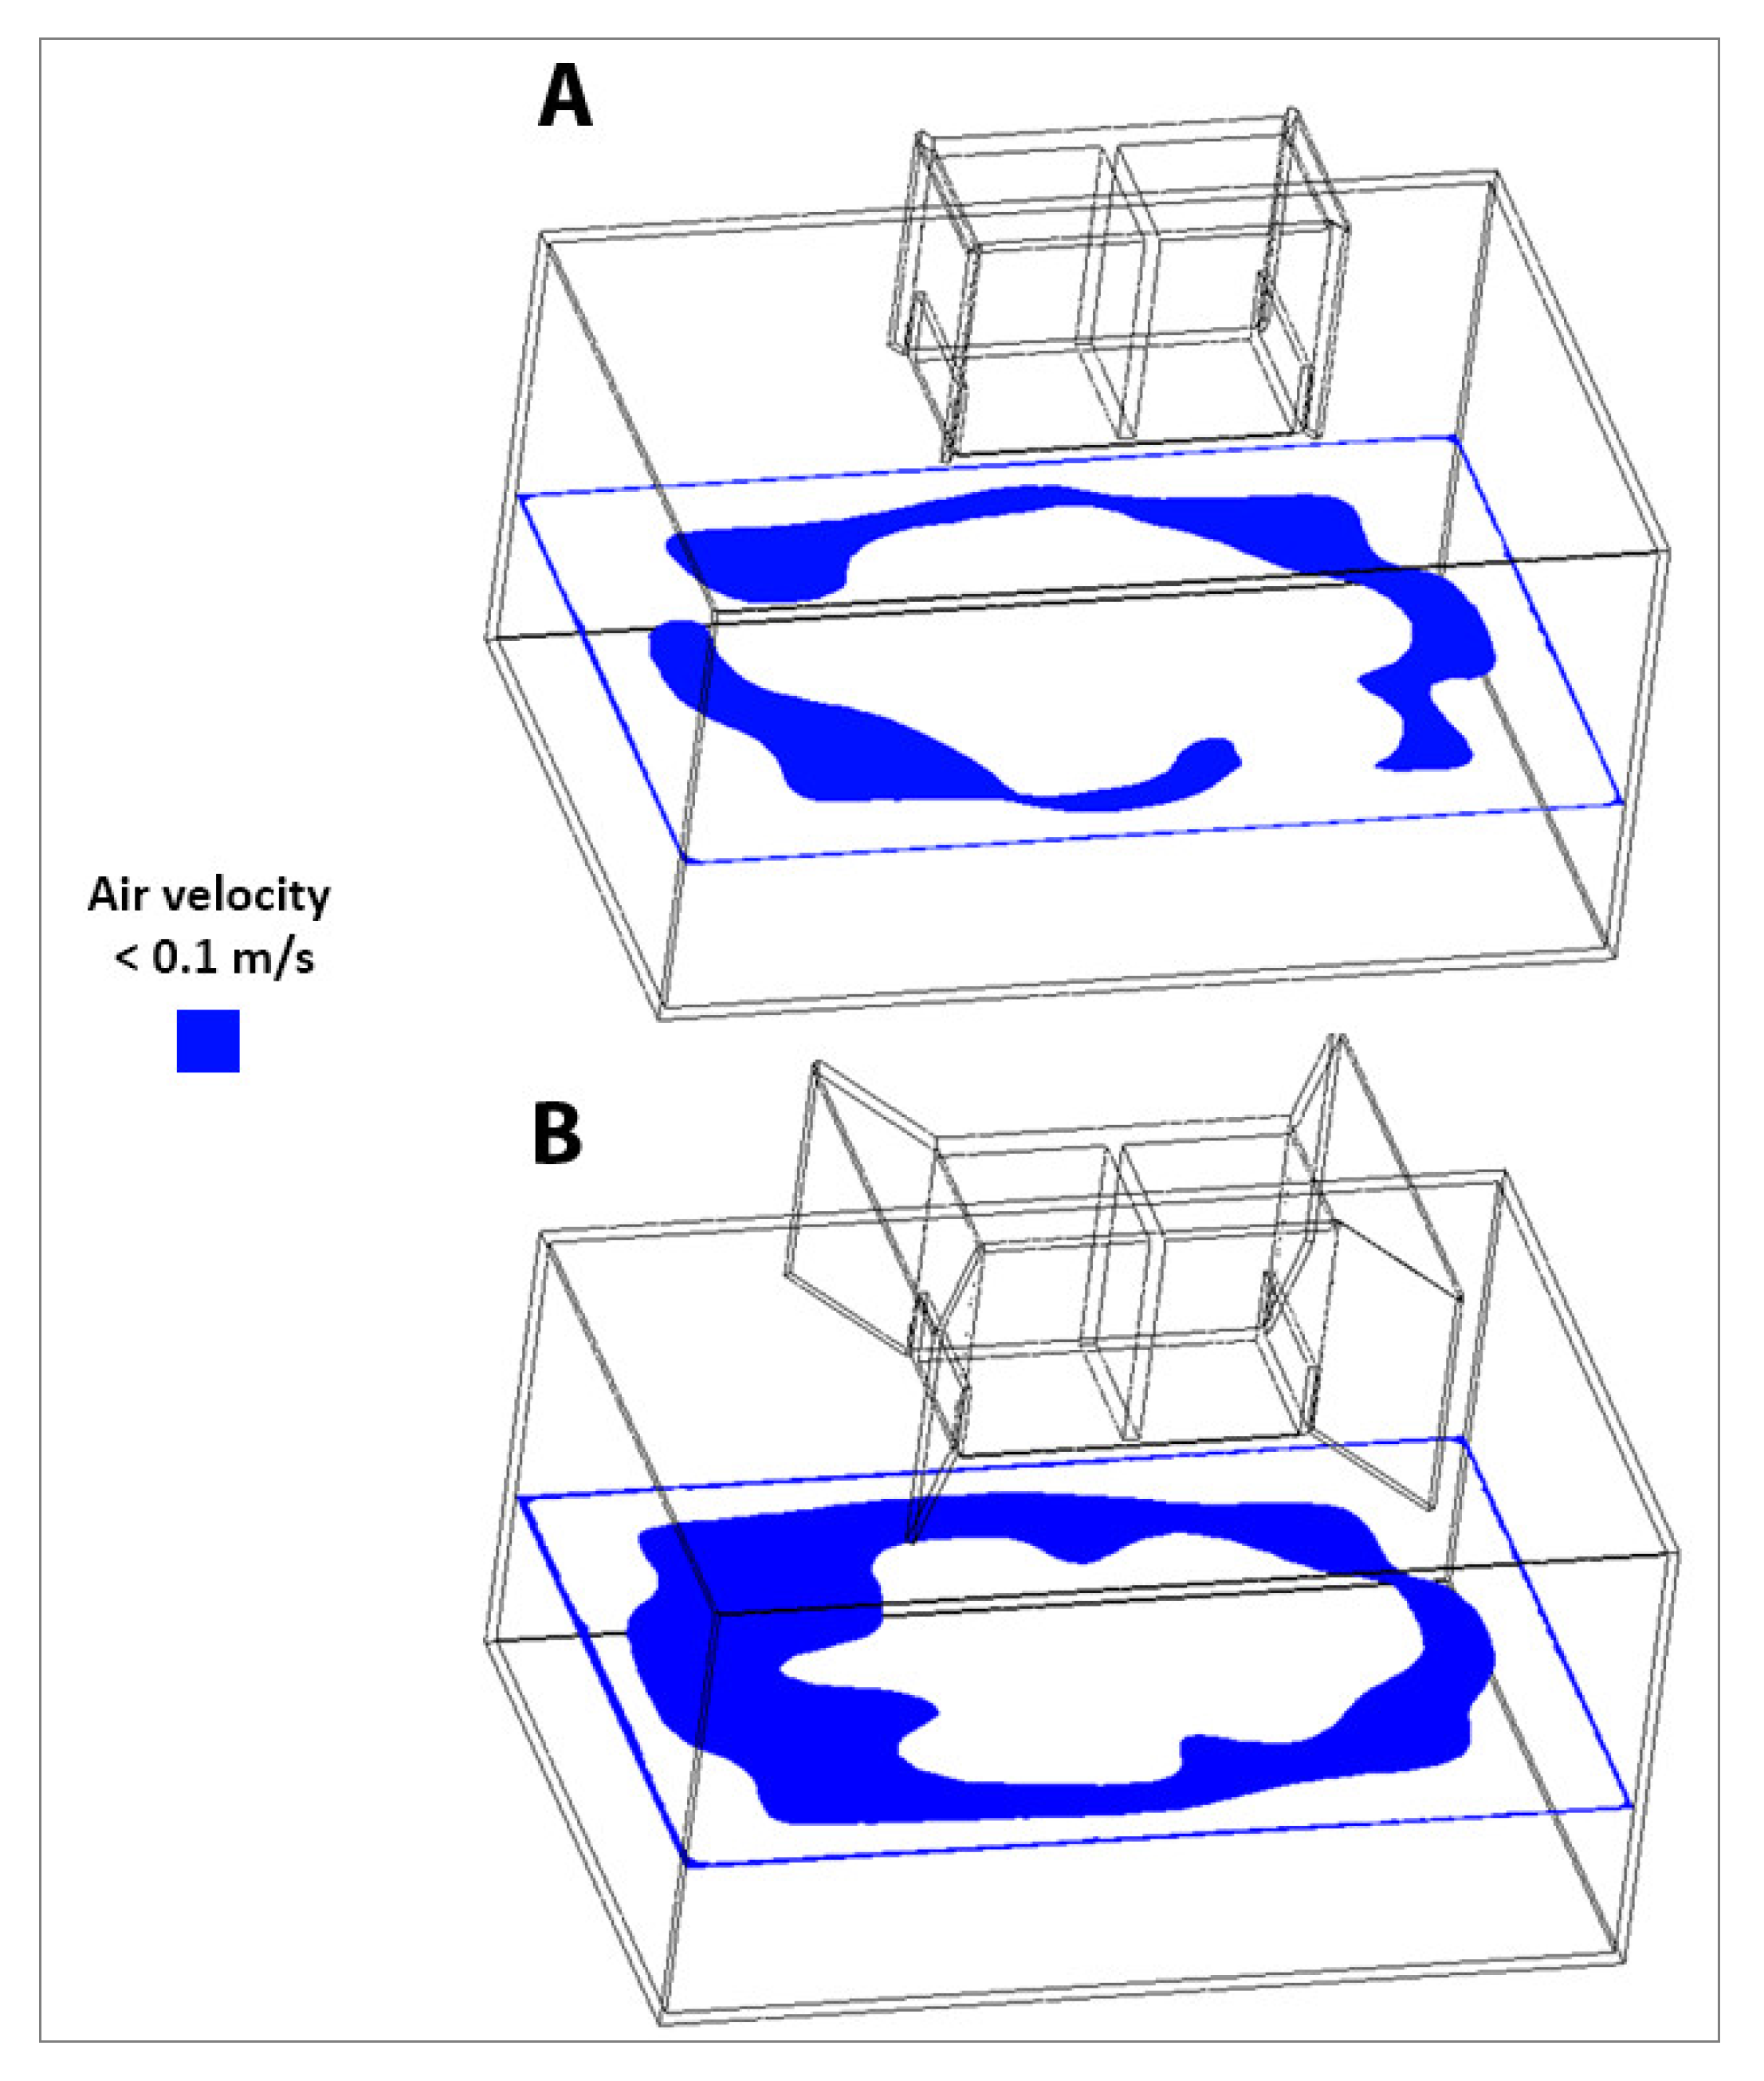
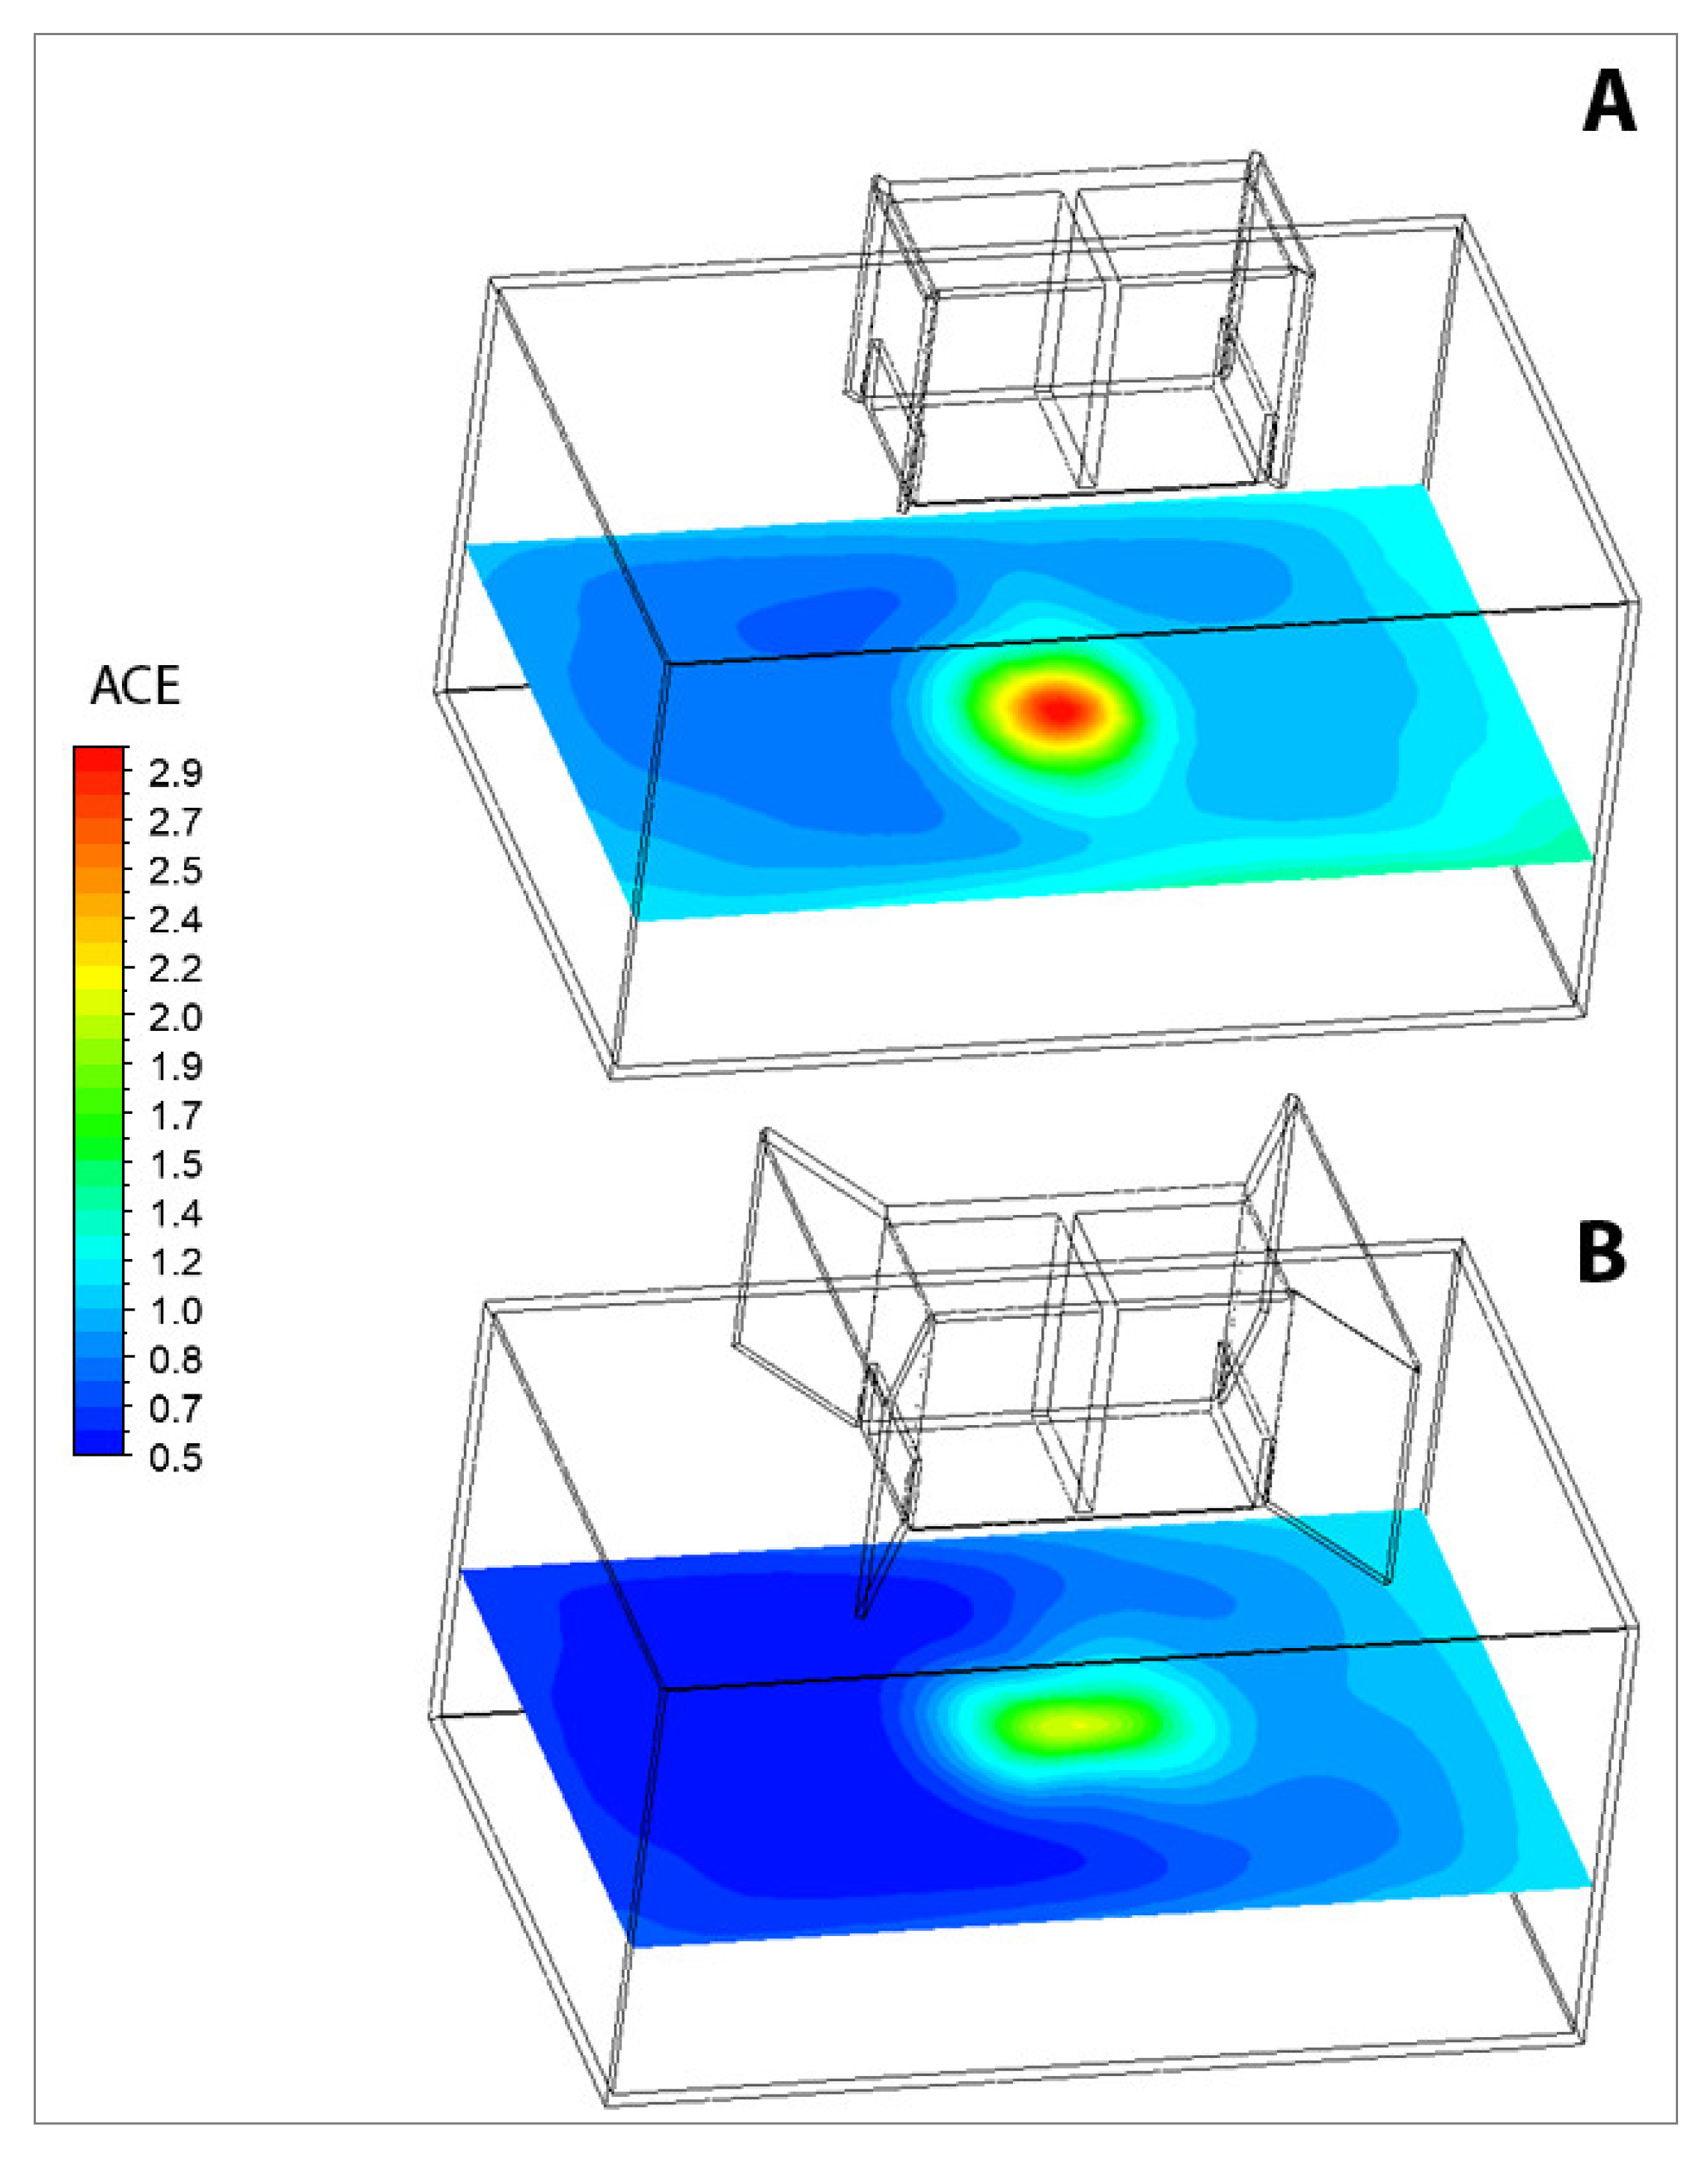
Comparison between 10 cm and 100 cm length

In this section a more detailed comparison between 10 cm model as the optimum configuration with highest IAQ performance with 100 cm model as the lowest is performed. Figure 22 compares the air velocity in horizontal plane between 10 cm model with 100 cm one. It is clear that bigger area was affected with higher air velocity in 10 cm model.
Figure 23 compares the dead zones between 10 cm and 100 cm wing wall in the horizontal plane which defined by Dehghan [38], as the spots of occupied area with zero or near zero air velocity, a common challenge in the ventilation systems. The isoclip contour with condition of velocity below 0.1 m/s was plotted in Figure 23 to represent the dead zone area and it is obvious that a bigger dead zone area exists in 100 cm model. The FLUENT function calculation used to determine the percentage of the dead zone area to the full area of the 1.1 m horizontal plane. The results showed the dead zone formed 24% and 38% of horizontal plane in 10 cm and 100 cm respectively.
Figure 24 compares the calculated values of ACE at breathing height (1.1 m) between 10 cm model and 100 cm which is ranging from 0.5 (in 100 cm) to 2.9 (under supply jet of 10 cm model). Generally, values of the ACE in 10 cm model in the occupied space are higher than the other, which proves that ventilation air has better mixing in the ventilated location.

5. Conclusions

Many parts of buildings consume energy, but more than two-thirds of this energy is consumed for heating, air conditioning (HVAC) and ventilation. Apart from the high energy expenditure, a significant share of indoor air quality problems might be related to air conditioning (AC) systems. One solution is to replace conventional AC with natural ventilation ones among which windcatchers are one the most famous natural ventilation systems. In this study a two sided windcatcher integrated with a wing wall (TWIW) was evaluated at low wind speed (2.5 m/s wind speed) by variation of the wing wall length.
The research consisted of a CFD simulation which was validated against the experimental data of previous studies and good correlation was observed. The results indicated that the average difference between CFD results and experiments was less than 7%, which is in an acceptable range and consequently, the simulation could be trusted. In the second step, this study focused on the length as the other deign factor of TWIW to see its influence on the indoor air quality factors such as air velocity, air flow rate and air change rate, mean age of air and air change effectiveness. Different wing wall lengths from 10 cm to 100 cm were assessed and it was found that the length did not have a considerable effect on indoor air quality factors; however, the findings highlighted that in the 10 to 20 cm range relatively higher values could be observed. The results of this study can be implemented in any low wind speed climate type such as tropical climate or dense urban areas.

Author Contributions

Conceptualization, P.N.; Methodology, P.N.; Software, P.N.; Validation, P.N. and J.K.C.; Investigation F.J.; Data Curation, P.N.; Writing-Original Draft Preparation, P.N. and F.J.; Writing-Review & Editing, J.K.C., F.J. and H.M.H.; Supervision, H.M.H., M.Z.A.M.

Funding

This research received no external funding.

Acknowledgments

The authors would like to thank the Advanced Building and Environment Research (ABER) center.

Conflicts of Interest

The authors declare no conflict of interest.

Nomenclature

Across-sectional area (m2)
ε turbulence dissipation rate
ρ density
μ molecular dynamic viscosity
ggravitational acceleration (m/s2)
Kturbulence kinetic energy
Hheight (m)
lkinematic viscosity (m2/s)
Llength (m)
Ppressure (Pa)
Pototal pressure (Pa)
Psstatic pressure (Pa)
qair density (kg/m3)
Qvolume flow rate (m3/s)
ReReynolds number
ttime (s)
TWIWtwo-sided windcatcher intertied with wing wall
ux-direction velocity
vy-direction velocity
wz-direction velocity
Wwidth (m)
X, Y, ZCartesian co-ordinates (m)

References

  1. Jazizadeh, F.; Ghahramani, A.; Becerik-Gerber, B.; Kichkaylo, T.; Orosz, M. User-led decentralized thermal comfort driven HVAC operations for improved efficiency in office buildings. Energy Build. 2014, 70, 398–410. [Google Scholar] [CrossRef]
  2. Yang, L.; Yan, H.; Lam, J.C. Thermal comfort and building energy consumption implications—A review. Appl. Energy 2014, 115, 164–173. [Google Scholar] [CrossRef]
  3. Iannaccone, G.; Imperadori, M.; Masera, G. Smart-ECO Buildings Towards 2020/2030: Innovative Technologies for Resource Efficient Buildings, 1st ed.; Springer: London, UK, 2014; ISBN 3319002694. [Google Scholar]
  4. Castilla, M.; Álvarez, J.D.; Ortega, M.G.; Arahal, M.R. Neural network and polynomial approximated thermal comfort models for HVAC systems. Build. Environ. 2013, 59, 107–115. [Google Scholar] [CrossRef]
  5. Chenari, B.; Dias Carrilho, J.; Gameiro da Silva, M. Towards sustainable, energy-efficient and healthy ventilation strategies in buildings: A review. Renew. Sustain. Energy Rev. 2016, 59, 1426–1447. [Google Scholar] [CrossRef]
  6. Santamouris, M.; Kolokotsa, D. Passive cooling dissipation techniques for buildings and other structures: The state of the art. Energy Build. 2013, 57, 74–94. [Google Scholar] [CrossRef]
  7. Elmualim, A.A. Evaluating the Performance Of Windcatchers For Natural Ventilation. Ph.D. Thesis, The University of Reading, Reading, UK, 2003. [Google Scholar]
  8. Hughes, B.R.; Abdul Ghani, S.A. A numerical investigation into the effect of windvent dampers on operating conditions. Build. Environ. 2009, 44, 237–248. [Google Scholar] [CrossRef]
  9. Environmental Protection Agency. Indoor Air Fact; United States Environmental Protection Agency: Washington, DC, USA, 1991. [Google Scholar]
  10. Calautit, J.K.; O’Connor, D.; Hughes, B.R. Determining the optimum spacing and arrangement for commercial wind towers for ventilation performance. Build. Environ. 2014, 82, 274–287. [Google Scholar] [CrossRef] [Green Version]
  11. Calautit, J.K.; Hughes, B.R.; O’Connor, D.; Shahzad, S.S. Numerical and experimental analysis of a multi-directional wind tower integrated with vertically-arranged heat transfer devices (VHTD). Appl. Energy 2017, 185, 1120–1135. [Google Scholar] [CrossRef] [Green Version]
  12. Zomorodian, Z.S.; Tahsildoost, M.; Hafezi, M. Thermal comfort in educational buildings: A review article. Renew. Sustain. Energy Rev. 2016, 59, 895–906. [Google Scholar] [CrossRef]
  13. Daghigh, R. Assessing the thermal comfort and ventilation in Malaysia and the surrounding regions. Renew. Sustain. Energy Rev. 2015, 48, 681–691. [Google Scholar] [CrossRef]
  14. Chen, Y.; Tong, Z.; Malkawi, A. Investigating natural ventilation potentials across the globe: Regional and climatic variations. Build. Environ. 2017, 122, 386–396. [Google Scholar] [CrossRef]
  15. Tong, Z.; Chen, Y.; Malkawi, A. Estimating natural ventilation potential for high-rise buildings considering boundary layer meteorology. Appl. Energy 2017, 193, 276–286. [Google Scholar] [CrossRef]
  16. Tong, Z.; Chen, Y.; Malkawi, A.; Liu, Z.; Freeman, R.B. Energy saving potential of natural ventilation in China: The impact of ambient air pollution. Appl. Energy 2016, 179, 660–668. [Google Scholar] [CrossRef] [Green Version]
  17. Elmualim, A.A.; Awbi, H.B. Post occupancy evaluation of a building employing windcatchers for summer ventilation. Facilities 2003, 21, 323–332. [Google Scholar] [CrossRef]
  18. Calautit, J.K.; Hughes, B.R. Measurement and prediction of the indoor airfolw in a room ventilated with a commercial wind tower. Energy Build. 2014, 84, 367–377. [Google Scholar] [CrossRef]
  19. Hughes, B.R.; Chaudhry, H.N.; Ghani, S.A. A review of sustainable cooling technologies in buildings. Renew. Sustain. Energy Rev. 2011, 15, 3112–3120. [Google Scholar] [CrossRef]
  20. Jomehzadeh, F.; Nejat, P.; Calautit, J.K.; Yusof, M.B.M.; Zaki, S.A.; Hughes, B.R.; Yazid, M.N.A.W.M. A review on windcatcher for passive cooling and natural ventilation in buildings, Part 1: Indoor air quality and thermal comfort assessment. Renew. Sustain. Energy Rev. 2017, 70, 736–756. [Google Scholar] [CrossRef] [Green Version]
  21. Jones, B.; Kirby, R. The Performance of Natural Ventilation Windcatchers in Schools—A Comparison between Prediction and Measurement. Int. J. Vent. 2010, 9, 273–286. [Google Scholar] [CrossRef]
  22. Monodraught Square Classic Windcatcher. Available online: http://www.ellis.co.nz/media/444887/windcatcher-classic-square-.pdf (accessed on 11 April 2018).
  23. Siew, C.C.; Che-Ani, A.I.; Tawil, N.M.; Abdullah, N.A.; Mohd-Tahir, M. Classification of natural ventilation strategies in optimizing energy consumption in Malaysian office buildings. Procedia Eng. 2011, 20, 363–371. [Google Scholar] [CrossRef]
  24. Chungloo, S.; Tienchutima, C. The effect of wing-walls and balcony on wind induced ventilation in high-rise residential units. JARS 2011, 8, 109–120. [Google Scholar]
  25. Allocca, C.; Chen, Q.; Glicksman, L.R. Design analysis of single-sided natural ventilation. Energy Build. 2003, 35, 785–795. [Google Scholar] [CrossRef]
  26. Al-Kodmany, K. Eco-Towers: Sustainable Cities in the Sky; WIT Press: Ashurst, UK, 2015; ISBN 1784660175. [Google Scholar]
  27. Givoni, B. Passive Low Energy Cooling of Buildings; John Wiley & Sons: Hoboken, NJ, USA, 1994; ISBN 0471284734. [Google Scholar]
  28. Hughes, B.R.; Calautit, J.K.; Ghani, S.A. The development of commercial wind towers for natural ventilation: A review. Appl. Energy 2012, 92, 606–627. [Google Scholar] [CrossRef]
  29. Mak, C.M.; Niu, J.L.; Lee, C.T.; Chan, K.F. A numerical simulation of wing walls using computational fluid dynamics. Energy Build. 2007, 39, 995–1002. [Google Scholar] [CrossRef]
  30. Liu, C.-H. Computational fluid dynamic analysis of the function of wing walls for natural ventilation in high-rise buildings. In Proceedings of the Annual Research Conference of the Royal Institution of Chartered Surveyors, London, UK, 7–8 Sepetember 2006. [Google Scholar]
  31. Nejat, P.; Calautit, J.K.; Majid, M.Z.; Hughes, B.R.; Zeynali, I.; Jomehzadeh, F. Evaluation of a two-sided windcatcher integrated with wing wall (as a new design) and comparison with a conventional windcatcher. Energy Build. 2016, 126, 287–300. [Google Scholar] [CrossRef] [Green Version]
  32. Afshin, M.; Sohankar, A.; Manshadi, M.D.; Esfeh, M.K. An experimental study on the evaluation of natural ventilation performance of a two-sided wind-catcher for various wind angles. Renew. Energy 2016, 85, 1068–1078. [Google Scholar] [CrossRef]
  33. Ghadiri, M.H.; Lukman, N.; Ibrahim, N.; Mohamad, M.F. Computational Analysis of Wind-Driven Natural Ventilation in a Two Sided Rectangular Wind Catcher. Int. J. Vent. 2013, 12, 51–61. [Google Scholar] [CrossRef]
  34. Montazeri, H.; Montazeri, F.; Azizian, R.; Mostafavi, S. Two-sided wind catcher performance evaluation using experimental, numerical and analytical modeling. Renew. Energy 2010, 35, 1424–1435. [Google Scholar] [CrossRef]
  35. Chandra, S.; Fairey, P.; Houston, M.; Kerestecioglu, A.A. Wing walls to improve natural ventilation. Full-scale results and design strategies. In Proceedings of the 8th National Passive Solar Conference, Sante Fe, NM, USA, 7–9 September 1983; pp. 855–860. [Google Scholar]
  36. Mak, C.M.; Cheng, C.; Niu, J.L. The Application of computational fluid dynamics to the assessment of green features in buildings: Part 1: Wing walls. Archit. Sci. Rev. 2005, 48, 121–134. [Google Scholar] [CrossRef]
  37. Mozaffari, F. Indoor Natural Ventilation with Wing Wall in Balcony in Medium-Rise Building in Hot and Humid Climate. Ph.D. Thesis, Universiti Teknologi Malaysia, Johor Bahru, Malaysia, 2015. [Google Scholar]
  38. Dehghan, A.A.; Esfeh, M.K.; Manshadi, M.D. Natural ventilation characteristics of one-sided wind catchers: Experimental and analytical evaluation. Energy Build. 2013, 61, 366–377. [Google Scholar] [CrossRef]
  39. Hughes, B.R.; Cheuk-Ming, M. A study of wind and buoyancy driven flows through commercial wind towers. Energy Build. 2011, 43, 1784–1791. [Google Scholar] [CrossRef]
  40. Calautit, J.K.; Hughes, B.R.; Chaudhry, H.N.; Ghani, S.A. CFD analysis of a heat transfer device integrated wind tower system for hot and dry climate. Appl. Energy 2013, 112, 576–591. [Google Scholar] [CrossRef] [Green Version]
  41. Franke, J.; Hellsten, A.; Schlünzen, H.; Carissimo, B. COST Action 732, Best Practice Guideline for the CFD Simulation of Flows in The Urban Environment; COST: Brussels, Belgium, 2007. [Google Scholar]
  42. Tominaga, Y.; Mochida, A.; Yoshie, R.; Kataoka, H.; Nozu, T.; Yoshikawa, M.; Shirasawa, T. AIJ guidelines for practical applications of CFD to pedestrian wind environment around buildings. J. Wind Eng. Ind. Aerodyn. 2008, 96, 1749–1761. [Google Scholar] [CrossRef]
  43. Tominaga, Y.; Akabayashi, S.; Kitahara, T.; Arinami, Y. Air flow around isolated gable-roof buildings with different roof pitches: Wind tunnel experiments and CFD simulations. Build. Environ. 2015, 84, 204–213. [Google Scholar] [CrossRef]
  44. Launder, B.E.; Spalding, D.B. The numerical computation of turbulent flows. Comput. Methods Appl. Mech. Eng. 1974, 3, 269–289. [Google Scholar] [CrossRef]
  45. Cebeci, T.; Bradshaw, P. Momentum Transfer in Boundary Layers; Hemisphere Publishing Corp: New York, NY, USA, 1977. [Google Scholar]
  46. Blocken, B.; Stathopoulos, T.; Carmeliet, J. CFD simulation of the atmospheric boundary layer: Wall function problems. Atmos. Environ. 2007, 41, 238–252. [Google Scholar] [CrossRef]
  47. Montazeri, H.; Montazeri, F. CFD simulation of cross-ventilation in buildings using rooftop wind-catchers: Impact of outlet openings. Renew. Energy 2018, 118, 502–520. [Google Scholar] [CrossRef]
  48. ANSYS Incorporated ANSYS 14.5 FLUENT Theory Guide. Available online: http://www.ansys.com (accessed on 15 April 2018).
  49. Liu, P. A Modelling Study of Segmentation of Naturally Ventilated Tall Office Buildings in A Hot and Humid Climate. Ph.D. Thesis, University of Nottingham, Nottingham, UK, 2012. [Google Scholar]
  50. Elmualim, A.A. Dynamic modelling of a wind catcher/tower turret for natural ventilation. Build. Serv. Eng. Res. Technol. 2006, 27, 165–182. [Google Scholar] [CrossRef]
  51. American Society of Heating Refrigerating and Air-Conditioning Engineers. ASHRAE Standard 62.1: Ventilation for Acceptable Indoor Air Quality; ASHRAE: Atlanta, Georgia, 2007. [Google Scholar]
  52. Mundt, E.; Mathisen, H. Ventilation Effectiveness; Federation of European Heating, Ventilation and Air Conditioning Associations (REHVA): Stockholm, Sweden, 2004. [Google Scholar]
Figure 1. The different types of windcatcher found in the Middle East.
Energies 11 02536 g001
Figure 2. The schematic of model of a room ventilated with a TWIW, dimensions are in centimeter.
Energies 11 02536 g002
Figure 3. The 1:10 scaled model in the wind tunnel used for the validation study (dimensions are in mm).
Energies 11 02536 g003
Figure 4. The CFD domain of the model.
Energies 11 02536 g004
Figure 5. Mesh generation on the computational model.
Energies 11 02536 g005
Figure 6. Atmospheric boundary layer (ABL) profile of the approach flow.
Energies 11 02536 g006
Figure 7. (a) Solution convergence and (b) solution monitoring.
Energies 11 02536 g007
Figure 8. The inlet and outlet channel used for validation of CFD with experiment (dimensions are in mm).
Energies 11 02536 g008
Figure 9. Validation of CFD results against the experimental results.
Energies 11 02536 g009
Figure 10. Grid sensitivity analysis of different sizes: 1.5 million, 3 million, 6 million and 9 million.
Energies 11 02536 g010
Figure 11. The impact of different turbulence models on the air velocity in inlet and outlet points.
Energies 11 02536 g011
Figure 12. The positions of planes used for calculations.
Energies 11 02536 g012
Figure 13. The air velocity in inlet of TWIW in different wing wall length (at 2.5 m/s wind speed).
Energies 11 02536 g013
Figure 14. The air flow rate and air flow rate per square meter in different wing wall length (at 2.5 m/s wind speed).
Energies 11 02536 g014
Figure 15. The air change rate of windcatchers with different wing wall length.
Energies 11 02536 g015
Figure 16. Air velocity contours of 1.1 m horizontal planes (at 2.5 m/s wind speed).
Energies 11 02536 g016
Figure 17. The average of air velocity in 1.1 m horizontal planes in different wing wall lengths.
Energies 11 02536 g017
Figure 18. The Mean age of air of horizontal plane in different length.
Energies 11 02536 g018
Figure 19. The distribution of MAA in vertical plane of 10 cm model.
Energies 11 02536 g019
Figure 20. The MAA distribution of four sided windcatcher in the vertical plane in Calautit study [18].
Energies 11 02536 g020
Figure 21. The air change effectiveness of horizontal plane in different length.
Energies 11 02536 g021
Figure 22. Comparison of air velocity in horizontal plane between 10 cm wing wall (A) and 100 cm wing wall (B).
Energies 11 02536 g022
Figure 23. The ISO plane contours which show the area with air velocity below 0.1 m/s as the dead zone area ((A) 10 cm wing wall and (B) 100 cm wing wall).
Energies 11 02536 g023
Figure 24. Comparison of ACE in horizontal plane between 10 cm (A) and 100 cm wing wall (B).
Energies 11 02536 g024
Table 1. The brief of boundary conditions settings in CFD.
FactorDomain
Macro-climateFluid zone
Micro-ClimateFluid zone
WallsTop: Symmetry
Side: Symmetry
Bottom: Wall
Velocity InletABL Profile
Pressure Outlet0 Pa
Operating PressureAtmospheric
Viscous Modelk-ε (standard)
Near-Wall TreatmentStandard wall functions
Solver TypePressure-based
TimeSteady
Gravity9.81 m/s2

