Optimisation of Second-Generation Biodiesel Production from Australian Native Stone Fruit Oil Using Response Surface Method

1
School of Engineering and Technology, Central Queensland University, North Rockhampton, Queensland 4702, Australia
2
School of Health, Medical and Applied Sciences, Central Queensland University, North Rockhampton, Queensland 4702, Australia
*
Author to whom correspondence should be addressed.
Energies 2018, 11(10), 2566; https://doi.org/10.3390/en11102566
Submission received: 13 August 2018
/
Revised: 18 September 2018
/
Accepted: 25 September 2018
/
Published: 26 September 2018
(This article belongs to the Special Issue Biofuel and Bioenergy Technology)
Abstract
:In this study, the production process of second-generation biodiesel from Australian native stone fruit have been optimised using response surface methodology via an alkali catalysed transesterification process. This process optimisation was performed varying three factors, each at three different levels. Methanol: oil molar ratio, catalyst concentration (wt %) and reaction temperature were the input factors in the optimisation process, while biodiesel yield was the key model output. Both 3D surface plots and 2D contour plots were developed using MINITAB 18 to predict optimum biodiesel yield. Gas chromatography (GC) and Fourier transform infrared (FTIR) analysis of the resulting biodiesel was also done for biodiesel characterisation. To predict biodiesel yield a quadratic model was created and it showed an R2 of 0.98 indicating the satisfactory performance of the model. Maximum biodiesel yield of 95.8% was obtained at a methanol: oil molar ratio of 6:1, KOH catalyst concentration of 0.5 wt % and a reaction temperature of 55 °C. At these reaction conditions, the predicted biodiesel yield was 95.9%. These results demonstrate reliable prediction of the transesterification process by Response surface methodology (RSM). The results also show that the properties of the synthesised Australian native stone fruit biodiesel satisfactorily meet the ASTM D6751 and EN14214 standards. In addition, the fuel properties of Australian native stone fruit biodiesel were found to be similar to those of conventional diesel fuel. Thus, it can be said that Australian native stone fruit seed oil could be used as a potential second-generation biodiesel source as well as an alternative fuel in diesel engines.
1. Introduction
Global climate change and the resulting desire for renewable energy sources has generated the interests for using biofuel in the transport sector [1]. Due to the higher production of biofuel in recent years, it currently contributes 1.5% global transportation fuel. It has been reported that nearly 40% of the total worldwide biofuel supply comes from emerging and developing countries. However, the expansion of biofuel production around the world has raised major concerns, for example the existence of several first-generation biofuels. Biofuels that are produced from edible sources are termed first-generation biofuels [2], and these have been increasingly questioned over some concerns such as food-fuel controversy, environmental pollution, and climate change. The increasing concern regarding the sustainability of several first-generation biofuels has led to investigations into the potential of producing biodiesel from non-food crops which are termed as second-generation biodiesel. The potential benefits offered by the second-generation biodiesels are that they consume waste oils, make use of abandoned land and do not compete with food crops [3].
In addition, second-generation biofuel from locally available sources can play a great role in economic development of rural and emerging region of a country [4]. Despite significant socio-economic advantages and continuous support from government and non-government organisations, the market for biofuel production around the world has not expanded very much over the last few years. Many countries have announced second-generation biofuel support policies, e.g., the United States has adopted the policies to produce 60 billion litres by 2022 and the European Union set their target to use 20% renewable energy in the transport sector by 2020 [5]. Both the US and EU policies could play an important role for the worldwide biofuel development because of their market size and considerable amount of biofuel imports. In addition, the Australian Federal Government and its State Governments have developed relevant policies to promote a sustainable biofuel industry to ensure Australian’s long-term energy security. Leading oil companies such as Caltex, Shell, BP, and Exxon Mobile are also coming forward in second-generation biofuel research with more investment. A few plants with research activities are going to be established soon in emerging countries.
Biodiesel is one of the biofuels and has proved its potential as an alternative fuel worldwide. Biodiesel is biodegradable, renewable and environmentally friendly [6,7]. The feedstock selection of biodiesel is very important as 75% of the total cost of biodiesel production is associated with obtaining feedstocks alone. A high oil yield of any feedstock ensures a commercial scale biodiesel production at reasonable prices [8]. Feedstock security of supply, feedstock cost of supply and feedstock storage are the important factors to consider when choosing the biodiesel feedstock [9]. In addition, biodiesel should be produced from the feedstock that is consistently available, economically viable and locally available. Currently, the major feedstocks for biodiesel production in Australia are waste cooking oil, animal tallow, macadamia, beauty leaf, canola and mustard oils [10]. However, stone fruit such as Prunus armeniaca L. is widely cultivated in Australia, and it yields 22–38% of kernels which contain up to 54.2% oil. Australia produces about 100,000 tons of summer stone-fruit from October to April each year and, in 2008, about 16,917 tons of Prunus armeniaca L. fruit were produced from all six mainland states in Australia. This could therefore be a potential second-generation biodiesel feedstock in Australia. The main aim of this research was to investigate and optimise the production process of second-generation biofuel from this Australian native feedstock as the research on it is still far behind that into other feedstocks. This biodiesel could overcome the limitations associated with first-generation biodiesels and be used as an alternative to conventional fossil fuels.
2. Literature Review
Stone fruit is similar to a small peach, generally 1.5–2.5 cm in diameter, with its colour varying from yellow to orange or red. Its single seed is enclosed in a hard stony shell. During fruit processing, the seeds are discarded due to the presence of hydro-cyanic acid [11]. To utilise this waste product, it is important to optimise the procedures involved in oil extraction and its conversion into biodiesel.
Many researchers [12,13,14,15,16,17] have optimised the production of biodiesel from different first- and second-generation feedstocks using various methods. For example, Saydu et al. [13] optimised the process of biodiesel production from hazelnut and sunflower oil using single step transesterification with methanol, and employing potassium hydroxide as a catalyst. Razack and Duraiarasan [12] optimised the waste cooking oil biodiesel production process using response surface methodology using encapsulated mixed enzyme as a catalyst. Dharma et al. [17] optimised the biodiesel production process of Jatropha curcas and Ceiba pentandra oil using response surface methodology as also did Ong et al. [16] for the Calophyllum inophyllum biodiesel production process.
A few studies have been done on the optimisation of the stone fruit oil (SFO) biodiesel production process but none of them used any statistical modelling. For instance, Gumus et al. [18] used alkali transesterification with methanol and potassium hydroxide catalyst for producing SFO methyl ester. Abdelrahman [19] produced SFO biodiesel via alkali transesterification with 0.75% potassium hydroxide catalyst and at a methanol: oil molar ratio of 6:1. Faizan et al. [20] showed that the wild Prunus Armeniaca L. oil can be transesterified by a single step process via the use of sodium hydroxide catalyst at a methanol: oil molar ratio of 6:1, and reported a biodiesel yield of 93%. Ashok et al. [21] performed single step alkali transesterification using 1% potassium hydroxide as a catalyst at 55 °C and 60 min reaction time with a constant stirring at 400 rpm and obtained a biodiesel yield of 96.5%. Thus, many process parameters, including reaction temperature, catalyst type and catalyst concentration, type of alcohol used, the oil to methanol molar ratio, reaction time and agitation speed have been found to influence the optimum transesterification process [22,23,24,25,26]. From the above literature, it is obvious that no/limited investigation has been done on the optimisation of second-generation biodiesel production process from Prunus Armeniaca L. oil using any statistical modelling. Thus, this study has explored optimisation of the biodiesel production processes from Australian native stone fruit oil using response surface methodology.
3. Materials and Methods
3.1. Materials
Stone fruit (Prunus armeniaca L. species) seed oil was purchased from a local producer named Chromium Group Pty Ltd. of Eumundi, Queensland, Australia. The chemicals used in this study were methanol (99.9% purity), potassium hydroxide (KOH pellets, 99% purity) and sodium hydroxide (NaOH pellets, 99% purity). All were of analytical reagent grade (AR) and were procured from the School of Engineering and Technology, Central Queensland University, Rockhampton, Australia. A three-neck laboratory reactor (1 L) along with a reflux condenser and a thermocouple placed on a magnetic heater/stirrer were used in the SFO biodiesel conversion experiments. In this experiment, methanol, KOH, NaOH and Whatman 541 grade filter paper (pore size 22 μm) were used.
3.2. Oil Extraction
The stone fruits were collected and the fleshy parts were separated manually for drying purposes. The seeds were separated for kernel collection and oil extraction. For easy breaking of the hard shell, seeds were softened by immersing in water for 10–20 min. The broken shell can be used as fertilizer or firewood after the oil extraction process [27]. Kernels were separated from the broken shells and were crushed using a pestle and mortar and sieved through a 40 mesh or 0.8 mm sieve [19,28]. The ground kernel was placed in a Soxhlet apparatus and the oil was extracted using petroleum ether (40–60 °C) over 6–8 h until the extraction was completed [19]. After oil extraction, the petroleum ether was evaporated using a rotary evaporator at 25 °C [29]. The oil was placed in an oven at 60 °C for 60 min to remove the remaining solvent. The oil was filtered using Whatman 541 filter paper. After filtration, the SFO was kept in a sealed container for characterisation. The oil yield was calculated using Equation (1).
3.3. Biodiesel Production
The acid value of raw SFO was determined as 1.65 mg KOH/g. After transesterification using KOH catalyst transesterification, the acid value of SFO biodiesel was found to be 0.25 mg KOH/g. This trial experiment suggested that only the single stage alkyl catalyst transesterification process was satisfactory for SFO biodiesel production. Thus, in each experiment, the experiment was performed by reacting a known quantity of SFO with methanol and the catalyst.
Initially, the SFO was poured into a three-neck laboratory reactor and heated to the desired temperature. The measured quantities (molar basis) of methanol and catalyst (KOH) were poured into a separate beaker and stirred vigorously using a magnetic stirrer at 50 °C at 600 rpm for 10 min to produce methoxide. This solution was slowly poured into the three-neck reactor containing SFO. The blend was agitated continuously at 600 rpm and the temperature and reaction time were varied as per the experimental design. At the end of the transesterification reaction, the blend was transferred into a separating funnel. Although the separation of glycerol and biodiesel occurred instantaneously, the funnel was left undisturbed for 24 h. Two separate liquid phases were formed, with the top layer being methyl ester (biodiesel) and the bottom layer of red viscous glycerol and impurities. The bottom layer was drained off while the top layer was collected and washed with warm (50 °C) distilled water. This moist biodiesel was then heated to 110 °C for 15 min to remove residual water that would have been retained by the biodiesel during the washing process. The Whatman® qualitative Grade 1 filter paper was used to filter the biodiesel and finally stored in an airtight container at room temperature until its characterisation. Biodiesel yield was calculated using Equation (2) and its composition was determined using a Gas Chromatogram [22]. The graphical illustration of the SFO production process is shown in Figure 1.
3.4. Physicochemical Characterisation of SFO
This section discusses the international standards used in characterising the SFO biodiesel and its composition via Gas Chromatography (GC) and Fourier Transform Infrared (FTIR) spectroscopy.
3.4.1. Fuel Properties
The physicochemical properties and fatty acid compositions of crude SFO and SFO biodiesel were tested according to ASTM and EN standards. The properties studied were density at 15 °C (ASTM D1298), kinematic viscosity at 40 °C (ASTM D445), acid value (ASTM D664), calorific value (ASTM D240), flash point (ASTM D93) and oxidation stability (ASTM D2274). The fatty acid compositions were determined using a gas chromatograph according to EN 14103.
Fuel properties calculated based on the fatty acid composition of the SFO biodiesel were cetane number (CN), saponification value (SV), iodine value (IV), long-chain saturated factor (LCSF) and degree of unsaturation (DU). The numerical calculations were determined using the following equations [30]:
where D indicates the number of double bonds, Ai is the percentage of each fatty acid in the FAME, and MWi is the molecular mass of each component. MUFA denotes monounsaturated fatty acid and PUFA refers to polyunsaturated fatty acid. The degree of unsaturation was calculated using both MUFA and PUFA concentrations. Fatty acids of C16:0, C18:0, C20:0, C22:0 and C24:0 stand for palmitic acid, stearic acid, arachidic acid, behenic acid and lignoceric acid, respectively, and were used for measuring the long chain saturated factor.
3.4.2. Gas Chromatography
According to EN14103, a gas chromatograph (GC) (Thermo Scientific Trace 1310 GC) was used to determine the fatty acid composition of the SFO. 25 mg of the SFO biodiesel was dissolved in high purity hexane (10 mL). Then, this solution was poured to 2 mL auto-sampler vials. The equipment for the GC test included Thermo Scientific Trace 1310 GC with a split/split less (SSL) injector, flame ionisation detector, and TriPlus auto-sampler. At 240 °C, a 1 µL sample was injected in split mode (40:1) by maintaining a constant helium flow of 1.2 mL/min. The conditions for separating FAMEs were: using a BPX-70 column (60 m × 250 μm × 0.25 μm film) with a temperature program: 110 °C (4 min); 10 °C/min, 150 °C; 3.9 °C/min, 230 °C (5 min). In this study, SFO biodiesel individual components were identified by retention time compared to a standard FAME mixture that had certified concentrations, namely Supelco CRM18920 (FAME C8-C22). Chromeleon 7.2 software was used for data acquisition and processing.
3.4.3. Fourier Transform Infrared (FTIR) Spectroscopy
The various functional groups present in the crude oil and the biodiesel sample were determined with Fourier transform infrared (FTIR) spectroscopy. The Spectrum 100 FTIR spectrometer with a universal Attenuated total reflectance (ATR) sampling accessory (Perkin Elmer, Melbourne, Australia) was used to record ATR infrared spectra. SFO biodiesel samples were placed directly on the ATR window at approximately 40% transmission to record the spectra with four scans, 4000–650 cm−1. After ATR correction, Spectrum 6.2.0 software was used to acquire data and processing.
3.5. Design of Experiments
Box-Behnken is one of the most commonly used responses surface methodology designs. This design was used for designing and statistical analysis of this experiment. The Box-Behnken design matrix was utilised to find the optimum conditions for maximum biodiesel yield production. The experimental optimisation was achieved via analysis of variance (ANOVA) using Minitab 18 software. The effects of process factors such as methanol: oil molar ratio, KOH catalyst concentration, and reaction temperature were tested. Using these three factors at three levels required a total of 15 runs for identifying the optimum conditions for transesterification. The coded symbols, ranges, and levels of the investigated factors are listed in Table 1. The design matrix for the three factors was varied at three levels, namely −1, 0 and +1. The range levels of the factors investigated were chosen by considering the initial tests carried out on the effect of individual factors on biodiesel yield as well as the operating limits of the biodiesel production process conditions as evidenced from the literature.
Methanol: oil molar ratio ranged from 4:1 to 6:1, catalyst concentrations were 0.5–1.5% by weight of oil and the reaction temperature was varied from 45 °C to 65 °C (boiling point of methanol). Once the experiments were completed, the response factor (biodiesel yield) was applied in a full quadratic model to correlate the response factor to the independent factors. The general form of the full quadratic model is shown in Equation (8).
where Y is the response factor (biodiesel yield, %); P0 is a constant; P1, P2, and P3 are regression coefficients; P1,1, P1,2, P1,3, P2,2, P2,3, and P3,3 are quadratic coefficient; and Q1, Q2, and Q3 are independent variables.
Y = P0 + P1Q1 + P2Q2 + P3Q3 + P1,2Q1Q2 + P1,3Q1Q3 + P2,3Q2Q3 + P1,1Q12 + P2,2Q22 + P3,3Q32
4. Results and Discussion
This section includes the results of the characterisation of both crude SFO and SFO biodiesel, fatty acid compositions of SFO biodiesel, optimisation of reaction conditions by response surface methodology and response surface plots for SFO biodiesel production.
4.1. Characterisation of Crude SFO
The properties of crude stone fruit seed oil used in this study were evaluated prior to the optimisation process. Physicochemical properties are the most important features to check the quality of any crude oil. The SFO was characterised by viscosity, density, specific gravity, acid value, calorific value, saponification number and iodine value. The properties of SFO from this study along with those from other studies and those of petro diesel were compared and are presented in Table 2. The density of the oil was found to be 910 kg/m3 which matches with that reported in the literature. Again, the acid value of SFO was determined to be 1.65 mg KOH/g, indicating the presence of low levels of free fatty acids in the oil. The kinematic viscosity of the oil was found to be 34.54 m2/s and the calorific value was 38.45 MJ/kg, which is within the values found in the literature [18]. Based on above results, it is clear that Australian native SFO oil have similar fuel properties including fatty acid, calorific value and viscosity with the data of other researchers, thus it is expected that Australian native SFO may serve as a good feedstock for biodiesel production.
4.2. Properties and Qualities of SFO Biodiesel
The physical and chemical properties of SFO biodiesel from this study, along with results from other researchers’ work on SFO biodiesel, are compared with other non-edible biodiesels and petrodiesel in Table 3. It was found that all the properties and qualities of the SFO biodiesel fulfilled the international standards (USA ASTM D6751 and European Union EN14214). Many researchers [31,32,33,34] showed that densities of biodiesels do not vary considerably, as the density of methanol and oil are close to the density of produced biodiesel, which usually varies between 850 and 900 kg/m3. The density of SFO and papaya seed oil (PSO) was found to be 855 and 840 kg/m3 respectively, whereas that of petrodiesel was found to be 827.2 kg/m3. Densities of other SFO biodiesels also matched with the international standards. Karanja biodiesel has a density of 931 kg/m3, which is outside the ASTM and EN standards specification, thus limiting its efficiency of fuel atomisation in airless combustion systems [35]. However, other biodiesels (Table 3) have slightly higher densities than petrodiesel fuel, but they are within the range of the international standards. The viscosity of SFO biodiesel was determined to be 4.26 mm2/s and other biodiesels (except Karanja) ranged from 1.9–6.0 mm2/s and also fulfil the requirements of the standards. The viscosity of SFO biodiesels of other studies was found to be within the range as well. The acid values of biodiesels (except Neem) were also in line with requirements of ASTM and EN biodiesel standards which are less than 0.5 mg KOH/g. Higher acid values can cause corrosion of IC engines and internal metal parts. Cetane number is an important fuel property for diesel engines. A higher speed diesel engine works more efficiently with a fuel with a higher cetane number. A lower cetane number fuel has longer ignition delays providing more time to complete the combustion process. The cetane number of biodiesel increases with an increase in fatty acid proportion. Longer fatty acid chains and higher saturated fatty acid content will lead to a higher cetane number [36,37]. Moringa biodiesel has the highest cetane number of 67.1 compared with all other biodiesels in Table 3 and is within the international standard limit. All calorific values are lower than those of petrodiesel fuel (45.3 MJ/kg). The SFO biodiesel calorific value was found to be 39.64 MJ/kg in this study, thus meeting the minimum EN standard requirement of 35 MJ/kg. All other SFO biodiesels have similar calorific values as well. The flashpoint of this SFO biodiesel was found to be 105 °C, whereas the ASTM standard specifies 100–170 °C and petrodiesel fuel is 68.5 °C. This suggests that SFO biodiesel fuel is safer to handle and store than petroleum diesel. The iodine value for this SFO was recorded as 104.7 mgI2 which met the range of the EN standard. The higher the iodine value, the more unsaturated double bonds are present in the methyl ester, leading to better biodiesel fuel quality. Biodiesel with higher oxidation stability is preferable as low oxidation stability can affect the quality of biodiesel [38]. This SFO biodiesel has an oxidation stability of 7.15 h, which falls above the minimum values of both the ASTM (minimum 3 h) and EN standards (minimum 6 h). Some biodiesels with poor oxidation stability such as Tobacco, Cottonseed, Jatropha and Moringa biodiesel can be easily remedied by adding antioxidants.
4.3. The Fatty Acid Composition of SFO Biodiesel
The fatty acid composition of any biodiesel feedstock is an important fuel property. The fatty acid composition is highly dependent on the quality of the feedstock, its growth condition and the geographic location in which the plant has grown. The chromatogram of the SFO biodiesel produced in this study shows the existence of derivatives of C16:0 (palmitic acid), C18:0 (Stearic acid), C18:1 (oleic acid), C18:2 (linoleic acid), C18:3 (linolenic acid), and C22:1 (behenic acid) in Figure 2. GC chromatogram of SFO biodiesel ensured the formation of methyl ester.
The fatty acid compositional analysis of SFO biodiesel produced in this study is shown in Table 4, which indicates a high level (89.7%) of unsaturated fatty acids made up of both polyunsaturated and monounsaturated fatty acids. Saturated fatty acids such as palmitic acid, stearic acid, and behenic acid were found to be present at 5.85%, 2.51%, and 0.66%, respectively. Monounsaturated fatty acids (MUFA) such as oleic acid were found to be the dominant fatty acids (63.84%), whereas polyunsaturated fatty acids (PUFA) such as linoleic acid and linolenic acid were 25.34% and 0.51%, respectively. Pedro et al. [40] indicated that the degree of unsaturation of biodiesel did not significantly affect the engine performance and the start of injection, but it had a significant influence on combustion characteristics and emissions. The degree of unsaturation was recorded as 115.54% in this study. Altun [41] indicated that degree of unsaturation and cetane number of biodiesel could highly influence NOx formation in biodiesel-fuelled diesel engines. Generally, higher degrees of saturation relate to higher cetane numbers of biodiesel. Unsaturated biodiesel produces higher NOx and lowers HC emissions than saturated biodiesels [40]. Furthermore, higher degrees of unsaturation in crude oil results in the production of less viscous biodiesel.
The distribution of the main fatty acids of some non-edible biodiesel feedstocks (including the SFO in this study and those from other research works on SFO) are shown in Table 5. Gas chromatography (GC) analysis of those biodiesels shows that the most abundant fatty acids are oleic acid, linoleic acid, and palmitic acid. The SFO biodiesel produced in this study shows similar results compared with those of previous research [18,21,28,42,43] on SFO biodiesel fuel. The presence of higher MUFA and PUFA can contribute to lower oxidative stability. As mentioned earlier, low oxidative stability could affect the quality of produced biodiesel. This low oxidation has a negative impact on both kinematic viscosity and acid value [44]. However, the presence of high contents of MUFA and PUFA ensures biodiesel with good fuel flow properties (especially in cold prone countries) compared with saturated fatty acids (SFA).
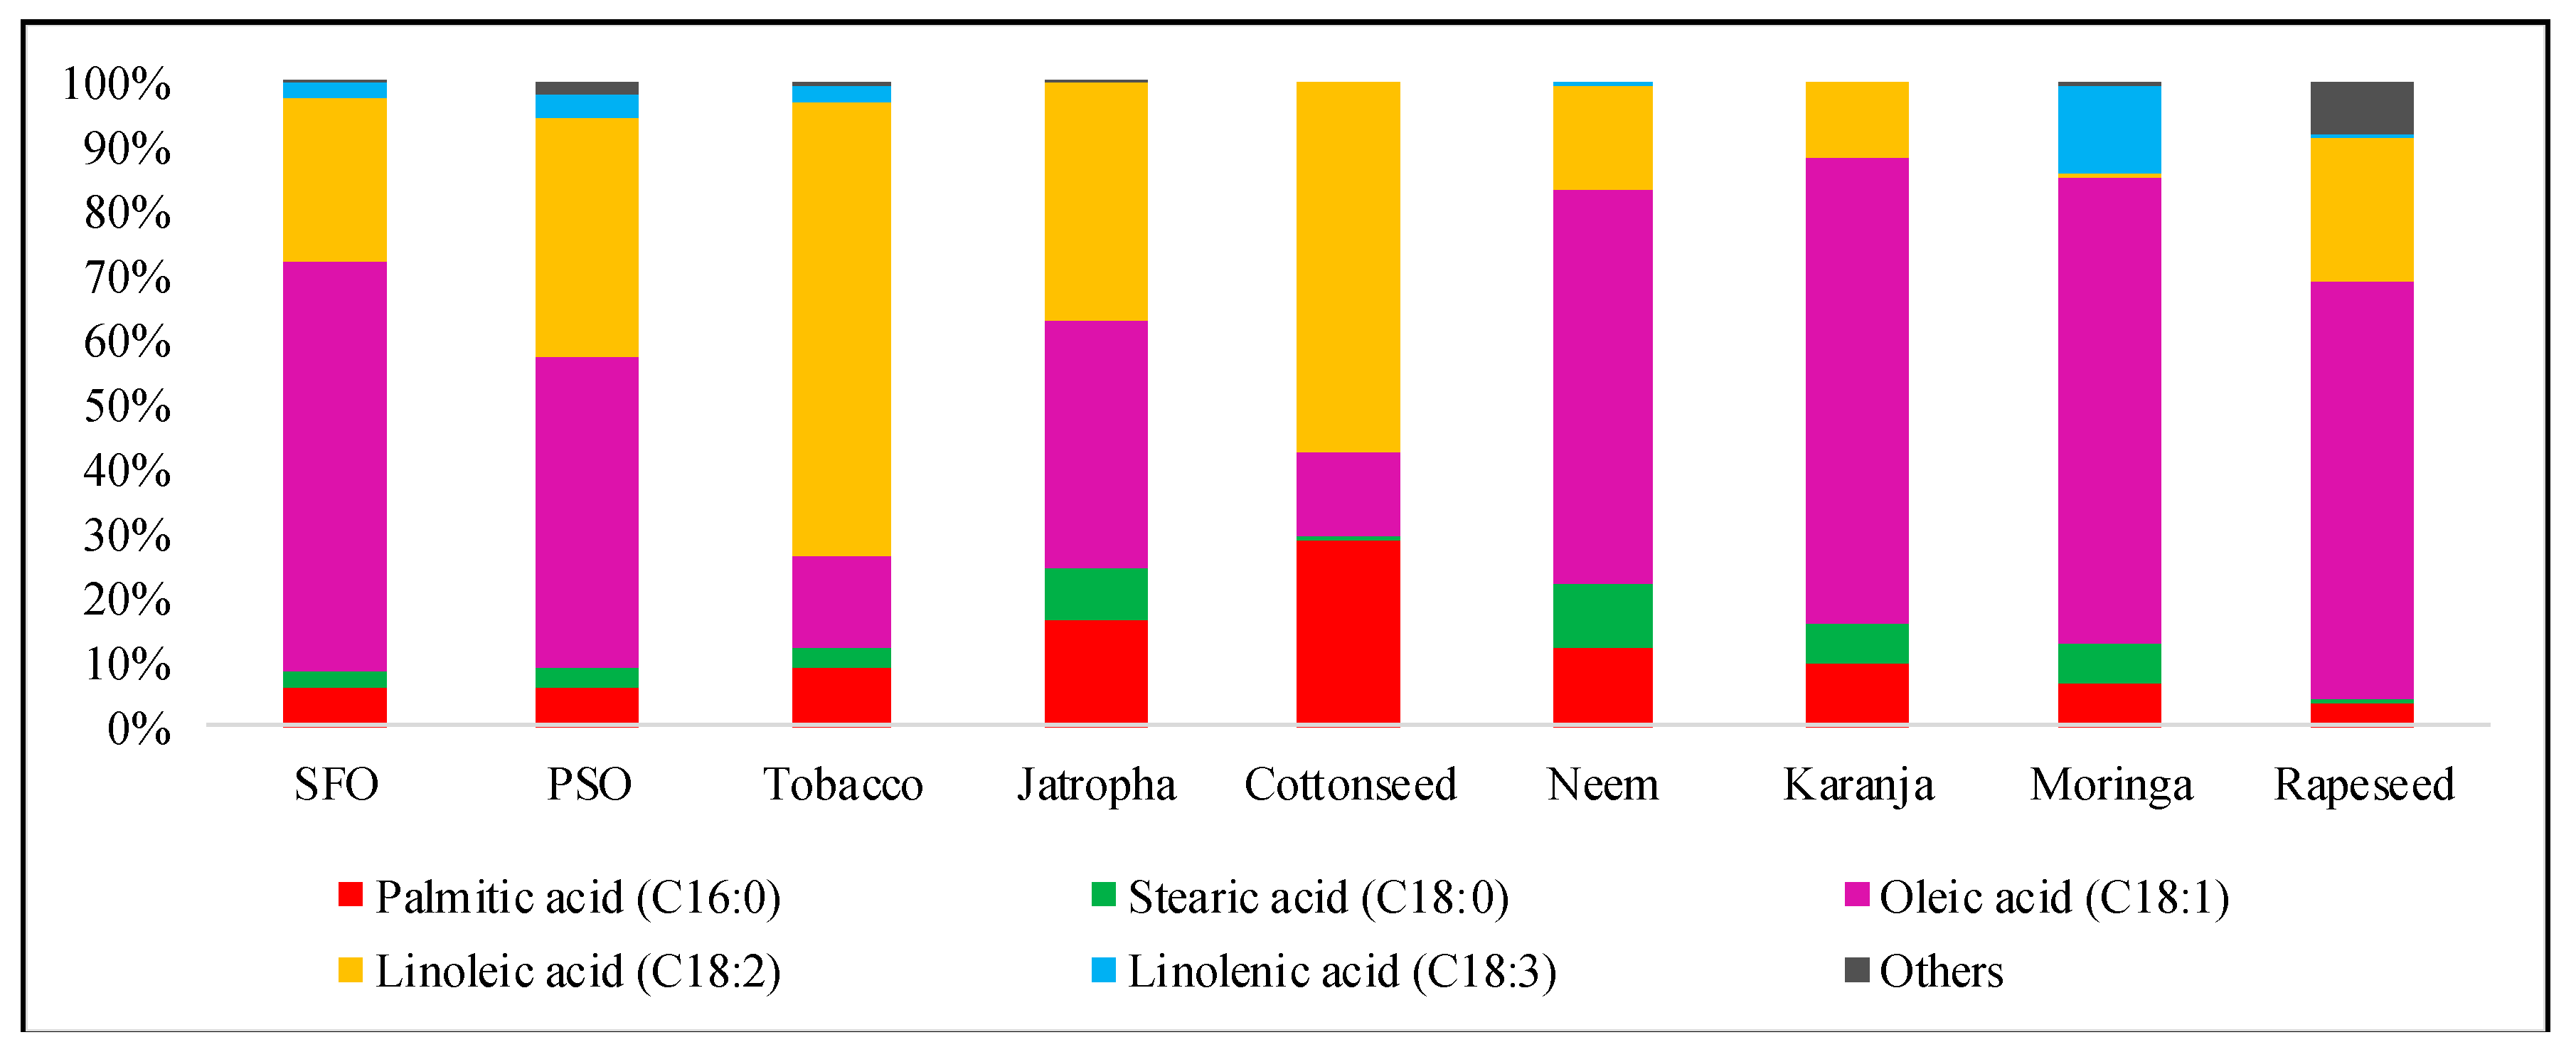
The comparison of different non-edible biodiesels and SFO biodiesel fatty acid compositions are shown in Figure 3. It can be seen that MUFA-oleic acid (C18:1) dominates most of the feedstocks (except tobacco and cottonseed), followed by PUFA-linoleic acid (C18:2) and SFA-palmitic acid (C16:0). Both tobacco and cottonseed had high proportions of PUFA and it can be seen in Table 3 that their oxidation stabilities are very poor (0.8 h and 1.83 h, respectively). Oxidation occurs due to the presence of high proportions of unsaturated fatty acid chains and double bonds, i.e., PUFA in the parent molecule reacts with oxygen as soon as it is exposed to air [23,52]. Therefore, biodiesels with high linoleic acid (C18:2) and linolenic acids (C18:3) such as tobacco and cottonseed tend to have lower oxidation stabilities.
Figure 4 shows the FTIR spectrum of the SFO methyl ester produced in this study. The advantages of using the FTIR method compared with GC is the ability to analyse whole samples, including precipitated fractions, without any further preparation [53].
The most important functional groups, wave number, band assignment and absorption intensity of absorption peaks detected in the FTIR spectrum of the SFO methyl ester are presented in Table 6. The peak at 1435.8 cm−1 corresponds to the asymmetric stretching of –CH3 present in the SFO biodiesel sample, which is shown in Figure 4. The peak in the region of 2800–3000 cm−1 represents the CH3 asymmetric stretching vibration. The peak of stretching of the carbonyl group (–C=O) is 1742 cm−1 located in the region of 1800–1700 cm−1 which is common for esters. The fingerprint region of 1500–900 cm−1 is the major spectrum from the SFO methyl ester which has a peak at 1244.8 cm−1, corresponding to the bending vibration of –CH3 [5]. These results reflect the conversion of triglycerides to methyl ester.
4.4. Optimisation of Reaction Conditions by RSM
The results of the Box–Behnken design model to optimise biodiesel production process parameters are shown in Table 7. In the transesterification experiments, the SFO biodiesel yield ranged from 75.2% to 95.8%. This design matrix also shows the experimental run order, experimental yields and predicted yields. These results show that the biodiesel yield varies with the production process. To avoid systematic errors, all run orders were randomised.
The predicted biodiesel yield values were generated from a quadratic regression model as obtained from Minitab software version 18.0 through response surface methodology (RSM) statistical analysis of the experimental data. The Minitab 18 program was used to calculate the effects of each parameter and its interactions with other parameters. The response parameter (biodiesel yield %) was correlated with other parameters using a full quadratic regression model shown in Equation (9). The model represents SFO biodiesel predicted yield (Y) as a function of methanol: oil molar ratio (M), catalyst concentration (wt %) (C) and reaction temperature (T).
Y = 92.983 + 4.719M − 2.161C − 0.730T − 4.490M2 − 4.650C2 − 4.323T2 − 5.168MC + 0.665MT − 1.635CT
Figure 5a shows the line of a perfect fit with points corresponding to zero error as indicated by the comparison of experimental and predicted biodiesel yields. Points closer to the straight line indicate a good agreement between the experimental and predicted values. Figure 5b shows that there is an adequate correlation between RSM predicted values and experimental values, which verifies the acceptability of the model. The model represents a relatively good description of the experimental data regarding the SFO yield.
The linear, quadratic and interaction effects of the parameters were considered to investigate the impacts on the biodiesel yield. Table 8 displays the significance of those parameters in terms of the probability value (p value). It also summarises the resulting regression coefficients and computed T-values. In the model, positive coefficients M and MT showed a linear effect on biodiesel yield, whereas quadratic terms of M2, C2, T2, MC, and CT had adverse effects that reduce the biodiesel yield. At the 95% confidence level, the p values were less than 0.05, indicating significant effects of those parameters. The analysis of variance (ANOVA) was used to determine the significance and fitness of the quadratic model.
Table 9 shows the level of significance of individual terms and their interactions on the selected response. The quadratic regression model has higher F value (24.76) and lower p value (0.001) than significance level (p < 0.05), which indicates that the model is significant at the 99.9% confidence level. The p value represents the probability of error and is used to check the significance of each regression coefficient. The interaction effect of each cross product can be revealed through the p value. It is found, M (methanol: oil molar ratio), C (catalyst concentration), M2 (quadratic effect of methanol amount), C2 (quadratic effect of catalyst concentration), T2 (quadratic effect of reaction temperature) and MC (methanol amount with catalyst) have significant effects on SFO biodiesel production. Among all other parameters, methanol: oil molar ratio (M) has the lowest p value (0.000) and highest F value (74.53). These results show that M is the most important parameter in SFO biodiesel production. According to the regression model in Equation (9), M has a positive effect and both C and reaction temperature (T) have negative effects on SFO biodiesel yield. This implies that increasing M will increase the speed of the transesterification process. However, increase in C and T will slow the speed of the transesterification reaction. The square term of T2 was also significant although it has a smaller F value compared to its corresponding linear term which indicated its weaker influence in the model. Again, the ANOVA results showed that the linear term of T with p value was not significant (more than 0.05) and its quadratic term T2 with p value was significant (less than 0.05). ANOVA also showed that both C and C2 terms were significant with their F values (15.63 and 27) which indicated their medium effect in the model. The Lack of Fit was also determined for this regression model. F value and p value of Lack of Fit parameters were found to be 2.32 and 0.315 respectively. The p value (0.315) of the Lack of Fit parameter is greater than 0.050, which indicated the quadratic model has an insignificant Lack of Fit, i.e., the model sufficiently described a relationship between independent parameters such as M, C and T, with the dependent parameter (SFO biodiesel yield). The coefficient of determination (R2) was employed to identify the quality of the model fitness. R2 also indicates the good correlation between the independent parameters. In this study, R2 was found to be 97.8% and the adjusted coefficient of determination (Adj. R2) was 93.9%. This means that the model explains 97.8% of the variation in the experimental data. In conclusion, the regression model developed for SFO biodiesel yield was valid and showed a satisfactory experimental relationship between the response and parameters.
4.5. Response Surface Plots for SFO Biodiesel Production
The interactive effect of the two factors on the transesterification process for biodiesel production is necessary for interpreting the impact of independent variables used in the optimisation process. Figure 6, Figure 7 and Figure 8 show both surface plots and contour plots of SFO biodiesel yield obtained by the regression model in Equation (9). Surface plots were produced by plotting three-dimensional (3D) surface curves against any two independent variables while keeping the other variables fixed at their medium values. The interaction effect of the two parameters plotted while the third parameter was fixed at a medium value in the contour plot. Contour plots can identify the variation in biodiesel yield with any change in experimental conditions.
4.5.1. Interaction Effect of Methanol: Oil Molar Ratio and Catalyst Concentration
Figure 6a shows the 3D response surface for SFO biodiesel yield production as a function of methanol: oil molar ratio, and KOH catalyst concentration under the current conditions of Box-Behnken design matrix. With an increase of methanol: oil molar ratio up to 6:1 (highest) and 0.5 wt % of catalyst concentration (lowest), biodiesel yield percentage increases. The maximum SFO biodiesel yield of 95.8% was found for KOH 0.5 wt % (Run 13). Table 7 design matrix indicated that highest KOH concentration at 1.5 wt % and unchanged methanol: oil ratio at 6:1 resulted in lower SFO biodiesel yield to 82.1% (Run 4). When the methanol:oil molar ratio remains unchanged at 6:1, and the catalyst concentration is at the highest value of 1.5 wt %, the SFO biodiesel decreases to 82.1% (Run 4). When the methanol: oil molar ratio was reduced to 4:1 (lowest level), and with the highest value of catalyst concentration of 1.5 wt %, the biodiesel yield was found to be 82.3% (Run 9). Again, at methanol: oil molar ratio of 6:1, and with the mid-value of catalyst concentration of 1wt %, the yield was found to be 89.3% (Run 3). On the other hand, when the methanol: oil molar ratio was reduced to 4:1, and with the mid-value of catalyst concentration of 1 wt %, the yield dropped to 80.3% (Run 12). Methanol: oil molar ratio affected total biodiesel yield production. ANOVA from Table 9 confirmed that both M, C and MC interaction were significant. The 2D contour plot with MC interaction along with biodiesel yield is shown in Figure 6b. It is easy to identify the optimum operating conditions and the related response values (yield) through the 2D contour plot. Therefore, both M and C are significant factors for higher biodiesel yield. Although literature showed that higher amount of C could result in less biodiesel yield production, and eventually produce emulsion and phase separation [54].
4.5.2. Interaction Effect of Catalyst Concentration and the Reaction Temperature
The interaction effect of catalyst concentration, C and reaction temperature, T on the SFO biodiesel yield in 3D surface plots is shown in Figure 7a. An increase in T to mid-level (55 °C), and the low-level of C (0.5 wt %) can enhance the SFO biodiesel yield up to 95.8% (Run 13), considering M of 6:1 and reaction time of 60 min constant, which is presented in Table 7 of the Box–Behnken design matrix. It is found that increasing the T to 65 °C and C to 1 wt % resulted in the decline in biodiesel yield to 89.3% (Run 3). Similarly, increasing C to the highest level of 1.5 wt % and increasing T to the mid-level of 55 °C resulted in a stepwise decline in biodiesel yield to 82.1% (Run 11). Figure 7a displays the interaction between C and T on biodiesel yield production up to 92%, keeping the experimental conditions of T at 55 °C and C at 1 wt %. ANOVA results in Table 9 confirms that the interaction between C and T is not significant. Moreover, the higher amount of C and higher T might induce saponification of triglycerides as well as form soap at the end [55]. Figure 7b shows the 2D contour plots of CT interaction, which is not significant for SFO biodiesel yield production.
4.5.3. Interaction Effect of Reaction Temperature and Methanol: Oil Molar Ratio
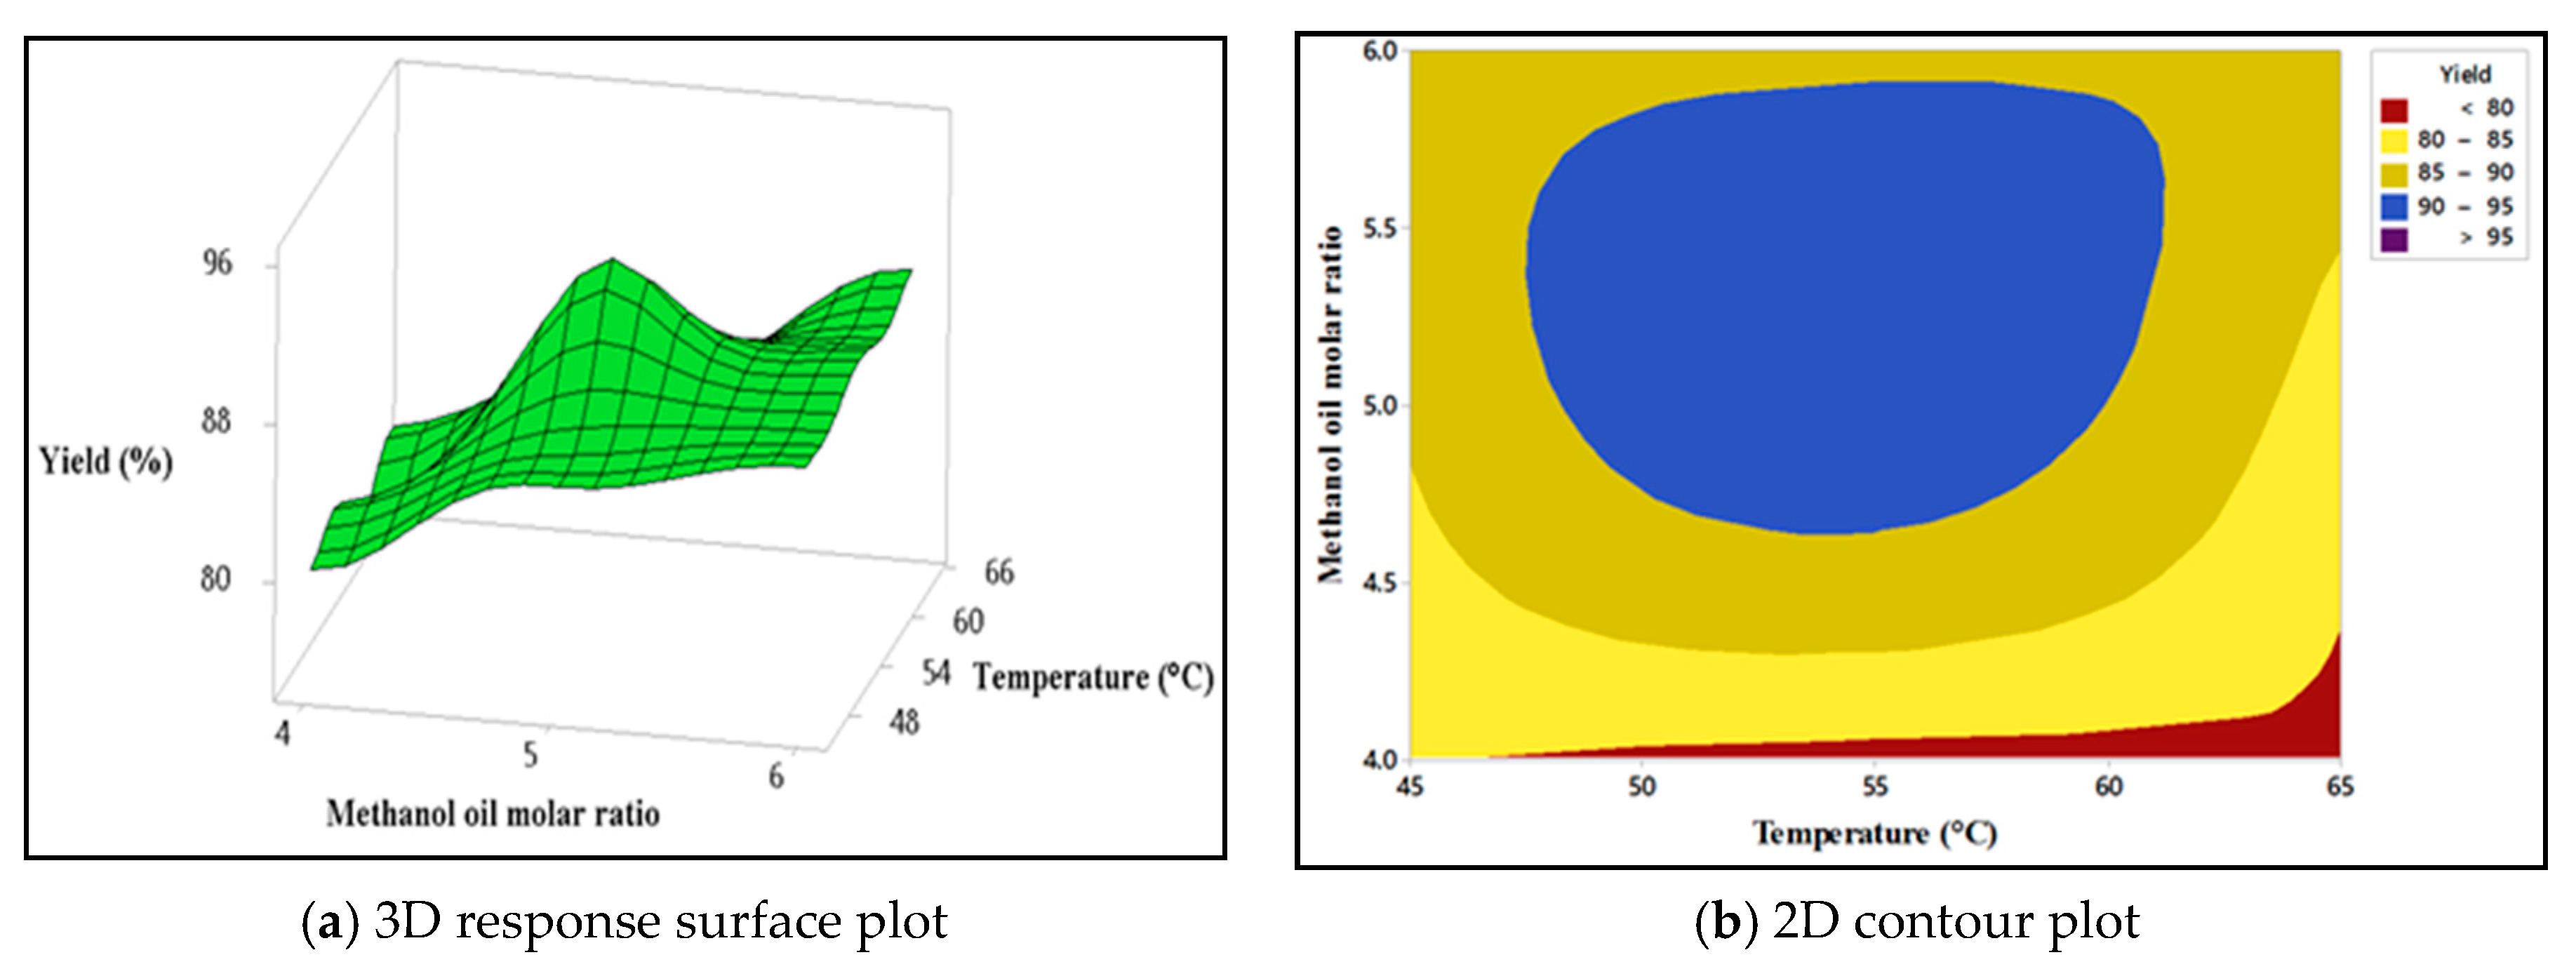
Figure 8a shows the 3D surface plot of reaction temperature, T and methanol: oil molar ratio, M with SFO biodiesel yield. The T at mid-level (55 °C) and mid-level M of 5:1 shows the maximum yield. Table 7 Box–Behnken design matrix shows that, at the mid-level T and mid-level M, a biodiesel yield of 93% can be achieved. However, at mid-level T and the highest level M, biodiesel yield was optimised and found to be 95.8%. The overall biodiesel yield decreased significantly to 89.3% when T reached 65 °C (Run 3). Any change in T either by an increase or decrease from its mid-level (55 °C) resulted in reduced biodiesel yield. The optimum M was found to be 6:1 and any decreasing the molar ratio (<6) lowered the biodiesel yield. Figure 8b shows the contour plot of interaction between M and T. It shows that, at the mid-level of both T and M, biodiesel yield is maximum. Therefore, ANOVA results in Table 9 confirms that both T and TM are not significant in SFO biodiesel production.
From ANOVA results in Table 9, it is found that M is the only highly significant process factor that affects the production of SFO biodiesel. Interaction of MC is also a significant process factor for biodiesel production. Both the M and MC have higher F values of 74.5 and 44.7, respectively. Therefore, the optimum reaction conditions are M of 6:1, KOH C of 0.5 wt % and a T of 55 °C and the optimum SFO biodiesel yield is predicted to be 95.9%. To check the validity of the regression model (Equation (9)), experiments were carried out under predicted optimum conditions. The results of the experimental values under the optimum conditions indicated the highest (95.8%) conversion of SFO to SFO biodiesel. This matches very closely with the predicted value (95.9%). Finally, this small degree of error (<0.5%) indicates the high accuracy of the model.
5. Conclusions
A response surface methodology-based Box–Behnken design matrix was employed to achieve the optimum operating parameters for second-generation biodiesel production from SFO. Three major parameters were varied individually within different ranges to anticipate biodiesel yield in that matrix. Based on the results, optimum operating parameters for transesterification of stone fruit seed oil were found to be methanol: oil molar ratio of 6:1, catalyst concentration 0.5 wt %, and a reaction temperature of 55 °C, considering both reaction time and reaction agitation speed were fixed at 60 min and 600 rpm. The maximum biodiesel yield under such conditions was 95.8%, which also confirmed the RSM model prediction of 95.9%. ANOVA statistics of this study confirmed that methanol: oil molar ratio has the most significant effect on the stone fruit biodiesel yield, whereas catalyst concentration and reaction temperature does not seem to have any significant impact. The results show a significant improvement in fuel properties of stone fruit biodiesel with kinetic viscosity 4.26 (mm2/s), density 0.855 (kg/m3), acid value 0.25 (mg/KOH/g), flash point 105 (°C), cloud point −4 (°C), pour point −8 (°C), higher heating value 39.04 (MJ/kg), cetane number 50.45 and oxidation stability 7.15 (h), all of which meet both the ASTM D6751 and EN14214 standards. In conclusion, stone fruit oil is a potential for biodiesel production, and this environment-friendly biodiesel can be used as an alternative to diesel fuel.
Author Contributions
M.A. collected oil, produced and characterised biodiesel, optimised the biodiesel, and drafted the manuscript; M.G.R. contributed to the experimental design and thoroughly revised the paper; N.A. helped revise and improve the paper; and M.M.R. checked and revised the manuscript.
Funding
This research received no external funding.
Acknowledgments
The authors would like to acknowledge Tim Mcsweeney, Adjunct Research Fellow, Tertiary Education Division at Central Queensland University, Australia for his contribution in proofreading of this article.
Conflicts of Interest
The authors declare no conflict of interest.
References
- Rahman, M.M.; Rasul, M.G.; Hassan, N.M.S.; Azad, A.K.; Uddin, M.N. Effect of small proportion of butanol additive on the performance, emission, and combustion of Australian native first-and second-generation biodiesel in a diesel engine. Environ. Sci. Pollut. Res. 2017, 24, 22402–22413. [Google Scholar] [CrossRef] [PubMed]
- Rahman, M.; Rasul, M.; Hassan, N. Study on the tribological characteristics of Australian native first generation and second generation biodiesel fuel. Energies 2017, 10, 55. [Google Scholar] [CrossRef]
- Bhuiya, M.M.K.; Rasul, M.G.; Khan, M.M.K.; Ashwath, N.; Azad, A.K.; Hazrat, M.A. Second generation biodiesel: Potential alternative to-edible oil-derived biodiesel. Energy Procedia 2014, 61, 1969–1972. [Google Scholar] [CrossRef]
- Bhuiya, M.M.K.; Rasul, M.G.; Khan, M.M.K.; Ashwath, N.; Azad, A.K.; Hazrat, M.A. Prospects of 2nd generation biodiesel as a sustainable fuel—Part 2: Properties, performance and emission characteristics. Renew. Sustain. Energy Rev. 2016, 55, 1129–1146. [Google Scholar]
- Popp, J.; Lakner, Z.; Harangi-Rákos, M.; Fári, M. The effect of bioenergy expansion: Food, energy, and environment. Renew. Sustain. Energy Rev. 2014, 32, 559–578. [Google Scholar] [CrossRef]
- NguyenThi, T.; Bazile, J.-P.; Bessières, D. Density measurements of waste cooking oil biodiesel and diesel blends over extended pressure and temperature ranges. Energies 2018, 11, 1212. [Google Scholar] [CrossRef]
- Yusop, A.; Mamat, R.; Yusaf, T.; Najafi, G.; Yasin, M.; Khathri, A. Analysis of particulate matter (pm) emissions in diesel engines using palm oil biodiesel blended with diesel fuel. Energies 2018, 11, 1039. [Google Scholar] [CrossRef]
- Ali, O.; Mamat, R.; Najafi, G.; Yusaf, T.; Safieddin Ardebili, S. Optimization of biodiesel-diesel blended fuel properties and engine performance with ether additive using statistical analysis and response surface methods. Energies 2015, 8, 14136–14150. [Google Scholar] [CrossRef]
- Silitonga, A.S.; Atabani, A.E.; Mahlia, T.M.I.; Masjuki, H.H.; Badruddin, I.A.; Mekhilef, S. A review on prospect of jatropha curcas for biodiesel in Indonesia. Renew. Sustain. Energy Rev. 2011, 15, 3733–3756. [Google Scholar] [CrossRef]
- Rahman, M.; Rasul, M.; Hassan, N.; Hyde, J. Prospects of biodiesel production from macadamia oil as an alternative fuel for diesel engines. Energies 2016, 9, 403. [Google Scholar]
- Sharma, R.; Gupta, A.; Abrol, G.S.; Joshi, V.K. Value addition of wild apricot fruits grown in north-west himalayan regions: A review. J. Food Sci. Technol. 2012, 51, 2917–2924. [Google Scholar] [CrossRef] [PubMed]
- Razack, S.A.; Duraiarasan, S. Response surface methodology assisted biodiesel production from waste cooking oil using encapsulated mixed enzyme. Waste Manag. 2016, 47, 98–104. [Google Scholar] [CrossRef] [PubMed]
- Saydut, A.; Erdogan, S.; Kafadar, A.B.; Kaya, C.; Aydin, F.; Hamamci, C. Process optimization for production of biodiesel from hazelnut oil, sunflower oil and their hybrid feedstock. Fuel 2016, 183, 512–517. [Google Scholar] [CrossRef]
- Martínez, S.L.; Romero, R.; Natividad, R.; González, J. Optimization of biodiesel production from sunflower oil by transesterification using Na2O/NaX and methanol. Catal. Today 2014, 220, 12–20. [Google Scholar] [CrossRef]
- Kostić, M.D.; Djalović, I.G.; Stamenković, O.S.; Mitrović, P.M.; Adamović, D.S.; Kulina, M.K.; Veljković, V.B. Kinetic modeling and optimization of biodiesel production from white mustard (Sinapis alba L.) seed oil by quicklime-catalyzed transesterification. Fuel 2018, 223, 125–139. [Google Scholar] [CrossRef]
- Ong, H.C.; Masjuki, H.H.; Mahlia, T.M.I.; Silitonga, A.S.; Chong, W.T.; Leong, K.Y. Optimization of biodiesel production and engine performance from high free fatty acid Calophyllum inophyllum oil in Ci diesel engine. Energy Convers. Manag. 2014, 81, 30–40. [Google Scholar] [CrossRef]
- Dharma, S.; Masjuki, H.H.; Ong, H.C.; Sebayang, A.H.; Silitonga, A.S.; Kusumo, F.; Mahlia, T.M.I. Optimization of biodiesel production process for mixed Jatropha curcas–Ceiba pentandra biodiesel using response surface methodology. Energy Convers. Manag. 2016, 115, 178–190. [Google Scholar] [CrossRef]
- Gumus, M.; Kasifoglu, S. Performance and emission evaluation of a compression ignition engine using a biodiesel (apricot seed kernel oil methyl ester) and its blends with diesel fuel. Biomass Bioenergy 2010, 34, 134–139. [Google Scholar] [CrossRef]
- Fadhil, A.B. Evaluation of apricot (Prunus armeniaca L.) seed kernel as a potential feedstock for the production of liquid bio-fuels and activated carbons. Energy Convers. Manag. 2017, 133, 307–317. [Google Scholar] [CrossRef]
- Ullah, F.; Nosheen, A.; Hussain, I.; Bano, A. Base catalyzed transesterification of wild apricot kernel oil for biodiesel production. Afr. J. Biotechnol. 2009, 8, 3309–3313. [Google Scholar]
- Yadav, A.K.; Pal, A.; Dubey, A.M. Experimental studies on utilization of Prunus armeniaca L. (wild apricot) biodiesel as an alternative fuel for CI engine. Waste Biomass Valoriz. 2017, 1–9. [Google Scholar] [CrossRef]
- Hamze, H.; Akia, M.; Yazdani, F. Optimization of biodiesel production from the waste cooking oil using response surface methodology. Process Saf. Environ. Prot. 2015, 94, 1–10. [Google Scholar] [CrossRef]
- Atabani, A.E.; Silitonga, A.S.; Badruddin, I.A.; Mahlia, T.M.I.; Masjuki, H.H.; Mekhilef, S. A comprehensive review on biodiesel as an alternative energy resource and its characteristics. Renew. Sustain. Energy Rev. 2012, 16, 2070–2093. [Google Scholar] [CrossRef]
- Atadashi, I.M.; Aroua, M.K.; Abdul Aziz, A.R.; Sulaiman, N.M.N. The effects of water on biodiesel production and refining technologies: A review. Renew. Sustain. Energy Rev. 2012, 16, 3456–3470. [Google Scholar] [CrossRef]
- Banerjee, A.; Chakraborty, R. Parametric sensitivity in transesterification of waste cooking oil for biodiesel production—A review. Resour. Conserv. Recycl. 2009, 53, 490–497. [Google Scholar] [CrossRef]
- Yaakob, Z.; Mohammad, M.; Alherbawi, M.; Alam, Z.; Sopian, K. Overview of the production of biodiesel from waste cooking oil. Renew. Sustain. Energy Rev. 2013, 18, 184–193. [Google Scholar] [CrossRef]
- Targais, K.; Stobdan, T.; Yadav, A.; Singh, S.B. Extraction of apricot kernel oil in cold desert Ladakh, India. Indian J. Tradit. Knowl. 2011, 10, 304–306. [Google Scholar]
- Wang, L. Properties of manchurian apricot (Prunus mandshurica Skv.) and siberian apricot (Prunus sibirica L.) seed kernel oils and evaluation as biodiesel feedstocks. Ind. Crops Prod. 2013, 50, 838–843. [Google Scholar] [CrossRef]
- Fan, S.; Liang, T.; Yu, H.; Bi, Q.; Li, G.; Wang, L. Kernel characteristics, oil contents, fatty acid compositions and biodiesel properties in developing siberian apricot (Prunus sibirica L.) seeds. Ind. Crops Prod. 2016, 89, 195–199. [Google Scholar] [CrossRef]
- Rahman, M.M.; Hassan, M.H.; Kalam, M.A.; Atabani, A.E.; Memon, L.A.; Rahman, S.M.A. Performance and emission analysis of Jatropha curcas and Moringa oleifera methyl ester fuel blends in a multi-cylinder diesel engine. J. Clean. Prod. 2014, 65, 304–310. [Google Scholar] [CrossRef]
- Kafuku, G.; Mbarawa, M. Alkaline catalyzed biodiesel production from moringa oleifera oil with optimized production parameters. Appl. Energy 2010, 87, 2561–2565. [Google Scholar] [CrossRef]
- Alptekin, E.; Canakci, M. Determination of the density and the viscosities of biodiesel–diesel fuel blends. Renew. Energy 2008, 33, 2623–2630. [Google Scholar] [CrossRef]
- Encinar, J.M.; González, J.F.; Rodríguez-Reinares, A. Biodiesel from used frying oil. Variables affecting the yields and characteristics of the biodiesel. Ind. Eng. Chem. Res. 2005, 44, 5491–5499. [Google Scholar] [CrossRef]
- Graboski, M.S.; McCormick, R.L. Combustion of fat and vegetable oil derived fuels in diesel engines. Prog. Energy Combust. Sci. 1998, 24, 125–164. [Google Scholar] [CrossRef]
- Silitonga, A.S.; Ong, H.C.; Mahlia, T.M.I.; Masjuki, H.H.; Chong, W.T. Biodiesel conversion from high FFA crude Jatropha curcas, Calophyllum inophyllum and Ceiba pentandra oil. Energy Procedia 2014, 61, 480–483. [Google Scholar] [CrossRef]
- Silitonga, A.S.; Ong, H.C.; Masjuki, H.H.; Mahlia, T.M.I.; Chong, W.T.; Yusaf, T.F. Production of biodiesel from Sterculia foetida and its process optimization. Fuel 2013, 111, 478–484. [Google Scholar] [CrossRef] [Green Version]
- Keera, S.T.; El Sabagh, S.M.; Taman, A.R. Transesterification of vegetable oil to biodiesel fuel using alkaline catalyst. Fuel 2011, 90, 42–47. [Google Scholar] [CrossRef]
- Hasni, K.; Ilham, Z.; Dharma, S.; Varman, M. Optimization of biodiesel production from Brucea javanica seeds oil as novel non-edible feedstock using response surface methodology. Energy Convers. Manag. 2017, 149, 392–400. [Google Scholar] [CrossRef]
- Anwar, M.; Rasul, M.G.; Ashwath, N. Production optimization and quality assessment of papaya (Carica papaya) biodiesel with response surface methodology. Energy Convers. Manag. 2018, 156, 103–112. [Google Scholar] [CrossRef]
- Benjumea, P.; Agudelo, J.R.; Agudelo, A.F. Effect of the degree of unsaturation of biodiesel fuels on engine performance, combustion characteristics, and emissions. Energy Fuels 2011, 25, 77–85. [Google Scholar] [CrossRef]
- Altun, Ş. Effect of the degree of unsaturation of biodiesel fuels on the exhaust emissions of a diesel power generator. Fuel 2014, 117, 450–457. [Google Scholar] [CrossRef]
- Wang, L.; Yu, H. Biodiesel from siberian apricot (Prunus sibirica L.) seed kernel oil. Bioresour. Technol. 2012, 112, 355–358. [Google Scholar] [CrossRef] [PubMed]
- Kate, A.E.; Lohani, U.C.; Pandey, J.P.; Shahi, N.C.; Sarkar, A. Traditional and mechanical method of the oil extraction from wild apricot kernel: A comparative study. Res. J. Chem. Environ. Sci. 2014, 2, 54–60. [Google Scholar]
- Atabani, A.E.; César, A.D.S. Calophyllum inophyllum L.—A prospective non-edible biodiesel feedstock. Study of biodiesel production, properties, fatty acid composition, blending and engine performance. Renew. Sustain. Energy Rev. 2014, 37, 644–655. [Google Scholar] [CrossRef]
- García-Martínez, N.; Andreo-Martínez, P.; Quesada-Medina, J.; de los Ríos, A.P.; Chica, A.; Beneito-Ruiz, R.; Carratalá-Abril, J. Optimization of non-catalytic transesterification of tobacco (Nicotiana tabacum) seed oil using supercritical methanol to biodiesel production. Energy Convers. Manag. 2017, 131, 99–108. [Google Scholar] [CrossRef]
- Goyal, P.; Sharma, M.P.; Jain, S. Optimization of conversion of high free fatty acid Jatropha curcas oil to biodiesel using response surface methodology. ISRN Chem. Eng. 2012, 2012, 8. [Google Scholar] [CrossRef]
- Lin, L.; Zhou, C.; Vittayapadung, S.; Shen, X.; Dong, M. Opportunities and challenges for biodiesel fuel. Appl. Energy 2011, 88, 1020–1031. [Google Scholar] [CrossRef]
- Demirbaş, A. Biodiesel fuels from vegetable oils via catalytic and non-catalytic supercritical alcohol transesterifications and other methods: A survey. Energy Convers. Manag. 2003, 44, 2093–2109. [Google Scholar] [CrossRef]
- Shankar, V.; Jambulingam, R. Waste crab shell derived CaO impregnated Na-ZSM-5 as a solid base catalyst for the transesterification of neem oil into biodiesel. Sustain. Environ. Res. 2017, 27, 273–278. [Google Scholar] [CrossRef]
- Patel, R.L.; Sankhavara, C.D. Biodiesel production from karanja oil and its use in diesel engine: A review. Renew. Sustain. Energy Rev. 2017, 71, 464–474. [Google Scholar] [CrossRef]
- Rashid, U.; Anwar, F.; Moser, B.R.; Knothe, G. Moringa oleifera oil: A possible source of biodiesel. Bioresour. Technol. 2008, 99, 8175–8179. [Google Scholar] [CrossRef] [PubMed]
- Silitonga, A.S.; Masjuki, H.H.; Mahlia, T.M.I.; Ong, H.C.; Chong, W.T.; Boosroh, M.H. Overview properties of biodiesel diesel blends from edible and non-edible feedstock. Renew. Sustain. Energy Rev. 2013, 22, 346–360. [Google Scholar] [CrossRef]
- Gupta, J.; Agarwal, M.; Dalai, A.K. Optimization of biodiesel production from mixture of edible and nonedible vegetable oils. Biocatal. Agric. Biotechnol. 2016, 8, 112–120. [Google Scholar] [CrossRef]
- Silva, G.F.; Camargo, F.L.; Ferreira, A.L.O. Application of response surface methodology for optimization of biodiesel production by transesterification of soybean oil with ethanol. Fuel Process. Technol. 2011, 92, 407–413. [Google Scholar] [CrossRef]
- Vicente, G.; Martínez, M.; Aracil, J. Optimisation of integrated biodiesel production. Part I. A study of the biodiesel purity and yield. Bioresour. Technol. 2007, 98, 1724–1733. [Google Scholar] [CrossRef] [PubMed]
Figure 1.
Graphical representation of producing biodiesel from SFO biodiesel.

Figure 2.
GC Chromatogram of SFO biodiesel.
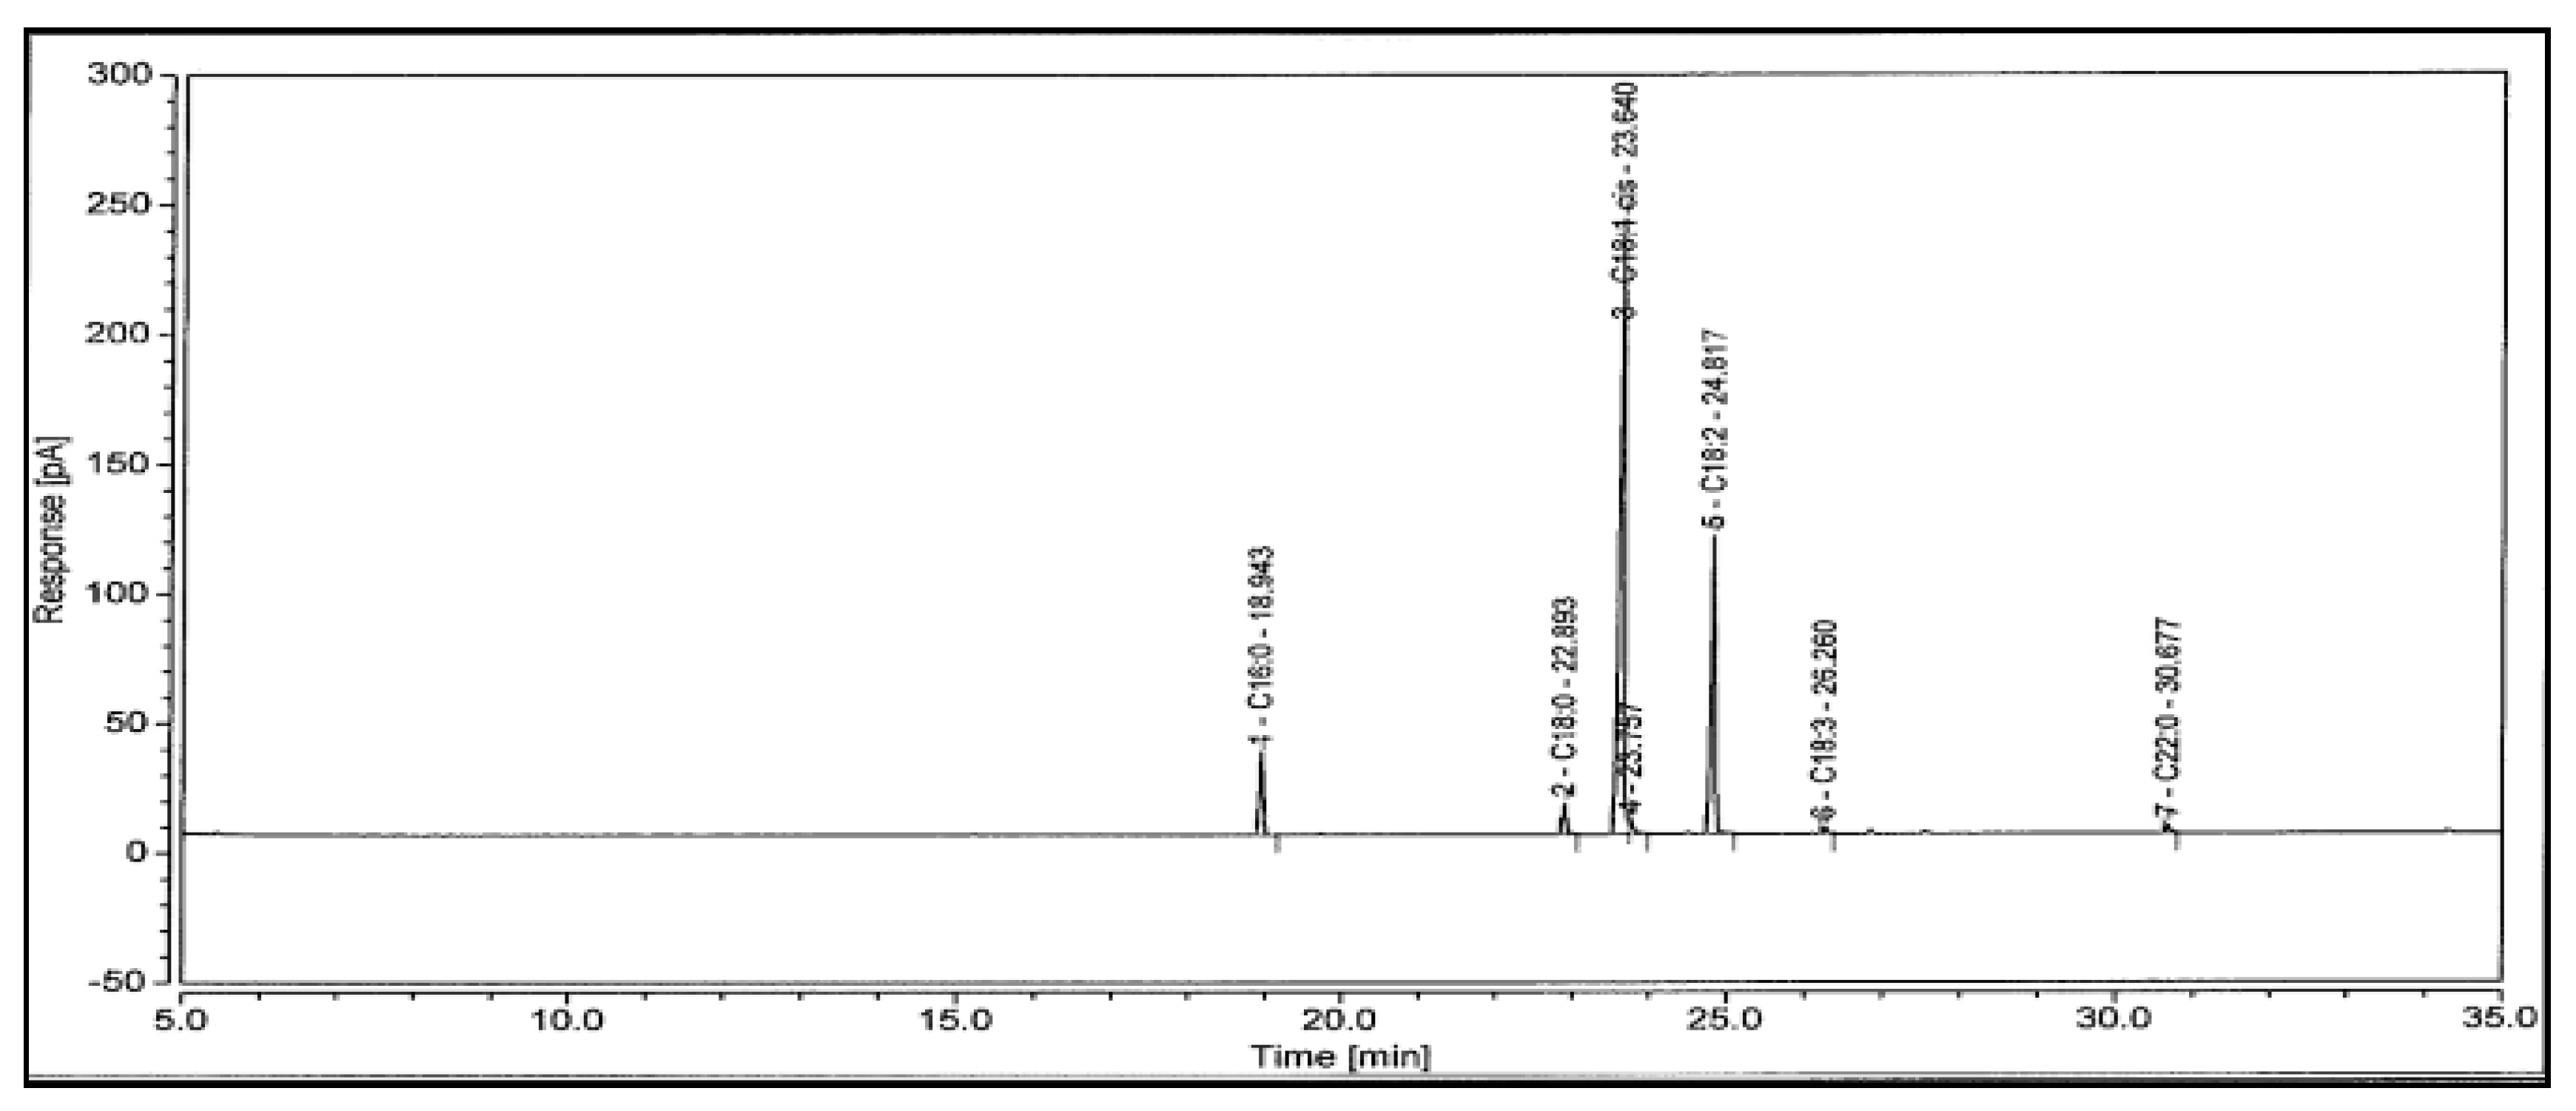
Figure 3.
Comparison of the fatty acid composition of SFO and other non-edible vegetable oils.

Figure 4.
Fourier transforms infrared (FTIR) spectrum of SFO biodiesel.
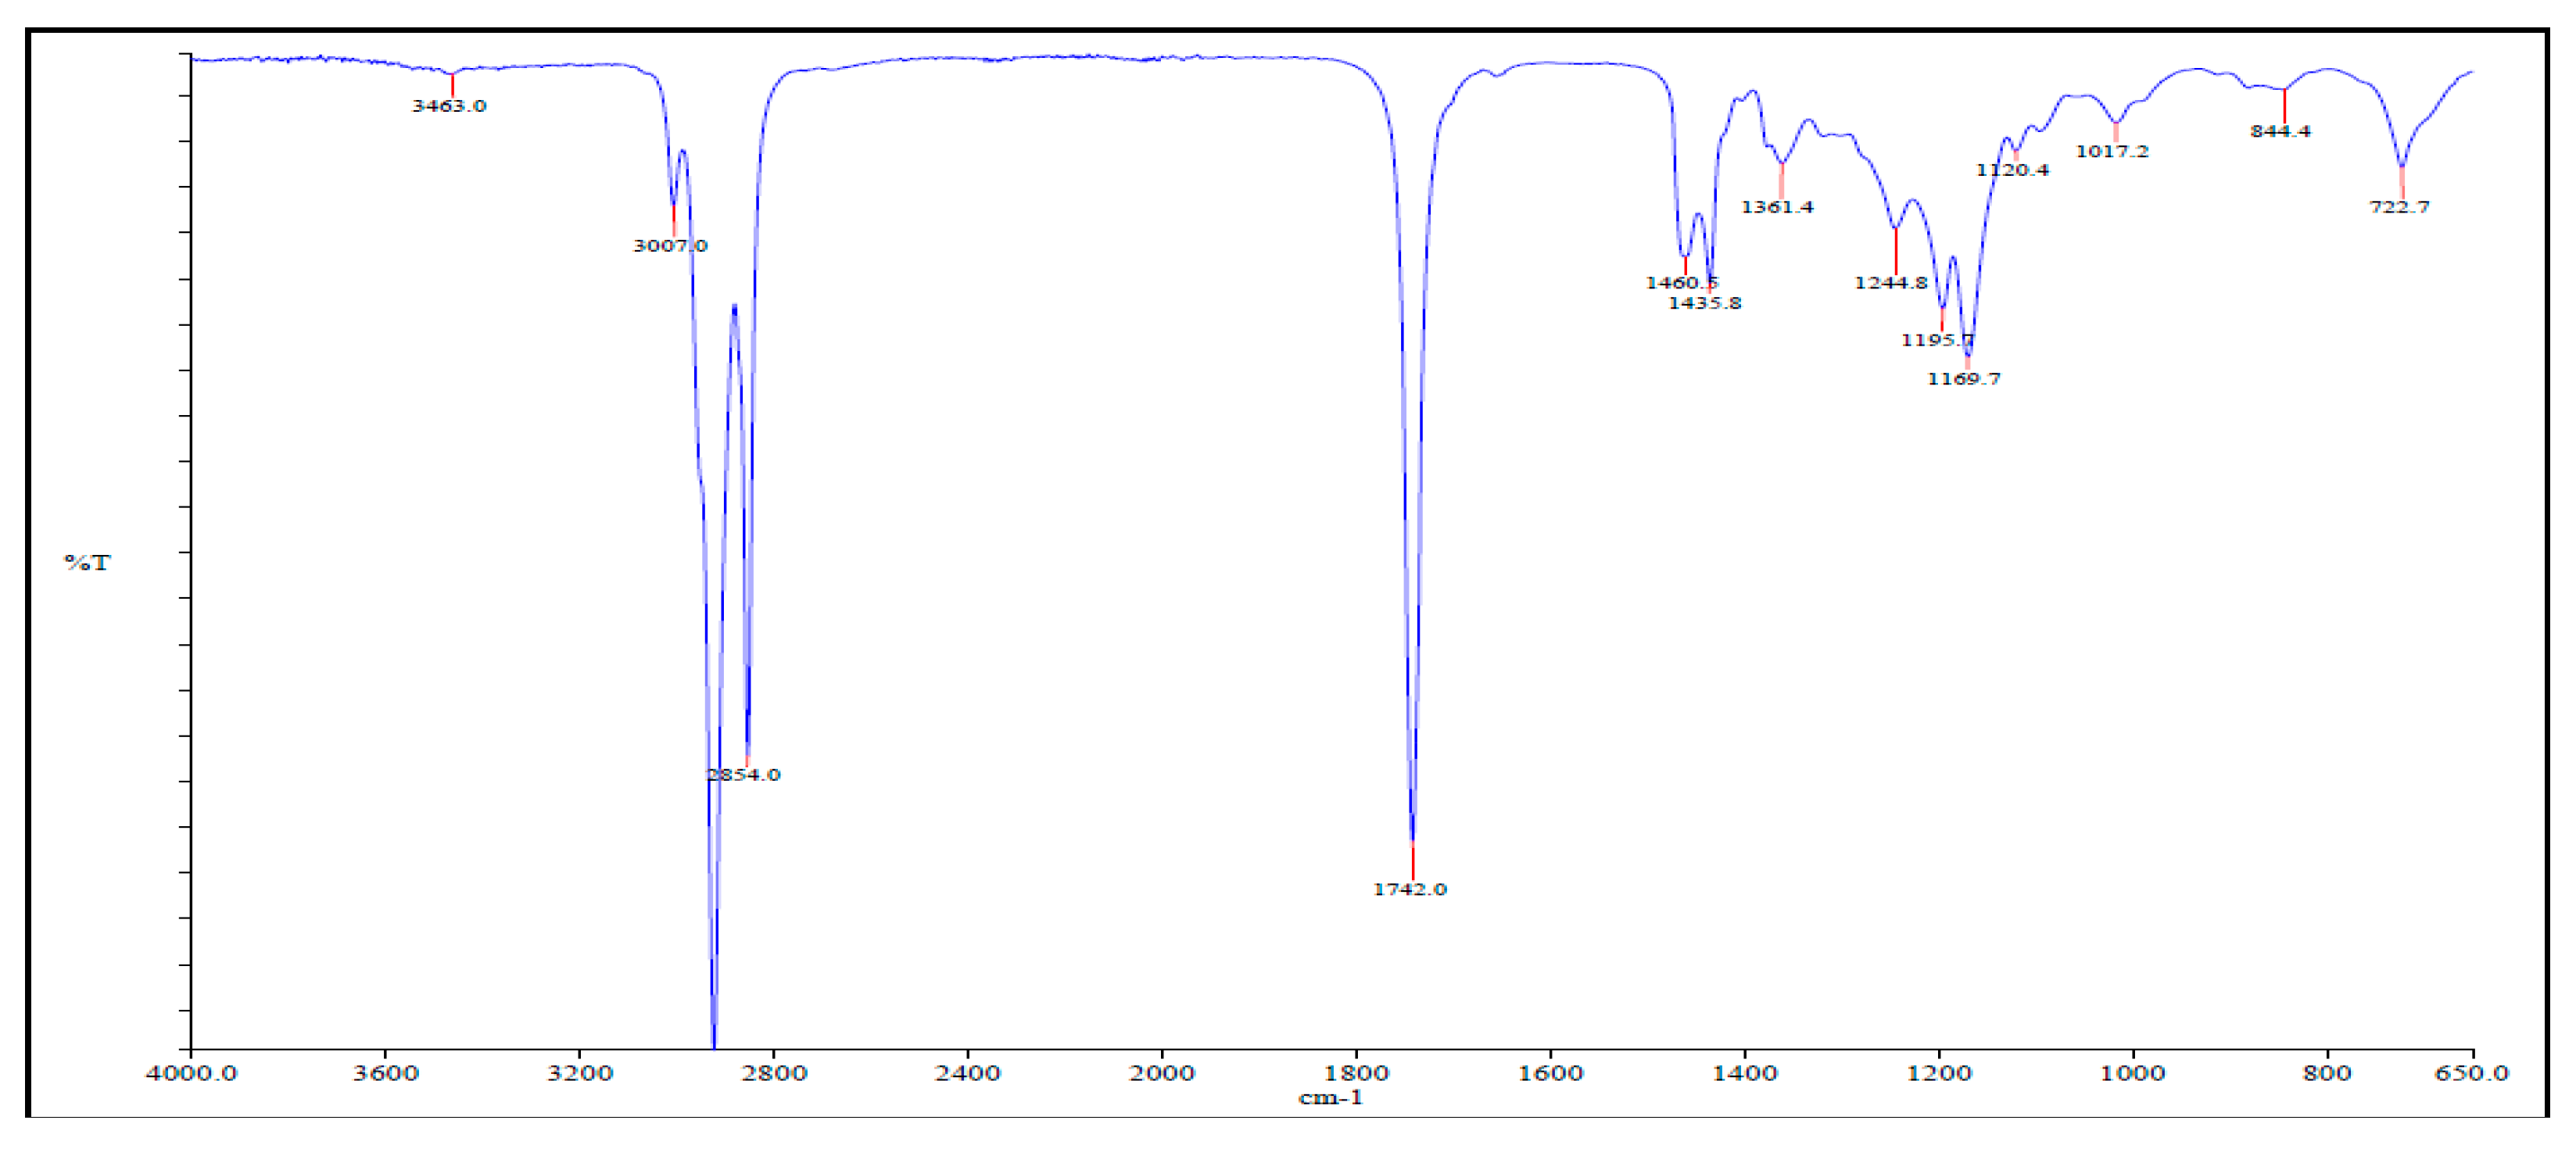
Figure 5.
Biodiesel yield values (%): (a) Experimental versus (b) RSM predicted.

Figure 6.
Interaction effect of methanol: oil molar ratio (M) and catalyst concentration (C) on the SFO biodiesel yield.
Figure 6.
Interaction effect of methanol: oil molar ratio (M) and catalyst concentration (C) on the SFO biodiesel yield.
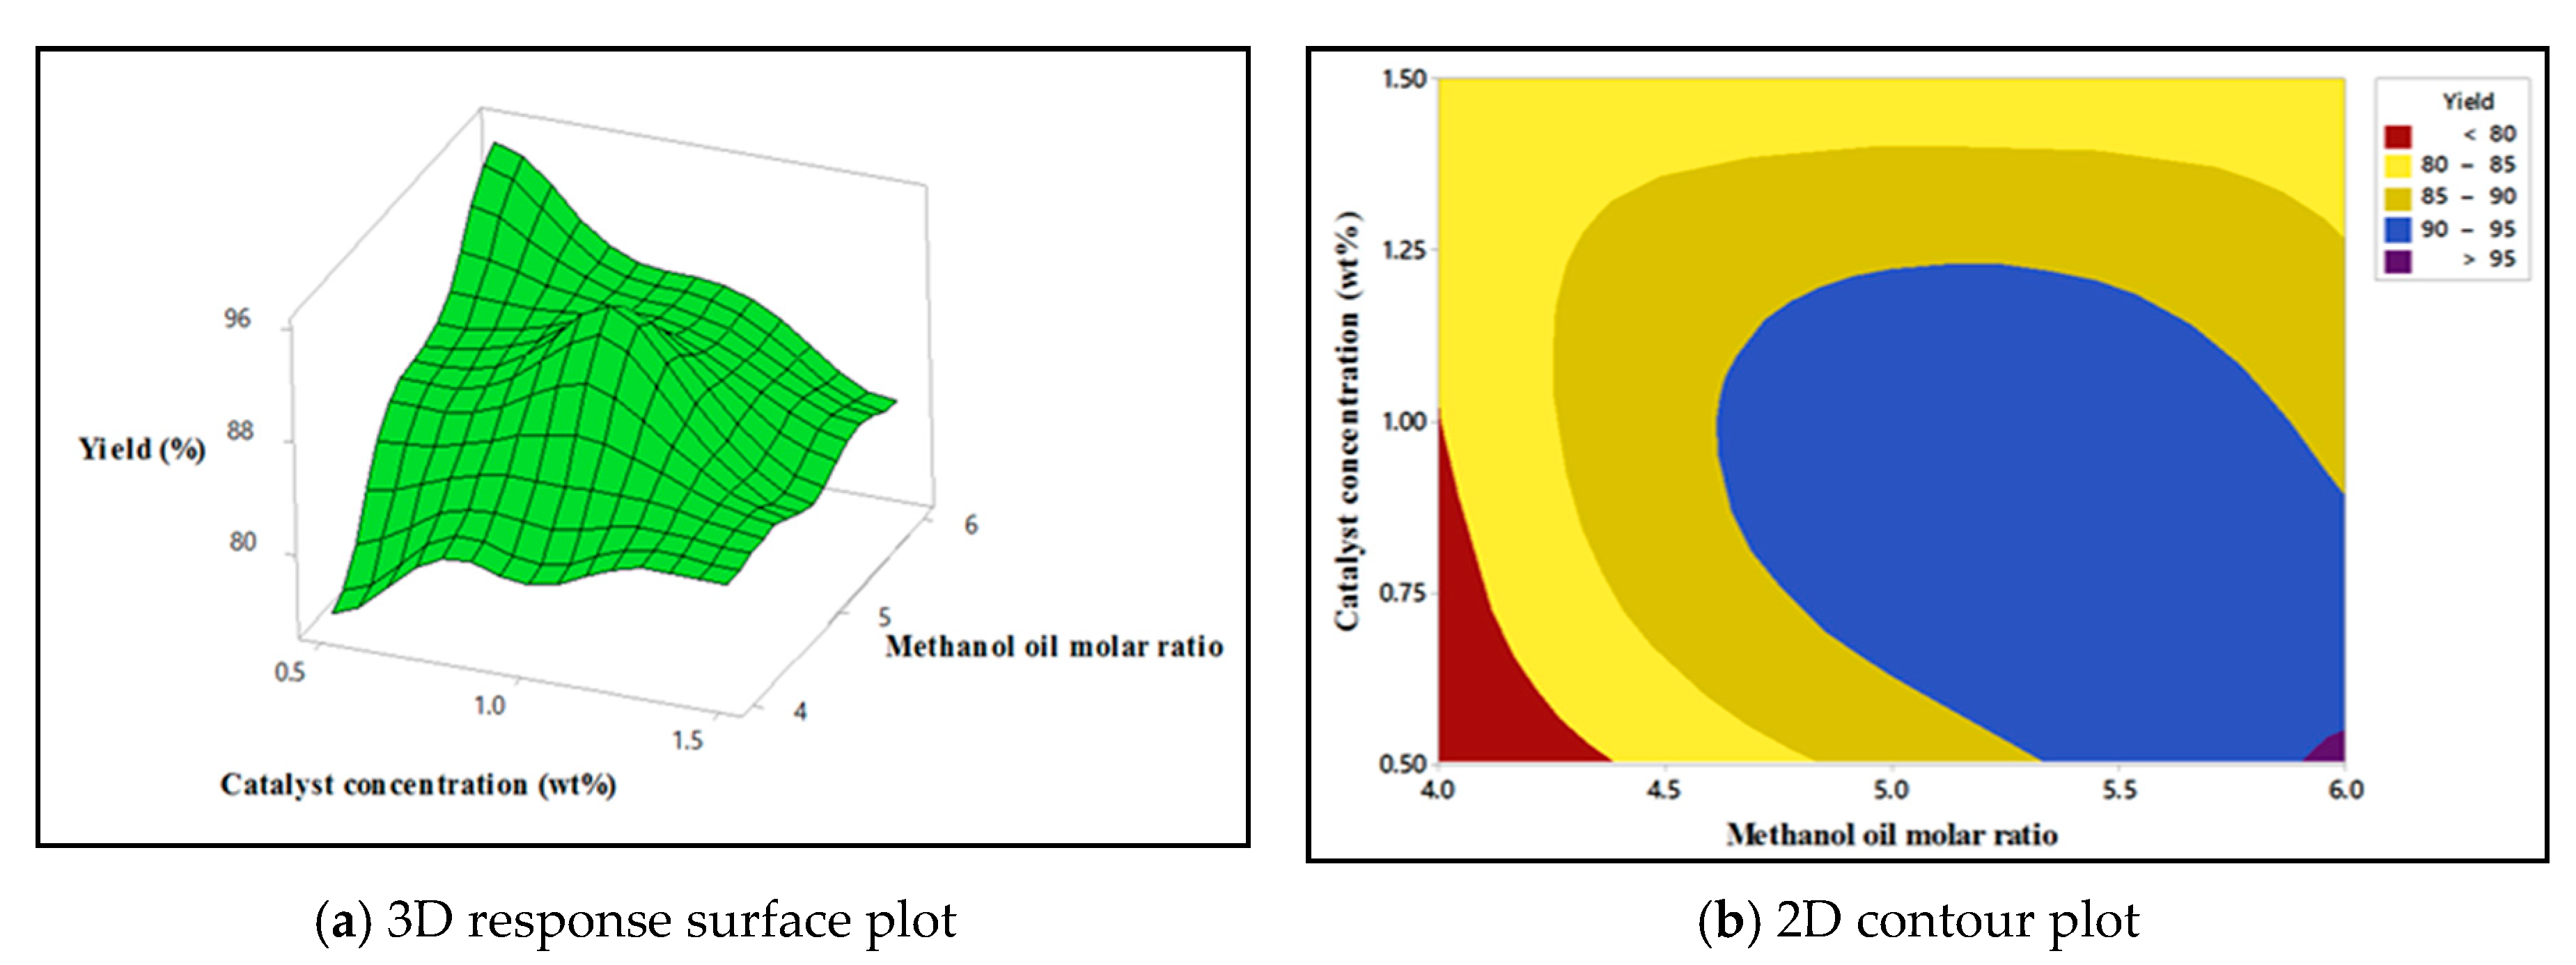
Figure 7.
Interaction effect of reaction temperature (T) and catalyst concentration (C) on SFO biodiesel yield.
Figure 7.
Interaction effect of reaction temperature (T) and catalyst concentration (C) on SFO biodiesel yield.

Figure 8.
Interaction effect of methanol: oil molar ratio (M) and reaction temperature (T) on SFO biodiesel yield.
Figure 8.
Interaction effect of methanol: oil molar ratio (M) and reaction temperature (T) on SFO biodiesel yield.

Table 1.
Experimental range and levels coded for independent factors.
| Factors/Variables | Unit | Symbol Coded | Range and Levels | ||
|---|---|---|---|---|---|
| −1 | 0 | +1 | |||
| Methanol: Oil ratio | mol/mol | M | 4:1 | 5:1 | 6:1 |
| KOH catalyst concentration | wt % | C | 0.5 | 1.00 | 1.5 |
| Temperature | °C | T | 45 | 55 | 65 |
Table 2.
Physical and chemical properties of SFO.
| Properties | Units | SFO This Study | SFO [18] | SFO [21] | SFO [11] | Petro Diesel |
|---|---|---|---|---|---|---|
| Kinematic Viscosity @ 40 °C | m2/s | 34.54 | 34.82 | 20.53 | 26.22 | 3.23 |
| Density | kg/m3 | 910 | 920 | 913 | 916.6 | 827.2 |
| Specific Gravity @ 15 °C | g/cm3 | 0.91 | 0.91 | 0.91 | 0.91 | 0.83 |
| Acid value | mg KOH/g | 1.65 | 2.60 | 0.68 | 0.05 | |
| Calorific value | MJ/kg | 38.4 | 39.6 | 31.5 | 45.3 | |
| Saponification number | mg KOH/g | 173 | 188 | 187 | ||
| Iodine value | mgI2/100 g | 103 | 90 | 101 |
Table 3.
Comparison of SFO biodiesel with other non-edible biodiesels.
| Non-Edible Biodiesels | Density (kg/m3) | Viscosity at 40 °C, mm2/s | Acid Value, mg KOH/g | Cetane Number (CN) | Calorific Value, MJ/Kg | Flash Point, °C | Iodine Value (IV) mgl2/100 g | Oxidation Stability (OS), h |
|---|---|---|---|---|---|---|---|---|
| SFO this study | 855.0 | 4.26 | 0.25 | 50.45 | 39.64 | 105 | 104.70 | 7.15 |
| SFO [18] | 884.3 | 4.92 | 39.95 | 111 | ||||
| SFO [21] | 857.0 | 5.20 | 0.32 | 58.70 | 38.93 | 180 | 100.70 | 6.30 |
| SFO [11] | 879.4 | 4.21 | 0.08 | 39.12 | 170 | 100.66 | ||
| Petro diesel [39] | 827.2 | 3.23 | 0.05 | 48.00 | 45.30 | 68.5 | 38.3 | 39.0 |
| Tobacco [23,38] | 888.5 | 4.23 | 51.60 | 165.4 | 136 | 0.80 | ||
| PSO [39] | 840.0 | 3.53 | 0.42 | 48.29 | 38.49 | 112 | 115.89 | 5.61 |
| Jatropha [38] | 879.5 | 4.80 | 0.40 | 51.60 | 39.23 | 135 | 104 | 2.30 |
| Rapeseed [23] | 882.0 | 4.43 | 54.40 | 37.00 | 170 | 7.60 | ||
| Cottonseed [23] | 875.0 | 4.07 | 0.16 | 54.13 | 40.43 | 150 | 1.83 | |
| Neem [23,38] | 868.0 | 5.21 | 0.65 | 39.81 | 76 | 7.10 | ||
| Karanja [38] | 931.0 | 6.13 | 0.42 | 55.00 | 43.42 | 95 | ||
| Moringa [23] | 883.0 | 5.00 | 0.18 | 67.1 | 160 | 74 | 2.3 | |
| ASTM D6751 | 880.0 | 1.9~6.0 | maximum 0.5 | minimum 47 | 93~170 | minimum 3 | ||
| EN14214 | 860~900 | 3.5~5.0 | maximum 0.5 | minimum 51 | 35 | >120 | maximum 120 | minimum 6 |
Table 4.
The fatty acid composition of SFO.
| Fatty Acids. | Formula | Molecular Weight | Structure | wt % |
|---|---|---|---|---|
| Palmitic | C16H32O2 | 256 | 16:0 | 5.85 |
| Stearic | C18H36O2 | 284 | 18:0 | 2.51 |
| Oleic | C18H34O2 | 282 | 18:1 | 63.8 |
| Linoleic | C18H32O2 | 280 | 18:2 | 25.3 |
| Linolenic | C18H30O2 | 278 | 18:3 | 0.51 |
| Behenic | C22H44O2 | 340 | 22:0 | 0.66 |
| Others | 1.29 | |||
| Total Saturated Fatty Acids (SFA) | 9.02 | |||
| Total Monounsaturated Fatty Acids (MUFA) | 63.84 | |||
| Total Polyunsaturated Fatty Acids (PUFA) | 25.85 | |||
| The degree of Unsaturation (DU) | 115.5 | |||
| Long Chain Saturated Factor (LCSF) | 2.83 | |||
Table 5.
Variations in the main fatty acid compositions of selected biodiesel feedstocks.
| Non-Edible Biodiesels | Fatty Acids (% w/w) | Ref. | |||||
|---|---|---|---|---|---|---|---|
| C16:0 | C18:0 | C18:1 | C18:2 | C18:3 | Others | ||
| SFO this study | 5.85 | 2.51 | 63.84 | 25.34 | 0.51 | 1.95 | |
| SFO | 5.62 | 1.27 | 67.31 | 24.68 | 0.08 | 1.04 | [18] |
| SFO | 4.20 | 2.32 | 71.00 | 20.15 | 1.20 | 1.13 | [21] |
| SFO | 3.87 | 0.92 | 67.21 | 27.12 | 0.11 | 0.77 | [28] |
| SFO | 3.79 | 1.01 | 65.23 | 28.92 | 0.14 | 0.91 | [42] |
| SFO | 66.20 | 28.20 | 5.60 | [43] | |||
| PSO | 6.07 | 3.13 | 47.73 | 37.25 | 1.78 | 4.04 | [39] |
| Tobacco | 8.90 | 3.50 | 14.10 | 70.10 | 1.00 | 2.40 | [45] |
| Jatropha | 16.20 | 8.20 | 38.40 | 36.80 | 0.40 | 0 | [46] |
| Rapeseed | 3.49 | 0.85 | 64.40 | 22.30 | 8.23 | 0.73 | [47] |
| Cottonseed | 28.70 | 0.90 | 13.00 | 57.40 | 0 | 0 | [48] |
| Neem | 12.00 | 10.00 | 61.00 | 16.00 | 0 | 1.00 | [49] |
| Karanja | 9.80 | 6.20 | 72.20 | 11.80 | 0 | 0 | [50] |
| Moringa | 6.50 | 6.00 | 72.20 | 1.0 | 0.65 | 13.65 | [51] |
Table 6.
Functional groups of SFO biodiesel detected in the FTIR spectrum.
| Wavenumber (cm−1) | Group Attribution | Vibration Type | Functional Groups | Absorption Intensity |
|---|---|---|---|---|
| 2924 | =C–H | Asymmetric stretching vibration | Alkyl | Strong |
| 2854 | –CH2 | Symmetric stretching vibration | Aromatic | Strong |
| 1742 | –C=O | Stretching | Carbonyl | Strong |
| 1460.5 | –CH2 | Shear-type vibration | Alkanes | Weak |
| 1244.8 | –CH3 | Bending vibration | Alkanes | Weak |
| 1195.7 | C–O–C | Anti-symmetric stretching vibration | Ethers | Middling |
| 1169.7 | C–O–C | Anti-symmetric stretching vibration | Ethers | Middling |
| 1120.4 | C–O–C | Anti-symmetric stretching vibration | Ethers | Weak |
| 1017.2 | C–O–C | Anti-symmetric stretching vibration | Ethers | Weak |
| 722.7 | –CH2 | Plane rocking vibration | Aromatic | Weak |
Table 7.
Experimental matrix and results for Box-Behnken design model. The combination in italics shows the best combination for SFO biodiesel production.
Table 7.
Experimental matrix and results for Box-Behnken design model. The combination in italics shows the best combination for SFO biodiesel production.
| Exp. Number | Run Order | M | C | T | Methanol: Oil (Molar Ratio) | KOH (wt %) | Temp (°C) | SFO Biodiesel Yield (%) | |
|---|---|---|---|---|---|---|---|---|---|
| Experimental | Predicted | ||||||||
| 1 | 7 | 0 | −1 | −1 | 5 | 0.5 | 45 | 86.65 | 85.27 |
| 2 | 13 | 1 | −1 | 0 | 6 | 0.5 | 55 | 95.75 | 95.89 |
| 3 | 14 | 0 | 0 | 0 | 5 | 1 | 55 | 91.65 | 92.98 |
| 4 | 12 | −1 | 0 | −1 | 4 | 1 | 45 | 80.34 | 80.85 |
| 5 | 15 | 1 | 0 | −1 | 6 | 1 | 45 | 87.71 | 88.95 |
| 6 | 6 | −1 | −1 | 0 | 4 | 0.5 | 55 | 75.24 | 76.12 |
| 7 | 9 | −1 | 1 | 0 | 4 | 1.5 | 55 | 82.27 | 82.13 |
| 8 | 11 | 0 | 0 | 0 | 5 | 1 | 55 | 93.65 | 92.98 |
| 9 | 5 | 0 | 0 | 0 | 5 | 1 | 55 | 93.65 | 92.98 |
| 10 | 8 | 0 | 1 | −1 | 5 | 1.5 | 45 | 84.58 | 84.21 |
| 11 | 4 | 1 | 1 | 0 | 6 | 1.5 | 55 | 82.11 | 81.23 |
| 12 | 3 | 1 | 0 | 1 | 6 | 1 | 65 | 89.33 | 88.82 |
| 13 | 2 | −1 | 1 | 1 | 4 | 1 | 65 | 79.30 | 78.06 |
| 14 | 1 | 0 | −1 | 1 | 5 | 0.5 | 65 | 86.71 | 87.08 |
| 15 | 10 | 0 | 1 | 1 | 5 | 1.5 | 65 | 78.10 | 79.48 |
Table 8.
Regression coefficient of the predicted quadratic polynomial model.
| Term. | Coefficients | Standard Errors | Computed T-Value | p Value |
|---|---|---|---|---|
| Constant | 92.983 | 0.893 | 104.17 | 0.000 |
| M | 4.719 | 0.547 | 8.63 | 0.000 |
| C | −2.161 | 0.547 | −3.95 | 0.011 |
| T | −0.730 | 0.547 | −1.34 | 0.239 |
| M × M | −4.490 | 0.805 | −5.58 | 0.003 |
| C × C | −4.650 | 0.805 | −5.78 | 0.002 |
| T × T | −4.323 | 0.805 | −5.37 | 0.003 |
| M × C | −5.168 | 0.773 | −6.69 | 0.001 |
| M × T | 0.665 | 0.773 | 0.86 | 0.429 |
| C × T | −1.635 | 0.773 | −2.12 | 0.088 |
Table 9.
ANOVA results for SFO biodiesel.
| Source | Sum of Squares | Degree of Freedom | Mean Square | F-Value | p-Value | Remarks |
|---|---|---|---|---|---|---|
| Model | 532.603 | 9 | 59.178 | 24.76 | 0.001 | Significant |
| M-Methanol | 178.123 | 1 | 178.123 | 74.53 | 0.000 | Highly significant |
| C-Catalyst | 37.364 | 1 | 37.364 | 15.63 | 0.011 | Significant |
| T-Temperature | 4.263 | 1 | 4.263 | 1.78 | 0.239 | Not significant |
| M2 | 74.447 | 1 | 74.447 | 31.15 | 0.003 | Significant |
| C2 | 79.847 | 1 | 79.847 | 27.00 | 0.002 | Significant |
| T2 | 69.004 | 1 | 69.004 | 28.87 | 0.003 | Significant |
| MC | 106.823 | 1 | 106.823 | 44.69 | 0.001 | Significant |
| MT | 1.769 | 1 | 1.769 | 0.74 | 0.429 | Not significant |
| CT | 10.693 | 1 | 10.693 | 4.47 | 0.088 | Not significant |
| Lack of Fit | 9.284 | 3 | 3.095 | 2.32 | 0.315 | Not Significant |
| Pure Error | 2.667 | 2 | 1.333 | |||
| Total | 544.553 | 14 | ||||
| R2 = 0.9781 | Adj R2 = 0.9386 | |||||
© 2018 by the authors. Licensee MDPI, Basel, Switzerland. This article is an open access article distributed under the terms and conditions of the Creative Commons Attribution (CC BY) license (http://creativecommons.org/licenses/by/4.0/).
Share and Cite
MDPI and ACS Style
Anwar, M.; Rasul, M.G.; Ashwath, N.; Rahman, M.M. Optimisation of Second-Generation Biodiesel Production from Australian Native Stone Fruit Oil Using Response Surface Method. Energies 2018, 11, 2566. https://doi.org/10.3390/en11102566
AMA Style
Anwar M, Rasul MG, Ashwath N, Rahman MM. Optimisation of Second-Generation Biodiesel Production from Australian Native Stone Fruit Oil Using Response Surface Method. Energies. 2018; 11(10):2566. https://doi.org/10.3390/en11102566
Chicago/Turabian StyleAnwar, Mohammad, Mohammad G. Rasul, Nanjappa Ashwath, and Md Mofijur Rahman. 2018. "Optimisation of Second-Generation Biodiesel Production from Australian Native Stone Fruit Oil Using Response Surface Method" Energies 11, no. 10: 2566. https://doi.org/10.3390/en11102566
Note that from the first issue of 2016, this journal uses article numbers instead of page numbers. See further details here.