Fast Power Reserve Emulation Strategy for VSWT Supporting Frequency Control in Multi-Area Power Systems

 , , and
Abstract
:1. Introduction
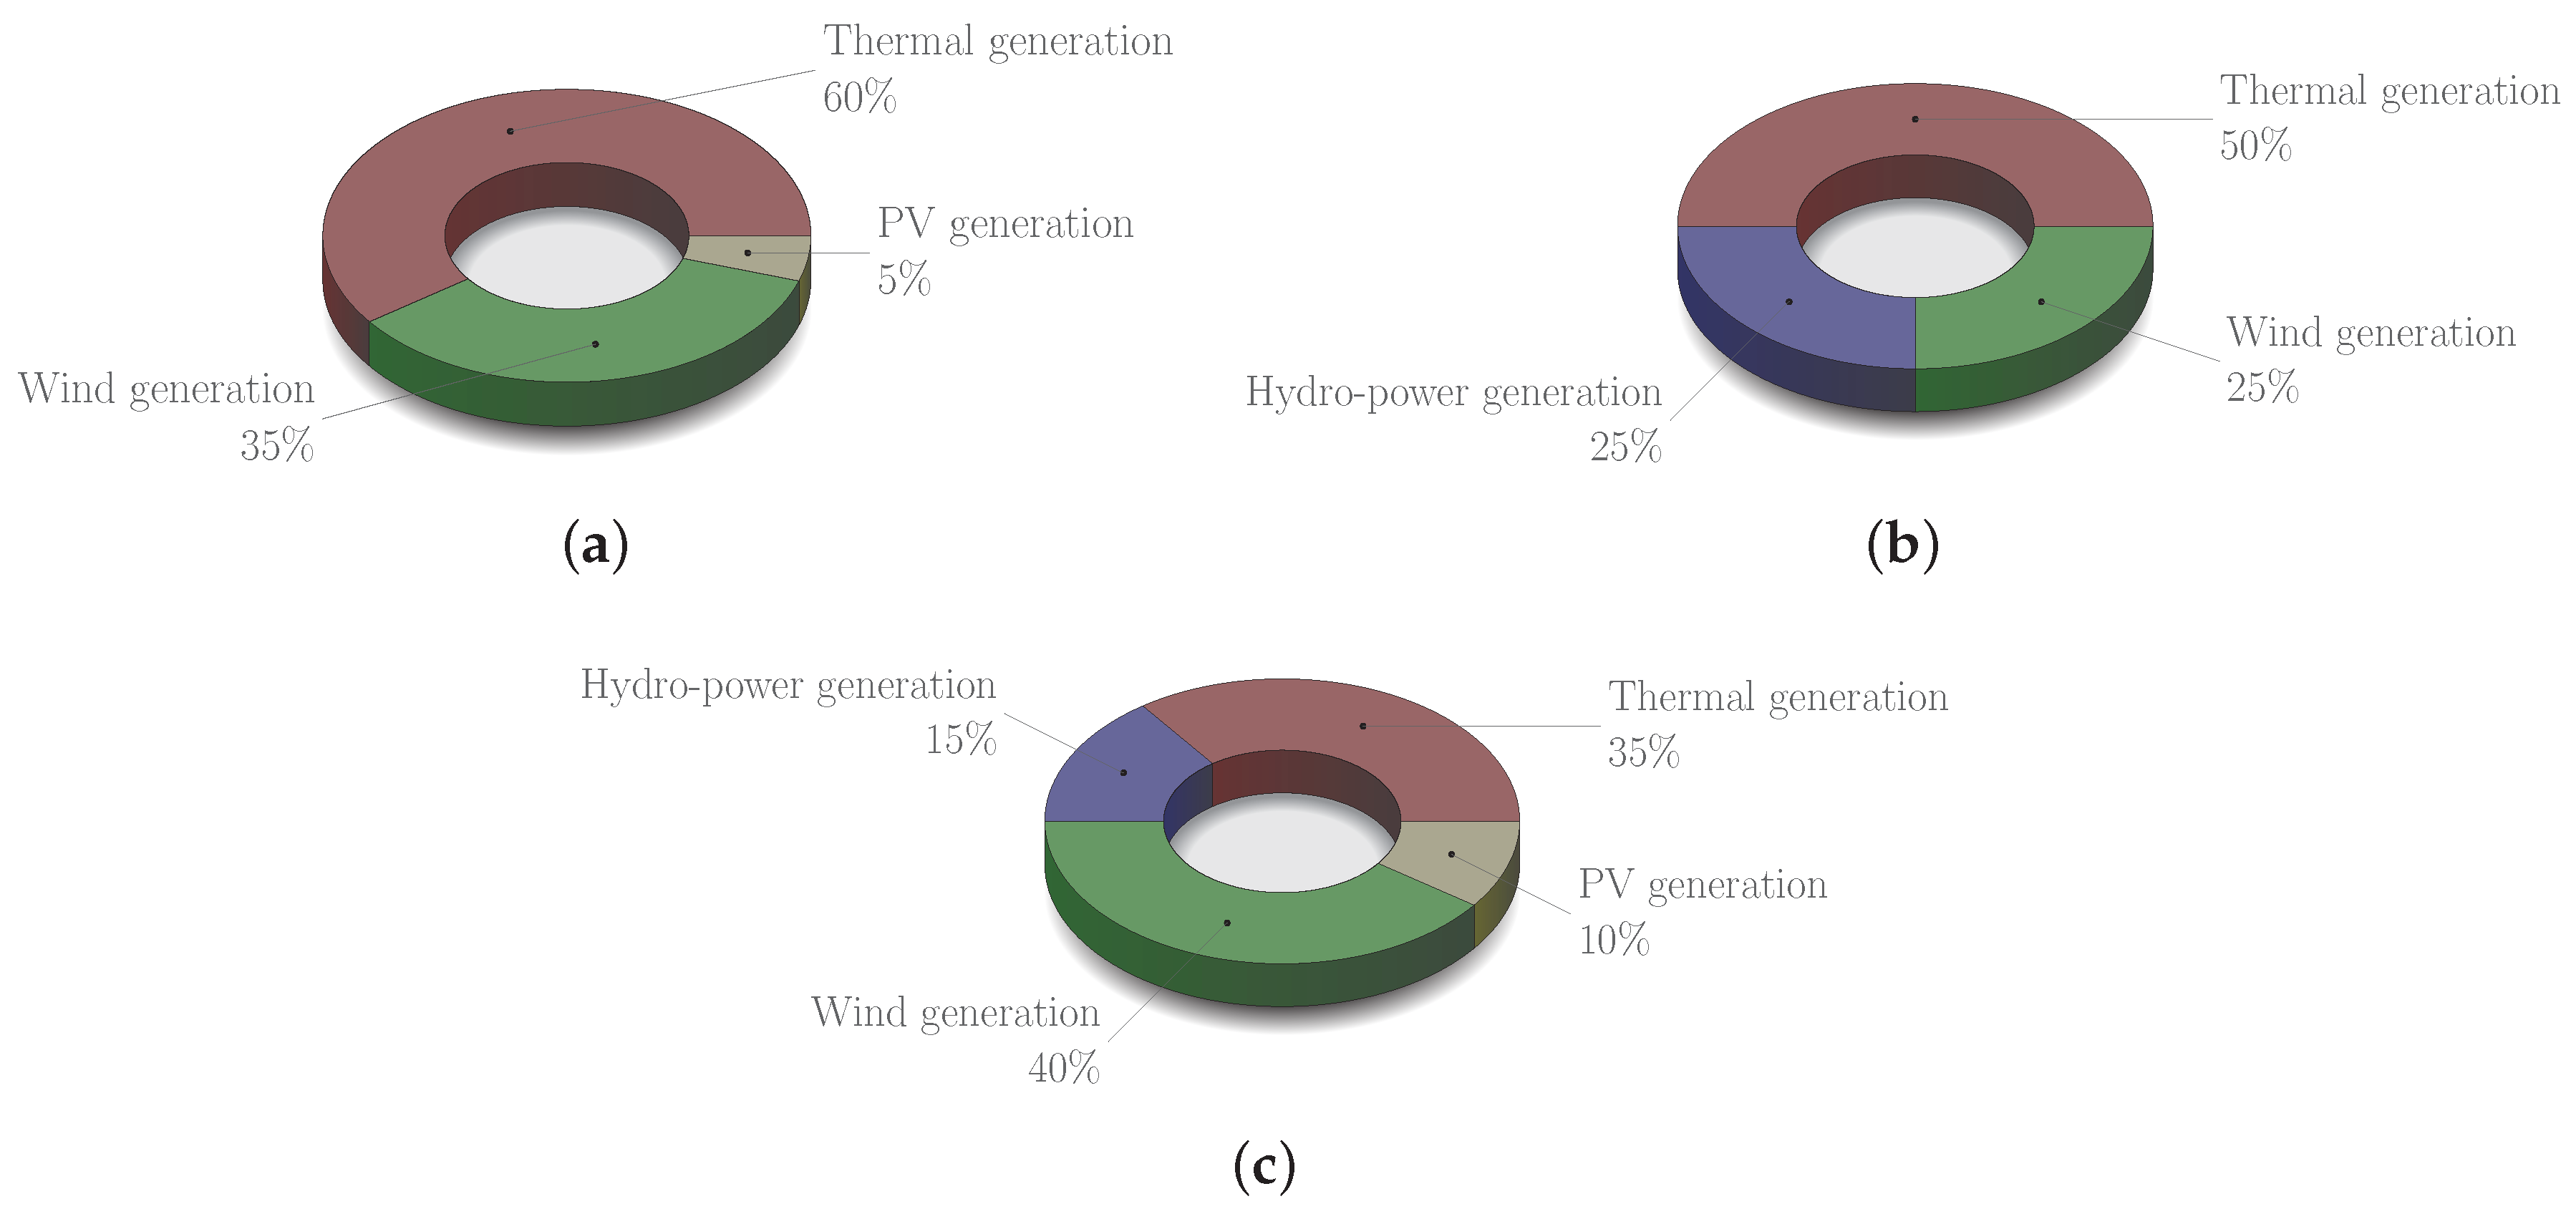
- Different multi-area power systems are analyzed with significant wind power integration, in line with current shares of renewables accounting for between 25% and 40%. Most previous studies on multi-area power systems only consider conventional generating units, such as thermal, gas and hydro-power [38,39,40,41].
- Wind power plants include a fast power reserve emulation control strategy in order to provide frequency response under power imbalances. Indeed, there is a lack of contributions describing frequency control response in wind power plants without energy storage solutions under multi-area power systems [42,43,44,45].
- The total power exchanged between areas is in line with the recent EU-wide targets, assuming a power interconnection share of 10% [46].
- The impact of wind power plants located in different areas on the frequency evolution is included in our model and dicussed in detail.
2. Improving Frequency Control Strategy of Wind Turbines
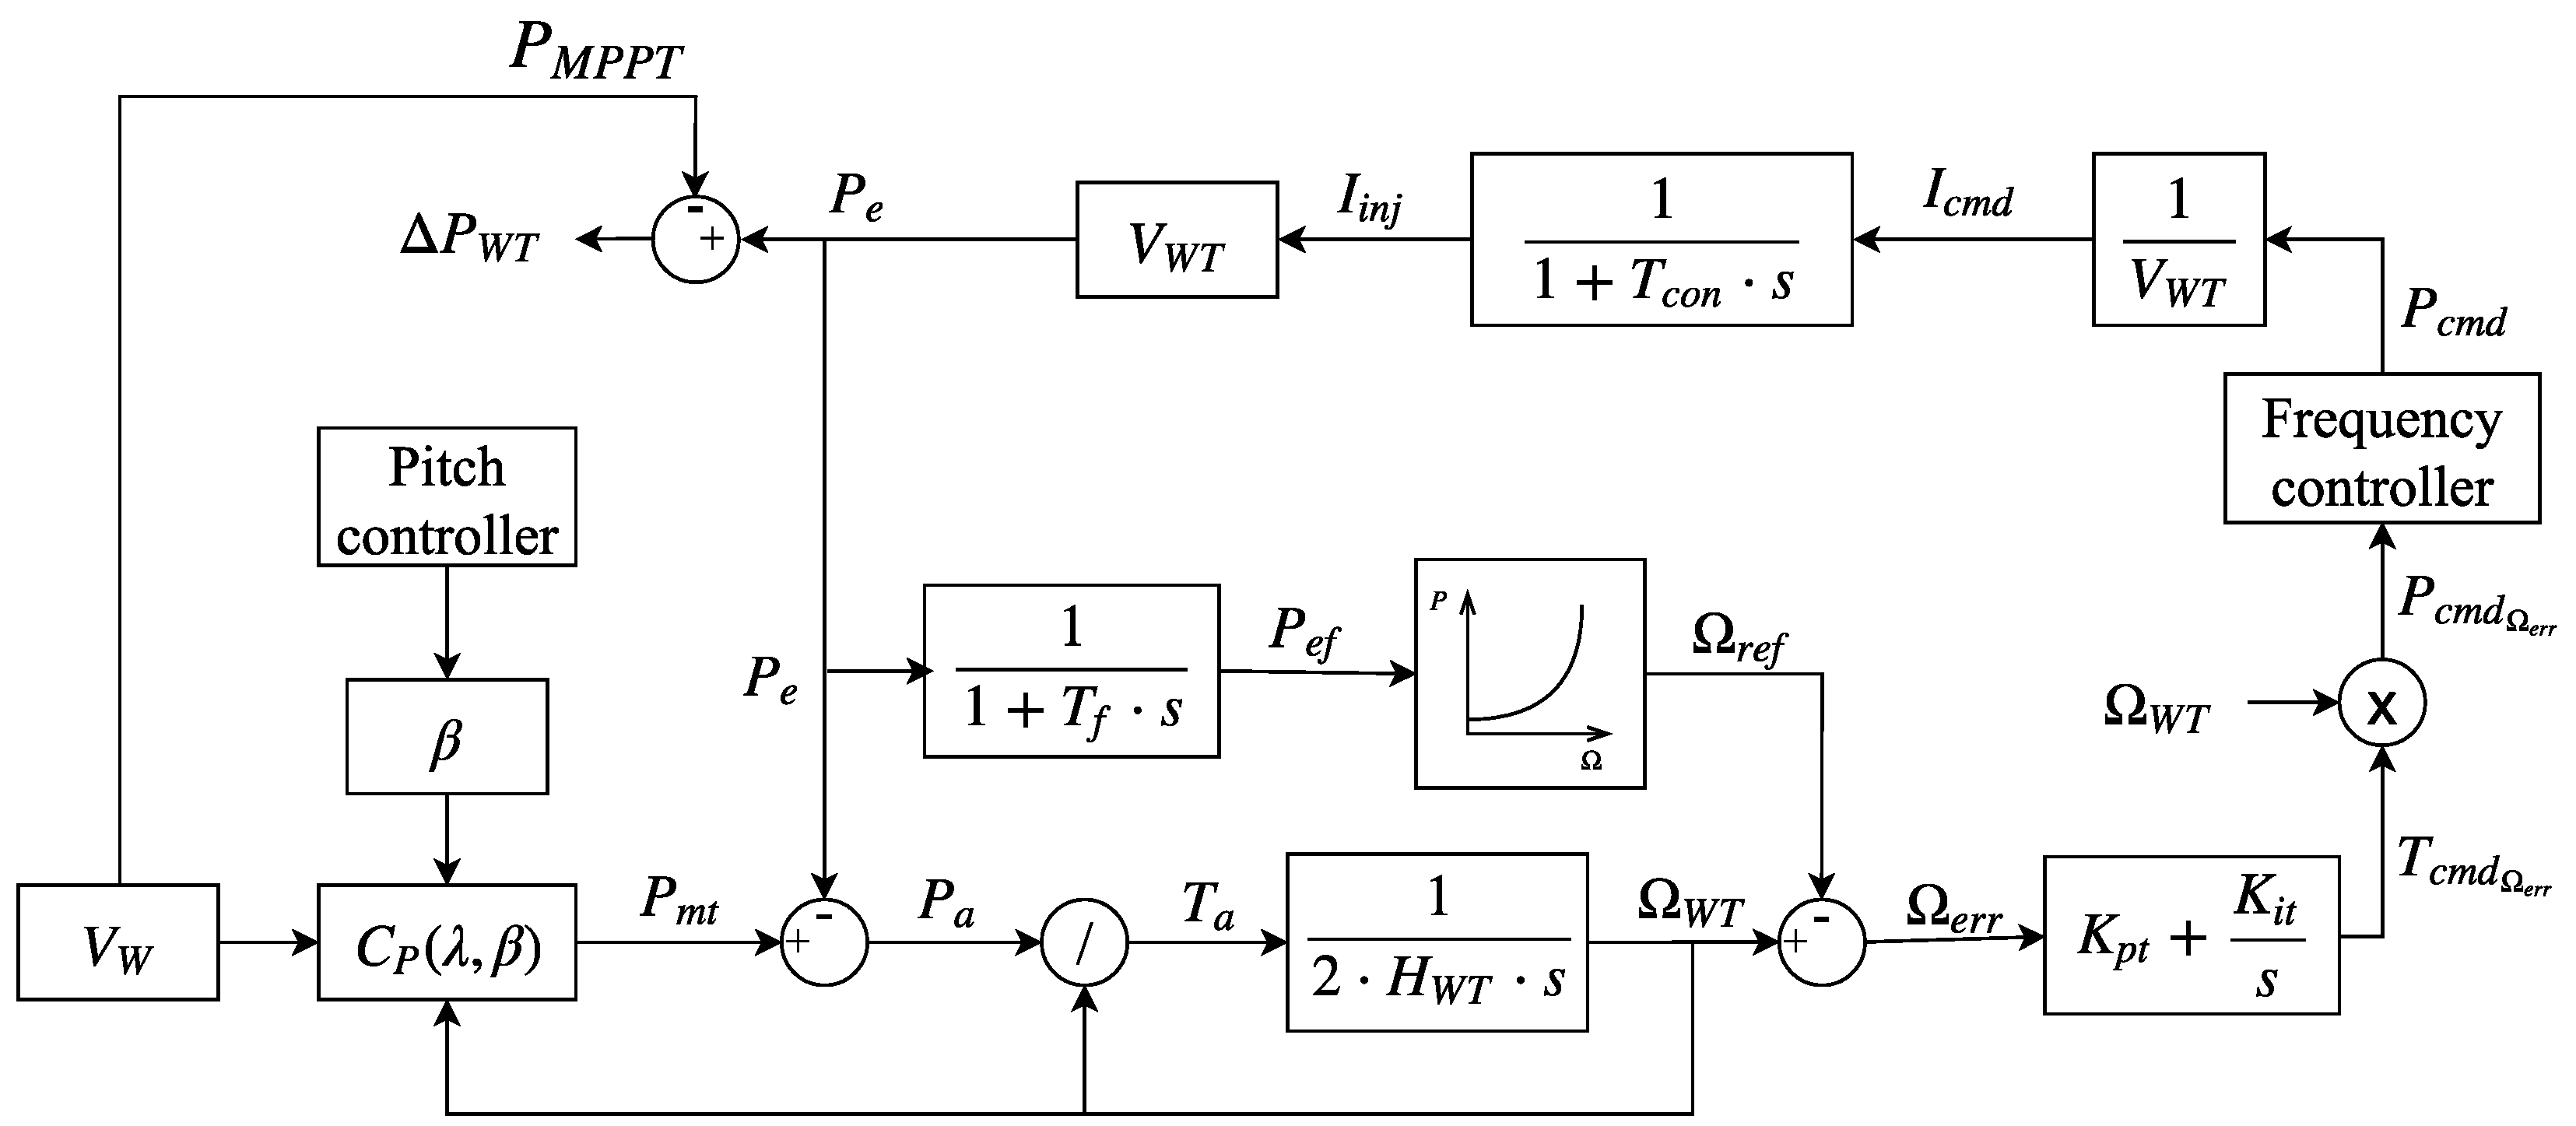
- Normal operation mode. The VSWTs operate at a certain active power value (), according to the available mechanical power for a specific wind speed, . It matches the maximum available active power for this current wind speed ; see Figure 2a,Under power imbalance conditions, and assuming an under-frequency deviation, the frequency controller strategy changes to the overproduction mode and, subsequently, .
- Overproduction mode. The active power supplied by the VSWTs involves (i) mechanical power available from the curve and (ii) additional active power provided by the kinetic energy stored in the rotational masses,is estimated proportionally to the evolution of frequency excursion in order to emulate primary frequency control of conventional generation units [26,62]. Most previous approaches assume as a constant value independent of the frequency excursion [22,23,61]. Moreover, the mechanical power is also considered as constant by most authors, even when rotational speed decreased [20,21,22,23,24,61]. This overproduction strategy remains active until one of the following conditions is met: the frequency excursion disappears, the rotational speed reaches a minimum allowed value, or the commanded power is lower than the maximum available active power,
- Recovery mode. With the aim of minimizing frequency oscillations, wind power plants have to move from overproduction mode to recovery mode as smoothly as possible, avoiding abrupt power changes and, subsequently, undesirable secondary frequency shifts [20,22,24,61]. With this aim, the authors’ solution described in [25] follows the mechanical power curve according to the wind speed instead of the maximum power curve [22]. The power provided by the VSWTs in this mode is based on two periods according to [25]: (i) a parabolic trajectory and (ii) following the curve proportional to the difference between and . The normal operation mode then can be recovered when either or are respectively reached by the wind turbine.
3. Power System Modeling
3.1. General Overview
3.2. Supply-Side Modeling
3.3. Area Descriptions
4. Results
4.1. Two-Area Interconnected Power System
4.2. Three-Area Interconnected Power System
5. Conclusions
Author Contributions
Funding
Conflicts of Interest
Abbreviations
| Area Control Error | |
| Automatic Generation Control | |
| Total number of conventional synchronous generators | |
| Rate of Change of Frequency | |
| Variable Speed Wind Turbines | |
| Wind Power Plant | |
| Minimum value of the frequency excursion | |
| n | Number of VSWT in the wind power plant |
| Stabilization time | |
| B | Bias factor |
| Equivalent damping factor of the power system | |
| Equivalent inertia constant of the power system | |
| Inertia constant of generating unit m | |
| N | Number of interconnected areas |
| Commanded power of the VSWT | |
| Maximum power point tracking of the VSWT | |
| Mechanical power of the VSWT | |
| Rated power of the power system | |
| Rated power of generating unit m | |
| Rated power of a VSWT | |
| synchronizing moment coefficient of a tie-line between areas i and j | |
| Wind speed | |
| Pitch angle | |
| Frequency excursion | |
| Value at which frequency controller of the VSWT activates | |
| Variation of active power of the power system | |
| Variation of power demand | |
| Additional active power in overproduction operation mode | |
| Tie-line power changed between areas i and j | |
| Peak-to-peak tie-line power changed between areas i and j | |
| Variation of active power of the wind power plant | |
| Rotational speed of the VSWT | |
| Minimum rotational speed of the VSWT | |
| Rotational speed at maximum power point tracking |
References
- Li, D.Y.; Li, P.; Cai, W.C.; Song, Y.D.; Chen, H.J. Adaptive Fault Tolerant Control of Wind Turbines with Guaranteed Transient Performance Considering Active Power Control of Wind Farms. IEEE Trans. Ind. Electron. 2017, 65, 3275–3285. [Google Scholar] [CrossRef]
- Rasolomampionona, D. A modified power system model for AGC analysis. In Proceedings of the 2009 IEEE Bucharest PowerTech, Bucharest, Romania, 28 June–2 July 2009; pp. 1–6. [Google Scholar]
- Du, P.; Matevosyan, J. Forecast system inertia condition and its impact to integrate more renewables. IEEE Trans. Smart Grid 2018, 9, 1531–1533. [Google Scholar] [CrossRef]
- Toulabi, M.; Bahrami, S.; Ranjbar, A.M. Application of Edge theorem for robust stability analysis of a power system with participating wind power plants in automatic generation control task. IET Renew. Power Gener. 2017, 11, 1049–1057. [Google Scholar] [CrossRef]
- Toulabi, M.; Bahrami, S.; Ranjbar, A.M. An Input-to-State Stability Approach to Inertial Frequency Response Analysis of Doubly-Fed Induction Generator-Based Wind Turbines. IEEE Trans. Energy Convers. 2017, 32, 1418–1431. [Google Scholar] [CrossRef]
- Ochoa, D.; Martinez, S. Frequency dependent strategy for mitigating wind power fluctuations of a doubly-fed induction generator wind turbine based on virtual inertia control and blade pitch angle regulation. Renew. Energy 2018, 128, 108–124. [Google Scholar] [CrossRef]
- Ochoa, D.; Martinez, S. Proposals for Enhancing Frequency Control in Weak and Isolated Power Systems: Application to the Wind-Diesel Power System of San Cristobal Island-Ecuador. Energies 2018, 11, 910. [Google Scholar] [CrossRef]
- Bao, Y.; Xu, J.; Liao, S.; Sun, Y.; Li, X.; Jiang, Y.; Ke, D.; Yang, J.; Peng, X. Field Verification of Frequency Control by Energy-Intensive Loads for Isolated Power Systems with High Penetration of Wind Power. IEEE Trans. Power Syst. 2018, in press. [Google Scholar] [CrossRef]
- Fini, M.H.; Golshan, M.E.H. Determining optimal virtual inertia and frequency control parameters to preserve the frequency stability in islanded microgrids with high penetration of renewables. Electr. Power Syst. Res. 2018, 154, 13–22. [Google Scholar] [CrossRef]
- Li, H.; Wang, X.; Xiao, J. Differential Evolution-Based Load Frequency Robust Control for Micro-Grids with Energy Storage Systems. Energies 2018, 11, 686. [Google Scholar] [CrossRef]
- Huang, L.; Xin, H.; Zhang, L.; Wang, Z.; Wu, K.; Wang, H. Synchronization and Frequency Regulation of DFIG-Based Wind Turbine Generators With Synchronized Control. IEEE Trans. Energy Convers. 2017, 32, 1251–1262. [Google Scholar] [CrossRef]
- Luo, X.; Wang, J.; Dooner, M.; Clarke, J. Overview of current development in electrical energy storage technologies and the application potential in power system operation. Appl. Energy 2015, 137, 511–536. [Google Scholar] [CrossRef]
- Xue, Y.; Tai, N. Review of contribution to frequency control through variable speed wind turbine. Renew. Energy 2011, 36, 1671–1677. [Google Scholar]
- Sun, D.; Sun, L.; Wu, F.; Zu, G. Frequency Inertia Response Control of SCESS-DFIG under Fluctuating Wind Speeds Based on Extended State Observers. Energies 2018, 11, 830. [Google Scholar] [CrossRef]
- Tavakoli, M.; Pouresmaeil, E.; Adabi, J.; Godina, R.; Catalao, J.P. Load-frequency control in a multi-source power system connected to wind farms through multi terminal HVDC systems. Comput. Oper. Res. 2018, 96, 305–315. [Google Scholar] [CrossRef]
- Saeed Uz Zaman, M.; Bukhari, S.B.A.; Hazazi, K.M.; Haider, Z.M.; Haider, R.; Kim, C.H. Frequency Response Analysis of a Single-Area Power System with a Modified LFC Model Considering Demand Response and Virtual Inertia. Energies 2018, 11, 787. [Google Scholar] [CrossRef]
- Sun, Y.; Zhang, Z.; Li, G.; Lin, J. Review on frequency control of power systems with wind power penetration. In Proceedings of the 2010 IEEE International Conference on Power System Technology (POWERCON), Hangzhou, China, 24–28 October 2010; pp. 1–8. [Google Scholar]
- Gonzalez-Longatt, F.M.; Bonfiglio, A.; Procopio, R.; Verduci, B. Evaluation of inertial response controllers for full-rated power converter wind turbine (Type 4). In Proceedings of the 2016 IEEE Power and Energy Society General Meeting (PESGM), Boston, MA, USA, 17–21 July 2016; pp. 1–5. [Google Scholar]
- Wu, Z.; Gao, W.; Gao, T.; Yan, W.; Zhang, H.; Yan, S.; Wang, X. State-of-the-art review on frequency response of wind power plants in power systems. J. Modern Power Syst. Clean Energy 2018, 6, 1–16. [Google Scholar] [CrossRef]
- Keung, P.K.; Li, P.; Banakar, H.; Ooi, B.T. Kinetic energy of wind-turbine generators for system frequency support. IEEE Trans. Power Syst. 2009, 24, 279–287. [Google Scholar] [CrossRef]
- El Itani, S.; Annakkage, U.D.; Joos, G. Short-term frequency support utilizing inertial response of DFIG wind turbines. In Proceedings of the 2011 IEEE Power and Energy Society General Meeting, Detroit, MI, USA, 24–28 July 2011; pp. 1–8. [Google Scholar]
- Hansen, A.D.; Altin, M.; Margaris, I.D.; Iov, F.; Tarnowski, G.C. Analysis of the short-term overproduction capability of variable speed wind turbines. Renew. Energy 2014, 68, 326–336. [Google Scholar] [CrossRef] [Green Version]
- Hafiz, F.; Abdennour, A. Optimal use of kinetic energy for the inertial support from variable speed wind turbines. Renew. Energy 2015, 80, 629–643. [Google Scholar] [CrossRef]
- Kang, M.; Kim, K.; Muljadi, E.; Park, J.W.; Kang, Y.C. Frequency control support of a doubly-fed induction generator based on the torque limit. IEEE Trans. Power Syst. 2016, 31, 4575–4583. [Google Scholar] [CrossRef]
- Fernández-Guillamón, A.; Villena-Lapaz, J.; Vigueras-Rodríguez, A.; García-Sánchez, T.; Molina-García, Á. An Adaptive Frequency Strategy for Variable Speed Wind Turbines: Application to High Wind Integration into Power Systems. Energies 2018, 11, 1436. [Google Scholar] [CrossRef]
- Margaris, I.D.; Papathanassiou, S.A.; Hatziargyriou, N.D.; Hansen, A.D.; Sorensen, P. Frequency control in autonomous power systems with high wind power penetration. IEEE Trans. Sustain. Energy 2012, 3, 189–199. [Google Scholar] [CrossRef]
- Vidyanandan, K.; Senroy, N. Primary frequency regulation by deloaded wind turbines using variable droop. IEEE Trans. Power Syst. 2013, 28, 837–846. [Google Scholar] [CrossRef]
- Alsharafi, A.S.; Besheer, A.H.; Emara, H.M. Primary Frequency Response Enhancement for Future Low Inertia Power Systems Using Hybrid Control Technique. Energies 2018, 11, 699. [Google Scholar] [CrossRef]
- Tielens, P.; Van Hertem, D. Receding horizon control of wind power to provide frequency regulation. IEEE Trans. Power Syst. 2017, 32, 2663–2672. [Google Scholar] [CrossRef]
- Sahu, R.K.; Gorripotu, T.S.; Panda, S. Automatic generation control of multi-area power systems with diverse energy sources using teaching learning based optimization algorithm. Eng. Sci. Technol. Int. J. 2016, 19, 113–134. [Google Scholar] [CrossRef]
- Shayeghi, H.; Shayanfar, H.; Jalili, A. Load frequency control strategies: A state-of-the-art survey for the researcher. Energy Convers. Manag. 2009, 50, 344–353. [Google Scholar] [CrossRef]
- Parmar, K.S.; Majhi, S.; Kothari, D. LFC of an interconnected power system with multi-source power generation in deregulated power environment. Int. J. Electr. Power Energy Syst. 2014, 57, 277–286. [Google Scholar] [CrossRef]
- Shankar, R.; Chatterjee, K.; Bhushan, R. Impact of energy storage system on load frequency control for diverse sources of interconnected power system in deregulated power environment. Int. J. Electr. Power Energy Syst. 2016, 79, 11–26. [Google Scholar] [CrossRef]
- Barisal, A. Comparative performance analysis of teaching learning based optimization for automatic load frequency control of multi-source power systems. Int. J. Electr. Power Energy Syst. 2015, 66, 67–77. [Google Scholar] [CrossRef]
- Sahu, R.K.; Panda, S.; Sekhar, G.C. A novel hybrid PSO-PS optimized fuzzy PI controller for AGC in multi area interconnected power systems. Int. J. Electr. Power Energy Syst. 2015, 64, 880–893. [Google Scholar] [CrossRef]
- Guha, D.; Roy, P.K.; Banerjee, S. Load frequency control of interconnected power system using grey wolf optimization. Swarm Evol. Comput. 2016, 27, 97–115. [Google Scholar] [CrossRef]
- Ozdemir, M.T.; Ozturk, D. Comparative Performance Analysis of Optimal PID Parameters Tuning Based on the Optics Inspired Optimization Methods for Automatic Generation Control. Energies 2017, 10, 2134. [Google Scholar] [CrossRef]
- Mohanty, B.; Panda, S.; Hota, P. Controller parameters tuning of differential evolution algorithm and its application to load frequency control of multi-source power system. Int. J. Electr. Power Energy Syst. 2014, 54, 77–85. [Google Scholar] [CrossRef]
- Zare, K.; Hagh, M.T.; Morsali, J. Effective oscillation damping of an interconnected multi-source power system with automatic generation control and TCSC. Int. J. Electr. Power Energy Syst. 2015, 65, 220–230. [Google Scholar] [CrossRef]
- Gorripotu, T.S.; Sahu, R.K.; Panda, S. AGC of a multi-area power system under deregulated environment using redox flow batteries and interline power flow controller. Eng. Sci. Technol. Int. J. 2015, 18, 555–578. [Google Scholar] [CrossRef]
- Hota, P.; Mohanty, B. Automatic generation control of multi source power generation under deregulated environment. Int. J. Electr. Power Energy Syst. 2016, 75, 205–214. [Google Scholar] [CrossRef]
- Ketabi, A.; Fini, M.H. An underfrequency load shedding scheme for hybrid and multiarea power systems. IEEE Trans. Smart Grid 2015, 6, 82–91. [Google Scholar] [CrossRef]
- Mi, Y.; Fu, Y.; Li, D.; Wang, C.; Loh, P.C.; Wang, P. The sliding mode load frequency control for hybrid power system based on disturbance observer. Int. J. Electr. Power Energy Syst. 2016, 74, 446–452. [Google Scholar] [CrossRef]
- Kerdphol, T.; Rahman, F.S.; Mitani, Y. Virtual Inertia Control Application to Enhance Frequency Stability of Interconnected Power Systems with High Renewable Energy Penetration. Energies 2018, 11, 981. [Google Scholar] [CrossRef]
- Babahajiani, P.; Shafiee, Q.; Bevrani, H. Intelligent demand response contribution in frequency control of multi-area power systems. IEEE Trans. Smart Grid 2018, 9, 1282–1291. [Google Scholar] [CrossRef]
- 2030 Energy Strategy. Available online: https://ec.europa.eu/energy/en/topics/energy-strategy-and-energy-union/2030-energy-strategy (accessed on 15 August 2018).
- Dreidy, M.; Mokhlis, H.; Mekhilef, S. Inertia response and frequency control techniques for renewable energy sources: A review. Renew. Sustain. Energy Rev. 2017, 69, 144–155. [Google Scholar] [CrossRef]
- Wang, H.; Yang, J.; Chen, Z.; Ge, W.; Hu, S.; Ma, Y.; Li, Y.; Zhang, G.; Yang, L. Gain Scheduled Torque Compensation of PMSG-Based Wind Turbine for Frequency Regulation in an Isolated Grid. Energies 2018, 11, 1623. [Google Scholar] [CrossRef]
- Jallad, J.; Mekhilef, S.; Mokhlis, H. Frequency Regulation Strategies in Grid Integrated Offshore Wind Turbines via VSC-HVDC Technology: A Review. Energies 2017, 10, 1244. [Google Scholar] [CrossRef]
- Tavakkoli, M.; Adabi, J.; Zabihi, S.; Godina, R.; Pouresmaeil, E. Reserve Allocation of Photovoltaic Systems to Improve Frequency Stability in Hybrid Power Systems. Energies 2018, 11, 583. [Google Scholar] [CrossRef]
- Kayikçi, M.; Milanovic, J.V. Dynamic contribution of DFIG-based wind plants to system frequency disturbances. IEEE Trans. Power Syst. 2009, 24, 859–867. [Google Scholar] [CrossRef]
- Morren, J.; de Haan, S.W.H.; Kling, W.L.; Ferreira, J.A. Wind turbines emulating inertia and supporting primary frequency control. IEEE Trans. Power Syst. 2006, 21, 433–434. [Google Scholar] [CrossRef]
- Ramtharan, G.; Jenkins, N.; Ekanayake, J. Frequency support from doubly fed induction generator wind turbines. IET Renew. Power Gener. 2007, 1, 3–9. [Google Scholar] [CrossRef]
- Chowdhury, B.H.; Ma, H.T. Frequency regulation with wind power plants. In Proceedings of the 2008 IEEE Power and Energy Society General Meeting-Conversion and Delivery of Electrical Energy in the 21st Century, 20–24 July 2008; pp. 1–5. [Google Scholar]
- Conroy, J.F.; Watson, R. Frequency response capability of full converter wind turbine generators in comparison to conventional generation. IEEE Trans. Power Syst. 2008, 23, 649–656. [Google Scholar] [CrossRef]
- Mauricio, J.M.; Marano, A.; Gómez-Expósito, A.; Ramos, J.L.M. Frequency regulation contribution through variable-speed wind energy conversion systems. IEEE Trans. Power Syst. 2009, 24, 173–180. [Google Scholar] [CrossRef]
- Bassi, F.; Caciolli, L.; Giannuzzi, G.; Corsi, N.; Giorgi, A. Use of hidden inertia from wind generation for frequency support in power grids. In Proceedings of the 2016 IEEE AEIT International Annual Conference (AEIT), Capri, Italy, 5–7 October 2016; pp. 1–6. [Google Scholar]
- Gonzalez-Longatt, F.M. Impact of emulated inertia from wind power on under-frequency protection schemes of future power systems. J. Modern Power Syst. Clean Energy 2016, 4, 211–218. [Google Scholar] [CrossRef] [Green Version]
- Hu, J.; Sun, L.; Yuan, X.; Wang, S.; Chi, Y. Modeling of type 3 wind turbines with df/dt inertia control for system frequency response study. IEEE Trans. Power Syst. 2017, 32, 2799–2809. [Google Scholar] [CrossRef]
- Bonfiglio, A.; Invernizzi, M.; Labella, A.; Procopio, R. Design and Implementation of a Variable Synthetic Inertia Controller for Wind Generating Units. IEEE Trans. Power Syst. 2018, in press. [Google Scholar]
- Tarnowski, G.C.; Kjar, P.C.; Sorensen, P.E.; Ostergaard, J. Variable speed wind turbines capability for temporary over-production. In Proceedings of the 2009 IEEE Power & Energy Society General Meeting (PES’09), Calgary, AB, Canada, 26–30 July 2009; pp. 1–7. [Google Scholar]
- Kundur, P.; Balu, N.J.; Lauby, M.G. Power System Stability and Control; McGraw-Hill: New York, NY, USA, 1994; Volume 7. [Google Scholar]
- Tan, W. Load frequency control: Problems and solutions. In Proceedings of the 2011 IEEE 30th Chinese Control Conference (CCC), Yantai, China, 22–24 July 2011; pp. 6281–6286. [Google Scholar]
- Ma, M.; Chen, H.; Liu, X.; Allgöwer, F. Distributed model predictive load frequency control of multi-area interconnected power system. Int. J. Electr. Power Energy Syst. 2014, 62, 289–298. [Google Scholar] [CrossRef]
- Yousef, H.A.; Khalfan, A.K.; Albadi, M.H.; Hosseinzadeh, N. Load frequency control of a multi-area power system: An adaptive fuzzy logic approach. IEEE Trans. Power Syst. 2014, 29, 1822–1830. [Google Scholar] [CrossRef]
- Pan, I.; Das, S. Fractional-order load-frequency control of interconnected power systems using chaotic multi-objective optimization. Appl. Soft Comput. 2015, 29, 328–344. [Google Scholar] [CrossRef] [Green Version]
- Sathya, M.; Ansari, M.M.T. Load frequency control using Bat inspired algorithm based dual mode gain scheduling of PI controllers for interconnected power system. Int. J. Electr. Power Energy Syst. 2015, 64, 365–374. [Google Scholar] [CrossRef]
- Abdelaziz, A.; Ali, E. Cuckoo search algorithm based load frequency controller design for nonlinear interconnected power system. Int. J. Electr. Power Energy Syst. 2015, 73, 632–643. [Google Scholar] [CrossRef]
- Padhan, D.G.; Majhi, S. A new control scheme for PID load frequency controller of single-area and multi-area power systems. ISA Trans. 2013, 52, 242–251. [Google Scholar] [CrossRef] [PubMed]
- Chang, Y.; Liu, R.; Ba, Y.; Li, W. A New Control Logic for a Wind-Area on the Balancing Authority Area Control Error Limit Standard for Load Frequency Control. Energies 2018, 11, 121. [Google Scholar] [CrossRef]
- Pyller, M.; Achilles, S. Aggregated wind park models for analyzing power system dynamics. In Proceedings of the 4th International Workshop Large-Scale Integration of Wind Power and Transmission Networks, Billund, Denmark, 20–21 October 2003. [Google Scholar]
- Mokhtari, M.; Aminifar, F. Toward wide-area oscillation control through doubly-fed induction generator wind farms. IEEE Trans. Power Syst. 2014, 29, 2985–2992. [Google Scholar] [CrossRef]
- Miller, N.W.; Sanchez-Gasca, J.J.; Price, W.W.; Delmerico, R.W. Dynamic modeling of GE 1. In 5 and 3.6 MW wind turbine-generators for stability simulations. In Proceedings of the 2003 IEEE Power Engineering Society General Meeting, Toronto, ON, Canada, 13–17 July 2003; Volume 3, pp. 1977–1983. [Google Scholar]
- Ullah, N.R.; Thiringer, T.; Karlsson, D. Temporary primary frequency control support by variable speed wind turbines—Potential and applications. IEEE Trans. Power Syst. 2008, 23, 601–612. [Google Scholar] [CrossRef]
- Baccino, F.; Conte, F.; Grillo, S.; Massucco, S.; Silvestro, F. An optimal model-based control technique to improve wind farm participation to frequency regulation. IEEE Trans. Sustain. Energy 2015, 6, 993–1003. [Google Scholar] [CrossRef]
- Zhao, J.; Lyu, X.; Fu, Y.; Hu, X.; Li, F. Coordinated microgrid frequency regulation based on DFIG variable coefficient using virtual inertia and primary frequency control. IEEE Trans. Energy Convers. 2016, 31, 833–845. [Google Scholar] [CrossRef]
- Martínez-Lucas, G.; Sarasúa, J.I.; Sánchez-Fernández, J.Á. Frequency Regulation of a Hybrid Wind–Hydro Power Plant in an Isolated Power System. Energies 2018, 11, 239. [Google Scholar] [CrossRef]
- Perera, A.T.D.; Nik, V.M.; Mauree, D.; Scartezzini, J.L. Electrical hubs: An effective way to integrate non-dispatchable renewable energy sources with minimum impact to the grid. Appl. Energy 2017, 190, 232–248. [Google Scholar] [CrossRef] [Green Version]
- Wind energy in Europe: Scenarios for 2030. Wind Eur. 2017. Available online: https://windeurope.org/wp-content/uploads/files/about-wind/reports/Wind-energy-in-Europe-Scenarios-for-2030.pdf (accessed on 10 August 2018).
- Technology Roadmap: Solar Photovoltaic Energy. Int. Energy Agency. 2014. Available online: https://www.iea.org/publications/freepublications/publication/TechnologyRoadmapSolarPhotovoltaicEnergy_2014edition.pdf (accessed on 10 August 2018).
- Huang, C.; Yue, D.; Xie, X.; Xie, J. Anti-windup load frequency controller design for multi-area power system with generation rate constraint. Energies 2016, 9, 330. [Google Scholar] [CrossRef]
- Zeng, G.Q.; Xie, X.Q.; Chen, M.R. An Adaptive Model Predictive Load Frequency Control Method for Multi-Area Interconnected Power Systems with Photovoltaic Generations. Energies 2017, 10, 1840. [Google Scholar] [CrossRef]
- Yang, L.; Liu, T.; Hill, D.J. Decentralized periodic event-triggered frequency regulation for multi-area power systems. In Proceedings of the 2018 IEEE Power Systems Computation Conference (PSCC), Dublin, Ireland, 11–15 June 2017; pp. 1–7. [Google Scholar]
- Lu, K.; Zhou, W.; Zeng, G.; Zheng, Y. Constrained population extremal optimization-based robust load frequency control of multi-area interconnected power system. Int. J. Electr. Power Energy Syst. 2019, 105, 249–271. [Google Scholar] [CrossRef]
- Huang, H.; Li, F. Sensitivity analysis of load-damping characteristic in power system frequency regulation. IEEE Trans. Power Syst. 2013, 28, 1324–1335. [Google Scholar] [CrossRef]
- Tielens, P.; Van Hertem, D. The relevance of inertia in power systems. Renew. Sustain. Energy Rev. 2016, 55, 999–1009. [Google Scholar] [CrossRef] [Green Version]
- Ali, E.; Abd-Elazim, S. Bacteria foraging optimization algorithm based load frequency controller for interconnected power system. Int. J. Electr. Power Energy Syst. 2011, 33, 633–638. [Google Scholar] [CrossRef]
- Sudha, K.; Santhi, R.V. Robust decentralized load frequency control of interconnected power system with generation rate constraint using type-2 fuzzy approach. Int. J. Electr. Power Energy Syst. 2011, 33, 699–707. [Google Scholar] [CrossRef]
- Jiang, L.; Yao, W.; Wu, Q.H.; Wen, J.Y.; Cheng, S.J. Delay-dependent stability for load frequency control with constant and time-varying delays. IEEE Trans. Power Syst. 2012, 27, 932. [Google Scholar] [CrossRef]
- Masuta, T.; Yokoyama, A. Supplementary load frequency control by use of a number of both electric vehicles and heat pump water heaters. IEEE Trans. Smart Grid 2012, 3, 1253–1262. [Google Scholar] [CrossRef]
- Shabani, H.; Vahidi, B.; Ebrahimpour, M. A robust PID controller based on imperialist competitive algorithm for load-frequency control of power systems. ISA Trans. 2013, 52, 88–95. [Google Scholar] [CrossRef] [PubMed]
- Rout, U.K.; Sahu, R.K.; Panda, S. Design and analysis of differential evolution algorithm based automatic generation control for interconnected power system. Ain Shams Eng. J. 2013, 4, 409–421. [Google Scholar] [CrossRef]
- Sahu, R.K.; Panda, S.; Rout, U.K. DE optimized parallel 2-DOF PID controller for load frequency control of power system with governor dead-band nonlinearity. Int. J. Electr. Power Energy Syst. 2013, 49, 19–33. [Google Scholar] [CrossRef]
- Ruiz, S.; Patiño, J.; Espinosa, J. Load Frequency Control of a Multi-area Power System Incorporating Variable-speed Wind Turbines. 2016; in press. [Google Scholar]
- Dong, L.; Tang, Y.; He, H.; Sun, C. An event-triggered approach for load frequency control with supplementary ADP. IEEE Trans. Power Syst. 2017, 32, 581–589. [Google Scholar] [CrossRef]
- Peng, C.; Zhang, J.; Yan, H. Adaptive Event-Triggering H∞ Load Frequency Control for Network-Based Power Systems. IEEE Trans. Ind. Electr. 2018, 65, 1685–1694. [Google Scholar] [CrossRef]
- Wu, Y.; Wei, Z.; Weng, J.; Li, X.; Deng, R.H. Resonance attacks on load frequency control of smart grids. IEEE Trans. Smart Grid 2018, 9, 4490–4502. [Google Scholar] [CrossRef]


| Parameter | Name | Value () |
|---|---|---|
| Speed relay pilot valve | ||
| Fraction of power generated by high pressure section | ||
| Time constant of reheater | ||
| Time constant of main inlet volumes and steam chest | ||
| Speed droop | ||
| Integral controller | ||
| Inertia constant | s |
| Parameter | Name | Value () |
|---|---|---|
| Speed relay pilot valve | ||
| Reset time | ||
| Temporary droop | ||
| Permanent droop | ||
| Water starting time | ||
| Speed droop | ||
| Integral controller | ||
| Inertia constant | s |
| Parameter | Name | Value |
|---|---|---|
| Wind speed | 10 m/s | |
| Rated power | MW | |
| Inertia constant | s | |
| Base rotational speed | rad/s | |
| Time delay to measure electric power | 5 s | |
| Time delay to generate the injected current | s | |
| Wind turbine voltage | 1 | |
| Proportional constant of speed controller | 3 | |
| Integral constant of speed controller |
| Parameter | Name | Value |
|---|---|---|
| Bias factor of Area 1 | ||
| Bias factor of Area 2 | ||
| Synchronizing moment coefficient between Areas 1 and 2 | ||
| Equivalent inertia constant of Area 1 | s | |
| Equivalent inertia constant of Area 2 | s |
| Parameter | Name | Value |
|---|---|---|
| Bias factor of Area 1 | ||
| Bias factor of Area 2 | ||
| Bias factor of Area 3 | ||
| Synchronizing moment coefficient between Areas 1 and 2 | ||
| Synchronizing moment coefficient between Areas 2 and 3 | ||
| Synchronizing moment coefficient between Areas 3 and 1 | ||
| Equivalent inertia constant of Area 1 | s | |
| Equivalent inertia constant of Area 2 | s | |
| Equivalent inertia constant of Area 3 | s |
| Ref. | Value (pu/Hz) | Analysis | Year |
|---|---|---|---|
| [62] | 1–2 | Power system stability | 1994 |
| [87] | 0.83 | Two areas with non-reheat thermal units | 2011 |
| [88] | 1.66 | Two areas with thermal units | 2011 |
| [89] | 1–1.8 | Three areas with non-reheat thermal units | 2012 |
| [90] | 2 | One area with nuclear, thermal, wind and PV | 2012 |
| [91] | 0.5–0.9 | Three areas with nonlinear thermal units | 2013 |
| [92] | 0.83 | Two areas non-reheat thermal units | 2013 |
| [93] | 0.83 | Two areas with thermal units | 2013 |
| [67] | 0.83 | Two areas with reheat units | 2015 |
| [94] | 0.8 | IEEE 9 bus system with hydro-power, gas and wind turbines | 2016 |
| [95] | 1–1.8 | One and three areas with non-reheat thermal units | 2017 |
| [96] | 1–1.8 | Three areas with non-reheat thermal units | 2018 |
| [97] | 1 | Two areas with non-reheat thermal units | 2018 |
© 2018 by the authors. Licensee MDPI, Basel, Switzerland. This article is an open access article distributed under the terms and conditions of the Creative Commons Attribution (CC BY) license (http://creativecommons.org/licenses/by/4.0/).
Share and Cite
Fernández-Guillamón, A.; Vigueras-Rodríguez, A.; Gómez-Lázaro, E.; Molina-García, Á. Fast Power Reserve Emulation Strategy for VSWT Supporting Frequency Control in Multi-Area Power Systems. Energies 2018, 11, 2775. https://doi.org/10.3390/en11102775
Fernández-Guillamón A, Vigueras-Rodríguez A, Gómez-Lázaro E, Molina-García Á. Fast Power Reserve Emulation Strategy for VSWT Supporting Frequency Control in Multi-Area Power Systems. Energies. 2018; 11(10):2775. https://doi.org/10.3390/en11102775
Chicago/Turabian StyleFernández-Guillamón, Ana, Antonio Vigueras-Rodríguez, Emilio Gómez-Lázaro, and Ángel Molina-García. 2018. "Fast Power Reserve Emulation Strategy for VSWT Supporting Frequency Control in Multi-Area Power Systems" Energies 11, no. 10: 2775. https://doi.org/10.3390/en11102775