Analysis and Control of Electrolytic Capacitor-Less LED Driver Based on Harmonic Injection Technique


1
APAERC, Faculty of Engineering, Aswan University, 81542, Aswan, Egypt
2
Departamento de Ingeniería Eléctrica, Electrónica, de Computadores y Sistemas University of Oviedo, 33204 Gijón, Spain
*
Author to whom correspondence should be addressed.
Energies 2018, 11(11), 3030; https://doi.org/10.3390/en11113030
Submission received: 24 September 2018
/
Revised: 31 October 2018
/
Accepted: 1 November 2018
/
Published: 5 November 2018
(This article belongs to the Special Issue Design and Control of Power Converters 2019)
Abstract
:AC-DC LED drivers may have a lifespan shorter than the lifespan of LED chips if electrolytic capacitors are used in their construction. Using film capacitors solves this problem but, as their capacitance is considerably lower, the low-frequency ripple will increase. Solving this problem by limiting the output ripple to safe values is possible by distorting the input current using harmonic injection technique, as long as these harmonics still complies with Power Factor Regulations (Energy Star). This harmonic injection alleviates the requirements imposed to the output capacitor in order to limit the low-frequency ripple in the output. This idea is based on the fact that LEDs can be driven by pulsating current with a limited Peak-To-Average Ratio (PTAR) without affecting their performance. By considering the accurate model of LEDs, instead of the typical equivalent resistance, this paper presents an improved and more reliable calculation of the intended harmonic injection. Wherein, its orders and values can be determined for each input/output voltage to obtain the specified PTAR and Power Factor (PF). Also, this harmonic injection can be simply implemented using a single feedback loop, its control circuit has features of wide bandwidth, simple, single-loop and lower cost. A 21W AC-DC buck converter is built to validate the proposed circuit and the derived mathematical model and it complies with IEC61000 3-2 class D standard.
1. Introduction
LED technology has several merits over conventional lamps such as: high-efficiency, very long lifespan (approximately 100,000 h [1]), lower power consumption, low maintenance cost and instantaneous switch-on [2,3]. Besides, the LEDs are environmentally friendly. Regarding their efficiency, CREE claimed to be the first company to break the 300 lumens per watt barriers (still being the highest level achieved) [4]. Moreover, lighting consumes 20% of the electrical energy in the industrial countries pushing forward the replacement of conventional lighting with LED lighting.
The critical part that defines the LED lamp lifespan is the driver. One-stage AC-DC LED drivers normally use a bulky electrolytic capacitor to balance power between the pulsating input and the constant output, minimizing the double line frequency current ripple [5]. This capacitor limits the lifespan of the LED lamp to its own lifespan, typically between 1000 and 10,000 h, considerably lower than the lifespan of LEDs [6]. In addition, the lifespan of the E-Caps follows the 10-degree-law that states that it decreases by a factor of 2 for each +10 °C temperature increase. Even assuming this, operation at 85 °C only pushes its lifespan to 20,000 h. Consequently, eliminating the E-Cap is mandatory and many research efforts have been made in this direction.
Wound and soft winding film capacitors can be used instead of E-Caps due to their long lifespan [7]. However, their energy density is low and that increases the output voltage and the output current ripple of the LED driver. This causes a depraved effect on the LED chip. The light perceived by humans’ eyes is proportional to its average value because the light ripple is filtered as long as its frequency is higher than a few hundreds of hertz. Nonetheless, increasing LED peak current (as a consequence of the ripple) results in a change in the chromaticity coordinates, color correlated temperature (CCT), color rendering index (CRI), flux and efficacy degradation, so LED light is perceived as bluish-white [8,9].
Several studies proposed different topologies and control circuits to enable using low-density capacitors with limited LED peak current under a defined ratio called PTAR. The most effective way is harmonic injection technique. The idea is to inject predefined harmonics into the input current to limit the PTAR of the output LED current while observing PF regulations. Figure 1a–c shows different harmonics combinations for the LED current [10,11] with the result of a lower PTAR if those harmonics are wisely selected. First, Figure 1a shows the double line frequency output current in dashed line and the third harmonic order in dashed-dot line. The combination result is shown as a solid line and, as can be seen, its PTAR is lower than in the case of the first harmonic. Second, Figure 1b shows the double line frequency output current combined with the fifth harmonics. In this case, the resulting PTAR is higher than in the case of the first harmonic alone. Finally, Figure 1c shows the double line frequency output current combined with the third harmonics and the fifth harmonics. In this case, the PTAR is the lowest of the three cases. As more harmonic orders are injected, the combination has lower PTAR. However, it is very important to define the amplitudes that lead to the lowest PTAR while keeping the input PF within the regulation limits.
In [12], a two-stage LED driver is introduced. The first stage is a high frequency boost converter that operates at discontinuous conduction mode (DCM) as a pre-regulator PF correction (PFC) and injecting the 3rd harmonics into the input current. The second stage is a Flyback converter for regulating the LEDs current. The design replaced the storage E-Cap with film one; however, three 47-µF capacitors connected in parallel are still needed.
More harmonics are injected in the input current in [10,11]. The developed circuit is a single stage AC-DC Flyback converter. It has only a 0.47-µF film capacitor in its output. However, the model analysis introduced in [10] was based only on a resistive load model without considering the accurate LED chip model. As a consequence, the theoretical analysis and the experimental results were not well matched. Practical results show a PTAR of 1.43 for the output LED current instead of the designed one of only 1.34. Also, the presented controller included a feedforward loop with a multiplier and a divider that increase the complexity and the cost. In [13], limiting the PTAR of the LED current is achieved by using two loops, feedback and feedforward. Results recorded a PTAR of less than 1.34 by injecting more harmonics orders. Again, the LED model consists of the equivalent resistor, which results in inaccuracy. In [14,15] a feedforward circuit was proposed to generate a distorted sinusoidal reference signal that contains the required injected harmonics to limit the PTAR. The implemented circuit included one microcontroller in the current loop with two voltage sensors and one current sensor in addition to the multiplier circuit. It uses a look-up table with a normalized value to generate the reference signal for the duty cycle. Moreover, injecting only the third harmonic resulted in a higher PTAR compared to the previous approaches. Similar results can be found in [16], wherein a feedforward loop for harmonic injection in addition to PLL, multiplier and divider circuits are used. A similar strategy was proposed in [17], which reduces the electrolytic output capacitor to almost 24.2% by using an Active Ripple Compensation (ARC). In [18] the same methodology was used to reduce the electrolytic capacitance by 46.3% by using a different ARC technique.
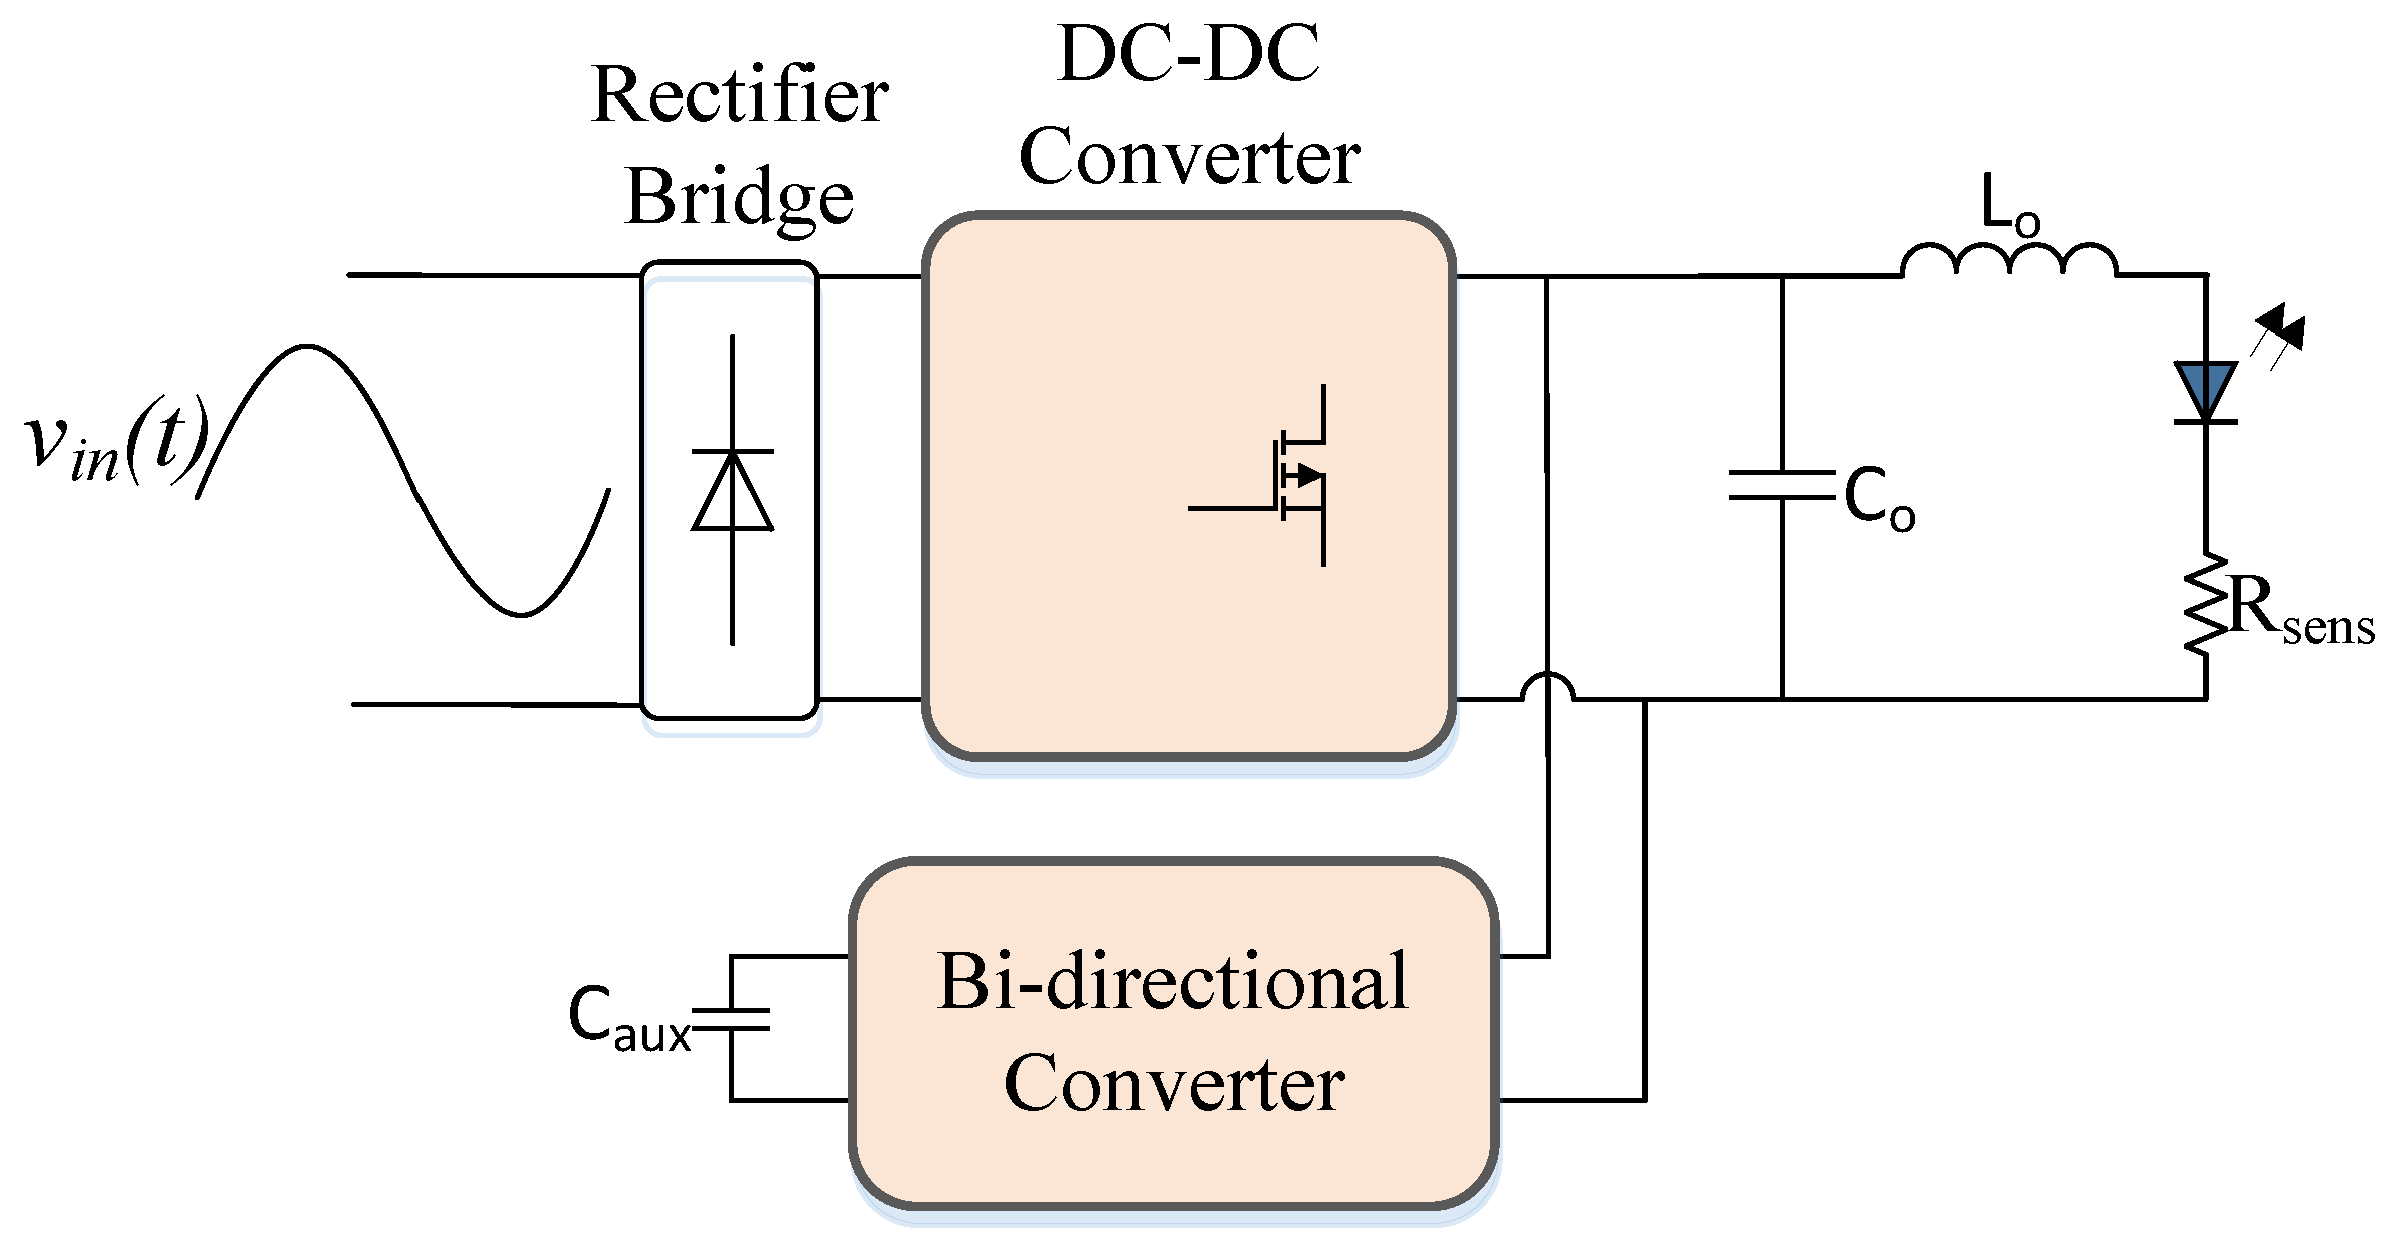
Harmonics injection is not only method to eliminate the E-cap. Ripple cancelation method can be also used to maintain the same purpose. This technique is based on adding a bidirectional converter connected in parallel or series to the output capacitor in order to cancel the double line frequency of the current ripple produced from decreasing the output capacitance as shown in Figure 2 [19]. By controlling the bidirectional converter to absorb the double line harmonics, the output inductor and output capacitor are used only to filter the high frequency harmonics in the output current [20,21]. Consequently, E-cap is eliminated and can be replaced with small capacitance.
Thus, many of these methods are using double stage with more than two semiconductors switches. Cost-wise is still not considered in this technique by using many components counts and using complex control circuits as well.
In [22], a boost converter was used as a pre-regulator to act as a PFC and it was cascaded with LLC resonant converter. Wherein, the frequency modulation technique is used in the control circuit. The behavior of the control circuit acts to vary the frequency when the line voltage changes. It generates the highest frequency at the peak of the line voltage. Therefore, the output current peak is expected to decrease. This kind of technique is suffering from many components counts in power stage and the implementation of the complex controller circuit.
Ripple cancellation technique can maintain the lowest LED current peak. However, the main disadvantage is using an extra converter to absorb the low frequency ripple current and using extra capacitor as shown in Figure 2. Therefore, it increases the component counts and circuit complexity.
Passive LED driver is considered one of the E-cap less topologies. In [23,24], four different passive LED driver topologies were proposed. The first type used valley-fill circuit to keep a high PF. It used a high inductance value of 1.47 H at the input, another bulky inductor value of 1.9 H at the output stage and two output capacitors in the valley fill circuit with a value of 20 µF polypropylene capacitors. The second type was done by making a modification in the valley-fill circuit. It has the same structure of the first type, in addition to the two output polypropylene capacitors in the valley-fill circuit with a value of 20 µF. The third type was proposed without using the valley-fill circuit. This circuit was considered the most cost-effective one among all passive LED driver types as it used less component counts than the previous two types. The fourth type used a bulky inductor for the input stage with the same value of the first type. Also, it used a coupled inductor and one capacitor to filter the output current ripples.
Passive LED drive is only considered a cost-effective solution in a high-power application where size and cost of this passive elements are not considerable. Wherein, the usage of the bulky inductor instead of the bulky electrolytic capacitor increases the LED driver footprint.
In conclusion, prior researches have the following limitations:
- Using additional control loop circuit to inject harmonics increases the component count. Consequently, the LED lamp cost will increase, limiting its penetration to the market, especially in the case of single-stage solution.
- The best practical result is a PTAR of 1.43 in nominal conditions which is still a high value.
- Using an inaccurate model of the LED chip (i.e., replacing it by a simple resistor), leads to a deviation between the practical results and mathematical ones.
This paper introduces a step forward to modify the harmonic injection techniques to be simpler and more economic through using just one feedback loop, that can achieve the target PTAR and PF by means of using an accurate model for LED chip.
2. Modelling of E-Cap-Less Converter for LED Applications
AC-DC buck converter operating in DCM without electrolytic capacitor is the simplest topology for implementing an AC-DC LED driver because high PF can be achieved with the converter operating as a resistor emulator. Figure 3 shows the LED driver circuit of the converter under study. The LED is modeled as a series branch of three components: a small dynamic resistor , a DC source representing the knee voltage and an ideal diode. Although this is the standard model of a diode, it has not been normally used in AC-DC LED driver design in favor of just the typical and simple equivalent resistance. As will be shown, more accurate results will be obtained in the implementation of the harmonic injection technique for reducing the PTAR if the complex model is considered.
To simplify the analysis of the converter operation, elements such as diode D1, MOSFET (switch Q1), capacitor Co, and inductor L are considered ideal. The buck converter operates with an input voltage equal to a rectified line voltage (). The input current follows the input voltage as long as the input voltage is higher than the output one, defined by the required LED forward voltage . Figure 4a shows the rectified input voltage, inductor current and output current which starts increasing at and reaches zero again at . Their values can be expressed as follows:
where is the peak value of the input voltage, is the output voltage (LED voltage), M is the conversion ratio of the converter and is the period of the input voltage. It should be mentioned that the output voltage is assumed to be constant to simplify the calculation.
2.1. Period 1: ( ≤ t ≤ )
For period 1, the rectified voltage can be expressed as:
By referring to Figure 3, the inductor voltage during the on state of can be expressed as:
The instantaneous peak inductor current, as shown in Figure 4a, is equal to Δ as the converter operates at DCM, and can be expressed as:
where is constant in each switching period, and is the switching frequency.
Also, the maximum peak inductor current over the line cycle can be calculated at the peak line input voltage as:
where is the maximum duty cycle.
The instantaneous input current, averaged over each switching period, can be expressed as:
where is the instantaneous rectified current averaged over the switching period.
By ignoring the converter losses, the instantaneous input and output power are equal (over a switching period):
where is the output power and is the input power. By referring to (7) and substituting it into (9) the expression for the output current can be expressed as:
From (10), the instantaneous duty can be expressed as:
Referring to (11), the duty cycle in DCM depends on the power stage inductance L, switching frequency , output current , the input voltage and the output voltage .
2.2. Period 2: ( and )
As explained in the section above, Equation (11) represents the derived control duty cycle for the system under study during the main conduction period ( ≤ t ≤ ). Here the duty cycle equation for the remaining part of the period will be derived.
The converter operates in DCM, where the conversion ratio can be given as:
where and is the equivalent load seen by the converter.
By replacing by in (12) to obtain the boundary between the DCM and CCM, so the duty cycle equals .
Combing period 1 and 2, using (11) and (12), the duty cycle is derived over the full range as:
3. Modeling of Proposed E-Cap Less Converter under Harmonic Injection
Harmonic injection will be used to limit the PTAR of the output current. Equation (13) gives the duty cycle of the LED system under study. It is clear that the duty cycle is a function of the instantaneous output LED current and the input rectified voltage. If the output LED current is considered a dc value, the duty cycle shape will be as sketched in Figure 4b with orange line. This results in a PTAR of 2 for pure restive loads and even higher for real LEDs. Injecting harmonics into the current will imply modifying the duty cycle shape as shechted in Figure 4b with black line. In this section, a detailed study for the required harmonic injection components to limit the PTAR while keeping the target PF will be presented.
3.1. LED Output/Input Currents’ Harmonics Relations
Figure 4a shows that the LED current during the positive half-line cycle can be expressed as:
where is the DC component, is the peak value of the harmonic component with order n. It is worth to note that if n = 1, this refers to conventional system without harmonic injection.
is a function of the conversion ratio M, resulting from the integration over the period , where is a function of M as derived in (1). Therefore, from (3), (7), (9) and (14) the input current can be derived as:
Using a trigonometric expansion and Chebyshev polynomials to simplify the input current equation [25]:
The Fourier series expansion of the input current is a sum of sinusoidal waveforms with different amplitudes and different frequencies:
where is the peak value for the nth order harmonic component. By comparing (16) and (17), the relation between the input and output currents harmonics can be obtained:
3.2. Designed Operating Regions under Target PF and PTAR
From (14), there are multiple combinations of harmonics that can be injected to limit the PTAR while keeping the same PF and the same LED average current (). Therefore, a MATLAB script to sweep all possible combinations for the output current harmonics can be used. The target are those harmonic combinations that lead to minimum PTAR while keeping a PF greater than 0.9.
PF consists of two factors, distortion and displacement. In this case, the displacement factor is considered unity due to the converter operation in DCM. The distortion factor is then the significant one [26]:
Substituting (18) into (19) to determine PF expression as a function of the LED current harmonics:
The PTAR can be derived from (14) by normalizing the LED current with the DC component. Therefore, the PTAR value will be the peak value of the periodic signal, which can be expressed as:
Regarding the MATLAB script, there are a many harmonics values which can be combined to implement the LED current considering the boundaries given in Equations (20) and (21), which determine the relation between the PTAR, the PF and the conversion ratio M. Therefore, the MATLAB script increases the amplitude of each harmonic component ( and calculates the PTAR and the PF in each case. Valid combinations are those that satisfy the constraint of 0.9 as minimum PF value. Among them, the optimum one will be that with the lowest value of PTAR. Five cases are presented here. Case I is a double the frequency (). Case II is a combination of harmonics from the second () to the fourth order (). Case III is a combination of harmonics from the second () to the sixth order (). Case IV is a combination of harmonics from the second () to the eighth order (). Finally, Case V is a combination from the second () to the tenth order ().
The proposed analysis follows the flow chart presented in Figure 5. Adding more harmonics decreases the PTAR but also the PF. It is worth mentioning that the cases with higher harmonic orders (above tenth order) have been tested, but they are not considered here as they have a significant impact on PTAR but have a low PF (lower than 0.9) for any harmonic combination.
It is in this script where using the real model of the LED rather than the typical equivalent resistance makes the conversion ratio to have a significant impact on PTAR and PF. Figure 6 shows the PTAR under Case V as a function of M while keeping the PF equals to 0.9. It should be mentioned that each point of the graph is obtained by the MATLAB script, which means that the minimum PTAR is shown. As illustrated in this graph, for a PTAR of less than 1.43, the accepted conversion ratio is limited to 0.2. This explain the mismatch in the results obtained by [10,11], where 1.43 was obtained experimentally, while 1.34 was targeted in the theoretical model. Also, this result clarifies the limitation of the conversion ratio in harmonic injection techniques. Using curve fitting, a relation between the PTAR and the conversion ratio M is found:
4. Proposed Control Circuit and Simple Implementation
Taking the benefits described in the previous section, the control loop that reshapes the required LED current will be derived in this section using a straightforward control block. The harmonic combinations obtained from the MATLAB script for the output LED current. The duty cycle can be expressed as a Fourier series expansion using the curve fitting as:
The duty cycle defined in (23) can be obtained by means of the proposed feedforward loop, which allows the chosen harmonic components to pass through. This reshapes the input and output currents as desired. Figure 7 shows the proposed closed-loop control for the LED driver. As can be seen, only a single feedback loop is implemented. The loop compensator, taking advantage of the previously explained harmonic injections optimization, should adjust the duty cycle according to the harmonics obtained from the MATLAB script.
The loop compensator gain can be computed by dividing each order value of duty cycle harmonics, (24) by the output LED current harmonics, (14). The gain plot of the compensator output can be expressed in logarithmic scale as:
The results obtained with (25) states that this proposed reshaping block (compensation) is based on the division of the duty cycle by the output LED current harmonics.
5. Case Study
To validate the derived mathematical model and the proposed control, a case study will be analyzed in this section. The system parameters will be as follows:
- Nominal input voltage
- Line frequency
- Output voltage .
- Average output power .
- Output current .
- Switching frequency
- Input filter capacitor
- Input filter inductor
- Output filter capacitor
- Output filter inductor
- Series inductor with LED
It should be noted that the extra series inductor with LED is used to act as a low pass filter to attenuate the switching frequency harmonics and preventing it to flow through the LED chips.
5.1. Determination of the Targeted Injected Harmonics’ Order Values
Firstly, using (23), the PTAR is determined for the selected conversion ratio M (in this case M = 0.27) For (198 V, 220 V, 244 V) and 60 V output voltage, the PTAR is found to be 1.44, 1.41, and 1.38, respectively. It is important to highlight the advantage of this model where the designer can decide from the beginning of the design process if this resulting PTAR is acceptable or not and if another acceptable conversion ratio M has to be chosen.
Secondly, the MATLAB script is used to calculate the values of the required harmonics to be injected in the output current so that the predefined PTAR is obtained and the PF regulations are observed. Figure 8 shows the output LED current for different harmonic combination cases, as explained in the previous section. It can be shown that the peak value of the output current decreases gradually as the injected harmonic orders increases, while having the same LED current average. Figure 9 shows the input current under the same conditions. Table 1 illustrates the PTAR and the PF for each case. It is clear that Case V (with harmonics up to the tenth order) is the best one as the lowest PTAR is obtained for nominal input voltage (220 V).
5.2. Design Control Values for Single Multifunction Block (SMFB)
Once the LED current harmonics are obtained from MATLAB script, their values can be substituted in (14) in order to have the output LED current with its injected harmonic. Then, this output LED current is substituted into the duty cycle Equation (13). The resulting duty cycle is drawn and then the curve fitted as shown in Figure 10. Through this curve fitting, the Fourier components of the duty cycle waveform are obtained. Using (24), the results for the obtained gain, from the division of the duty cycle harmonics to the output LED harmonics, is plotted and fitted in Figure 11a.
It is possible to study the required features for this reshape SMFB with the results shown in Figure 11a. The required gain for the loop compensator is almost flat during the frequency range of 100 Hz–500 Hz, which is the frequency range for harmonic injection. As this analysis is concerned with the frequency range of the harmonic injection, it does not discuss the frequency range above this 500 Hz. However, this can follow regular design rules (i.e., having a low-pass filter with bandwidth in the range of one tenth of the switching frequency).
A simple implementation for this proposed SMFB can be an integrator and a pole before the double line frequency, in addition to an extra pole below one tenth of the switching frequency to filter undesired harmonics component. One critical point is that the required phase should be zero within the 100 Hz–500 Hz range to keep the line current and line voltage in phase (displacement PF requirement).
To summarize, the compensator parameters for this system can be summarized as:
- Integrator for regulation purpose.
- One zero at a frequency lower than one tenth of twice the line frequency to flat the gain and keep the phase angle to zero.
- One pole between the last injected harmonic (>500 Hz, in this case) and one tenth of the switching frequency to filter undesired high frequency harmonics.
The transfer function of the described system can be presented as:
Figure 11b shows the described system bode plot with the integrator, one zero at one hertz, and one pole at 4 kHz. One advantage of the proposed system is that it has a higher bandwidth, which introduces better dynamics than conventional systems with usually 10 Hz bandwidth.
The SMFB functions are summarized in Figure 12 regulation for the LED average current, duty cycle reshaping, harmonics injection and output current reshaping.
6. Simulation & Experimental Results
To validate the proposed idea, simulation and experimentation are carried out. Figure 13a describes the circuit diagram used in both simulation and practice. It consists of the EMI filter, the rectifier bridge, and the buck converter. The buck converter switch is AOT22N50 500 V, 22 A N-Channel MOSFET and the diode is ES1J which is 1 A, 200 V Surface Mount Super-Fast Rectifier. The converter has a small output film capacitor to increase the lifetime of the LED driver. Small series resistor Surface Mount is inserted to sense the output current for the control circuit.
The compensator is a Type II, as shown in Figure 13b Due to the simplicity of the control circuit, a generic PWM controller can be used, the UC3825a IC from Texas Instrument with a few surface mount technology (SMT) components. The compensator capacitors and resistors can be calculated using (25). Table 2 shows the compensator values.
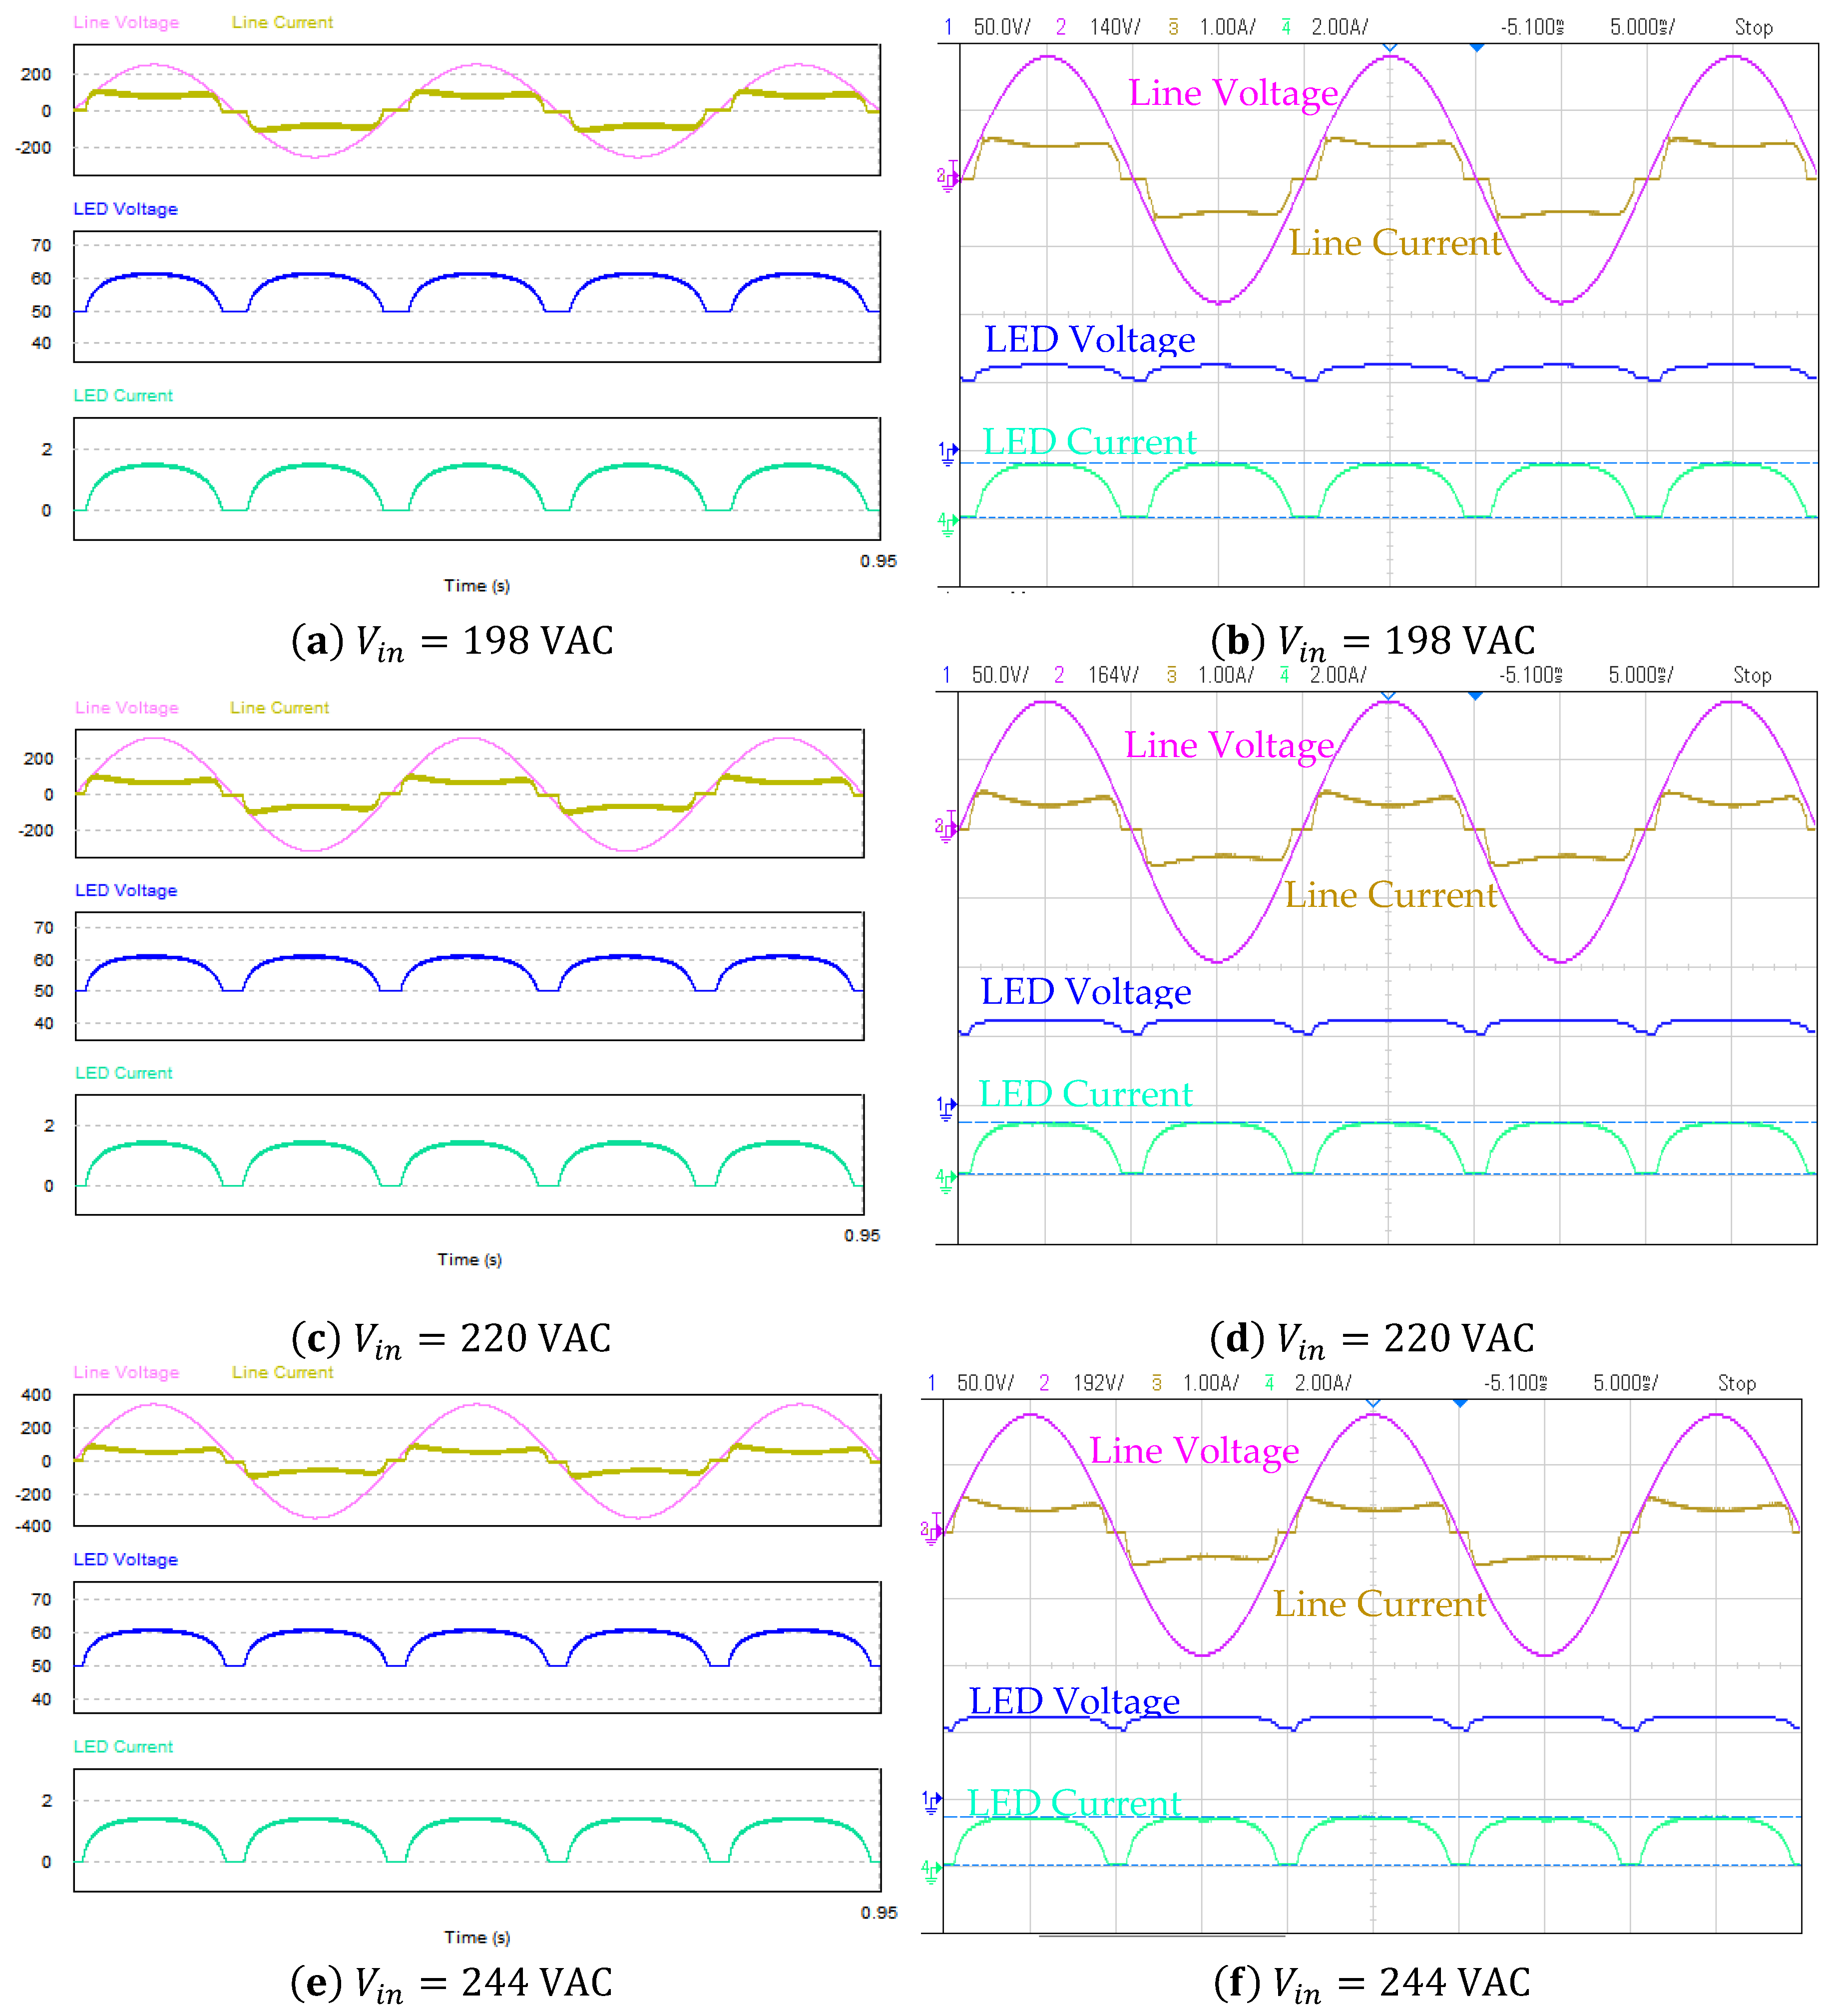
Figure 14 shows the simulation results obtained with PSIM (left column) as well as the experimental measurements on the prototype (right column). All the figures present the input voltage , input current , output voltage and output current in AC-DC electrolytic-capacitor-less buck converter. As shown, different line voltages were tested. Figure 14a,b show the results for which implies a conversion ratio of M = 0.21. The recorded PF is 0.9 and the PTAR is 1.43. Similarly, the system under study is tested for (nominal value), which represents M = 0.19, and its results are shown in Figure 14c,d. The recorded PF is 0.9 and the PTAR is 1.41. For , the results are shown in Figure 14e,f. The recorded PF is 0.9 and the PTAR is 1.39 (M = 0.17). Also, no phase shift happens between input current and line voltage as shown in the figures.
As discussed in introduction about the finding in [10], the circuit aimed to inject 3rd and 5th harmonics into the input current to eliminate the E-Cap. This was proposed using complex control technique which increase the component counts and leads to increase the LED driver technology as shown in Table 3 in compare to the proposed single-feedback loop in this paper. In addition, the mathematical model in [2] showed that the PTAR is 1.34, however the experimental results have a mismatch where a PTAR of 1.43 is reported. On the other hand, the proposed mathematical model in this paper has a good correlation with experimental results as shown in Figure 15. This graph shows different values for the PTAR and conversion ratio M under simulation, experimental and mathematical model.
An AC-DC power converter should be complied with EN 61000-3-2 standard. This standard for limiting the harmonics current level of the electronics equipment which is injected by different loads back to the grid. Figure 16 shows a comparison between the input current values for the proposed circuit and the maximum values for EN 61000-3-2 Class D standard. This class should be complied for the lighting equipment with an input power smaller or equal than 25 W. The figure verifies that the proposed circuit is compliance with EN 61000-3-2 standard [27].
The proposed solution has the features of single feedback loop with low component counts for E-cap less LED solution under limited PTAR, by its turn lower cost solution. Within test, there was no record for visible flicker. However, flicker issue requires more investigation due to the increase in the LED current modulation percentage [28].
7. Conclusions
This paper has proposed the use of the complete LED model instead of the simple equivalent resistance. Its relevance and influence on the design, on the PF and on the PTAR are explored. The proposed model is derived under harmonic injection technique and it determines the required harmonic to limit the LED current PTAR and keep the input PF higher than 0.9. Based on the derived model, a reshape control block is proposed and implemented using a second-order compensator with a single feedback loop. This circuitry can be applied to different converters topologies such as Flyback converter. Results show a good agreement between simulation and experimentation. Results conclude that there is a specified range for the conversion ratio so the target PTAR can be achieved with while complying with ENERGY STAR and EN 61000-3-2 Class D standard.
Author Contributions
M.N. conceived and designed the experiments, performed the experiments, analyzed the data, and wrote the paper. M.O. define the concept, review results, supervision and manage the project. M.A. review results, revised and edited the manuscript. E.M.A., E.-S.H. co-supervised the work.
Funding
This research received no external funding.
Conflicts of Interest
The authors declare no conflict of interest.
References
- Machine, W. Lifetime of White LEDs; US Department of Energy: Washington, DC, USA, 2009. [Google Scholar]
- Wang, Y.; Alonso, J.M.; Ruan, X. A Review of LED Drivers and Related Technologies. IEEE Trans. Ind. Electron. 2017, 64, 5754–5765. [Google Scholar] [CrossRef]
- Gebreel, A.; Nassary, M.; Bakr, A. Low Cost Low Voltage Low Power Integrated LED Driver; LAP LAMBERT Academic Publishing: Saarbruggen, Germany, 2016. [Google Scholar]
- Cree First to Break 300 Lumens-Per-Watt Barrier. CREE, 26 March 2014. Available online: http://www.cree.com/ (accessed on 2 November 2018).
- Cheng, C.A.; Cheng, H.L.; Chung, T.Y. A Novel Single-Stage High-Power-Factor LED Street-Lighting Driver With Coupled Inductors. IEEE Trans. Ind. Appl. 2014, 50, 3037–3045. [Google Scholar] [CrossRef]
- Fortunato, M. Ensure Long Lifetimes from Electrolytic Capacitors: A Case Study in LED Light Bulbs. Maximintegrated, 29 May 2013. Available online: www.maximintegrated.com (accessed on 2 November 2018).
- Montanari, D.; Saarinen, K.; Scagliarini, F.; Zeidler, D.; Niskala, M.; Nender, C. Film Capacitors for Automotive and Industrial Applications. October 2008. Available online: www.kemet.com (accessed on 2 November 2018).
- Almeida, P.S.; Nogueira, F.J.; Guedes, L.F.A.; Braga, H.A.C. An experimental study on the photometrical impacts of several current waveforms on power white LEDs. In Proceedings of the XI Brazilian Power Electronics Conference, Praiamar, Brazil, 11–15 September 2011; pp. 728–733. [Google Scholar]
- Almeida, P.S.; Bender, V.C.; Braga, H.A.C.; Costa, M.A.D.; Marchesan, T.B.; Alonso, J.M. Static and Dynamic Photoelectrothermal Modeling of LED Lamps Including Low-Frequency Current Ripple Effects. IEEE Trans. Power Electron. 2015, 30, 3841–3851. [Google Scholar] [CrossRef]
- Wang, B.; Ruan, X.; Yao, K.; Xu, M. A Method of Reducing the Peak-to-Average Ratio of LED Current for Electrolytic Capacitor-Less AC–DC Drivers. IEEE Trans. Power Electron. 2010, 25, 592–601. [Google Scholar] [CrossRef]
- Ruan, X.; Yao, B.W.K.; Wang, S. Optimum Injected Current Harmonics to Minimize Peak-to-Average Ratio of LED Current for Electrolytic Capacitor-Less AC–DC Drivers. IEEE Trans. Power Electron. 2011, 26, 1820–1825. [Google Scholar] [CrossRef]
- Gu, L.; Ruan, X.; Xu, M.; Yao, K. Means of Eliminating Electrolytic Capacitor in AC/DC Power Supplies for LED Lightings. IEEE Trans. Power Electron. 2009, 24, 1399–1408. [Google Scholar] [CrossRef]
- Nassary, M.; Orabi, M.; Ahmed, E.; Hasaneen, El.; Gaafar, M. Control Circuit Optimization for Electrolytic Capacitor-Less LED Driver. In Proceedings of the IEEE MEPCON Conference, Cairo, Egypt, 19–21 December 2017. [Google Scholar]
- Lamar, D.G.; Sebastian, J.; Arias, M.; Fernandez, A. On the Limit of the Output Capacitor Reduction in Power-Factor Correctors by Distorting the Line Input Current. IEEE Trans. Power Electron. 2012, 27, 1168–1176. [Google Scholar] [CrossRef]
- Lamar, D.G.; Sebastián, J.; Arias, M.; Fernández, A. Reduction of the Output Capacitor in Power Factor Correctors by Distorting the Line Input Current. In Proceedings of the 2010 Twenty-Fifth Annual IEEE Applied Power Electronics Conference and Exposition (APEC), Palm Springs, CA, USA, 21–25 February 2010; pp. 196–202. [Google Scholar]
- Rezaei, K.; Golbon, N.; Moschopoulos, G. A New Control Scheme for an AC-DC Single-stage Buck-Boost PFC Converter with Improved Output Ripple Reduction and Transient Response. In Proceedings of the APEC 2014, Beijing, China, 10–12 November 2014; pp. 1866–1873. [Google Scholar]
- Soares, G.M.; Alonso, J.M.; Braga, H.A.C. Investigation of the Active Ripple Compensation Technique to Reduce Bulk Capacitance in Off-line Flyback-Based LED Drivers. IEEE Trans. Power Electron. 2018, 33, 5206–5214. [Google Scholar] [CrossRef]
- Soares, G.M.; Almeida, P.S.; Alonso, J.M.; Braga, H.A.C. Capacitance Minimization in Offline LED Drivers Using an Active-Ripple-Compensation Technique. IEEE Trans. Power Electron. 2017, 32, 3022–3033. [Google Scholar] [CrossRef]
- Yang, Y.; Ruan, X.; Zhang, L.; He, J.; Ye, Z. Feed-Forward Scheme for an Electrolytic Capacitor-Less AC/DC LED Driver to Reduce Output Current Ripple. IEEE Trans. Power Electron. 2014, 29, 5508–5517. [Google Scholar] [CrossRef]
- Wang, S.; Ruan, X.; Yao, K.; Tan, S.C.; Yang, Y.; Ye, Z. A Flicker-Free Electrolytic Capacitor-Less AC–DC LED Driver. IEEE Trans. Power Electron. 2012, 27, 4540–4548. [Google Scholar] [CrossRef] [Green Version]
- Lee, K.W.; Hsieh, Y.H.; Liang, T.J. A Current Ripple Cancellation Circuit for Electrolytic Capacitor-less AC-DC LED Driver. In Proceedings of the 2013 Twenty-Eighth Annual IEEE Applied Power Electronics Conference and Exposition (APEC), Long Beach, CA, USA, 17–21 March 2013; pp. 1058–1061. [Google Scholar]
- Shen, Y.C.; Liang, T.J.; Tseng, W.J.; Chang, H.H.; Chen, K.H.; Lu, Y.J.; Li, J.S. Non-Electrolytic Capacitor LED Driver with Feedforward Control. In Proceedings of the IEEE Energy Conversion Congress and Exposition (ECCE), Montreal, QC, Canada, 20–24 September 2015; pp. 3223–3230. [Google Scholar]
- Hui, S.Y.; Li, S.N.; Tao, X.H.; Chen, W.; Ng, W.M. A Novel Passive Offline LED Driver With Long Lifetime. IEEE Trans. Power Electron. 2010, 25, 2665–2672. [Google Scholar] [CrossRef]
- Chen, W.; Li, S.N.; Hui, S.Y.R. A Comparative Study on the Circuit Topologies for Offline Passive LightEmitting Diode (LED) Drivers with Long Lifetime & High Efficiency. In Proceedings of the IEEE Energy Conversion Congress and Exposition, Atlanta, GA, USA, 12–16 September 2010; pp. 724–730. [Google Scholar]
- Kreyszig, E. Advanced Engineering Mathematics, 7th ed.; Wiley: Hoboken, NJ, USA, 1992. [Google Scholar]
- Robert, W. Erickson and Dragan Maksimovic, Fundamentals of Power Electronics, 2nd ed.; Springer Science+Business Media, LLC: New York, NY, USA, 2001. [Google Scholar]
- European Power Supply Manufacturers Association. Harmonic Current Emissions: Guidelines to the Standard EN 61000-3-2; EPSMA: Winchester, UK, 2010. [Google Scholar]
- IEEE Recommended Practices for Modulating Current in HighBrightness LEDs for Mitigating Health Risks to Viewers; IEEE Std: Piscataway, NJ, USA, 2015; pp. 1–80.
Figure 1.
Different cases of the output current waveforms and its circuit diagram under harmonic injection [10,11]. (a) Combination of double and third line harmonics orders; (b) Combination of double and fifth line harmonics orders; (c) Combination of double, third and fifth line harmonics orders.

Figure 2.
Parallel type of ripple cancellation circuit diagram [19].
Figure 2.
Parallel type of ripple cancellation circuit diagram [19].

Figure 3.
AC-DC E-Cap-less buck converter.
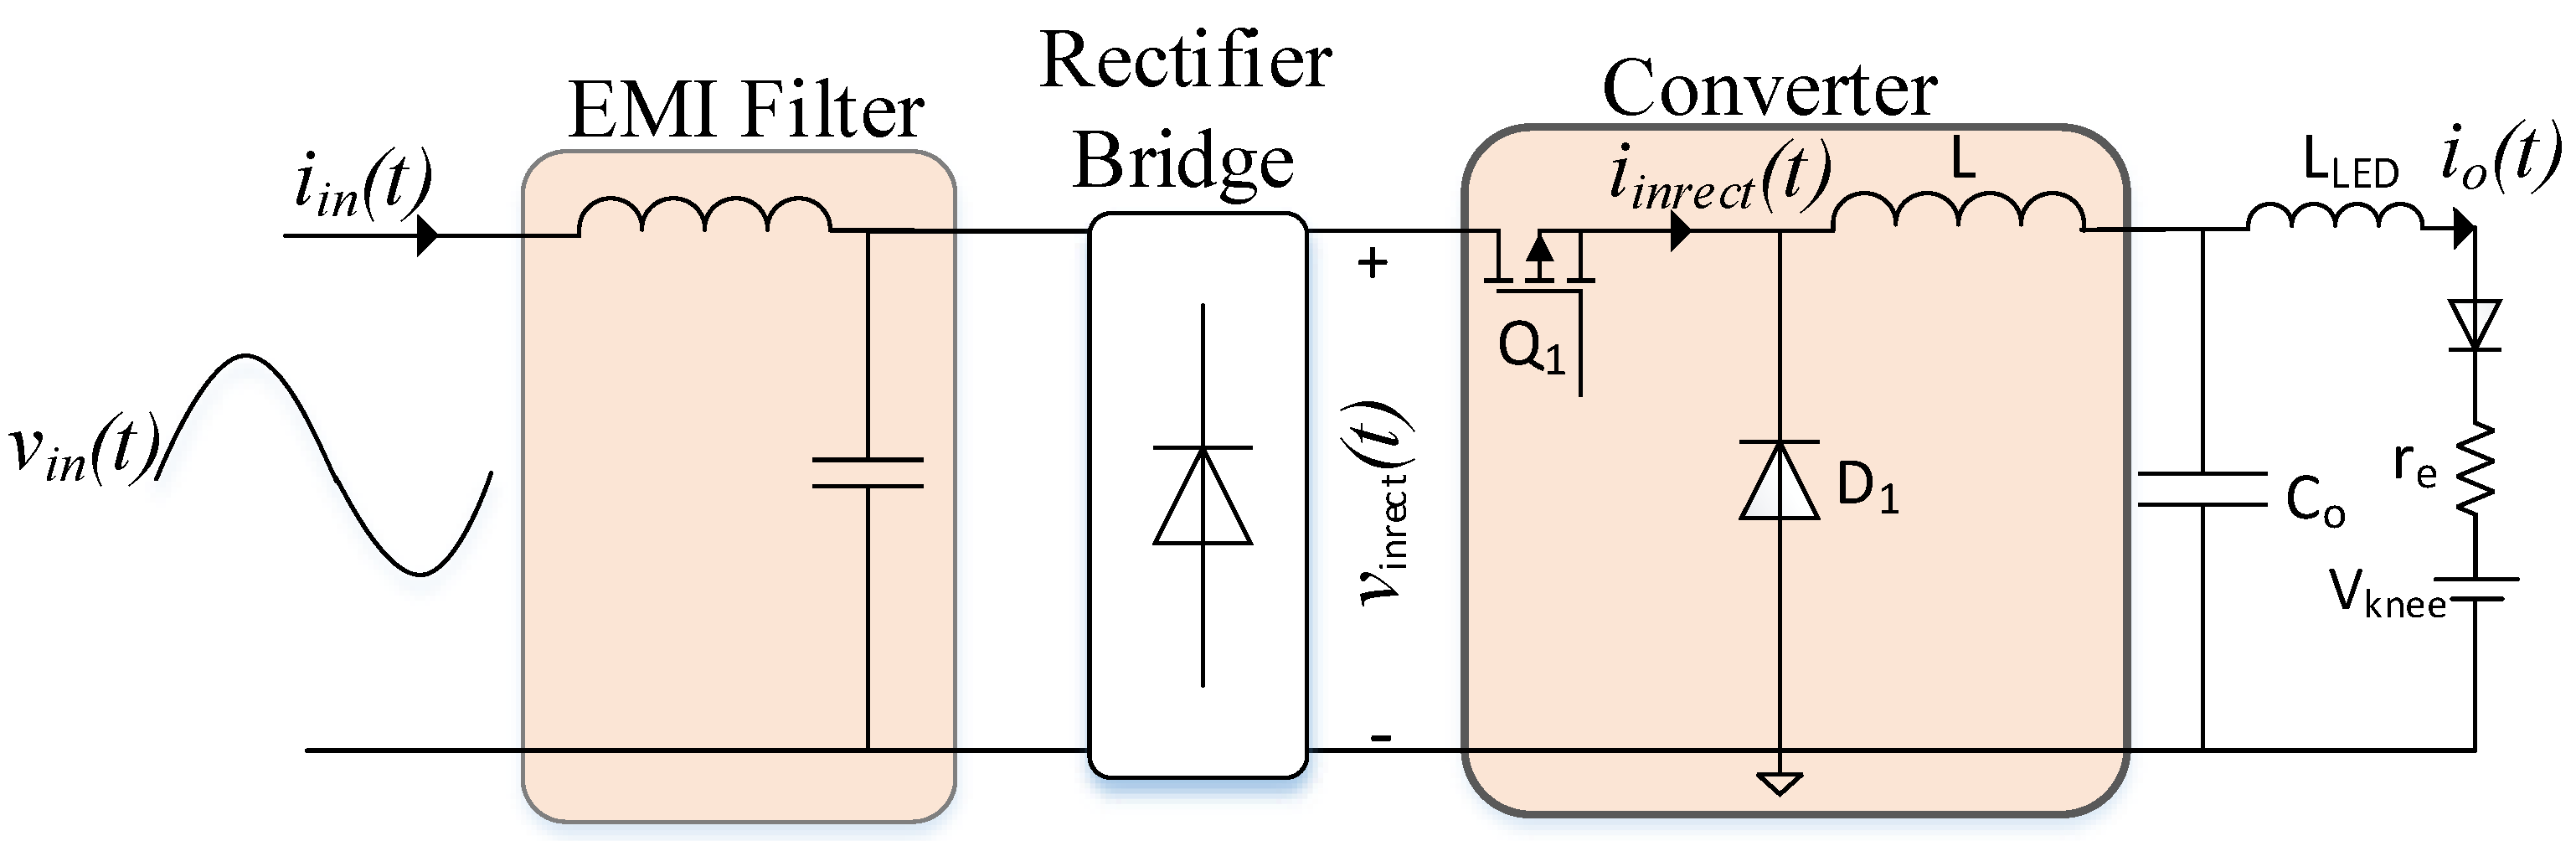
Figure 4.
LED driver based buck converter for E-Cap less waveforms with and without harmonics injections. (a) Sketch for the rectified input voltage and inductor current without harmonics injection. (b) The Duty cycle shape with and without harmonics injection.
Figure 4.
LED driver based buck converter for E-Cap less waveforms with and without harmonics injections. (a) Sketch for the rectified input voltage and inductor current without harmonics injection. (b) The Duty cycle shape with and without harmonics injection.

Figure 5.
Flow chart of the MATLAB script.
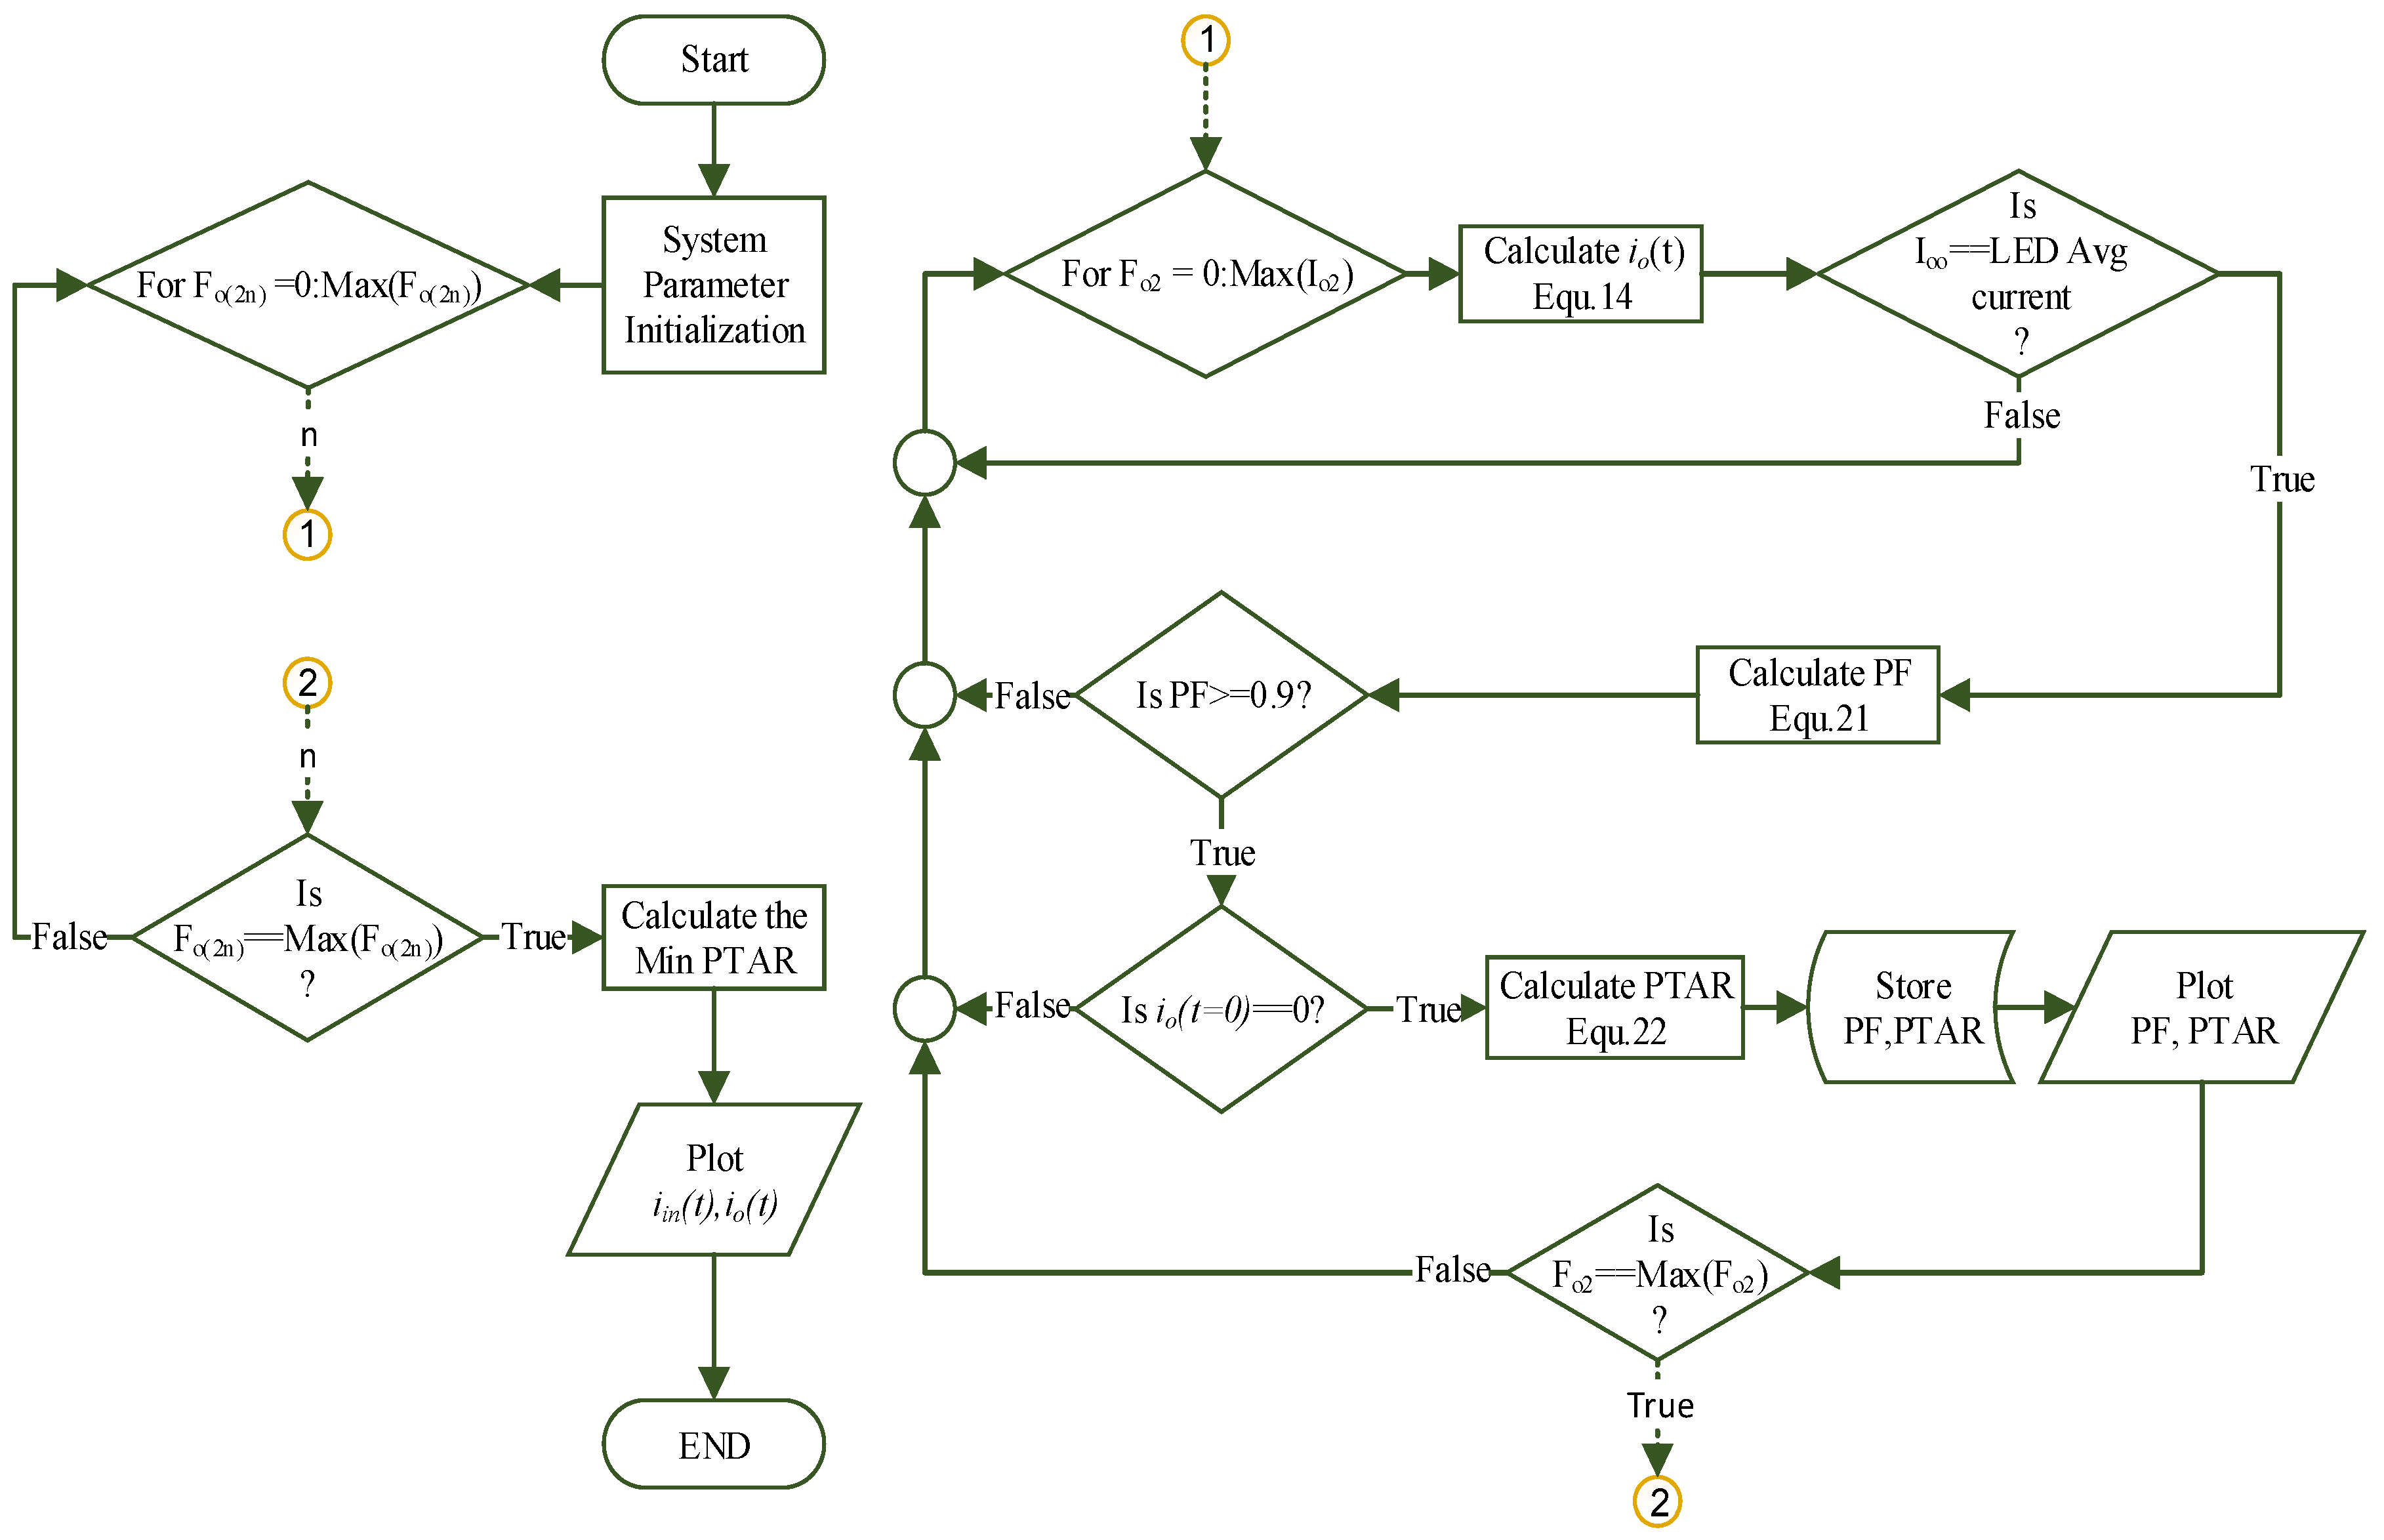
Figure 6.
Curve fitted for different values for conversion ratio (M) and Peak to Average Ratio (PTAR).
Figure 6.
Curve fitted for different values for conversion ratio (M) and Peak to Average Ratio (PTAR).

Figure 7.
Closed system block configuration of DCM converter.

Figure 8.
The LED current waveforms under different harmonics order combinations at .

Figure 9.
The input current waveform under different harmonics order combinations at .

Figure 10.
Duty cycle curve fitting.
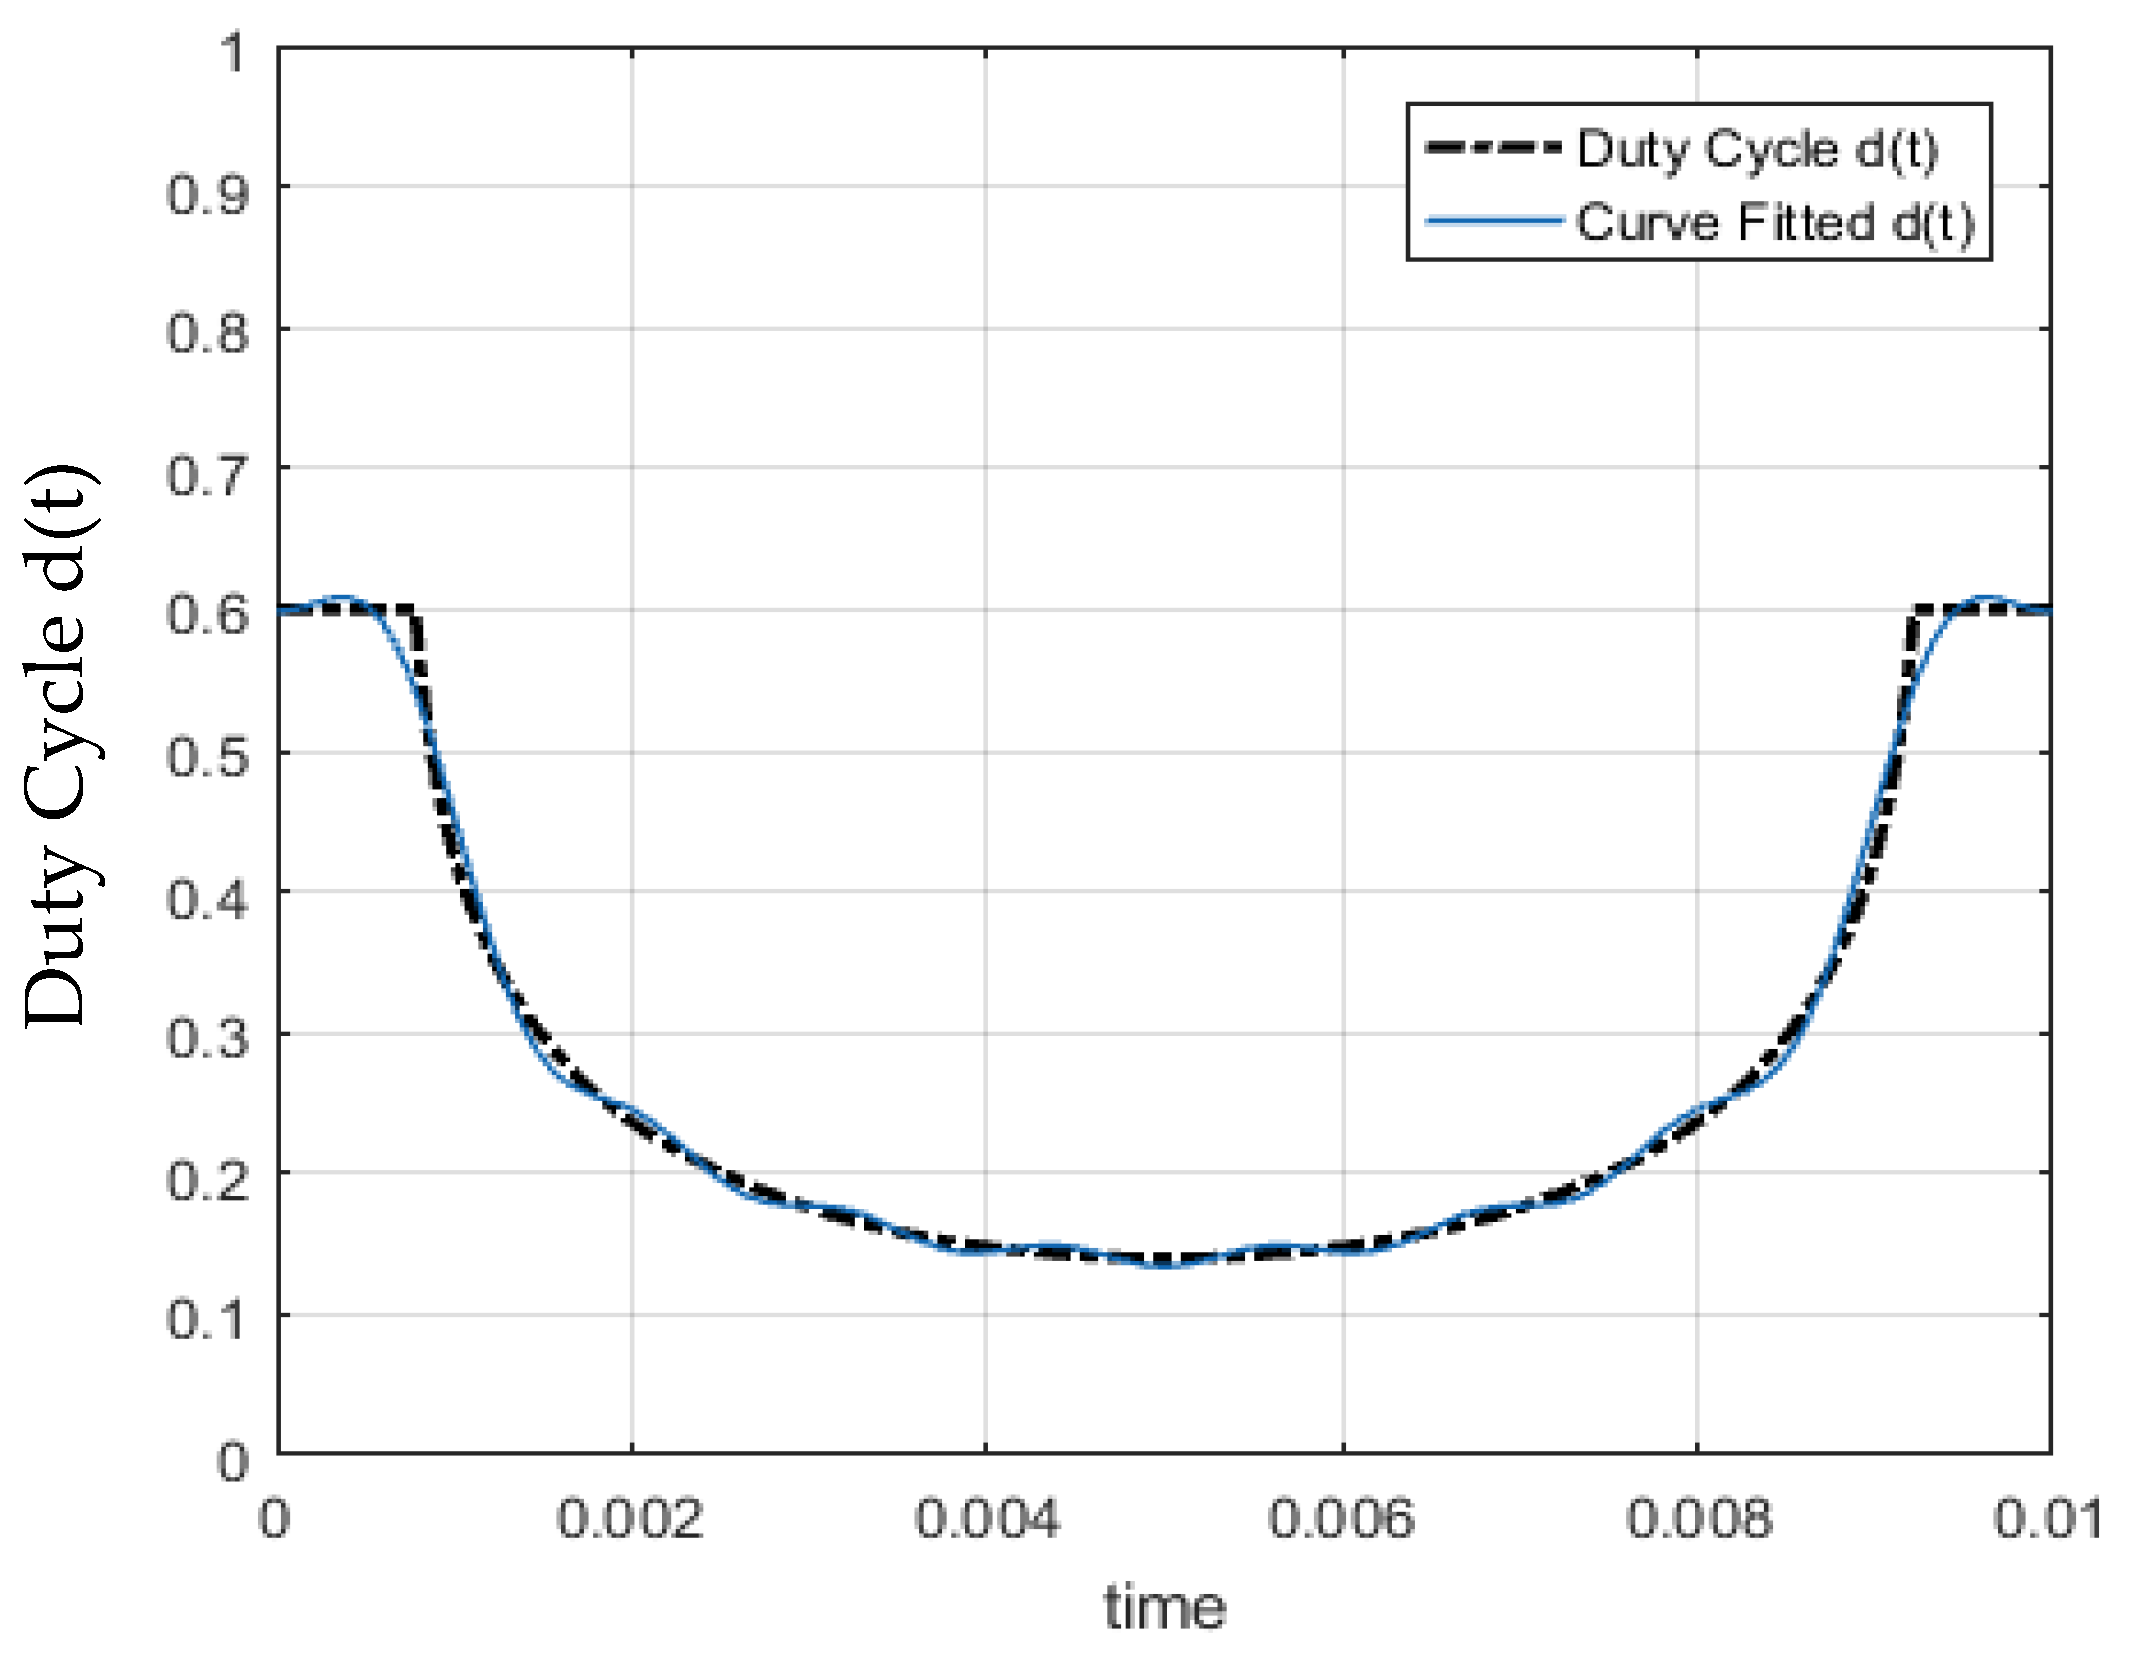
Figure 11.
(a) Model of the bode plot. (b) Bode diagram of the system transformation function.

Figure 12.
Single Multifunction Block (SMFB) functions.

Figure 13.
(a) Proposed circuit forharmonics injection. (b) Compensator circuit diagram for E-Cap less converter.
Figure 13.
(a) Proposed circuit forharmonics injection. (b) Compensator circuit diagram for E-Cap less converter.

Figure 14.
Simulation and prototype waveform results of input voltage , input current , LED output voltage and output LED current in buck converter.
Figure 14.
Simulation and prototype waveform results of input voltage , input current , LED output voltage and output LED current in buck converter.

Figure 15.
Obtained PTAR at different values for conversion ratio (M) from mathematical model, practical and simulation.
Figure 15.
Obtained PTAR at different values for conversion ratio (M) from mathematical model, practical and simulation.

Figure 16.
Comparison between the proposed Input current values and maximum level for EN 61000-3-2 Class D standard.
Figure 16.
Comparison between the proposed Input current values and maximum level for EN 61000-3-2 Class D standard.


Table 1.
PTAR and PF values at different cases, Vin = 220 V.
| Harmonics | Case I | Case II | Case III | Case IV | Case V |
|---|---|---|---|---|---|
| PF | 0.983 | 0.979 | 0.963 | 0.9163 | 0.90 |
| PTAR | 2.28 | 1.713 | 1.541 | 1.431 | 1.41 |
Table 2.
The compensator value.
| Component | R1 | R2 | C1 | C2 |
|---|---|---|---|---|
| Value | 100 k Ω | 200 k Ω | 1 uF | 220 pF |
Table 3.
comparison between the proposed circuit and [10].
© 2018 by the authors. Licensee MDPI, Basel, Switzerland. This article is an open access article distributed under the terms and conditions of the Creative Commons Attribution (CC BY) license (http://creativecommons.org/licenses/by/4.0/).
Share and Cite
MDPI and ACS Style
Nassary, M.; Orabi, M.; Arias, M.; Ahmed, E.M.; Hasaneen, E.-S. Analysis and Control of Electrolytic Capacitor-Less LED Driver Based on Harmonic Injection Technique. Energies 2018, 11, 3030. https://doi.org/10.3390/en11113030
AMA Style
Nassary M, Orabi M, Arias M, Ahmed EM, Hasaneen E-S. Analysis and Control of Electrolytic Capacitor-Less LED Driver Based on Harmonic Injection Technique. Energies. 2018; 11(11):3030. https://doi.org/10.3390/en11113030
Chicago/Turabian StyleNassary, Mahmoud, Mohamed Orabi, Manuel Arias, Emad M. Ahmed, and El-Sayed Hasaneen. 2018. "Analysis and Control of Electrolytic Capacitor-Less LED Driver Based on Harmonic Injection Technique" Energies 11, no. 11: 3030. https://doi.org/10.3390/en11113030
Note that from the first issue of 2016, this journal uses article numbers instead of page numbers. See further details here.