1. Introduction
The economic development of a state depends to a large extent on its ability to create and maintain constant access to energy resources. Contemporary society is in a continuous transformation. Both the current needs and the resources necessary for their satisfaction change rapidly, causing important mutations in everyday life. Energy production sectors are exempted from continuous transformations. Every day the need for energy is growing.
Energy security is the ability of a nation to deliver the energy resources needed to ensure its welfare and implies secure supply and stable prices. The decision about ensuring energy security are always taken over the long-term because it implies the implementation of large projects needing enormous investments. Energy sources can be divided into three main categories: fossil fuels, nuclear resources, and renewable energy sources [
1]. Renewable energy sources can provide energy free of air pollutants and greenhouse gasses by emitting zero or nearly 0% of these gasses [
2].
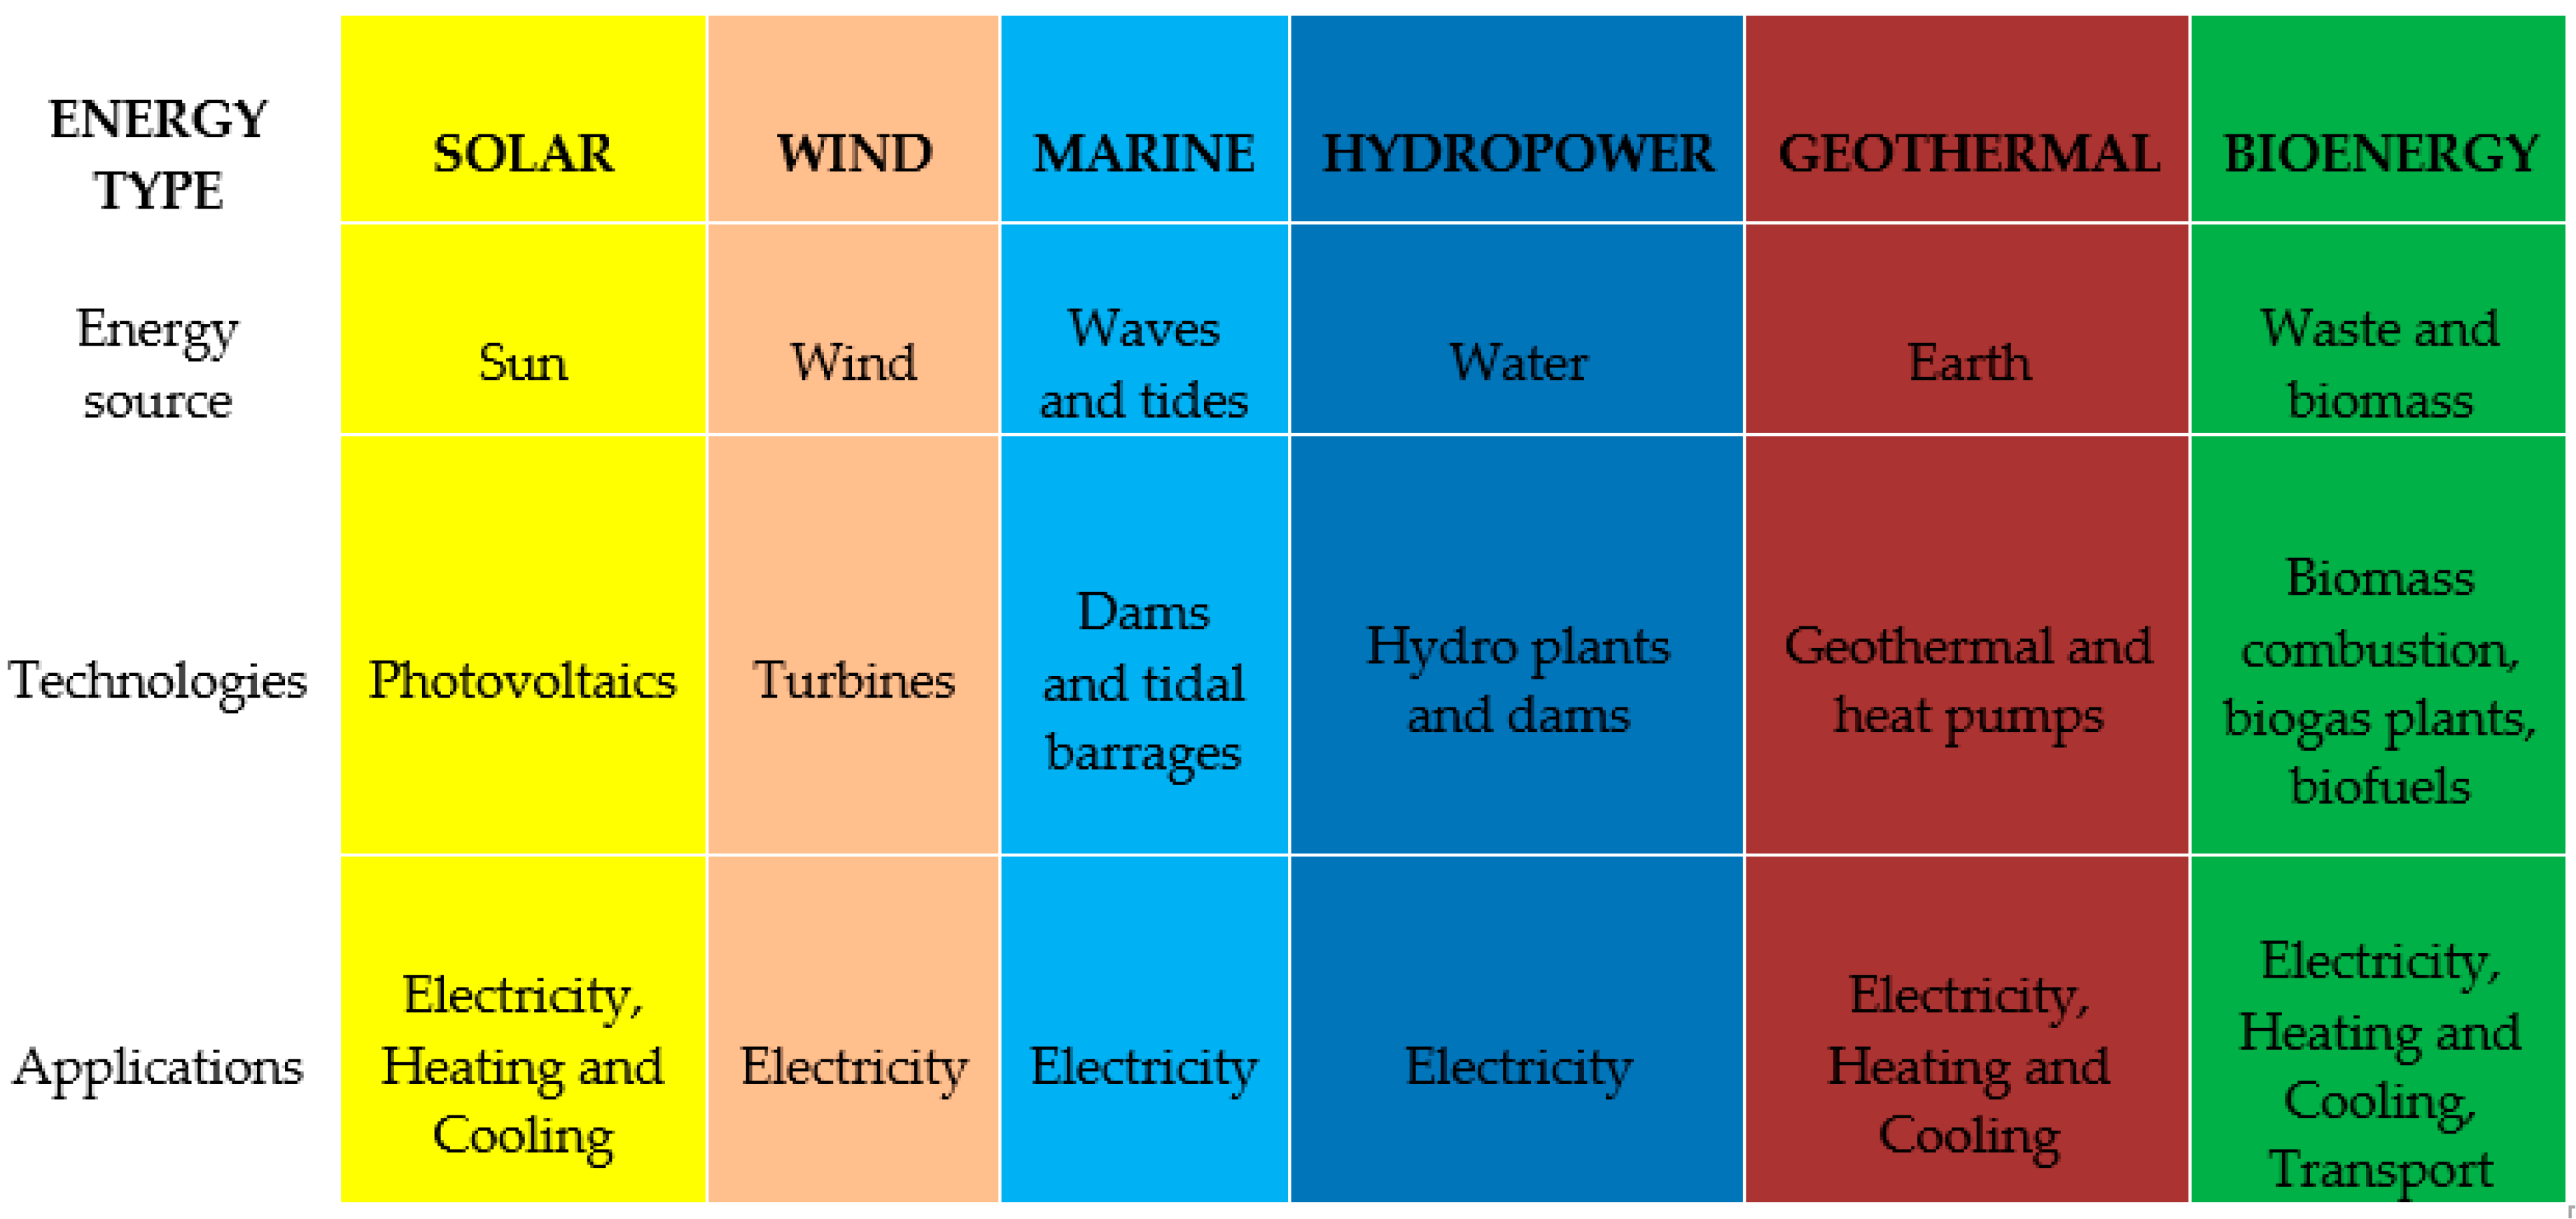
European Court of Auditors (ECA) reveals in a report which are the main types of renewable energy sources, relevant technologies and specific applications (
Figure 1). They sustain that using more renewable energy is crucial if the EU wants to reduce its greenhouse gas emissions to comply with the 2015 Paris Agreement on Climate Change [
3].
Globally, the energy sector has a significant impact on the environment, air pollution, water, soil pollution, and on GHG emissions or climate change. Between 2009 and 2013, the share of renewable energy sources (RES) in the EU’s energy generation mix increased from 9 to 16% and it is expected to grow up to 20% by 2020 [
4]. RES progress since 2005 allowed the EU to cut its fossil fuel use by 11% and its GHG emissions by 10% in 2015 [
5]. Over the last decade, significant progress has been made in the energy sector in Romania to limit the environmental impact. However, considerable efforts are still needed for the energy sector to contribute to Romania’s transition to an economy based on the principles of sustainable development.
Judicious value, energy resources contribute significantly to: (1) economic and social development, (2) improving the standard of living of the population, and (3) managing strategic challenges/surprises. Overall, energy supply is essential, given that any gap in energy supply can have significant negative consequences on both socio-economics and the public. Romania fulfills the first condition of energy security, holding important energy resources that can support integrated cycles in certain industrial branches. Theoretical potential of RE largely exceeds all other energy forms [
6]. In order to meet the world’s demand, an important factor that contributes to harvesting energy from renewable sources and to use them as the source of new, clean, and sustainable energy is technological advancement [
7,
8,
9]. The shift to renewable energy is mandatory given that fossil fuel supplies 85.77% of the primary energy consumption of the world [
10,
11]. Nowadays, a significant percentage (25.4% in 2014) of the total energy production in the EU comes from renewable energy sources [
12]. In Romania, with more than 30% of its total electricity demand coming from RES [
13], renewable energy production is significantly increasing [
14].
Romania has rich and varied renewable energy resources: biomass, hydropower, geothermal potential, wind, concentrated solar power (CSP), and photovoltaic energy. They are distributed throughout the country and can be exploited on a wider scale as soon as the performance-price ratio of technologies improves. This level will only be achieved by maturing new generations of equipment and related facilities. Romania has advanced the use of a significant part of the wind and photovoltaic energy potential. Evaluating the main renewable energy sources can be underlined that the least harmful to the environment is considered wind energy [
15,
16]. At the same time, it is sustainable and long-lasting, pollution-free, and eco-friendly [
17,
18,
19].
With a share of 24.7% in 2015, Romania has already achieved its 2020 target (24%) for renewable energy due, in particular, to the size of its hydropower sector, which is responsible for about one third of the installed power generation capacity, but also the evolution of wind energy (9.4% of the energy generated in 2014) and the use of biomass for heating (16.6% of final energy consumption) [
20]. As an EU member state, Romania must achieve the target established by the EU that binds the member states to reach a share of at least 27% of renewable energy in its gross final energy consumption [
5].
The objectives of the article are: (1) to outline the energy structure in Romania; (2) to present the evolution of the main renewable energy indicators in Romania; (3) to discuss the perspectives of renewable energy in Romania when Romania intends to participate in achieving the European targets for reducing CO2 emissions; (4) to indicate the challenges facing with the development of renewable energy in Romania; and (5) to predict the development of renewable energy in Romania and propose targeted countermeasures and suggestions.
The paper aims to present an overview of the different types of renewable energy resources, their current and future states, their share in different economic sectors, and their benefits.
This study contributes to the existing body of knowledge in several ways. First, this paper is one of the first contributions to the existing literature which shapes, in one review article, an overview of the Romania energy sector, the impact and the development of renewable energy in Romania, and outlines the future perspectives of this important economic sector. Secondly, this study is the first attempt to investigate the overall renewable energy in Romania after the publication of Energy Strategy of Romania 2016–2030 with the perspective of 2050, in the context of achieving the European Union Climate change targets and UN Sustainable Development Goals.
2. Energy Structure in Romania
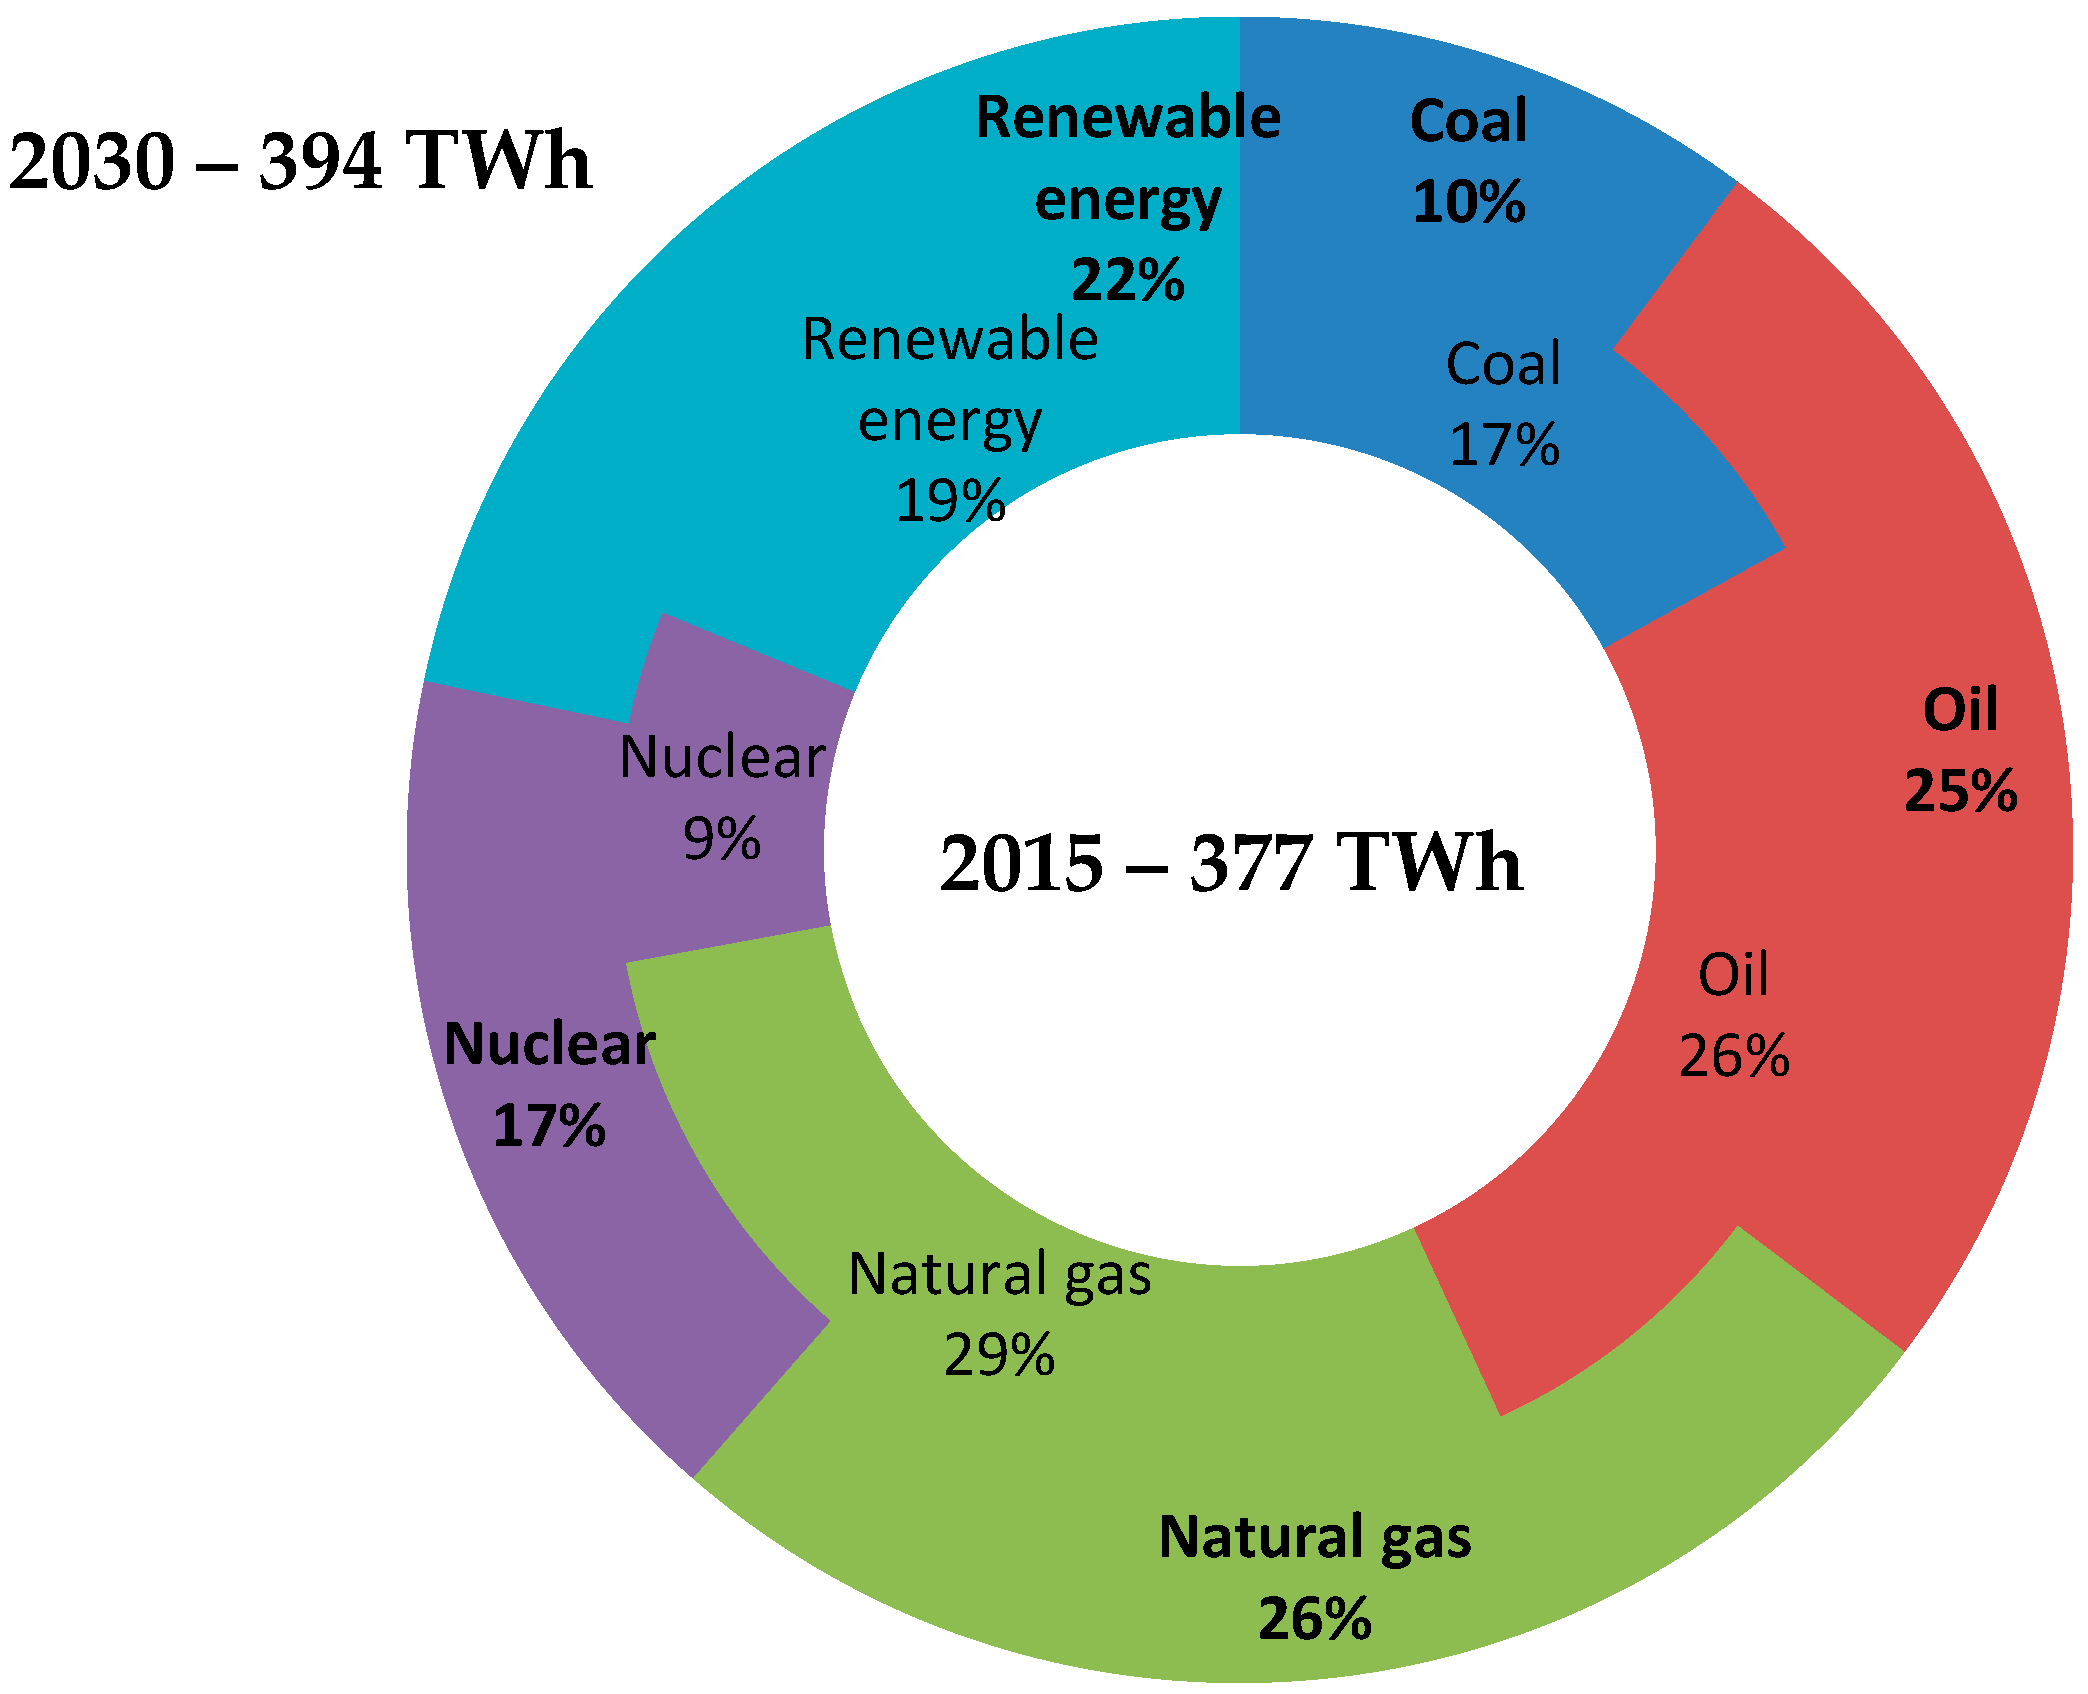
To have a complete overview of the Romanian energy structure, we choose to analyze the evolution of the main energy indicators in comparison with other six former communist countries who are also members of the EU. All the countries’ EU accessions were between 2004 and 2007, but they have a different level of development. Romania has become an extremely exciting country in terms of investment after EU accession. This is also due to the economic growth registered by this country over the last period. The Romanian economy grew by 7% in 2017, compared to 2016, the largest increase since 2008. In 2008, the Romanian economy grew by 7.1%, in real terms, compared to 2007. In 2016, the Romanian economy grew by 4.8% and, in 2015, the Romanian economy advanced by 3.9%. Though it can be observed that Romania’s gross energy consumption declined significantly after 1990, reaching 377 TWh in 2015, equivalent to about 19 MWh per capita, and the final energy consumption was 254 TWh. The modeling results estimate gross energy consumption in 2030 to 394 TWh (a 4% increase) and final energy demand to 269 TWh (a 6% increase). Consumption of energy resources as raw material is set to increase by 35% (6 TWh), while energy consumption and losses will decrease by 4 TWh.
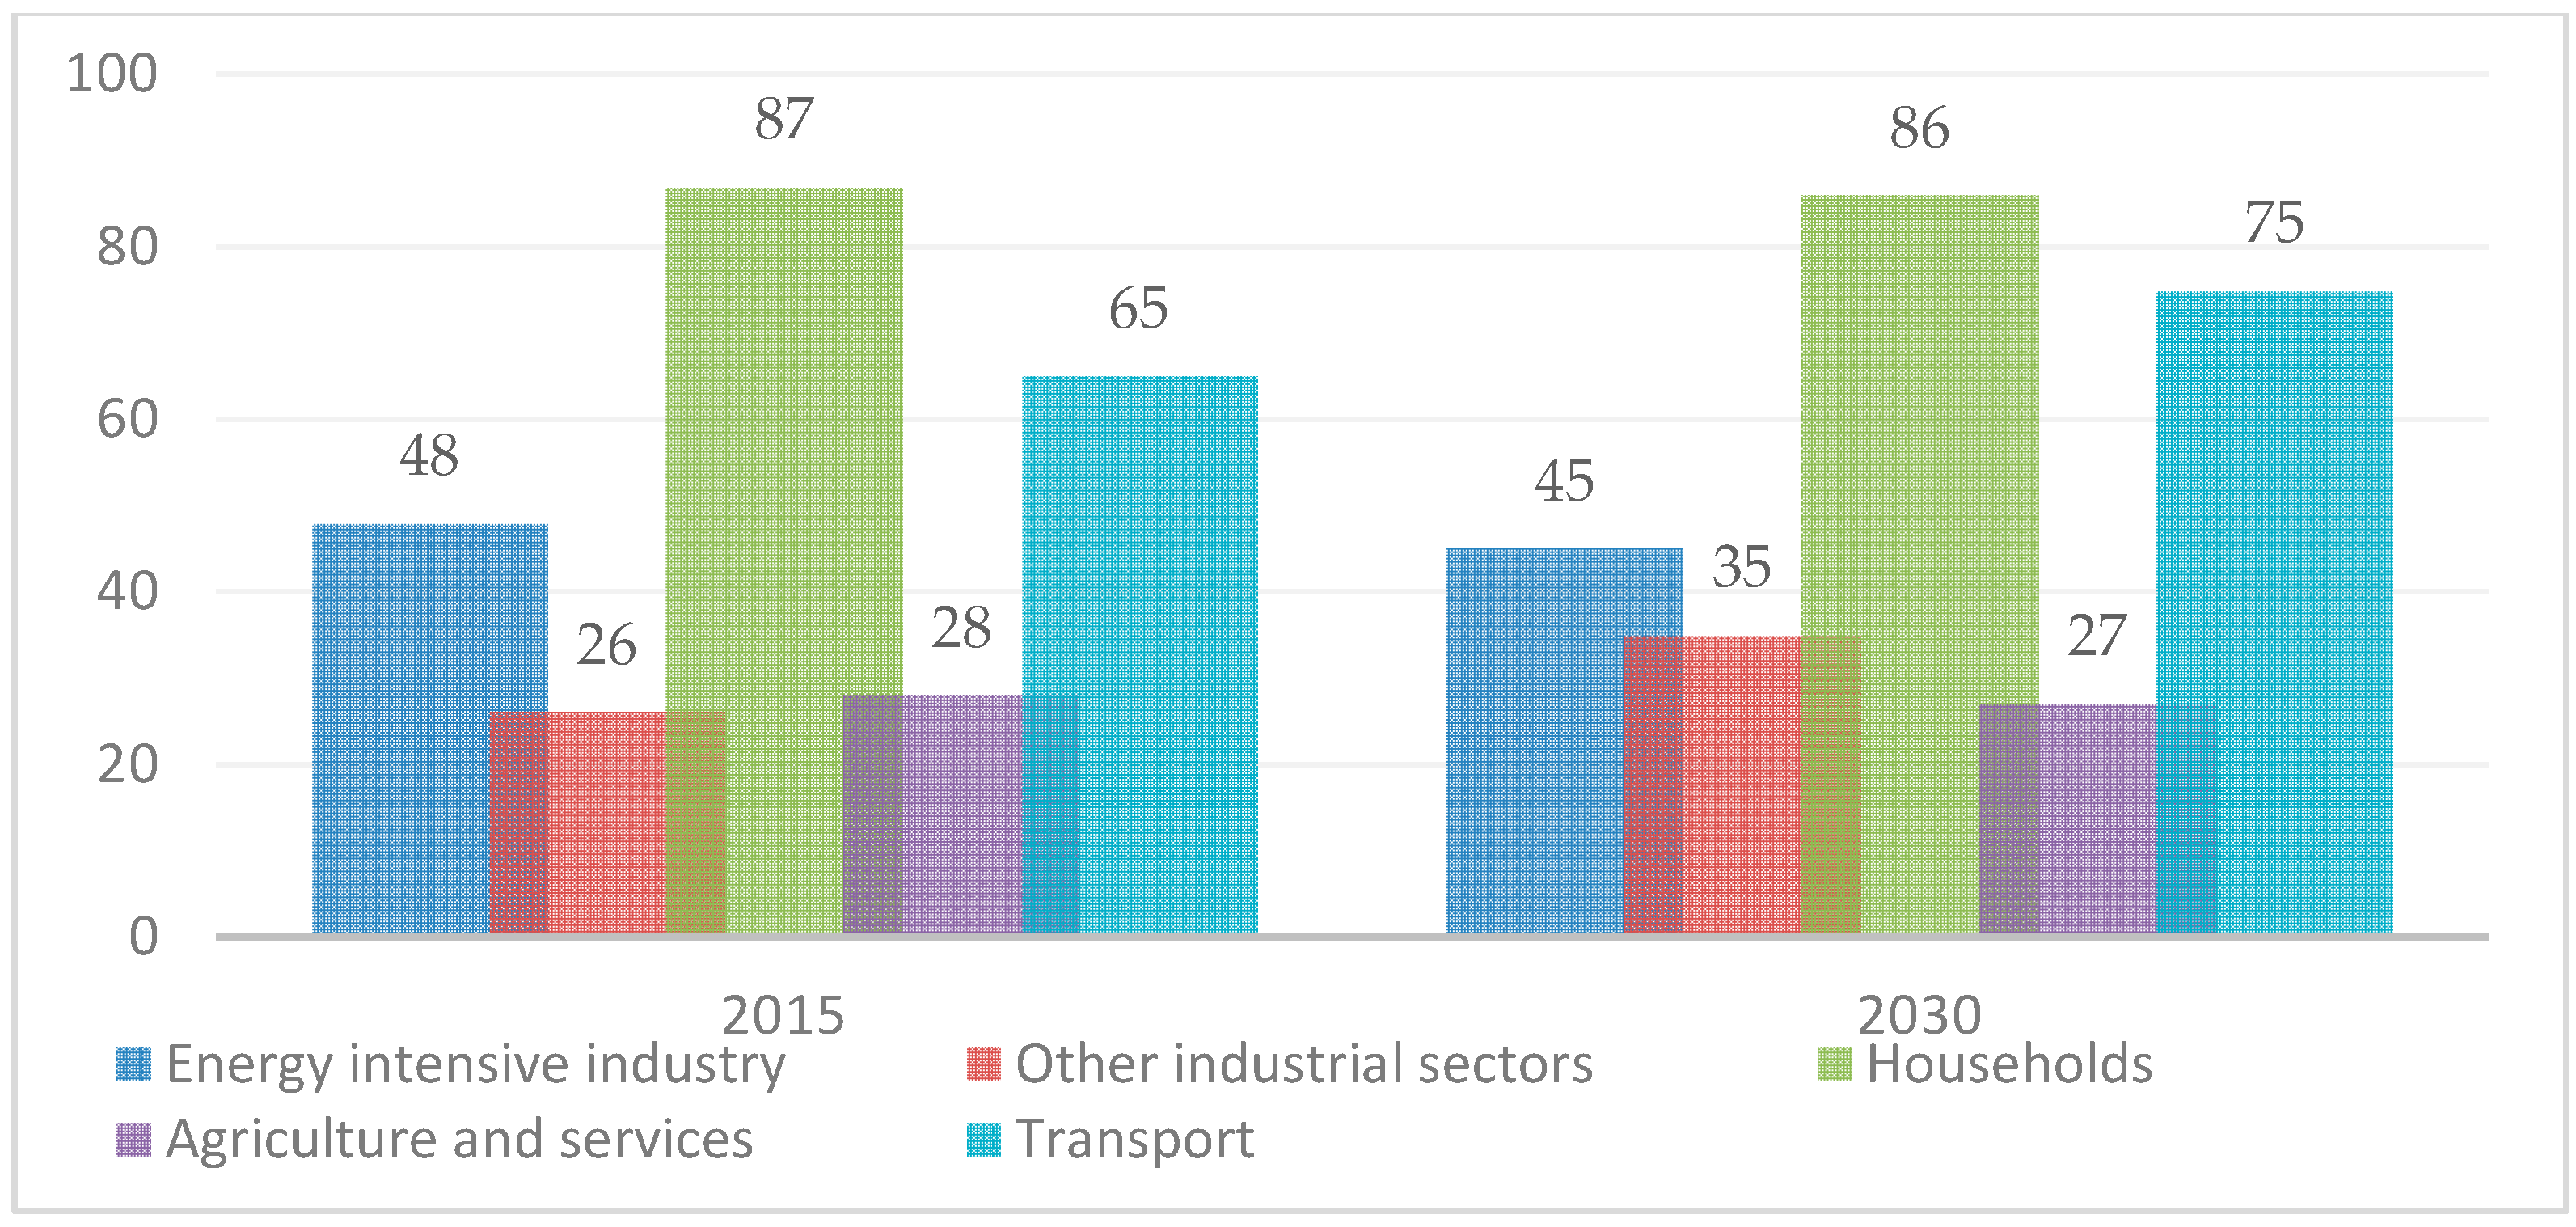
The analysis of final energy consumption in 2015 (total 254 TWh) by type of energy consumption brings to the fore the heating and cooling needs, estimated at 97 TWh (39%)—of which 76 TWh in households and 21 TWh in the services sector (
Figure 2). The consumption in industrial processes (48 TWh) and in passenger transport (48 TWh) are the next ranked in descending order. The rest of the industrial energy consumption is 27 TWh of final energy, and the freight transport consumes the equivalent of 17 TWh. Electronic and household appliances, used by households and in services, consumes 13 TWh (of which 10 TWh household consumption). Finally, the specific consumption of the agricultural sector is 4 TWh.
Natural gas, the main energy resource in Romania, had a share of 29% (111 TWh) in the primary energy mix in 2015, followed by crude oil, with a share of 27% (101 TWh) (
Figure 3). A total of 65 TWh of coal (of which 55 TWh of lignite) and 46 TWh as biomass were consumed. Nuclear power corresponds to 35 TWh in the primary energy mix and 26 TWh comes from RES to produce electricity (hydro, wind, and photovoltaic). The difference between gross energy consumption and the primary energy mix is given by the net export of electricity, which cannot be allocated by the type of resource.
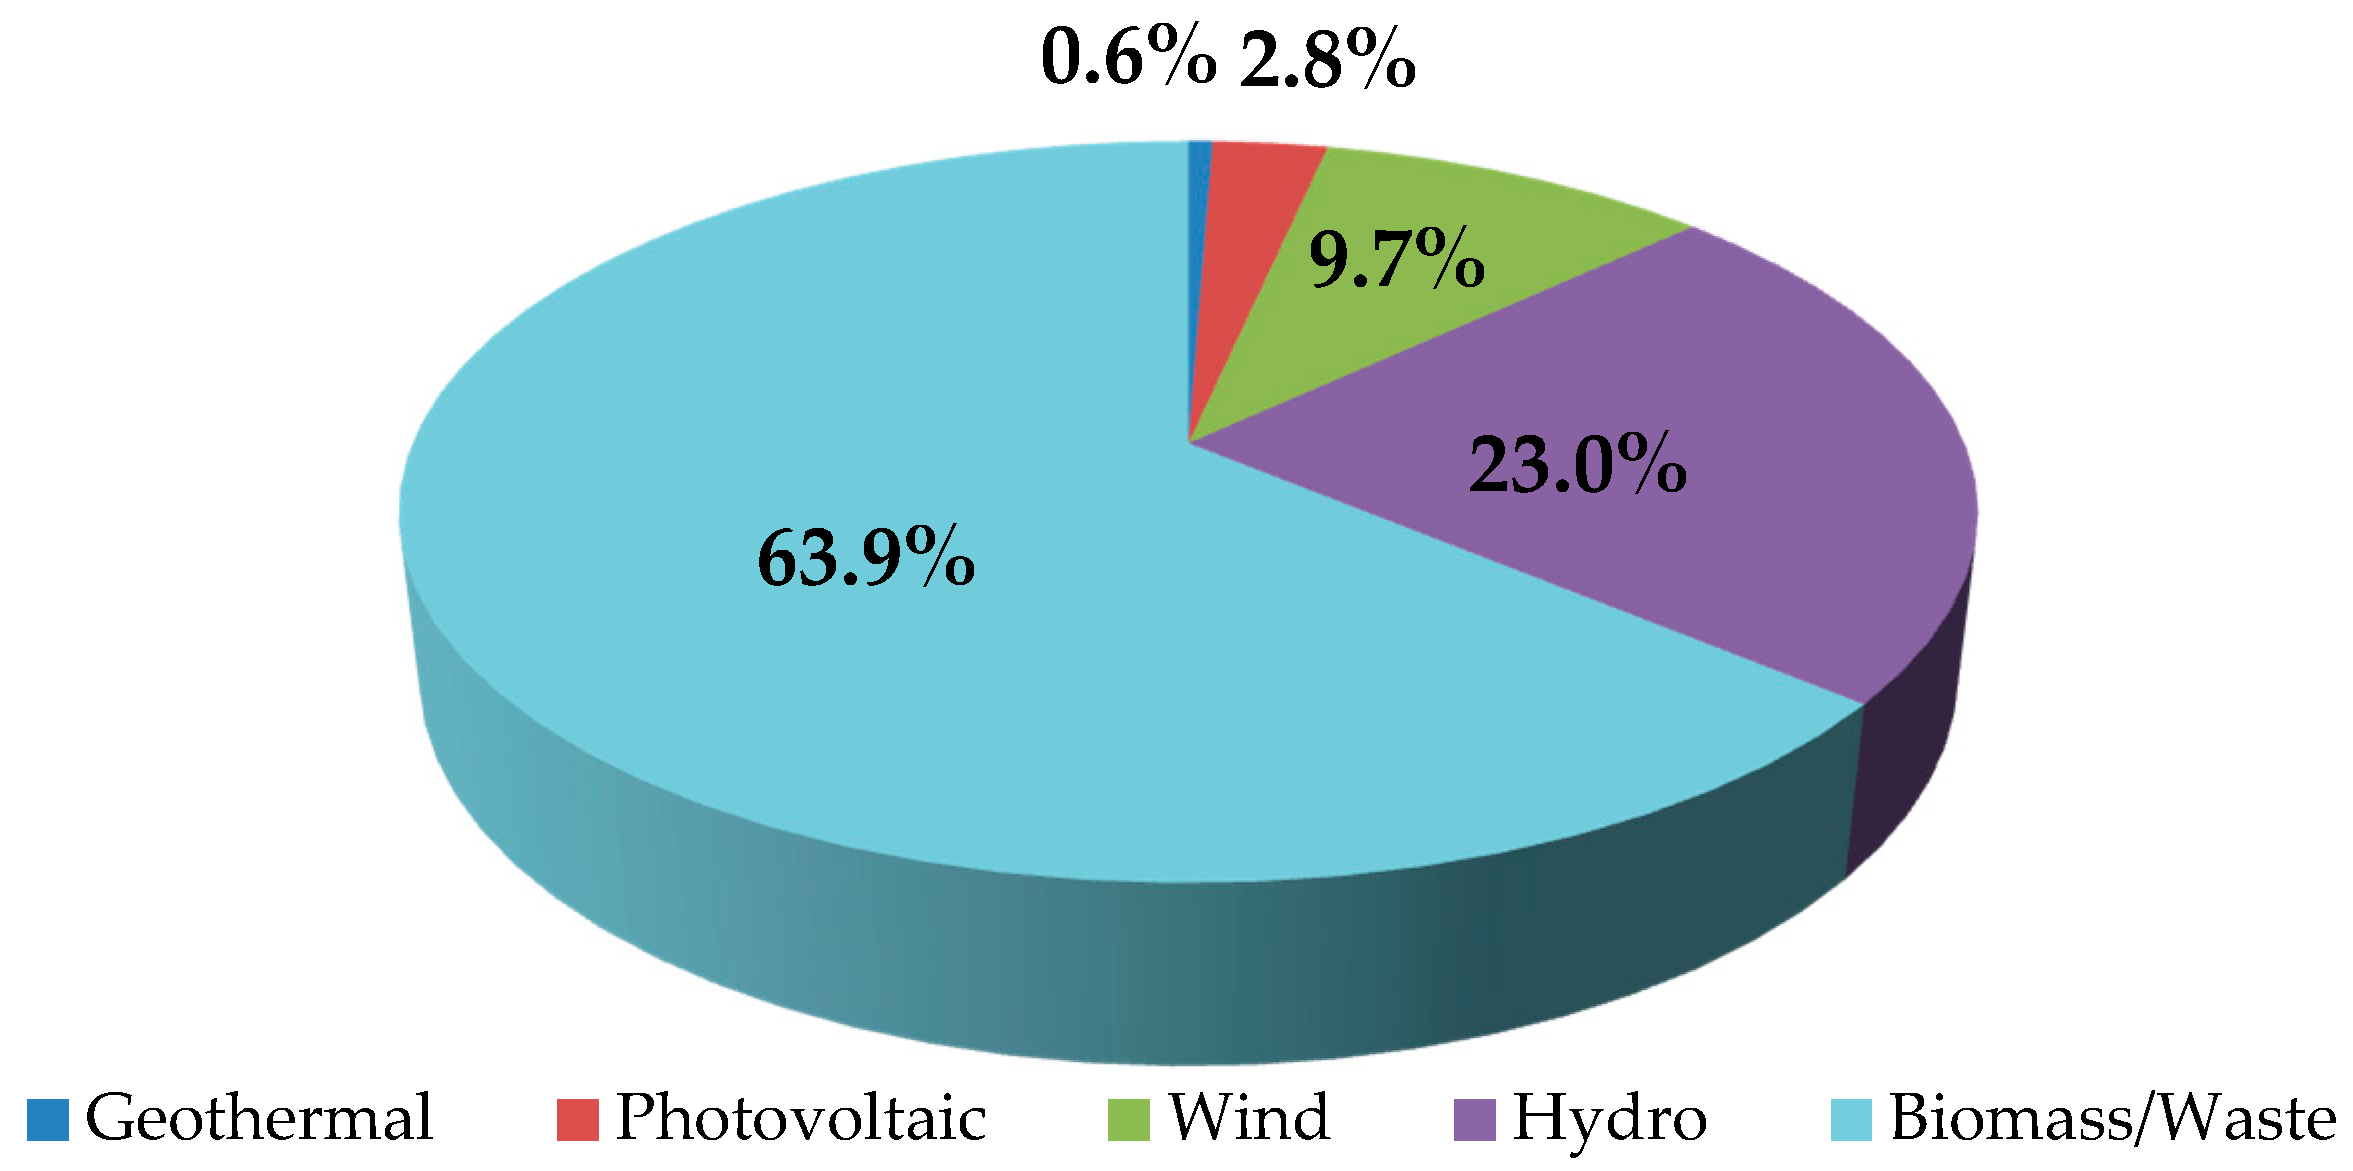
As can be observed in
Figure 4, biomass is the most important contributor in the renewable energy mix in 2015, with a share of 63.9%. Almost one third of renewable energy is provided by hydropower, a sector which can be extended in the future, due to the fact that there are unfinished investments in this sector that were started before 1989.
The latest Eurostat data (2016) shows that the final energy price in Romania is considerably below the European average for both natural gas and electricity. On electricity, Romania had the sixth lowest EU average household price of 132 €/MWh, Bulgaria (96 €/MWh), Lithuania, the Czech Republic, Estonia, and Croatia (131 €/MWh). For industrial consumption, Romania had the third lowest electricity price of 80 €/MWh, after Bulgaria and the Czech Republic (78 €/MWh), followed by Croatia (93 €/MWh) and Estonia (96 €/MWh).
3. Main Renewable Energy Indicators Evolution
The selected indicators were analyzed in comparison with other six EU member countries to obtain a more significant overview. The countries selected for the study were: Bulgaria, Czech Republic, Hungary, Poland, Slovenia, and Slovakia. All these states are former communist countries in different stages of economic development.
One of the most important indicators in the field of renewable energy is Renewable Energy Country Attractiveness Index (RECAI). The RECAI ranks 40 countries on the attractiveness of their renewable energy investment and deployment opportunities [
21]. In the same time, RECAI has established itself as an industry standard and is widely regarded as providing leading market commentary, analysis, and insights on the global renewable energy sector [
22]. Analyzing this indicator (
Table 1), it can be observed that Romania has an average attractiveness regarding renewable energy.
To have an overview of the renewable energy sector in Romania, we consider that a detailed breakdown of the evolution of the main indicators is necessary. In terms of renewable energy, a series of indicators has been selected for this research, including:
Renewable energies—primary production;
Share of renewables in electricity production;
Renewable electricity output;
Renewable electricity share of total electricity output; and
Renewable energy consumption;
3.1. Renewable Energies—Primary Production
According to Eurostat, in renewable energy primary production are included all types of green energy: wind, hydro, photovoltaic, bioenergy, and geothermal. At the EU level, renewable energy primary production is constantly increasing with an average of 5%. The greatest increase can be noted in 2012 and 2011 was the only year when this indicator decreases.
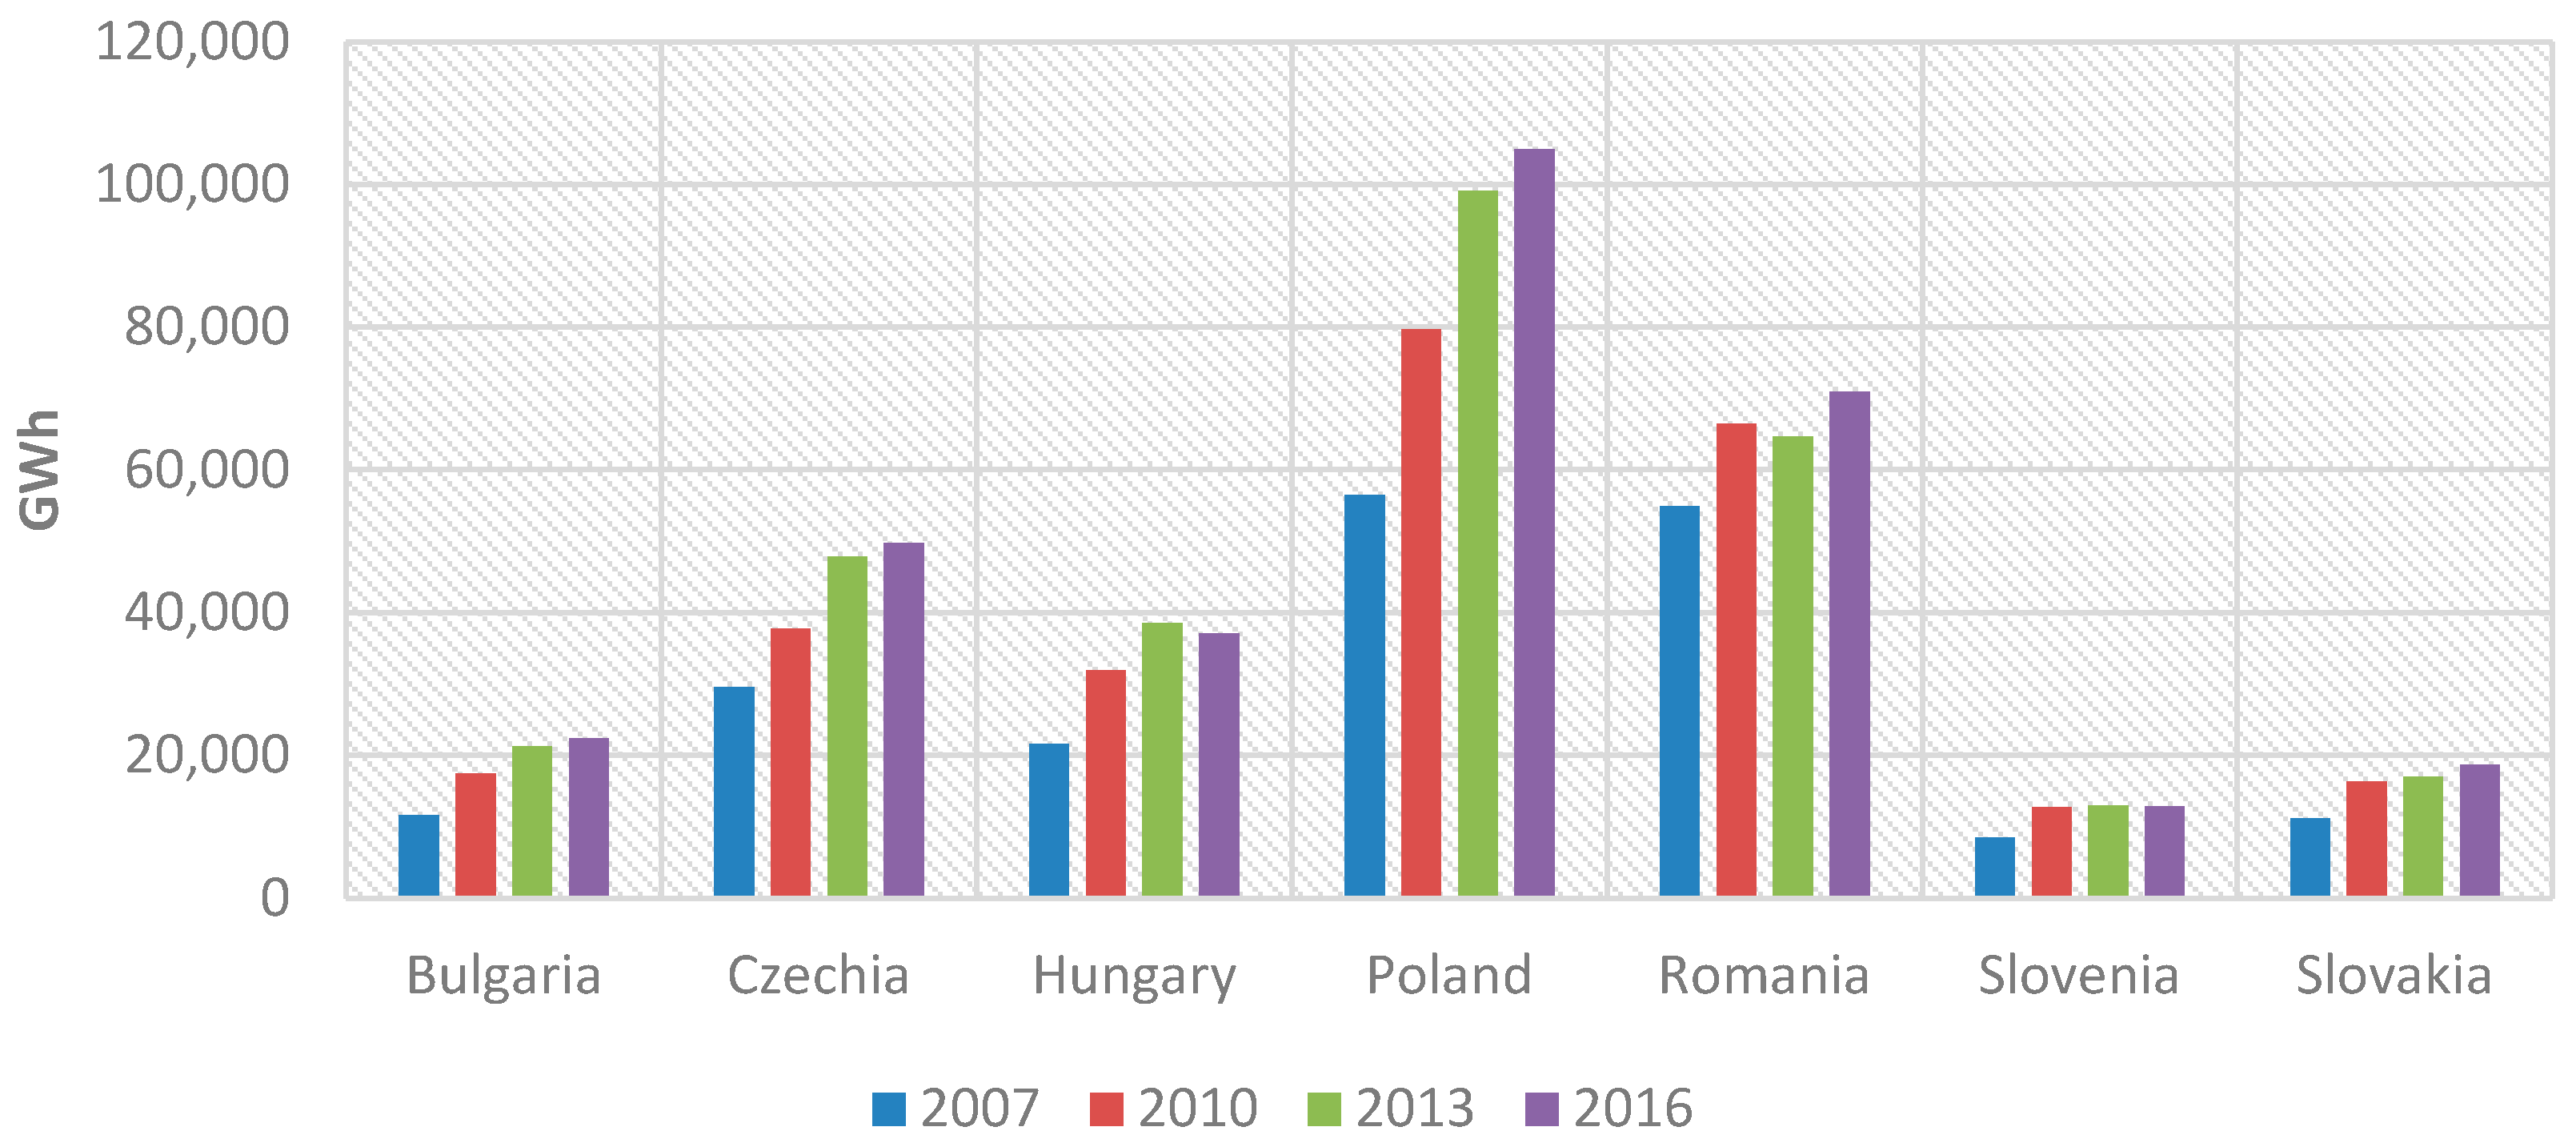
As can be seen in
Figure 5, renewable energy primary production is increasing in the case of Romania. Due to this fact, in Romania it was possible to achieve the EU targets in terms of share of renewable since 2015. At the level of primary production from all products a constant decline starting with 2012 can be mentioned.
At the same time, it can be noticed that, compared to the other EU Member States, Romania ranks second in terms of renewable energy primary production. Along with Poland, which ranks first in relation to this indicator, Romania is at a considerable distance from other former communist EU members.
3.2. Share of Renewables in Electricity Production
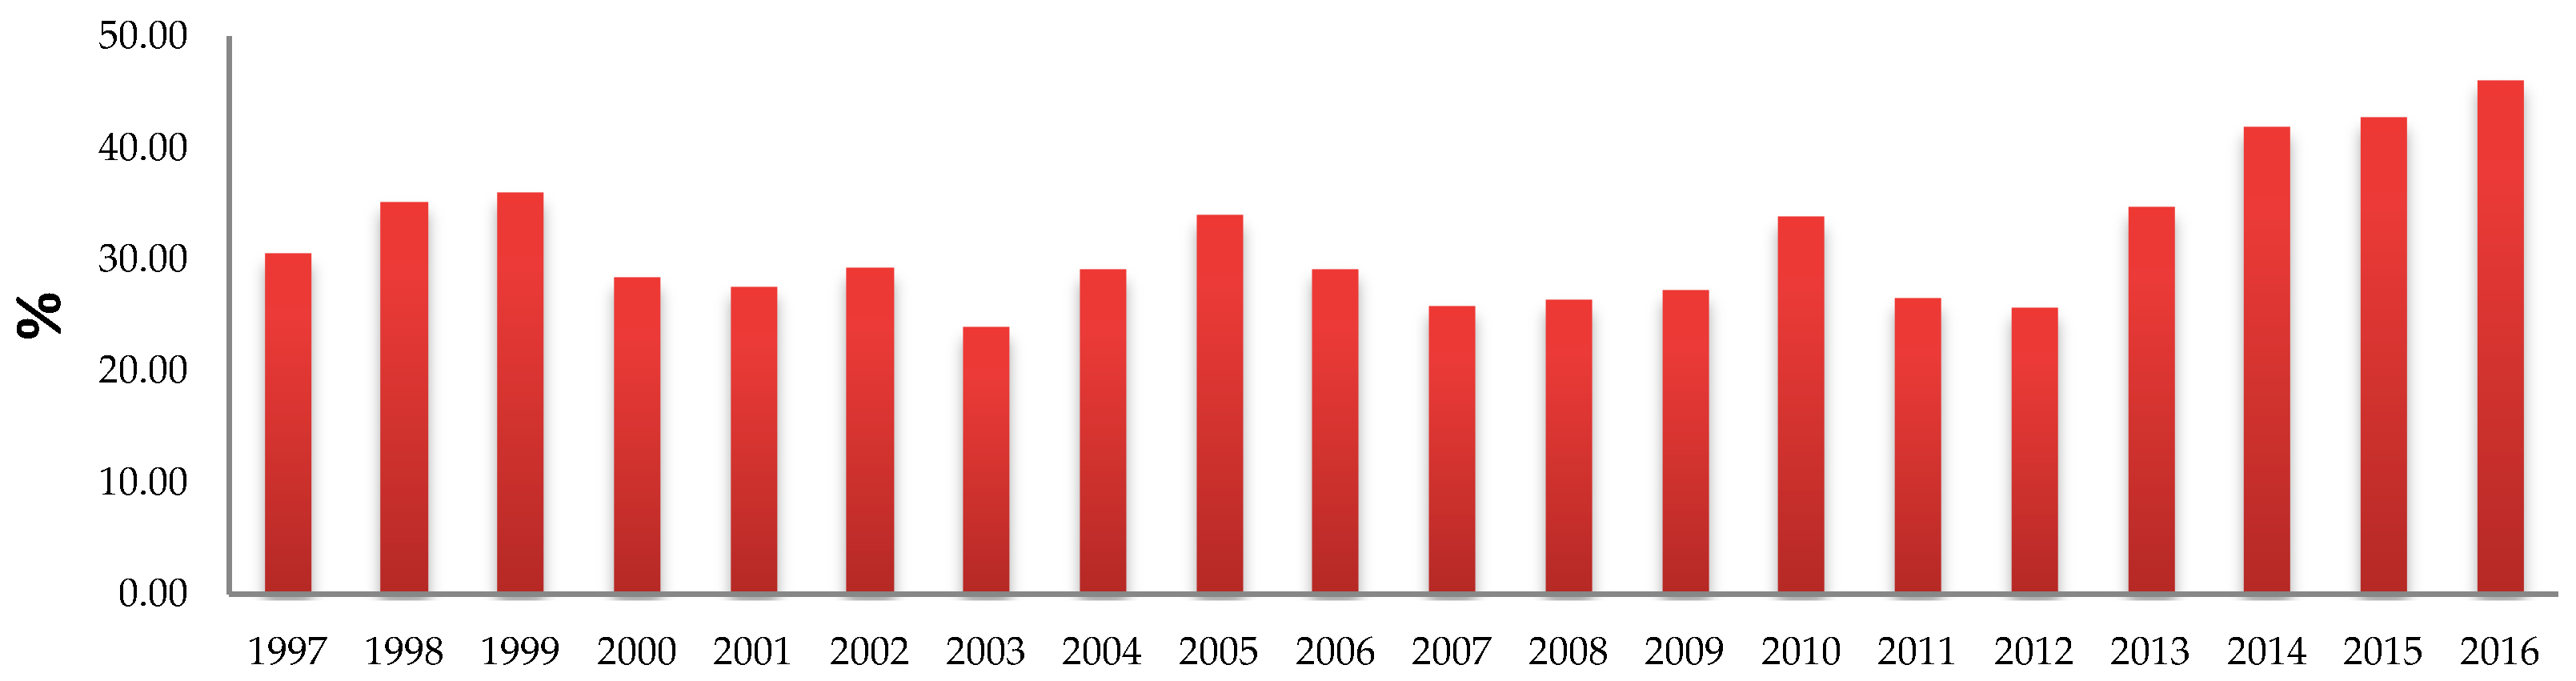
The share of renewable energy sources (
Figure 6) within the global power generation mix has been growing quickly since the end of the 2000s [
23].
Between 2000 and 2016, the share of renewable energy registered an annual growth of 1.6% worldwide. The European Union recorded a 4.6% increase per year, which overtakes the increase by 3.4%, reached by Europe as a continent.
Romania did not exceed the EU average, having a 3.1%/year increase between 2000 and 2016. Analyzing the share of renewables in electricity production between 2015 and 2016, for Romania, it a 7.8% increase can be observed. This value is 4.5% over the worldwide level, and 1.7% over the European Union level, which indicates a significant involvement in renewable energy. At Romania’s level, the fast expansion that took place at the EU level between 2006 and 2014 continues, even though at the Union level the penetration of RES in the European Union power mix has been increasing more slowly since then.
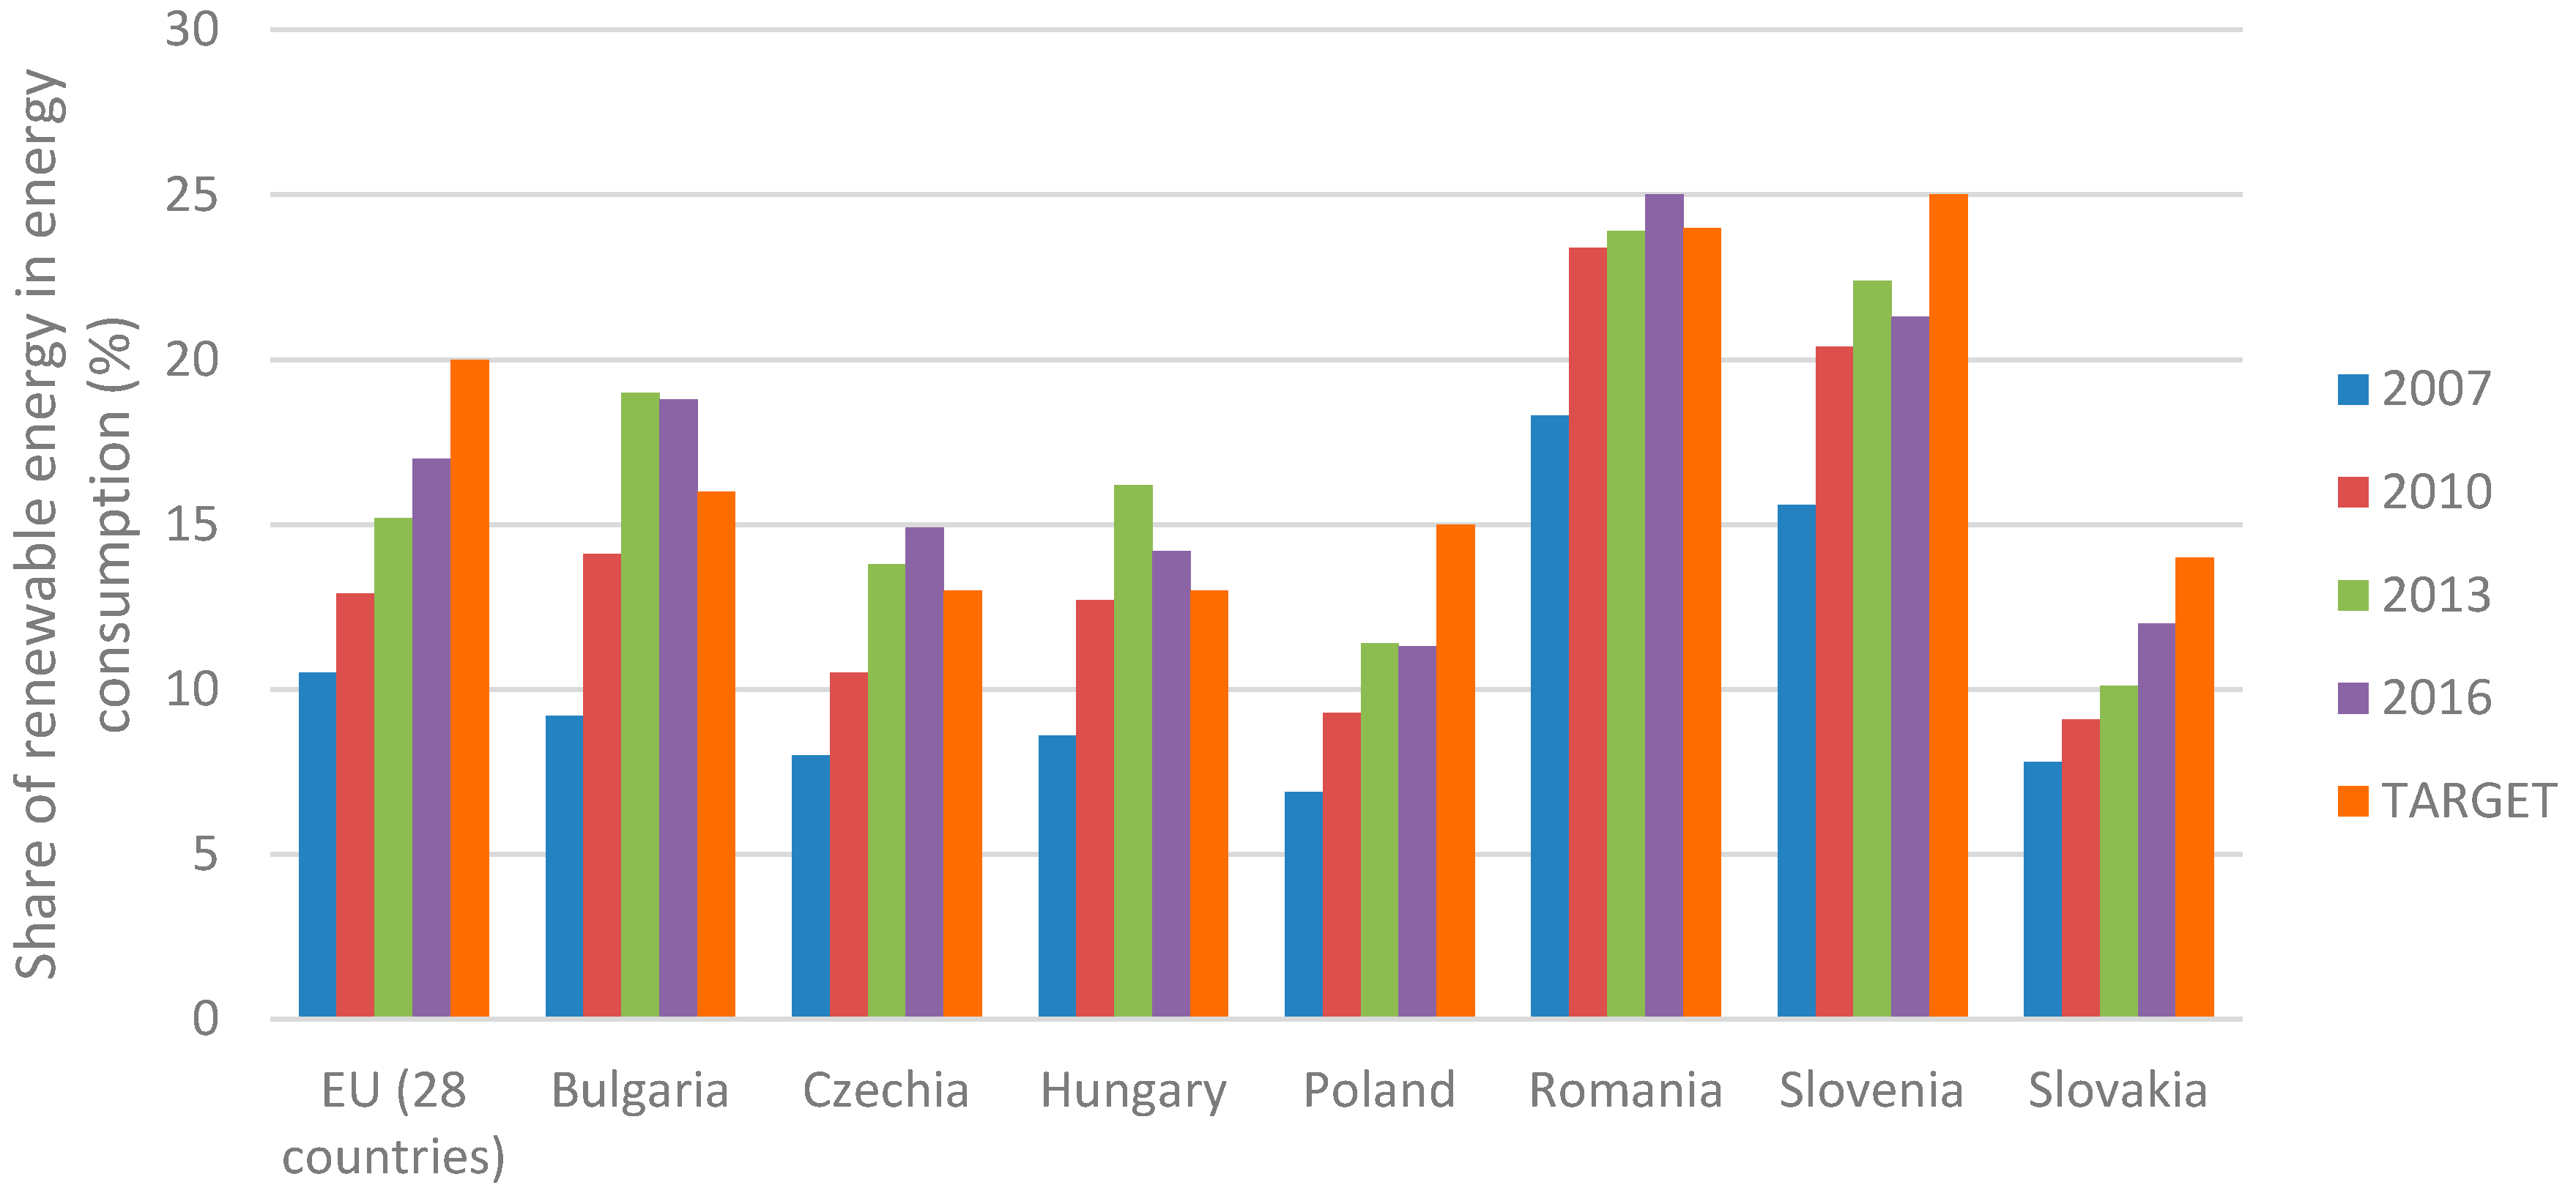
As can be observed in
Figure 7, at the EU level, that the share of renewable energy in energy consumption is on an ascending trend. There are countries like Romania, Hungary, or Bulgaria that achieved the target share for 2020. It is expected that all the countries of the EU will achieve this limit by the end of the current decade.
3.3. Renewable Electricity Output and Renewable Electricity Share of Total Electricity
Renewable electricity is the quantity of electricity generated by renewable power plants in total electricity generated by all types of plants. In the renewable power plants are included energy generation factories that use renewable resources, including wind, solar PV, solar thermal, hydro, marine, geothermal, solid biofuels, renewable municipal waste, liquid biofuels, and biogas. Electricity production from hydro pumped storage is excluded [
24]. The renewable electricity share of total electricity output (%) represents electricity generated by power plants using renewable resources as a share of total electricity output [
24].
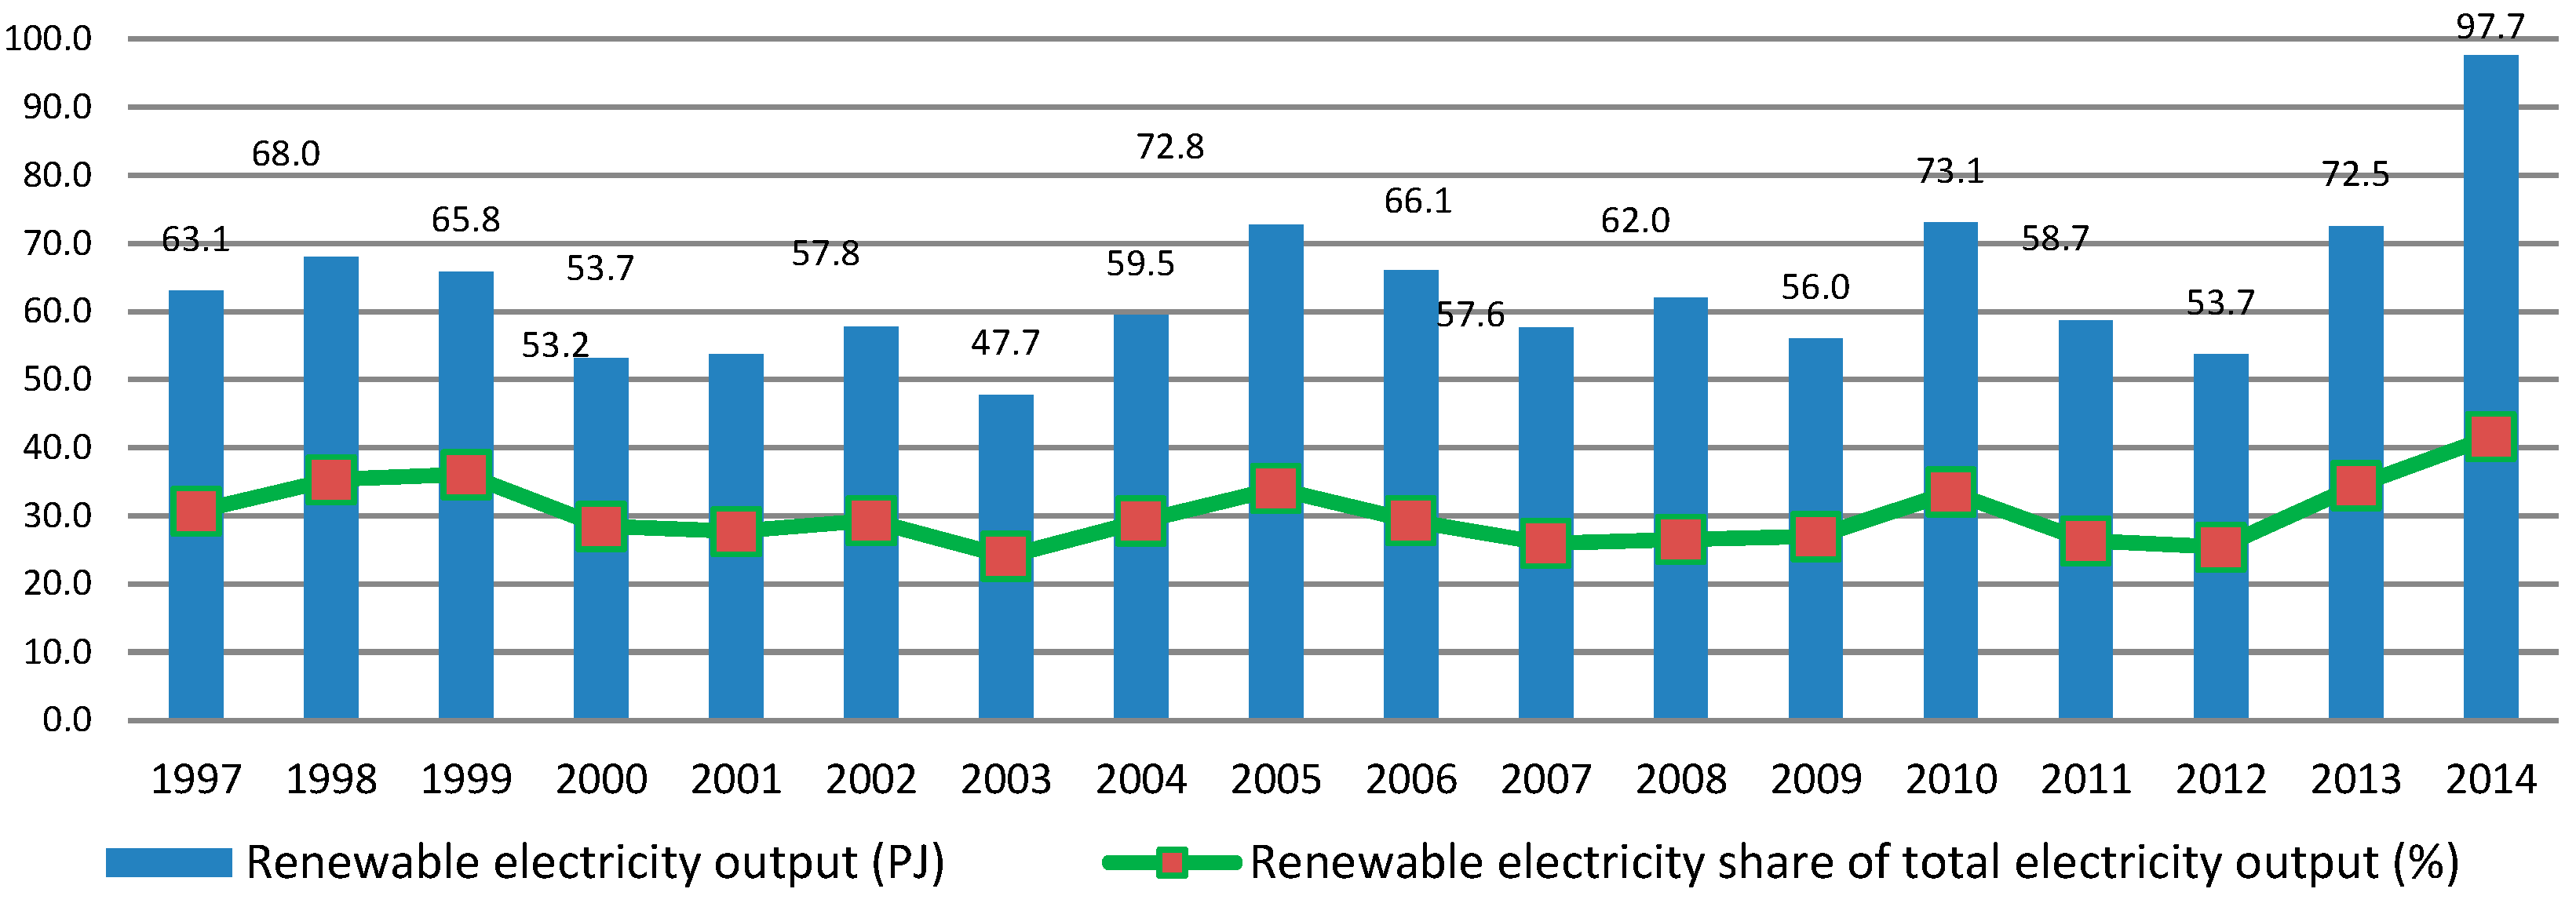
Romania has increased its renewable energy output by 55% in the studied period, 1997–2014. The minimum output was in 2003, with a value of 47.7 PJ caused by political tensions, economic stagnation and the aging or high wear of production capacities (
Figure 8). From the perspective of the renewable electricity share with respect to total electricity output a fluctuating trend can be highlighted. The lowest point was also in 2003, 24%, when the renewable electricity share was affected by the same causes as renewable energy output. At the level of 2014, the renewable electricity share was 41.6% of total electricity output, with an ascending perspective for this indicator.
3.4. Renewable Energy Consumption
Renewable energy consumption is the share of renewable energy in total final energy consumption. The first study, belonging to Kraft and Kraft [
25], which investigates the relationship between energy consumption and economic growth, started a segment that has been extensively researched. Apergis and Payne indicate that energy consumption is positively associated with economic growth [
26]. Contrariwise, in an empirical research for 27 European countries, empirical results do not confirm causality between renewable energy consumption and gross domestic product (GDP) [
27].
Energy consumption was a special issue researched during the time. A significant number of articles investigate the causal nexuses between CO
2 emissions, economic growth and energy consumption [
27,
28,
29,
30]. Bhattacharya et al. investigate the effects of renewable energy consumption on the economic growth of major renewable energy consuming countries in the world [
28]. In the same time, Saidi et al. investigate the impact of economic growth and CO
2 emissions on energy consumption for a global panel of 58 countries [
30].
Renewable energy consumption is the ratio between the gross inland consumption of energy from renewable sources and the total (primary) gross inland energy consumption calculated for a calendar year [
31]. The share of energy consumption from renewable energy provides a broad indication of progress towards reducing the environmental impact of energy consumption.
As presented in
Figure 9, Romania recorded a fluctuating trend in terms of renewable energy consumption. In the period 1997–2003, Romania was situated below the worldwide average. Starting with the year 2007, Romania beat year after year the world average. The year 2007 had a special significance for this country: it was the year of Romania’s accession to the EU. For the studied period, 1997–2014, Romania’s renewable energy consumption was above the EU average.
Even if, in 2011, this indicator experienced a slight decrease (from 24.1% in 2010 to 21.1% in 2011) due to the global crisis, after 2012 its trajectory has continually improved. In 2014 the maximum value of renewable energy consumption was reached for the studied period.
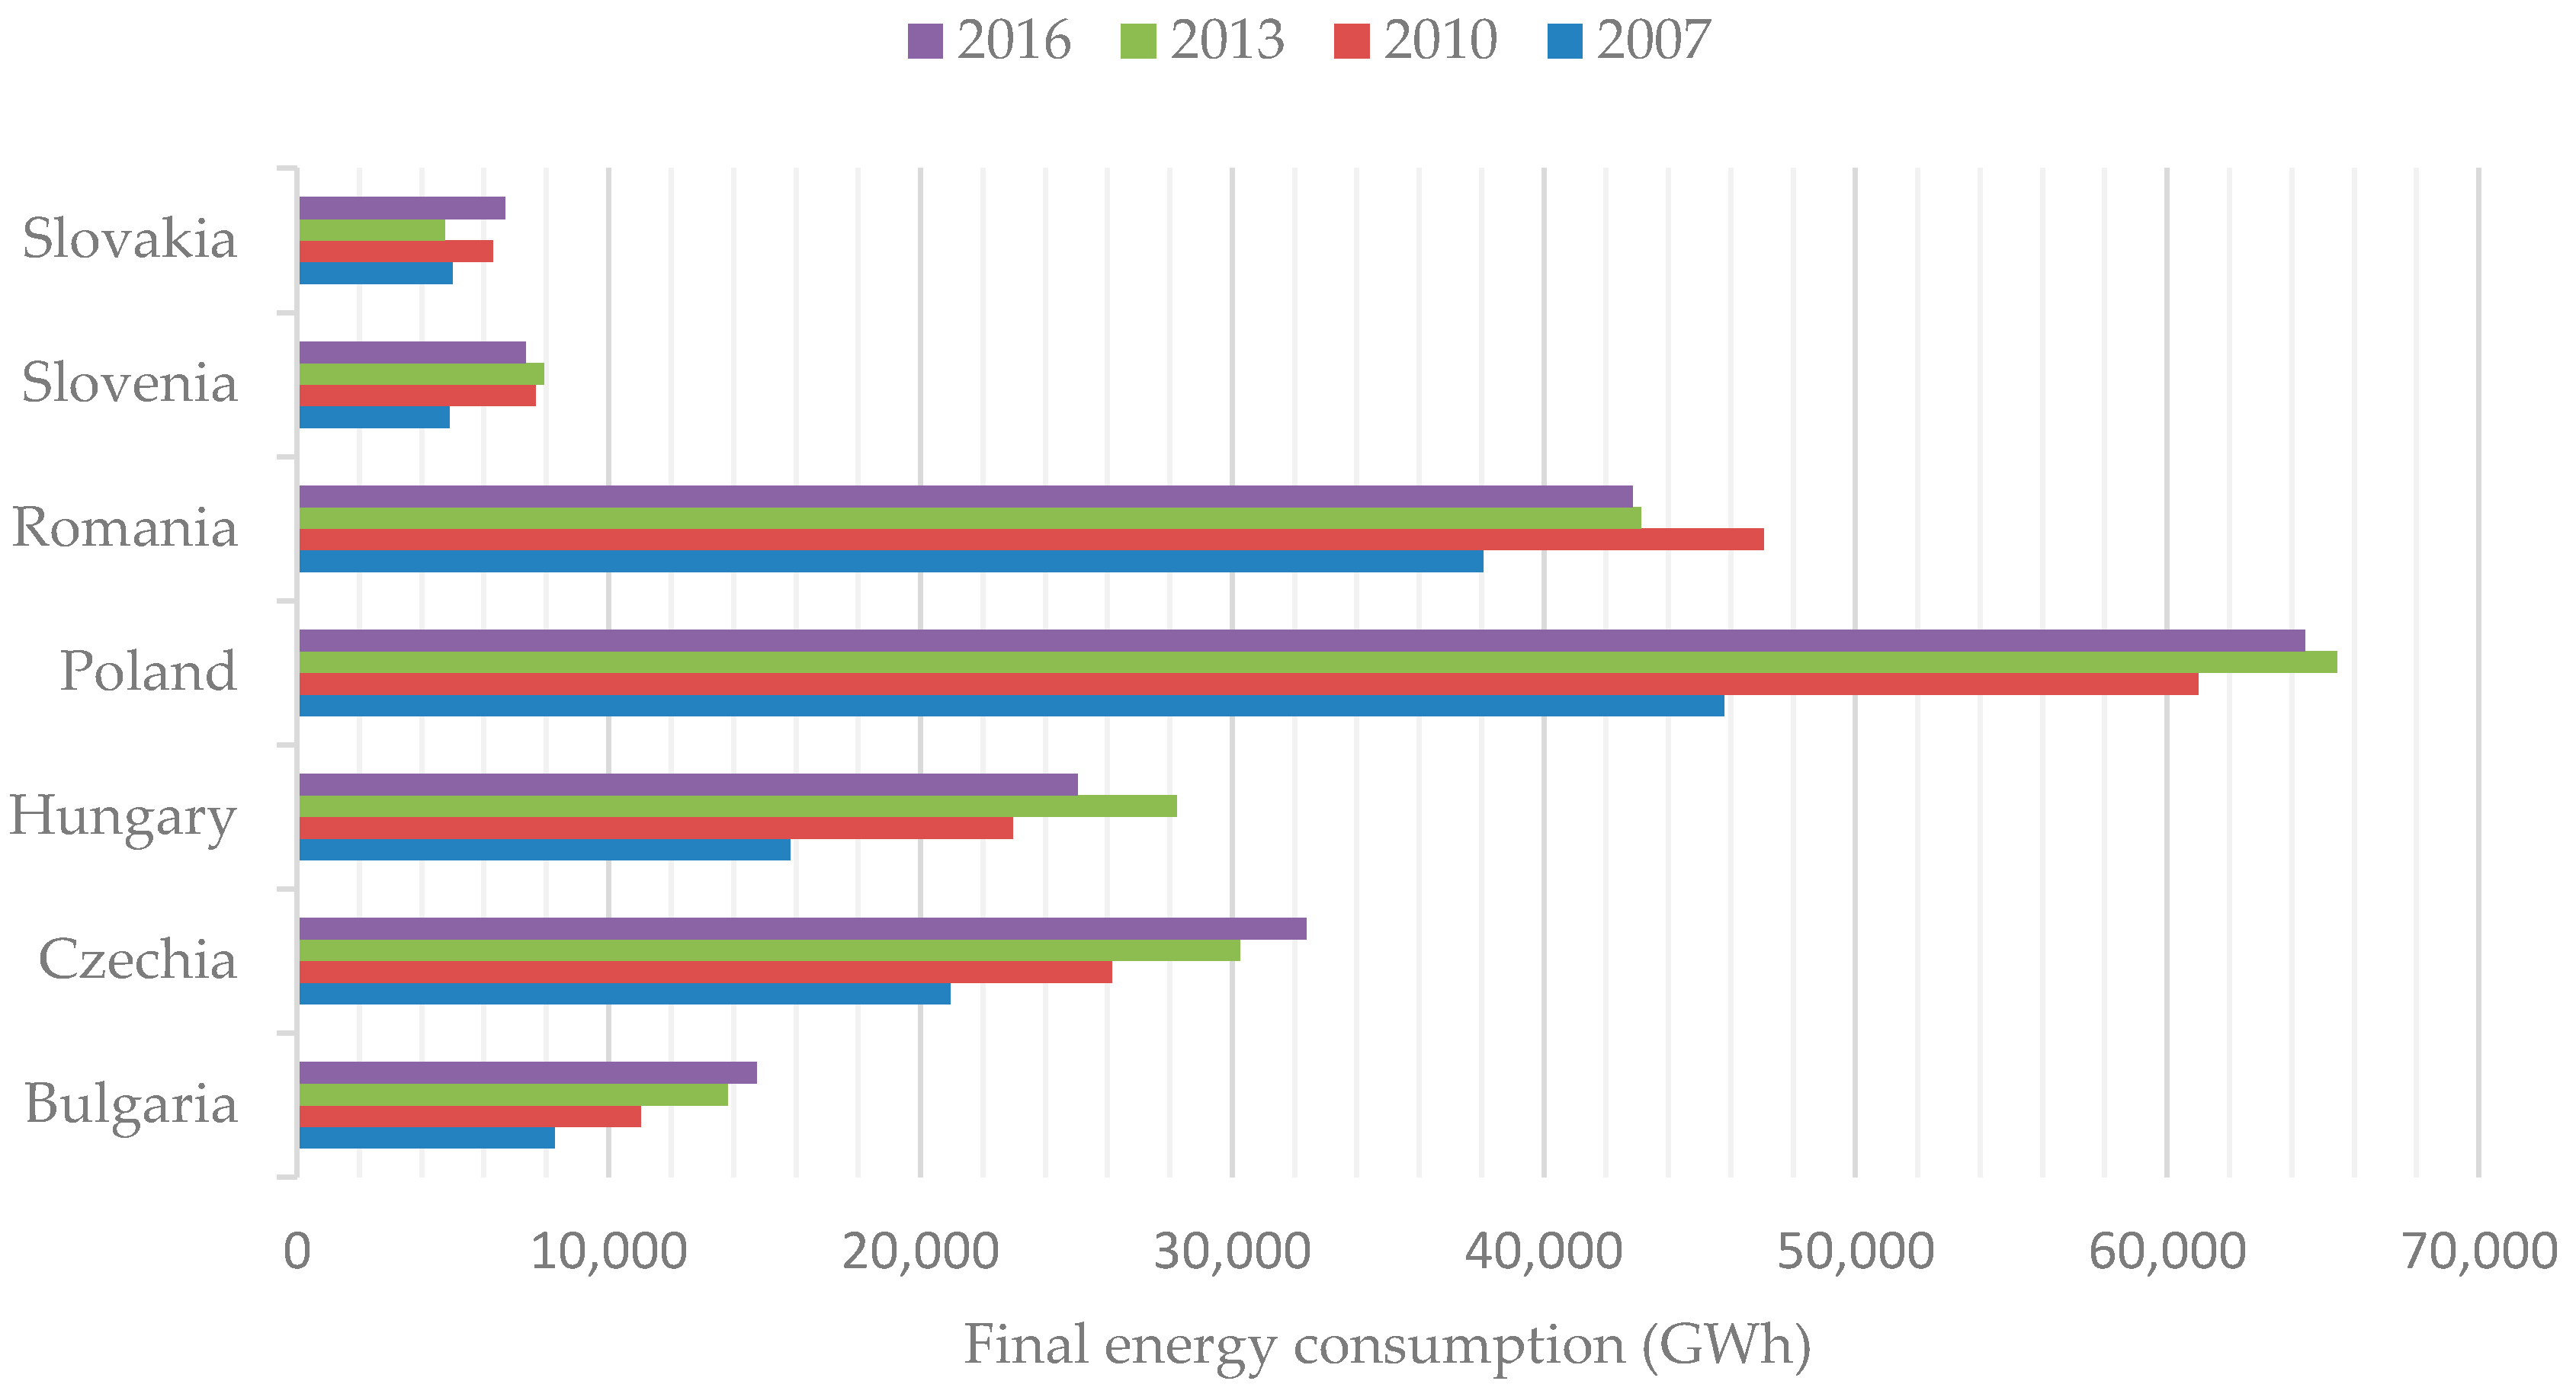
In
Figure 10, can be highlighted that Romania records the second-best final energy consumption after Poland. In almost all analyzed indicators, Romania ranks second, in terms of renewable energy among former communist countries. It can be outlined that this country tries to strengthen its performance not only in the energy sector, but also regarding its economic growth and environmental performance.
3.5. Electrical Capacity
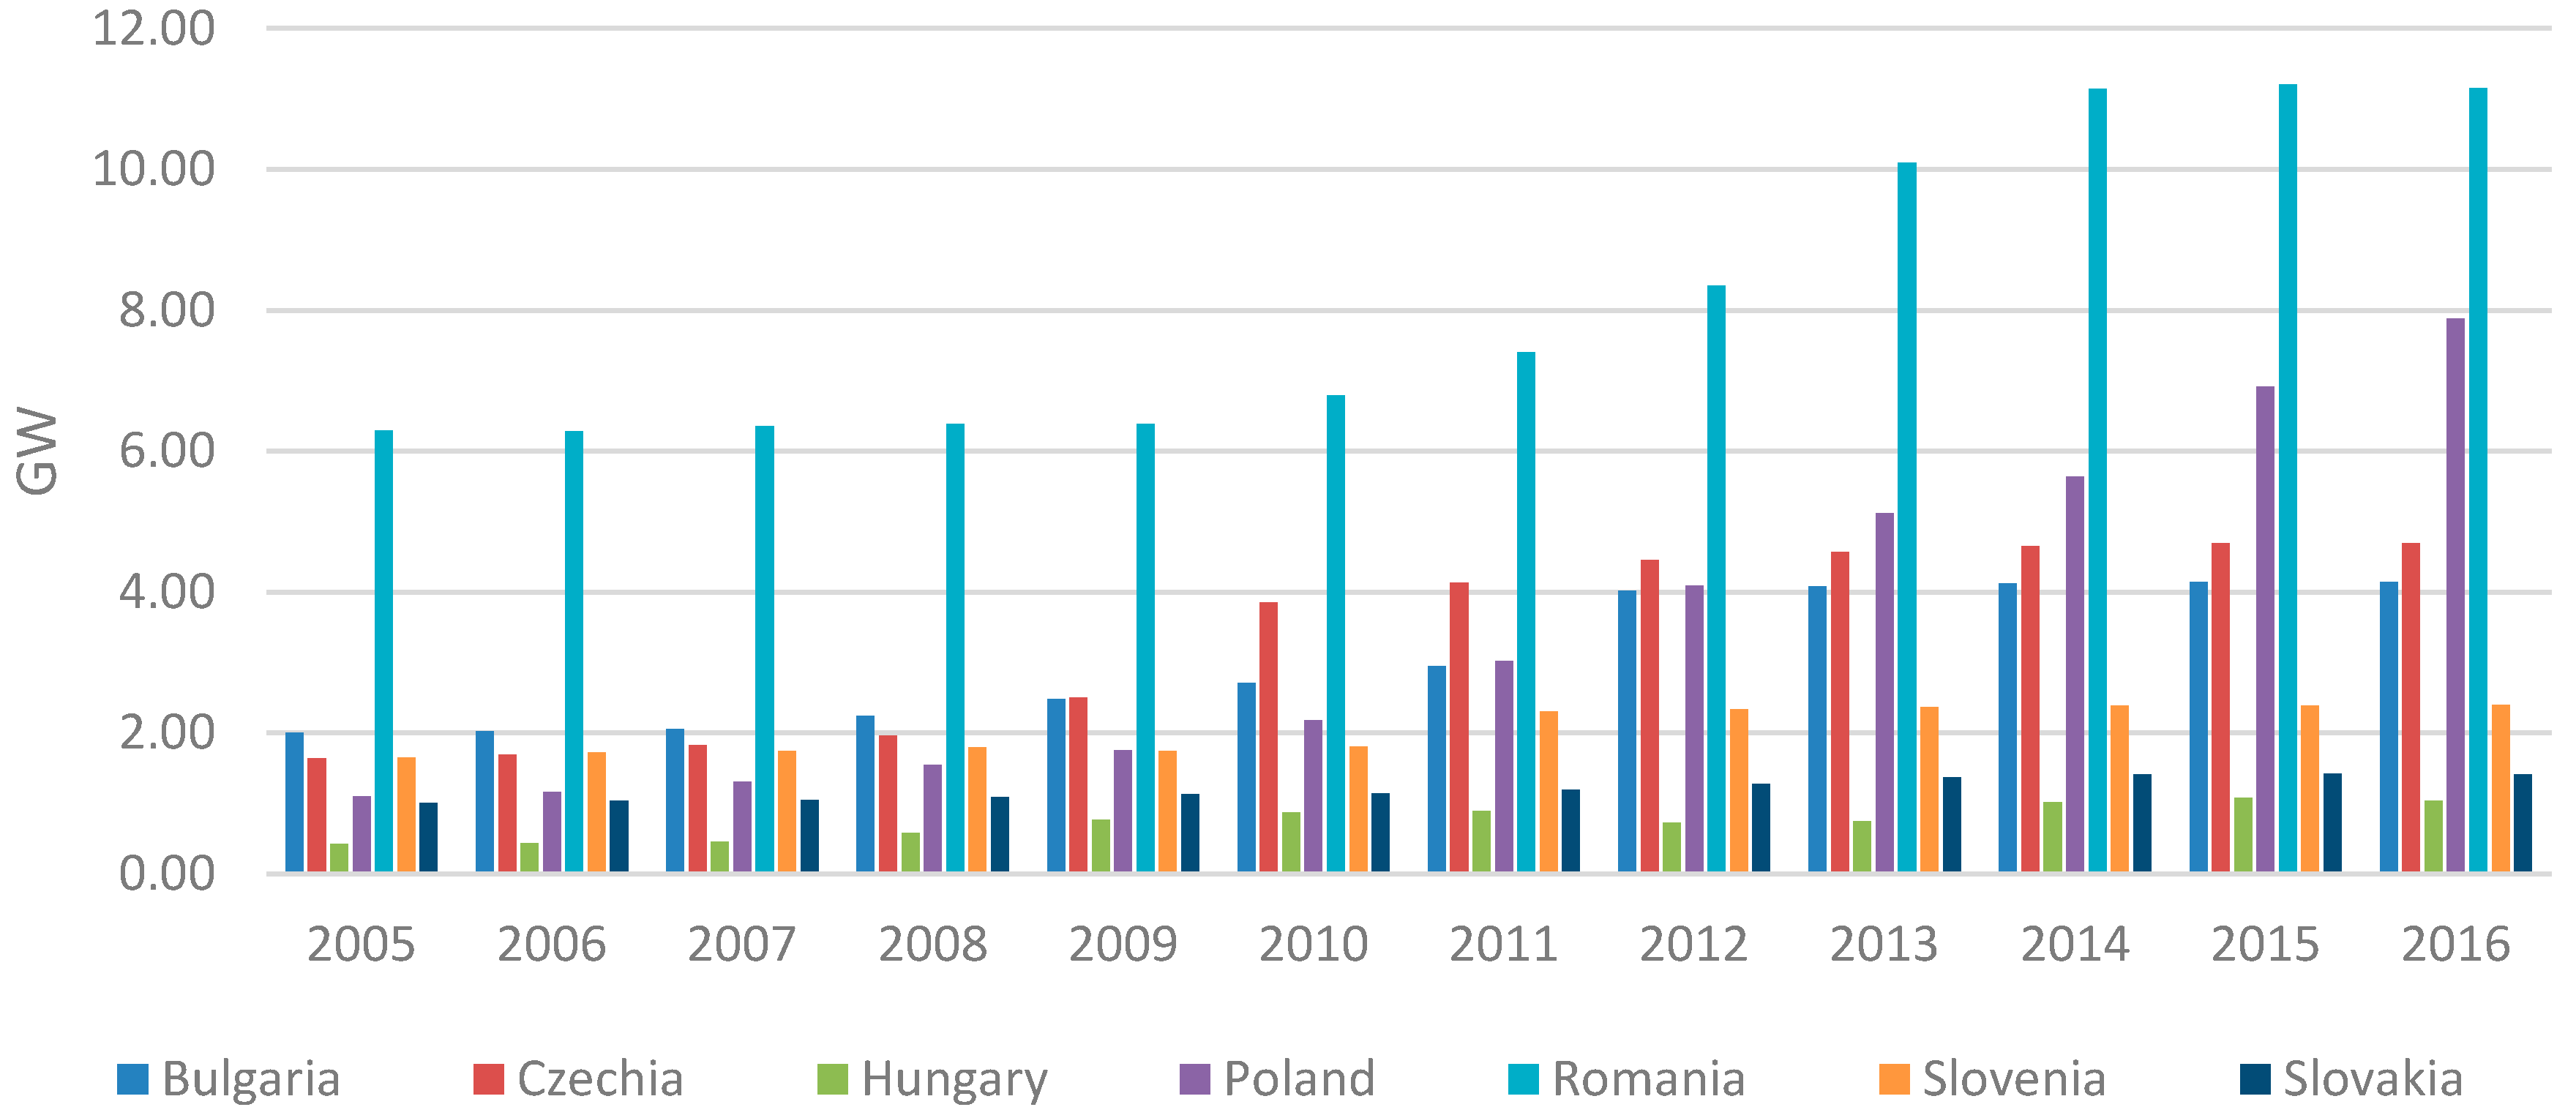
With 11.16 GW installed capacity in 2016, Romania ranks first of the seven EU countries analyzed regarding renewable energy installed capacity (
Figure 11). The weakest installed capacity performance is recorded by Hungary, with only 1.12 GW, in 2016. Compared with 2005 a 622% increase of this indicator is registered by Poland can be observed, especially between 2010 and 2013. It reached 8.11 GW capacity in about 10 years, starting from 1.09 GW in 2005. In the case of Romania, renewable energy installed capacity means almost 46% of the entire installed capacity. It is important to underline that all seven former communist countries made significant progress in terms of renewable energy installed capacity.
4. The Renewable Energy Sources and the Current Situation in Romania
In the European Union, renewables account for 80% of new capacity and wind power becomes the leading source of electricity soon after 2030, due to strong growth both onshore and offshore [
33]. Renewable energy sources are steadily becoming a greater part of the global energy mix [
34]. World energy consumption rises 28% between 2015 and 2040 [
35]. Renewables capture two-thirds of global investment in power plants to 2040 as they become, for many countries, the least-cost source of the new generation [
36].
The development of electricity production from renewable sources led to a decrease in GHG emissions from the electricity generation process. The amount of greenhouse-gas emissions resulting from the production of electricity decreased from 438 g/kWh in 2011 to 326 g/kWh in 2015. The influence of renewable energy in domestic electricity was significant, mainly due to the replacement of polluting fossil-fuel electricity.
Currently, the annual production of energy from renewable resources in Romania is approximately 6550 ktoe (kilotons of oil equivalent). A technical potential of 8000 ktoe remains unexploited, with biomass and biogas representing 47%, solar energy 19%, wind energy 19%, hydropower energy 14%, and geothermal energy 2%.
4.1. Wind
The share of wind power in the EU’s total installed power capacity has increased from 6% in 2005 to 18% in 2017. Having overtaken coal in 2016 as the second largest form of power generation capacity in the EU, wind power is now closely catching up with gas [
33].
Wind energy generated by wind power remains advantageous, as Romania has the highest potential in Southeast Europe in the field of wind energy, and Southeast Dobrogea is ranked second in the continent. Wind turbines use a perpetual renewable energy that is never consumed and start from a wind speed of only 3.5 m/s. In Dobrogea the speed is 7 m/s at a height of 100 meters.
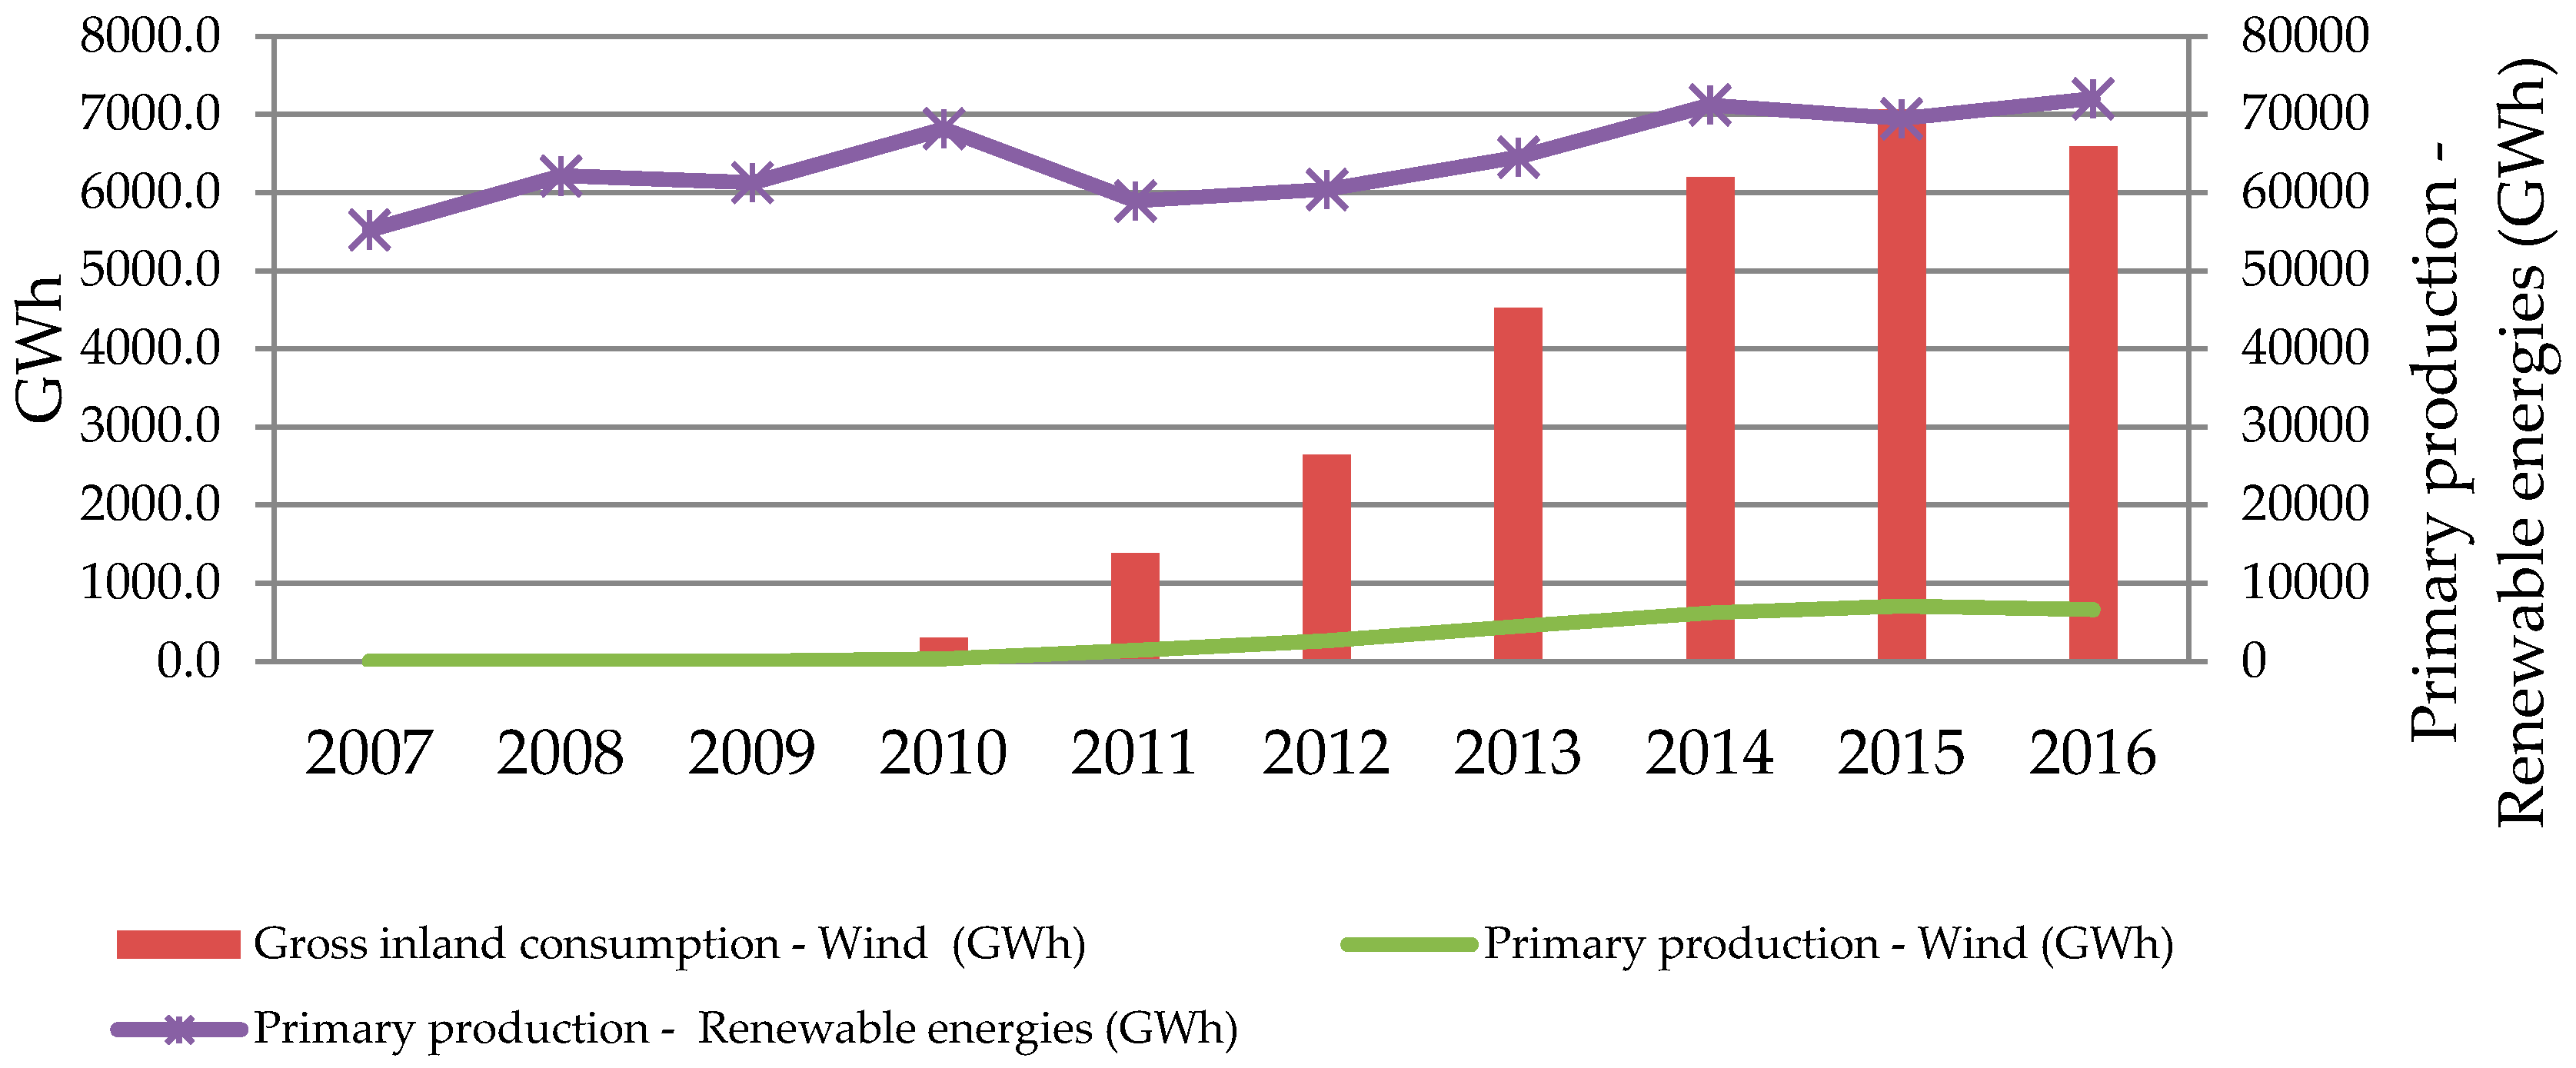
As can be observed in
Figure 12, starting with 2007, Romania began to produce wind-based energy. The primary production recorded a slight increase every year. If in 2007 primary production was only 0.3 toe, in 2016 the primary production reached 566 toe. The greatest increase was registered in 2010 and it consists of an enlarging capacity with 3188% compared with 2009. The average increase of primary production in wind energy was 431% between 2007 and 2016. This trend was in accordance with the increase at the level of all renewable energy sources. In 2016, a slight decrease of 7% in wind primary production can be highlighted. Simultaneously, wind gross inland production followed the same trend.
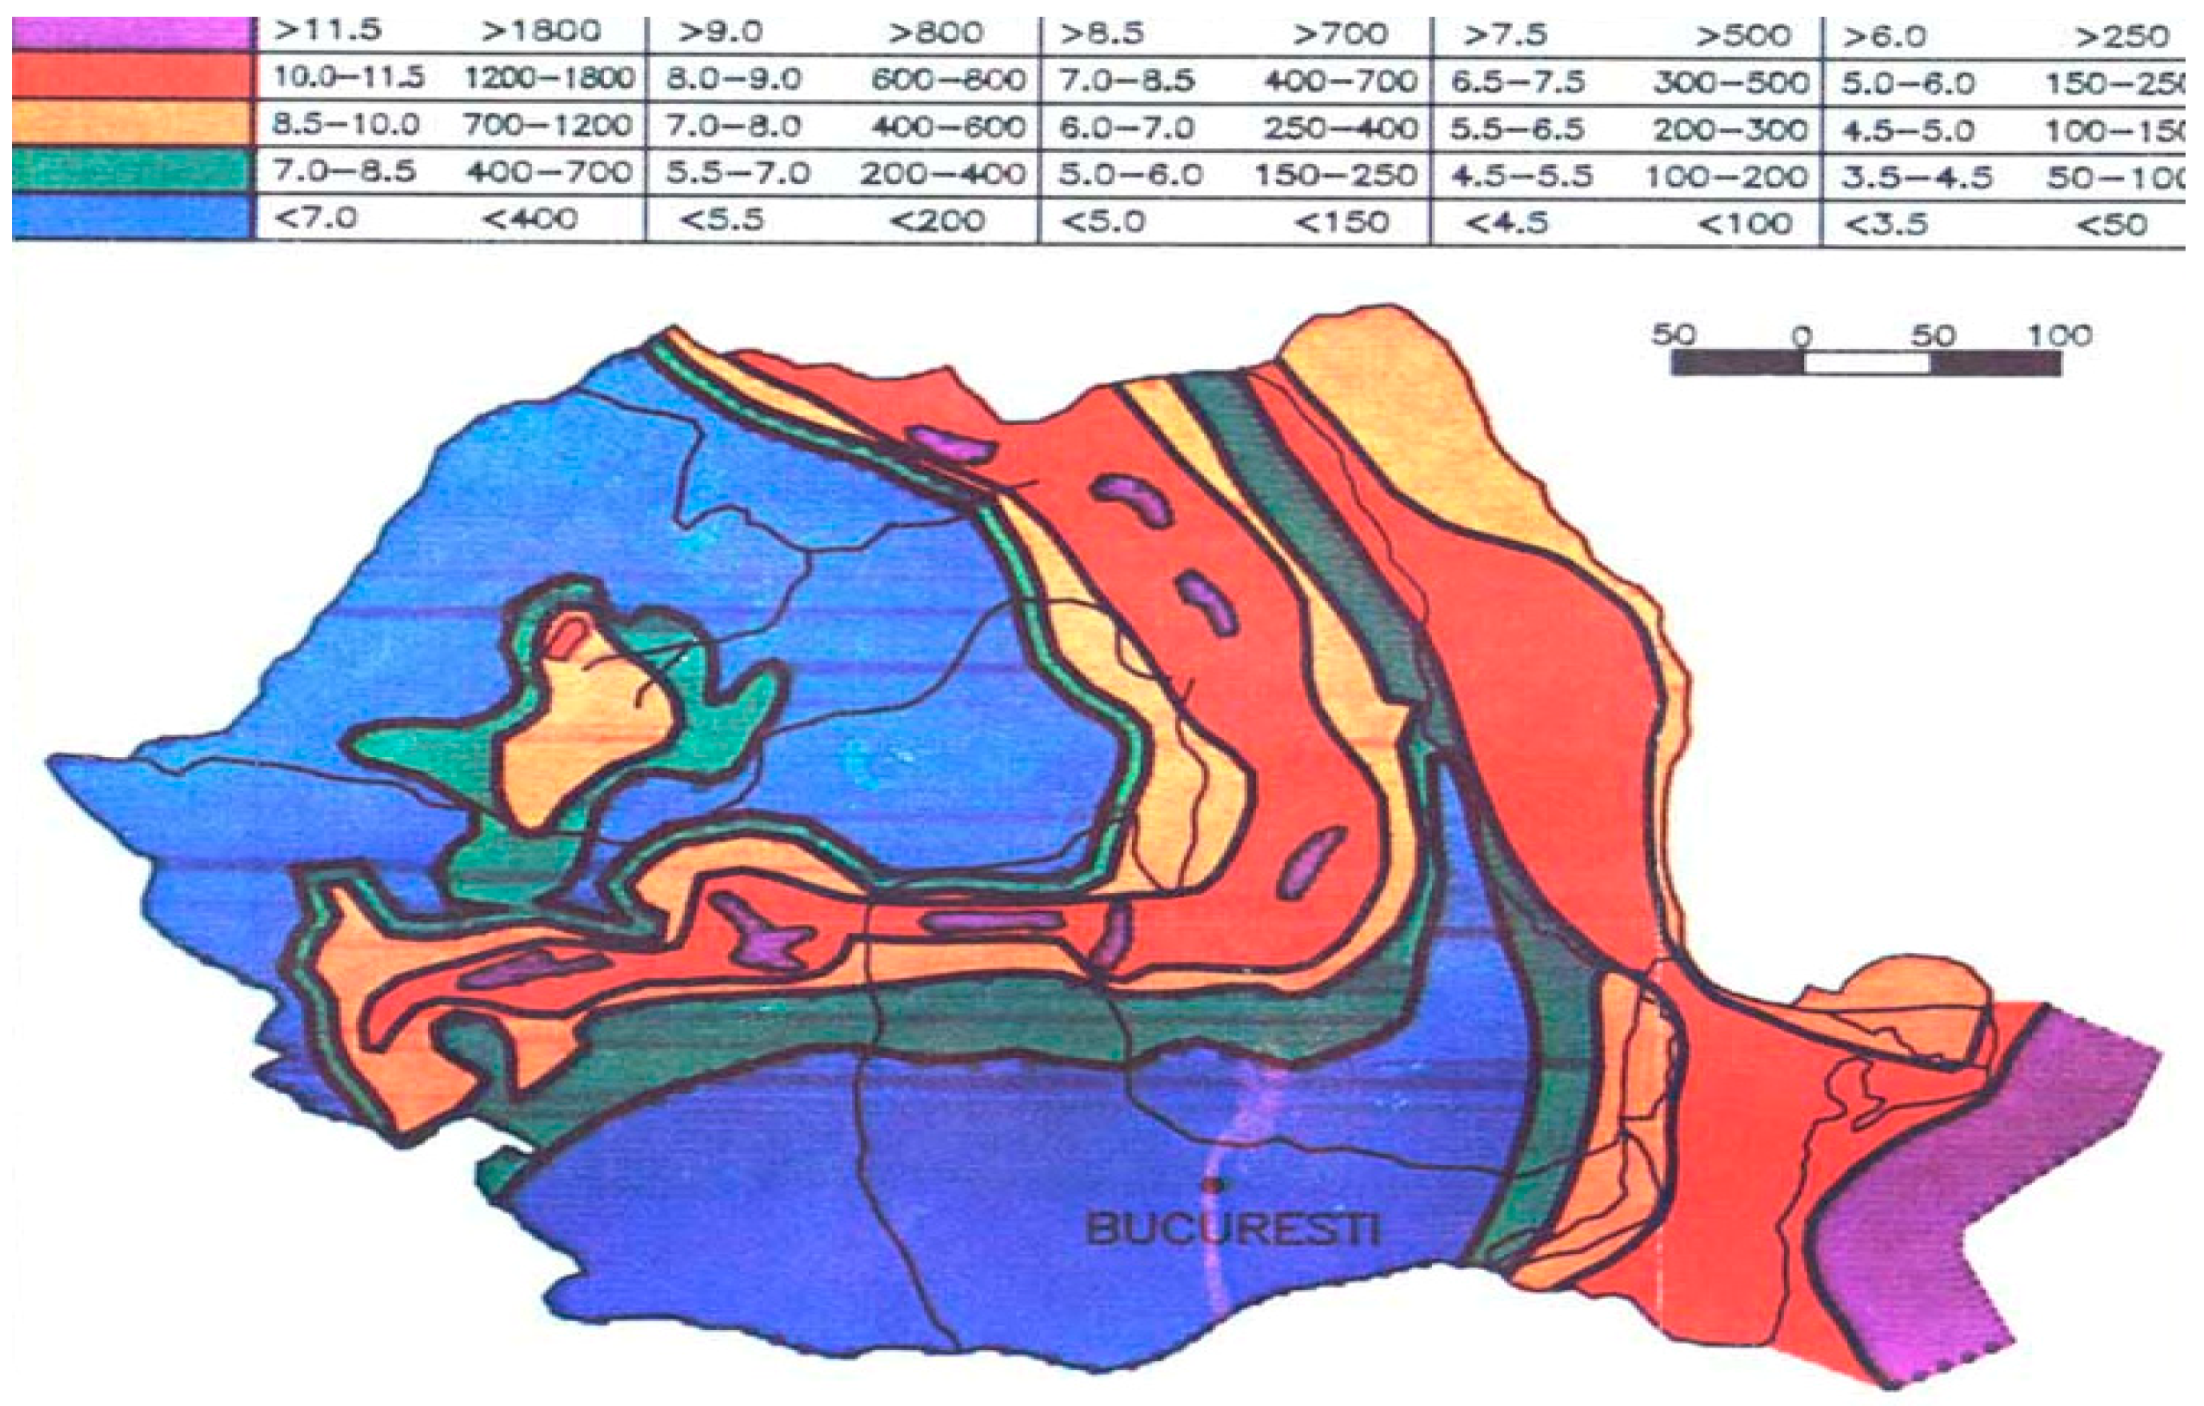
In Romania, five wind zones were identified, depending on the environmental and topo-geographical conditions, considering the level of the energy potential of such resources at an average height of 50 meters and over (
Figure 13).
The results of the recorded measurements show that Romania is in a temperate continental climate, with high energy potential, especially in the littoral and coastal areas (mild climate), as well as in alpine areas with plateaus and mountain valleys (severe climate). It is estimated that the annual wind energy potential in Romania is around 23 TWh.
In 2015, a total of about 27.3 GW of new power generation capacity were connected in the EU and 18.2 GW were decommissioned, resulting in 9.1 GW of new net capacity. Renewable energy sources (RES) accounted for 20.6 GW or 75.6% of all new power generation capacity [
38].
Romania’s wind potential is the highest in Southeast Europe [
39]. The wind energy in Romania witnessed considerable development over the five-year period. A total of 75 wind farms with a power range from 0.008 to 600 MW and an average of 40 MW were built [
39].
At the level of 2012, in Romania were installed 923 MW that represents an increase of 94% of the total wind power capacity. Cumulative wind power capacity of Romania has reached 1905 MW at the end of 2012, surpassing the estimates of ANRE and the National Action Plan for Renewable Energy [
40]. Simultaneously, Tocan has analyzed the main investments in wind energy in Romania [
40]. Representative investments are presented in
Table 2.
As can be observed in the previous table, the main investor in wind energy in Romania is Cez. On the second and third place, both for installed capacity and total of investments are ranked Enel Green Power and EDP Renewables.
Dobrogea region became, in 2014, the largest wind farm in Central and Eastern Europe, with hundreds of 2.5 MW wind turbines installed all over the Constanta County, in sites as: Cogealac, Fantanele, Pestera, Independenta, Chirnogeni, Silistea, Targusor, and Crucea localities and surrounding areas.
In April 2016 Romania’s electricity production accounted 23% of total energy production coming from wind energy. According to the state-based transportation company, Transelectrica, the wind was the second most important power source, after hydropower. In April 2016, the wind energy production amounted to 1941 MW whereas hydropower reached 2192 MW, representing 26% of the total [
41].
After 2017, one of the largest projects in the field is represented by the NERO Renewables project, which intends to build in Romania three wind farms with 362 turbines and a total installed capacity of about 1 GW, with 400 MW above the capacity of the Fântânele-Cogealac onshore park, currently the largest of its kind in Europe [
42]. Given that the Netherlands expects to miss the target of a 14% share of renewable energy in total energy production for 2020 and Romania has already reached its 2020 target, NERO proposed to the Dutch Government to “adopt” the project in Romania. Thus, through the European mechanism “joint projects” for cooperation in the renewable energy sector, the Netherlands will be able to co-finance the wind farms developed by NERO in Romania, and the energy produced by them will be included in the renewable energy production of the Netherlands. At the end of 2017, Romania has 3209 MW installed wind power capacity. This means that 12.2% of the average annual electricity demand is covered by wind [
33].
Wind energy investments in 2017 were less geographically concentrated than in 2016. Wind energy investments accounted for 52% of the new clean energy finance in 2017, compared to 86% in 2016. Germany was the largest investor in 2017 with a total financing activity of €6.7 bn for the construction of new onshore and offshore wind farms.
4.2. Photovoltaic
According to Romania Photovoltaic Market Outlook 2014–2025, Romania was one of the most promising emerging markets for photovoltaic energy investments in 2013 amongst SEE countries [
43].
Romania’s solar potential is widespread throughout the country. Romania benefits from about 210 sunny days per year. The southeastern region of Romania, the west, the center, and the east of the country are the best places to place a solar park. Solar energy is quoted by many market specialists with good chances to turn into the new boom in the green energy segment.
It is very difficult to assess the number of photovoltaic (PV) parks existing in Romania because no institution centralizes this information and does not have a cumulative record. As of 2016, consulting and comparing information from various sources, not all official, we found that 962 photovoltaic power stations or photovoltaic parks with a combined installed capacity of 4871.66 MW were built up to last year.
A total of 212 of them produce less than 1 MW and 112 have a production below 2 MW (
Table 3). Most PV parks are built in Ialomita county (59 parks), and the largest installed capacity is in Brasov County, at 287.5 MW.
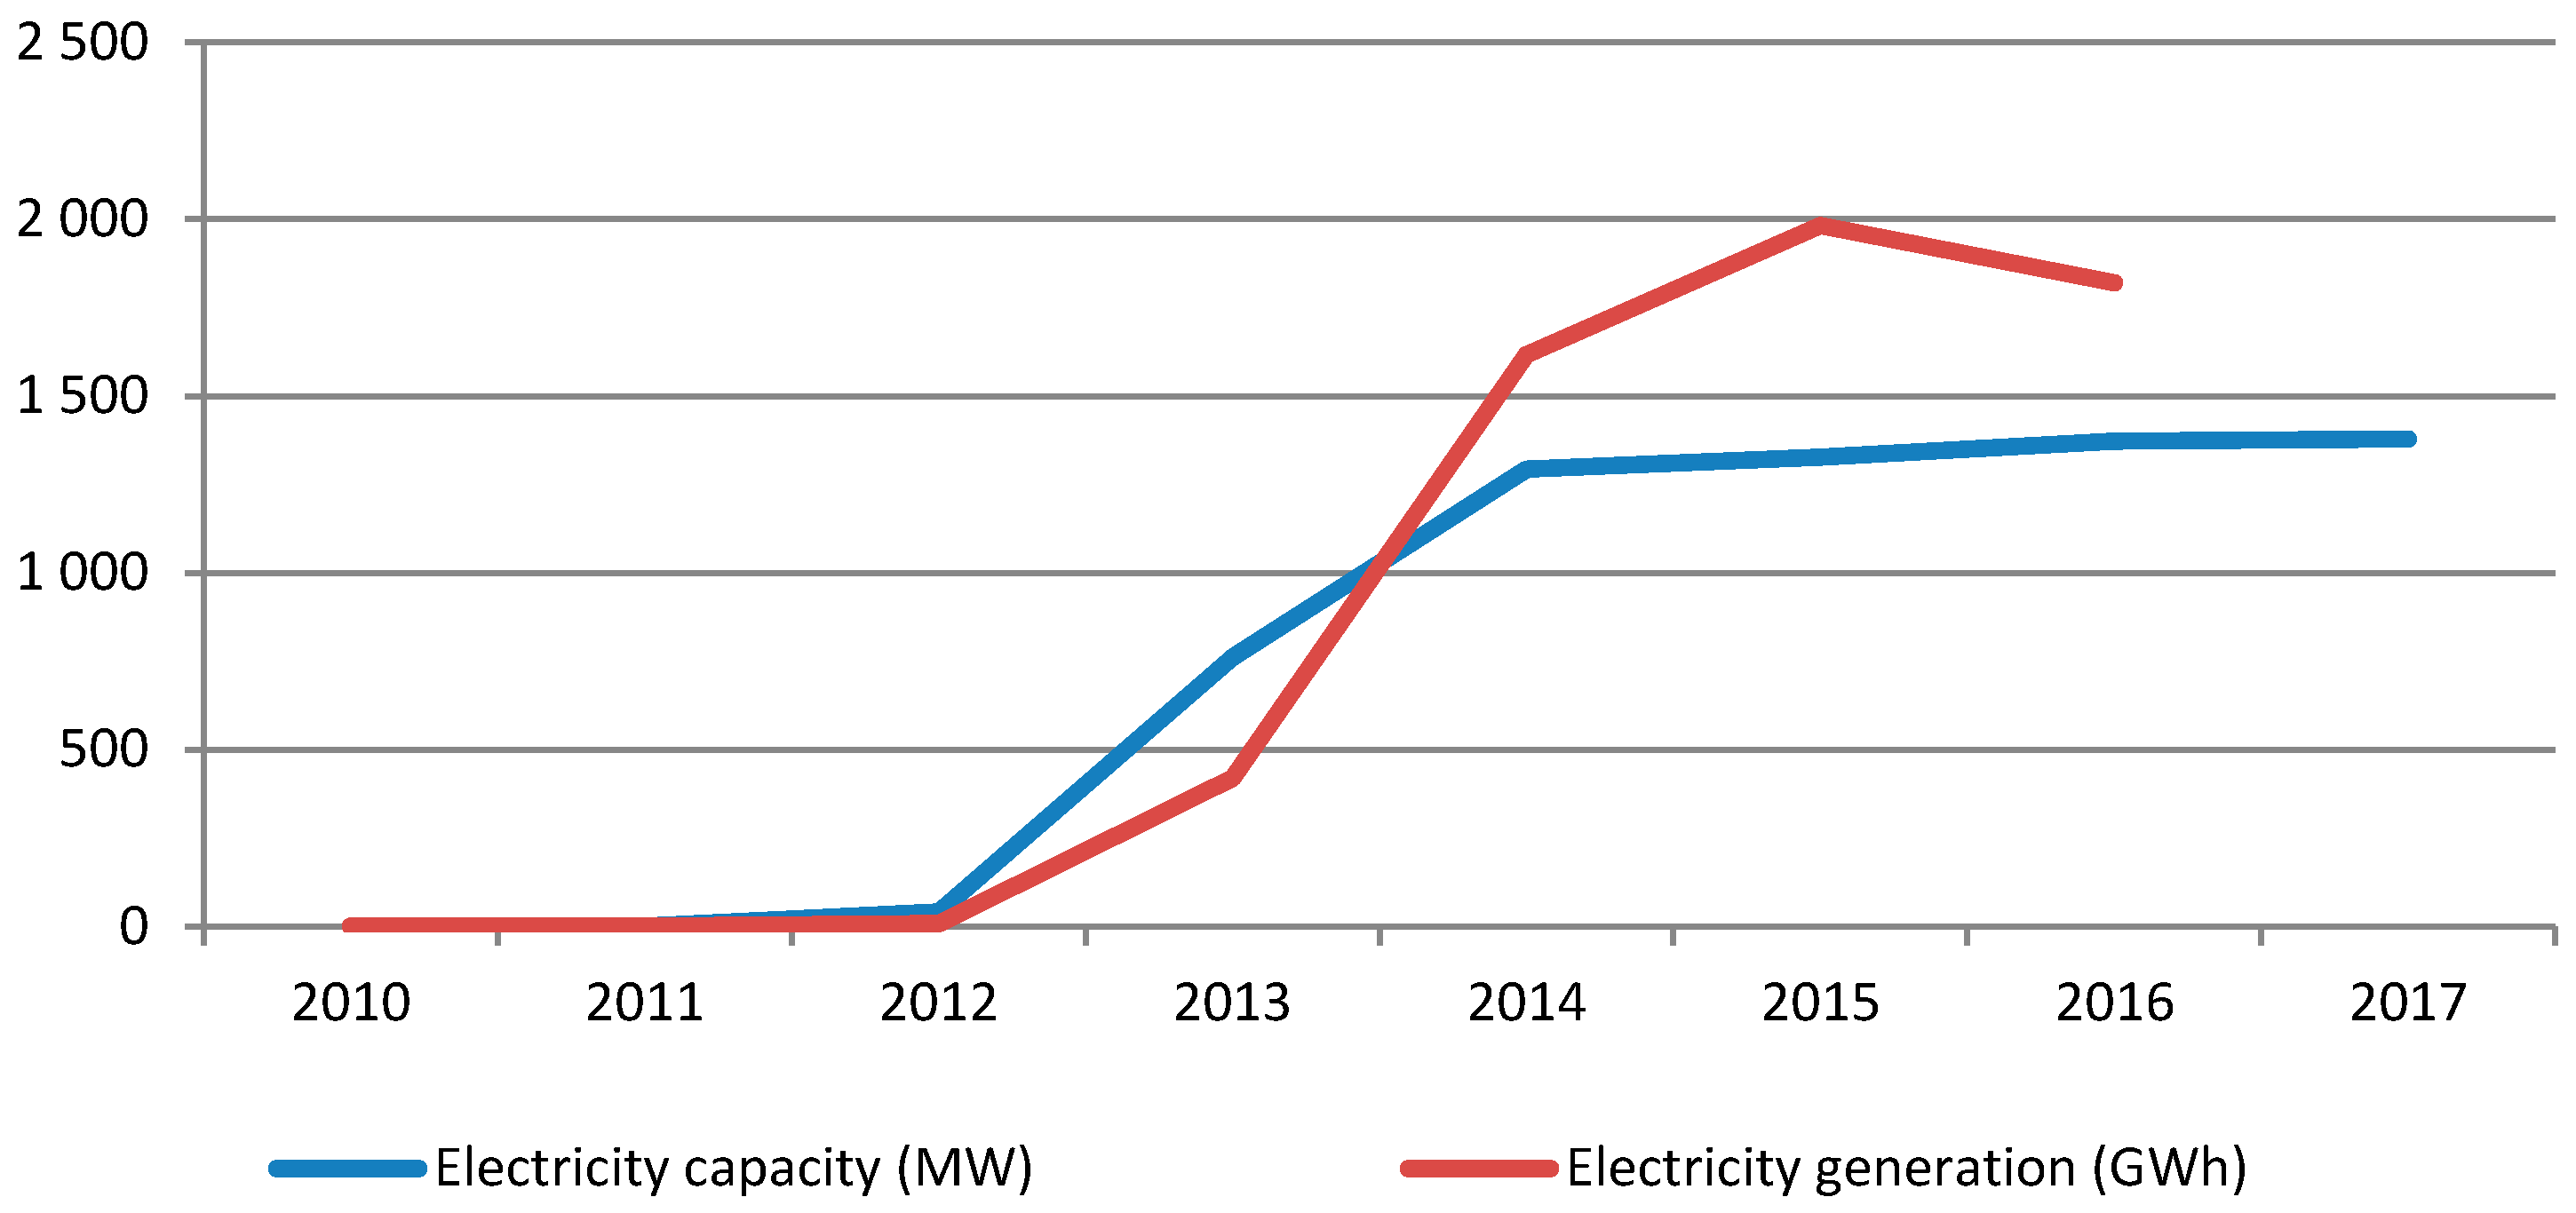
During the 1970s and 1980s, Romania was an early player in the solar power industry, installing around 800,000 m
2 of early-technology solar cells, which placed the country third worldwide as far as the total surface of photovoltaic panels was concerned. Although the support scheme was one of the main investment drivers lately, the solar sector has lagged. In 2011 the production of electricity using solar PV was insignificant in Romania, while in April 2012 only two PV plants were operational, each amounting to 1 MW. The solar installed capacity recorded an increase from 500 kW in 2008 to 1.3 GW in 2016 (
Figure 14).
The most important increase of the electricity capacity can be underlined between 2013 and 2014, when the capacity has grown from 761 MW to 1293 MW. In 2013, the Romanian incentive structure subsidizes up to a total of six green certificates per megawatt-hour of electricity produced. Demand significantly exceeded expectations, and in response the Romanian Energy Regulatory Authority (ANRE) recommended a reduction in green certificates from six to three in March 2013.
The result of this incentive was a 3361% increase in solar installations over the 30 megawatts installed in 2012. Romania’s rise is a byproduct of the longstanding forces governing PV demand, which shifted development from region to region based on rapid changes to incentives. With an attractive incentive program, acceptable insolation and geographic accessibility for vendors and EPCs, Romania met all the criteria for a strong PV market. However, similar to other markets, a rapid phase-out of incentives caused a significant drop in installations.
4.3. Hydropower
Hydropower is one of the main contributors to the total electricity generation in Romania, with a contribution of around 30% of the total power delivered to the grid. In 2010 hydropower plants had a total installed capacity of over 6400 MW and produced 19.8 TWh electricity [
44].
Compared to 2008, in 2016 the hydropower installed capacity slightly increase from 6.38 GW to 6.71 GW. Additionally, in the same period, a drop of the hydropower production, from 1.46 Mtoe/year in 2008 to 1.25 Mtoe/year in 2016 can be remarked. The largest company in the hydropower sector is a state-owned company named Hidroelectrica. In 2017, this company produced 14.04 TWh in 208 hydropower plants with 6444 MW installed power. At the level of 2017, Hidroelectrica posted EUR 260 million gross profit in the first nine months of this year, when its turnover stood at EUR 525 million [
45]. At the level of 2016, the values of the produced energy and of the power installed in the hydropower facilities in operation in Romania are represented in
Table 4.
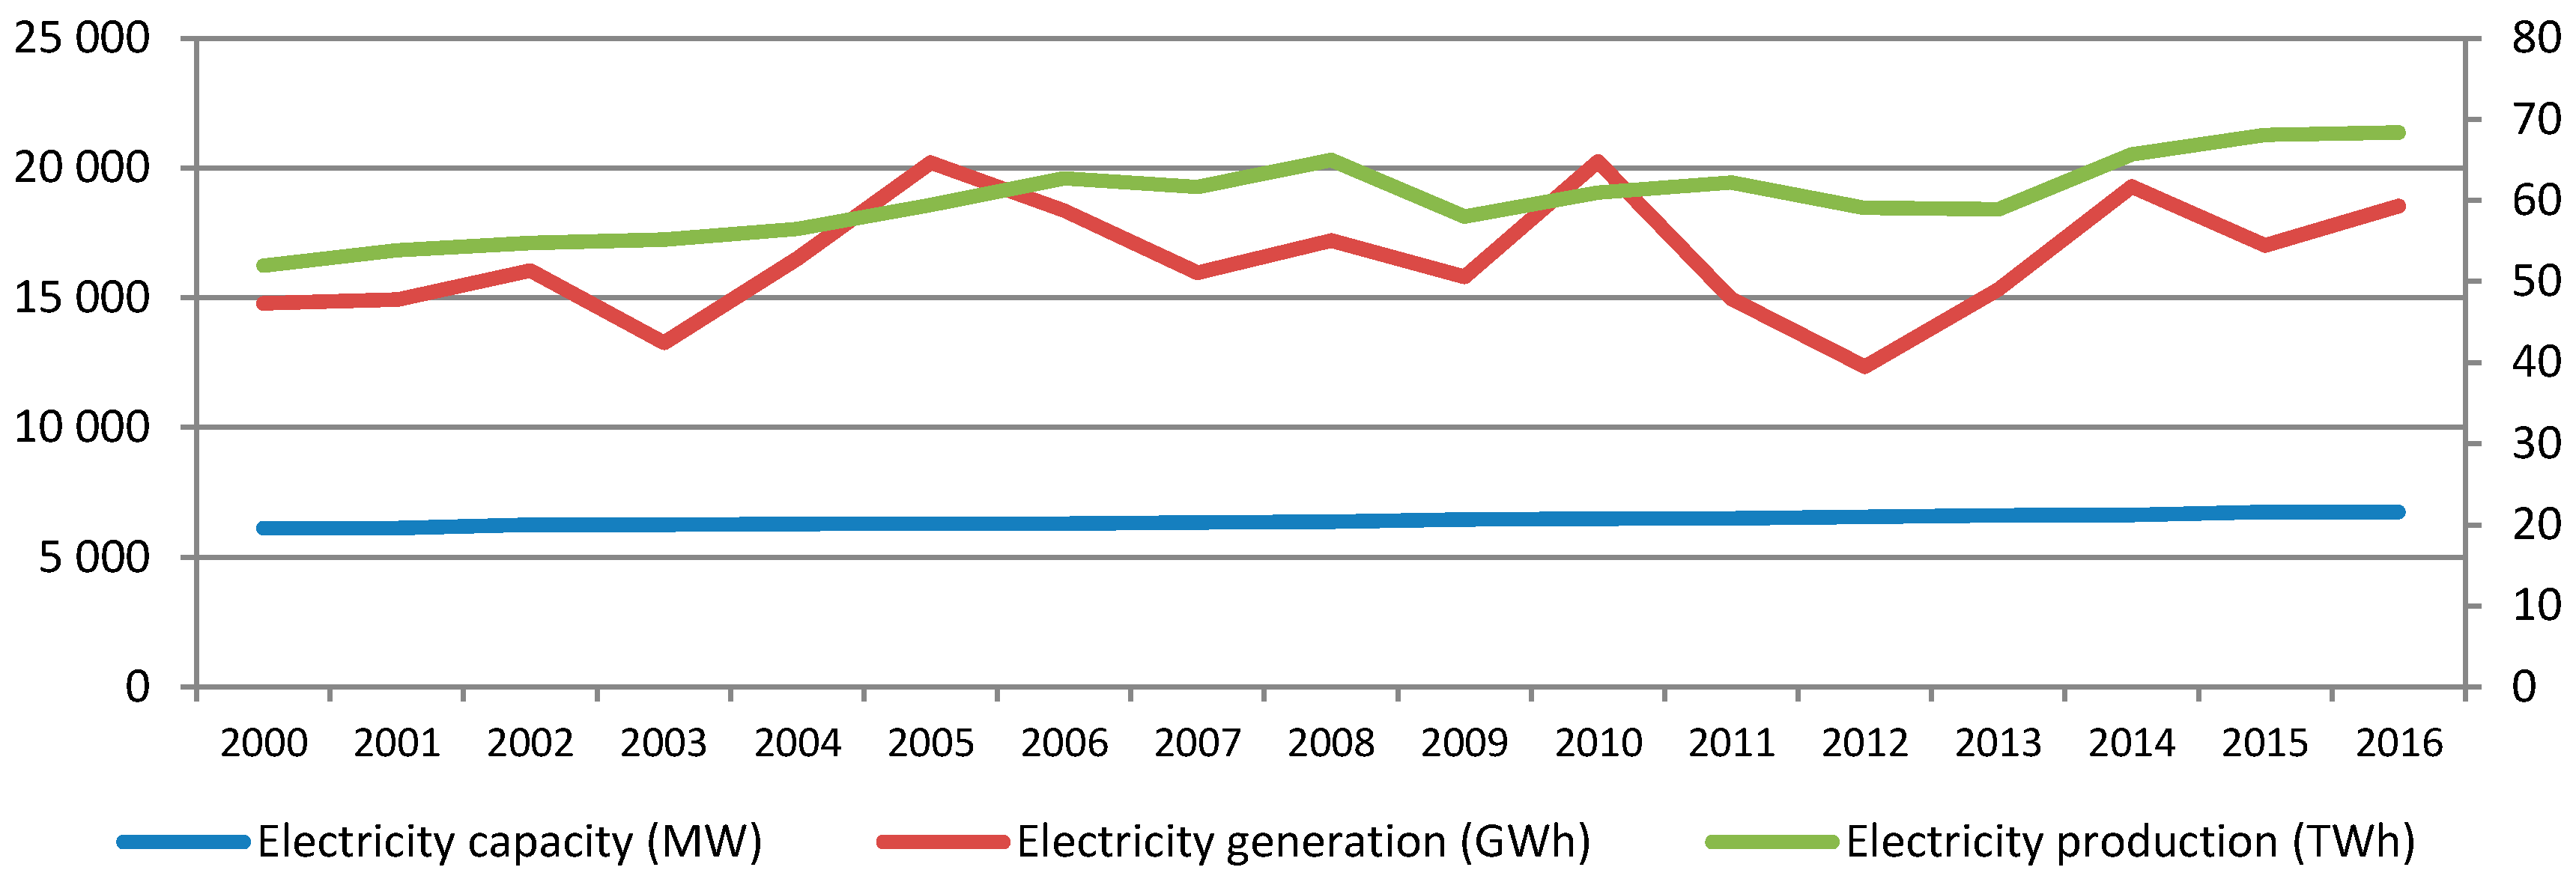
In Romania, hydropower capacity has grown from year to year. If in 2000 the electricity capacity was 6120 MW, in 2016 it reached 6734 MW. This means a 10% increase in capacity in 15 years (
Figure 15).
At the level of 2005, a slight decrease in electricity capacity was recorded, –7 MW. In 2014 the largest increase in electricity capacity of 117 MW added for the analyzed period can be remarked.
World Energy Trilemma 2016 considers that emerging economies have the potential to double energy production by 2050, including low-power hydropower plants [
46]. In the same report is highlighted that hydropower contributes more than 16% of total energy needs and supplies 76% of total energy produced from renewable sources. In Romania, in 2016, the exploitable potential reached 69–75% of its capacity. An important share of the remaining exploitable potential, representing 6–8 TWh/year, can be valued in the future. This represents a new installed capacity of approx. 1700–2700 MW (
Figure 16).
To extend the hydropower network in Romania, the national authorities could speed the completion of various plants at various stages of execution. There are 14 large hydropower plants and eight small hydropower plants with an installed capacity of 416 MW and an annual energy output of 1329.40 MWh/year, which were started before 1989.
4.4. Bioenergy
Romania is the state of Europe best suited for bio-economy with a localization coefficient of 3.9. This means that the share of people working in the Romanian bio-economy is almost four times the share of those working in the bio-economy of the rest of the European Union. In fact, this "concentration" in the bio-economy is mainly due to a very large concentration of the labor market in agriculture in Romania. One of the most important aspect that bio-economy refers to is bioenergy. In the category of bioenergy can be included: (1) Solid biomass including waste; (2) Biogas and (3) Liquid Biofuels.
Biomass is and will remain the main type of RES in Romania. The main form of energy biomass produced in Romania is firewood (95%), being an important generator of GHG. Data on solid biomass production presents a high degree of uncertainty (about 20%) compared to a central estimate of 42 TWh in 2015, uncertainty also reflected in heating consumption and energy balances of Romania. Household firewood consumption is estimated at 36 TWh; with the mention that the predominant biomass is used in the production of heat, respectively heat and electricity in cogeneration. The modeling results show a 20% decrease in firewood consumption by 2030, which will lead to a slight decrease in production to 39 TWh.
We are closer to the truth considering biomass as a bridge between fossil resources and truly non-polluting resources—so, at best; the use of biomass can mean a period of transition, long enough, towards a truly non-polluting energy system. For now, the European Commission’s report only succeeds in highlighting the benefits of biomass over the use of fossil resources, but at the same time highlights the possible large-scale risks that inefficient use of biomass can bring. Thus, it would require a reassessment of the importance biomass has to have in the plans of the EU countries.
Starting in 2009, a continuous growth both for electricity capacity and electricity generation can be observed (
Figure 17). The greatest growth of this indicator can be highlighted between 2013 and 2014, at 126%. This increase is due to several major investments in the field of biomass of which a significant one inaugurated is Genesis BIOPARTNER. It is a Romanian holding company formed in partnership with Baupartner Romania and Vireo Energy from Sweden with a capacity of 1 MW/h electric and 1.2 MW/h heat and process 49 tons daily amount of organic substrate. The project involved an investment of approximately 5 million EUR [
47]. Another major investment in the field, 11 million EUR, was made, starting in 2012, by KDF Energy.
In terms of biomass electricity generation, the most important increase can be observed between 2009 and 2010. If in 2009 the value of this indicator was 10 GWh, in 2010 it reached 110 GWh. Another significant increase was between 2013 and 2014, from 202 GWh to 454 GWh.
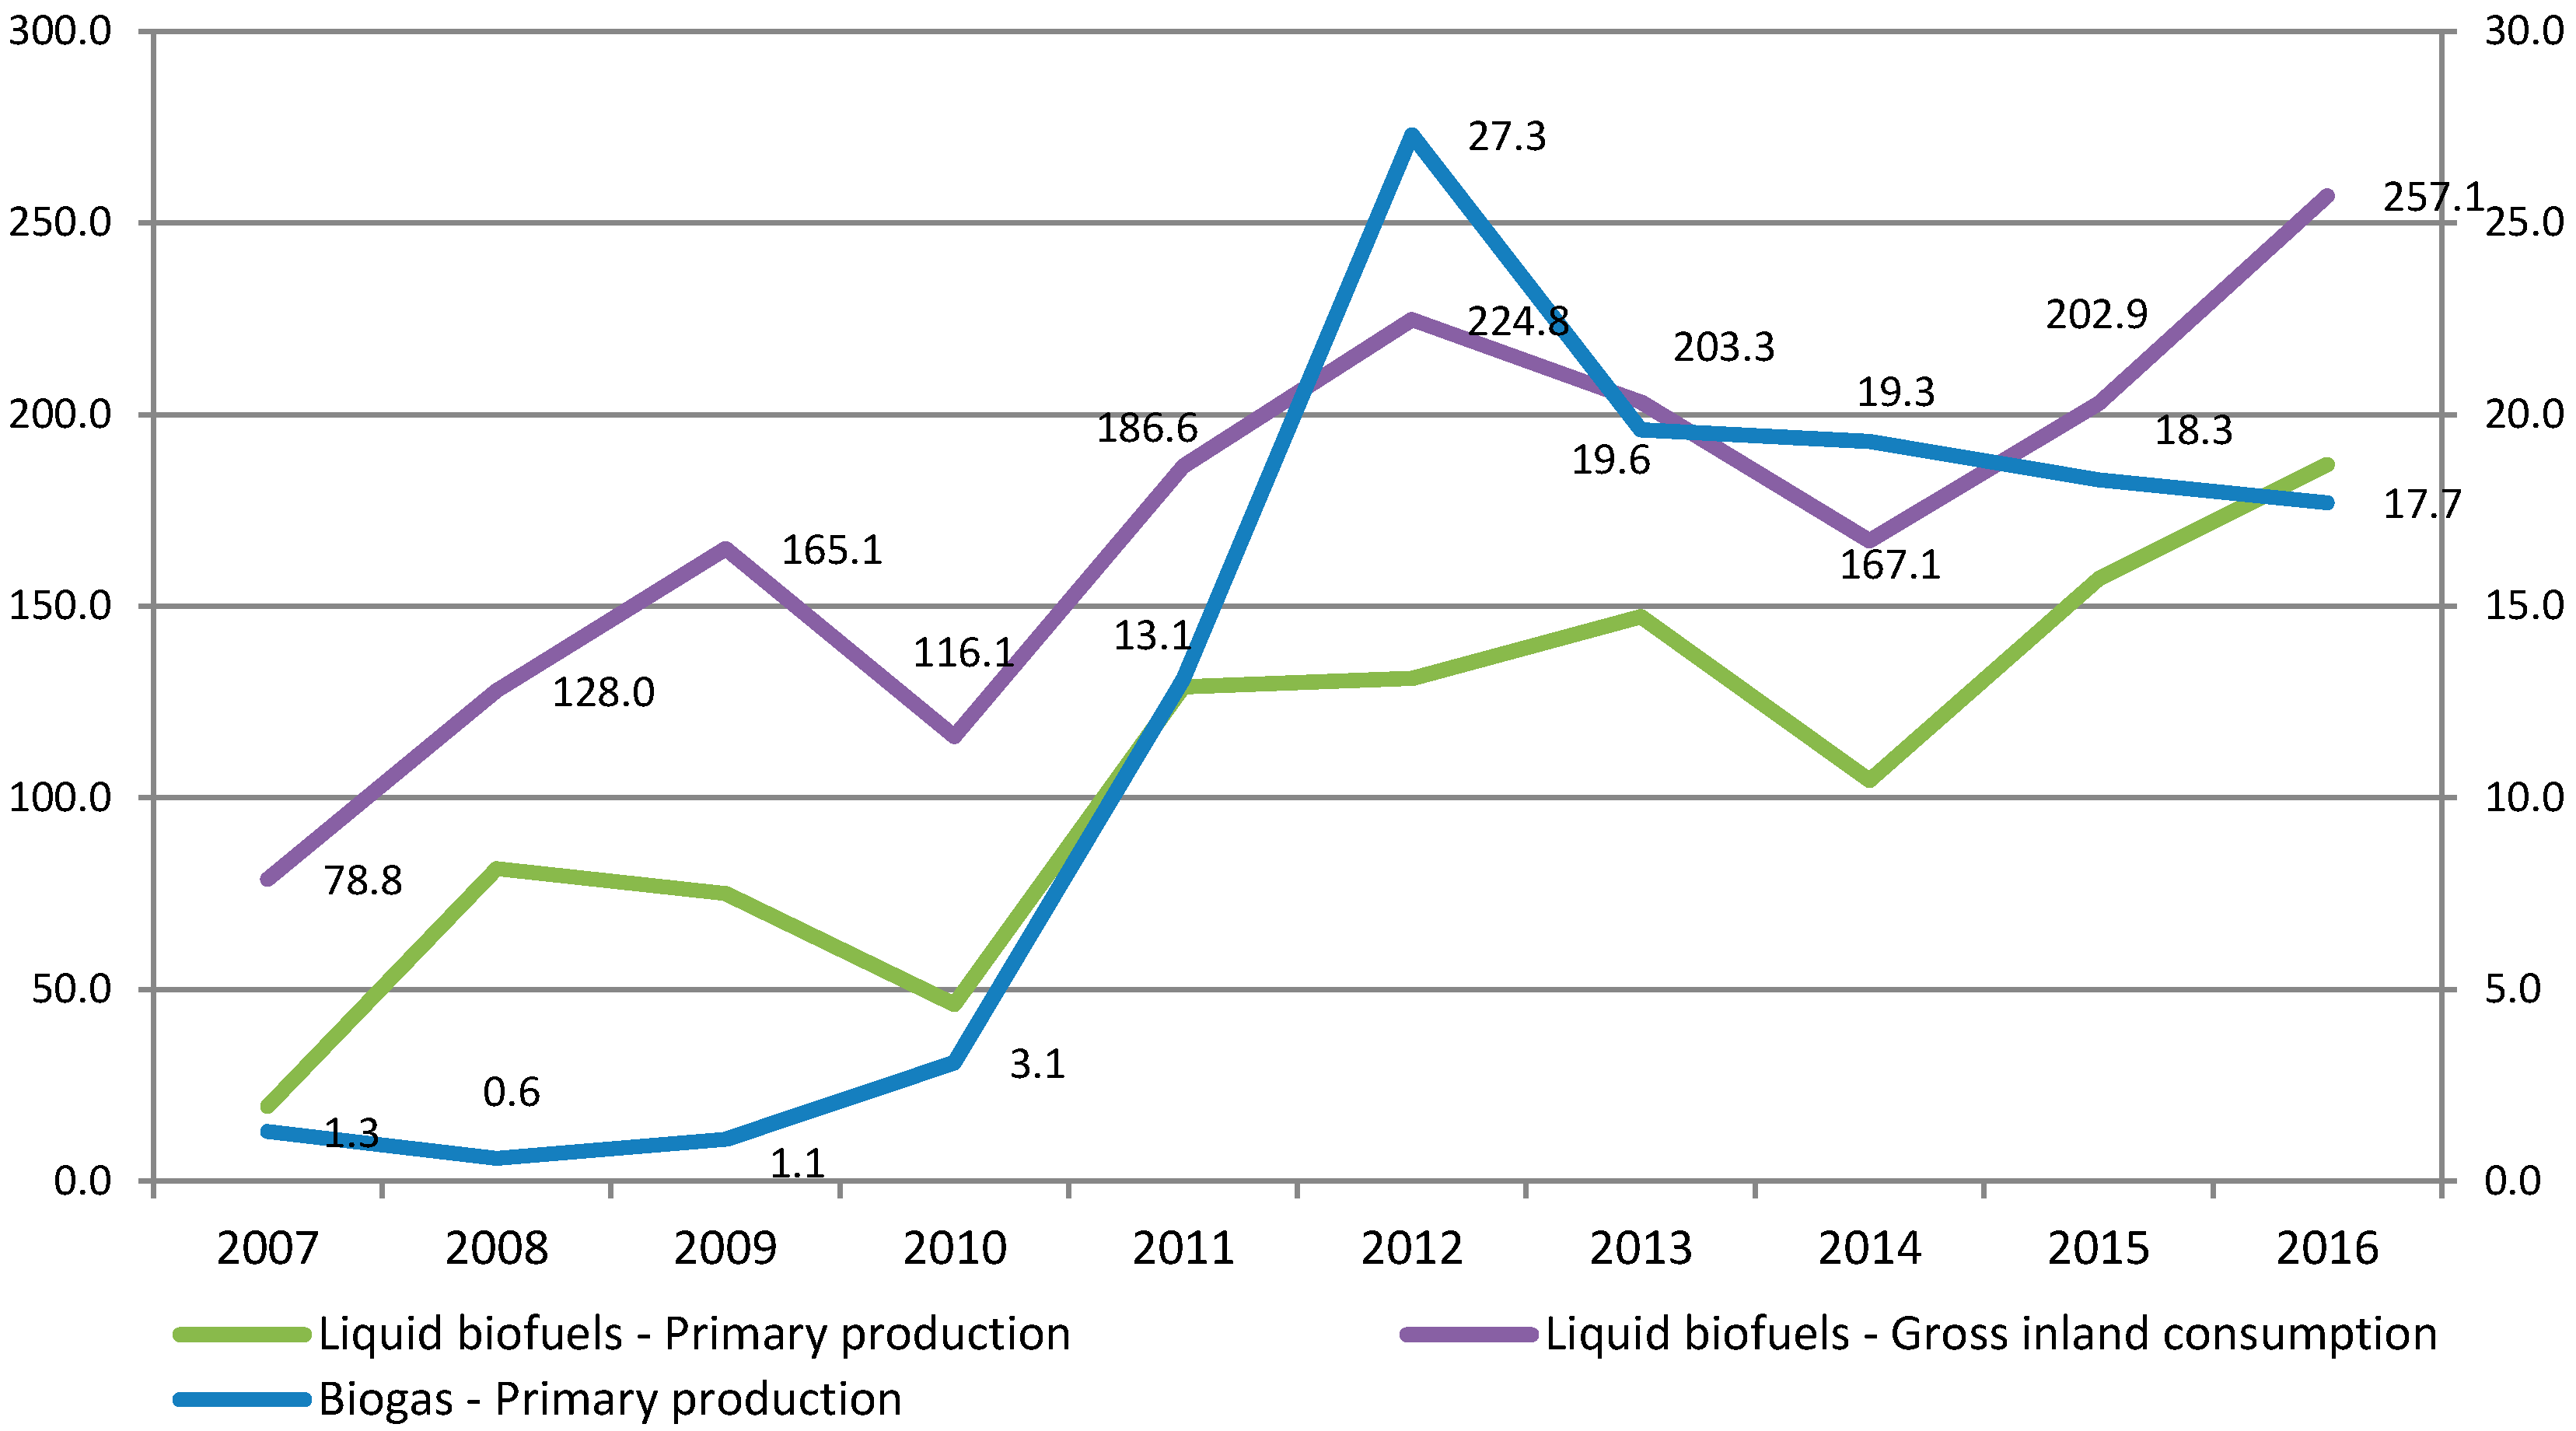
Starting in 2010, from the perspective of primary production and gross inland consumption, it can be seen a negative correlation (
Figure 18). A bigger value of gross inland consumption is due to imports in the field of liquid biofuels, because major companies in fuel distribution are foreign entities. For the analyzed period, the total amount of biogas production was consumed by the domestic market. Since 2014, biogas primary production is decreased from 19.3 to 17.7 Mtoe in 2016.
The Bio-Based Industries Consortium (BIC) report has identified the main local biomass sources that could be used as sustainable raw materials for bio-industries as well as key actors in relevant sectors and industry-based development opportunities based on these activities [
48].
According to the same report, agriculture and forestry, together with other industries, such as food processing, the wood industry, and the paper and pulp industry, can produce large quantities of waste and other unused or less used materials, being available as raw material for biomass processing industries [
48].
In 2012, Transelectrica reported that there are about 35 MW using agricultural or forestry waste to produce light, which means that the field has already attracted investments of 70 million EUR.
In 2017, a new state aid scheme to support investments in ‘less exploited’ renewable resources, such as biogas, biomass and geothermal energy, has been approved in Romania. The new support scheme from the Romanian government has a total budget of over EUR 100,000 ($107,000). A total of 85% of the budget comes from the European fund for regional development and 15% from the state’s funds.
5. Perspectives on Renewable Energy Development
The renewable energy sources to be stimulated in Romania for the period 2030–2050 are: wind energy, hydropower, geothermal energy, biomass, and solar energy. As previous research has underlined, Romania has the potential for green energy production as follows: 65% for biomass, 17% for wind energy, 12% for solar energy, 4% for small hydropower plants, and 2% for geothermal energy [
49].
Moreover, the European Parliament voted for a project that requires 35% of Europe’s energy consumption in 2030 to be renewable. Each Member State will have a target from which it will be able to deviate by a maximum of 10%, under certain conditions, including Romania. In 2030, each EU Member State will have to ensure that 12% of the energy consumed in the transport sector comes from renewable sources.
According to a map compiled by the National Meteorological Administration, this potential is allocated zonal as follows:
Danube Delta—photovoltaic;
Dobrogea—wind and photovoltaic;
Moldova—small hydropower, wind and biomass;
Carpathians Mountains—biomass and small hydropower;
Transylvania—small hydropower;
Western Plain—geothermal;
Subcarpathian—biomass and small hydropower; and
Romanian plain—biomass, geothermal and photovoltaic.
In order to encourage companies and householders to develop such systems, the Romanian government has created support tools such as the green certificates market, investment financing solutions, or incentive regulatory framework.
Policies continue to support renewable electricity worldwide, increasingly through competitive auctions rather than feed-in tariffs, and the transformation of the power sector is amplified by millions of households, communities and businesses investing directly in distributed solar PV.
The electricity produced in Romania, between 2011 and 2015, increased by approximately 4.5%, and the reduction in greenhouse-gas emissions from the electricity production process decreased by 5.8 million tons. This decrease reflects the change-over in the electricity production process, from fossil fuels, particularly coal, to electricity generated from renewable sources, in particular, wind power.
For 2030, the estimations show a more significant increase only for energy consumption in the machine, machinery, and equipment industry, respectively, in freight transport. Heating consumption is likely to decrease slightly by increasing energy efficiency.
In the medium and long term, an increase in e-mobility is expected, eliminating exhaust fumes, especially in the urban environment. For the electric vehicle to contribute substantially to reducing air pollution, the energy transition to renewable energy sources and other low-emission electricity technologies, or sustainable technologies for storing significant amounts of electricity, will have to be completed.
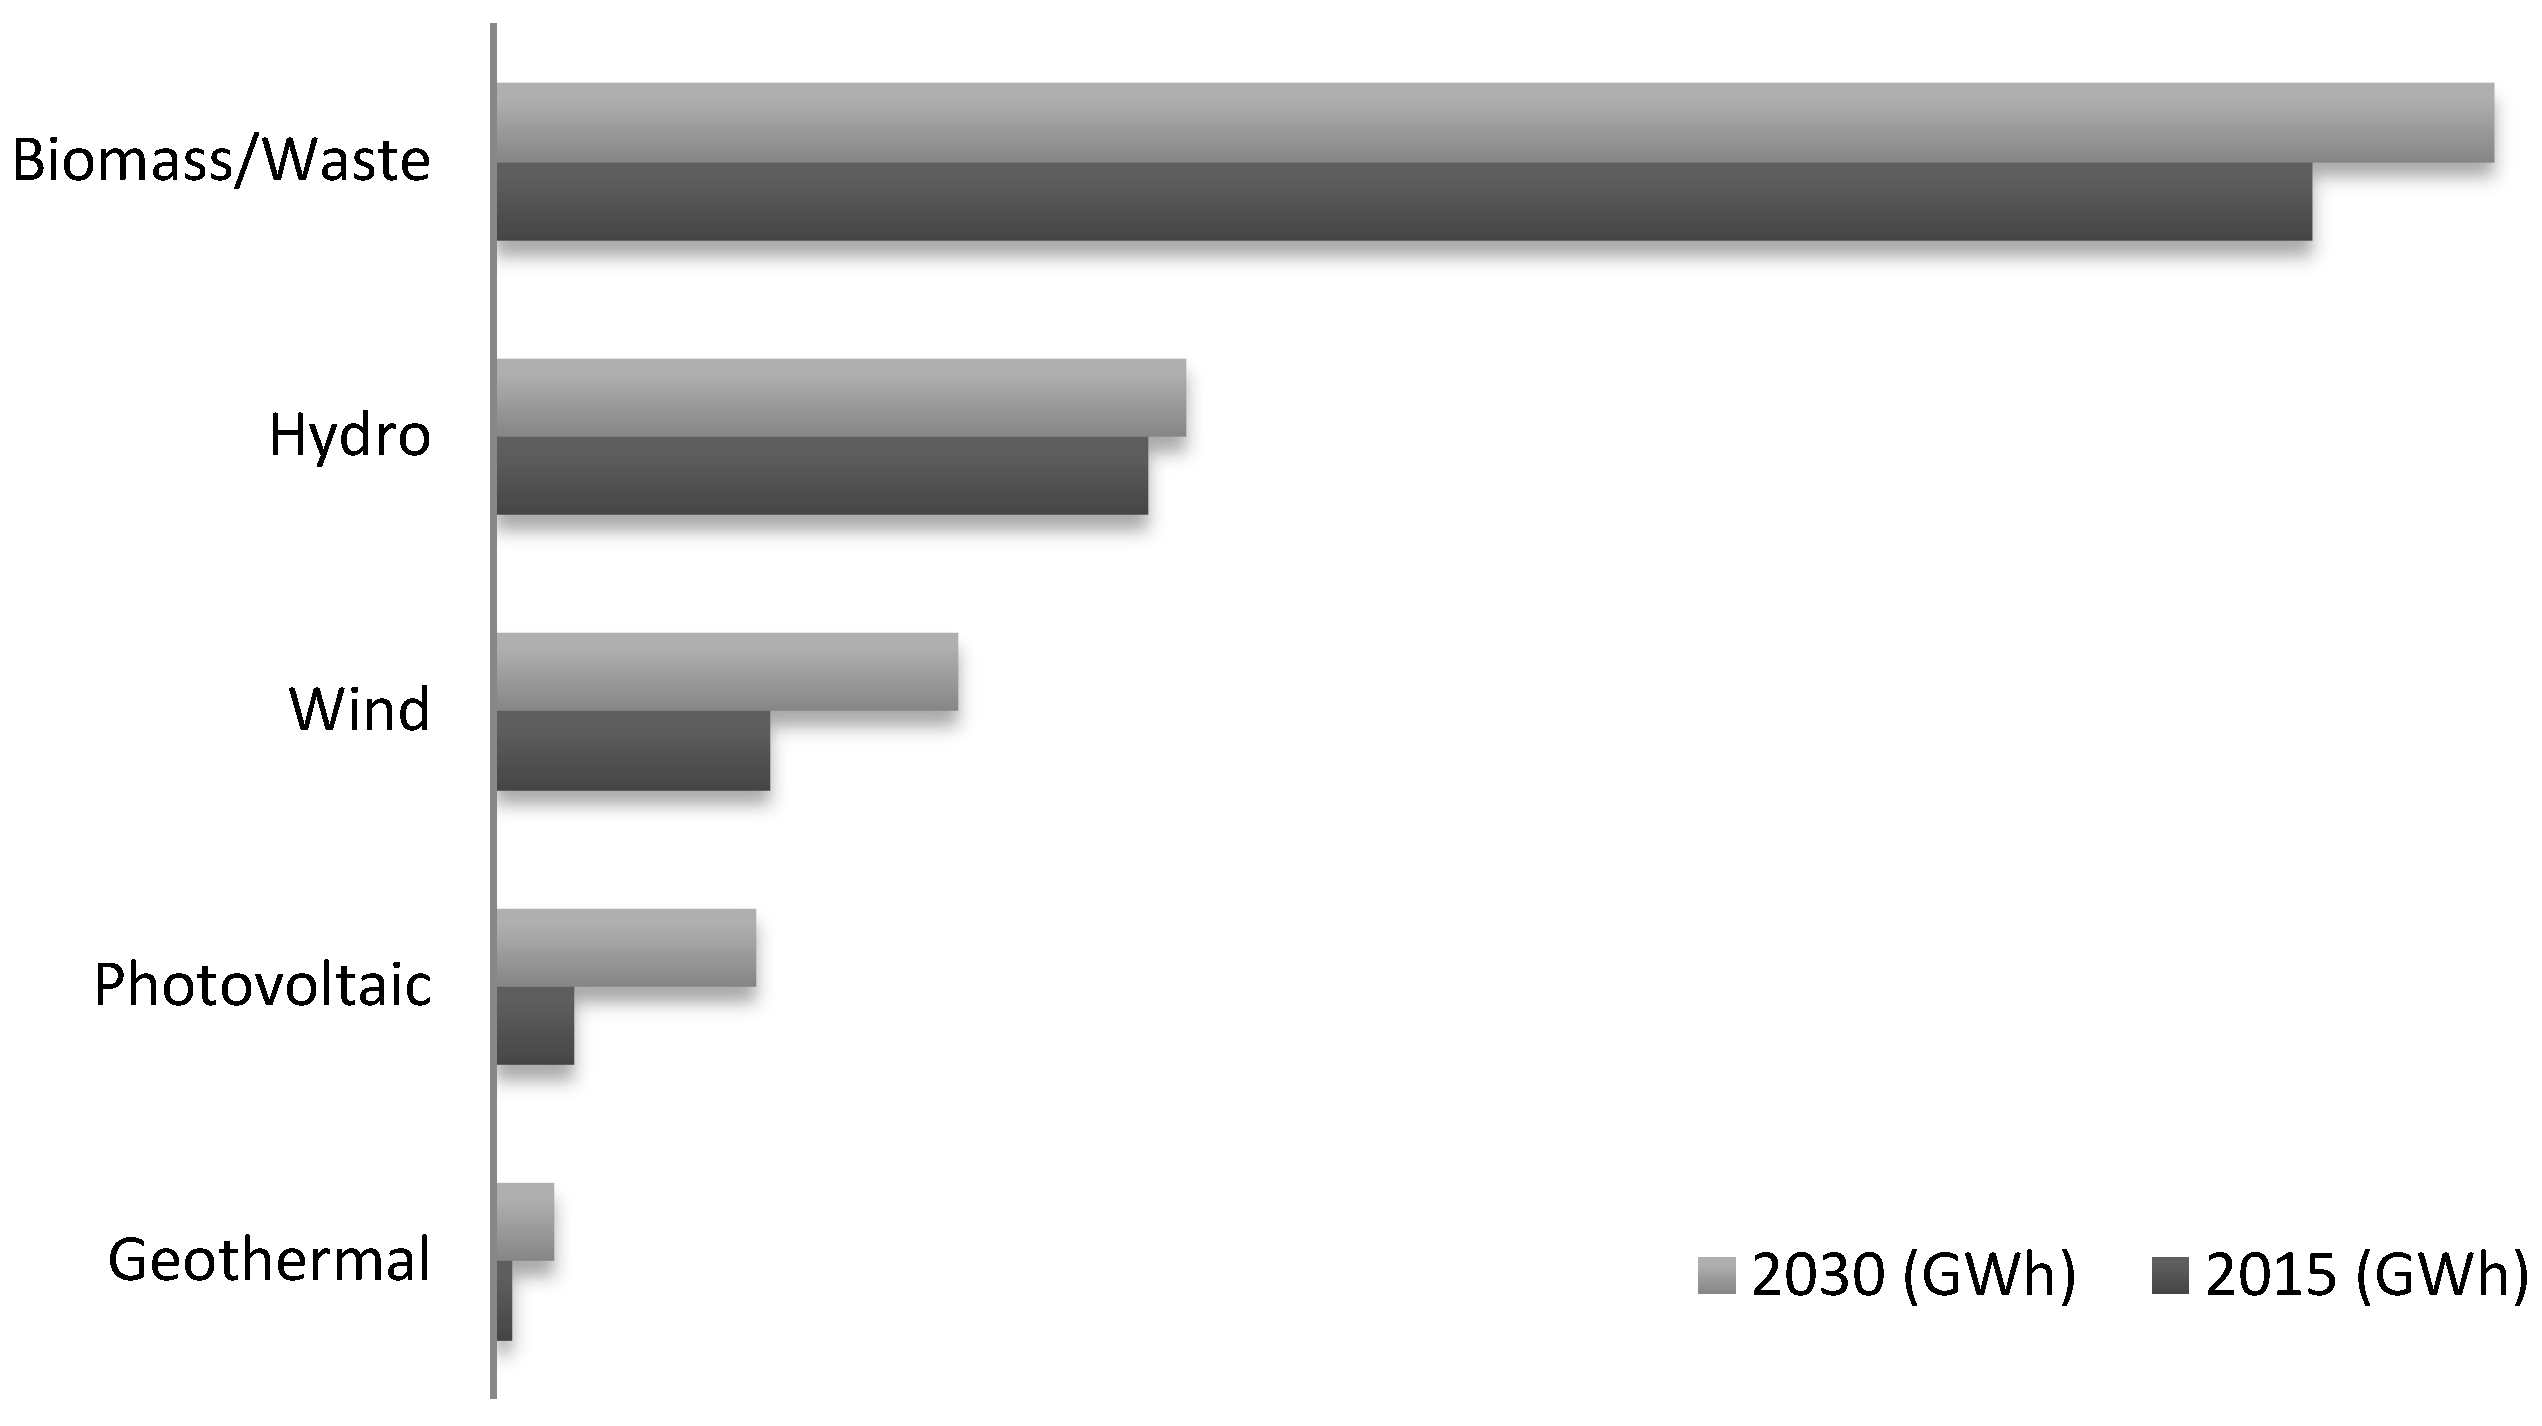
For the year 2030, an optimal scenario shows a decrease in natural gas to 106 TWh (27%), the maintenance of crude oil consumption (26%) and the reduction of coal’s contribution. Instead, the contribution of nuclear energy is doubled and energy from biomass (including biogas) increases to 51 TWh. Renewable energy capacities in electricity generation grow to 37 TWh (
Figure 19).
For Romania, frequent changes to the Green Certificates support scheme in recent years, aggregated with the country-specific risk of an emerging economy, place the cost of RES capital at one of the highest levels in the EU. Therefore, there is a risk that Romania’s equitable participation in meeting the EU’s common targets for RES in 2030 will be costly.
Access to the current green certificates support scheme closed at the end of 2016, so new investments in wind, photovoltaic, micro-hydro power, or biomass capacities are unlikely in the period 2017–2020, except those receiving co-financing from European Structural Funds.
In an optimistic scenario, after 2020, Romania is succeeding in attracting investment in new RES-based capacities by reducing capital costs without the need for new support schemes. This development enhances competitiveness in attracting investment in related industries. Under low capital cost and without a support scheme, a gradual increase of 1500 MW wind power and 1400 MW of photovoltaic capacity over the 2020–2030 period is projected. In total, the increase in RES-based capacity between 2017 and 2030 will be lower than in 2011–2016.
Biomass occupies a central place in the electricity mix, but the development potential is still high, especially through efficiency and the introduction of new technologies such as biorefineries and biogas production capacities. Judicious management of the forest fund is a basic condition for the energetic use of wood. Geothermal and solar resources are only marginally exploited in Romania, with substantial potential for increasing the use of these resources in the future decades.
Biomass is the main form of RES in Romania’s energy mix and will retain this role in the long run. After 2030, the analysis of the potential for biomass development at European level indicates the possibility of a considerable increase of the surface area used in Romania effectively in annual and perennial lignocelluloses cultures. Total biomass production in Romania could increase from 47 TWh in 2015 to 184 TWh in 2050, of which 119 TWh are lignocellulose biomass cultures. Thus, biomass could become Romania’s main energy product, as much of it could be for exports, after transformation into finished energy products with high added value. The problem of waste management will be solved by transforming into energy products, biogas production, and energy-producing oils, but the resulting volume is lower than the potential of lignocelluloses plants.
A 45 TWh increase in RES is allocated, almost equal between wind, solar, and geothermal. Hydropower is not expected to increase substantially, but growth is not excluded if new investments are made in hydroelectric power plants on the main water courses—the greatest potential is still on the Danube.
There is also a need for strategies to ensure energy security. Thus, by 2030, Romania should streamline the capacity and the way of electricity production. Modern and flexible technologies are required to deliver optimal energy and reduce carbon emissions. The digitization of the entire sector, especially in terms of transport and distribution of energy should be considered.
The production of biofuels and biogas has a high potential. In 2015, the production was 1500 GWh for biofuels and 450 GWh for biogas. For 2030, the modeling results indicate an increase of 4100 GWh of biofuels, amid the development of the agricultural sector and, to a lesser extent, the upgrading of sewage treatment plants. These values can help to reach the national required target for 2020 of 10% RES share in the transport sector.
Waste energy production may increase in Romania, but the focus should be on selective collection, recycling, and recycling of raw materials rather than incineration.
In the short term, the following measures are proposed to ensure the development of the energy sector: strategic stocks and enough capacity reserves; ensuring the calibration of the National Energy System; balancing, backup, and storage systems; protection of critical infrastructure from cyber-attacks or terrorism.
Long-term domestic measures refer to: increasing the capacity of energy governance—legislation, regulations, and administrative acts; maintaining a diversified and balanced energy mix as well as a high level of demand-side coverage with internal resources; maintaining an integrated nuclear cycle and providing expertise in the nuclear field; completing investment in transport and distribution networks in order to increase their efficiency and achieve the transition to smart grids; and reducing energy poverty, including by increasing energy efficiency for vulnerable consumers.
From the GHG reduction perspective, Romania can propose a series of targets that can be achieved by 2050 with the improvements and adjustments presented below (
Table 5).
Based on actual perspectives of development for the energy sector, the GHG reduction compared to 1990 will be only 75%. The European target for this indicator is 80%, but Romania can have a reasonable contribution. It is expected that Romania reaches the 10% target for the share of RES in transportation by 2020. If by 2020, the increase in the RES–transportation share will be supported by the biofuel mix in petrol and diesel until the 10% target is reached; in 2020–2030, the share of RES–transportation will grow especially because of the increase in the share of electric mobility, on the railway and road segments.
For Romania, an 80% GHG reduction by 2050 is not excluded, but it is possible only by maturing new technologies, along with cost savings. The energy sector contributes essentially to the development of Romania through its profound influence on the competitiveness of the economy, the quality of life, and the environment. The Romanian energy sector needs to become more robust economically, technologically advanced, and less polluting in order to sustain long-term consumer expectations. There are five major themes that are highlighted that should be developed until 2030, including: (1) storage and energy mix; (2) infrastructure; (3) the role of biomass in households heating; (4) increasing buildings energy efficiency; or (5) mitigating energy poverty.

 ,
, 


