Article

Expected Global Warming Impacts on the Spatial Distribution and Productivity for 2050 of Five Species of Trees Used in the Wood Energy Supply Chain in France

by
Emmanuel Garbolino
1,*,
Warren Daniel
2 and
Guillermo Hinojos Mendoza
3
1
MINES ParisTech / Paris Sciences et Lettres PSL Université Paris, Centre for research on Risks and Crises (CRC), 1 rue Claude Daunesse, CS 10207, 06904 Sophia Antipolis CEDEX, France
2
Warren DANIEL, Plant and Ecosystems (PLECO), University of Antwerp, Campus Drie Eiken - C 0.13, Universiteitsplein 1, BE-2610 Wilrijk, Belgium
3
Universidad Autónoma de Chihuahua, Facultad de Zootecnia y Ecología, Periférico Francisco R. Almada Km. 1, Chihuahua 31000, Mexico
*
Author to whom correspondence should be addressed.
Energies 2018, 11(12), 3372; https://doi.org/10.3390/en11123372
Submission received: 30 October 2018 / Revised: 23 November 2018 / Accepted: 29 November 2018 / Published: 2 December 2018

Abstract

:
The development of collective and industrial energy systems, based on wood biomass, knows a significant increase since the end of the 90’s in France, with more than 6000 power plants and heating plants developed currently. Because these systems are built for a minimal duration of 30 years, it is relevant to assess the availability of wood resources according to the potential impacts of global warming on five tree species mainly used in such a supply chain. The assessment of the potential spatial distribution of the suitable areas of these trees in 2050, by using the IPCC (Intergovernmental Panel on Climate Change) RCP6.0 scenario (Representative Concentration Pathway), shows an average decrease of 22% of the plots in comparison with the current situation. The results also point out that mountain areas would maintain a high probability of the development of four tree species. The assessment of the Net Primary Productivity (NPP) underlines a potential decrease for 93% of the plots in 2050, and an increase of this parameter in mountain areas. According to these assumptions, the proposed ecosystem based methodology can be considered as a prospective approach to support stakeholders’ decisions for the development of the wood energy supply chain.

1. Context and Problematic

Wood biomass for energy systems, in order to produce heat or electricity, represents around 40% of the renewable energy production in France [1]. More than 6000 wood based energy installations have been established since the beginning of the 2000s in France [2] for the collective and industrial energy production. The aim of accelerating the development of the wood-energy sector for heating or electricity is to ensure France’s commitments to reduce its greenhouse gas emissions for energy production. This dynamic relies on a regulatory and tax incentive context and the considerable increase in forest areas (+6 million ha in 100 years, reference [3] Figure 1). Currently, this increase of forest coverage is induced by the abandonment of a part of rural activities, mainly located in hills and mountains areas, and by the development of forestry in specific territories. The origins of this rural abandonment are mainly the transformation of the French rural economic model into an industrial economic model, since the 1850, and the impacts of the two world wars on the rural population that induced territorial iniquities between rural and urbanized areas [4]. The post-war baby-boom also favored the migration of the rural population to urban areas in order to earn higher salaries.
This increase of forest areas is essential to ensure the sustainability of combustion systems that are usually planned to operate for a minimum of 25 to 30 years. According to this situation, it seems relevant to assess the vegetation dynamics and productivity trends for 2050 in order to support the sustainability of the wood energy supply chain by taking into account the potential effect of climate change on the wood resource. The fifth report of the Intergovernmental Panel on Climate Change [5] introduced scenarios of increasing the annual average temperature between 1.4 °C and 3.1 °C (baseline 2.2 °C) over a period of 100 years. These scenarios show also heterogeneous variations of precipitations for the future decades according to the different territories. These two parameters of temperatures and precipitations are the main parameters that drive plants’ distribution at regional, national and continental scales [6,7,8]. This climate change should affect the nature and structure of ecosystems (species composition) and, in the same time, the functioning of ecosystems. In this context, some researchers estimated the potential impact of global warming on ecosystem services, like biomass production for bioenergy [9,10,11,12], in Europe and America.
We propose a prospective approach to assess the potential impact of global warming towards 2050 on vegetation dynamics of five tree species, commonly used for energy purposes, and the Net Primary Productivity (NPP). This approach is applied at the scale of France in order to provide the main trends of the expected location of the most suitable areas for the development of these species. The following five tree species have been selected according to their use in the economy of the wood supply chain for energy systems: Fagus sylvatica L. (beech), Populus nigra L. (Italian poplar), Abies alba Mill. (Silver fir), Picea excelsa (Lam.) Lk. (spruce), and Pinus silvestris L. (Scots pine). Other species could be considered, but we want to focus our study on an example of some spontaneous species in France that are well represented and abundant on the territory. Our aim is also to raise the awareness of the stakeholders on the vulnerability due to climate change of these trees and the forest ecosystems where they grow, especially in natural areas where human impacts are minimal (abandoned areas and protected zones).

2. Material and Methods

The assessment of the potential impacts of global warming on the biomass resource requires studying the potential distribution of species and the evolution of the NPP. The developed methodology combines two complementary models:
  • A model to assess the spatial distribution of the most suitable areas, for the current (2015) and future (2050) climate situations, related to the climatic behavior of the selected tree species; and
  • A model of the Net Primary Productivity (NPP) proposed by Leith [13] to assess its variation towards 2050 and for the identification of the potential risk on biomass availability.
We integrate the results of these two models into an index allowing the estimation of the most suitable areas for the development of the five tree species. This index, proposed by [9] and named the Biomass Development Index (BDI), aims to help decision makers to estimate the potential development and use of the forest resource on a territory. Applied for the development of the wood energy supply chain, this index gives information to the different stakeholders to optimize the supply chain by minimizing wood supply risk.

2.1. Model of Suitable Areas Assessment for Plant Growth

Reference [14] developed a probabilistic calibration to quantify the relations of 1874 plants (herbs, shrubs, and trees species) with 72 climatic variables over a period of 50 years in France. The current probabilistic calibration encompasses more than 4000 plants and climatic variables (monthly averages for 30 years of day and night average and extreme temperatures, amount of freezing days, amount of rainy days, and amount of the precipitations) [15,16]. The results of this probabilistic calibration provide a set of 4000 plants able to indicate climatic variables. This set of bio-indicators represents the fundamental basis for modeling the spatial distribution of suitable areas for vegetation on French territory.
The characterization of the climatic behavior of a taxon is based on a probabilistic model taking into account three main ecological assumptions:
  • The effect of an ecological factor on a plant’s frequency follows a unimodal trend, defining an optimum frequency of plant occurrences in a portion of the range of a climatic variable;
  • the effect of an environmental factor on a plant is gradual, even if the distribution of the plant in the range of the climatic variable is intermittent; and
  • a plant is a better indicator of an environmental factor if its occurrences are concentrated in a specific portion of the range of the climatic variable. In other words, if two plants are distributed in the same range of a climatic variable, the most indicative one shows the highest frequencies at one or more levels of the range.
The validation of this probabilistic calibration is based on the calculation of the difference between the observed measures of climate variables and the estimated values by the plants inside the climatic plots. The result of this validation gives an average accuracy of 75% of the bio-indicators of the climatic parameters in France.
The use of the inverse relation allows estimating the probability of occurrence of a plant in the climatic plots. The algorithm selects all the climatic plots that match the climatic range of a plant for all the climatic variables. The next step is the calculation of the average probability of occurrence of a plant into a climatic plot, according to the probability of occurrence of a plant into specific values of climatic variables. This calculation allows identifying the suitable areas for each plant by the calculation of the average probability of occurrence of a plant into the climatic plots. This algorithm assesses the potential distribution of suitable areas for a plant in the territory for the current climate and for the climatic scenario estimated for 2050 and provided by the IPCC members (RCP6.0 scenario—Representative Concentration Pathway). The climatic variables provided by the IPCC and integrated in our model are the monthly average of day and night temperatures and the monthly amount of precipitations. The comparison between the potential spatial distribution of suitable areas for these two periods enables the identification of the potential consequences of the climate change on the spatial distribution of the suitable areas of trees and forests for the future.
One of the most innovative points of this research is to take into account the behavior of a species when it is abundant: This parameter of abundance of a species allows estimating the spatial distribution of dense coverage of the trees at the scale of France. This methodology has been evaluated in a previous publication at a local scale [9,15,16] and needs to be evaluated at a national scale. The validation step compares the potential spatial distribution of the suitable areas for the tree species, according to the current climate, with the map of distribution of each species provided by the IFN (National Forest Inventory). The IFN data are not implemented into the vegetation database and, for this reason, they can be considered as independent data.
Figure 2 shows the maps of the most suitable area of the five tree species (with three levels of probabilities) and it presents the map of their observed distribution according to the IFN data. A simple observation of these maps shows that the observed distribution of the species is mainly located in the high level of probabilities of occurrence of the suitable areas, which confirms the relevance of the model.
Table 1 shows the quantitative results of this comparison: It points out that the observed populations of these tree species are mainly distributed into the high values of probabilities (form 68% to 91%, with an average of 78% of the IFN plots), and between 9% and 32% in the average level of probabilities (with an average of 20% of the IFN plots).
Only 1 to 2% of the IFN plots’ distribution is located in the low probabilities of occurrence of the suitable areas for the five species. It is important to explain that for some of the populations located into a low level of probabilities, or into areas without probabilities of occurrence, are the most often tree plantations, like it is the case for Spruce (Picea excelsa (Lam.) Lk.) that was introduced in Brittany after 1750 [17] and this tree has difficulties to develop in some areas of this territory [18]. This validation step has demonstrated that the methodology to assess the potential suitable areas of the species with climatic data is relevant. This methodology can be applied with the RCP 6.0 scenario provided in the last IPCC report [5] to assess the possible consequences of global warming on the distribution of the suitable areas for these five species and for the NPP. We selected the RCP 6.0 scenario because this scenario is considered as an average scenario.
The first part of the results deal with the climate change impact on the species distribution in France. This scale allows identifying gradients of probabilities of occurrence of suitable areas for the five tree species for the current climate and for 2050.
Figure 3 presents the maps of the potential distribution of the suitable areas for the five trees in 2015 and 2050. The first observation of these maps shows a potential contraction of the spatial distribution of the suitable areas for each species in 2050. This phenomenon affects especially the levels of high probabilities of occurrence, except for the Italian poplar that may have an increase of plots in the level of high probabilities of occurrence.
Figure 4 and Table 2 underline these results by the use of statistics about the amount of plots of potential suitable areas in 2015 and 2050 for each species.
Table 2 shows an average 22% loss of plots of potential suitable areas for the five species in 2050. There are some differences of the potential distribution of suitable area between the species:
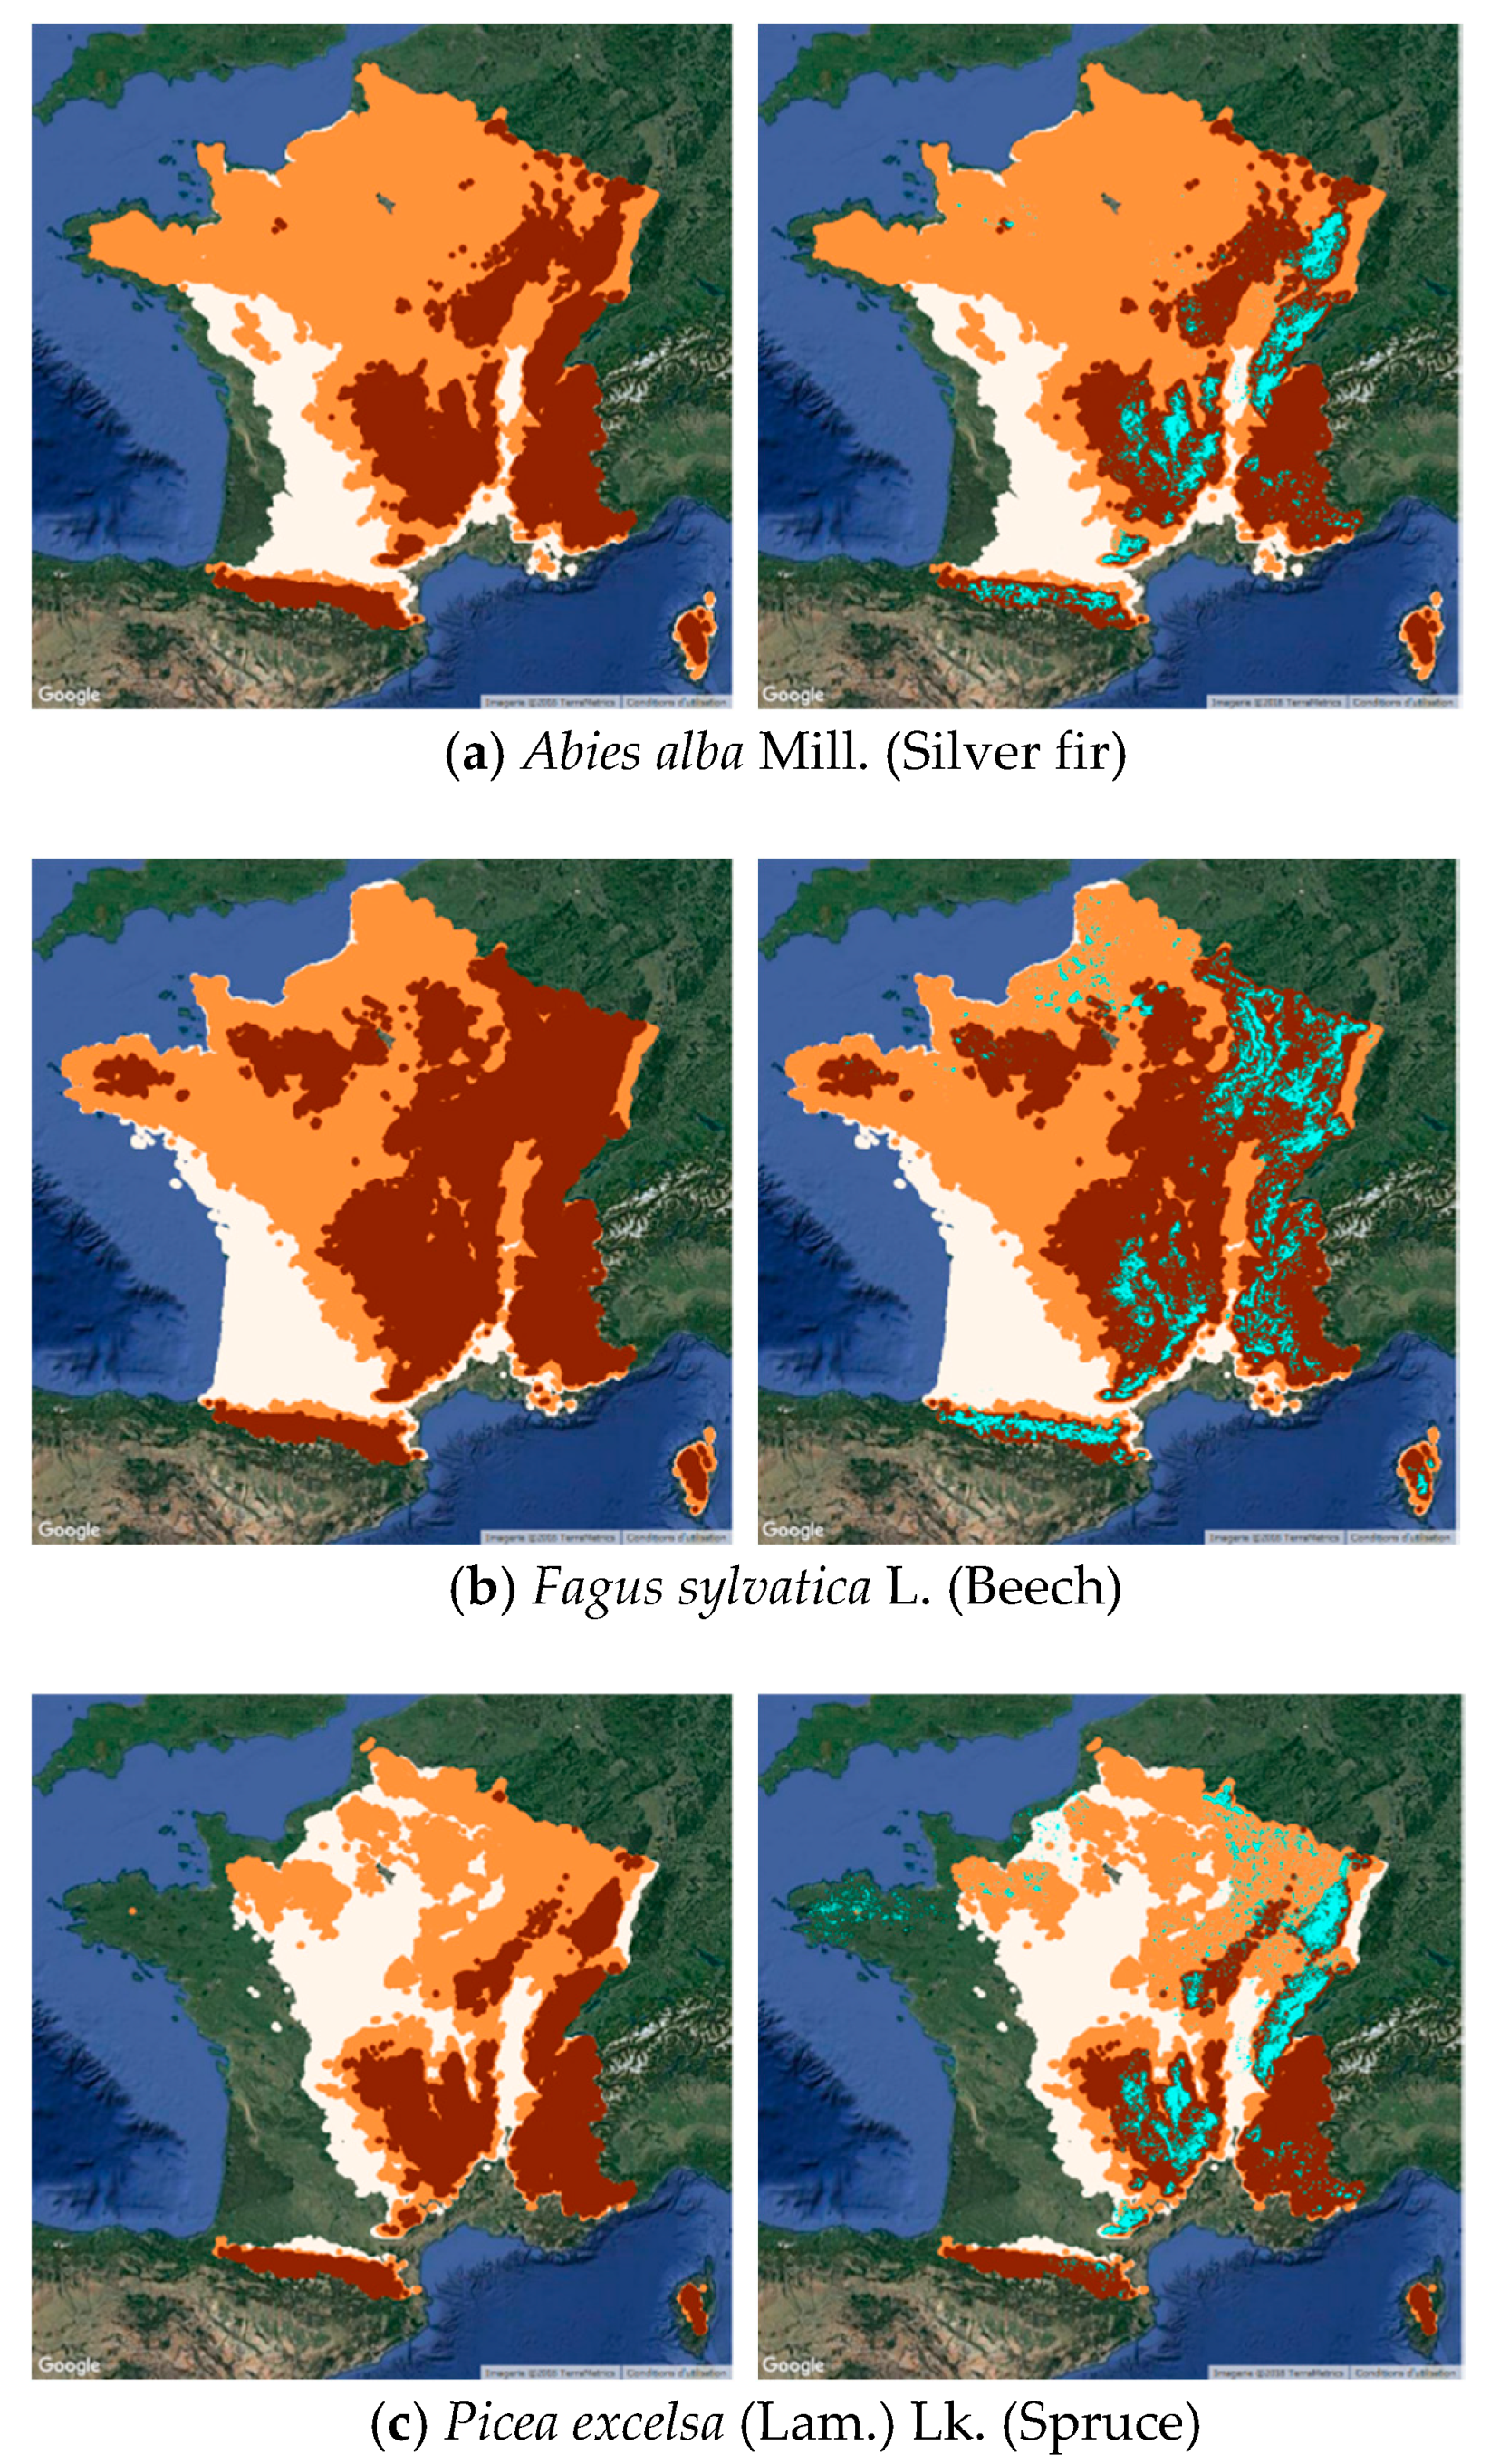
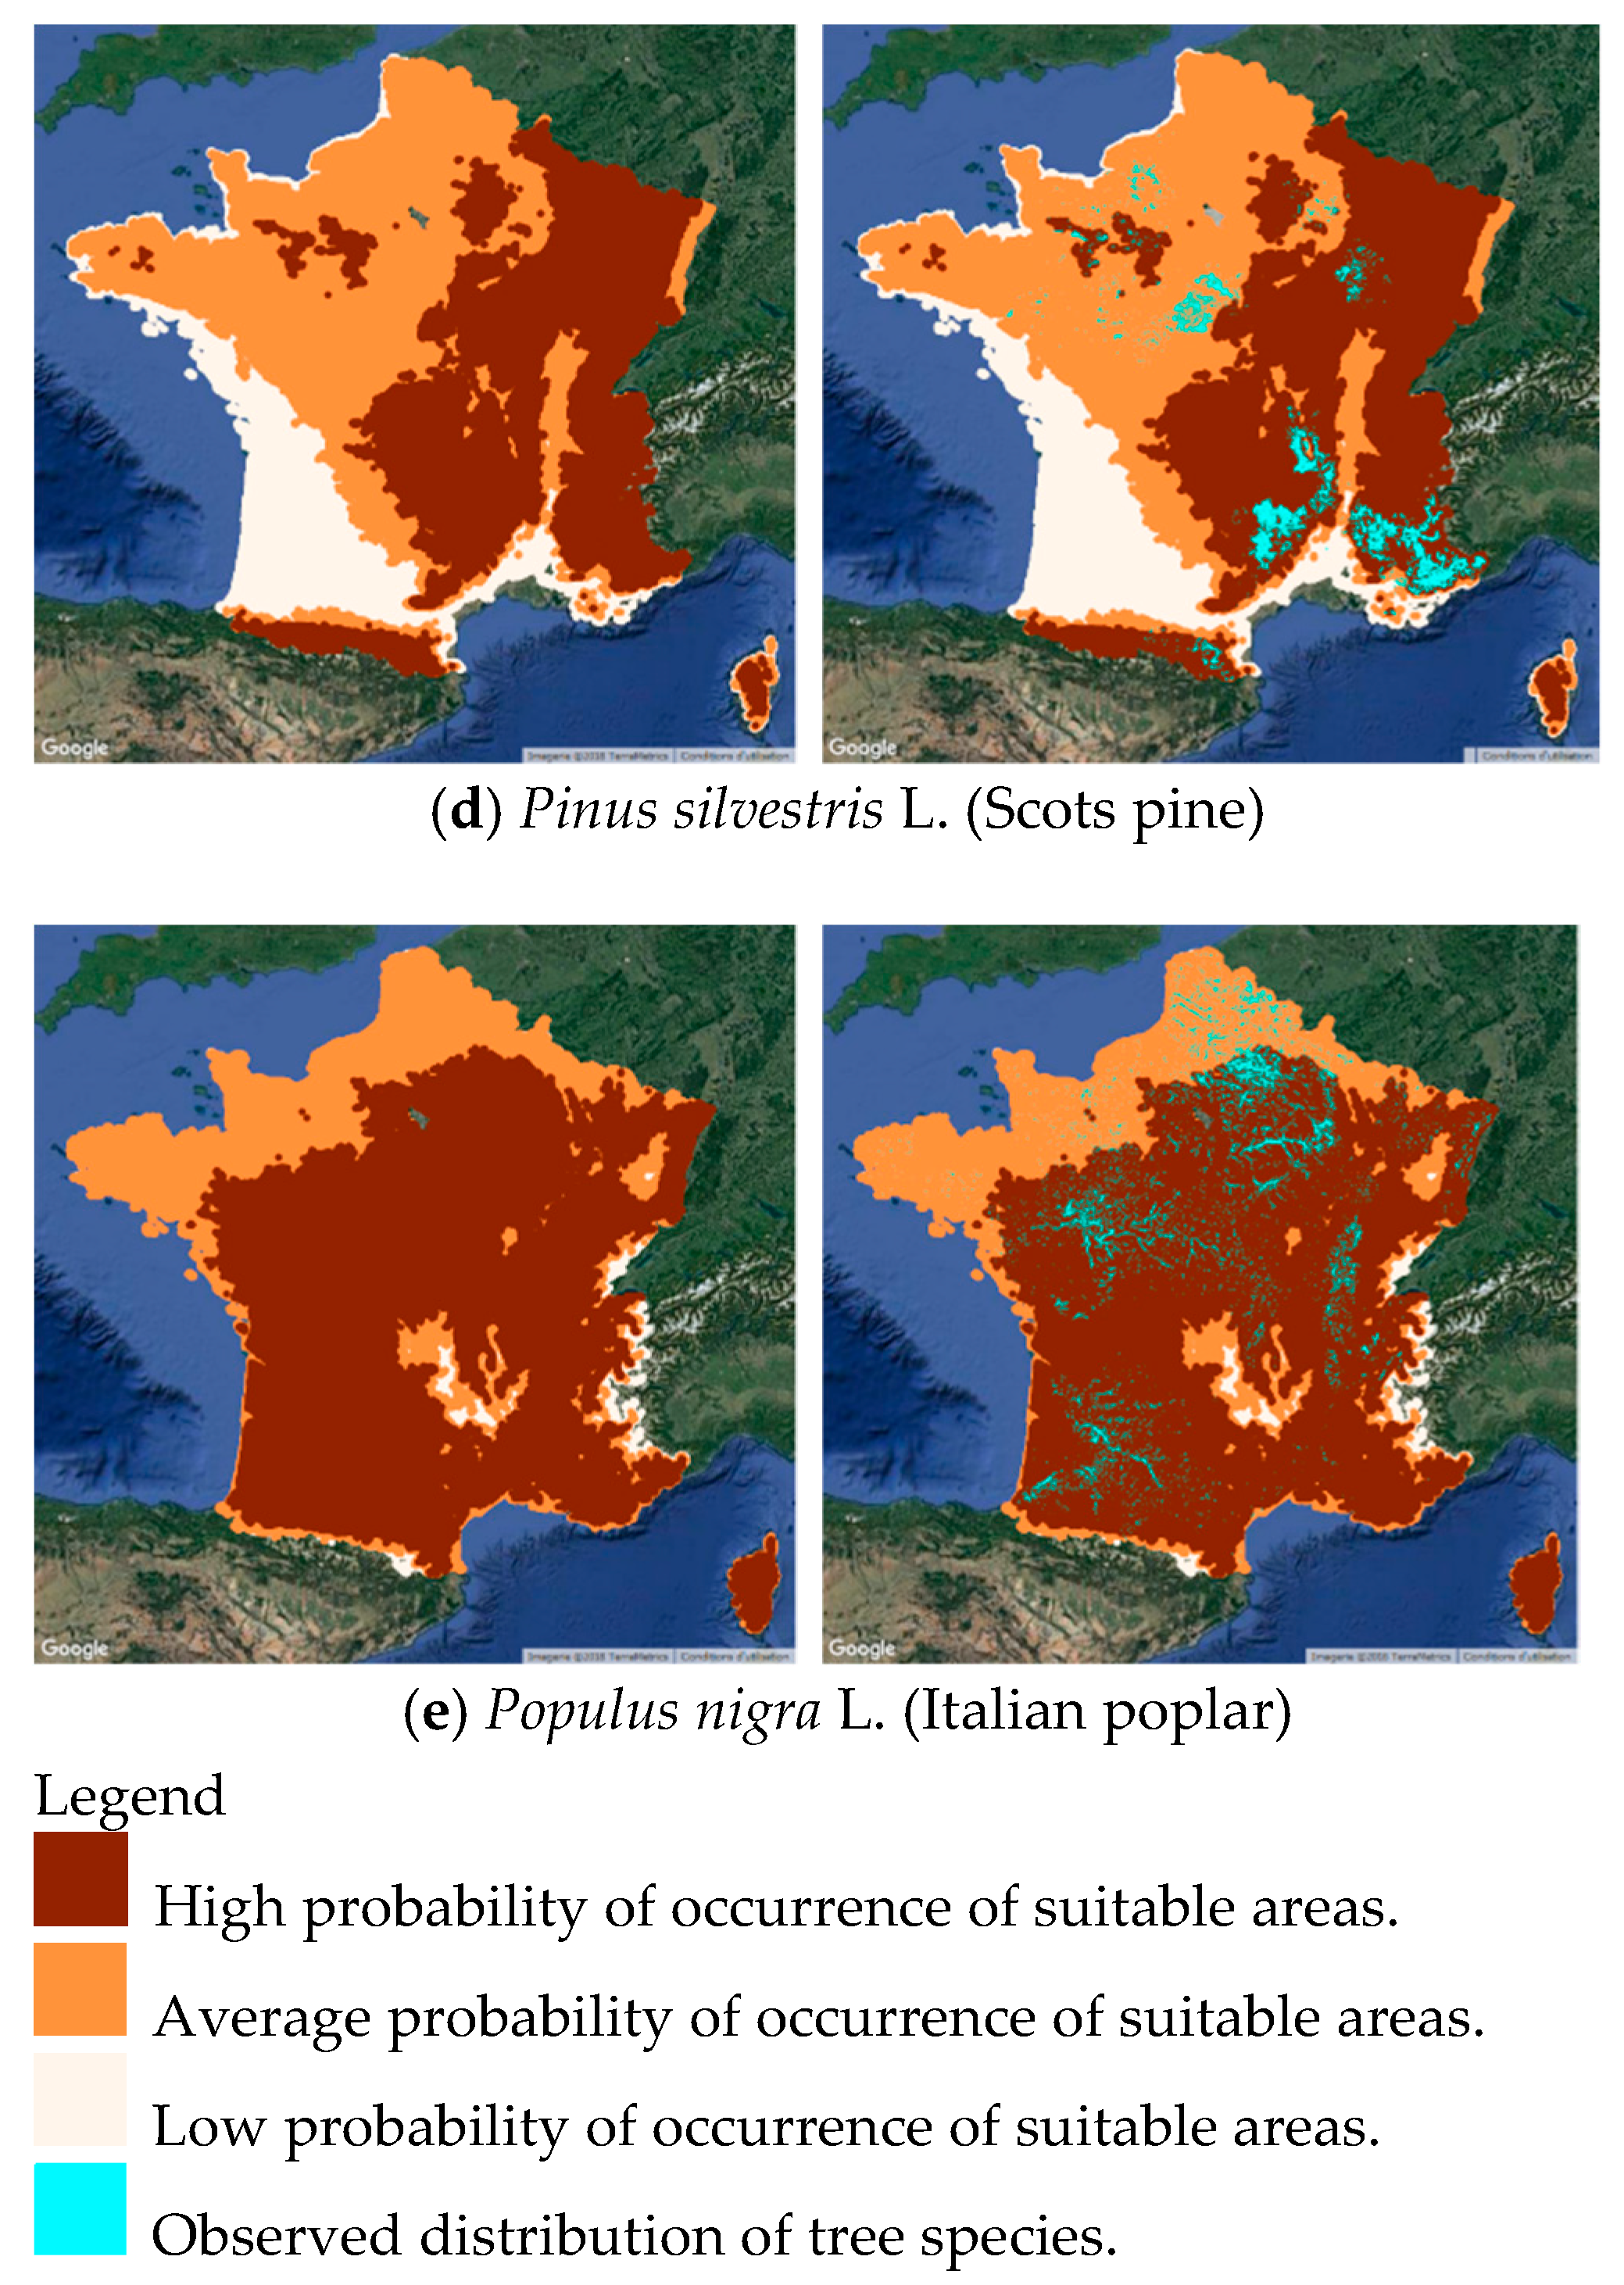
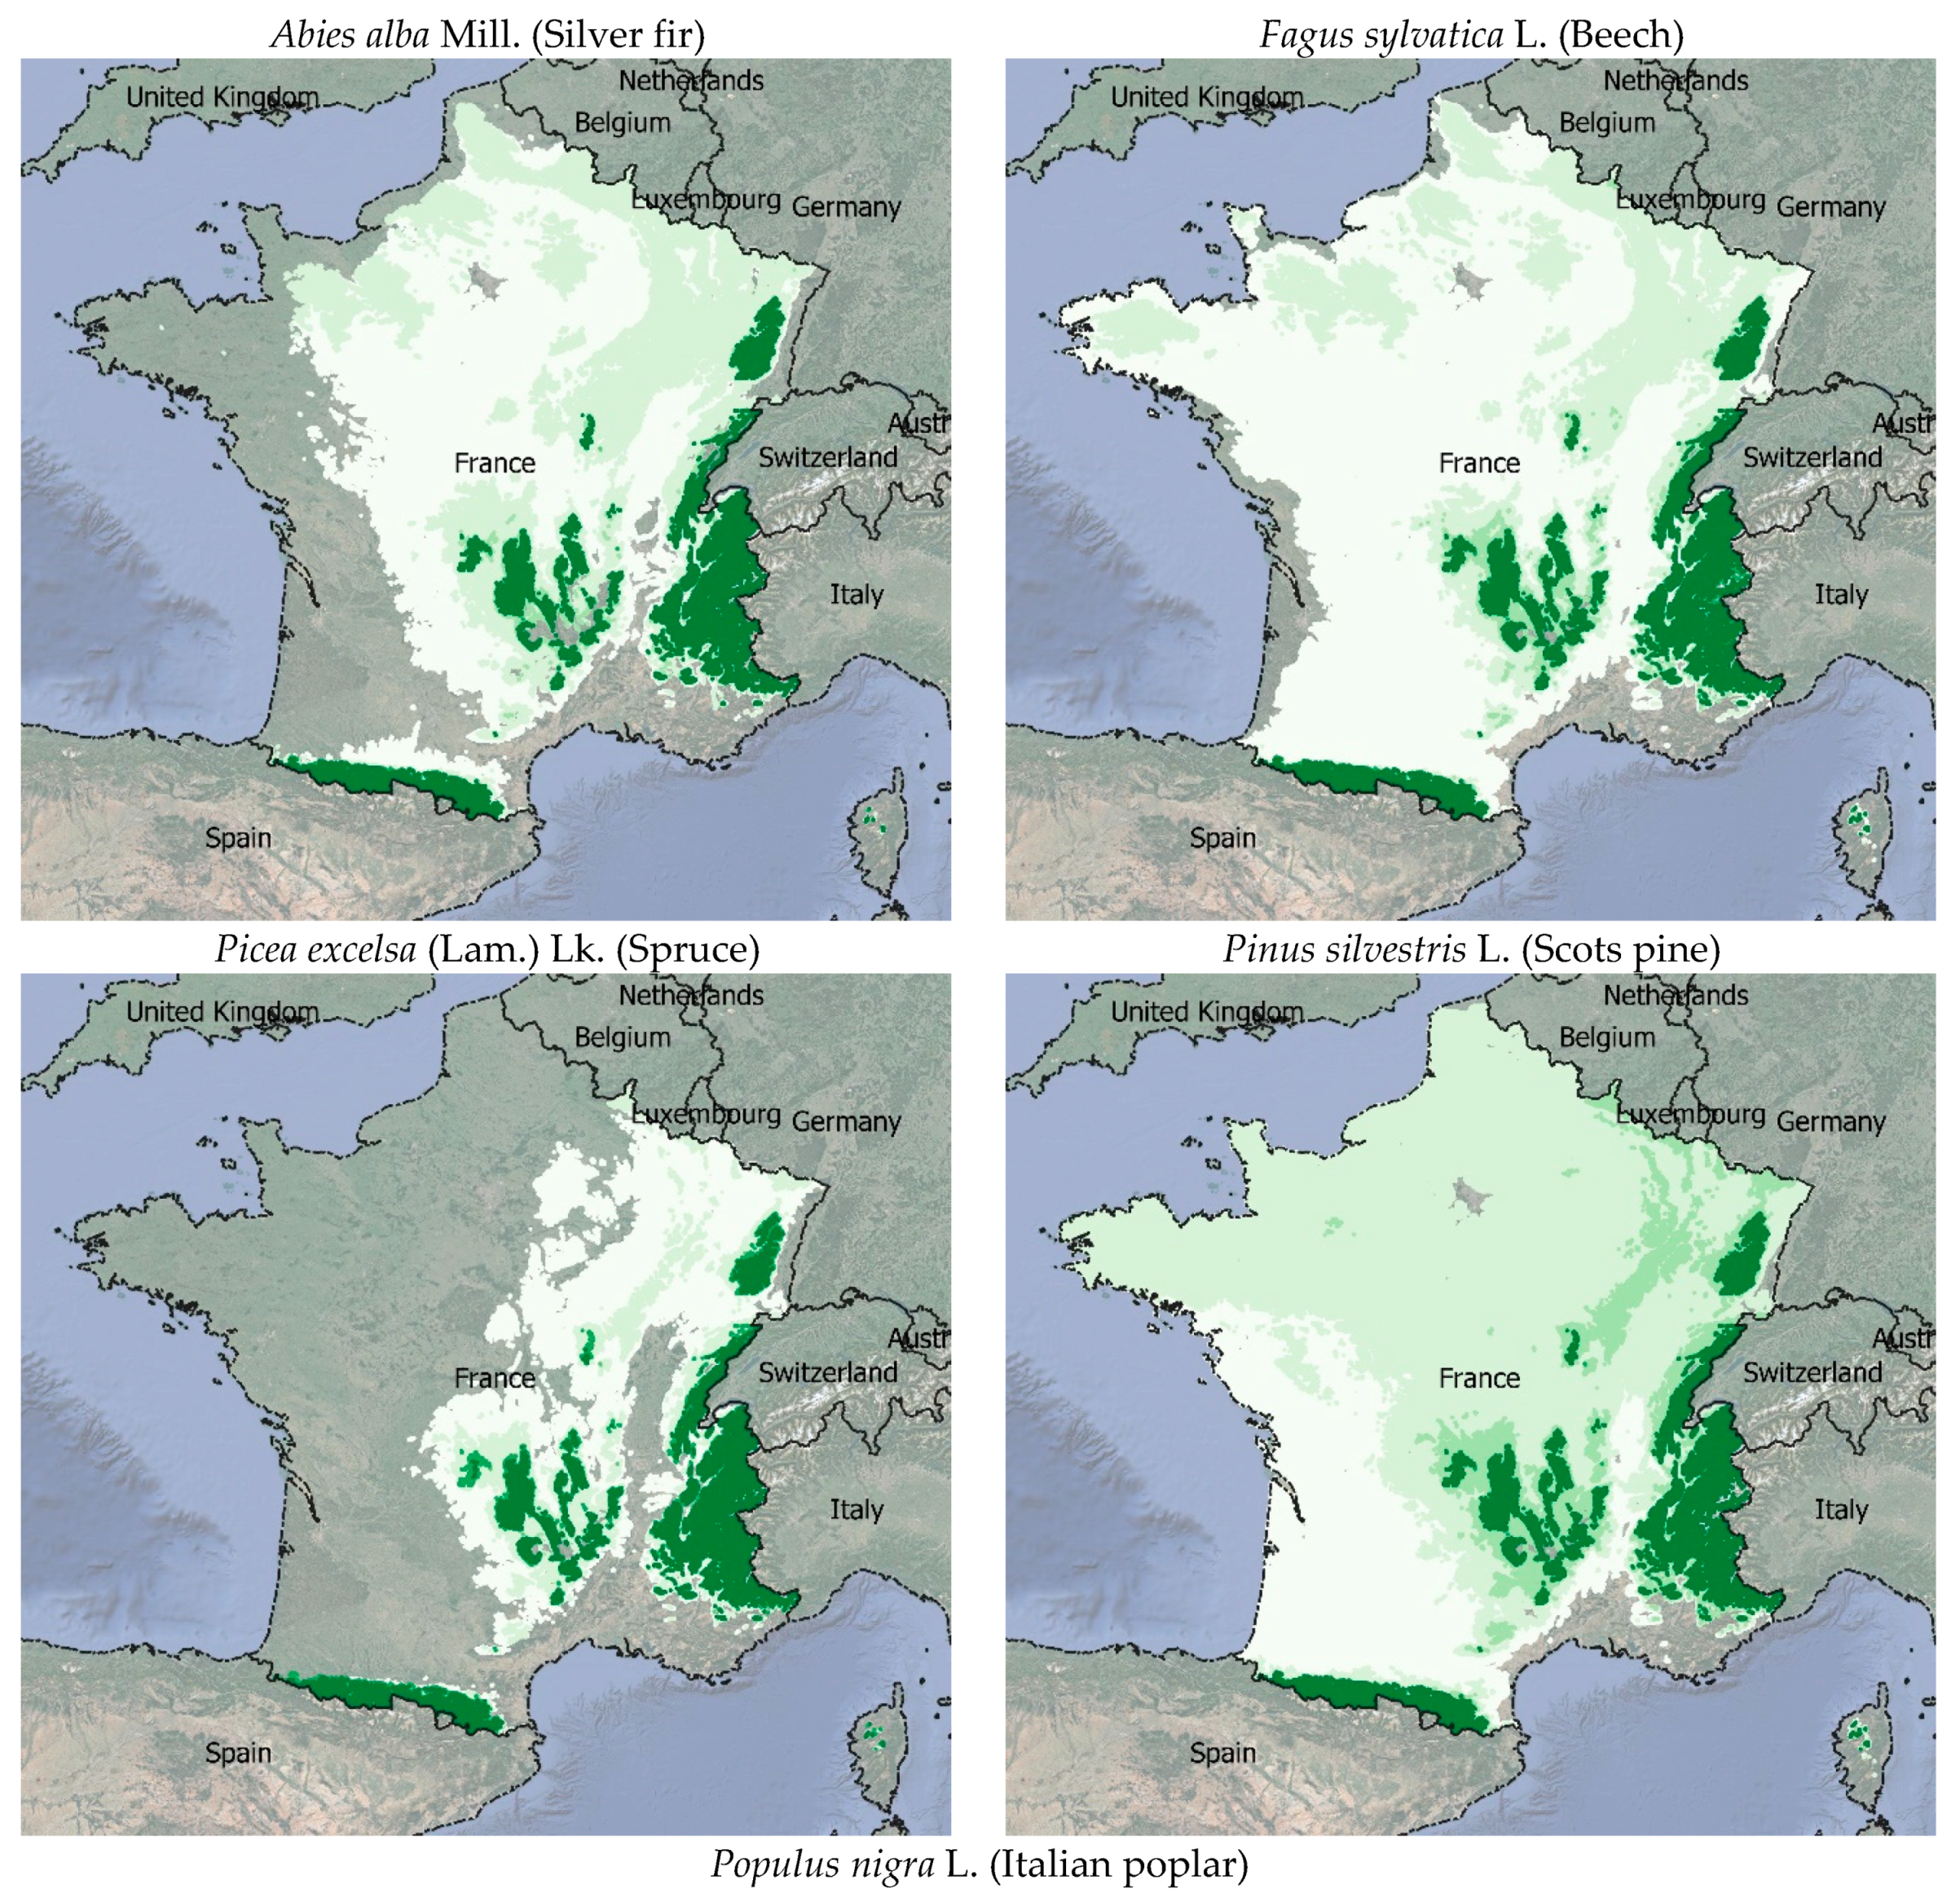
  • Silver fir may have a decrease of 29% of the total amount of its suitable areas, with a decrease of 61% in high probable areas and a decrease of 64% in average probabilities. There could be an increase of 63% of low probabilities to find suitable areas for this tree. This result underlines a risk of reduction of the areas of this tree and a potential risk of stress in the locations where this species is observed currently and should not find a high level of probabilities of suitable areas in 2050;
  • Scots pine and beech may have a low decrease of their amount of suitable areas (−11% and −7%). However, this decrease would affect only high probabilities to find suitable areas for these taxa. A potential increase of the average of low probabilities could be possible in the future. These results attest a risk for these trees in terms of stress in the areas where the probabilities to find a suitable environment may decrease in the future;
  • Spruce may have a significant decrease (−53%) of its probabilities to find suitable areas in 2050, especially for high and average probabilities (−58% and −71%, respectively), which could underline a high risk for this species to expand and to grow in the half part of its current distribution; and
  • Italian poplar could have a little decrease (−8%) of the potential suitable areas, but this reduction should affect only low and average probabilities. This tree may have an increase of its high probabilities (+11%) to find suitable areas that may compensate the decline of some probabilities of occurrence.
The second part of the results deals with the potential impact of global warming on the evolution of NPP.

2.2. Model of Net Primary Productivity Assessment

The net primary productivity (NPP) of an ecosystem is the production of biomass that all photosynthetic organisms of this ecosystem produce per unit area and per unit time. It depends on the nature of exploited ligneous species, and environmental factors (nutrition, water, and energy conditions related to climate and soil. The main determining physical factors are temperature and water availability. In the early 70 s, Lieth proposed a model of climatic NPP integrating this pair of variables: The Miami Model [13]. This model was the first global scale empirical model of terrestrial ecosystems’ productivity where NPP was considered as a function of the annual mean temperature, T (in degrees Celsius), and annual mean precipitation, P (in mm).
The model equation is:
NPP = min (NPPT, NPPP)
NPPT = 3000 × (1 + e(1.315 − 0.119 × T))−1
NPPP = 3000 × (−e(−0.000664 × P))
Thanks to the Miami Model equation, temperature, and rainfall data, we estimated the current NPP and the NPP for 2050 with global warming scenarios provided by [4].
For the current climate, Figure 5 shows that the highest values of NPP are mainly located in the hills and mountains of a large part of the territory. It also shows that low and average values are more located in the plains and hills of the Mediterranean area, a large part of the oceanic area, and in the North and North East areas of the country.
For 2050, according to the RCP6.0 scenario, a decrease of high levels of NPP could occur, but an increase of NPP could be observed in mountain areas, as it is shown with the calculation of the difference between the 2015 and 2050 values of NPP.
Table 3 underlines the potential decrease of NPP for almost 93% of the plots in France in 2050, and a potential increase of NPP only for 7% of the plots, mainly located in hills and mountain areas.

3. Results and Discussion on the Potential Development and Use of the Five Tree Species for Energy Purpose within 2050

The identification of the territories that would be suitable for the development of the wood energy supply chain is based on the use of a spatial index, named the Biomass Development Index – BDI [9]. This index combines the probabilities of occurrence of the suitable areas for the five tree species and the level of NPP. In this frame, the best areas for the development of the supply chain in the future will be the one where the probabilities of occurrence of trees are the highest, and where the NPP is also at the maximum.
The spatial index of biomass development is based on this formula:
BDI = PVT × NPP
where:
PVT = probability of occurrence of the suitable areas for the five tree species. This variable is discretized into the following modalities: 1 (low probability), 2 (medium probability), and 3 (high probability).
NPP = the values are discretized into three classes: 1 (low NPP), 2 (medium NPP), and 3 (high NPP).
Figure 6 presents the maps of BDI for the five tree species selected in our research.
The maps of BDI show for Abies alba Mill. (Silver fir), Fagus sylvatica L. (beech), Picea excelsa (Lam.) Lk. (spruce), and Pinus silvestris L. (Scots pine) that the best suitable areas in 2050 for their development and the development of the wood energy supply chain (classes 6 and 9 of the BDI) should be mainly located in the hills and mountains in the Alps, Massif Central, and the Pyrenees. The lowest classes of the BDI should be distributed in the plains, hills, base of mountains, and valleys of other territories of France. For Populus nigra L. (Italian poplar), the situation should be different with almost the loss of areas with high and very high probabilities of development and productivity of forest (classes 6 and 9 of the BDI). Only classes 3 and 4 of the BDI (areas with a slightly low or a medium probability of forest development and productivity) should be well represented in 2050, especially in mountain areas with a BDI equal to 4.
Table 4 gives the amount and percentages of plots according to the BDI classes and for each tree species. For each percentage, we calculate the uncertainty (δ%) of the potential distribution of the suitable areas by considering the accuracy level of the climatic calibration for each species. When δ% is not mentioned, it means that this parameter is negligible.
These statistics underline that:
  • Abies alba Mill. (Silver fir), Fagus sylvatica L. (Beech), and Pinus silvestris L. (Scots pine): These three species should have around 90% of their plots distributed in very low and low BDI classes. They would have, respectively, 10%, 7%, and 6% of their plots that should be located into the highest classes of the BDI in 2050 (high and very high probabilities of development and productivity of forest);
  • Picea excelsa (Lam.) Lk. (Spruce): This tree should have around 80% of its plots distributed in very low and low BDI classes in 2050 and 21% of its plots distributed into high and very high levels of BDI; and
  • Populus nigra L. (Italian poplar): This tree should have around 95% of its plots located into areas with a slightly low or a medium probability of development and productivity of forest (BDI levels 3 and 4) in 2050. Unlike the other four tree species, Italian poplar should have less than 2% of its plots located into high levels of BDI in 2050, which would represent a significant issue for the development and use of such a species for energy purposes.
The results have pointed that global warming, established with the RCP6.0 IPCC scenario, may have a significant effect for both trees’ spatial distribution and NPP towards 2050. They show the potential decrease of suitable areas for the five tree species in 2050, with an average plot loss of 22%. The model of NPP also underlines a potential decrease of NPP for almost 93% of the plots in the whole country.
Other studies [10,11,12] have assessed the potential consequences of global warming on bioenergy crops in Europe and North America. The methodology of this research is based on the use of characterization of bioclimatic envelops of each species, and the calculation of the areas that would be suitable or not suitable for their growth according to climate data.
In our study, we also considered other elements for the purposes of determining the potentiality of the development of the supply chain: Firstly, the climatic characterization of plants in France is based on a probabilistic calibration, which is a very accurate methodology to perform bio-indicators of climatic variables. The model to assess the suitable areas of each species has been validated with data from the National Forest Inventory. Secondly, we also estimated the evolution of the NPP in order to assess the ecosystem productivity. We have identified a potential decrease of NPP in almost 93% of the whole country. Other studies have shown a decrease of NPP in the case of drought and heat waves for the current climate [19,20,21,22] and for the future [23]. Reference [24] gave a comprehensive review of observed and potential impacts of climate change on growth, productivity, and suitability of species for both current and future climate on forest ecosystems through Europe. These authors mentioned the current decline of radial growth of beech in France and in Spain and the migration of some tree species that need to find suitable areas for their growth. According to the scenarios of climate warming, they underline the interest to take into account CO2 atmospheric concentration in the models to predict the NPP in Europe, even if some uncertainties remain on the capability of tree species to use this increase of CO2 resource for their growth. In the case of constant CO2 concentration, many places may have a decrease of NPP due to the global warming, but, if this parameter is integrated into the model, a lot of forest areas may have an increase of their NPP, apart some places from the south of the European continent where water resources limit their growth. Tree species’ response to global warming for the spatial distribution of their suitable areas shows a potential shift in Northern latitudes or in higher altitudes, and a probable reduction in Central and Southern Europe towards 2100. Reference [25] argued that the growth of silver fir and scots pine will be altered within the end of the century due to the effect of warm and dry conditions in the North-East part of Spain. The results of their projections for these two species show a potential dieback and contraction of the spatial distribution in the most thermophilous areas of their study. This result questions our model and our results on the probable similarities of the future ecological situations for these two species in France in 2050.
More specifically, in France, regarding the 2003 heat wave episode, reference [26] argued that this phenomenon induced an increase of foliage loss and branch mortality for some tree species, like scots pine. Other studies attested the role of drought in the decrease of radial growth for silver fir [27] and beech [28]. These studies underline the role of temperature increase and precipitation decrease on the reduction of NPP and the increase of the death rate of trees. Reference [29] also published a study based on the use of models estimating the annual carbon storage in forests under different management scenarios according to the current climate and the scenario of climate change for 2050 (RCP 8.5). The results show that in France, independently of the forest management technics, climate change will induce a significant decrease of forest productivity in comparison with the current climatic situation. Reference [30] focused their study on the Mediterranean area showing the potential impacts of global warming on the reduction of stem growth of some oaks, even if the concentration of atmospheric CO2 will increase. The authors also mention the uncertainty related to this parameter and to the acclimation process that the trees may know within the end of the 21st century.
The current development of collective energy systems based on wood biomass in France will have to face this phenomenon (wood biomass production reduction) if these trends will be observed in the future. However, in some parts of the French territory, especially in mountain areas, these tree species will be able to grow well in the future. This potential shift of suitable areas in mountain areas for these five species must be considered for the development of the supply chain in order to establish new management planning of forest resources. Researches on supply chain optimization for the use of wood as a fuel are mainly based on the integration of different parameters, like the distance from the wood resource to the road network or the cost of transportation and processes, and some physical parameters of the territory, like the slopes that constrain the accessibility to the resource [31,32,33,34,35,36,37,38]. These parameters (transportation costs, distances, slopes…) can have a significant impact on the price of the wood biomass delivered to the collective and industrial energy systems. For this reason, these parameters are often implemented into a set of models (based on linear or nonlinear programming, heuristic approaches, multicriteria decision analysis etc.) dedicated to the optimization of the supply chain according to the market of wood biomass. These models integrate also the availability and accessibility of the wood biomass, which is a key factor to ensure a sustainable business model. They can estimate the distance thresholds to consider the wood supply to the heating and power plants to minimize the transportation costs.
However, these models do not explicitly consider the potential shift of suitable areas for the tree species and/or the potential variation of their NPP through 2050. Therefore, it seems to be relevant to take into consideration the estimation of the spatial variation of suitable areas for trees’ growth to anticipate the potential effects of global warming on wood resource availability and accessibility. Variations of distances from resources to energy systems and wood availability in a few decades can have impacts on the market of wood resources. In this context, our results can contribute to optimize the supply chain and help stakeholders to select the best areas to establish the energy systems by considering the parameters that influence the cost of biomass, like the distances between the wood resource, the biomass platform, and energy systems.
A last point must be mentioned: The spatial distribution of natural protected areas. Many of the National and Regional Parks and other Natura 2000 sites are located in French mountain areas. This fact may induce a reduction of the potential availability of the resource in the future for an energy purpose.

4. Conclusions and Perspectives

The short and mid-term availability of the wood resource, which favors a short economic cycle and needs to assess local energy needs, is strategic for the industry and municipal boards because energy systems based on wood resources are developed for at least 30 years.
This study shows the necessity to evaluate the potential impact of climate change on the availability of the wood resource to optimize the development of the wood energy supply chain in France. Our results estimate a potential reduction of suitable areas for the five species for 2050, with a significant shift of these areas. These assumptions, if they will be observed in the future, allow identifying the spatial distribution of areas where these species may know constraints or opportunities to survive and to grow.
The problem of wood resources must also be related to the increase of the vulnerability of forests to wildfires due to the impact of climate warming [39,15,16]. This hazard may increase in frequency and spatial representation in the future. The development of biomass extraction for the wood energy supply chain should represent a way, among others, to reduce the amount of fuel in natural areas and help the territory to be more resilient. The potential impacts of climate change on forest areas thus require developing adaptation strategies based on forest management techniques and decisions that must be elaborated by involving researchers, forest managers, industries, institutions, and territorial administrations [40]. According to this author and to our opinion, the adaptation of forest management to global warming impacts based on multidisciplinary researches needs to be developed and expanded.
The presented approach here follows this aim because it can help decision makers and stakeholders to ensure the ecological transition of the energy production of the French territory with a prospective frame. These results could be integrated into a global risk assessment approach with a prospective dimension in order to support the sustainability of the wood energy supply chain. The results mainly claim to a potential contraction of suitable areas and, in this frame, it should be also interesting to assess the potential colonization of invasive species of trees and their effects on both biodiversity and ecosystem services in the perspective of the development of wood energy systems. The corollary of this research is the need to develop management strategies to adapt forests to global warming and ensure a sustainable use of the wood resource.

Author Contributions

E.G. contributed to the general redaction of the paper, the model of plants probable distribution, the definition of the Biomass Development Index (BDI) and the statistical analysis of all data. W.D. contributed to the general redaction of the paper and the model Net Primary Productivity (NPP). G.H.M. contributed to the general redaction of the paper and the statistical analysis of all data.

Funding

This research received no external funding.

Conflicts of Interest

The authors declare no conflicts of interest.

References

  1. Cavaud, D.; Coléou, Z.; Guggemos, F.; Reynaud, D. Chiffres clés des énergies renouvelables; Service de l’observation et des statistiques (SOeS): Nancy, France, 2017; p. 76. (In French) [Google Scholar]
  2. CIBE. Retour sur la saison de chauffe: bilan sur l’approvisionnement. Enjeux et perspectives: Recensement des installations, Bilan du Fond Chaleur, Valorisation des cendres; Comité interprofessionnel du Bois Energie (CIBE): Paris, French, 2017; p. 22. (In French) [Google Scholar]
  3. IGN. La forêt française: Etat des lieux et évolutions récentes. Panorama des résultats de l’inventaire forestier; Institution National de L’information Geographique et Forestiere: Paris, French, 2018; p. 56. (In French) [Google Scholar]
  4. Talandier, M.; Jousseaume, V.; Nicot, B.-H. Two centuries of economic territorial dynamics: The case of France. Reg. Stud. Reg. Sci. 2016, 3, 67–87. [Google Scholar] [CrossRef]
  5. IPCC. Climate Change 2014: Impacts, Adaptation, and Vulnerability, Part B: Regional Aspects; Cambridge University Press: Cambridge, UK, 2014; p. 696. [Google Scholar]
  6. Woodward, F.I. Climate and Plant Distribution; Cambridge University Press: Cambridge, UK, 1987; p. 174. [Google Scholar]
  7. Ozenda, P.; Borel, J.-L. An Ecological Map of Europe: Why and How? C. R. Acad. Sci. Ser. II Sci. Vie 2000, 323, 983–994. [Google Scholar] [CrossRef]
  8. Thuiller, W.; Lavorel, S.; Sykes, M.T.; Araújo, M.B. Using niche-based modelling to assess the impact of climate change on tree functional diversity in Europe. Divers. Distrib. 2006, 12, 49–60. [Google Scholar] [CrossRef]
  9. Garbolino, E.; Daniel, W.; Hinojos Mendoza, G.; Sanseverino-Godfrin, V. Anticipating climate change effect on biomass productivity and vegetation structure of Mediterranean Forests to promote the sustainability of the wood energy supply chain. In Proceedings of the 25th European Biomass Conference and Exhibition, Stockholm, Sweden, 12–15 June 2017; pp. 17–29. [Google Scholar]
  10. Barney, J.N.; Di Tomaso, J.M. Bioclimatic predictions of habitat suitability for the biofuel switchgrass in North America under current and future climate scenarios. Biomass Bioenergy 2010, 34, 124–133. [Google Scholar] [CrossRef]
  11. Bellarby, J.; Wattenbach, M.; Tuck, G.; Glendining, M.J.; Smith, P. The potential distribution of bioenergy crops in the UK under present and future climate. Biomass Bioenergy 2010, 34, 1935–1945. [Google Scholar] [CrossRef]
  12. Tuck, G.; Glendining, M.J.; Smith, P.; House, J.I.; Wattenbach, M. The potential distribution of bioenergy crops in Europeunder present and future climate. Biomass Bioenergy 2006, 30, 183–197. [Google Scholar] [CrossRef]
  13. Lieth, H. Modelling the primary productivity of the world, nature and resources. Indian For. 1972, 98, 327–331. [Google Scholar]
  14. Garbolino, E.; De Ruffray, P.; Brisse, H.; Grandjouan, G. Relationships between plants and climate in France: Calibration of 1874 bio-indicators. C. R. Biol. 2007, 330, 159–170. [Google Scholar] [CrossRef]
  15. Garbolino, E. Les bio-indicateurs du climat: Principes et caractérisation; Presses des MINES: Paris, French, 2014; p. 129. (In French) [Google Scholar]
  16. Garbolino, E.; Sanseverino-Godfrin, V.; Hinojos-Mendoza, G. Describing and predicting of the vegetation development of Corsica due to expected climate change and its impact on forest fire risk evolution. Saf. Sci. 2016, 88, 180–186. [Google Scholar] [CrossRef]
  17. Abbayes, H.R. Les conifères introduits en Bretagne. Penn Ar Bed 1966, 46, 262–274. (In French) [Google Scholar]
  18. Pourtet, J.; Duchaufour, P.; Duval, A. Notes forestières sur la Bretagne et le Cotentin; Ecole Nationale des Eaux et des Forêts: Nancy, France, 1947; p. 51. (In French) [Google Scholar]
  19. Ciais, P.; Reichstein, M.; Viovy, N.; Granier, A.; Ogeé, J.; Allard, V.; Aubinet, M.; Buchmann, N.; Bernhofer, C.; Carrara, A.; et al. Europe-wide reduction in primary productivity caused by the heat and drought in 2003. Nature 2005, 437, 529–533. [Google Scholar] [CrossRef] [PubMed]
  20. Fink, A.H.; Brücher, T.; Krüger, A.; Leckebusch, G.C.; Pinto, J.G.; Ulbrich, U. The 2003 European summer heatwaves and drought? Synoptic diagnosis and impacts. Weather 2004, 59, 209–216. [Google Scholar] [CrossRef] [Green Version]
  21. Reichstein, M. Severe Impact of the 2003 European Heat Wave on Ecosystems. Available online: https://www.pik-potsdam.de/news/press-releases/archive/2005/severe-impact-of-the-2003-european-heat-wave-on-ecosystems (accessed on 20 April 2018).
  22. Niu, S.; Luo, Y.; Li, D.; Cao, S.; Xia, J.; Li, J.; Smithe, M.D. Plant growth and mortality under climatic extremes: An overview. Environ. Exp. Bot. 2014, 8, 13–19. [Google Scholar] [CrossRef]
  23. Fischer, E.M. The Role of Land–Atmosphere Interactions for European Summer Heat Waves: Past, Present and Future. Ph.D. Thesis, ETH Zurich, Zurich, Switzerland, 2007. [Google Scholar]
  24. Lindner, M.; Fitzgerald, J.B.; Zimmermann, N.E.; Reyer, C.; Delzon, S.; van der Maaten, E.; Schelhaas, M.J.; Lasch, P.; Eggers, J.; van der Maaten-Theunissen, M.; et al. Climate change and European forests: What do we know, what are the uncertainties, and what are the implications for forest management? J. Environ. Manag. 2014, 146, 69–83. [Google Scholar] [CrossRef] [PubMed]
  25. Sánchez-Salguero, R.; Camarero, J.J.; Gutiérrez, E.; González Rouco, F.; Gazol, A.; Sangüesa-Barreda, G.; Andreu-Hayles, L.; Linares, J.C.; Seftigen, K. Assessing forest vulnerability to climate warming using a process-based model of tree growth: Bad prospects for rear-edges. Glob. Chang. Biol. 2017, 23, 2705–2719. [Google Scholar] [CrossRef] [PubMed]
  26. Favre, C.-M.; Renaud, J.-P. Réseau systématique de suivi des dommages forestiers. Observations de la campagne 2006. Available online: https://www.google.com.sg/url?sa=t&rct=j&q=&esrc=s&source=web&cd=1&ved=2ahUKEwjZtdrTlPneAhVIw7wKHfoaDZEQFjAAegQICRAC&url=http%3A%2F%2Fagriculture.gouv.fr%2Ftelecharger%2F45428%3Ftoken%3D09f7c633f8ded65b4263945ce104bd02&usg=AOvVaw3612bwWdfN8PPS1fLJDtlJ (accessed on 29 October 2018).
  27. Lebourgeois, F.; Gomez, N.; Pinto, P.; Mérian, P. Mixed stands reduce Abies alba tree-ring sensitivity to summer drought in the Vosges mountains, western Europe. For. Ecol. Manag. 2013, 303, 61–71. [Google Scholar] [CrossRef]
  28. Cailleret, M.; Dvi, H. Effects of climate on diameter growth of co-occurring Fagus sylvatica and Abies alba along an altitudinal gradient. Trees 2011, 25, 265–276. [Google Scholar]
  29. IGN. The Role of Fench Forests and the Forestry Sector in Climate-Change Mitigation. Opportunities and Deadblocks by 2050. Summary of a Case Study Conducted by INRA and IGN for the Ministry of Agriculture and Food—June 2017. Available online: https://inventaire-forestier.ign.fr/IMG/pdf/419860-c1d9a-resource-etude-forets-bois-changement-climatique-resume-anglais.pdf (accessed on 29 October 2018).
  30. Lempereur, M.; Martin-StPaul, N.K.; Damesin, C.; Joffre, R.; Ourcival, J.M.; Rocheteau, A.; Rambal, S. Growth duration is a better predictor of stem increment than carbon supply in a Mediterranean oak forest: Implications for assessing forest productivity under climate change. New Phytol. 2015, 207, 579–590. [Google Scholar] [CrossRef]
  31. Alam, M.B.; Pulkki, R.; Shahi, C.; Upadhyay, T.P. Economic Analysis of Biomass Supply Chains: A Case Study of Four Competing Bioenergy Power Plants in Northwestern Ontario. ISRN Renew. Energy 2012, 2012, 1–12. [Google Scholar] [CrossRef]
  32. De Meyer, A.; Cattrysse, D.; Rasinmäki, J.; Van Orshoven, J. Methods to optimize the design and management of biomass-for-bioenergy supply chains: A review. Renew. Sustain. Energy Rev. 2014, 31, 657–670. [Google Scholar] [CrossRef]
  33. Edel, M.; Thraen, D. The Economic Viability of Wood Energy Conversion Technologies in Germany. Int. J. For. Eng. 2012, 23, 102–113. [Google Scholar] [CrossRef] [Green Version]
  34. Eliasson, L.; Eriksson, A.; Mohtashami, S. Analysis of factors affecting productivity and costs for a high-performance chip supply system. Appl. Energy 2017, 185, 497–505. [Google Scholar] [CrossRef]
  35. Graham, R.L.; English, B.C.; Noon, C.E. A Geographic Information System-based modeling system for evaluating the cost of delivered energy crop feedstock. Biomass Bioenergy 2000, 18, 309–329. [Google Scholar] [CrossRef]
  36. Kamimura, K.; Kuboyama, H.; Yamamoto, K. Wood biomass supply costs and potential for biomass energy plants in Japan. Biomass Bioenergy 2012, 36, 107–115. [Google Scholar] [CrossRef]
  37. Ruiz, P.; Sgobbi, A.; Nijs, W.; Thiel, C. The JRC-EU-TIMES Model. Bioenergy Potentials for EU and Neighbouring Countries; European Union: Brussels, Belgium, 2015; p. 172. [Google Scholar]
  38. Viana, H.; Cohen, W.B.; Lopes, D.; Aranha, J. Assessment of forest biomass for use as energy. GIS-based analysis of geographical availability and locations of wood-fired power plants in Portugal. Appl. Energy 2010, 87, 2551–2560. [Google Scholar] [CrossRef] [Green Version]
  39. Abatzoglou, J.T.; Williams, A.P. Impact of anthropogenic climate change on wildfire across western US forests. Proc. Natl. Acad. Sci. USA 2016, 113, 11770–11775. [Google Scholar] [CrossRef] [Green Version]
  40. Keenan, R.J. Climate change impacts and adaptation in forest management: A review. Ann. For. Sci. 2015, 72, 145–167. [Google Scholar] [CrossRef]
Figure 1. Afforestation rate of French territories in 1908 (left) and in 2014 (right), (IGN, 2018, modified).
Energies 11 03372 g001
Figure 2. Comparison of the maps of the potential suitable areas of five tree species with their observed distribution provided by the IFN.
Energies 11 03372 g002aEnergies 11 03372 g002b
Figure 3. Potential distribution of suitable areas for the five species in 2015 and 2050.
Energies 11 03372 g003aEnergies 11 03372 g003b
Figure 4. Amount of plots for the potential distribution of the suitable areas of the five tree species in 2015 and 2050.
Energies 11 03372 g004
Figure 5. Maps of NPP estimated for 2015 and for 2050 (in white: Low values; in light blue: Average values; in dark blue: High values), and map of the difference of NPP (2050-2015: In white: Decrease of NPP; in blue: Increase of NPP).
Energies 11 03372 g005
Figure 6. Maps of BDI estimated for 2050 related to Fagus sylvatica L. (beech), Populus nigra L. (Italian poplar), Abies alba Mill. (Silver fir), Picea excelsa (Lam.) Lk. (spruce), and Pinus silvestris L. (Scots pine).
Energies 11 03372 g006aEnergies 11 03372 g006b
Table 1. Quantitative comparison of the observed distribution of the five tree species with the potential distribution of their suitable areas in France for the current climate.
Abies albaAmount of IFN plots=3931
Proba. classesIFN plots in proba. classes% IFN plots in proba. classes
low proba291
average proba3719
high proba353190
Fagus sylvaticaAmount of IFN plots=6825
Proba. classesIFN plots in proba. classes% IFN plots in proba. classes
low proba310
average proba5929
high proba620291
Picea excelsaAmount of IFN plots=4378
Proba classesIFN plots in proba. classes% IFN plots in proba. classes
low proba1483
average proba114426
high proba308670
Pinus silvestrisAmount of IFN plots=3217
Proba. classesIFN plots in proba. classes% IFN plots in proba. classes
low proba572
average proba82326
high proba233773
Populus nigraAmount of IFN plots=1962
Proba. classesIFN plots in proba. classes% IFN plots in proba. classes
low proba00
average proba63232
high proba133068
Table 2. Estimated amount of plots for suitable areas of the five tree species in 2015 and 2050 (diff = difference between 2050 and 2015; diff % is the percentage of this difference).
Abies alba20152050diffdiff %
all classes 2015643,868455,297−188,571−29
low proba173,813283,478109,66563
average proba353,171126,359−226,812−64
high proba116,88445,460−71,424−61
Fagus sylvatica20152050diffdiff %
all classes 2015734,287650,278−84,009−11
low proba152,052166,36214,3109
average proba341,095390,91249,81715
high proba241,14093,004−148,136−61
Picea excelsa20152050diffdiff %
all classes 2015465,780217,597−248,183−53
low proba224,312136,329−87,983−39
average proba159,49546 859−112,636−71
high proba81,97334,409−47,564−58
Pinus silvestris20152050diffdiff %
all classes 2015740,099689,576−50,523−7
low proba168,819190,66121,84213
average proba362,532410,18247,65013
high proba208,74888,733−120,015−57
Populus nigra20152050diffdiff %
all classes 2015738,069679,247−58,822−8
low proba41,39329,481−11,912−29
average proba264,039168,343−95,696−36
high proba432,637481,42348,78611
Table 3. Statistics of the potential evolution of the NPP between 2015 and 2050 (NPP is expressed in g/m2/year).
NPPAmount of Plots =795,616
Classes of differenceplots% of plots
[−121, −1]738,46592.8
[−1, 1]4530.1
[1, 180]56,6987.1
Table 4. Statistics of the potential BDI of the five tree species in 2050.
BDI ValuesAbies albaFagus sylvaticaPicea excelsaPinus silvestrisPopulus nigra
plots% δ%plots% δ%plots% δ%plots% δ%plots% δ%
1283,47862 ± 12478,05674 ± 25136,21063 ± 7189,09327 ± 810,4692
2124,02727 ± 5111,56517 ± 635,42216 ± 2408,32659 ± 18242,89436 ± 7
35077114,9622 ± 1287<147,9277 ± 2415,78961 ± 12
490<139<1342<117<1333<1
6249414543111,1275 ± 11 153<196041
940,1319 ± 241,1136 ± 234,20916 ± 243,0606 ± 2158<1

