Assessment of Productivity and Economic Viability of Combined Food and Energy (CFE) Production System in Denmark


1
Department of Plant and Environmental Sciences, University of Copenhagen, Højbakkegård Alle 30, 2630 Taastrup, Denmark
2
Basque Centre for Climate Change (BC3). Building 1, 1st floor, Scientific Campus of the University of Basque Country, Barrio Sarriena, s/n. 48940 Leioa, Bizkaia, Spain
*
Author to whom correspondence should be addressed.
Energies 2019, 12(1), 166; https://doi.org/10.3390/en12010166
Submission received: 23 November 2018
/
Revised: 18 December 2018
/
Accepted: 24 December 2018
/
Published: 4 January 2019
(This article belongs to the Special Issue Selected Papers from 26th European Biomass Conference & Exhibition (EUBCE 2018))
Abstract
:Agro-ecosystems for integrated food, fodder, and biomass production can contribute to achieving European Union goals to increase renewable energy sources and reduce greenhouse gas emissions. The study objective was to evaluate the productivity and economic returns from a combined food and energy (CFE) system compared to sole winter wheat and sole short rotation woody crop (SRWC) production. Two excel-based models viz. Yield-SAFE and Farm-SAFE, were used to simulate agronomic productivity and economic assessment respectively. Yield-SAFE was calibrated and validated with measured data from CFE from 1996–2016. When compared over temporal scale of 21 years, CFE systems with 150–200 m alley width had the highest net present value (NPV) followed by 100 m, 50 m, sole winter wheat and sole SRWC, indicating higher profitability of CFE systems. Sensitivity analysis of NPV with ±10% yield fluctuations, and with 0–10% discount rate, demonstrated that CFE systems was more profitable than sole crops, indicating higher resilience in CFE systems. LER in CFE ranged from 1.14–1.34 indicative of higher productivity of CFE systems compared to component monocultures. Hence, the study has demonstrated that the productivity and the economic viability of CFE systems, were higher than sole crops, for informed decision making by farm managers and policy makers to contribute to renewable energy biomass production and to mitigate the impending adverse climate change effects on agricultural production.
1. Introduction
With growing concerns on contribution of greenhouse gas (GHG) emissions to global warming from combustion of fossil fuels [1], the demand for renewable energy resources is increasing at a rapid rate. The European Union (EU) target is to reduce GHG emissions by 20% in 2020 based on 1990 levels by increasing the share of renewable energy by 20% in gross final energy consumption [2]. Aligning with EU targets, Denmark has an ambitious national goal to reduce 20% GHG emissions by 2020 compared to 2005 level by increasing the share of renewable energy by 30% of total energy consumption [3,4]. To meet the growing demand for biomass, growing energy crops on farmland is a potential source of renewable energy [5]. The biomass from short rotation woody crops (SRWC) can fill in the gap between the high demand of renewable energy resources and the lack of supply [6]. SRWC are the dedicated woody perennial crops—like Populus, Salix, and Eucalyptus etc.—which can be grown for biomass production as a source of bioenergy and biofuel applications [7].
Integrating SRWC production with the food and fodder production in agroforestry systems provides a viable potential to meet the food, fodder and bioenergy production and agroforestry systems are gaining importance [8]. Agroforestry systems are more productive compared to conventional monocultures and provide a suite of ecosystem services [9] that supports agricultural productivity and enhance environmental performance of production systems. The main ecosystem services of the system are water holding capacity, carbon sequestration, soil erosion prevention, windbreak effects, soil fertility maintenance, pollination, biological control of pest, and landscape improvement [10]. The benefits of agroforestry are evident from the EU Rural Development Regulation 1305/2013 that supports agroforestry practices on agricultural land [11]. The European Commission supports agroforestry as a means to promote resource use efficiency, low-carbon and climate resilient economy in the food, forestry and agriculture sectors [12]. According to the European Commission [13], farmers in EU receive ‘green payment’ based on three following obligatory practices: (a) crop diversification; (b) maintenance of permanent grassland; and (c) ecological focus area (agroforestry).
In spite of the multiple ecosystem service benefits and the monetary incentives known as ‘green subsidy’, agroforestry production systems are not widespread across Europe compared to monoculture system. This is partly due to the lack of familiarity with the concept of agroforestry and the related environmental benefits. Farmers that do practice agroforestry are less driven by subsidies and more so by tradition or with an aim to increase diversity of products [14]. Since the 1950s, economic incentives have encouraged felling of trees in agricultural landscape to increase the arable area, and many farmers still view agroforestry as unproductive and unprofitable [8]. A group of Danish willow farmers have formed an association in collaboration with a local heat and power plant to produce willow woodchips for bioenergy. However, only farmers incorporating willows with chicken for egg production noted the benefits of willows providing shade and shelter to chickens, while the chickens provided manure and weed removal for the willows. The remaining farmers only grew willows in order to make use of land with wet or poor soil, or as a side business, unable to make a living on willow production alone. The farmers in the Danish willow association established willow belts during a short period of high subsidies, and point out increased risk of growing willow instead of arable crops as it takes up to six years after establishment for the first harvest [15]. While agroforestry systems are gaining increasing attention [8,9,16,17], for agroforestry systems to become a viable production system, there is a need to assess the agronomic productivity and the economic returns of the system to provide field-based evidence and demonstrate to the farmers, advisory services and policy makers [17].
Given the benefits of agroforestry and the challenges faced to meet the 2020 target on renewable energy, a combined food and energy (CFE) agro-ecosystem was established in Denmark, as a potential production system to produce food, fodder and energy. CFE is an agroforestry system integrating SRWC into conventional monoculture to produce food, fodder and energy [18]. The economic viability of agroforestry needs to be compared with the economics of the conventional monocropping system to provide field-based evidence on the superior economic performance of the agroforestry systems. Hence, the objective of the study was to evaluate the agronomic productivity and economic returns from the CFE systems compared to sole winter wheat and sole SRWC.
2. Materials and Methods
2.1. Description of the Case Study (Experimental Farm)
The experimental production system is a combined food and energy (CFE) system, integrating food and fodder crops with biomass belts constituting mixed stands of willow, alder and hazelnut. It was established in the spring of 1995 at the experimental farm in Taastrup (55°40′ N, 12°18′ E) under University of Copenhagen, Denmark [19]. Denmark has a mean annual temperature of 8.9 °C, ranging from −1.2 °C in February to a daily average of 21.8 °C in July, and annual precipitation of about 800 mm spread over 200 days of rain per year, mainly in autumn [20]. The farm is located at 130 m above sea level, with sandy clay loam soil (clay 15%, silt 18%, sand 65%) and soil depth is 1–2 m [10]. The CFE is an organic production system, without the use of any fertilizers, herbicides, or pesticides [10].
The CFE system is an alley cropping system with food and fodder crops in the alleys and short rotation woody crops (SRWC) as the biomass belts for energy production. It consists of 10.1 ha of food components like spring barley, winter wheat, oat and lucerne/ryegrass as food and fodder components and 0.75 ha of biomass belts consisting of five belts of SRWC, placed at spatial distances of 50, 100, 150, and 200 m within the field (Figure 1) [18]. Each biomass belt is 10.7 m wide and consists of five double rows of SRWC. Of the five double rows, three double rows in the middle consists of three willow clones (one double row each) of Salix viminalis (L.) “Jor”, Salix dasycladus Wimmer, and Salix triandra cinerea (L.) bordered by one double row of common hazel Corylus avellana (L.) on one side and one double row of alder (Alnus glutinosa (L.) Gaertner) on the other side (Figure 2) [18]. Each double row is 1.3 m apart, with a planting density of 18,600 trees ha−1. The SRWC are planted at intra-row spacing of 0.5 m and inter-row distance of 0.7 m. Along the edges of the SRWC belts, 4 m-wide ‘turning headlands’ were established with grass-ley to allow space for farm machinery turning [21]. The biomass belts are established at varying distances of 50, 100, 150, and 200 m creating alleys of the equivalent distances to assess the spatial effects of biomass belts on food and fodder components (Figure 1). The biomass belts are harvested and chipped every four years and the wood chips sold to a nearby heat and power station for the production of heat and electricity, while the food and fodder crops grown between the biomass belts are harvested annually [19].
This study took account of only willow as SRWC component and winter wheat as food component. As winter wheat is one of the most commonly grown crops in Europe and willow has high growth rate and woodchip yield, the combinations were selected to assess the productivity and economic returns of CFE system as a potential agro-ecosystem to produce food and energy sustainably in the future. Six scenarios were compared for productivity and economic returns viz. sole winter wheat, sole SRWC, and SRWC-winter wheat agro-forestry systems with four alley widths of 50, 100, 150, and 200 m.
2.2. Biophysical Simulation
The crop and tree yield data were simulated by EcoYield-SAFE model [22], which is a newer version of Yield-SAFE [23]. The simulation period was from 1996–2016. Field data from CFE was split into a calibration dataset (2002–2008) and a validation dataset (2008–2016). The simulation was carried out in two steps. The first step was model calibration. The model was provided with cropped area, tree density, soil, management, and climate data. Following this, the model was calibrated with crop and tree specific parameters to match the yield from the CFE field harvest. Once the model was calibrated, the second step was model validation with an independent dataset. Since there was no sole winter wheat and sole SRWC in the CFE system, data from a nearby organic farm was used for sole winter wheat whereas the data from literature was used for sole SRWC for the calibration and validation purposes. In this study, simulations were carried out for six scenarios viz. sole winter wheat, sole SRWC, SRWC-winter wheat alley cropping systems with alley widths of 50, 100, 150, and 200 m.
Climate, soil, management, and crop and tree specific parameters are required for the simulation of yields by Yield-SAFE. Daily climate data was retrieved from the local weather station located in Taastrup. Soil parameters were extracted from an earlier study, in which soil samples were taken from the site whereas the management data was taken from the field data records provided by the responsible farm manager of the CFE farm. Winter wheat was harvested annually as per the production cycle in the farm whereas the sole SRWC was harvested every four years. Crop and tree specific parameters were collected from literature and field measurements.
2.3. Productivity and Economic Returns Assessment
Land equivalent ratio (LER) was used as an indicator [24] to compare productivity between agroforestry scenarios, sole winter wheat and sole SRWC. LER is the ratio of monoculture area to the agroforestry area at the same management level to attain a certain yield [25]. LER was calculated as the sum of the proportions of agroforestry to monoculture yield per unit area for each component species [22].
Farm-SAFE [26] model [27] was used for economic returns and the economic analysis were based on the yield data from Yield-SAFE. For the economic assessments, net present value (NPV) and equivalent annual value (EAV), were the basis for comparison of the six scenarios of agroforestry and sole crops.
For annual crops, gross margin was calculated as gross margin = R − V, where R is revenues (€ ha−1) and variable costs, V (€ ha−1), is the input and labor costs to carry out the field operations. In agroforestry and sole SRWC systems, costs such as labor and machinery costs termed ‘assignable fixed cost’ (A; € ha−1) needs to be considered. Hence, net margin (N) was calculated as
Cumulative net margin is the sum of net margins from previous years and expressed as
Here N denotes the net margin (€ ha−1) in year t.
A discounted present value of future incomes and costs from different scenarios, were converted into net present values (NPV) as per the following Equation.
NPV is the net present value (€ ha−1) of sole winter wheat, sole SRWC or agroforestry systems, Rt is the revenue (including subsidies) in year t (€ ha−1), Vt is the variable costs in year t (€ ha−1), At is the assignable fixed costs in year t (€ ha−1), T is the time horizon (years), and i is the discount rate (typically a value between 0 and 10% [7]). A discount rate of 3% was used in this study, based on the average interest rate in Denmark over the last 20 years [28]. NPV provides the current value of the investment but does not take account of the number of years of investment. In order to account for the investment period, equivalent annual value (EAV) ha−1 year −1 was calculated to compare the investment between the alternative returns from farming options. EAV was calculated as
where iNPV describes the NPV over an infinite rotation and n accounts for rotation in years.
2.4. Revenues and Cost of Production
The input data on cost of production and revenues for sole SRWC, required for Farm-SAFE, is provided in Table 1. The input data was collected from combinations of different sources including earlier published papers on the CFE system [21,29] and interviews with the farm technician, Anders Kristian Nørgaard, responsible for establishment and management of the CFE system. The farm technician provided data on the labor cost for land preparation and planting trees. In the revenues, subsidies are included as the Danish farmers are eligible to apply for grants of 430 € ha−1 for establishing SRWC for bioenergy on farm land.
The input data for cost of production and revenues for sole winter wheat is provided in Table 2. The farm technician provided the information on land preparation, sowing and harvesting costs whereas other information, such as grain price, was taken from the local Danish websites viz. farmtalonline.dk and from the statistical database in Denmark. According to the Danish Agrifish Agency [30], farmers can apply for general basic subsidy payments included in the revenues.
The input for the agroforestry systems was based on the input from sole SRWC and sole winter wheat. For the CFE agroforestry systems, the area payment for the crop component was changed from the basic subsidy of 173.33 € ha−1, to a green subsidy of 251 € ha−1 [30]. The density of the tree component of 18,600 tree ha−1 in the sole SRWC was changed to 3295, 1807, 1245, and 949 tree ha−1 for the CFE with an alley widths of 50, 100, 150, and 200 m, respectively. Likewise, the annual woodchip and grain yields varied between the CFE systems as seen in Table 3.
2.5. Study Limitations
The Danish CFE system is located in the university experimental farm and the costs for farm operations may differ depending on whether the farm machinery is rented or owned. There may also be small differences in costs if the trial was carried out by a farmer compared to the costs incurred in the university experimental farm. The study excluded crop by-products, such as straw, which were not considered in the model, as straw was left in the field as mulch on the experimental farm, as opposed to being sold. Non-inclusion of revenues from straw may have underestimated the revenues generated from the CFE and sole winter wheat systems.
3. Results
3.1. Calibration and Validation of Simulated Yield Data
The model validation was carried out by plotting measured and simulated yield data of sole winter wheat from 2002–2008 (Figure 3a) and sole short rotation woody crops (SRWC) from 2008–2016 (Figure 3b). The measured field data in sole winter wheat was taken from an organic farm located next to the combined food and energy (CFE) system with similar climatic and soil conditions. The woodchip yield data in sole SRWC was taken from the CFE field, which was harvested every four years.
3.2. Net Present Value (NPV) and Equivalent Annual Value (EAV)
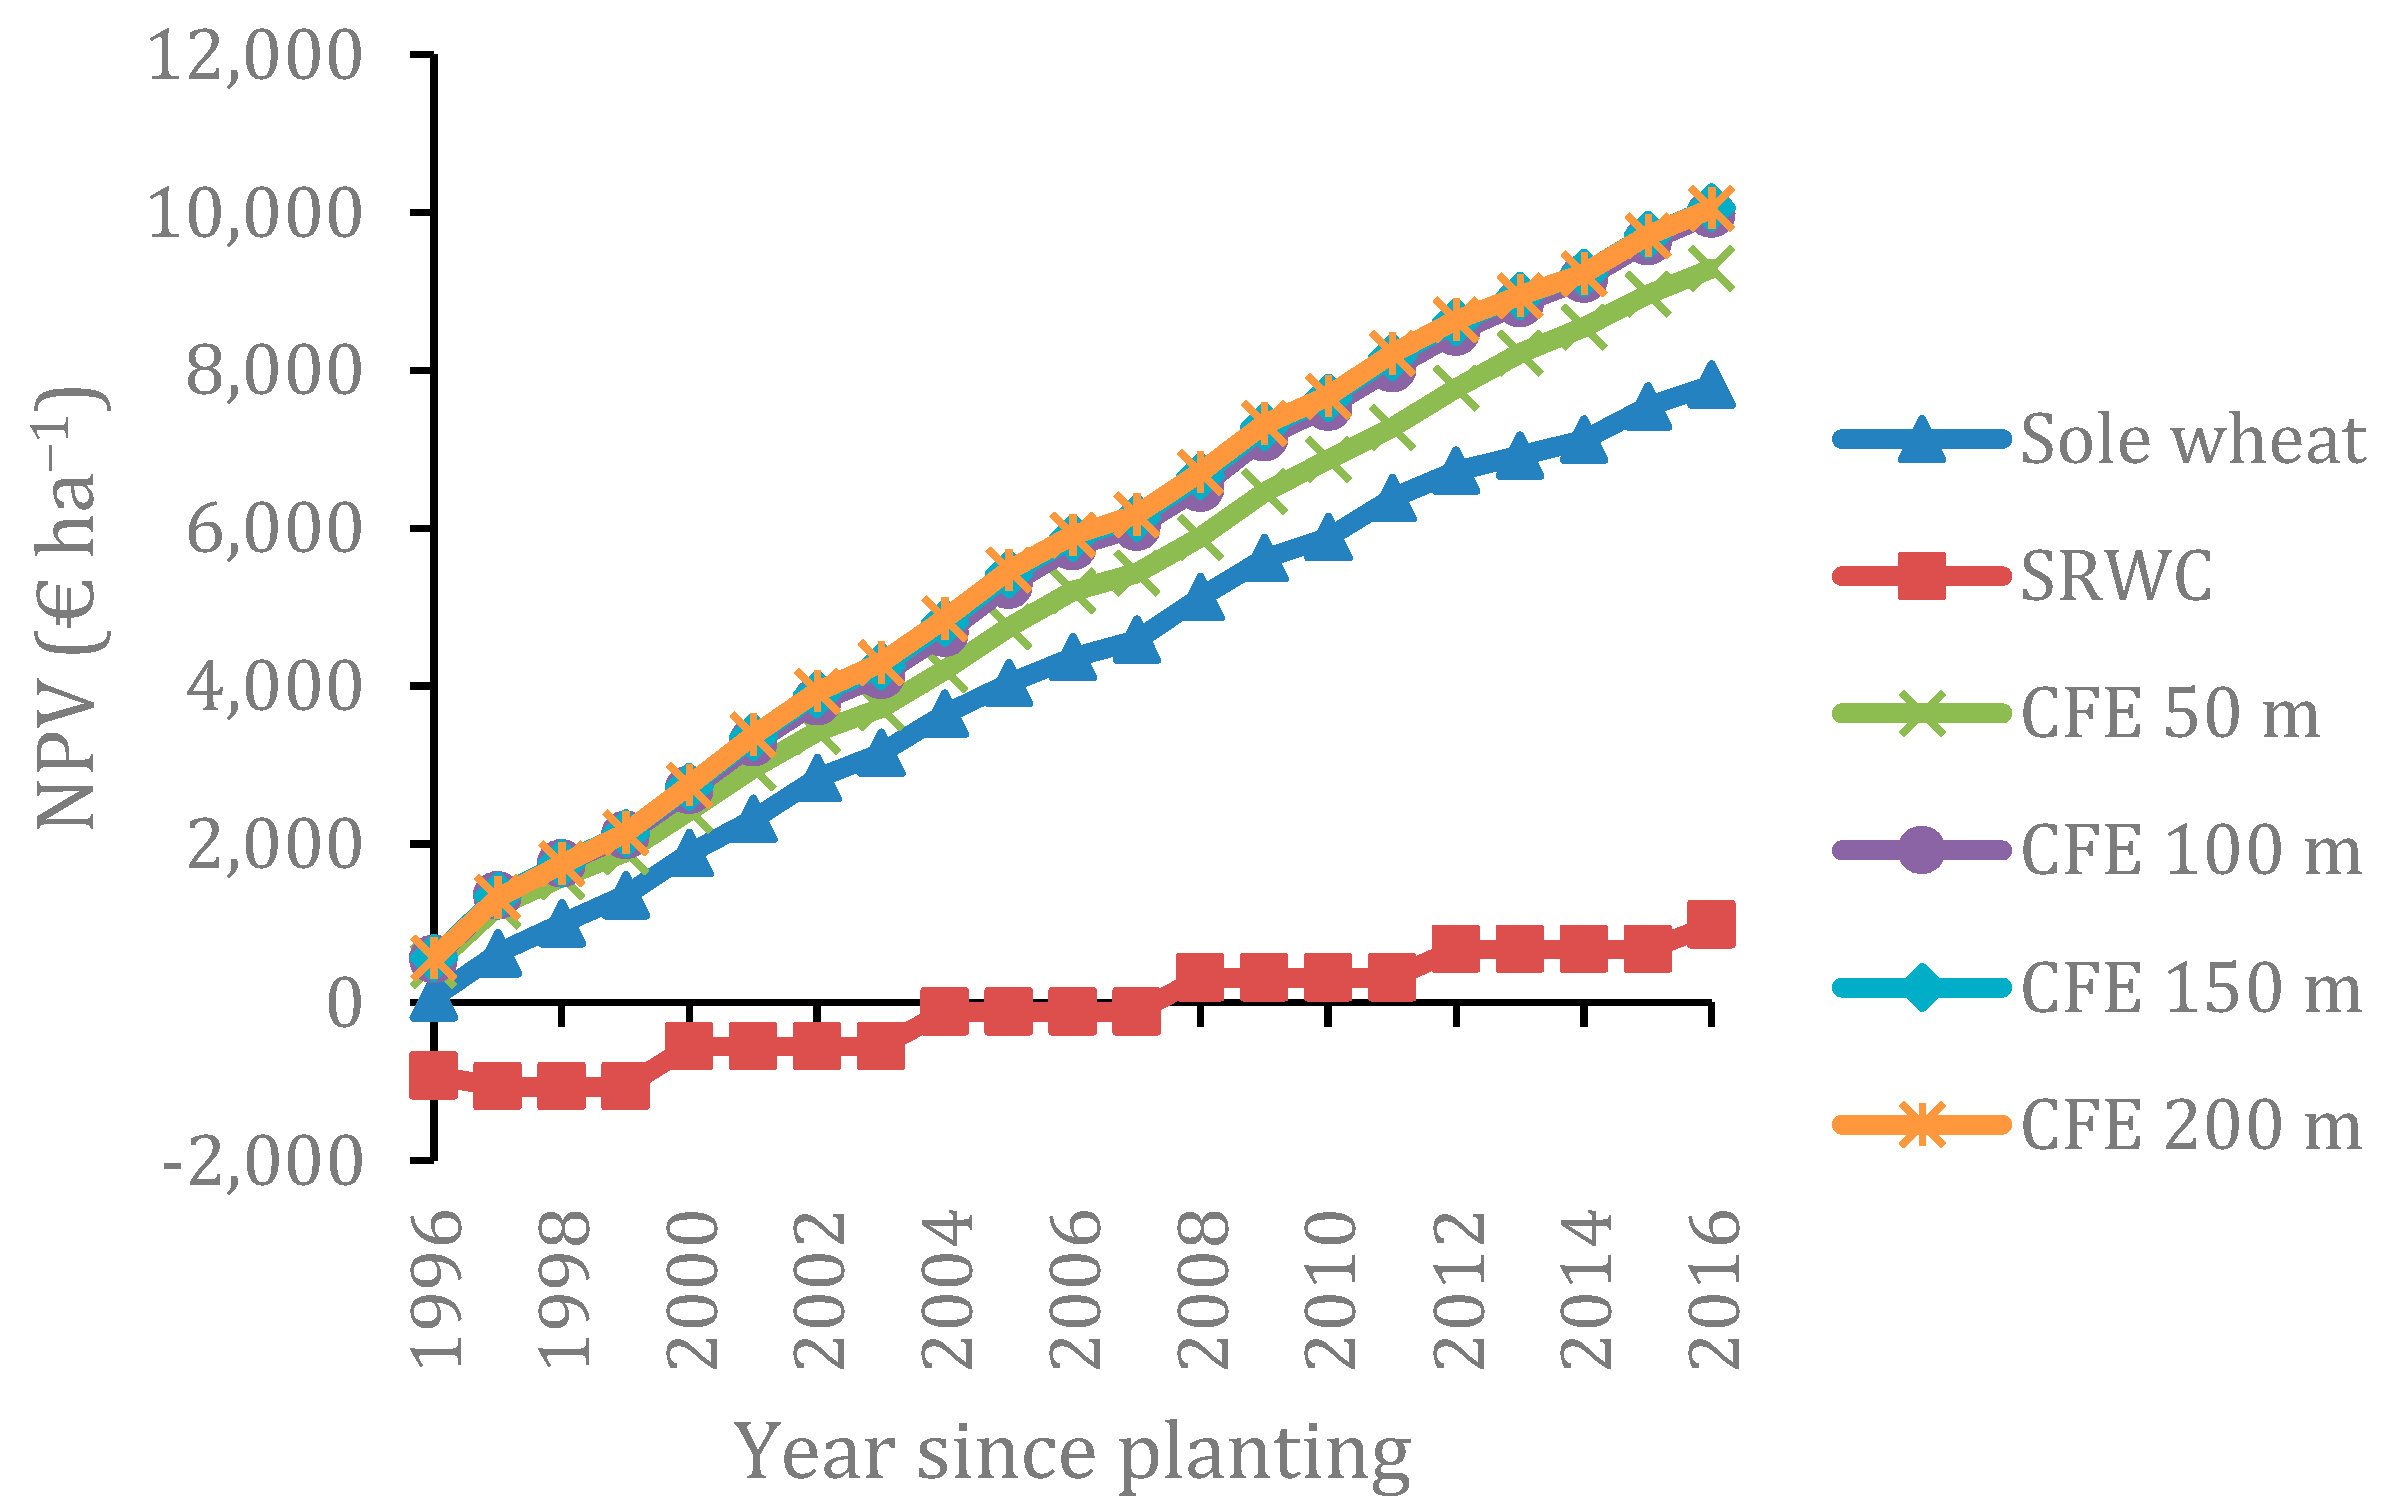
The net present value (NPV) depicted a clear distinction between the six production scenarios (Figure 4) over the simulation period of 21 years (1996–2016). Compared over the production systems, sole SRWC NPV was the lowest and was negative from year 1 with a value of −931 € ha−1 (1996) until year 12 (2007; −121 € ha−1). It was only from year 13 (2008) that the sole SRWC exhibited positive NPV (309 € ha-1), though the same NPV was reported for a span of every four years. Consequently, the NPV value was highest in the CFE system with 150 m alley width (10,061 € ha−1) and 200 m (10,051 € ha−1), followed by the CFE system with 100 m (9977 € ha−1) and 50 m (9288 € ha−1). The NPV of sole winter wheat was 7816 € ha−1 and the sole SRWC had the lowest NPV of 976 € ha−1.
Equivalent annual value (EAV) trends were similar to NPV across the production systems with CFE systems exhibiting the higher EAV compared to the sole winter wheat and sole SRWC. Over 21 years of simulation period, the CFE systems had the highest EAV of 653 and 652 € ha−1 year−1 for 150 and 200 m alley width, and 647 and 602 € ha−1 year−1 for 100 and 50 m alley widths, respectively. EAV of sole winter wheat (507 € ha−1 year−1) was lower than CFE systems, whereas sole SWC had the lowest EAV (63 € ha−1 year−1).
3.3. Net Present Value (NPV) Sensitivity to Discount Rates
The sensitivity of NPV to discount rates between 0–10% was carried out, and NPV decreased with increasing discount rates (Figure 5). CFE systems had higher NPVs exhibiting higher return at 0–10% discount rates compared to the sole winter wheat and sole SRWC. For example, at 2% discount rate, the NPVs were 10,210, 10,944, 11,026 and 11,009 € ha−1 for CFE systems with 50, 100, 150, and 200 m alley widths, respectively, whereas the NPV of sole winter wheat and sole SRWC was 8598, and 1211 € ha−1 respectively. At 8% discount rate, the NPVs of CFE systems decreased to 6159, 6681, 6763, and 6773 € ha−1 for alley widths of 50, 100, 150, and 200 m respectively whereas NPVs of sole winter wheat and sole SRWC decreased to 5137 and 190 € ha−1 respectively. At 10% discount rate, the sole SRWC recorded negative NPV. Hence, CFE systems had higher NPVs at 0–10% discount rate compared to the sole winter wheat and sole SRWC.
3.4. Comparisons of NPV with and without Grants
The NPV of the four CFE systems, sole winter wheat and sole SRWC, with and without the green support subsidy, were calculated (Figure 6). Without green support payment, the NPV in CFE systems decreased by 1238 € ha−1. However, CFE systems still recorded higher NPVs than sole winter wheat, while sole SRWC had the lowest NPV.
NPV sensitivity to yield change was simulated by ±10% yield change. With 10% increase in yield, NPV of the CFE system with 150 and 200 m alley width was highest with 11,480 and 11,496 € ha−1 respectively, whereas with 10% decrease in yield, the CFE system with 150 m alley width had the highest NPV (8642 € ha−1), followed by 100 m and 200 m alley width with NPV of 8610 and 8607 € ha−1, respectively.
3.5. Agronomic Productivity in Combined Food and Energy (CFE) System
Based on the yield data simulated from EcoYield-SAFE, the calculated LERs (Equation (1)) were 1.34, 1.23, 1.17, and 1.14 for CFE systems with 50, 100, 150, and 200 m alley widths respectively. CFE systems had LERs higher than 1, indicating higher productivity of agroforestry systems, compared to the sole winter wheat and sole SRWC. Higher LER values in 50 m alley widths indicated as high as 30% more yields compared to the sole winter wheat and sole SRWC. With the increasing alley widths, the LER decreased to 1.2 at 100 m and 150 m and 1.1 at 200 m indicating that the CFE systems are more productive with narrower alley widths (50–150 m) compared to wider alley widths.
4. Discussion
4.1. Economic Assessment
Equivalent annual value (EAV) and net present value (NPV) were used as the indicators of economic returns from six production scenarios. Combined food and energy (CFE) systems with 150 m and 200 m alley widths recorded the highest EAV and NPV. In comparison, sole winter wheat and sole short rotation woody crops (SRWC) exhibited lower NPV and EAV values with lowest returns in sole SRWC. In the CFE systems, the cumulative net margin increased with the increasing alley widths until 150 m after which minor decrease was noted at 200 m alley width and this was true for NPV (9.40 € ha−1 difference or 0.093%) and EAV (0.61 € ha−1 equivalent to 0.093% difference).
This study found that sole SRWC had the lowest NPV, similar to a field study by García de Jalón et al. [16] carried out in the UK based on a 19 year-old poplar-crop system. The UK study, simulated a time horizon of 30 years, found sole poplar to give the lowest NPV of 1068 € ha−1. The present study findings showed that CFE systems returned highest NPV followed by sole winter wheat, whereas the study in the UK showed that sole arable crops of winter wheat, spring barley, and oilseed rape returned the highest NPV of 5444 € ha−1 followed by silvoarable systems (2069 € ha−1) with a tree density of 156 trees ha−1 [16]. The low NPV for the UK systems was attributed to the fact that the crop component of the silvoarable systems decreased in yield after 15 years due to competition with the tree component for light and water [16]. While the silvorable systems resulted in comparable NPV with our study, these findings underline the importance of selection of tree and crop species for agroforestry system, that complement with each other, especially the tree species do not grow out to overshadow the crops, or have extensive roots extending into the crop fields drawing water and nutrients, adversely affecting the crop component performance.
EAV followed a similar trend to NPV. The highest EAV values was found in the in CFE systems followed by sole winter wheat and sole SRWC at a discount rate of 3%, whereas for the silvoarable system in the UK, sole arable returned the highest EAV (559 € ha−1 year−1) followed by silvoarable (364 € ha−1 year−1) and sole poplar (194 € ha−1 year−1) at a discount rate of 4% [16]. A study by Graves et al. [17] on agroforestry systems in France, with a tree density of 113 tree ha−1 and a discount rate of 4%, found that sole trees, sole crop, and poplar-crop systems had EAV values of 262–599, 210–631, and 417–835 € ha−1 year−1 respectively, thus supporting the findings of low EAV values for sole trees and highest EAV values for agroforestry systems. In the Netherlands, the same study found the EAV of sole trees, sole crop and poplar-crop systems to be −221–35, 547–603, 384–426 € ha−1 year−1, respectively, thus supporting the low EAV in sole trees, compared to monocrops and agroforestry [17]. At 4% discount rate, Toor [31] recorded lower EAV of 272 € ha−1 year−1 in sole arable crops compared to 364 € ha−1 year−1 in a hybrid poplar silvoarable system in a study conducted in Canada, supporting higher economic value among agroforestry systems compared to monoculture. Another study in France by Palma et al. [9] found that silvoarable systems, when accounted for environmental and economic performance, had the highest infinite NPV (iNPV) compared to the sole trees and sole crops. In the CFE systems, the benefits peaked at maximum alley width of 150–200 m. While these findings demonstrated a lower EAV for monoculture trees, there is disagreement on whether monocrops or agroforestry systems are the most profitable, which depends on the complementarity between the crop and tree species and the effects of the spatial distances on the performance of crop and agroforestry components. Further research into the arena of agroforestry is required to maximize the synergy between the crop and tree species for agronomic productivity and environmental performance of the agro-ecosystems.
In this study, comparing the four CFE scenarios, 150 m and 200 m alley widths was the best practice with the highest profitability. Contrary to the opinion of some farmers, who expressed that silvoarable systems are not as profitable as traditional arable systems [11], this study showed silvoarable system such as the Danish CFE system are more profitable than sole arable production systems. As the agroforestry systems are still at the early stages of adoption in Europe, further research on agroforestry and cooperation between researchers, advisors, and farms is essential to disseminate the benefits of agroforestry.
4.2. Net Present Value (NPV) Sensitivity Analysis
The sensitivity analyses showed that the discount rate influences NPV. Grants played an important role in Danish CFE agroforestry systems, with different crops and corresponding yield outputs, can result in variability in NPV between monocultures and agroforestry systems.
The discount rate reflects the interest rates in future markets, and has the same effects for sole crops, SRWC production and agroforestry systems. Hence, accounting for NPV at different discount rate will not influence the gap between different scenarios. When comparing the changes due to increasing discount rate, CFE systems with less alley width had a bigger fluctuation, which could be explained by the lower sensitivity of agroforestry systems supported by the government under such disadvantageous conditions.
Grants have significant influence on agroforestry systems, demonstrating the importance of payment for ecosystem services. With the green support, considered as a government payment for ecosystem services, CFE systems could be competitive with sole wheat production system. Even when green payment was not included in the analysis, CFE scenarios still had a slightly better performance than monoculture. The study indicated that farmers who wish to establish agroforestry on farmland, should focus on environmental benefits, which qualifies farmers to apply for extra green support for better economic returns, underscoring the importance of government support. Extra support for ecosystem services aids silvoarable production to be competitive agro-ecosystems. Since ecosystem services have long-term effects on agronomic productivity, the support from the government to agroforestry systems will go a long way to support provision of ecosystem services, which will benefit the rural and urban population at large.
In terms of the effects caused by yield change by ±10% (Figure 7), agroforestry like CFE had a better economic performance than sole winter wheat production. Among the CFE systems, only alley width of 50 m resulted in noticeable NPV change with ±10% yield change, while the remaining CFE systems returns did not show noticeable changes. The similar trends for ±yield change suggested that 100–200 m alley widths were the most economically viable.
4.3. Productivity Assessment
Both LER and NPV are good indicators when comparing monoculture and agroforestry systems. LER focusses on productivity while NPV relates to profitability. Comparison of NPV after 21 years found the agroforestry system with an alley width of 150 m to have the highest NPV, with all CFE scenarios exhibiting higher NPV than arable system, thus demonstrating that agroforestry practices are more profitable than monoculture, although the profitability is dependent on the complementarity between the crops and trees. While the profitability would be expected to correlate with a higher productivity, a comparison of LER and NPV within the CFE systems shows the opposite results (Figure 8). The fact that CFE scenarios with higher LER exhibited a lower NPV can be explained by the effect of grants, as CFE systems with higher alley widths received higher green subsidy payment based on area. This shows that CFE systems with wider alley widths can have higher returns with grant support.
The present study LER ranged from 1.14 to 1.34 demonstrating a 14–34% higher productivity in CFE systems compared to sole winter wheat and SRWC. The same trend was found in the UK study by García de Jalón et al. [16], where 28% higher yields were recorded compared to sole arable and sole poplar systems. Similarly, a study of silvoarable systems in three European countries reported LER values of 1–1.4 [17], while a study from Switzerland reported 1.1–1.3 [8] in similarity to the LER values in the present study. The EU H2020 project SustainFARM [32] assessed the LER of four different agroforestry systems in Europe, and found annual averages of LER ranging from 1.36–2.00, further demonstrating that agroforestry systems are higher yielding than monocultures [33].
The present study showed lower NPV value for sole winter wheat and SRWC, demonstrating a correspondence between low LER with low NPV for monocultural systems. Toor [31] found NPV increase with increase in tree density from 50–150 trees ha−1 in hybrid poplar silvoarable systems in Canada, with NPV of 7884 € ha−1 with tree density of 150 tree ha−1, while the present study found the highest NPV for the 150 and 200 m alley width with a tree density of 1245 and 949 trees ha−1. The silvoarable systems with tree densities of 1807 trees ha−1 (100 m alley width) and 3295 trees ha−1 (50 m alley width) resulted in lower NPV, thus demonstrating that higher tree density does not necessarily correspond to higher NPV. Instead the most complementary number of trees per area should be identified for each agroforestry system depended on species selection. Toor [31] found the silvoarable system with a density of 50 tree ha−1 resulted in lower NPV than the monocropping system (Table 4), further underlining that a certain minimum of trees is necessary in agroforestry system to be economically competitive with monocropping despite a higher LER value.
5. Conclusions
This study conducted a productivity and economic viability assessment of Danish CFE systems by using the Yield-SAFE and Farm-SAFE model. CFE systems had better economic performance than sole winter wheat in terms of NPV and EAV, while sole SRWC had lowest economic return. When comparing six different scenarios, The Danish CFE system with a 150 and 200 m alley width had the highest economic returns. LER values of CFE systems were higher than one, which indicated higher productivity than sole SRWC and sole winter wheat. Silvoarable systems are more profitable with green payment support. Lower NPV was obtained for all six scenarios with increasing discount rate, although CFE systems recorded a better economic performance with higher discount rate than sole crop and tree system. At 10% yield change, CFE systems showed less sensitivity to NPV compared to monoculture due to grants support. In summary, agroforestry like CFE systems is more productive and economically viable compared to monoculture, when facing disadvantageous changes of yield and discount rates in the future. There is a need to inform the agroforestry practitioners on the agro-forestry economics and productivity based on robust field-based evidence under diverse socio-economic contexts. Government grant support plays an important role in agroforestry adoption and it is necessary to recognize the environmental and economic benefits, offered by agroforestry systems. Since the agroforestry systems provide a suite of ecosystem services required for the human wellbeing, there is good rationale to support agroforestry with reasonable grants in order to encourage more farmers to adopt agroforestry systems.
Author Contributions
The paper was conceptualized and initiated by B.B.G. including the approach and research methods. The material for the paper is taken from the MSc. Thesis of Y.X., who has triangulated the data by several rounds of yield-safe and farm-safe model re-runs, followed by calibration and validation of the models. S.G.d.J. improved some figure data and L.M.L. contributed to writing the first draft of the paper. Final review and finalization of the manuscript draft was carried out by B.B.G. and L.M.L.
Funding
We appreciate the financial support from WaterFARMING (grant agreement no: 689271), and SustainFARM (grant agreement no. 652615) projects for funding the collation of long-term experimental data to carry out revisions and improvement of the scientific content of the manuscript.
Conflicts of Interest
The authors declare no conflicts of interest.
References
- Tubby, I.; Armstrong, A. Establishment and management of short rotation coppice. Pract. Note For. Comm. 2002, 7, 1–12. [Google Scholar]
- European Commission. Annex 2—Overview of Europe 2020 Targets; European Commission: Brussels, Belgium, 2010; Volume 3, pp. 1–2. [Google Scholar]
- European Commission. Europe 2020 in Denmark—European Commission. 2013. Available online: https://ec.europa.eu/info/business-economy-euro/economic-and-fiscal-policy-coordination/eu-economic-governance-monitoring-prevention-correction/european-semester/european-semester-your-country/denmark/europe-2020-targets-statistics-and-indicators-denmark_en (accessed on 22 October 2018).
- Regeringen. Energistrategi 2050-Fra kul, Olie og Gas til Grøn Energi; Danish Ministry of Climate and Energy: Copenhagen, Denmark, 2011; Available online: http://www.stm.dk/multimedia/Energistrategi_2050.pdf (accessed on 22 October 2018).
- Nord-Larsen, T.; Sevel, L.; Raulund-Rasmussen, K. Commercially Grown Short Rotation Coppice Willow in Denmark: Biomass Production and Factors Affecting Production. Bioenergy Res. 2015, 8, 325–339. [Google Scholar] [CrossRef]
- Mola-Yudego, B.; Pelkonen, P. The effects of policy incentives in the adoption of willow short rotation coppice for bioenergy in Sweden. Energy Policy 2008, 36, 3052–3058. [Google Scholar] [CrossRef]
- Venendaal, R.; Jørgensen, U.; Foster, C.A. European energy crops: A synthesis. Biomass Bioenergy 1997, 13, 147–185. [Google Scholar] [CrossRef]
- Sereke, F.; Graves, A.R.; Dux, D.; Palma, J.H.N.; Herzog, F. Innovative agroecosystem goods and services: Key profitability drivers in Swiss agroforestry. Agron. Sustain. Dev. 2015, 35, 759–770. [Google Scholar] [CrossRef]
- Palma, J.; Graves, A.R.; Burgess, P.J.; van der Werf, W.; Herzog, F. Integrating environmental and economic performance to assess modern silvoarable agroforestry in Europe. Ecol. Econ. 2007, 63, 759–767. [Google Scholar] [CrossRef]
- Ghaley, B.B.; Vesterdal, L.; Porter, J.R. Quantification and valuation of ecosystem services in diverse production systems for informed decision-making. Environ. Sci. Policy 2014, 39, 139–149. [Google Scholar] [CrossRef]
- Graves, A.; Burgess, P.; Liagre, F.; Dupraz, C. Farmer perception of benefits, constraints and opportunities for silvoarable systems. Outlook Agric. 2017, 46, 74–83. [Google Scholar] [CrossRef]
- European Union. Regulation (EU) No. 1305/2013 of the European Parliament and the Council of 17 December 2013 on support for rural development by the European Agricultural Fund for Rural Development (EAFRD) and repealing Council Regulation (EC) No. 1689/2005. Off. J. Eur. Union 2013, L347, 487–548. [Google Scholar]
- European Commission. Direct Payments for Farmers 2015–2020; European Commission: Brussels, Belgium, 2015. [Google Scholar]
- Rois-Díaz, M.; Lovric, N.; Lovric, M.; Ferreiro-Domínguez, N.; Mosquera-Losada, M.R.; den Herder, M.; Graves, A.; Palma, J.H.N.; Paulo, J.A.; Pisanelli, A.; et al. Farmer’s reasoning behind the uptake of agroforestry practices: Evidence from multiple case-studies across Europe. Agrofor. Syst. 2018, 92, 811–828. [Google Scholar] [CrossRef]
- Röhrig, N.; Hassler, M.; Roesler, T.; Dellmann, N.; von Oppenkowski, M. Deliverable 4.1b: Report on farm scale value chains analysis of IFNA—Denmark. SustainFARM 2018, unpublished. [Google Scholar]
- García de Jalón, S.; Graves, A.; Palma, J.H.N.; Williams, A.; Upson, M.; Burgess, P.J. Modelling and valuing the environmental impacts of arable, forestry and agroforestry systems: A case study. Agrofor. Syst. 2018. [Google Scholar] [CrossRef]
- Graves, A.R.; Burgess, P.J.; Palma, J.H.N.; Herzog, F.; Moreno, G.; Bertomeu, M.; Dupraz, C.; Liagre, F.; Keesman, K.; Van der Werf, W.; et al. Development and application of bio-economic modelling to compare silvoarable, arable, and forestry systems in three European countries. Ecol. Eng. 2007, 29, 434–449. [Google Scholar] [CrossRef] [Green Version]
- Ghaley, B.B.; Porter, J.R. Emergy synthesis of a combined food and energy production system compared to a conventional wheat (Triticum aestivum) production system. Ecol. Indic. 2013, 24, 534–542. [Google Scholar] [CrossRef]
- Porter, J.; Costanza, R.; Sandhu, H.; Sigsgaard, L.; Wratten, S. The Value of Producing Food, Energy, and Ecosystem Services within an Agro-Ecosystem. AMBIO 2009, 38, 186–193. [Google Scholar] [CrossRef] [PubMed]
- Dansk Meteorologisk Institut (DMI). Vejrnormaler. 2018. Available online: http://www.dmi.dk/vejr/arkiver/normaler-og-ekstremer/klimanormaler-dk/vejrnormal/ (accessed on 18 October 2018).
- Kuemmel, B. CFE systems, an intergrated analysis of the economic and energetic balances of a combined food and energy (CFE) system. In Den Kongelige Veterinær- og Landbohøjskole; Institut for Jordbrugsvidenskab: Copenhagen, Denmark, 2002. [Google Scholar]
- AGFORWARD. EcoYield-SAFE. Available online: http://www.isa.ulisboa.pt/proj/ecoyieldsafe/#/dashboard (accessed on 2 January 2019).
- Van der Werf, W.; Keesman, K.; Burgess, P.; Graves, A.; Pilbeam, D.; Incoll, L.D.; Metselaar, K.; Mayus, M.; Stappers, R.; Van Keulen, H.; et al. Yield-SAFE: A parameter-sparse process-based dynamic model for predicting resource capture, growth, and production ina groforestry systems. Ecol. Eng. 2007, 29, 419–433. [Google Scholar] [CrossRef]
- Mead, R.; Willey, R.W. The concept of a ‘Land Equivalent Ratio’ and advantages in yields from intercropping. Exp. Agric. 1980, 16, 217–228. [Google Scholar] [CrossRef]
- Smith, J. Agroforestry: Reconsiling Production with Protection of the Environment—A Synopsis of Research Literature; The Organic Research Center: Berkshire, UK, 2010; pp. 1–24. [Google Scholar]
- Graves, A.; Burgess, P.; Herzog, F.; Palma, J. FarmSAFE 2006 User Manual; Unpublished report; Cranfield University: Bedfordshire, UK, 2006. [Google Scholar]
- AGFORWARD. Web Application of Yield-SAFE and Farm-SAFE Models. Available online: https://www.agforward.eu/index.php/en/web-application-of-yield-safe-and-farm-safe-models.html (accessed on 2 January 2019).
- Danmarks Nationalbank. Official Interest Rates, 2016. Available online: http://www.nationalbanken.dk/en/marketinfo/official_interestrates/Pages/Default.aspx (accessed on 10 August 2017).
- Berhongaray, G.; El Kasmioui, O.; Ceulemans, R. Comparative analysis of harvesting machines on an operational high-density short rotation woody crop (SRWC) culture: One-process versus two-process harvest operation. Biomass Bioenergy 2013, 58, 333–342. [Google Scholar] [CrossRef] [Green Version]
- Ministry of Environment and food of Denmark. Grundbetaling og Grøn Støtte. 2018. Available online: https://lbst.dk/tilskudsguide/grundbetaling-og-groen-stoette/#c22753 (accessed on 22 October 2018).
- Toor, I.A. Economic Analysis of Tree-Based Introcropping in Sounthern Ontario, Canada. Master’s Thesis, McGill University, Montreal, QC, Canada, February 2010. [Google Scholar]
- SustainFARM (EU H2020 Project). 2018. Available online: http://www.sustainfarm.eu/en/ (accessed on 2 November 2018).
- Xu, Y.; Smith, J.; Smith, L.; Sandor, M.; Jitea, M.; Gilga, A.; Borek; Wawer, R.; Pisanelli, A.; Russo, G.; et al. D.2.2 Manuscript on agronomic productivity and resource use efficiency for identification of knowledge gaps in IFNS. SustainFARM 2018, unpublished. [Google Scholar]
- European Central Bank. Euro Foreign Exchange Reference Rates—1 February 2010. Eurosystem 2018. Available online: http://www.ecb.europa.eu/stats/eurofxref/ (accessed on 10 December 2018).
Figure 1.
Field layout of the combined food and energy (CFE) system at the experimental farm in Taastrup, Denmark.
Figure 1.
Field layout of the combined food and energy (CFE) system at the experimental farm in Taastrup, Denmark.

Figure 2.
Short rotation woody crop (SRWC) belts in the experimental farm Taastrup, Denmark.

Figure 3.
Validation of simulated data with (a) measured sole winter wheat grain yield (2002–2008) and (b) measured sole short rotation woody crop (SRWC) woodchips yield (2008–2016).
Figure 3.
Validation of simulated data with (a) measured sole winter wheat grain yield (2002–2008) and (b) measured sole short rotation woody crop (SRWC) woodchips yield (2008–2016).
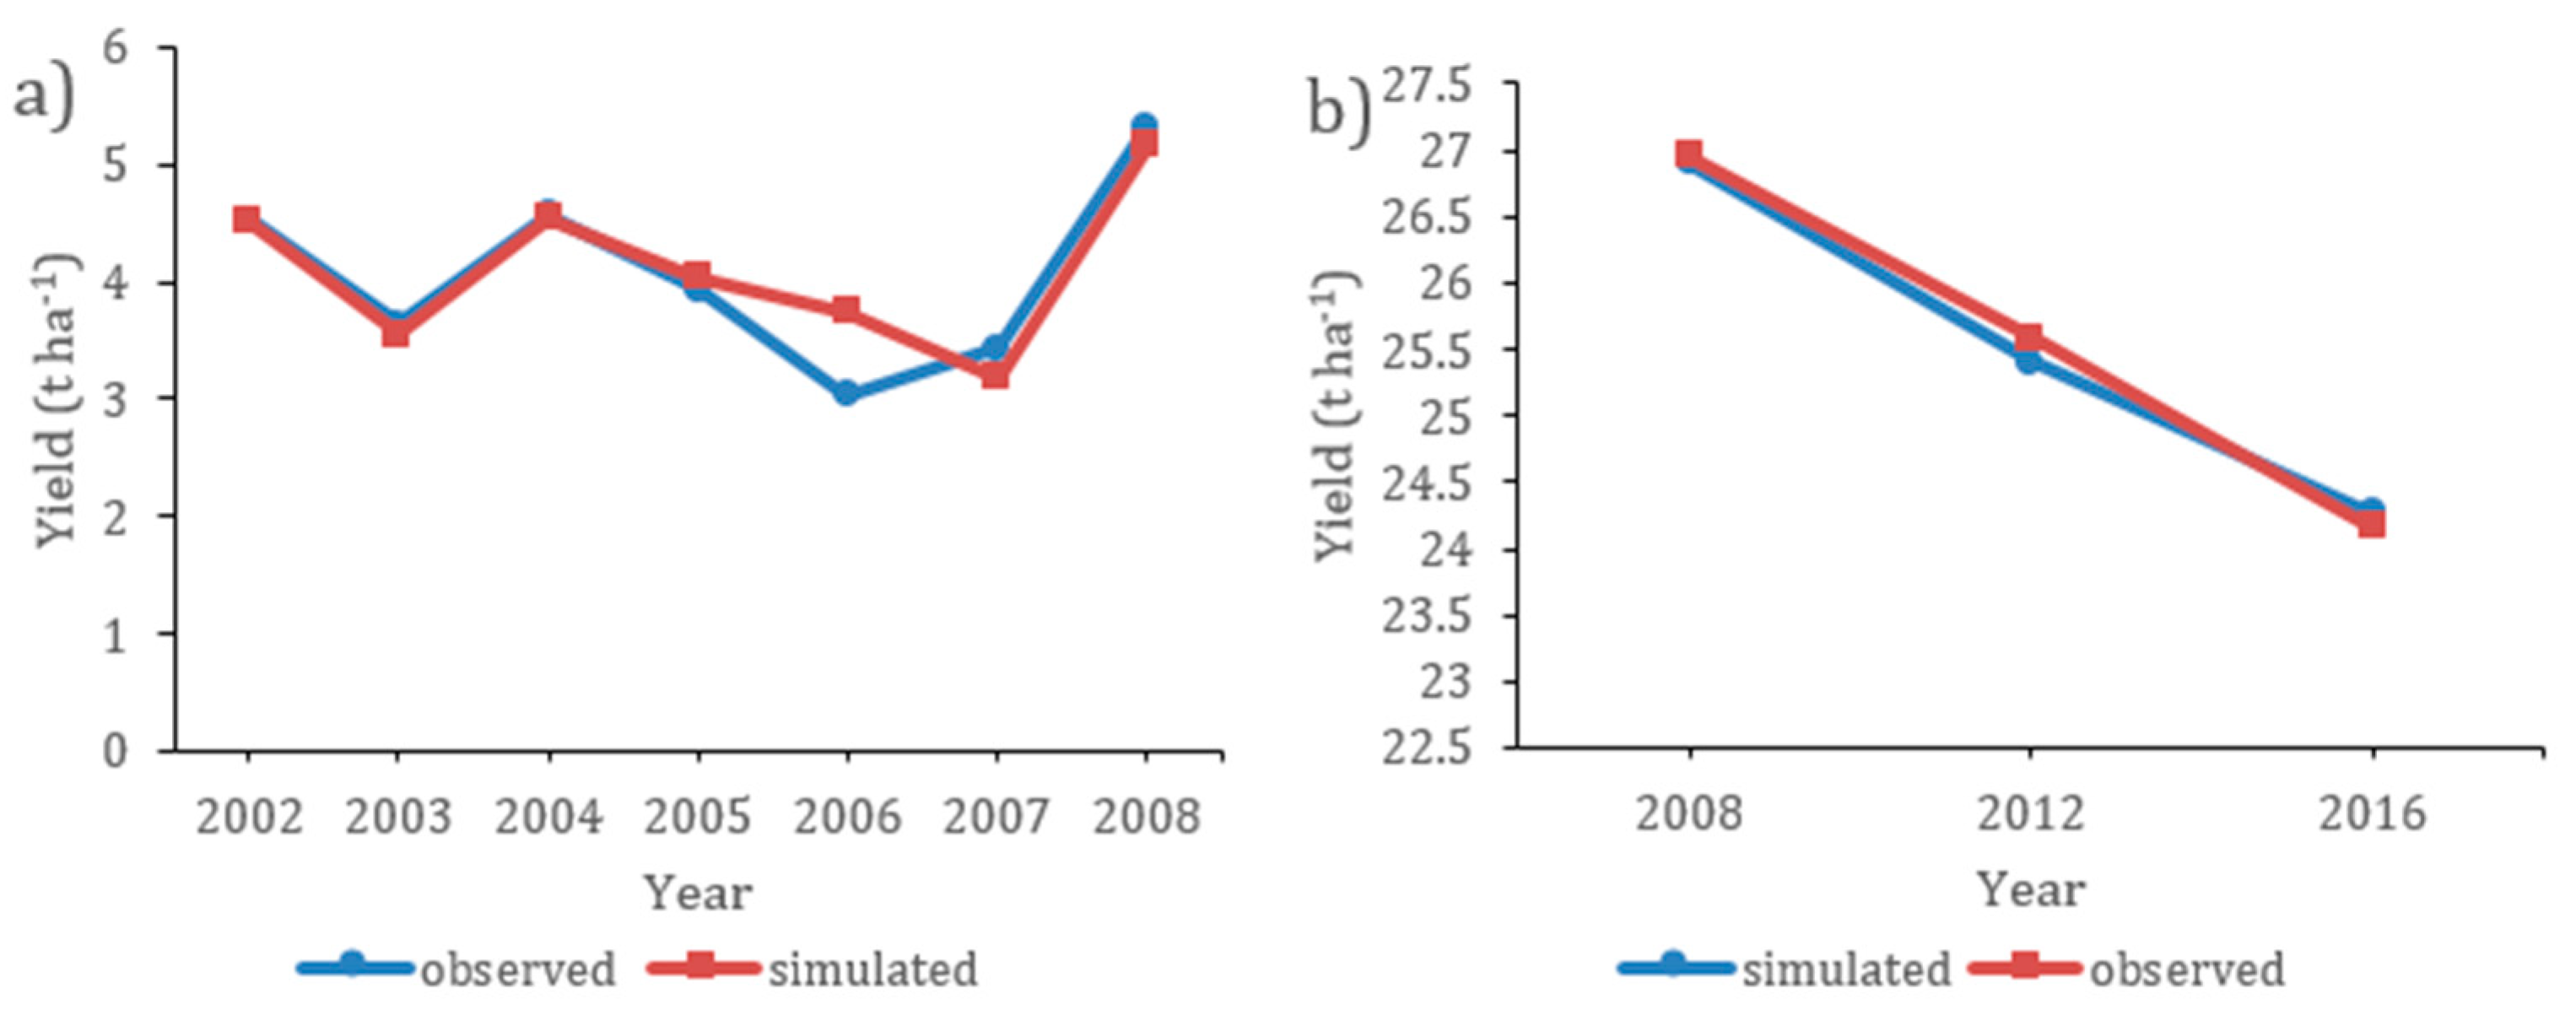
Figure 4.
Net present value (NPV) for sole winter wheat, sole short rotation woody crop (SRWC) and four SRWC-winter wheat combined food and energy (CFE) agroforestry scenarios over 21 years.
Figure 4.
Net present value (NPV) for sole winter wheat, sole short rotation woody crop (SRWC) and four SRWC-winter wheat combined food and energy (CFE) agroforestry scenarios over 21 years.

Figure 5.
Net present value (NPV) sensitivity at 2–10% discount rates for the six scenarios.
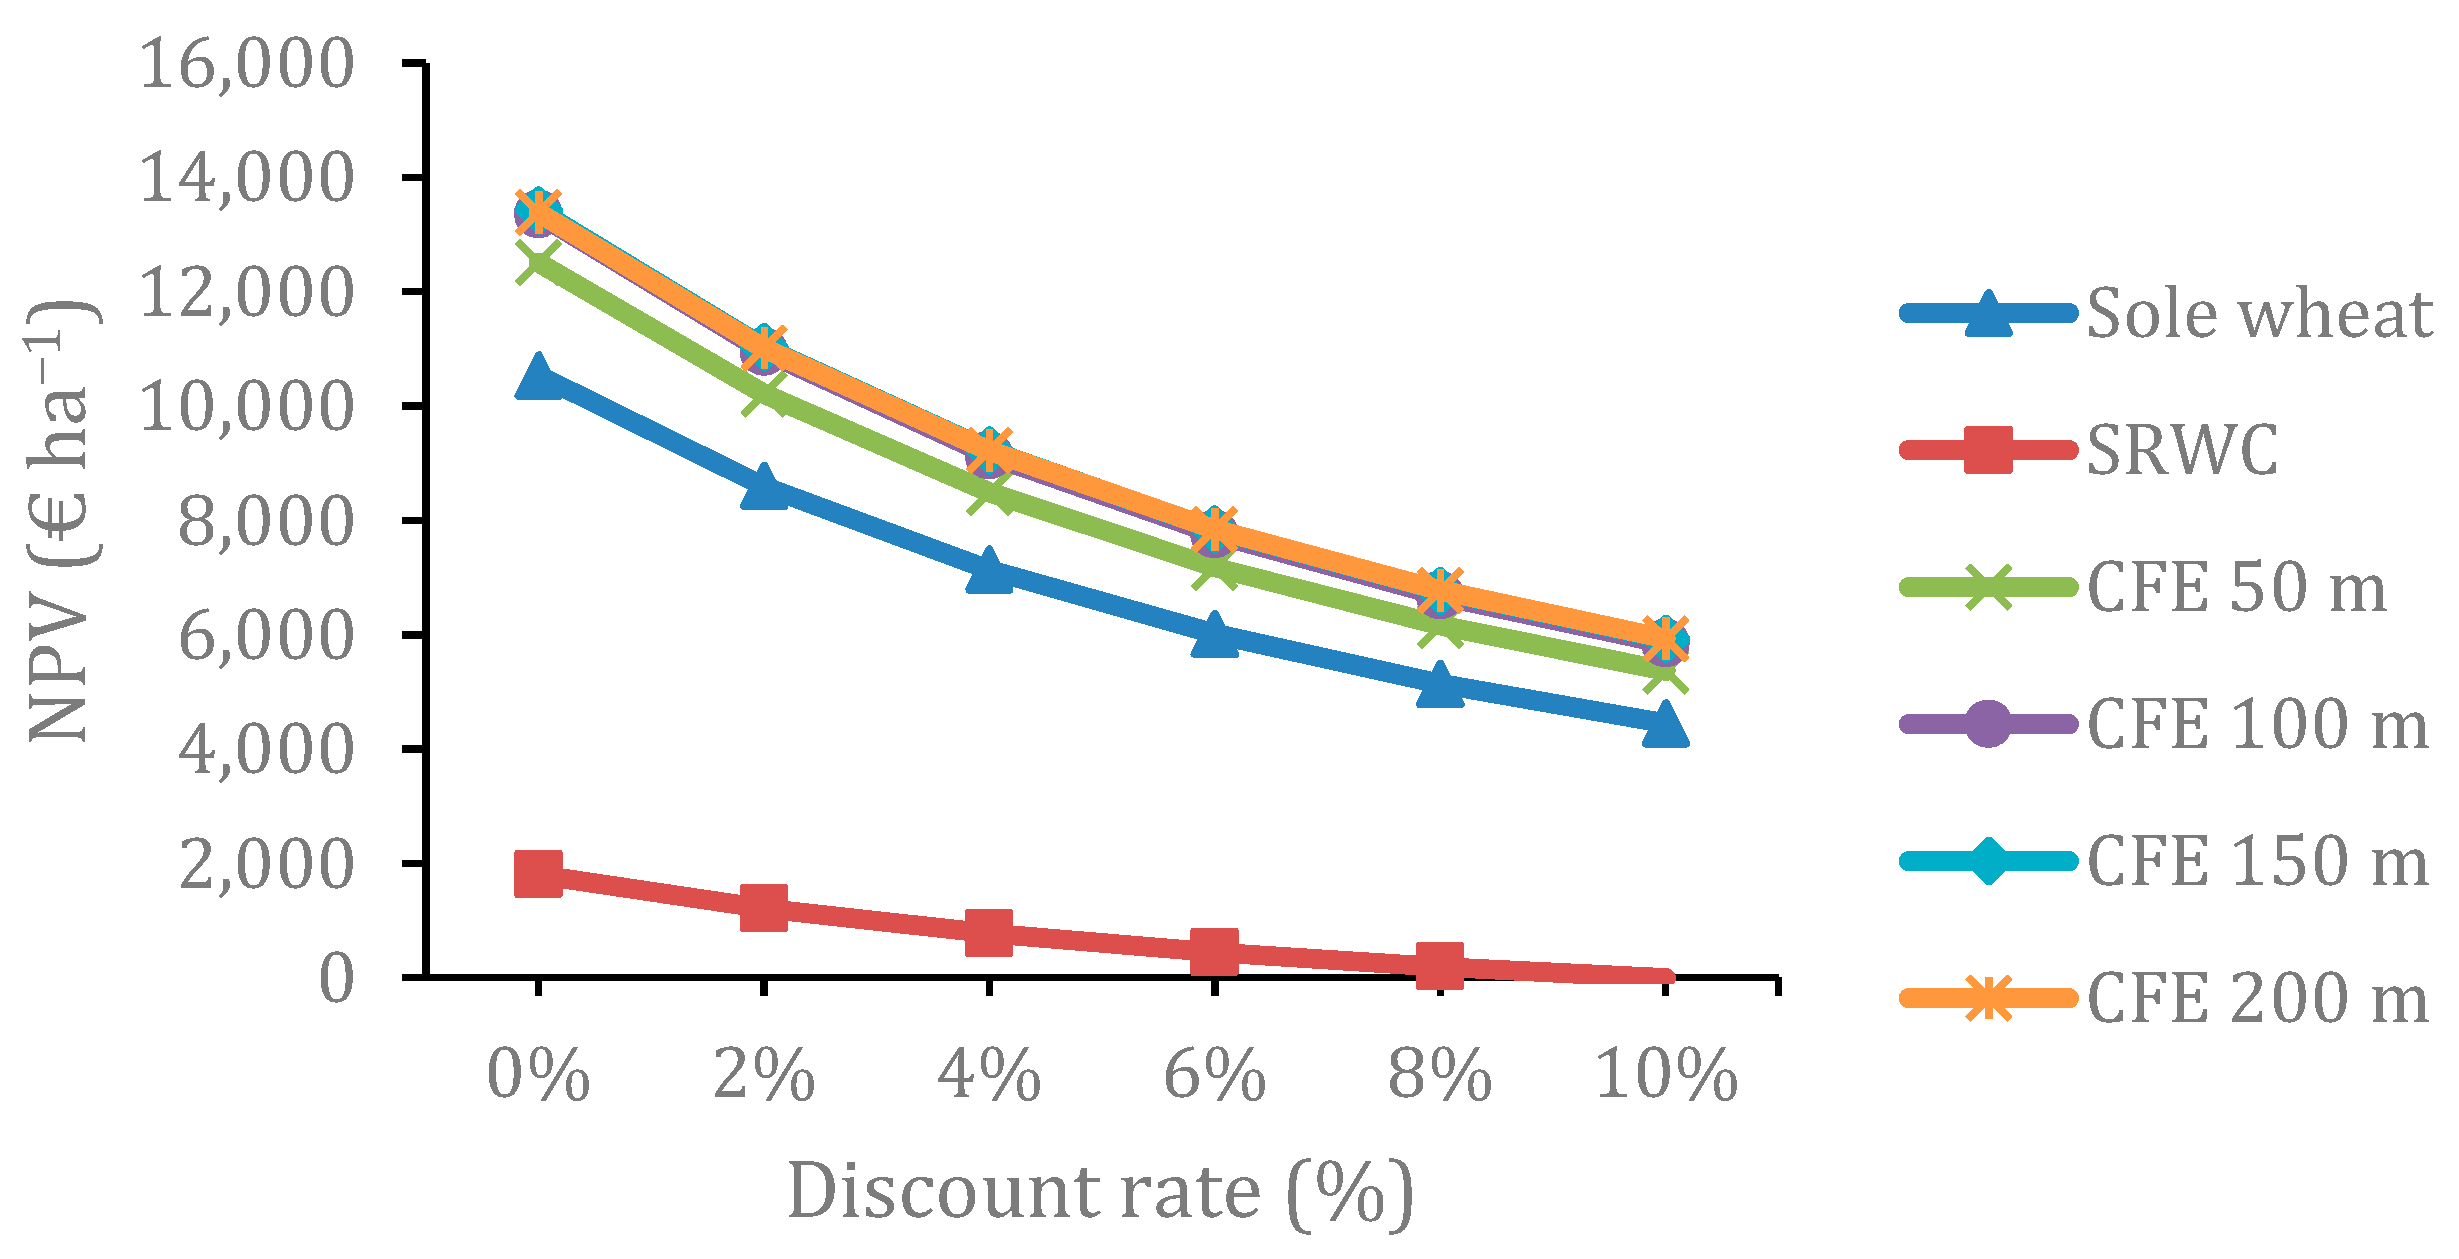
Figure 6.
Net present value (NPV) with and without the green support payment.
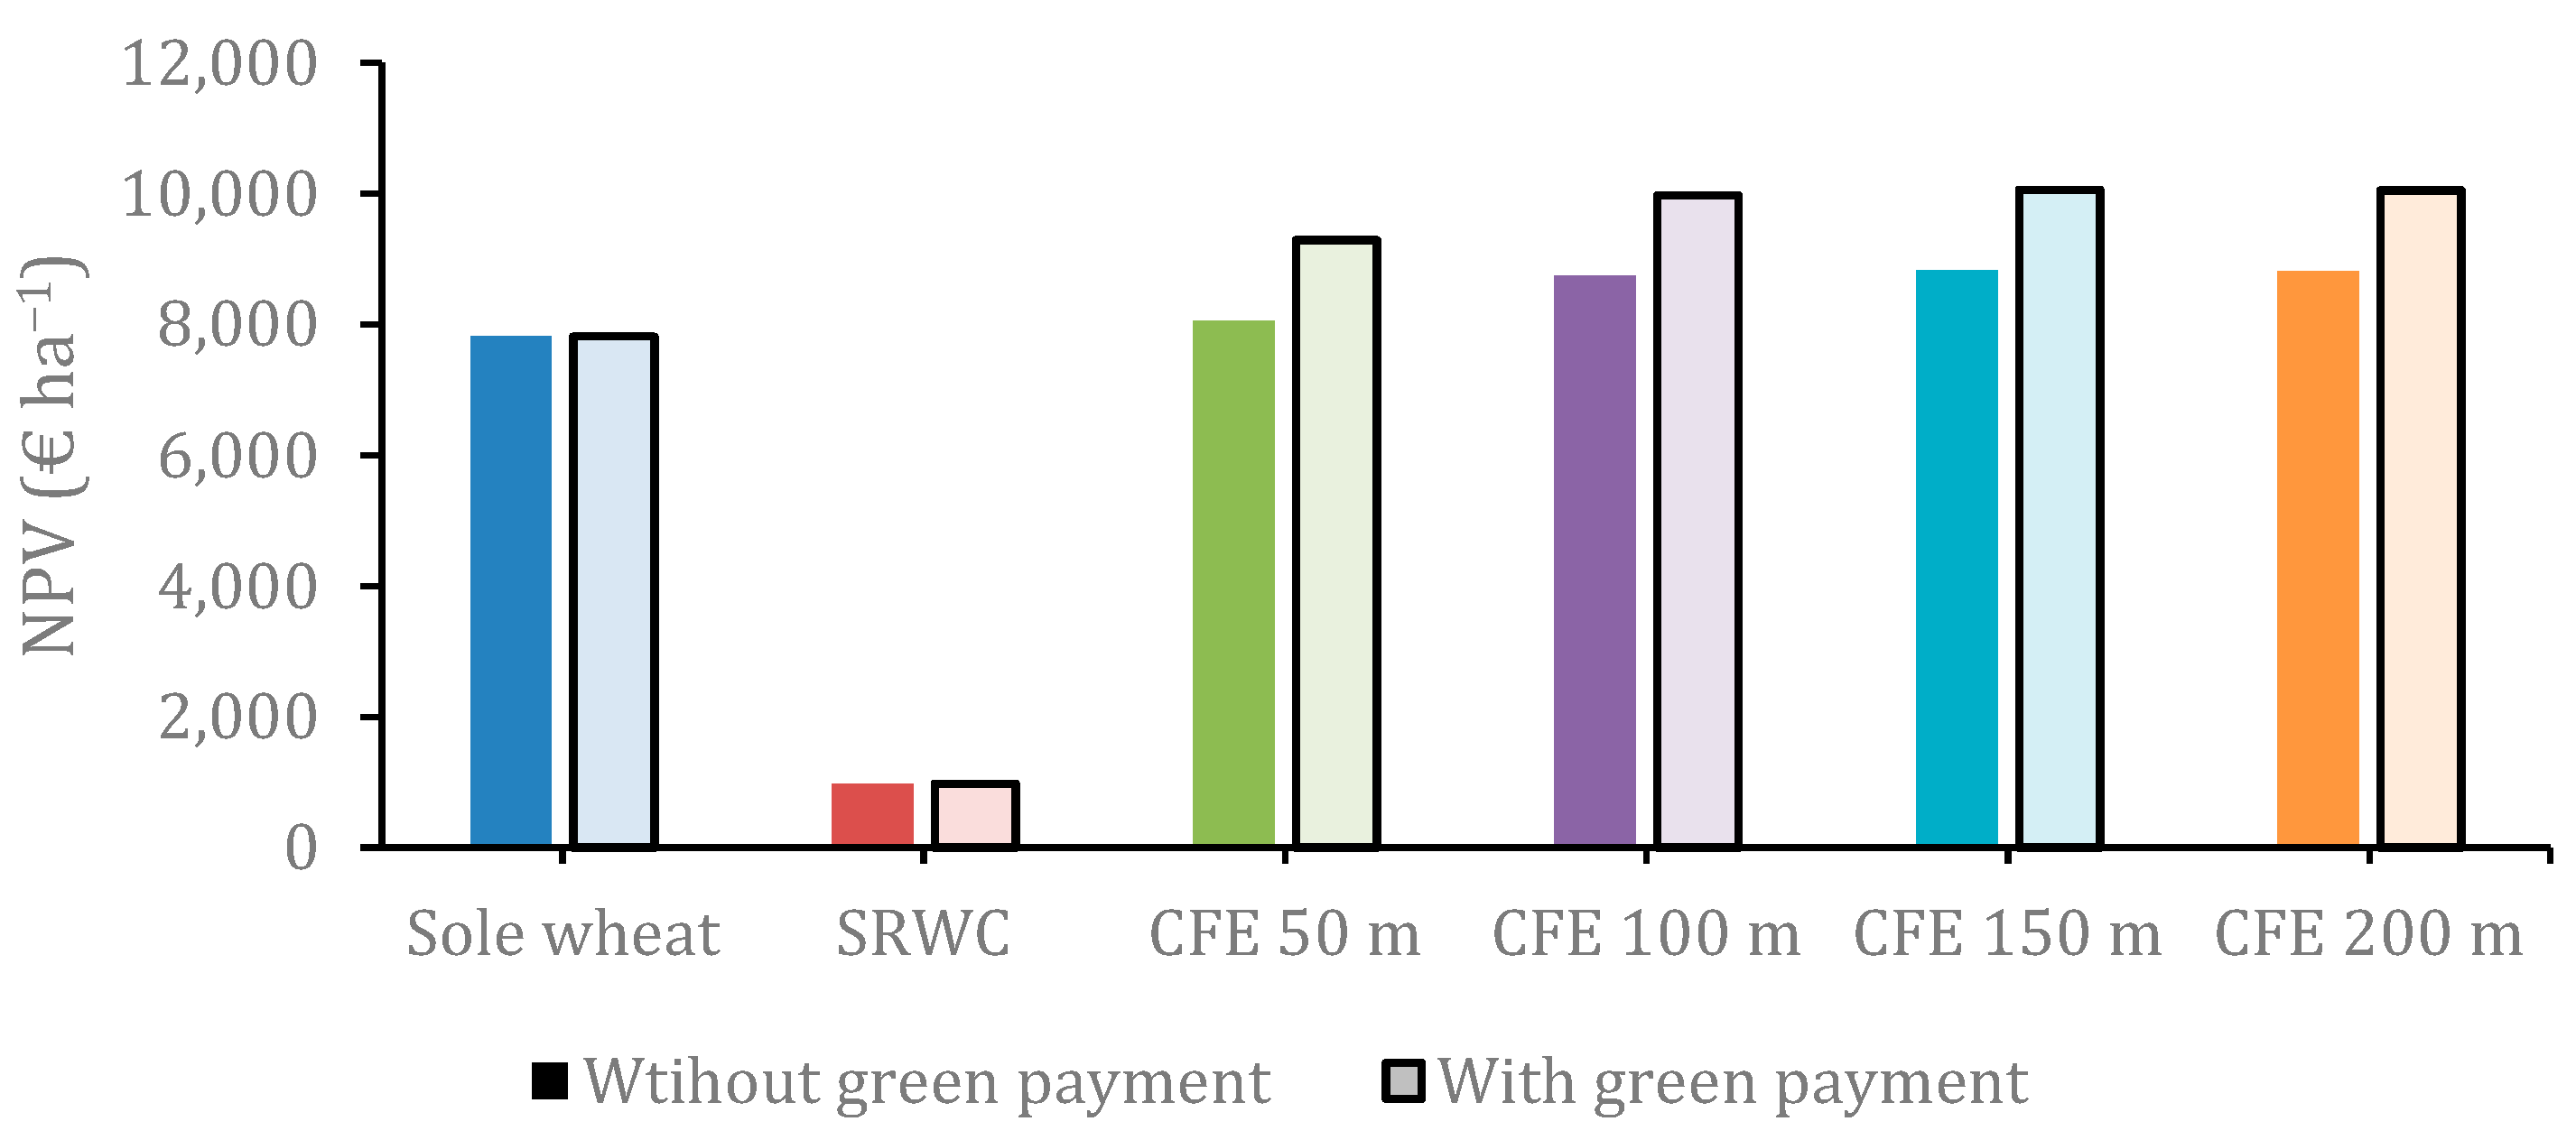
Figure 7.
Net present value (NPV) for the six scenarios over 21 years for (a) a 10% increase in yield, and (b) a 10% decrease in yield.
Figure 7.
Net present value (NPV) for the six scenarios over 21 years for (a) a 10% increase in yield, and (b) a 10% decrease in yield.

Figure 8.
The relation between land equivalent ratio (LER) and net present value (NPV) for the six scenarios.
Figure 8.
The relation between land equivalent ratio (LER) and net present value (NPV) for the six scenarios.


Table 1.
Production costs and revenues from one hectare of sole short rotation woody crop (SRWC) production over a four-year period.
Table 1.
Production costs and revenues from one hectare of sole short rotation woody crop (SRWC) production over a four-year period.
| Category | Unit | Input Value | Calculated Value |
|---|---|---|---|
| Revenue | |||
| Woodchip value | (€ m−3) | 11.09 | |
| Woodchip yield | (m3 ha−1) | 80.69 | |
| Value of first planting grant | (€ ha−1) | 430.00 | |
| Total establishment revenue | (€ ha−1) | 430.00 | |
| Total revenue every four years | (€ ha−1) | 894.85 | |
| Cost | |||
| Cost per rootstock | (€ tree−1) | 0.07 | |
| Tree density | (trees ha−1) | 18,600 | |
| Total rootstock cost | (€ ha−1) | 1302.00 | |
| Labor cost for ground preparation | (€ h−1) | 26.90 | |
| Labor cost for planting | (€ h−1) | 26.90 | |
| Labor requirement for ground preparation | (h ha−1) | 0.40 | |
| Labor requirement for plating | (h ha−1) | 3.10 | |
| Total cost of ground preparation | (€ ha−1) | 10.76 | |
| Total cost of planting | (€ ha−1) | 83.39 | |
| Total establishment cost | (€ ha−1) | 1396.15 |
Table 2.
Production costs and revenues from one hectare of sole winter wheat production over a four-year period.
Table 2.
Production costs and revenues from one hectare of sole winter wheat production over a four-year period.
| Category | Unit | Input Value | Calculated Value |
|---|---|---|---|
| Revenue | |||
| Grain price | (€ t−1) | 232.33 | |
| Area payment (basic payment) | (€ ha−1) | 173.33 | |
| Grain yield-year 1 | (t ha−1) | 4.74 | |
| Grain yield-year 2 | (t ha−1) | 3.45 | |
| Grain yield-year 3 | (t ha−1) | 2.79 | |
| Grain yield-year 4 | (t ha−1) | 5.29 | |
| Total grain revenue-year 1 | (€ ha−1) | 1274.57 | |
| Total grain revenue-year 2 | (€ ha−1) | 974.87 | |
| Total grain revenue-year 3 | (€ ha−1) | 821.53 | |
| Total grain revenue-year 4 | (€ ha−1) | 1402.36 | |
| Cost | |||
| Seed price | (€ kg−1) | 0.44 | |
| Seed rate | (kg ha−1) | 211.43 | |
| Total seed price | (€ ha−1) | 93.03 | |
| Machinery | (€ ha−1) | 268.80 | |
| Labor requirement for cultivation | (h ha−1) | 5 | |
| Labor requirement for harvesting | (h ha−1) | 4 | |
| Total labor time | (h ha−1) | 9 | |
| Labor cost farm operations | (€ h−1) | 26.9 | |
| Total labor cost | (€ ha−1) | 242.10 | |
| Total cost every year | (€ ha−1) | 603.93 |
Table 3.
Simulated yield data for combined food and energy (CFE) systems.
| System | Year | Grain Yield (t ha−1) | Woodchip Yield (m3 ha−1) |
|---|---|---|---|
| CFE 50 m | 1 | 4.68 | |
| 2 | 3.07 | ||
| 3 | 1.76 | ||
| 4 | 3.28 | 13.20 | |
| CFE 100 m | 1 | 4.60 | |
| 2 | 3.02 | ||
| 3 | 2.27 | ||
| 4 | 4.29 | 7.15 | |
| CFE 150 m | 1 | 4.57 | |
| 2 | 3.10 | ||
| 3 | 2.44 | ||
| 4 | 4.62 | 4.92 | |
| CFE 200 m | 1 | 4.61 | |
| 2 | 3.19 | ||
| 3 | 2.53 | ||
| 4 | 4.79 | 3.75 |
Table 4.
Productivity and profitability values for a selection of sole crop and agroforestry systems, in terms of land equivalent ratio (LER), net present value (NPV), and equivalent annual value (EAV).
Table 4.
Productivity and profitability values for a selection of sole crop and agroforestry systems, in terms of land equivalent ratio (LER), net present value (NPV), and equivalent annual value (EAV).
| Country | System | Tree Density (Trees ha−1) | NPV * (€ ha−1) | EAV (€ ha−1 yr−1) | LER | Source |
|---|---|---|---|---|---|---|
| Denmark | CFE 50 m | 3295 | 8049.37 | 602.52 | 1.34 | |
| Denmark | CFE 100 m | 1807 | 8738.68 | 647.23 | 1.23 | |
| Denmark | CFE 150 m | 1245 | 8822.43 | 652.67 | 1.17 | |
| Denmark | CFE 200 m | 949 | 8813.03 | 652.06 | 1.14 | |
| Denmark | Sole SRWC | 18,600 | 975.76 | 63.30 | 1 | |
| Denmark | Sole winter wheat | 7816.27 | 507.02 | 1 | ||
| UK | Sole poplar | 1068 | 194 | 1 | [16] | |
| UK | Sole arable | 5444 | 599 | 1 | [16] | |
| UK | Poplar-arable | 156 | 2069 | 364 | 1.28 | [16] |
| France | Sole forestry | 262–599 | 1 | [17] | ||
| France | Sole arable | 210–631 | 1 | [17] | ||
| France | Poplar-arable | 133 | 417–835 | 1.2–1.4 | [17] | |
| The Netherlands | Sole forestry | −221–35 | 1 | [17] | ||
| The Netherlands | Sole arable | 547–603 | 1 | [17] | ||
| The Netherlands | Poplar-arable | 133 | 384–426 | 1.2–1.3 | [17] | |
| Canada | Sole arable | 6142.05 † | 271,72 † | [31] | ||
| Canada | Poplar-arable | 50 | 6043.18 † | [31] | ||
| Canada | Poplar-arable | 100 | 6963,95 † | 363.87 † | [31] | |
| Canada | Poplar-arable | 125 | 7424.67 † | [31] | ||
| Canada | Poplar-arable | 150 | 7884.05 † | [31] | ||
| Switzerland | Sole arable | 1 | [8] | |||
| Switzerland | Walnut-arable | 70 | 1.1 | [8] | ||
| Switzerland | Cherry-arable | 70 | 1.3 | [8] | ||
| Denmark | Willow-wheat | 1.36 | [33] | |||
| Poland | Apple-vegetables | 2.00 | [33] | |||
| Italy | Olive-pasture | 1.87 | [33] | |||
| UK | Willow-wheat | 1.41 | [33] | |||
| Romania | Beach-pasture | 2.00 | [33] |
* Net present values (NPV) without grant support; † Values in Canadian Dollars (C$) converted to Euro (€) with an exchange rate of €1 = C$1.4868 (1 February 2010) [34].
© 2019 by the authors. Licensee MDPI, Basel, Switzerland. This article is an open access article distributed under the terms and conditions of the Creative Commons Attribution (CC BY) license (http://creativecommons.org/licenses/by/4.0/).
Share and Cite
MDPI and ACS Style
Xu, Y.; Lehmann, L.M.; García de Jalón, S.; Ghaley, B.B. Assessment of Productivity and Economic Viability of Combined Food and Energy (CFE) Production System in Denmark. Energies 2019, 12, 166. https://doi.org/10.3390/en12010166
AMA Style
Xu Y, Lehmann LM, García de Jalón S, Ghaley BB. Assessment of Productivity and Economic Viability of Combined Food and Energy (CFE) Production System in Denmark. Energies. 2019; 12(1):166. https://doi.org/10.3390/en12010166
Chicago/Turabian StyleXu, Ying, Lisa Mølgaard Lehmann, Silvestre García de Jalón, and Bhim Bahadur Ghaley. 2019. "Assessment of Productivity and Economic Viability of Combined Food and Energy (CFE) Production System in Denmark" Energies 12, no. 1: 166. https://doi.org/10.3390/en12010166
Note that from the first issue of 2016, this journal uses article numbers instead of page numbers. See further details here.