Frosting Performance of a Nanoporous Hydrophilic Aluminum Surface


1
School of Civil and Transportation Engineering, Guangdong University of Technology, Guangzhou 510006, China
2
School of Materials and Energy, Guangdong University of Technology, Guangzhou 510006, China
3
School of Engineering, University of Hull, Hull HU6 7RX, UK
*
Authors to whom correspondence should be addressed.
Energies 2018, 11(12), 3483; https://doi.org/10.3390/en11123483
Submission received: 19 October 2018
/
Revised: 9 November 2018
/
Accepted: 8 December 2018
/
Published: 13 December 2018
(This article belongs to the Special Issue 2018 EU–China Symposiums on Renewable Energy/Sustainable Energy and Energy Storage Technologies)
Abstract
:As an efficient energy-saving piece of equipment, an air-source heat pump can not only reduce the energy consumption required for heating, but can also reduce the pollution from fossil consumption. However, when an air-source heat pump operates under low temperatures and high humidity, the heat exchanger surface of its outdoor evaporator often get covered with frost. The growth of the frost layer seriously affects the operation efficiency of the equipment and limits its engineering application. Looking for materials that can actively inhibit frost forming is a good strategy to solve the problem mentioned above. Numerous studies show that a hydrophilic surface (contact angle less than 90°) can inhibit the normal freezing process. Manufacturing nanostructures on the surface also affect frosting performance. In this paper, nanoporous hydrophilic aluminum sheets, with contact angles of 47.8° (Sample 2), 35.9° (Sample 3), and 22.9° (Sample 4), respectively, were fabricated by the anodic oxidation method. The frosting performance of the nanoporous hydrophilic aluminum was studied compared with polished aluminum, with a contact angle of 60.2° (Sample 1). The frosting performance of the aluminum surface was systematically studied by observing the frost structure from top and side cameras and measuring the frost thickness, frost mass, and frosting rate. It was found that nanoporous hydrophilic aluminum can reduce the frost thickness and frost mass. The frost mass reduction rate of sample 2 reached a maximum of 65.9% at the surface temperature of −15 °C, under test conditions. When the surface temperature was −15 °C, the frosting rate of Sample 2 was 1.71 g/(m2·min), which was about one-third of that on sample 1 (polished aluminum). Nanoporous hydrophilic aluminum behaved better at lessening frost than polished aluminum, which revealed that manufacturing nanopores and promoting hydrophilicity can delay the formation of frost.
1. Introduction
The energy crisis is one of the main problems faced by the whole world, and more than 40% of the global energy is consumed by buildings [1,2]. The energy consumption of indoor heating systems and water heating systems has become a non-negligible part of buildings’ energy consumption. A suitable alternative to address the issues of energy consumption is to use an air-source heat pump (ASHP), whose energy efficiency is higher than fossil fuel heating systems and electric heating systems [3].
However, when air-source heat pumps are used in a cold and wet area in the winter, the heat exchanger surfaces of their outdoor evaporators often get covered with frost, due to the surface temperatures of the aluminum fins, in the heat exchanger, being lower than the dew point of wet air and the freezing point of water. The growth of frost on the heat exchanger surface seriously affect the operating efficiency and operational safety of the equipment. For example, the frost layer increases the heat transfer resistance and decreases the heat transfer efficiency between the heat exchanger and air [4]. As it was reported, the heat transfer efficiency would be decreased to 50%–75% due to deposition of frost [5] and, further, degrades the performance of the heat exchanger and even results in the shutdown of the ASHP [6].
Aiming to address the frosting problem on the heat exchanger surface, many researchers are looking for a better defrosting method. However, some traditional defrosting methods, such as hot water spray, electric heating, hot gas by-pass, and reverse cycle, need to operate with the use of additional equipment, thus increasing additional energy consumption and reducing the overall efficiency of the equipment operation [7]. Therefore, looking for aluminum sheets with good frost retardation performance, which can be used as the fins of the heat exchanger, is very important to reduce the frequency of defrosting, reduce equipment energy consumption, and maintain the efficient operation of the equipment.
As many studies reported, a hydrophilic surface (contact angle less than 90°) has a good frost retardation effect. Orejon et al. [8] studied the condensation phenomenon of water on hydrophilic silicon micropillars with different pillar densities. The dynamics of the condensation depended strongly on the spacing between the micropillars. In the case of short spacing between the pillars, the condensate, keeping a constant liquid thickness of that of the micropillar height, propagated between the structures. But in the case of large spacing, the condensate rose above the micropillars’ height in the end. Liu et al. [9] made a kind of hydrophilic surface by coating a copper surface. Compared with the uncoated copper surface, the initial frosting time of the coated surface could be delayed by at least 15 min, the frost layer thickness on the surface could be reduced by at least 40%, and the frosting weight could be reduced by more than 40%. On some better test conditions (φ < 60%, Ts > −10 °C), no frost formed on this hydrophilic surface for 3 h at least. Lee et al. [10] installed experimental materials with dynamic contact angles (DCA) of 23° and 88°, respectively, to a wind tunnel. Frost structure was observed with a visualization device. From the study, surfaces with a low DCA (23°) possessed lower frost thickness and higher frost density than that of surfaces with a high DCA (88°). Okoroafor et al. [11] reported that frost layers are significantly reduced on cold surfaces coated with a hydrophilic polymer coating. After 2 h of testing, the frost layer growth rate and frost thickness decreased by 10% to 30%.
The influence of surface wettability and micro-roughness on the formation of condensation and frost arouse great interest by researchers [12,13,14]. As a large number of studies showed, by creating the necessary roughness on the surface, droplet condensation and ice nucleation could be inhibited on any hydrophilic (contact angle less than 90°) or hydrophobic (contact angle greater than 90°) surface. As Gohari et al. [15] found, theoretically, it is possible for a surface to promote homogeneous ice nucleation if the surface roughness is transformed by reasonable design of the surface structure. The surface can delay frosting effectively when promoting homogeneous nucleation because homogeneous nucleation has a higher energy barrier of solidification relative to heterogeneous nucleation [16].
Many researchers increase the roughness by making nanostructures surfaces [17,18,19,20,21,22]. These studies showed that nanostructures on the surface can change the wettability of the hydrophilic surface so that the surface has a much better effect of frost retardation. Studying the frosting performance of the nanopore surface is of great significance for the practical engineering application of the nanopore surface. However, the frosting performance in relation to nanopores on the hydrophilic aluminum surface has not been reported systematically.
In order to understand how the nanoporous structure affects the frosting performance of aluminum surfaces in frosting conditions, with low temperatures and high humidity, three types of nanoporous aluminum surfaces have been compared with a polished aluminum surface. In this paper, we studied the frosting properties on nanoporous aluminum surfaces by using a microscopic visualization system. Specifically, we investigated the micro-morphology, pore size, and contact angle of the aluminum surfaces. In the experiment, we observed the structure of the frost layer on the aluminum surface and on the side of the aluminum sheet; and tested and analyzed the frosting performance of the aluminum surface, including the frost mass, frost thickness, and frosting rate. This paper can provide the basic experimental evidence for the engineering application of nanoporous aluminum sheets in refrigeration and air conditioning systems.
2. Physics Behind Ice Formation and Materials Preparation
2.1. Physics behind Ice Formation
The classical nucleation theory [23] is the widely recognized theory on expressing ice nucleation. According to the theory, a new interface is formed when ice nucleate, so that the surface energy of the system elevates. Meanwhile, the Gibbs free energy per unit volume decreases due to the phase transition.
The change of the Gibbs free energy in the system is defined as:
An ice nucleus must reach the critical ice nucleus size to be steady and keep growing. The critical nucleus size is described as [24]:
An activation energy is needed in order to reach the critical nucleus size, the activation energy is expressed as:
When the interfacial energy is between the ice and water phases, the Gibbs free energy barrier of nucleation is defined by [25]:
where is the geometrical factor that describes the decrement of the Gibbs free energy for heterogeneous nucleation compared to homogeneous nucleation.
The higher the Gibbs free energy barrier is, the more difficult it is for frost to form. Promoting a close to one and increasing homogeneous nucleation would be better for increasing the Gibbs free energy barrier. From the formula above, is influenced by the surface contact angle and roughness.
2.2. Materials Production
Nanoporous aluminum sheets were produced by anodic oxidation. The production process was simple and safe and the materials were cheap.
In order to eliminate the dirt on the aluminum surface caused by production, the aluminum sheets were immersed in ethanol solution and washed for 10 min in the ultrasonic cleaner. Then the steps were repeated in an acetone solution.
To completely remove the crude oxide film on the aluminum surface and expose their pure metal matrix, the aluminum sheets were placed in a 1 mol/L sodium hydroxide aqueous solution for 5 min. The aluminum sheets were then electrochemically polished for 2 min in the polishing solution, which had a ratio of 1:9 perchloric acid and ethanol solution, respectively.
Consequently, Sample 1 was obtained. The remaining aluminum sheets were placed into 0.3 mol/L of oxalic acid solution for anodizing, using currents of 1 A, 2 A, and 4 A for Samples 2, 3, and 4, respectively. Finally, the aluminum sheets were cut and flattened. Each sample (Samples 1–4) can be cut into 6 aluminum sheets; the dimensions of each sheet were 15 mm × 15 mm × 1 mm with an area of 225 mm2.
2.3. Surfaces Characteristics
The aluminum surfaces were observed using a scanning electron microscope (S-3400N, HITACHI, Tokyo, Japan) to obtain the SEM (Scanning Electron Microscope) images of micro-morphology and measure the pore size of each sample. As Sample 1 was not anodized, it was a smooth surface with a pore size of 0. Nanoporous structures appeared on the other samples’ surfaces. Figure 1 shows the SEM images of the surfaces of Sample 2, Sample 3, and Sample 4. By comparison, under the same magnification, it can be seen that the pore diameters of Samples 2–4 increased respective to current used in production.
The static contact angle on the surface of the test samples was measured using a contact angle meter (MHT-SD1, Shenzhen, China). Each sample was measured at five different locations using 8 μL of deionized water droplets during the test, and the average value was reported as the final value. Figure 2 shows the surface contact angles of the different samples. It is shown that the contact angles of the samples (Samples 1–4) were gradually decreased, respectively.
Table 1 shows the parameters of the experimental samples. It shows the relationship of the contact angle and the pore diameter of the test samples. As is shown in Table 1, when the pore diameter on the aluminum surface increased, the contact angle decreased. Actually, the theory of Wenzel et al. [19] illuminated the relationship between the contact angle and roughness on a hydrophilic surface. Similar conclusions were also proved by Shang et al. [22]. In their study, by increasing the roughness of the stainless steel, the contact angle was reduced by 28.5%.
3. Testing Rig
3.1. Construction of the Testing Rig
The schematic of the experimental testing rig is shown in Figure 3.
The experimental testing rig consisted of five parts: (1) The surface cooling system, including temperature controller, heat exchanger, water tank, water pump, and semiconductor refrigerator; (2) the air temperature and humidity control system, including low temperature humidity chamber, fan, and air duct; (3) the environment box; (4) the image capture system, including top microscope, top CCD, side microscope, side CCD, and computer; and (5) the parameter acquisition system, including multichannel temperature monito, double-channel temperature and humidity monitor, and electronic balance.
The semiconductor refrigerator included semiconductor refrigeration tablets, which had two surfaces. The upper surface of the semiconductor refrigeration tablets could refrigerate so that the low surface temperature could be provided. The underneath surface was a radiating surface that connected with the heat exchanger inside the semiconductor refrigerator. The water pump raised water to the heat exchanger, inside the semiconductor refrigerator, through a water pipe, which had a diameter of 7 mm. The heat underneath the semiconductor refrigerator could then be removed by water flow. In this experiment, the temperature of the aluminum surface was controlled to a certain value by a temperature controller. The surface temperature tested by different thermocouples was also very close, indicating that the surface temperature on different aluminum remains the same. Wet and cool air, with a certain temperature and humidity, was sustained and slowly delivered to the environment box through an air duct connected to the low-temperature humidity chamber. The environment box, which had a size of L × W × H = 280 × 200 × 80 mm, was built with insulated foam board with a thickness of 10 mm. The volume of the environment box was small, allowing for the distribution of the air temperature and humidity to be symmetrical. A hole, with a size of L × H = 40 × 10 mm, was created on the left side of the box in order to place the water pipes, a temperature and humidity testing sensor, and the thermocouple wire. The interspace of the hole was filled by thermal insulating cotton. Tempered glass was pasted inside the environment box for microscope observation. The air temperature and humidity inside the box was measured by a double-channel temperature and humidity monitor. The temperature on the aluminum surface was measured by a multichannel temperature monitor, using a K-type thermocouple probe, fixed on the semiconductor refrigeration surface by thermal grease and glue.
The parameters of the experimental equipment used in this experiment are shown in Table 2.
3.2. System Description
In this paper, a frosting experiment was done to study the frost layer structure, frost thickness, frost mass, and frosting rate on different aluminum surfaces.
The refrigerating surface of the semiconductor refrigerator provided a low surface temperature for the test samples, and the surface temperature was controlled by the temperature controller. The heat generated by the radiating surface underneath the semiconductor refrigerator was removed by water and then discharged through the air-cooled radiator. More concretely, the water in the water tank was transferred by the water pump to the heat exchanger inside the semiconductor refrigerator. The heat in the heat exchanger inside the semiconductor refrigerator was absorbed by the waterflow and then discharged into the air-cooled radiator. Water fell into the water tank eventually.
The air temperature and humidity was controlled by the low temperature humidity chamber in the air temperature and humidity control system. Wet and cool air was delivered to the environment box through an air duct connected to the low temperature humidity chamber. The cold and wet air was streamed into the environment box by a fan. The cold surface temperature was measured by a multichannel temperature monitor, while air temperature and air humidity were measured by a double-channel temperature and humidity monitor.
Before the experiment, we observed the SEM image, and measured the contact angle and pore diameter of each aluminum sample. After numbering and marking 6 aluminum sheets, per one type of sample, their unfrosted mass was measured using an electronic balance and then recorded as Mu. Later, aluminum sheets were fixed in the upper surface (refrigerating surface) of the semiconductor refrigerator, inside the environment box. The image acquisition systems were placed above and on the right side of the aluminum sheet, respectively, in order to shoot the frost structure topography. After adjusting the top and side microscopes to focus on the front and side of the aluminum sheet, respectively, we set the shooting interval to 1 min on the Amcap software in the computer. Through the image capturing system, the images of the frost layer structure, on the front and side of the aluminum sheet, could be recorded on the computer. After the experiment, frost thickness was measured using a standard ruler with a minimum scale of 0.1 mm.
We turn on the air temperature and humidity control equipment to made cool and wet air. When the air temperature and air relative humidity reached the expected value and remained stable, the surface cooling system was started as well as the image capturing system. The quality of the frosted aluminum sheets was measured at a certain moment, and recorded as M, after which we calculated the frost mass. The experiment studied the frost performance of different aluminum surfaces during 1 h. Six aluminum sheets were used per test group. In order to get the complete data for one hour, the experiment was conducted six times with a time interval of 10 min. The experimental data was the average values of the 6 samples.
The advantages of this testing device were as follows: (1) Six sheets of the same material were weighed at a certain moment and the weighing sheet did not need to put back in the test device for frosting. It was a benefit to avoid the error caused by melting water on the surface of aluminum sheet and improve the precision of the experiment. (2) Two sets of image acquisition systems, including the top and side image acquisition systems, were used in the test. It was convenient that images of the frost layer structure on the front of the aluminum surface and on the side of the aluminum sheet could be recorded. (3) Last but not least, the frost thickness was easy measure.
The test conditions are shown in Table 3. All the samples were tested on every test condition.
4. Test Results and Analyses
This experiment was divided into two parts. In the first part of the experiment, the frost layer morphology and the frost thickness of the aluminum sheets were recorded and analyzed at a surface temperature of −15 °C, air temperature of 5 °C, and air relative humidity of 60%. The image was recorded once per 1 min, and the experiment lasted for 1 h. The second part of the experiment was to test and analyze the frost mass and frosting rate under all test conditions, to explore the frosting regularity of the nanoporous hydrophilic aluminum sheets.
4.1. The Structure of the Frost Layer
4.1.1. The Structure of the Frost Layer on the Aluminum Surfaces
The images of the structure of the frost layer on the aluminum surfaces were captured by a top image capture system. The whole experiment lasted for 60 min. In the late stage of the test, the difference of the frost layer structure on the different aluminum samples was small; therefore, the images of the frost layer structure in the first 10 min were chosen to analyze. Table 4 shows the structure of the frost layer on the different aluminum surfaces when the surface temperature was −15 °C, air temperature was 5 °C, and air relative humidity was 60%.
On analysis of the images in Table 4, some conclusions could be found as follow:
- When frosting at 1 min, there were some spherical droplets, with different sizes, formed on the surface of Sample 1. The average radius of the droplets was the biggest on Sample 1. Many irregular droplets formed on the surface of Sample 2. There were many small spherical droplets on the surface of Sample 3. However, there were no obvious droplets on the surface of Sample 4; but we could see some sparse white spots on Sample 4, which were actually tiny droplets. Droplet density increased from Sample 1 to Sample 4, respectively. It revealed that when the surface contact angle decreased, the droplet density on the aluminum surfaces increased.
- With time passing by, at 5 min of the test, droplets on Sample 1 gradually merged to form larger spherical droplets. Meanwhile, new tiny droplets grew continuously between frozen droplets; however, we could still see some areas that were not covered by frost crystals on the surface of Sample 1. By contrast, frost crystals filled the surface of Sample 2 and 3. We could see many granular ice crystals on Sample 4, and there was still some surface area that was not covered by the frost crystals.
- After 10 min of frosting, Sample 1, 2, and 3 were all covered by a sheet of frost layer, but some small ice crystals could be seen, showing that the frost layers were inhomogeneous. Granular ice crystals were larger on Sample 4, and there was still some surface area that was not covered by the frost crystals.
4.1.2. The Structure of Frost Layer on the Side of the Aluminum Sheets
The images of the structure of the frost layer on the side of the aluminum sheets were captures by a side image capture system. Table 5 shows the structure of the frost layer on the side of the aluminum sheets when the surface temperature was −15 °C, air temperature was 5 °C, and air relative humidity was 60%.
As is shown in Table 5:
- At 1 min of the test, droplets formed on all aluminum surfaces. The phenomenon is the same as the analysis in Table 4.
- With time passing by, at 5 min of the test, dendritic frost, with different heights, grew on the surface of Sample 1 and they spread to the surrounding surface, connected in pieces. On the surface of Sample 2, needlelike frost, with different heights, was formed, whose density was smaller than the frost on Sample 1. Conversely, there was a dense and smooth frost layer filled up the surface on Sample 3. Different from the other, many newly frozen droplets laid on the surface of Sample 4, and the shape of these droplets were close to a sphere.
- At 10 min of frosting, bigger and higher dendritic frost, with different heights, grew on the surface of Sample 1. The frost on Sample 2 was slanted because of the gravitation of its slim ice. Lamellar frost was piled on Sample 3. And a smooth frost layer could be seen on Sample 4, but the frost layer was still thin and transparent, such that the material of the surface could still be seen clearly.
- The frost thickness decreased with the reduction of the surface contact angle. In this experiment, the frost thickness of Sample 4 was the smallest. This was attributed to the fact that a surface with a lower contact angle surface process better hydrophilic characteristic. In the early stages of the frosting experiment, for the hydrophilic aluminum sheet with the larger contact angle, the water vapor condensed from the air to the surface of the aluminum sheet, forming lots of hemispherical droplets. But on the surface of the hydrophilic aluminum sheet with a smaller contact angle, water vapor condensed to form a thin water film without significant droplets. Therefore, Sample 4 had a frost layer that was thinner and its surface of frost layer was smoother than the other aluminum sheets.
4.2. Frost Thickness
4.2.1. Frost Thickness
Since the surface of the frost layer was uneven, the values of the frost thickness had to be obtained by way of calculation. In this experiment, the values obtained by the arithmetic average method were accurate enough to 0.1 mm. And this method was very convenient and efficient. As a result, the arithmetic average method was adopted to calculate frost thickness. In this experiment, frost thickness was defined as the average of the minimum frost thickness and the maximum frost thickness. Frost thickness was calculated as:
The value of frost thickness of different kind of samples is shown in Table 6.
- It can be seen that the frost thickness on the four types of surfaces increased continually. With time passing by, frost thickness increased rapidly at first and then increased gently.
- The maximum frost thicknesses on Sample 1, Sample 2, Sample 3, and Sample 4 in 60 min were 1.69 mm, 1.31 mm, 1.01 mm, and 0.47 mm, respectively. Obviously, compared with the polished aluminum sheet, the nanoporous structure had a great effect on reducing the frost thickness on the aluminum surface. And when the surface contact angle decreased, the frost thickness on the surface also decreased.
4.2.2. Frost Thickness Reduction Ratio
The frost thickness reduction ratio was used to illustrate how much lesser the frost thickness of Sample 2, Sample 3, or Sample 4 was, than the frost thickness of Sample 1, at a certain moment of the frosting process, which was calculated as follow:
In order to study the thickness of the nanoporous surfaces directly, the frost thickness reduction ratio was calculated and is shown in Figure 4.
- The frost thickness reduction ratios of Sample 3 and Sample 4 decreased with time. The frost thickness reduction ratio of Sample 2 increased firstly and then decreased gradually. It was suggested that, compared with the polished aluminum fin (Sample 1), Sample 3 and Sample 4 showed to best restrict frost thickness growth at 10 min, whereas Sample 2 showed to be best at 30 min.
- The maximum frost thickness reduction ratios on the three types of nanopores sheets (Samples 2–4) were 37.4%, 62.3%, and 86.9%, respectively, which increased with the decrease in surface contact angle. This experiment showed that nanoporous hydrophilic aluminum sheets can effectively reduce frost thickness. As is universally known, high frost thickness between fins will block the duct of exchanger and, accordingly, increase the air pressure. To ensure that the equipment operates under stable air pressure, using the nanoporous hydrophilic aluminum, with a low frost thickness, as the material for the fin could be a good alternative.
4.3. Frost Mass
4.3.1. Frost Mass
According to the measurement method of this experiment, the frost mass was the difference between the quality of the frosted aluminum sheet and the quality of the unfrozen aluminum sheet under a certain temperature and humidity. The formula is listed as follow:
Table 7 shows the frost mass of various aluminum sheets under different experimental conditions.
From Figure 5, we ascertain see that:
- It was shown that under all the test conditions, the frost mass of the different samples increased linearly. The frost mass increased as the surface temperature decreased.
- The frost mass of Sample 1 was far higher than Sample 2, Sample 3, and Sample 4 from the first 10 min and under all the test conditions, which showed that, relative to the polished aluminum, nanoporous hydrophilic aluminum can decrease the formation of frost mass during the frosting process. The highest frost mass was 0.0806 g, which was formed by Sample 1 at a surface temperature of −20 °C, while the lowest frost mass was 0.0179 g, which was formed by Sample 2 at a surface temperature of −5 °C.
- The frost mass of the different nanoporous hydrophilic aluminum sheets was similar at 10 min of frosting. But the difference of the frost mass on the three nanoporous hydrophilic aluminum sheets was obviously increased at the later frosting stage. This was because, in the early frosting stage, the frost mass was mainly affected by the surface characteristics of the material. Samples 2, 3, and 4 showed similar frost resistant performance in the early frosting stage. In the later stage of the experiment, frost mainly continued to grow on the initial frost branch. New frost crystals formed more easily on the sharp frost branch than on the flat frost layer. Therefore, the difference of the frost mass on the nanoporous hydrophilic surfaces, with different frost shapes, increased in the later stage of frost formation.
4.3.2. Frost Mass Reduction Ratio
Similar to the frost thickness reduction ratio, the frost mass reduction ratio was used to illustrate how much lesser the frost mass of the nanoporous hydrophilic aluminum sheets (Samples 2–4) was than the frost mass of the polished aluminum sheet (Sample 1). The frosting performance of the nanoporous hydrophilic aluminum sheets were evaluated more intuitively by using the frost mass reduction rate. In this experiment, the frost mass reduction rate at one hour is shown in Figure 6.
The following conclusions could be drawn from the above figure:
- The frost mass reduction rate of the nanoporous hydrophilic aluminum sheets increased firstly and then decreased with the increase of the surface temperature. All of the samples reached the maximum frost mass reduction ratio when the surface temperature was −15 °C. As a result, for the nanoporous hydrophilic aluminum sheets, −15 °C was the optimum surface temperature for delaying frost at Ta = 5 °C, φ = 60%.
- Among the three kinds of nanoporous hydrophilic aluminum sheets (Samples 2–4), the frost reduction rate of Sample 2 was the highest, reaching a maximum of 65.9% at the surface temperature of −15 °C. And the frost reduction rate of Sample 3 was the lowest, with a minimum value of 13.7% when the surface temperature was −5 °C.
It can be inferred that the nanoporous hydrophilic aluminum sheets greatly reduced the frost mass compared with the polished aluminum sheet. To reach a certain frost mass, the time required for the nanoporous hydrophilic aluminum sheets was longer than that of the polished aluminum sheets. That means, the nanoporous hydrophilic aluminum sheets had a good frosting delay effect, and the effect of Sample 2 was the best. Therefore, it can be deduced from the results that nanoporous hydrophilic aluminum sheets can reduce the requirement for defrosting by delaying the frosting process, thereby reducing the energy consumption and conserving energy.
4.4. Frosting Rate
The frosting rate refers to the frost mass per unit area and per unit time on the aluminum sheet. The frosting rate is shown in Figure 7.
Under all experimental conditions, the frosting rate of the different samples increased, in a curved shape, with the decrease of the surface temperature. The frosting rate increased from Sample 2, to Sample 4, to Sample 3, to Sample 1, respectively.
When the surface temperature was −15 °C, the frosting rate of Sample 1 reached 5.01 g/(m2·min) and the frosting rate of Sample 2 was 1.71 g/(m2·min). The frosting rate of Sample 2 was about one-third of that of Sample 1. It was obvious that the nanoporous hydrophilic surface could greatly reduce the frost mass.
4.5. The Effect of Surface Properties on Frost Formation
According to the measured values of contact angle, surface pore diameter, and frosting mass, the relationship between the frost mass, contact angle, and surface pore diameter can be plotted as shown in Figure 8.
It can be seen from Figure 8 that the frost mass of all of the nanoporous hydrophilic aluminum sheets were lower compared with the polished aluminum sheet. This suggests that nanoporous hydrophilic aluminum can decrease frost formation. However, among the three kinds of nanoporous hydrophilic aluminum sheets, Sample 2, with the largest contact angle and the smallest pore diameter, showed the best frost mass reduction performance, and Sample 4, with largest pore diameter and smallest contact angle, ranked second in terms of performance. This means that, under different experimental conditions, the frost mass on the aluminum surfaces was not only related to the contact angle of the surface, but also to the surface pore diameter.
In the test, nanopores with different pore diameters were fabricated by anodic oxidation. The increasement of the surface pore diameter affected the surface roughness and hydrophilicity. In general, manufacturing nanopores and promoting hydrophilicity were beneficial to the delaying of the frosting process on the aluminum surfaces. Therefore, the frost thickness and frost mass of the nanoporous hydrophilic aluminum sheets was smaller than that of the polished aluminum sheet.
However, a larger contact angle promoted homogeneous nucleation. According to the classical nucleation theory, promoting homogeneous nucleation makes close to one, which causes the Gibbs free energy barrier to increase so that the frost formation can be delayed. That is to say, for the hydrophilic surfaces, although all of them have the effect of relieving frost, the smaller the contact angle, the greater the frost mass. This was not inconsistent with the law of frost thickness obtained in the previous paragraph. It can be explained that a small contact angle makes the droplets and the aluminum substrate contact more closely, resulting in a smaller frosting thickness. In conclusion, manufacturing nanopores and promoting hydrophilicity both play a beneficial role in frost reduction. However, for nanopore hydrophilic aluminum, the effect of the contact angle and pore diameter on frost formation is complex. Further research on exploring the law of the anti-frost mechanism is essential.
5. Conclusions
Through the experimental research and analysis, the following conclusions can be drawn:
- By observing the appearance of frost on the aluminum surface, it was found that, compared with the ordinary polished aluminum sheet, the droplets that were condensed on the surface of the nanoporous aluminum sheets had smaller diameters.
- The topography of the frost layers on the sides of the aluminum sheets were different. The frost layer thickness decreased with the decrease of the aluminum surface contact angle. At the end of frosting, Sample 4 had the smallest frost layer thickness. To ensure that equipment operates under a stable air pressure, using nanoporous hydrophilic aluminum, with a low frost thickness, as the material for the fin could be a good alternative.
- Under all the test conditions, the frost mass measurements of the nanoporous hydrophilic aluminum sheets were lower than the polished aluminum sheet, from the early stage of frost formation. For all the nanoporous hydrophilic aluminum sheets, −15 °C was the optimum surface temperature for delaying frost formation; at Ta = 5 °C, φ = 60%. Furthermore, the frost mass reduction rate of Sample 2 was the highest, reaching a maximum of 65.9% at a surface temperature of −15 °C. The study showed that the nanoporous hydrophilic aluminum sheets could reduce the frost mass to delay frost formation, decrease the defrosting frequency, and, consequently, could conserve energy.
- When the surface temperature was −15 °C, the frosting rate of Sample 1 reached 5.01 g/(m2·min) and the frosting rate of Sample 2 was 1.71 g/(m2·min). The frosting rate of Sample 2 was about one-third of that of Sample 1.
- Based on the classical nucleation theory, frosting is related to the surface contact angle and roughness. In general, the frost thickness and frost mass of the nanoporous hydrophilic aluminum was smaller than that of the polished aluminum. For the nanoporous hydrophilic aluminum sheets, Sample 2 and Sample 4 were better for lessening the formation of frost. The experiment revealed that manufacturing nanopores and promoting hydrophilicity can delay the formation of frost.
Author Contributions
Conceptualization, W.Y.; Methodology, W.Y.; Software, B.Z.; Validation, W.Y., S.H. and X.Z.; Formal Analysis, B.Z.; Investigation, S.H.; Resources, W.Y.; Data Curation, B.Z.; Writing-Original Draft Preparation, B.Z.; Writing-Review & Editing, X.Z.; Visualization, Y.Z.; Supervision, W.Y.; Project Administration, Y.Z.; Funding Acquisition, W.Y.
Funding
This research was funded by National Key R&D Program of China: Low Energy Dew Point Cooling for Computing Data Centres, grant number 2016YFE0133300; ROPEAN COMMISSION: Horizon 2020-Research and Innovation Framework Programme: Low Energy Dew Point Cooling for Computing Data Centres, grant number 734340-DEW-COOL-4-CDC-MSCA-RIS; Department of Science and Technology of Guangdong Province, China, grant number 2014A010106031; Department of Science and Technology of Guangdong Province, China, grant number 2013B091500094; Guangdong Provincial Key Country Joint Funding Projects, grant number 2018A050501002. And the APC was funded by National Key R&D Program of China: Low Energy Dew Point Cooling for Computing Data Centres, grant number 2016YFE0133300.
Acknowledgments
This work was financially supported by the National Key R&D Program of China: Low Energy Dew Point Cooling for Computing Data Centers (2016YFE0133300); ROPEAN COMMISSION; Horizon 2020-Research and Innovation Framework Program: Low Energy Dew Point Cooling for Computing Data Centres (734340-DEW-COOL-4-CDC-MSCA-RIS); Department of Science and Technology of Guangdong Province, China (2014A010106031 & 2013B091500094); and Guangdong Provincial Key Country Joint Funding Projects (2018A050501002).
Conflicts of Interest
The authors declare no conflicts of interest.
Nomenclature
| T | temperature (°C) |
| φ | air relative humidity (%) |
| θ | contact angle (°) |
| d | pore diameter (nm) |
| I | current (A) |
| L | length (mm) |
| W | width (mm) |
| H | height (mm) |
| M | mass (g) |
| Z | frost thickness (mm) |
| α | frost thickness reduction ratio (%) |
| t | time (min) |
| ΔG | change of Gibbs free energy (J) |
| ΔGx | change of Gibbs free energy per unit volume (J/m3) |
| ΔG* | activation energy to reach the critical nucleus size (J) |
| ΔGf,v | volumetric Gibbs free energy per unit volume between water and ice (J/m3) |
| r | nucleation radius (m) |
| γ | interfacial energy between two phases (J/m2) |
| f | geometrical factor relating to the energy barrier for homogeneous nucleation to heterogeneous nucleation |
| R | roughness curvature radius of the substrate |
| Subscripts | |
| s | surface |
| a | air |
| u | unfrosted |
| f | frost |
| ave | average value |
| max | maximum value |
| min | minimum value |
| 1 | sample 1 |
| n | number of samples, n = 2, 3, 4 |
| c | critical ice nucleus size |
| A | phase A |
| B | phase B |
| I | ice |
| W | water |
| het | heterogeneous |
| hom | homogeneous |
References
- Yang, L.; Yan, H.; Lam, J.C. Thermal comfort and building energy consumption implications—A review. Appl. Energy 2014, 115, 164–173. [Google Scholar] [CrossRef]
- Pérez-Lombard, L.; Ortiz, J.; Pout, C. A review on buildings energy consumption information. Energy Build. 2008, 40, 394–398. [Google Scholar] [CrossRef]
- Zhang, L.; Jiang, Y.; Dong, J.; Yao, Y. Advances in vapor compression air source heat pump system in cold regions: A review. Renew. Sustain. Energy Rev. 2018, 81, 353–365. [Google Scholar] [CrossRef]
- Kim, K.; Lee, K.S. Frosting and defrosting characteristics of a fin according to surface contact angle. Int. J. Heat Mass Transf. 2011, 54, 2758–2764. [Google Scholar] [CrossRef]
- Lv, J.; Song, Y.; Jiang, L.; Wang, J.V. Bio-inspired strategies for anti-icing. ACS Nano 2014, 8, 3152–3169. [Google Scholar] [CrossRef] [PubMed]
- Wang, F.; Liang, C.; Yang, M.; Fan, C.; Zhang, X. Effects of surface characteristic on frosting and defrosting behaviors of fin-tube heat exchangers. Appl. Therm. Eng. 2015, 75, 1126–1132. [Google Scholar] [CrossRef]
- Sheng, W.; Liu, P.; Dang, C.; Liu, G. Review of restraint frost method on cold surface. Renew. Sustain. Energy Rev. 2017, 79, 806–813. [Google Scholar] [CrossRef]
- Orejon, D.; Shardt, O.; Gunda, N.S.; Ikuta, T.; Takahashi, K.; Takata, Y.; Mitra, S.K. Simultaneous dropwise and filmwise condensation on hydrophilic microstructured surfaces. Int. J. Heat Mass Transf. 2017, 114, 187–197. [Google Scholar] [CrossRef]
- Liu, Z.; Wang, H.; Zhang, X.; Meng, S.; Ma, C. An experimental study on minimizing frost deposition on a cold surface under natural convection conditions by use of a novel anti-frosting paint. Part I. Anti-frosting performance and comparison with the uncoated metallic surface. Int. J. Refrig. 2006, 29, 229–236. [Google Scholar] [CrossRef]
- Lee, H.; Shin, J.; Ha, S.; Choi, B.; Lee, J. Frost formation on a plate with different surface hydrophilicity. Int. J. Heat Mass Transf. 2004, 47, 4881–4893. [Google Scholar] [CrossRef]
- Okoroafor, E.U.; Newborough, M. Minimising frost growth on cold surfaces exposed to humid air by means of crosslinked hydrophilic polymeric coatings. Appl. Therm. Eng. 2000, 20, 737–758. [Google Scholar] [CrossRef]
- Shin, J.; Tikhonov, A.V.; Kim, C. Experimental study on frost structure on surfaces with different hydrophilicity: Density and thermal conductivity. J. Heat Transf. 2003, 125, 84–94. [Google Scholar] [CrossRef]
- Liu, Z.L.; Zhang, X.H.; Wang, H.Y.; Meng, S.; Cheng, S.Y. Influences of surface hydrophilicity on frost formation on a vertical cold plate under natural convection conditions. Exp. Therm. Fluid Sci. 2007, 31, 789–794. [Google Scholar] [CrossRef]
- Jhee, S.; Lee, K.S.; Kim, W.S. Effect of surface treatments on the frosting/defrosting behavior of a fin-tube heat exchanger. Int. J. Refrig. 2002, 25, 1047–1053. [Google Scholar] [CrossRef]
- Gohari, B.; Russell, K.; Hejazi, V.; Rohatgi, P. Role of water solidification concepts in designing nano-textured anti-icing surfaces. J. Phys. Chem. B 2017, 121, 7527–7535. [Google Scholar] [CrossRef]
- Schutzius, T.M.; Jung, S.; Maitra, T.; Eberle, P.; Antonini, C.; Stamatopoulos, C.; Poulikakos, D. Physics of icing and rational design of surfaces with extraordinary icephobicity. Langmuir 2015, 31, 4807–4821. [Google Scholar] [CrossRef]
- Sommers, A.D.; Jacobi, A.M. Creating micro-scale surface topology to achieve anisotropic wettability on an aluminum surface. J. Micromech. Microeng. 2006, 16, 1571–1578. [Google Scholar] [CrossRef]
- Cassie, A.B.D.; Baxter, S. Wettability of porous surfaces. Trans. Faraday Soc. 1944, 40, 546–551. [Google Scholar] [CrossRef]
- Wenzel, R. Resistance of solid surfaces to wetting by water. Ind. Eng. Chem. 1936, 28, 988–994. [Google Scholar] [CrossRef]
- Wang, W.C.; Zhao, W.; Wang, K.G.; Wang, L.; Wang, X.W.; Wang, S.; Zhang, C.; Bai, J.T. On hydrophilicity improvement of the porous anodic alumina film by hybrid nano/micro structuring. Appl. Surf. Sci. 2017, 416, 710–715. [Google Scholar] [CrossRef]
- Piucco, R.O.; Hermes, C.J.; Melo, C.; Barbosa, J.R., Jr. A study of frost nucleation on flat surfaces. Exp. Therm. Fluid Sci. 2008, 32, 1710–1715. [Google Scholar] [CrossRef]
- Chen, A.; Huang, H. Rapid fabrication of t-shaped micropillars on polypropylene surfaces with robust cassie-baxter state for quantitative droplet Collection. J. Phys. Chem. C 2016, 120, 1556–1561. [Google Scholar] [CrossRef]
- Hobbs, P.V. Ice Physics; Clarendon Press: Oxford, UK, 1974. [Google Scholar]
- Hosford, W.F. Materials Science: An Intermediate Text; Cambridge University Press: Cambridge, UK, 2006. [Google Scholar]
- Pruppacher, H.R.; Klett, J.D.; Wang, P.K. Microphysics of clouds and precipitation. Aerosol Sci. Technol. 1998, 28, 381–382. [Google Scholar] [CrossRef]
Figure 1.
SEM images of micro-morphology on the nanoporous hydrophilic aluminum surfaces: (a) Sample 2, d = 150 nm; (b) Sample 3, d = 350 nm; and (c) Sample 4, d = 700 nm.
Figure 1.
SEM images of micro-morphology on the nanoporous hydrophilic aluminum surfaces: (a) Sample 2, d = 150 nm; (b) Sample 3, d = 350 nm; and (c) Sample 4, d = 700 nm.

Figure 2.
The contact angles of the different aluminum surfaces: (a) Sample 1, θ = 60.2°; (b) Sample 2, θ = 47.8°; (c) Sample 3, θ = 35.9°; and (d) Sample 4, θ = 22.9°.
Figure 2.
The contact angles of the different aluminum surfaces: (a) Sample 1, θ = 60.2°; (b) Sample 2, θ = 47.8°; (c) Sample 3, θ = 35.9°; and (d) Sample 4, θ = 22.9°.
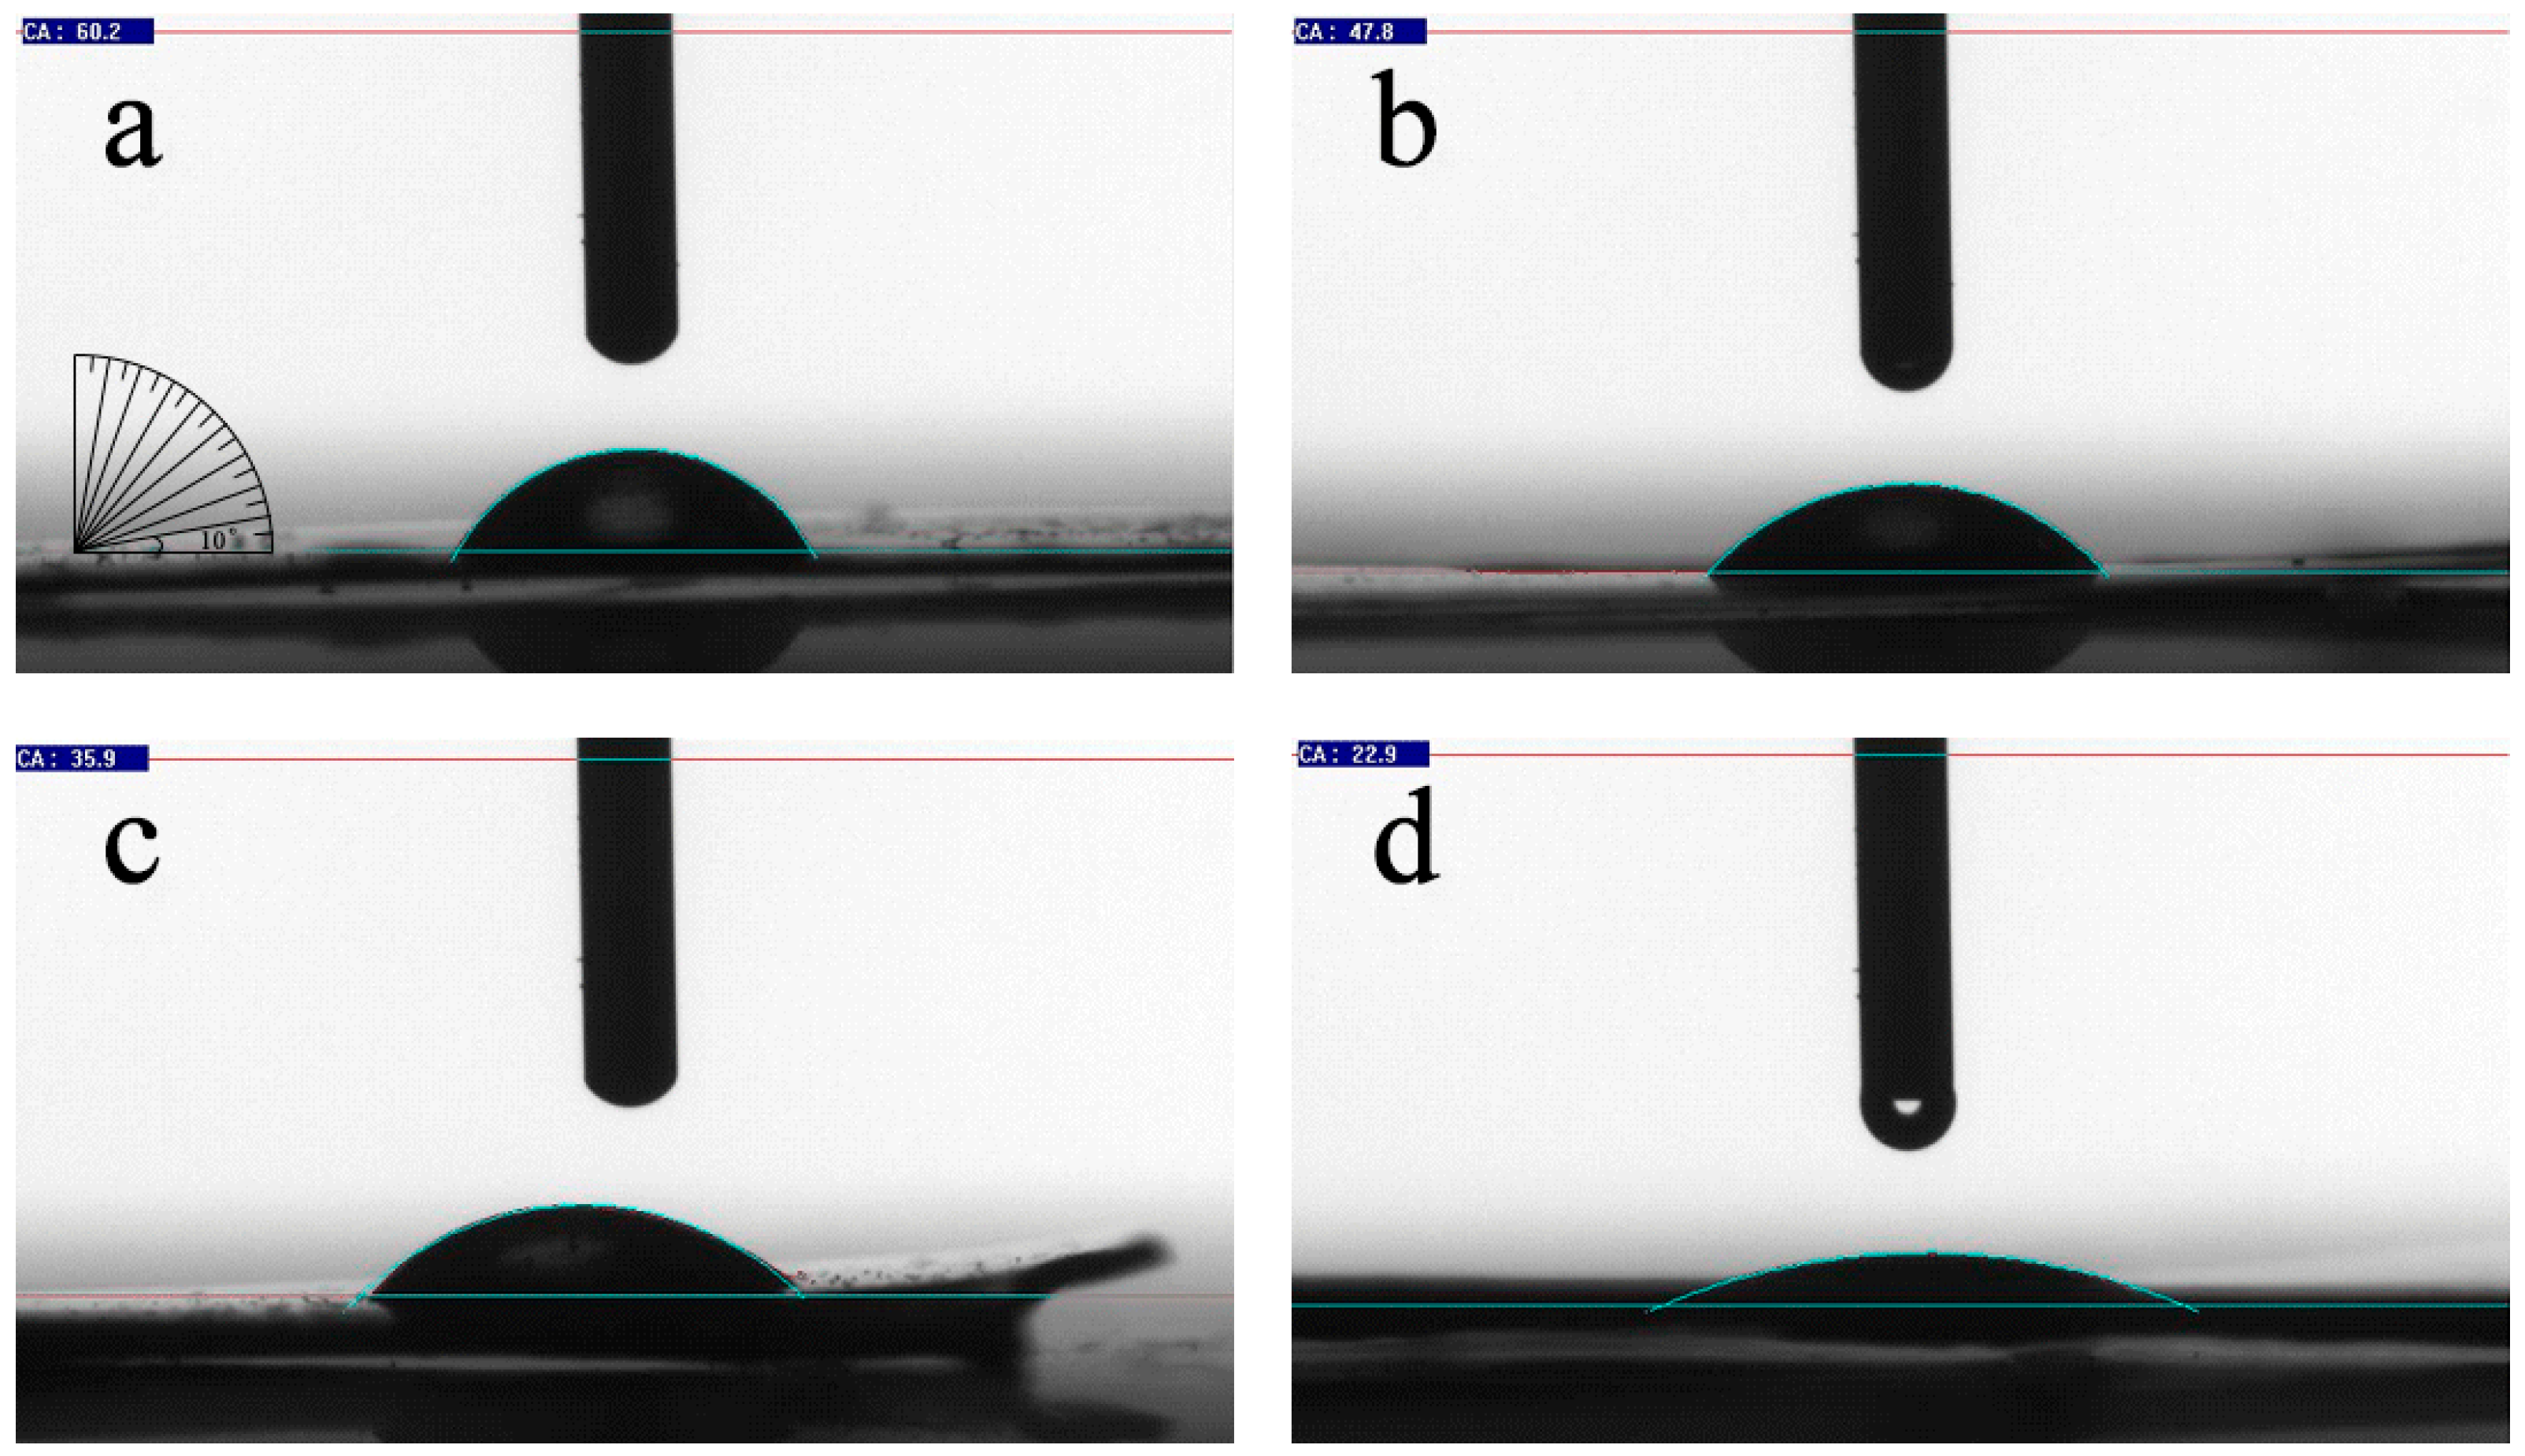
Figure 3.
Schematic of the experimental testing rig. 1: Temperature controller; 2: Air-cooled radiator; 3: Water tank; 4: Water pump; 5: Semiconductor refrigerator; 6: Thermocouple; 7: Test sample; 8: Temperature and humidity sensor; 9: Environment box; 10: Entrance of wet and cool air; 11: Observation hole of tempered glass; 12: Top microscope; 13: Top CCD; 14: Side microscope; 15: Side CCD; 16: Computer; 17: Electronic balance.

Figure 4.
The frost thickness reduction ratio of Sample 2, Sample 3, and Sample 4 at Ts = −15 °C, Ta = 5 °C, and φ = 60%.
Figure 4.
The frost thickness reduction ratio of Sample 2, Sample 3, and Sample 4 at Ts = −15 °C, Ta = 5 °C, and φ = 60%.
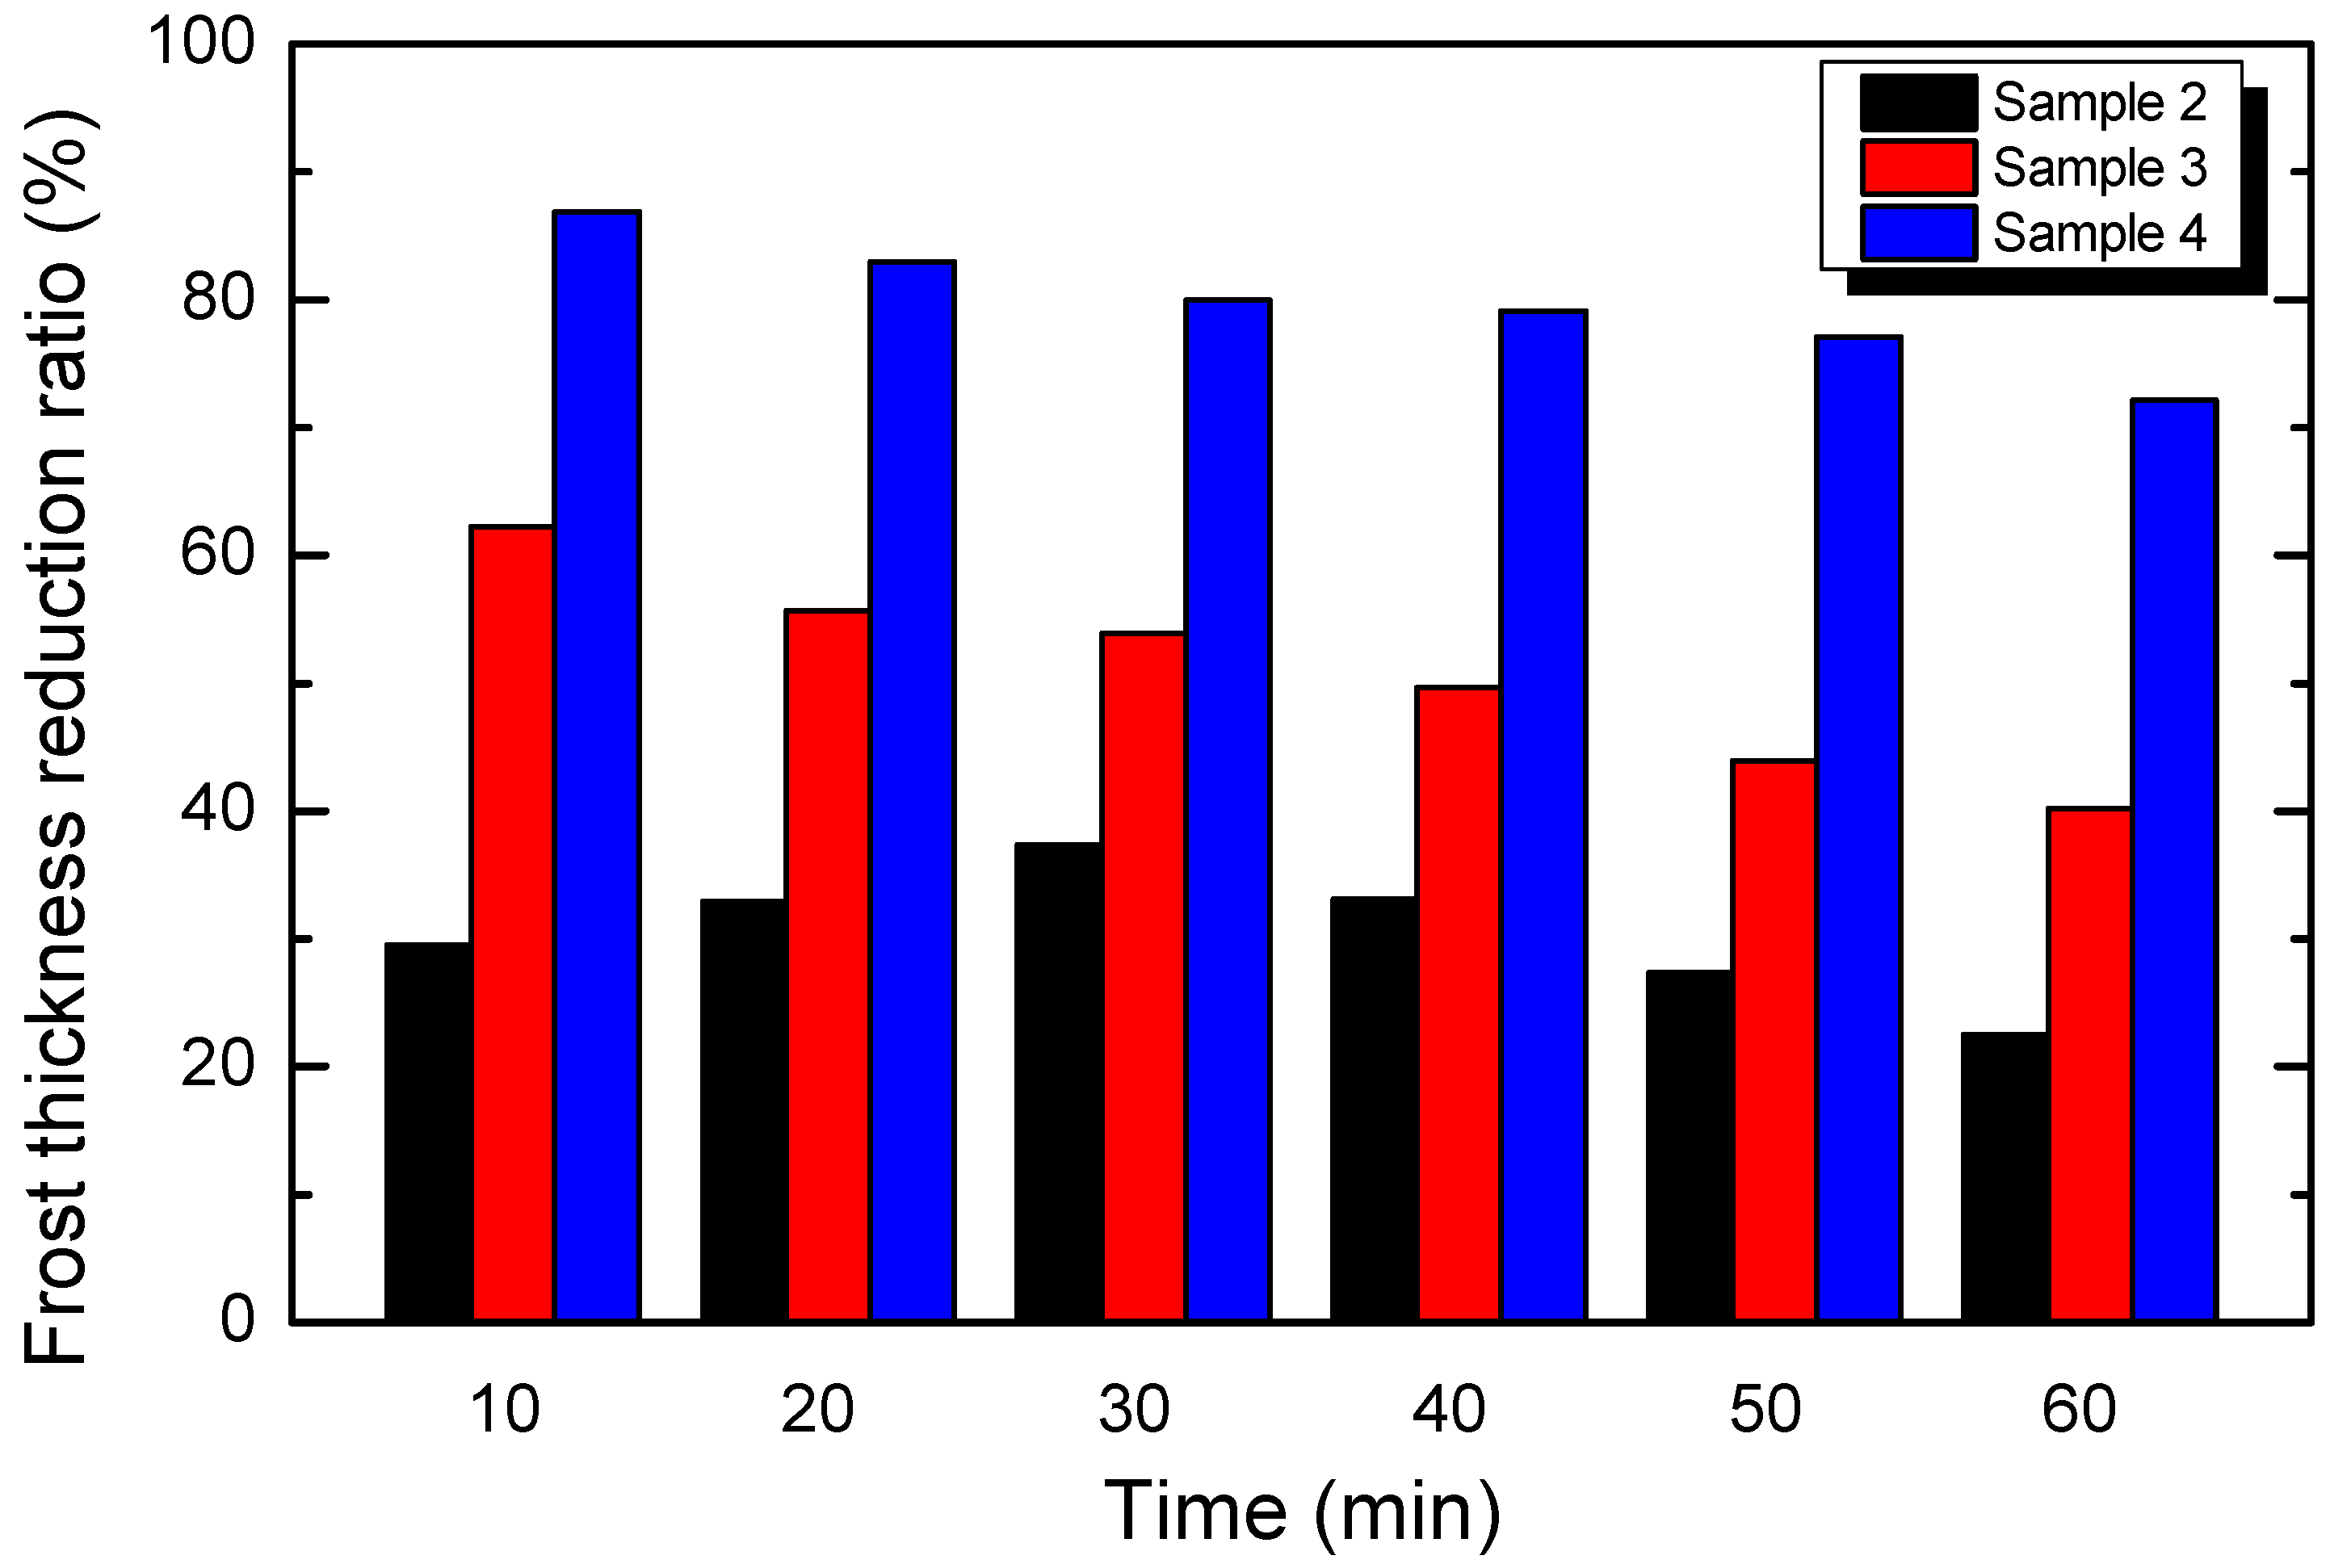
Figure 5.
The frost mass of the different aluminum sheets under different surface temperatures; Ta = 5 °C, φ = 60%, and Ts = (a) −5 °C; (b) −10 °C; (c) −15 °C; and (d) −20 °C.
Figure 5.
The frost mass of the different aluminum sheets under different surface temperatures; Ta = 5 °C, φ = 60%, and Ts = (a) −5 °C; (b) −10 °C; (c) −15 °C; and (d) −20 °C.

Figure 6.
The frost mass reduction ratio of the nanoporous hydrophilic aluminum sheets under different surface temperatures, and at Ta = 5 °C, φ = 60%.
Figure 6.
The frost mass reduction ratio of the nanoporous hydrophilic aluminum sheets under different surface temperatures, and at Ta = 5 °C, φ = 60%.

Figure 7.
The frosting rate of the different aluminum sheets under different surface temperatures.
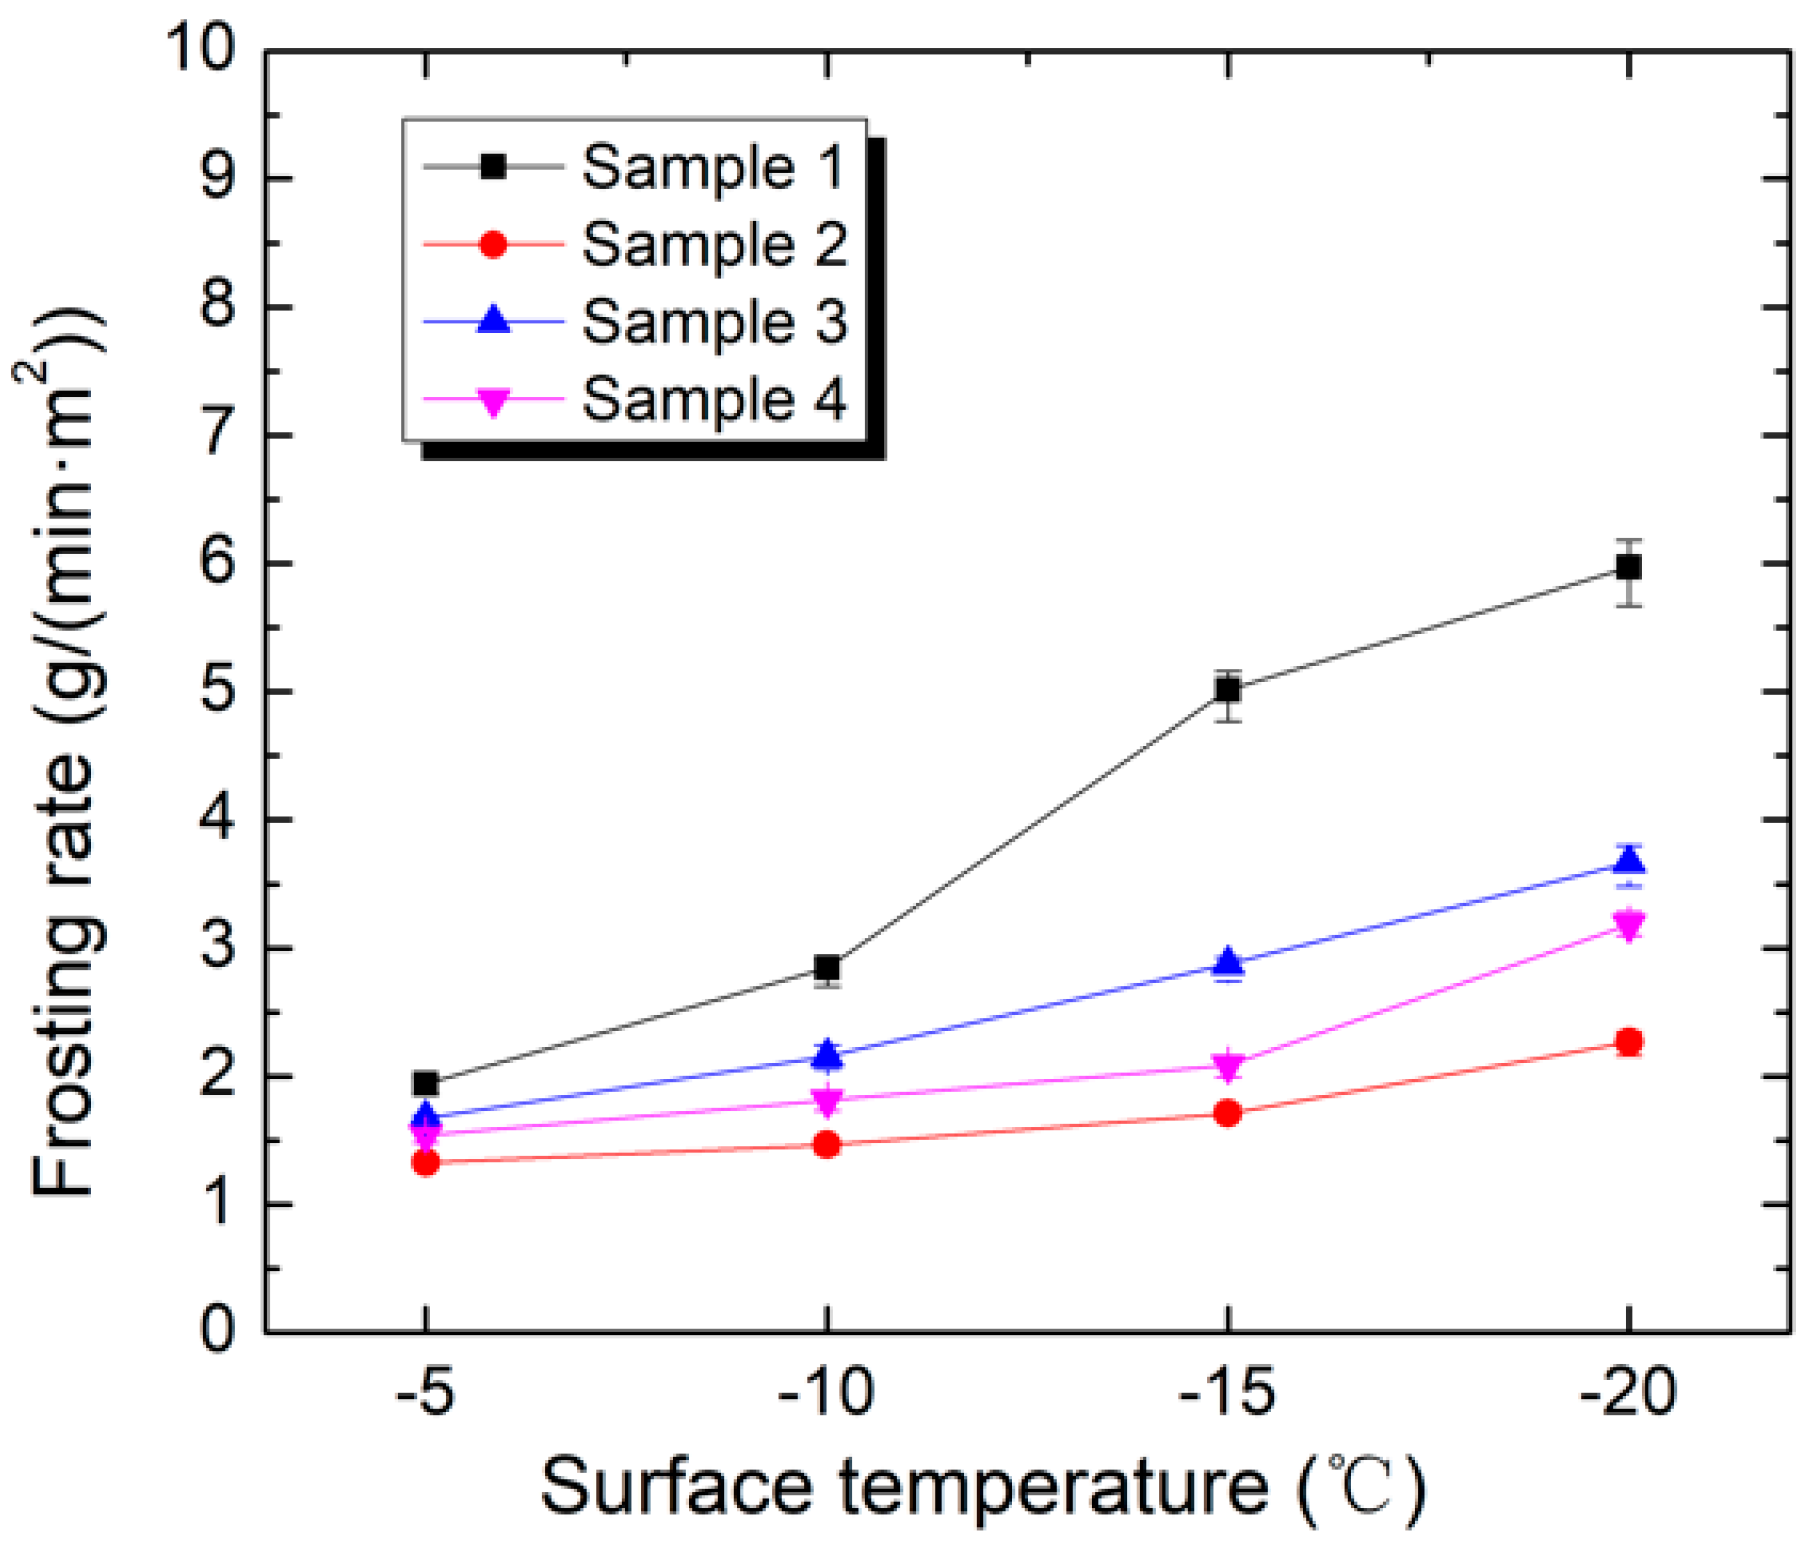
Figure 8.
The relationship between the frost mass, contact angle, and pore diameter under different surface temperatures.
Figure 8.
The relationship between the frost mass, contact angle, and pore diameter under different surface temperatures.


Table 1.
The parameters of the experimental samples.
| Test Sample | Current (I/A) | Contact Angle (θ/°) | Pore Diameter (d/nm) | Size (mm × mm) |
|---|---|---|---|---|
| 1 | - | 60.2 | 0 | 15 × 15 |
| 2 | 1 | 47.8 | 150 | 15 × 15 |
| 3 | 2 | 35.9 | 350 | 15 × 15 |
| 4 | 4 | 22.9 | 700 | 15 × 15 |
Table 2.
The parameters of the experimental equipment used.
| Name | Type | Parameter |
|---|---|---|
| Multichannel temperature monitor | AT4340 | Sensor: K-type thermocouple; measuring range: −200–1300 °C; accuracy: ±1 °C; |
| Double-channel temperature and humidity monitor | LS-HT211X | Temperature measurement range: −40–100 °C; temperature accuracy: ±0.5 °C; relative humidity measurement range: 0%–100%; relative humidity accuracy: ±3% |
| Pump | WH-D12220 | Power: 3.6 W; maximum head: 2 m; water flow: 2 L/min; noise: 30 dB |
| Semiconductor refrigerator | X206 | Cooling capacity: 480 W/h; applicable volume: 1–2 m2; temperature difference: 7–12 °C; |
| Low temperature humidity chamber | BYCT-TH150B | Temperature range: −40–150 °C; temperature accuracy: ±0.5 °C; relative humidity range: 20%–90%; relative humidity accuracy: ±2% |
| Digital microscope | RH-SM-10A | Maximum eyepiece resolution: 2592 × 1944; objective lens magnification: 0.7–4.5X; |
| Electronic balance | BSM−120.4 | Range: 0–120 g; accuracy: 0.1 mg. |
Table 3.
The test conditions.
| Test Condition | Surface Temperature Ts (°C) | Air Temperature Ta (°C) | Air Relative Humidity φ (%) |
|---|---|---|---|
| A | −5 | 5 | 60 |
| B | −10 | 5 | 60 |
| C | −15 | 5 | 60 |
| D | −20 | 5 | 60 |
Table 4.
The structure of the frost layer on different aluminum surfaces at Ts = −15 °C, Ta = 5 °C, and φ = 60%.
Table 4.
The structure of the frost layer on different aluminum surfaces at Ts = −15 °C, Ta = 5 °C, and φ = 60%.
| Time (min) | Sample 1 (θ = 60.2°) | Sample 2 (θ = 47.8°) | Sample 3 (θ = 35.9°) | Sample 4 (θ = 22.9°) |
|---|---|---|---|---|
| 0 |  | 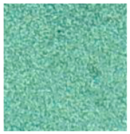 |  | 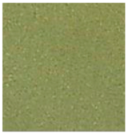 |
| 1 | 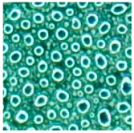 | 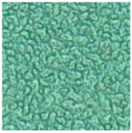 |  |  |
| 5 |  |  |  |  |
| 10 |  |  |  | 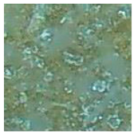 |
Table 5.
The structure of the frost layer on the side of the aluminum sheets at Ts = −15 °C, Ta = 5 °C, and φ = 60%.
Table 5.
The structure of the frost layer on the side of the aluminum sheets at Ts = −15 °C, Ta = 5 °C, and φ = 60%.
| Time (min) | Sample 1 (θ = 60.2°) | Sample 2 (θ = 47.8°) | Sample 3 (θ = 35.9°) | Sample 4 (θ = 22.9°) |
|---|---|---|---|---|
| 0 |  |  | 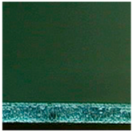 |  |
| 1 |  |  |  |  |
| 5 | 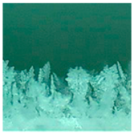 | 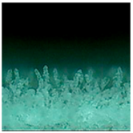 | 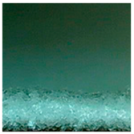 | 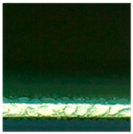 |
| 10 |  |  | 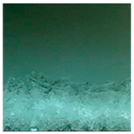 |  |
Table 6.
The frost thickness of the different samples at Ts = −15 °C, Ta = 5 °C, and φ = 60%.
| Test Sample | Time (min) | ||||||
|---|---|---|---|---|---|---|---|
| 5 | 10 | 20 | 30 | 40 | 50 | 60 | |
| 1 (θ = 60.2°) | 0.42 | 0.61 | 0.88 | 1.15 | 1.39 | 1.57 | 1.69 |
| 2 (θ = 47.8°) | 0.24 | 0.43 | 0.59 | 0.72 | 0.93 | 1.14 | 1.31 |
| 3 (θ = 35.9°) | 0.12 | 0.23 | 0.39 | 0.53 | 0.70 | 0.88 | 1.01 |
| 4 (θ = 22.9°) | 0.03 | 0.08 | 0.15 | 0.23 | 0.29 | 0.36 | 0.47 |
Table 7.
The frost mass of the different samples under different surface temperatures, and at Ta = 5 °C and φ = 60%.
Table 7.
The frost mass of the different samples under different surface temperatures, and at Ta = 5 °C and φ = 60%.
| Test Sample | θ (°) | d (nm) | Ts (°C) | |||
|---|---|---|---|---|---|---|
| −5 | −10 | −15 | −20 | |||
| 1 | 60.2 | 0 | 0.0262 | 0.0384 | 0.0677 | 0.0806 |
| 2 | 47.8 | 150 | 0.0179 | 0.0198 | 0.0231 | 0.0306 |
| 3 | 35.9 | 350 | 0.0226 | 0.0291 | 0.0388 | 0.0495 |
| 4 | 22.9 | 700 | 0.0208 | 0.0245 | 0.0282 | 0.0430 |
© 2018 by the authors. Licensee MDPI, Basel, Switzerland. This article is an open access article distributed under the terms and conditions of the Creative Commons Attribution (CC BY) license (http://creativecommons.org/licenses/by/4.0/).
Share and Cite
MDPI and ACS Style
Yang, W.; Zeng, B.; Zhang, Y.; He, S.; Zhao, X. Frosting Performance of a Nanoporous Hydrophilic Aluminum Surface. Energies 2018, 11, 3483. https://doi.org/10.3390/en11123483
AMA Style
Yang W, Zeng B, Zhang Y, He S, Zhao X. Frosting Performance of a Nanoporous Hydrophilic Aluminum Surface. Energies. 2018; 11(12):3483. https://doi.org/10.3390/en11123483
Chicago/Turabian StyleYang, Wansheng, Bin Zeng, Yanmei Zhang, Song He, and Xudong Zhao. 2018. "Frosting Performance of a Nanoporous Hydrophilic Aluminum Surface" Energies 11, no. 12: 3483. https://doi.org/10.3390/en11123483
Note that from the first issue of 2016, this journal uses article numbers instead of page numbers. See further details here.