Article

Fourier Transform Infrared (FTIR) Spectroscopy Analysis of Transformer Paper in Mineral Oil-Paper Composite Insulation under Accelerated Thermal Aging

School of Electrical Engineering and Informatics, Institut Teknologi Bandung, Bandung 40132, Indonesia
*
Author to whom correspondence should be addressed.
Energies 2018, 11(2), 364; https://doi.org/10.3390/en11020364
Submission received: 26 December 2017 / Revised: 27 January 2018 / Accepted: 29 January 2018 / Published: 4 February 2018
(This article belongs to the Section F: Electrical Engineering)

Abstract

:
Mineral oil is the most popular insulating liquid for high voltage transformers due to its function as a cooling liquid and an electrical insulator. Kraft paper has been widely used as transformer solid insulation for a long time already. The degradation process of transformer paper due to thermal aging in mineral oil can change the physical and chemical structure of the cellulose paper. Fourier transform infrared (FTIR) spectroscopy analysis was used to identify changes in the chemical structure of transformer paper aged in mineral oil. FTIR results show that the intensity of the peak absorbance of the O–H functional group decreased with aging but the intensity of the peak absorbance of the C–H and C=O functional groups increased with aging. Changes in the chemical structure of the cellulose paper during thermal aging in mineral oil can be analyzed by an oxidation process of the cellulose paper and the reaction process between the carboxylic acids in the mineral oil and the hydroxyl groups on the cellulose. The correlation between the functional groups and the average number of chain scissions of transformer paper gives initial information that the transformer paper performance can be identified by using a spectroscopic technique as a non-destructive diagnostic technique.

1. Introduction

Operational conditions of the transformer such as increased loading and short-circuit power might affect the ability of the transformer to endure the mechanical, electrical, and thermal stresses that occur. Those situations may accelerate the thermal aging of the transformer because electrical and mechanical properties of the transformer become worse due to those stresses. Cellulose paper has been used in power transformers as solid insulation for 100 years [1]. Cellulose is a homopolymer of d-anhydroglucose units bonded together with C1–C4 glycosidic oxygen linkages [2]. Cellulose paper plays an important role in considering the lifetime of power transformers [3,4,5]. Cellulose has been characterized by the degree of polymerization (DP), which is the average number of glucose rings of its polymeric chain [6,7]. The DP that is related to the tensile strength of the paper decreases with aging. At low DP levels, the ability to withstand high mechanical stresses is significantly reduced, increasing the risk of electrical failures such as generating the inrush current through windings [6,7]. By considering the effects of the damage of solid insulation of transformers, it can be concluded that the life of a transformer is directly related to its solid insulation condition. During operation, the degradation process of the cellulose paper takes place due to thermal aging, which is the dominant aging in power transformers. The lifetime of the solid insulation is affected by temperature, water, and oxygen [8]. The aging mechanism of solid insulation can be explained by the degradation process of cellulose, which is the combined effect of pyrolysis, hydrolysis, and oxidation [7]. Cellulose paper and insulating liquid are the main parts of power transformers’ insulation.
Nowadays, mineral oil is the most popular insulating liquid for high voltage transformers. Mineral oil has been used not only for liquid insulation but also as a cooling medium of power transformers. Mineral oil is well known as an insulating liquid for power transformers due to several advantages: good compatibility with cellulose paper as solid insulation, good physical and electrical properties, suitable properties such as good electrical arc quenching, availability, low cost, and long history [9,10,11]. Mineral oil is a complex mixture of several hydrocarbon molecules and its chemical formula consists of alkenes (paraffin), cyclic alkenes (naphthene), and aromatics [9,11]. Oxidation is the major degradation mechanism of hydrocarbon oil and the rate of oxidation depends on temperature [12]. The degradation process due to thermal aging can change the physical and chemical structure of transformer paper in mineral oil. Fourier transform infrared (FTIR) spectroscopy analysis can identify chemical bonds by using an infrared spectrum that is absorbed by the material. Spectroscopy is a powerful non-destructive technique that uses an electromagnetic radiation interaction effect to determine the atomic or molecular structure and the energy level of the substance [13]. So far, many researchers have developed the non-destructive technique to measure the condition of both the oil and the paper in a power transformer using spectroscopy techniques. For insulating liquid performance measurements, the combination of spectroscopy techniques and an artificial neural network is used to obtain the correlation between the spectral response and the chemical and physical properties of the oil. This combined method has been used to investigate a 2-FAL compound in transformer oil, the interfacial tension number of transformer oil, and various dissolved gases within transformer oil [13,14,15]. For insulating paper performance measurements, the spectroscopy technique and statistical analyses have been developed to obtain a correlation between the spectral response and the chemical properties of the paper. Several works have reported that this combined method has shown the possibility of using the spectroscopy technique for determining the degree of polymerization (DP) and water content of the transformer paper [6,16,17,18]. Currently, destructive methods such as viscometry have been widely used for the direct measurement of DP [6,19].
This paper reports the chemical structures of transformer paper aged in mineral oil using Fourier transform infrared (FTIR) spectroscopy. Fourier transform infrared (FTIR) spectroscopy shows the intensity of the peak absorbance of the functional groups of transformer paper, which can identify the chemical bond in a molecule of cellulose paper. This study was conducted to provide a better understanding of transformer paper characteristics in mineral oil during thermal aging using Fourier transform infrared (FTIR) spectroscopy. This study also gives initial information that the condition of the cellulose paper as transformer solid insulation, which has a direct correlation with the life of the transformer, can be identified by using a spectroscopy technique.

2. Experimental Specimens and FTIR Measurement

2.1. Preparation of Experimental Specimens

The sample needed for this experiment was a copper conductor, kraft paper, and mineral oil. Mineral oil used in this experiment is an uninhibited transformer oil that is typically used for high voltage transformers and conforms to IEC 60296. The transformer paper (thickness of 0.061 mm and a base weight of 0.0064 g/cm2) used for these studies was kraft paper, which is available commercially for power transformer windings. The initial water content of all kraft paper samples was about 5%. The copper conductor was needed in this experiment in order to obtain the real conditions of a transformer where the transformer coils are insulated by kraft paper and immersed in insulating liquid. IEEE Standard C57.100–2011 also recommends using a copper conductor in experiments relating to transformer solid insulation [20]. A total amount of 10 g kraft paper, 8.75 g copper conductor, and 200 g mineral oil were placed in a hermetical glass bottle [17,21]. A pre-treatment process was carried out on the mineral oil samples by putting the mineral oil in the oven for 24 h at 100 °C [9,11,17]. The purpose of this step was to reduce the amount of water content inside the mineral oil.
Kraft paper was cut into strips and wrapped around the copper conductor before the paper samples were inserted into heat-resistant glass bottles. After that, each aging test bottle was sealed. In this experiment, thermal aging using a sealed system was chosen based on the recommendation of the IEEE Standard C57.91–1995 [22]. An accelerated thermal aging test was conducted to obtain the aged paper samples in a short time. All of the sealed glass bottles were placed in two different ovens for aging and heated to 120 °C and 150 °C, respectively, for a certain period of time. Samples were taken out of the ovens at regular intervals: 336, 672, and 1008 h. Aging at a temperature of 150 °C was selected according to a reference published in IEEE by Mc Shane et al. [23], while aging at a temperature of 120 °C is a hot spot temperature according to the IEEE [24]. A list of samples is shown in Table 1.

2.2. Fourier Transform Infrared (FTIR) Spectroscopy

Electromagnetic radiation that interacts with a substance can be absorbed, transmitted, reflected, scattered, or have photoluminescence (PL), which provides significant information on the molecular structure and the energy level transition of that substance [13,25]. Paper samples placed in the path of an infrared beam will absorb and transmit light and then the light signal will penetrate the sample to the detector. The detector measures the intensity of the radiation moving into a sample and the intensity of the radiation transmitting through a sample. Figure 1a shows the schematic diagram of an FTIR spectrometer. Its output as a function of time is converted into a plot of absorption against wavenumber by a computer using a Fourier transform method [25]. In this experiment, the application of an ALPHA FTIR spectrometer was used to measure infrared spectra of the functional groups of transformer paper. An ALPHA FTIR spectrometer is shown in Figure 1b. FTIR using an attenuated total reflection (ATR) technique was used in this experiment to investigate the structural changes of cellulose paper by obtaining its infrared spectra. The penetration depth of a light beam using an ATR technique into a sample is about 0.5–3 μm [7]. This measurement only needed small samples of transformer paper and each sample was conducted twice to ensure the infrared spectra of the investigated paper samples. The observed spectra are the absorbance of the different paper samples versus the wavenumber range 4000–400 cm−1.

3. Results and Discussion

3.1. Fourier Transform Infrared (FTIR) Spectroscopy Analysis of Transformer Paper

During operation, the oil–paper composite insulation within a transformer experiences an aging process that is caused by a combination of thermal, electrical, and mechanical stresses. Thermal stress in oil–paper composite insulation is the most significant factor in insulation aging [26]. Due to thermal stress, the degradation process of insulation materials within transformers leads to changes in the chemical structure of the insulation material. A chemical reaction takes place during the degradation process. 
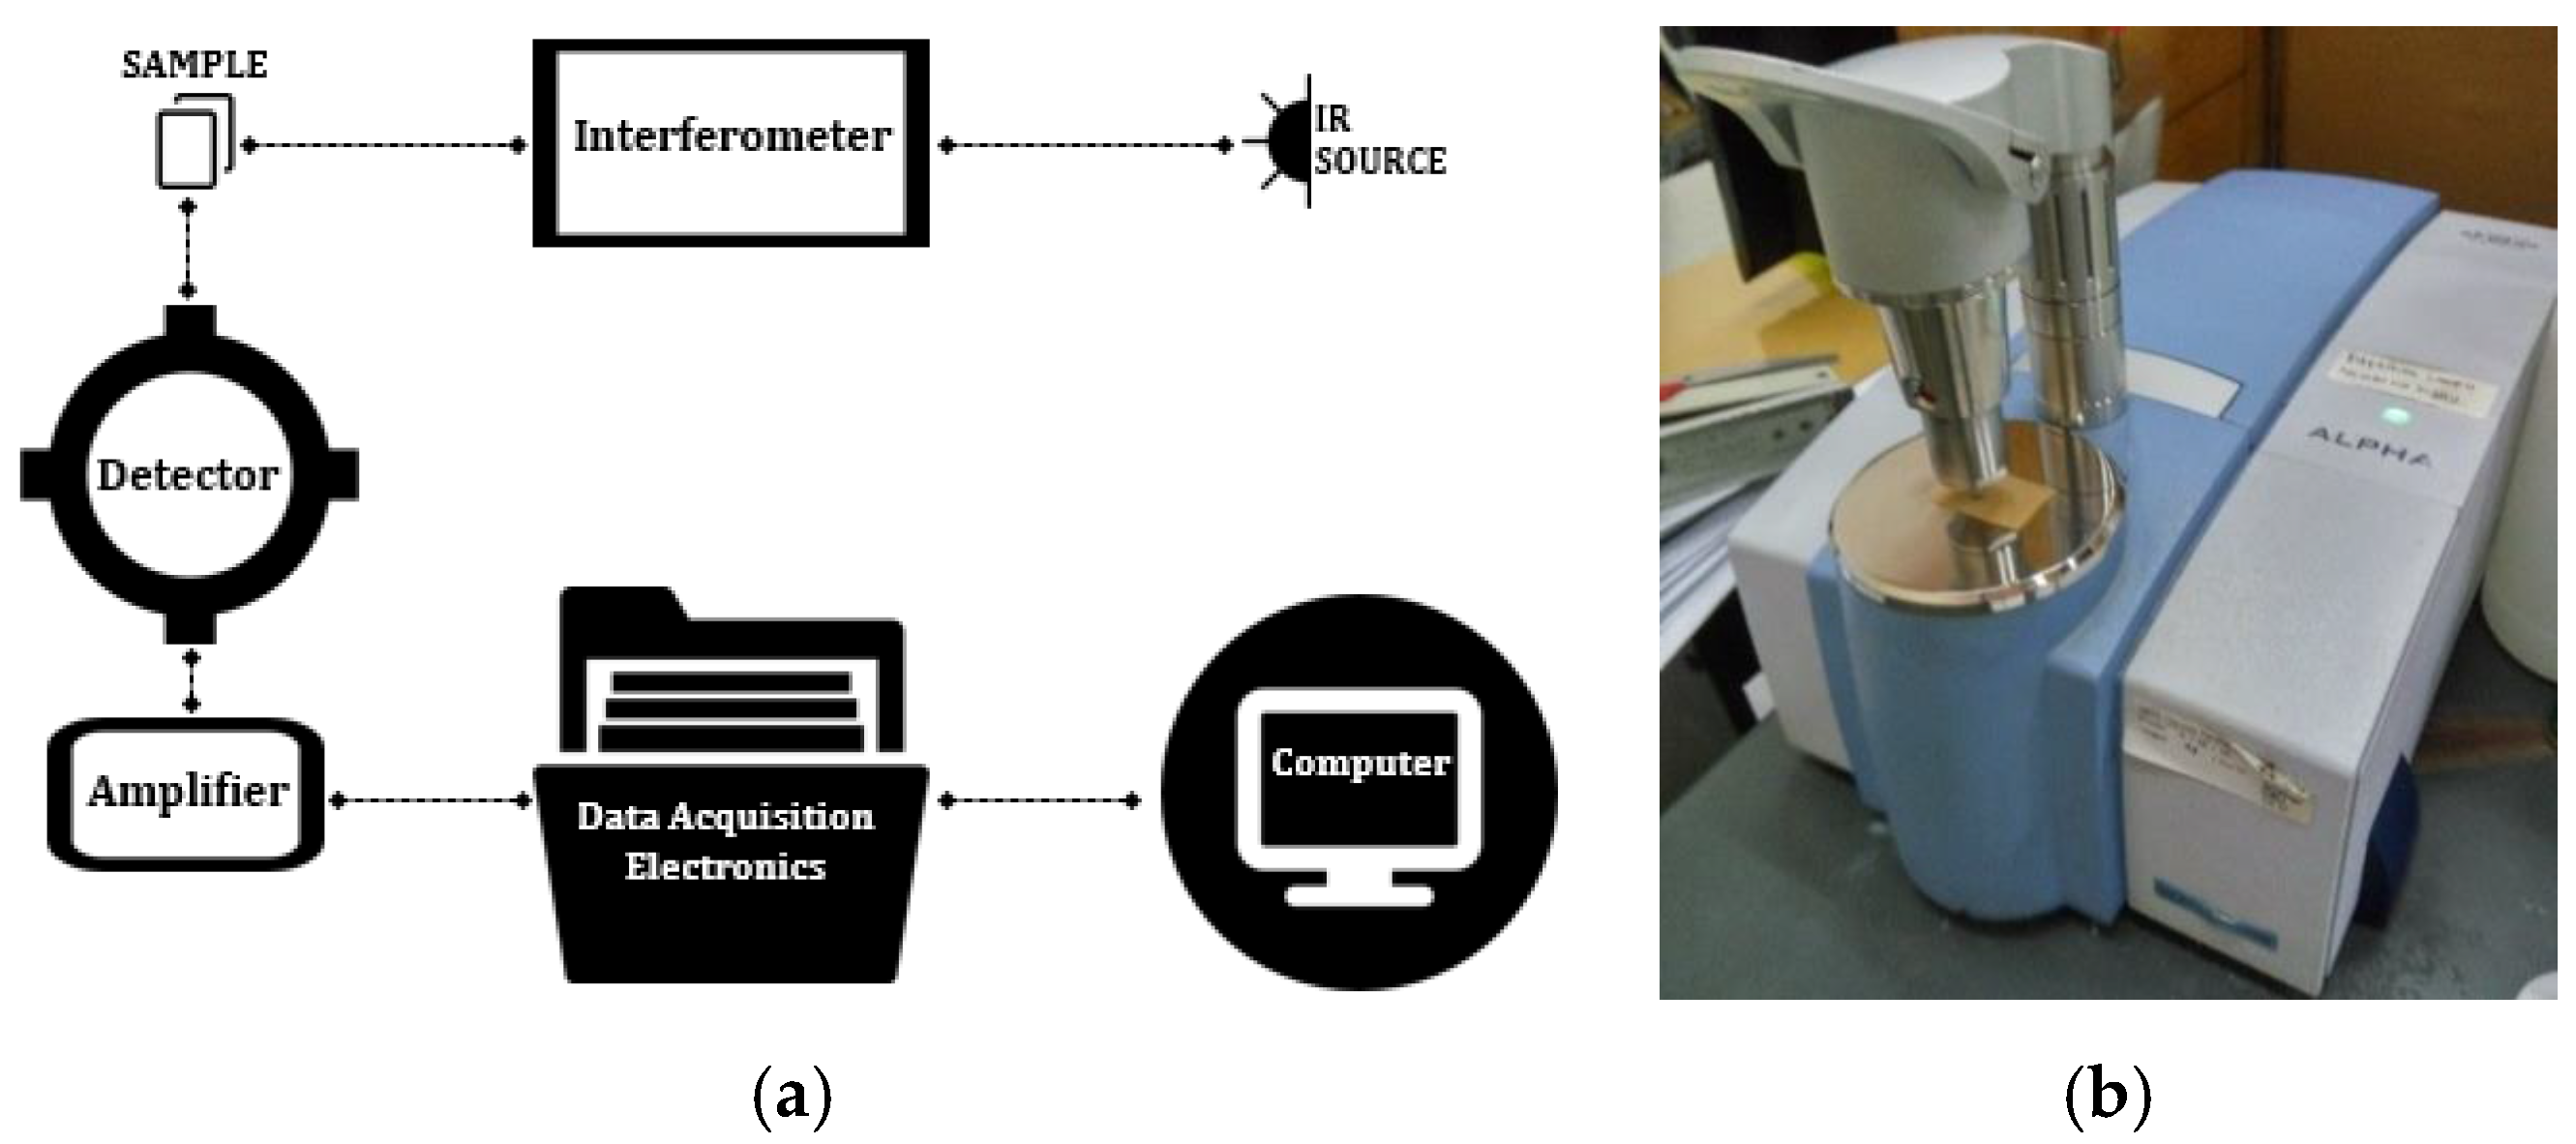
Table 2 shows the visual appearances of paper surfaces aged in mineral oil. The color of the paper surface becomes darker with aging. Solid dielectrics become darker as the aging time and temperature increase. It can be stated that an old transformer might have darker solid dielectrics compared to a new one. When higher temperatures were applied, the insulation paper became darker faster. The visual appearance of the paper sample changed with aging, which indicates changes in the microstructure and chemical structure of the cellulose paper. The chemical structure of the transformer paper aged in mineral oil can be identified by using Fourier transform infrared (FTIR) spectroscopy. FTIR was used to identify the functional groups of the investigated material, which is shown by the intensity of peak absorbance.
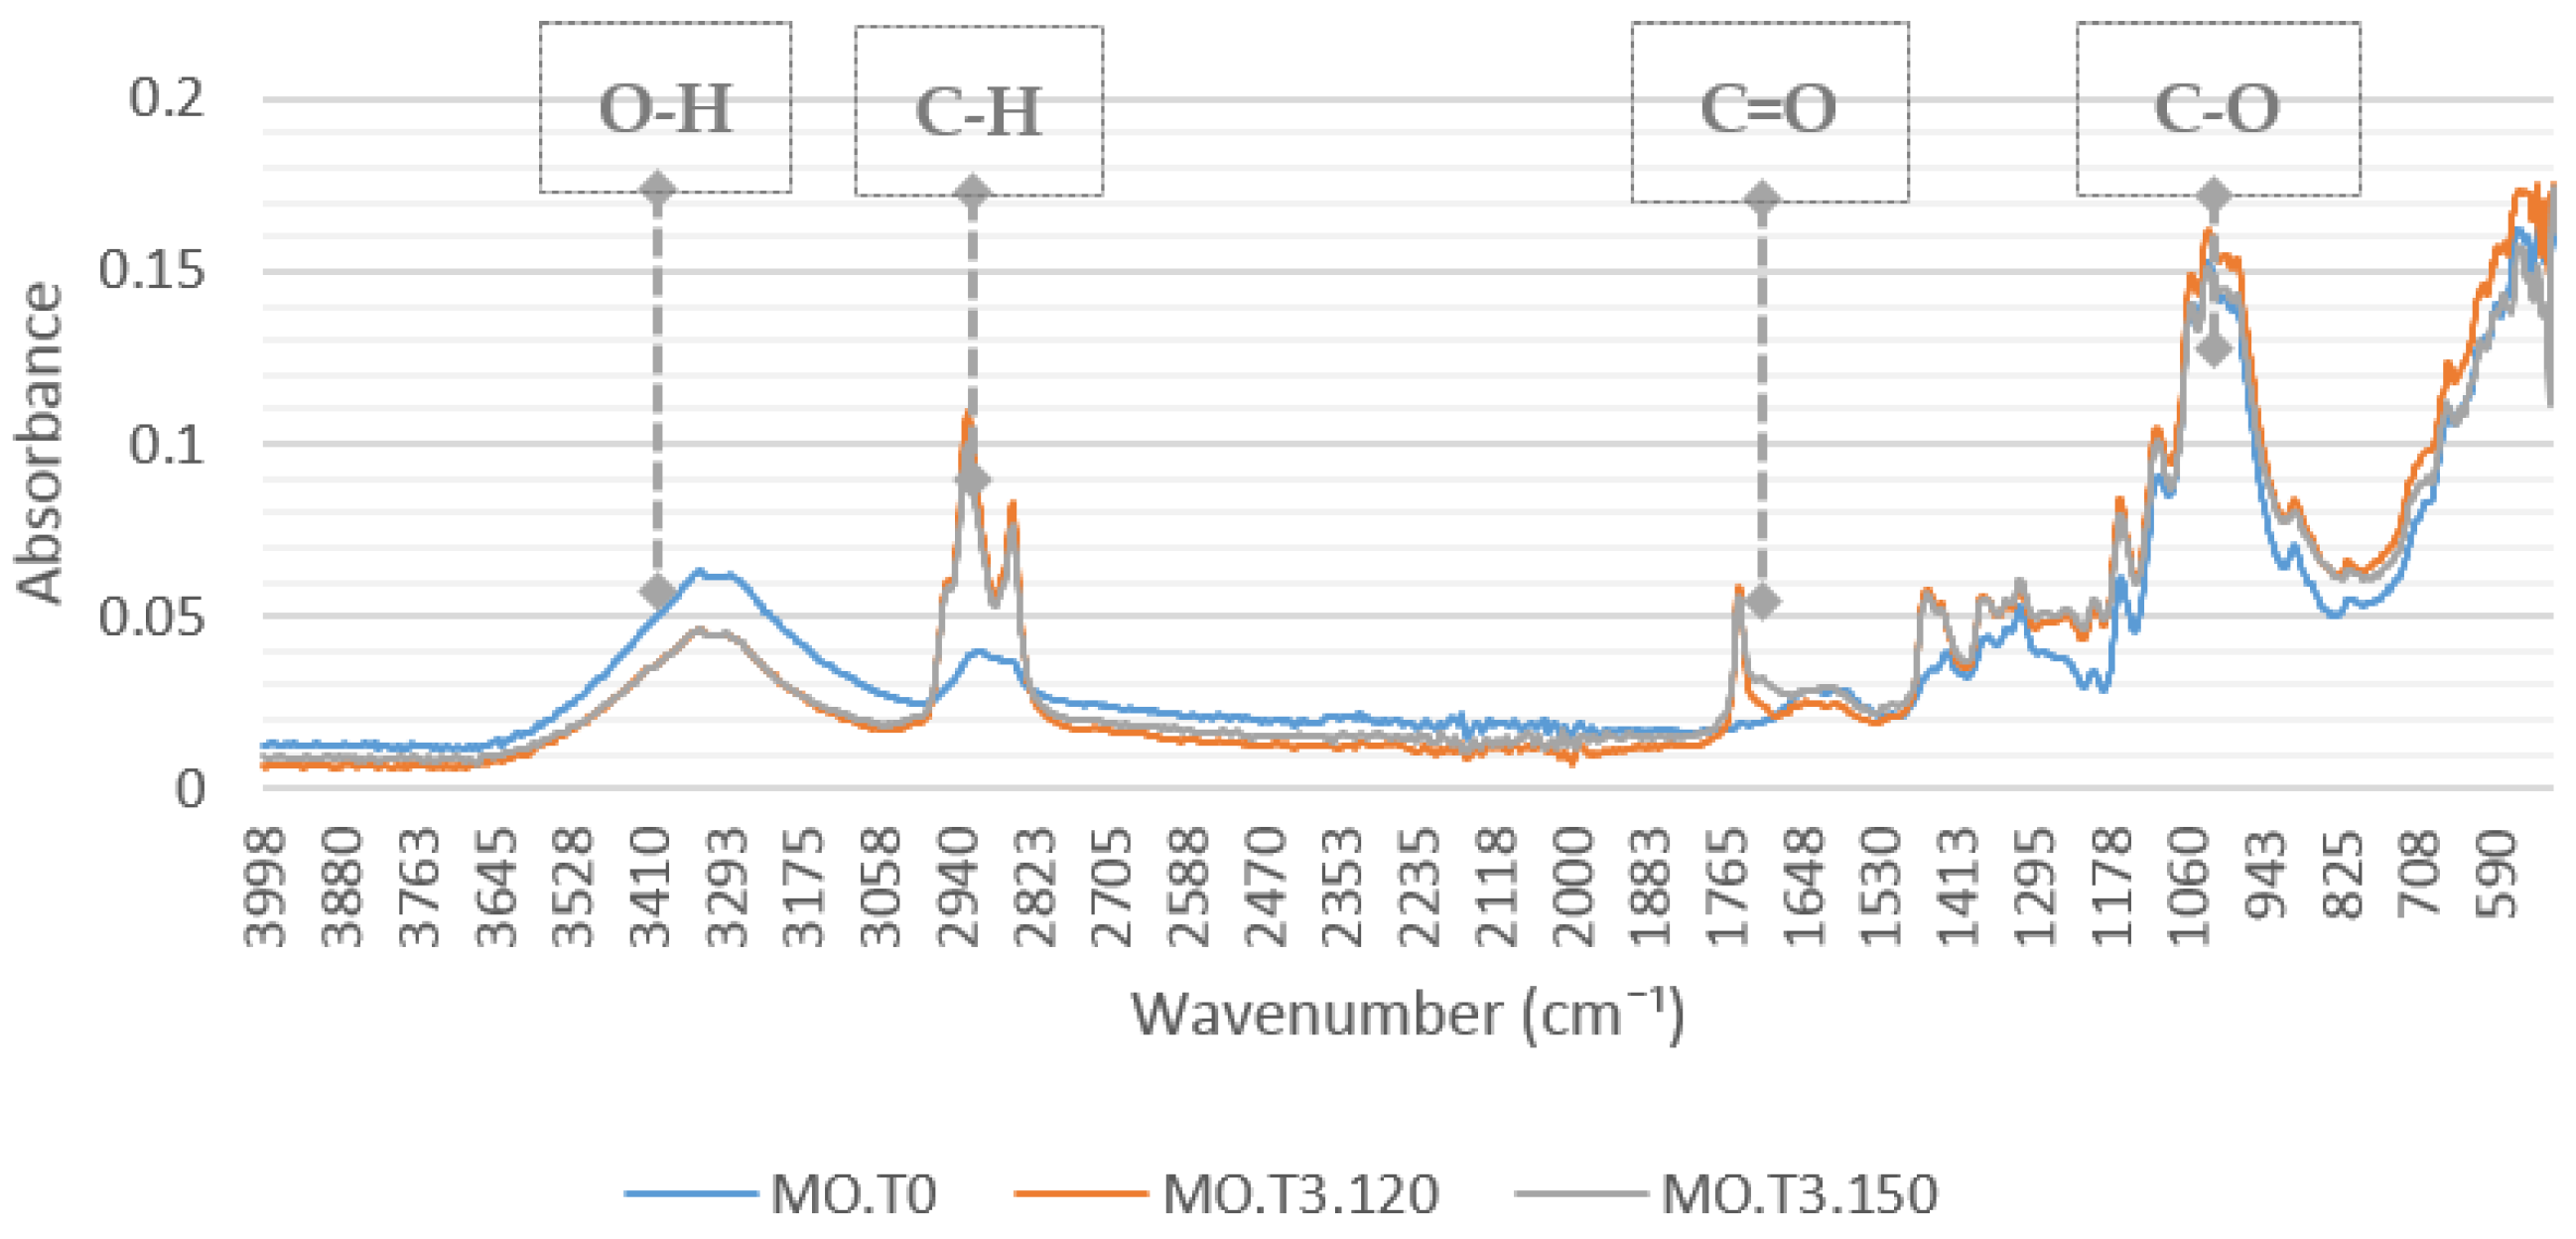
Figure 2 shows the FTIR spectra of transformer paper aged in mineral oil for 1008 h. Table 3 and Table 4 show the peak absorbance values of the paper samples. There is a significant difference between FTIR spectra, especially the peak absorbance value of the infrared spectra of the paper sample at aging temperatures of 120 °C and 150 °C of the same aging times. This confirms that thermal stress influences the chemical structure of paper samples.
From Figure 2, the FTIR spectrum of new cellulose paper shows absorbance peaks at wavenumbers 3700–3000 cm−1 (which is an O–H functional group), at wavenumbers 3000–2700 cm−1 (which is a C–H functional group), and at wavenumbers 1500–900 cm
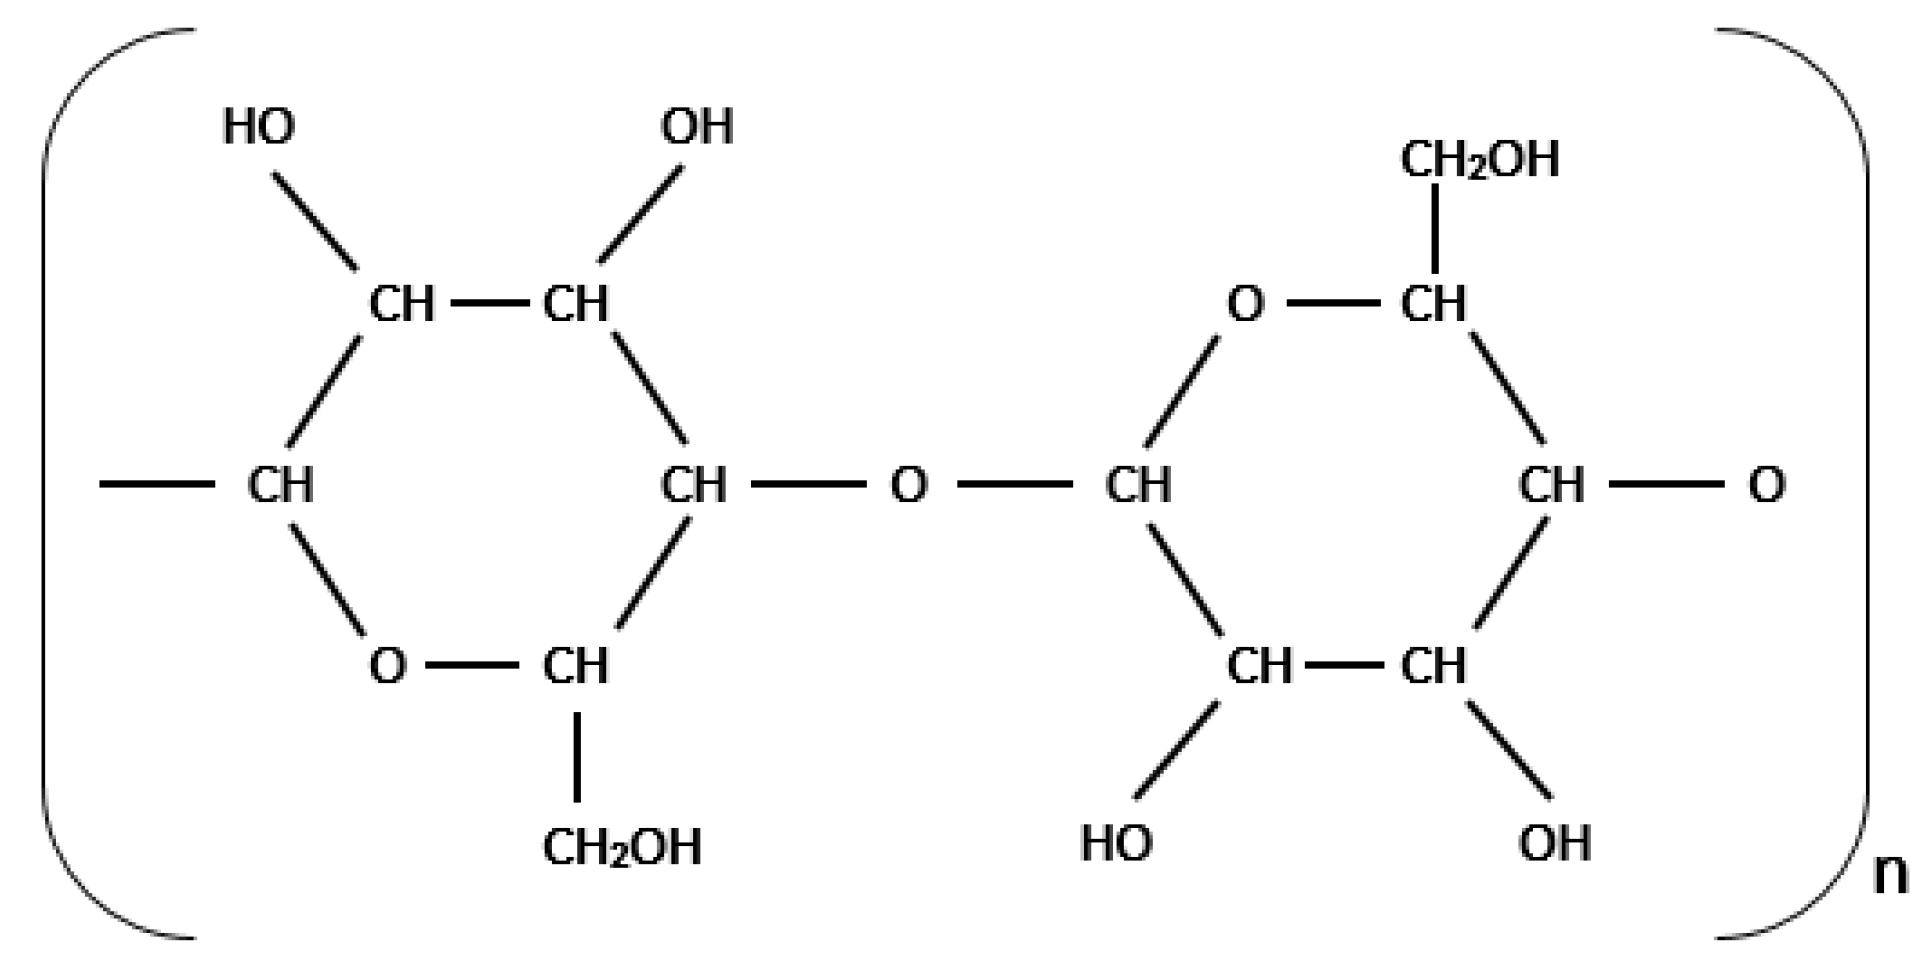
−1 (which is a C–O functional group). These functional groups identified are consistent with the basic structure of cellulose as shown in Figure 3.
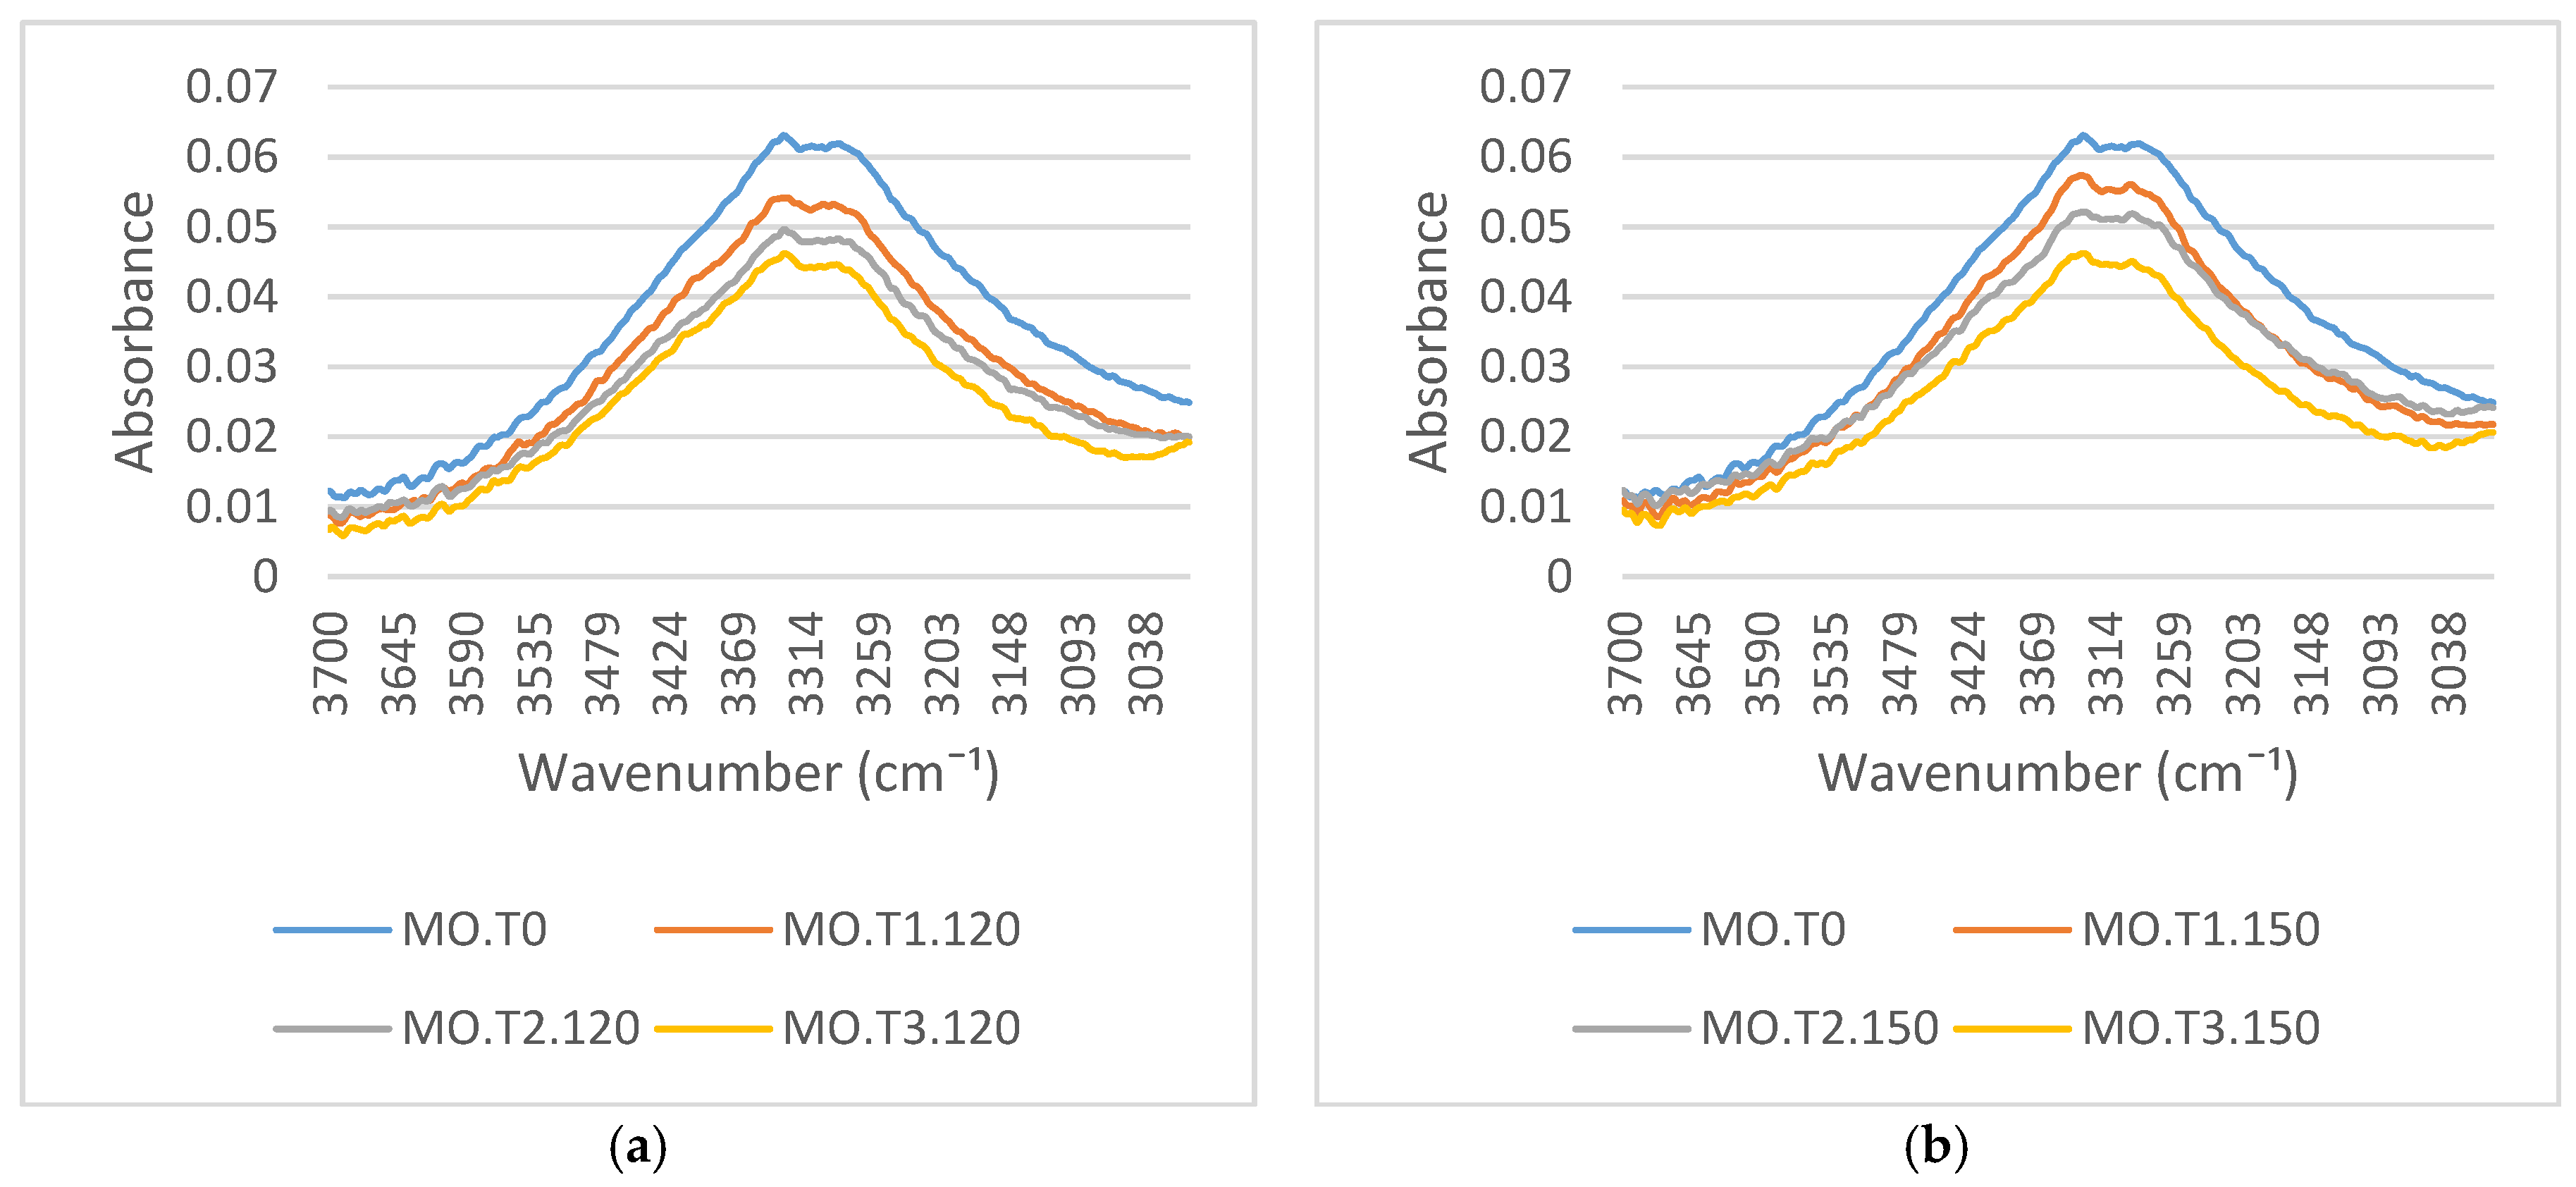
Figure 4a,b presents the FTIR spectra of transformer paper aged in mineral oil at aging temperatures of 120 °C and 150 °C. These figures relate to the hydroxyl groups of the spectra. The peak absorbance at 3329 cm−1 represents the O–H functional group. The peak absorbance located close to 3340 cm−1 is a typical characteristic of cellulose [27]. As shown in these figures, it is clear that the peak absorbance value of the O–H functional group located close to 3329 cm−1 decreases with aging due to the oxidation process. The products of degradation of cellulose paper are CO, CO2, H2O, H2, CH4, and furans, which are dissolved in the mineral oil [
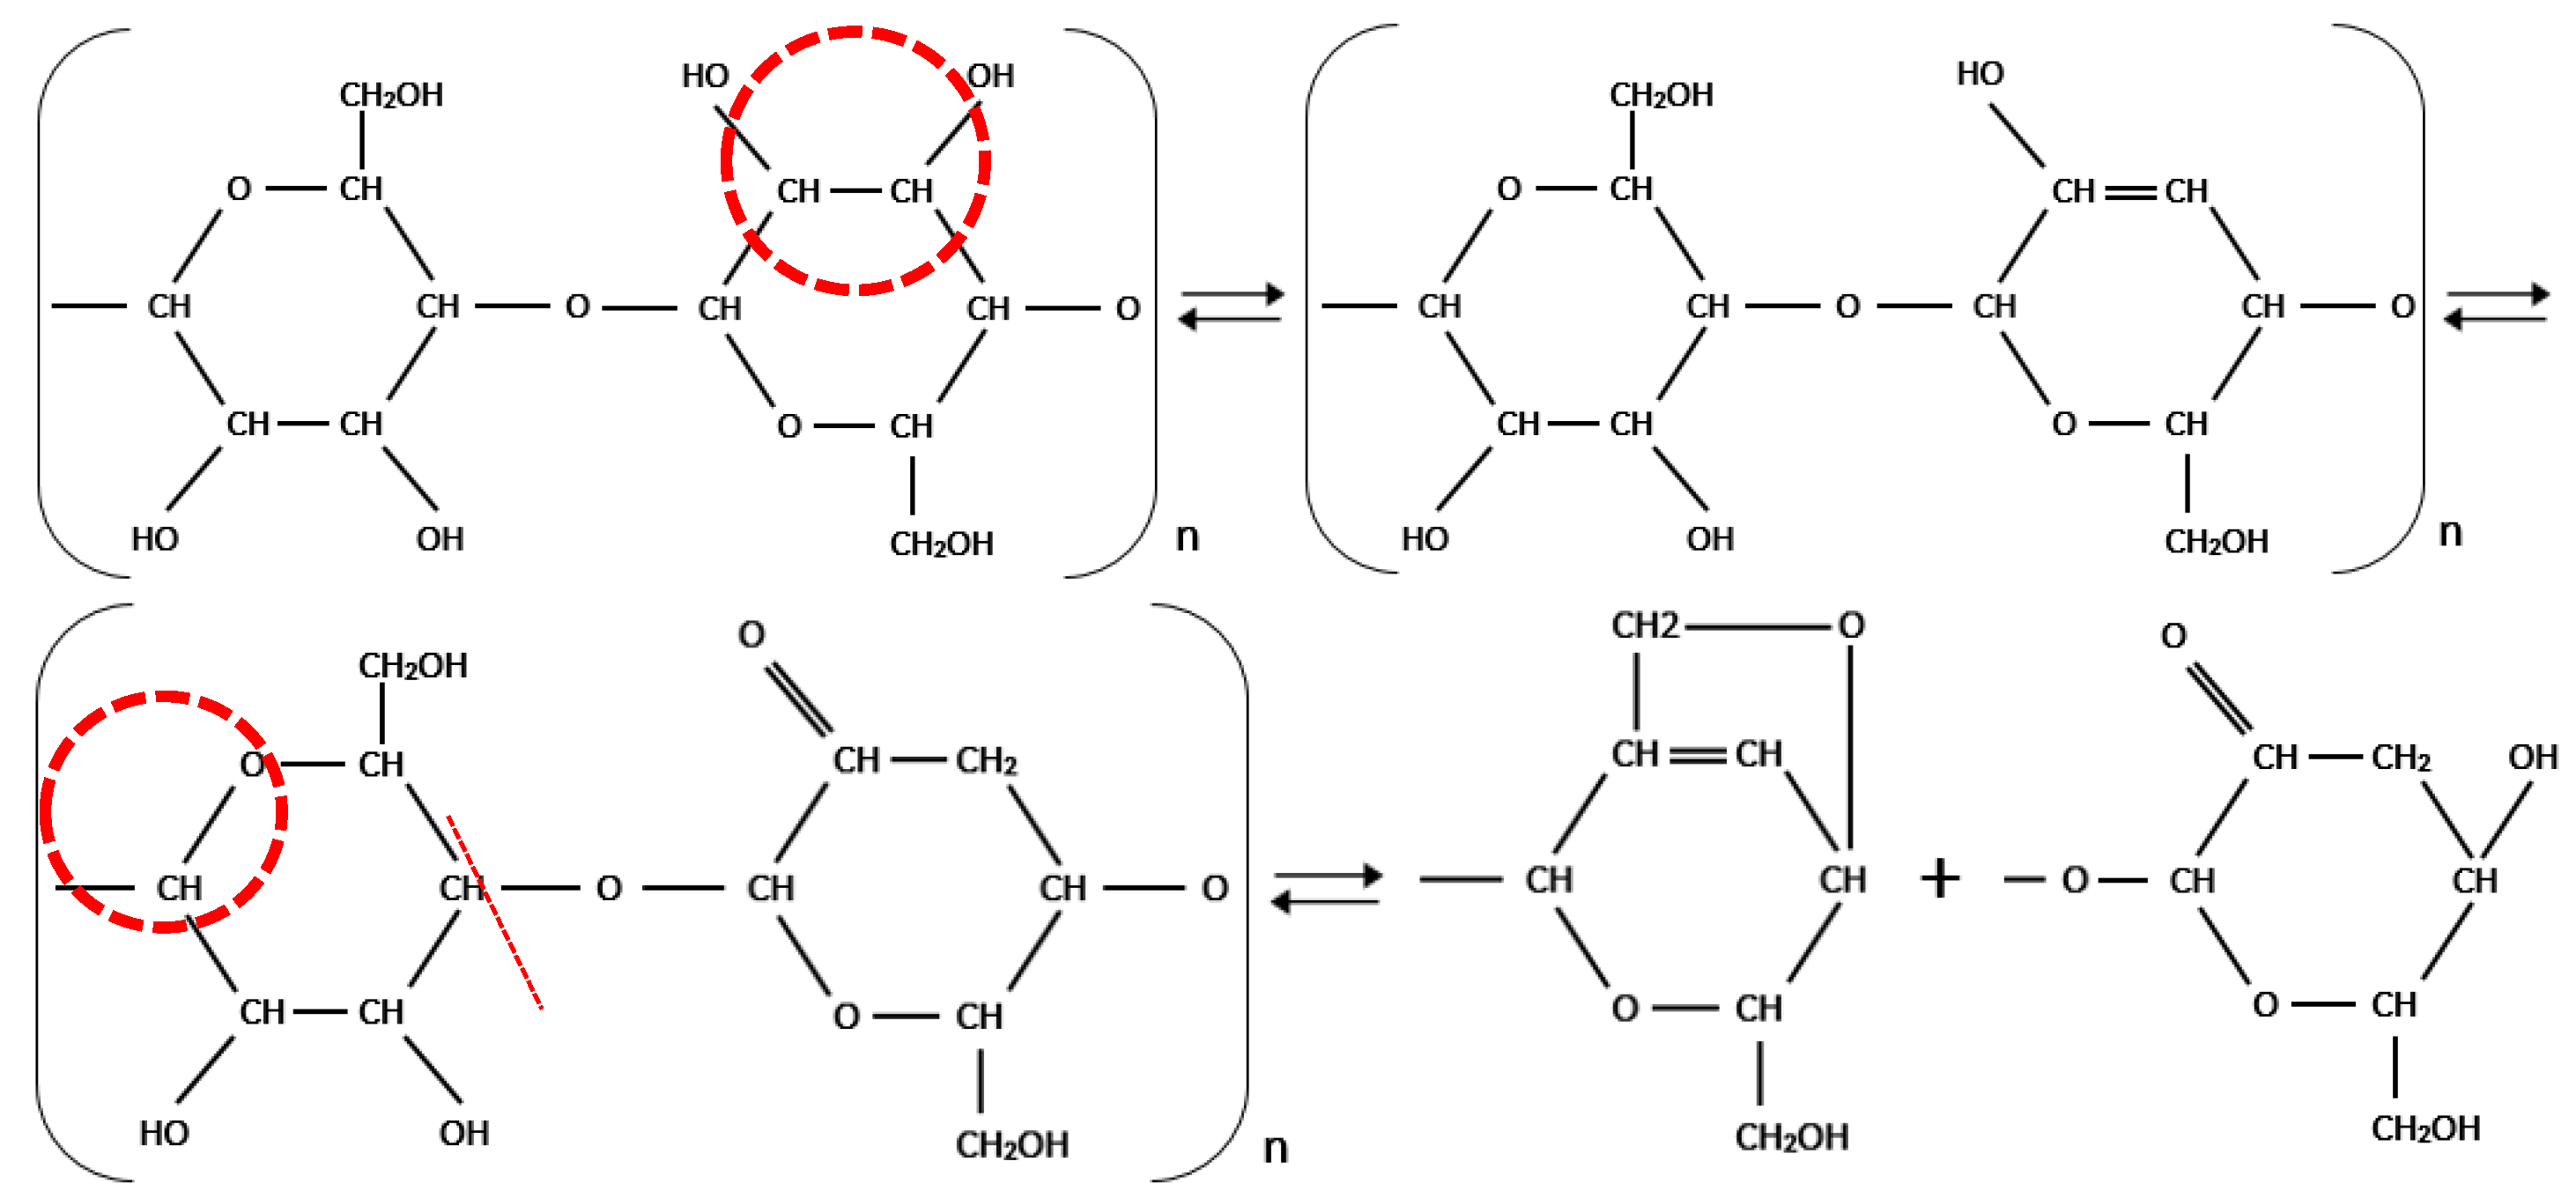
28]. During thermal aging, the cleavage of cellulose chains involves an O–H functional group. An O–H group reacts with a hydrogen atom generating a water molecule. An alcohol is transformed into ketone by an oxidation process. In this process, the hydrogen of the O–H group is displaced toward the carbon group and the CH2OH groups react with oxygen linking the glucose molecules, thereby cleaving the chain as shown in Figure 5 [29,30]. This intensity of peak absorbance located close to 3329 cm−1 can be associated with a reduction in molecular weight or the DP value [7].
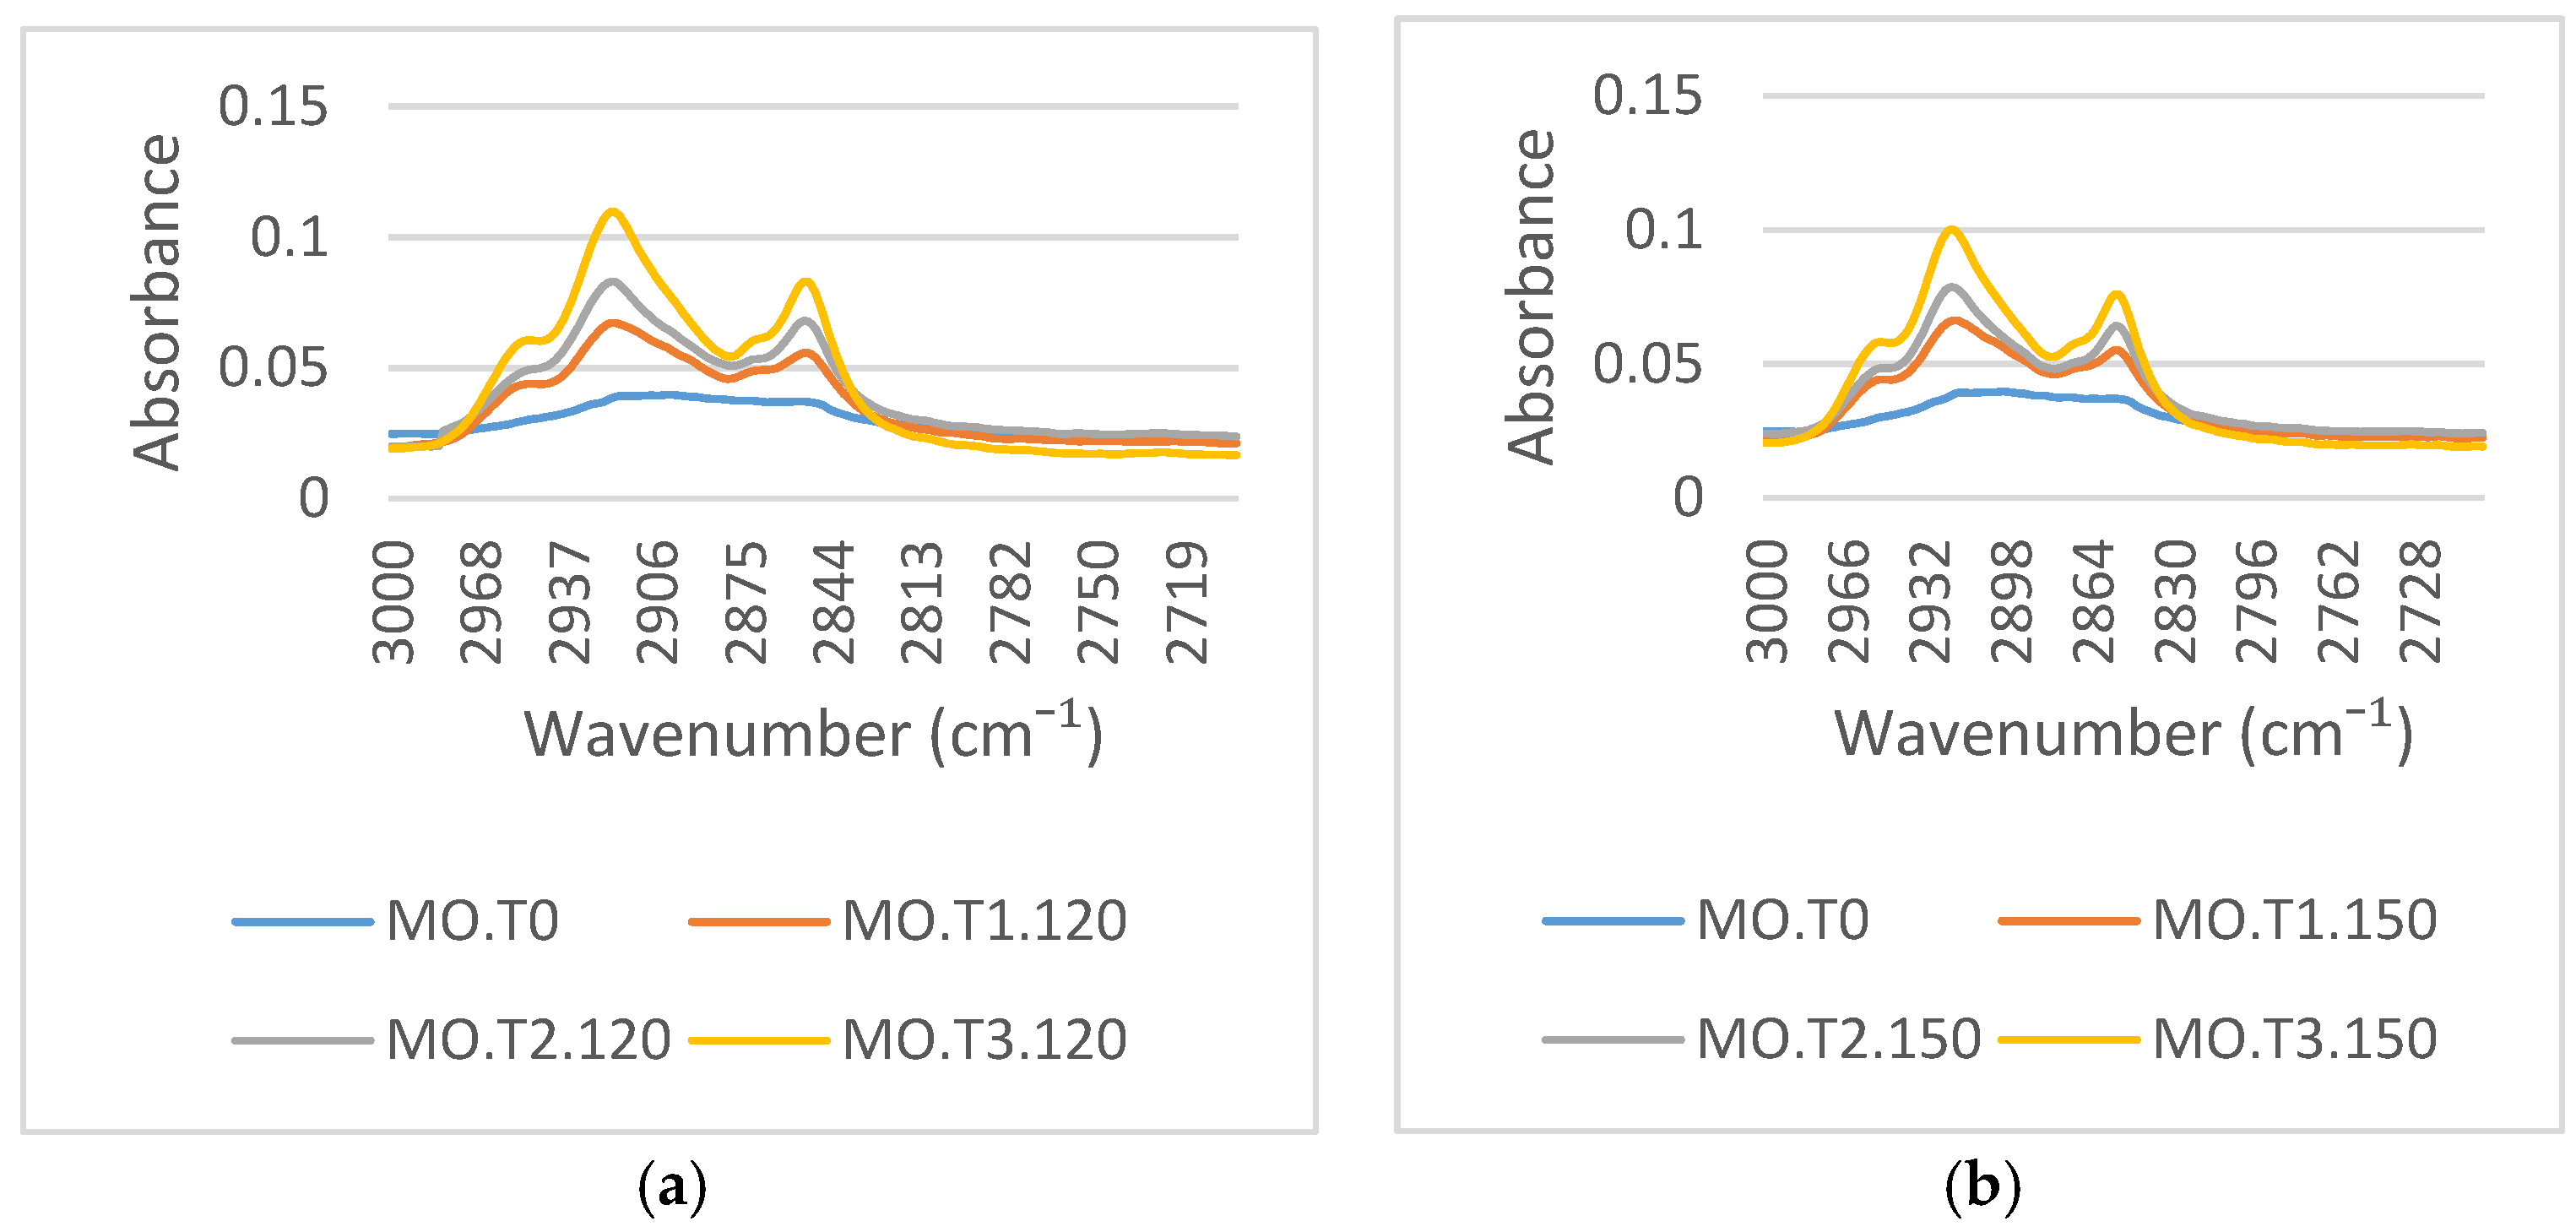
Figure 6a,b illustrates the variations of the FTIR spectra around 2900 cm−1, which represent a C–H functional group. The intensity of these absorbance peaks at 2922 cm−1 and 2854 cm−1 increase with aging due to the adsorption process of the mineral oil to the paper surface during aging [7]. The major degradation of the aging mechanism in mineral oil is oxidation [7,29]. Oxidation decomposes the hydrocarbon molecules into other substances: hydroperoxide, alcohol, aldehyde, ketones, and esters. The oxidation reaction of mineral oil also generates carboxylic acids (R–COOH), which bind to alcohol thereby generating esters. The degradation process of transformer paper aged in mineral oil is due to the combined effects of pyrolysis, hydrolysis, and oxidation [7]. Temperature, moisture, and oxygen are the key factors that determine the aging rate of cellulose paper [7]. CO2, water, furanic compounds, and carboxyl acids (R–COOH) form through the oxidative degradation of cellulose paper [7]. During thermal aging, the carboxylic acids generated from the oxidation process of mineral oil can react with hydroxyl groups on the cellulose forming a cellulose graft polymer via a condensation reaction [31]:
RCOOH + HO-[Cellulose] ↔ RCOO-[Cellulose] + H2O
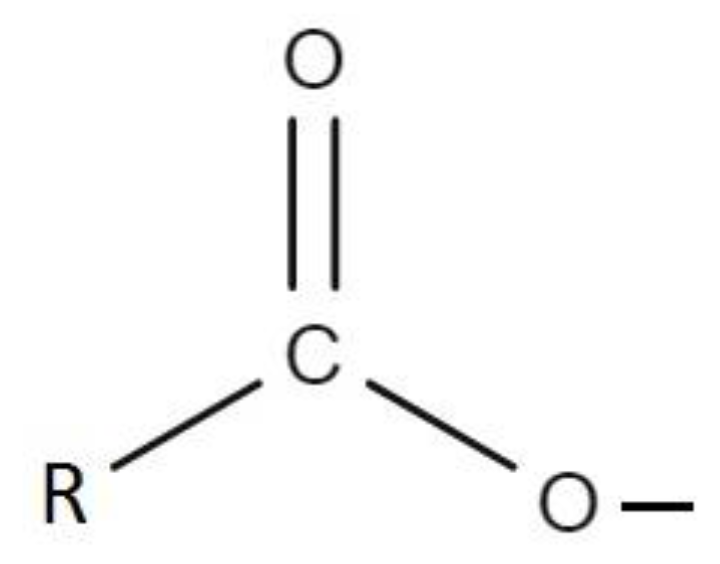
Carboxylic acids are an organic compound that contain a carbon–oxygen double bond and an oxygen–hydrogen single bond. R is a hydrocarbon group that has a lot of C–H functional groups. The reaction between the carboxylic acids in the mineral oil and the hydroxyl groups on the cellulose paper is the cause of the increasing C–H functional group on the cellulose paper after a hydrocarbon group (-R) in the mineral oil is moved to the cellulose paper. The radicals generated on the cellulose surface facilitate the physical attachment of low molecular weight oil molecules and lead to the formation of a layer of hydrocarbon lamination on the cellulose surface and an increase in the intensity of the corresponding to C–H vibrations [7]. Carboxyl acids in the mineral oil and the hydroxyl groups of cellulose paper are not only the main factors increasing the C–H functional group but are also the main factors in the emergence of the C=O functional group on the cellulose paper surface.
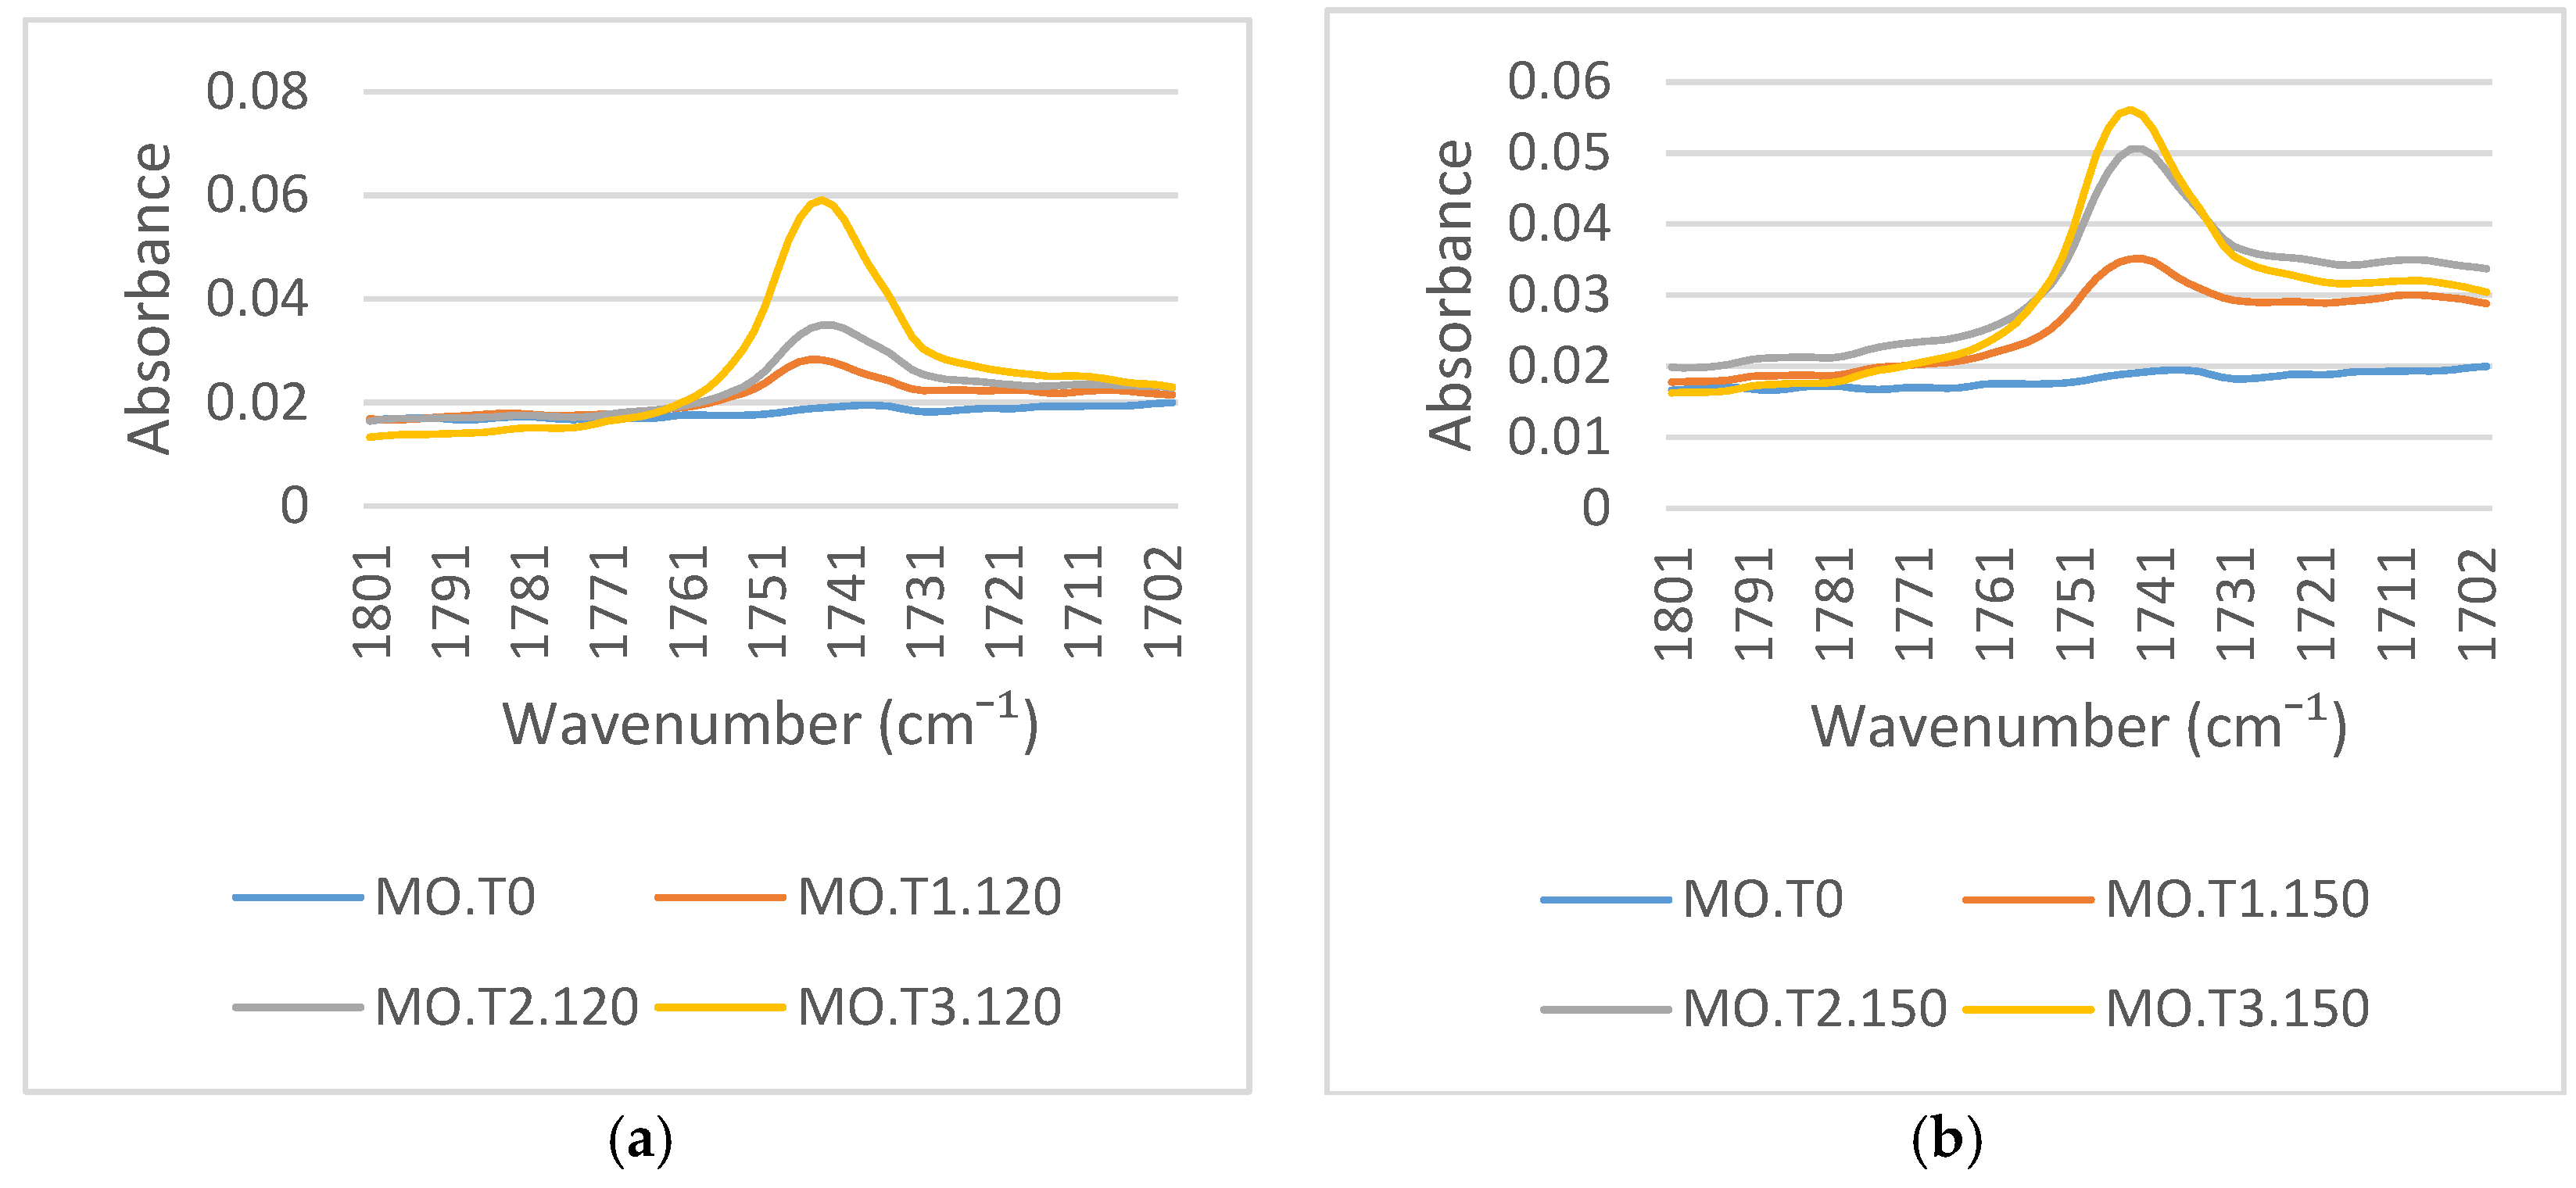
Figure 7a,b presents the FTIR spectra around 1700 cm−1, which represents the C=O functional group. The intensity of this absorbance peak at 1745 cm−1 increases with aging. This peak emerges on the cellulose paper after thermal aging in mineral oil. There is no absorbance peak at this functional group region for new transformer paper. The emergence of the C=O functional group is due to interactions between the low molecular weight acids dissolved in the mineral oil and the cellulose [31]. Carboxylic acids containing a carbon–oxygen double functional group react with the hydroxyl groups on the cellulose, forming a cellulose graft polymer and H2O. A carboxylate of the carboxylic acid (RCOO-) in mineral oil binds to the cellulose; this creates the emergence of the C=O functional group on the cellulose paper surface, as shown in Figure 8.

3.2. Correlation between Average Number of Chain Scissions and the Structural Changes of Transformer Paper Aged in Mineral Oil

The intensity of the peak absorbance of the functional groups within transformer paper changes during thermal aging due to the chemical process. The higher the temperature and the longer the duration of thermal aging of transformer paper in mineral oil, the higher is the thermal energy value. The chemical reaction is faster in systems with higher thermal energy. Svante Arrhenius showed the relationship between temperature and the rate constant by the reaction in Equation (1):
k   = A · e   E a R · T
where k is the rate constant at temperature T (K), A is a constant called ‘frequency factor’, Ea is the activation energy for the reaction (J/mol), and R is the universal gas constant (8.314 J/mole/K). The activation energy represents the energy that the molecule in the initial state of the process must have before it can take part in the reaction. The reaction rate at any time is assumed to be proportional to the number of unbroken polymer chain bonds in the aging of paper [8,32]. The Arrhenius equation about the thermal aging of transformer paper in mineral oil is shown in Equation (2) [33]:
A v e r a g e   n u m b e r   o f   c h a i n   s c i s s i o n   = A · e   E a R · T · t
In this calculation of the average number of chain scissions, the value of A depends on the initial moisture content within the paper sample and the type of insulating paper. The value of A used for this calculation was 21 × 108 for non-upgraded kraft paper with a high moisture content [6,34]. For the expected lifetime of the transformer, the energy activation of 111 kJ/mol was used in this calculation [6,34,35].
Table 5 shows the average number of chain scissions of each paper sample. The average number of chain scissions of the paper sample increases with an increasing aging temperature at the same aging time. The probability of molecules colliding with each other increases with aging temperature. As a result, the kinetic energy of the molecules increases, making the effect to the activation energy of a reaction. The thermal energy increased due to the kinetic energy of the molecules making the degradation process at a temperature of 150 °C higher than at a temperature of 120 °C.
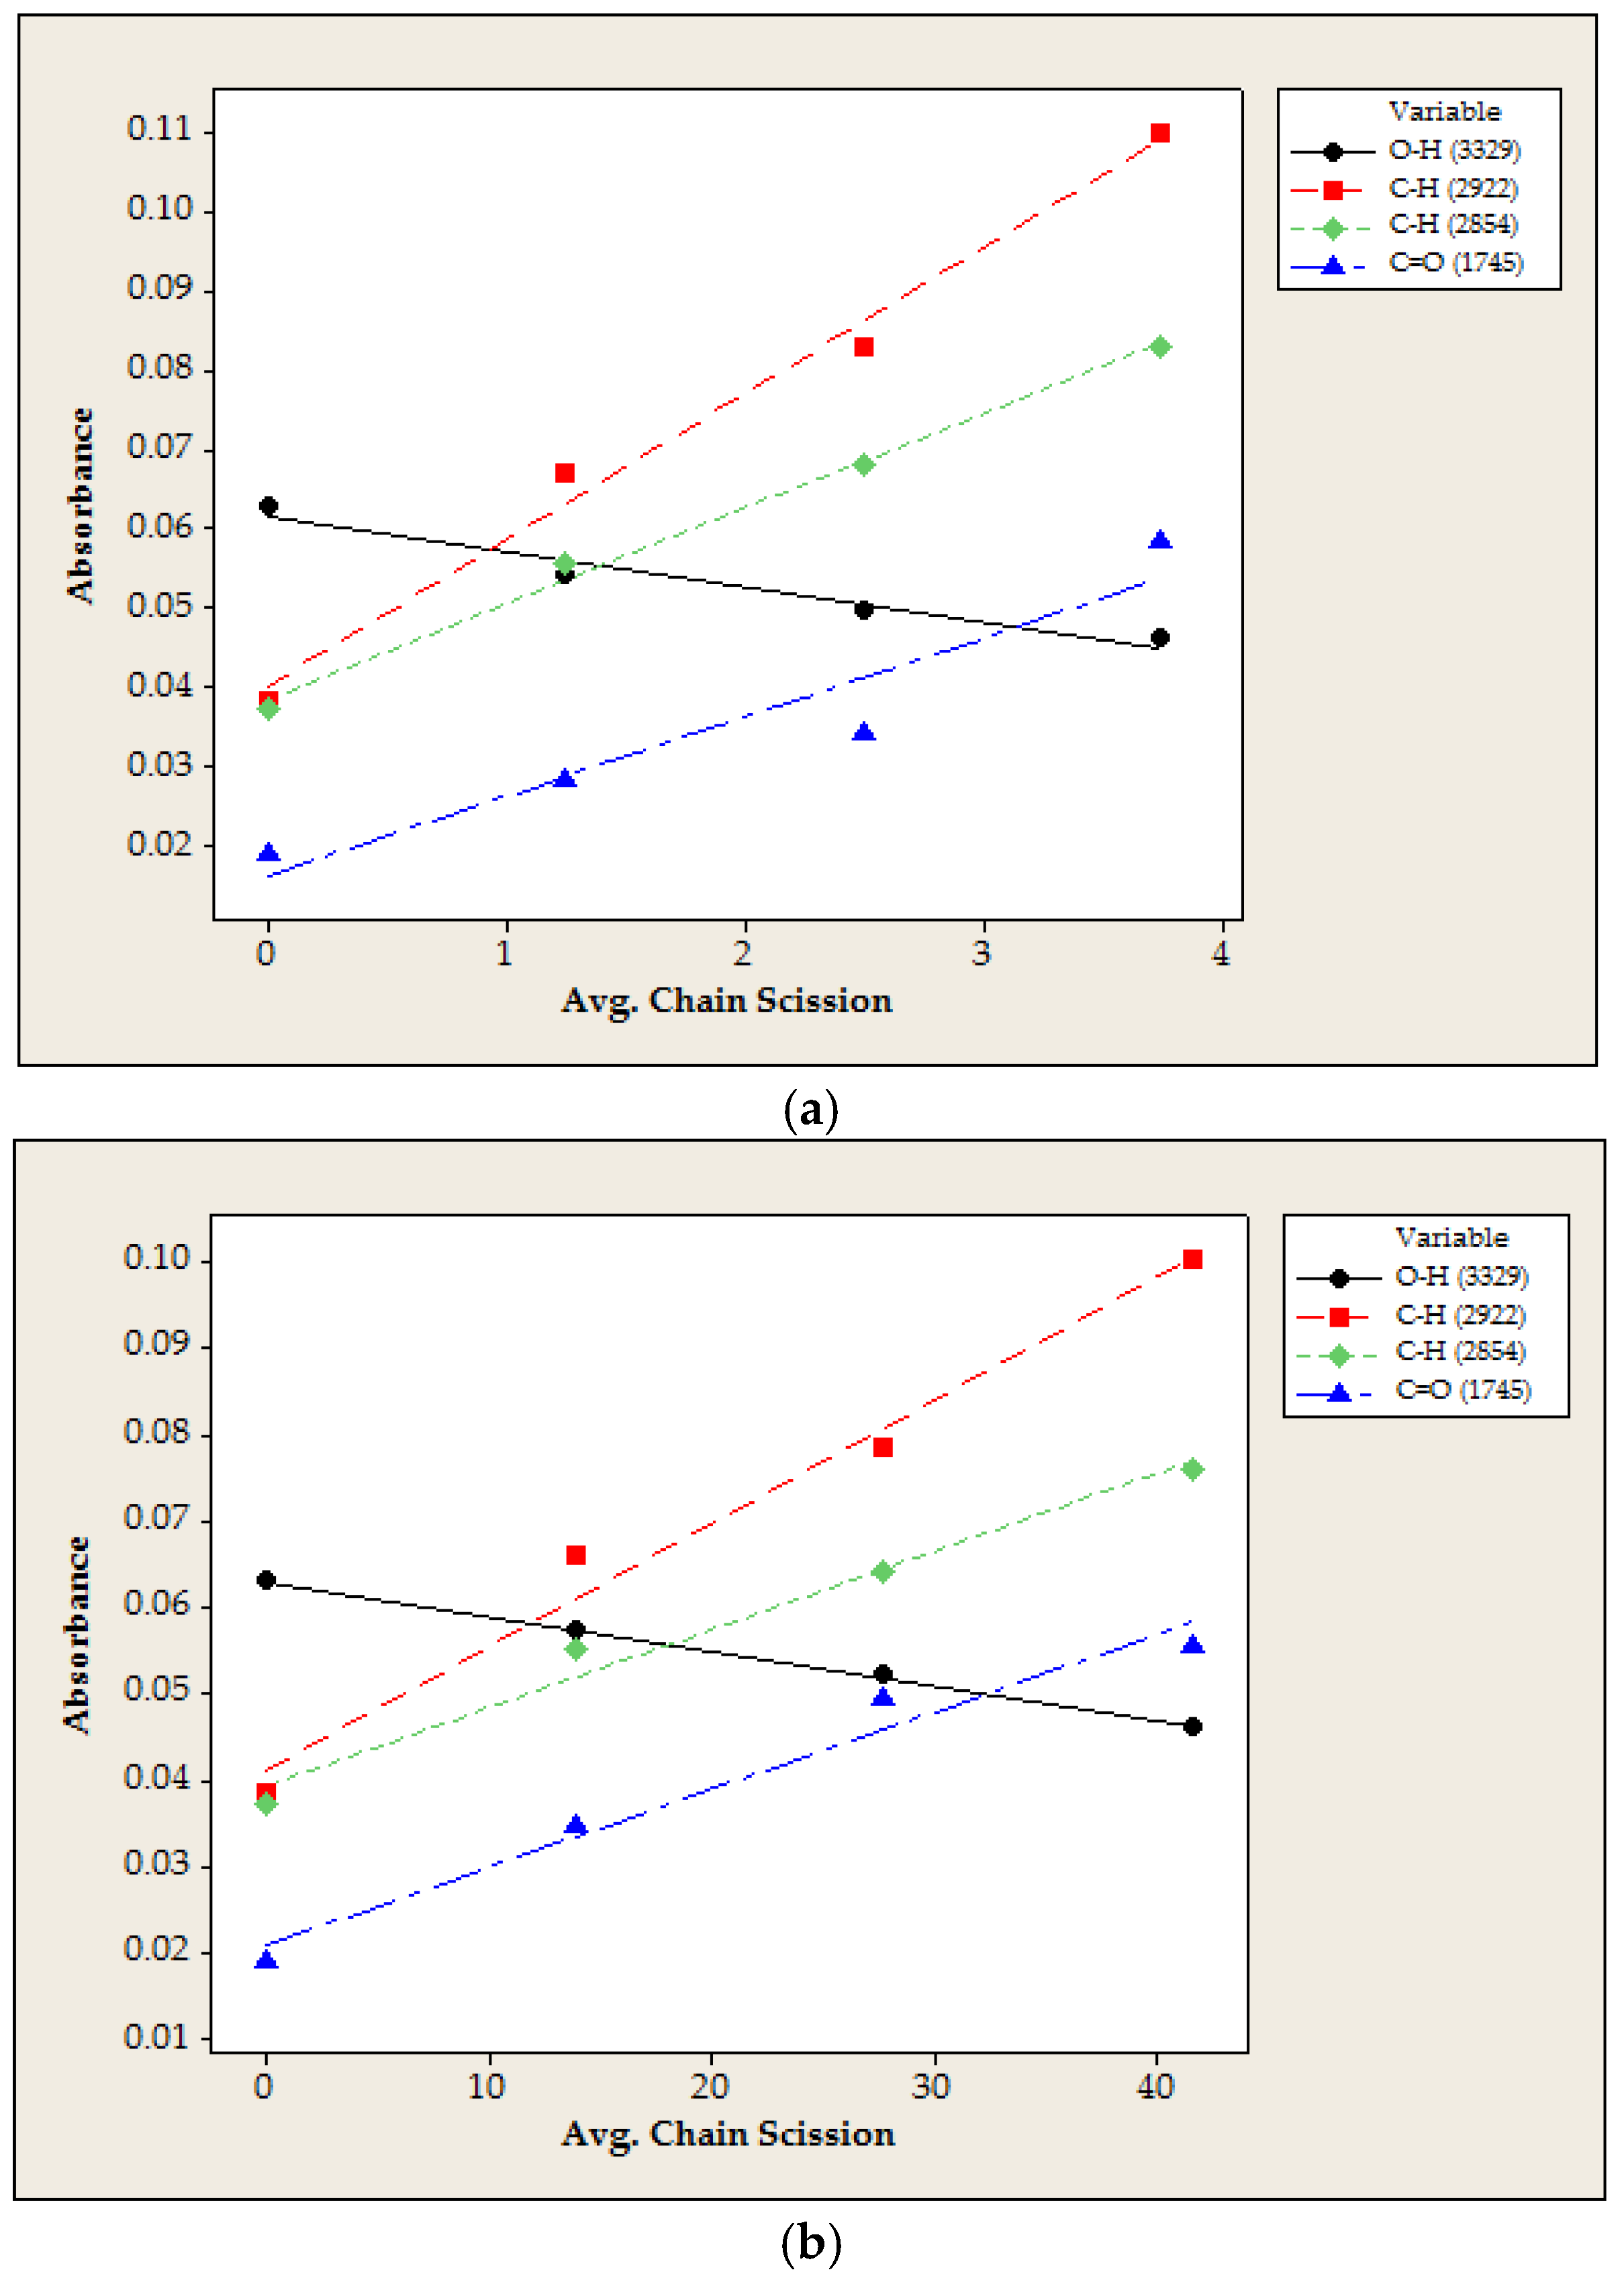
Figure 9 shows the correlation between the intensity of the absorbance peaks of the functional groups at 3329 cm−1, 2922 cm−1, 2854 cm−1, and 1745 cm−1 and the average chain scissions of the paper samples. The intensity of the peak absorbance of the functional group within the transformer paper that changes with aging correlates with the aging mechanisms during thermal aging. The intensity of the O–H functional group correlates with the average chain scissions due to the breakage of the hydrogen bonds of cellulose. The reduced intensity of the O–H functional group can be attributed to the reduction of the molecular weight/degree of polymerization [7]. The average number of chain scissions correlates with the molecular weight as shown in Equation (3) [7]:
Average   number   of   chain   scission   =   1 D P t 1 D P 0
DP0 represents the DP value of new transformer paper and DPt represents the DP value of transformer paper after thermal aging. From these figures, it can be seen that there is a linear correlation between the intensity of the peak absorbance of the O–H functional group and the average number of chain scissions. Those figures also show that there is a correlation between the intensity of the peak absorbance of the C–H and the C=O functional groups and the average number of chain scissions. It indicates that the reaction of the carboxylic acids in the mineral oil with the hydroxyl groups on the cellulose occurred at the same time as the process of chain scission on the cellulose.
Table 6 shows the value of R2 from the correlation between the functional group and the average number of chain scissions of transformer paper. R2 is the coefficient of determination, which has a range of 0–1 and measures the closeness of the data to the regression line. A value of R2 of 1 means that the correlation has a linear relationship. This result gives initial information that there is a correlation between the structural changes of transformer paper during thermal aging with the average number of chain scissions.

4. Conclusions

Accelerated thermal aging experiments on transformer paper in mineral oil was conducted under aging temperatures of 120 °C and 150 °C with durations of up to 1008 h. Visually the paper samples became darker as time elapsed, which indicates the structural changes of the cellulose paper after thermal aging. The chemical structure of transformer paper in mineral oil was identified using Fourier transform infrared (FTIR) spectroscopy analysis. FTIR spectra of new cellulose paper show absorbance peaks located close to 3329 cm−1 that represents an O–H functional group, located close to 2922 and 2854 cm−1 that represent a C–H functional group, and located close to 1050 cm−1 that represents a C–O functional group. These functional groups are consistent with the basic structure of cellulose. The intensity of the peak absorbance at 3329 cm−1, which is a typical characteristic of cellulose, decreased with aging due to oxidation processes. The intensity of the absorbance peaks located close to 2922 cm−1 and 2854 cm−1, which represent a C–H functional group, increased with aging due to the adsorption process of mineral oil to the paper surface during aging. The reaction between the carboxylic acids in the mineral oil with hydroxyl groups on the cellulose paper was the cause of the increased C–H functional group of the cellulose paper after moving a hydrocarbon group (-R) in mineral oil to the cellulose paper. The intensity of this absorbance peak at 1745 cm−1 increased with aging, which represents a C=O functional group. This peak emerged on the cellulose paper after thermal aging in mineral oil. There was no absorbance peak at this functional group region for new transformer paper. The emergence of the C=O functional group was due to the interaction between the low molecular weight acids dissolved in mineral oil and the cellulose. Carboxylate of the carboxylic acid (RCOO-) in mineral oil binds to cellulose, which creates the emergence of the C=O functional group on the cellulose paper surface. The intensity of the peak absorbances of the functional groups within the transformer paper that change with aging correlates with the aging mechanisms during thermal aging. The value of R2 > 0.9 from the correlation between functional groups and the average number of chain scissions of transformer paper gives direct evidence that transformer paper performance, which has a direct correlation with the life of transformers, can be investigated by using spectroscopy techniques.

Acknowledgments

This research was carried out with financial support from the Ministry of Research, Technology and Higher Education of Indonesia (KEMENRISTEKDIKTI).

Author Contributions

The authors contributed collectively to the experimental setup, testing and measurement, data analysis and manuscript preparation.

Conflicts of Interest

The authors declare no conflict of interest.

References

  1. Mildemberger, L.; Andreoli, M.C.; Silva, G.C.D.; Motta, H.N.D.; Gulmine, J.V.; Munaro, M. Correlation between stabilizer consumption and degree of polymerization of thermally upgraded paper aged in insulating natural ester and insulating mineral oil. Polímeros 2016, 26, 61–65. [Google Scholar] [CrossRef]
  2. Kumar, A.P.; Singh, R.P. Biocomposites of cellulose reinforced starch: Improvement of properties by photo-induced crosslinking. Elsevier J. Bioresour. Technol. 2008, 99, 8803–8809. [Google Scholar] [CrossRef] [PubMed]
  3. Ciuriuc, A.; Dumitran, L.M.; Notingher, P.V.; Badicu, L.V.; Setnescu, R.; Setnescu, R. Lifetime estimation of vegetable and mineral oil impregnated paper for power transformers’. In Proceedings of the 2016 IEEE International Conference on Dielectrics (ICD), Montpellier, France, 3–7 July 2016. [Google Scholar]
  4. Gorgan, B.; Notingher, P.V.; Wetzer, J.M.; Verhaart, H.F.A.; Wouters, P.A.A.F.; Schijndel, A.V.; Tanasescu, G. Calculation of the remaining life of power transformers paper insulation. In Proceedings of the 13th International Conference on Optimization of Electrical and Electronic Equipment (OPTIM), Brasov, Romania, 5 July 2012. [Google Scholar]
  5. Verma, P.; Chauhan, D.; Singh, P. Effects on tensile strength of transformer insulation paper under accelerated thermal and electrical stress. In Proceedings of the Annual Report Conference on Electrical Insulation and Dielectric Phenomena (CEIDP), Vancouver, BC, Canada, 14–17 October 2007. [Google Scholar]
  6. Baird, P.J.; Herman, H.; Stevens, G.C. On-Site analysis of transformer paper insulation using portable spectroscopy for chemometric prediction of aged condition. IEEE Trans. Dielectr. Electr. Insul. 2008, 15, 1089–1099. [Google Scholar] [CrossRef]
  7. Bandara, K.; Ekanayake, C.; Saha, T.K.; Annamalai, P.K. Understanding the aging aspects of natural ester based insulation liquid in power transformer. IEEE Trans. Dielectr. Electr. Insul. 2016, 23, 246–257. [Google Scholar] [CrossRef]
  8. Emsley, A.M.; Stevens, G.C. Review of chemical indicators of degradation of cellulosic electrical paper insulation in oil-filled transformers. IEE Proc. Sci. Meas. Technol. 1994, 141, 324–334. [Google Scholar] [CrossRef]
  9. Rahmat, S.; Pasaribu, R.A.; Suwarno. Effects of thermal aging on dielectric properties and DGA of oil-paper insulations. In Proceedings of the 3rd Conference on Power Engineering and Renewable Energy (ICPERE), Yogyakarta, Indonesia, 29–30 November 2016. [Google Scholar]
  10. Martins, M.A.G.; Gomes, A.R. Comparative study of the thermal degradation of synthetic and natural esters and mineral oil: Effect of oil type in the thermal degradation of insulating kraft paper. IEEE Electr. Insul. Mag. 2012, 28, 22–28. [Google Scholar] [CrossRef]
  11. Suwarno; Pasaribu, R.A. Thermal aging of mineral-oil paper composite insulation for high voltage transformer. Int. J. Electr. Eng. Inf. ITB 2016, 8, 820–835. [Google Scholar] [CrossRef]
  12. Hodges, P. Hydraulic Fluids, 1st ed.; Elsevier: Stabekk, Norway, 1996; pp. 17–77. [Google Scholar]
  13. Cui, H.; Abu-Siada, A.; Li, S.; Islam, S. Correlation between dissolved gases and oil spectral response. In Proceedings of the 1st International Conference on Electrical Materials and Power Equipment (ICEMPE), Xi’an, China, 14–17 May 2017. [Google Scholar]
  14. Baka, N.; Abu-Siada, A.; Islam, S.; El-Naggar, M. A new technique to measure interfacial tension of transformer oil using UV-Vis spectroscopy. IEEE Trans. Dielectr. Electr. Insul. 2015, 22, 1275–1282. [Google Scholar] [CrossRef]
  15. Das, N.; Abu-Siada, A.; Islam, S. New approach to estimate furan contents in transformer oil using spectroscopic analysis. In Proceedings of the 22nd Australasian Universities Power Engineering Conference (AUPEC), Bali, Indonesia, 26–29 September 2012. [Google Scholar]
  16. Herman, H.; Shenton, M.J.; Stevens, G.C.; Heywood, R.J. A new approach to condition assessment and lifetime prediction of paper and oil used as transformer insulation. In Proceedings of the IEEE 7th International Conference on Solid Dielectrics, Eindhoven, Netherlands, 25–29 June 2001. [Google Scholar]
  17. Munajad, A.; Subroto, C.; Suwarno. Study on the effects of thermal aging on insulating paper for high voltage transformer composite with natural ester from palm oil using fourier transform infrared spectroscopy (FTIR) and energy dispersive x-ray spectroscopy (EDS). Energies 2017, 10, 1857. [Google Scholar] [CrossRef]
  18. Przybylek, P. A new method for indirect measurement of water content in fibrous electro-insulating materials using near-infrared spectroscopy. IEEE Trans. Dielectr. Electr. Insul. 2016, 23, 1798–1804. [Google Scholar] [CrossRef]
  19. Saha, T.K. Review of modern diagnostic techniques for assessing insulation condition in aged transformers. IEEE Trans. Dielectr. Electr. Insul. 2003, 10, 903–917. [Google Scholar] [CrossRef] [Green Version]
  20. IEEE. IEEE Std. C57.100–2011: IEEE Standard Test Procedure for Thermal Evaluation of Insulation Systems for Liquid-Immersed Distribution and Power Transformers; IEEE: New York, NY, USA, 2011. [Google Scholar]
  21. Sun, P.; Sima, W.; Yang, M.; Wu, J. Influence of thermal aging on the breakdown characteristic of transformer oil impregnated paper. IEEE Trans. Dielectr. Electr. Insul. 2016, 23, 3373–3381. [Google Scholar] [CrossRef]
  22. IEEE. IEEE Std. C57.91–1995: IEEE Guide for Loading Mineral-Oil-Immersed Transformers; IEEE: New York, NY, USA, 1996. [Google Scholar]
  23. McShane, C.; Rapp, K.; Corkran, J.; Gauger, G.; Luksich, J. Aging of kraft paper in natural ester dielectric fluid. In Proceedings of the IEEE 14th International Conference on Dielectric Liquids (ICDL), Graz, Austria, 7 November 2002. [Google Scholar]
  24. IEEE. IEEE Std. 1538–2000: IEEE Guide for Determination Of Maximum Winding Temperature Rise in Liquid-Filled Transformers; IEEE: New York, NY, USA, 2000. [Google Scholar]
  25. Bakar, N.A.; Cui, H.; Abu-Siada, A.; Li, S. A review of spectroscopy technology applications in transformer condition monitoring. In Proceedings of the International Conference on Condition Monitoring and Diagnosis (CMD), Xi’an, China, 25–28 September 2016. [Google Scholar]
  26. Liao, R.; Liang, S.; Yang, L.; Hao, J.; Li, J. Comparison of ageing results for transformer oil-paper insulation subjected to thermal ageing in mineral oil and ageing in retardant oil. IEEE Trans. Dielectr. Electr. Insul. 2012, 19, 225–232. [Google Scholar] [CrossRef]
  27. Hinterstoisser, B.; Åkerholm, M.; Salmén, L. Effect of fiber orientation in dynamic FTIR study on native cellulose. Elsevier J. Carbohydr. Res. 2001, 334, 27–37. [Google Scholar] [CrossRef]
  28. Ciuriuc, A.; Vihancencu, M.S.; Dumitran, L.M.; Notingher, P.V. Comparative study on power transformers vegetable and mineral oil ageing. In Proceedings of the 2012 International Conference on Applied and Theoretical Electricity (ICATE), Craiova, Romania, 25–27 October 2012. [Google Scholar]
  29. Garcia, B.; Garcia, T.; Primo, V.; Burgos, J.C.; Urquiza, D. Studying the loss of life of natural-ester-filled transformer insulation: impact of moisture on the aging rate of paper. IEEE Electr. Insul. Mag. 2017, 33, 15–23. [Google Scholar] [CrossRef]
  30. Scheirs, J.; Camino, G.; Tumiatti, W. Overview of water evolution during the thermal degradation of cellulose. Eur. Polym. J. 2001, 37, 933–942. [Google Scholar] [CrossRef]
  31. Ese, M.G.; Liland, K.B.; Lesaint, C.; Kes, M. Esterification of low molecular weight acids in cellulose. IEEE Trans. Dielectr. Electr. Insul. 2014, 21, 662–665. [Google Scholar] [CrossRef]
  32. Noirhomme, B.; Lessard, M.-C.; Jalbert, J.; Besner, S.; Brochu, F.; Dupuis, E. Influence of transformer oil acidity on insulating paper degradation. In Proceedings of the IEEE Electrical Insulation Conference (EIC), Ottawa, Canada, 15 July 2013. [Google Scholar]
  33. Jang, J.-S.R.; Sun, C.-T. Neuro-fuzzy modeling and control. Proc. IEEE 1995, 83, 378–406. [Google Scholar] [CrossRef]
  34. Lundgaard, L.E.; Hansen, W.; Linhjell, D.; Painter, T.J. Aging of oil-impregnated paper in power transformers. IEEE Trans. Power Deliv. 2004, 19, 230–239. [Google Scholar] [CrossRef]
  35. Prasojo, R.A.; Diwyacitta, K.; Suwarno; Gumilang, H. Transformer paper expected life estimation using ANFIS based on oil characteristics and dissolved gases (case study: indonesian transformers). Energies 2017, 10, 1135. [Google Scholar] [CrossRef]
Figure 1. (a) Schematic diagram of Fourier transform infrared (FTIR) spectrometer. (b) ALPHA FTIR spectrometer.
Energies 11 00364 g001
Figure 2. FTIR spectra of transformer paper aged in mineral oil at aging temperatures of 120 °C and 150 °C for 1008 h.
Energies 11 00364 g002
Figure 3. Molecular structure of cellulose.
Energies 11 00364 g003
Figure 4. FTIR spectra at 3700–3000 cm−1 of transformer paper aged in mineral oil at aging temperatures of (a) 120 °C and (b) 150 °C.
Energies 11 00364 g004
Figure 5. Cleavage of cellulose chains.
Energies 11 00364 g005
Figure 6. FTIR spectra at 3000–2700 cm−1 of transformer paper aged in mineral oil at aging temperatures of (a) 120 °C and (b) 150 °C.
Energies 11 00364 g006
Figure 7. FTIR spectra at 1800–1700 cm−1 of transformer paper aged in mineral oil at aging temperatures of (a) 120 °C and (b) 150 °C.
Energies 11 00364 g007
Figure 8. A carboxylate of a carboxlic acid.
Energies 11 00364 g008
Figure 9. Intensity of the absorbance peaks of the functional groups as a function of the average chain scissions of paper samples at aging temperatures of (a) 120 °C (b) 150 °C.
Energies 11 00364 g009
Table 1. Sample and treatment.
SampleAging
MO.T0Initial state
MO.T1.120120 °C for 336 h
MO.T2.120120 °C for 672 h
MO.T3.120120 °C for 1008 h
MO.T1.150150 °C for 336 h
MO.T2.150150 °C for 672 h
MO.T3.150150 °C for 1008 h
Table 2. Visual appearances of the paper sample.
TemperatureAging Time (h)
03366721008
120 °C Energies 11 00364 i001 Energies 11 00364 i002 Energies 11 00364 i003 Energies 11 00364 i004
150 °C Energies 11 00364 i005 Energies 11 00364 i006 Energies 11 00364 i007 Energies 11 00364 i008
Table 3. Peak absorbance values of IR spectra of paper samples aged in mineral oil at 120 °C.
Wavenumber (cm−1)MO.T0MO.T1.120MO.T2.120MO.T3.120
29220.038420.06720.083030.10985
28540.037150.05570.067990.08303
17450.01880.02830.034320.05827
14540.033910.043890.037450.05759
13690.043870.049760.044380.05549
13140.053220.055920.051420.05979
11590.061230.067730.064360.0834
11040.090640.093660.085330.10457
10500.140040.140920.12780.14907
10260.152720.154530.140760.16223
8150.054840.062360.056990.0658
Table 4. Peak absorbance values of IR spectra of paper samples aged in mineral oil at 150 °C.
Wavenumber (cm−1)MO.T0MO.T1.150MO.T2.150MO.T3.150
29220.038420.066190.078690.10029
28540.037150.055210.064160.07608
17450.01880.034620.049430.0555
14540.033910.045880.050080.05566
13690.043870.052010.054880.05503
13140.053220.060980.062710.06098
11590.061230.072950.078740.07974
11040.090640.099670.101230.10112
10500.140040.146170.144380.14046
10260.152720.157970.157120.15071
8150.054840.061790.067550.06297
Table 5. Average number of chain scissions of the paper samples.
SampleAvg. Chain Scission (×1000)
MO0
MO.T1.1201244
MO.T2.1202487
MO.T3.1203731
MO.T1.15013,839
MO.T2.15027,678
MO.T3.15041,517
Table 6. The value of R2 from the correlation between the average number of chain scissions and the functional groups of the transformer paper.
SampleTesting MethodParameterR2
120FTIRIntensity of absorbance peak of O–H (3329 cm−1) functional group0.949
1500.9993
120FTIRIntensity of absorbance peak of C–H (2922 cm−1) functional group0.9889
1500.9804
120FTIRIntensity of absorbance peak of C–H (2854 cm−1) functional group0.9937
1500.9793
120FTIRIntensity of absorbance peak of C=O (1745 cm−1) functional group0.9968
1500.9115

