Experimental Enrichment of Low-Concentration Ventilation Air Methane in Free Diffusion Conditions


1
School of Energy Science and Engineering, Henan Polytechnic University, Jiaozuo 454003, China
2
Department of Civil Engineering, Monash University, Melbourne, VIC 3800, Australia
3
School of Resources and Civil Engineering, Northeastern University, Shenyang 110819, China
*
Authors to whom correspondence should be addressed.
Energies 2018, 11(2), 428; https://doi.org/10.3390/en11020428
Submission received: 16 January 2018
/
Revised: 7 February 2018
/
Accepted: 9 February 2018
/
Published: 13 February 2018
(This article belongs to the Section L: Energy Sources)
Abstract
:The massive emission of low concentrations (≤0.5%) of methane (CH4) from ventilation roadways results in resource waste and environmental pollution. To mitigate these emissions, an enrichment tower for low-concentration methane is designed, and segregation and non-segregation experiments are conducted. The results reveal that stable concentrations of methane under segregation and non-segregation states in the enrichment tower gradually increase with height, with a maximum methane concentration of 0.64% and 0.54%, respectively. This shows that the methane enrichment effect in free diffusion conditions is more significant under the segregation state than under the non-segregation state. The stable concentration of methane in the middle and upper sections of the enrichment tower shows an increasing trend. However, the stable concentration of methane in the lower section of the enrichment tower has an increasing trend (less than 0.50%). According to the methane molecule Boltzmann distribution law, methane concentration enrichment decreases with height, and the conversion of the methane from the segregated to non-segregated is irreversible. Consequently, industrial applications of methane enrichment from buoyant forces are not feasible for low concentrations of methane.

1. Introduction
During the mining process, a massive amount of methane is discharged, mostly into the atmosphere and thus contributing to the greenhouse effect. Among greenhouse gases, methane contributes to 16% of Earth’s greenhouse effect, compared to 74% for carbon dioxide [1,2,3]. Methane methane has the potential to be released in a future warmer climate with enhanced climate impact [4]. Over the last two hundred and fifty years, the concentration of methane in the atmosphere has increased by 151% [5,6]. Methane is mainly emitted from the agriculture, energy, industry, and waste processing sectors. Coal mining accounts for 22% of methane emissions from the energy sector [7,8].
There are three main contributions to methane emissions from coal mining: (a) mine ventilation air (0.1–1% CH4), (b) methane drained from the seam before mining (60–95% CH4), and (c) methane drained from work areas of the mine (30–95% CH4) [2,9]. These methane contributions are called “ventilation air methane (VAM)” and constitute a low percentage (1%) of methane emissions from coal mining. Low-concentration methane is responsible for 60–70% of total methane emissions related to coal mining [10,11]. The amount of methane discharged into the atmosphere every year is approximately 19 billion m3, which is equivalent to 20,000 T of standard coal [12,13], and this increases every year. Methane, as a greenhouse gas, damages the ozone layer and deteriorates the atmospheric environment [14]. A lot of methane is discharged into the atmosphere as a result of mining activity in Poland [15]. However, methane, as a clean resource, can act as a significant source of energy and provide substantial economic benefit. It is reported that 0.64 million dollars per annum was earned by selling certified emission reduction (CER) generated by one rotary kiln in India, which consumes 4505 tones methane per annum [16]. The electricity generation and safe transportation technologies of low-concentration methane have also been developed to improve the methane utilization rate in China [17,18].
However, when the methane concentration is lower than 30%, methane cannot be used in large-scale industrial applications. For industrial applications, the methane enrichment method should be adopted to improve methane concentrations. There are two main methods of enrichment of low-concentration methane. Chemical methane membrane separation technology [19,20], using a thermal flow reversal reactor, has been shown to increase methane concentrations from 0.22–0.42 vol. % to 89.7–97.5 vol. % [21]. Membrane separation technology requires a high investment, and the membrane is easily clogged by ventilation air methane. Alternatively, low-temperature methane adsorption technology [22,23], a widely used methane oxidation technology [24,25], uses three-bed vacuum swing adsorption tests and can increase low-concentration coal mine methane from 12 vol. % to 26.7 vol. % at adsorption and desorption pressures of 110 kPa abs [26,27]. The absorption technology can achieve methane enrichment in the laboratory, but the methane enrichment is slow. Generally, the VAM of coal mine is about 3000 m3/min, and there are some limitations of industrial applications.
This paper examines the enrichment of low-concentration ventilation air methane in free diffusion conditions. Because the density of methane is lower than air, buoyancy is used to achieve methane enrichment. An earlier study using buoyancy by Y. Wang used a methane cylinder (10 L) to conduct methane buoyancy separation experiments [28]. In the static state, methane in the methane cylinder was uniformly distributed, with no methane accumulation layer and no change in the methane concentration. Thus, the methane cylinder is an isolated system, and it has some limitations. D. Zou used a methane storage pipe to conduct methane separation and enrichment experiments. Under isolated system conditions, the data show that a stable methane layer formed at the top of the pipe, However, the segregation and non-segregation methane experiment are not divided into different experimental groups, and the results are not clear [29]. S. Wang monitored the change of methane concentration in a mine roadway and extraction pipe [30]. They found that methane concentrations did not vary vertically, and there was no methane enrichment with height.
In the above papers, the storage state of methane in air was not clearly illustrated, and some experiments did not show whether the methane injected was in the segregated or non-segregated state. If segregated methane was injected, increasing methane concentrations should be caused by the accumulation of segregated methane rather than the accumulation of methane separated from air. If non-segregated methane was injected and the concentration of methane increases, then methane accumulation is likely caused by methane separation from air. To explore the enrichment characteristic of segregated and non-segregated methane, a custom enrichment tower is constructed to conduct physical on segregated and non-segregated methane. Enrichment of low-concentration ventilation air methane in free diffusion conditions has some innovation. The results are presented with a theoretical explanation.
2. Development of the Methane Enrichment Tower
2.1. Design and Composition of the Enrichment Tower
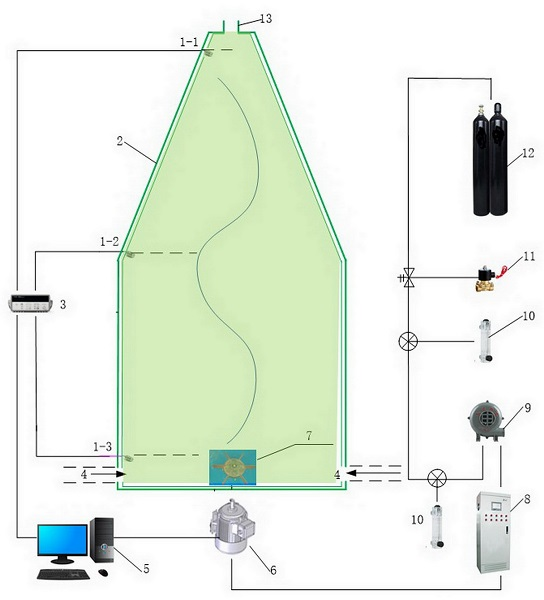
The methane enrichment tower is designed and developed according to the basic principle of methane buoyancy. The lower section of the device is cylindrical. The upper section is conical and narrows gradually. The height and diameter of the bottom cylinder are both 1 m. The height of conical round table is 1 m, and the material is stainless steel. The enrichment tower is composed of a cylinder, explosion-proof frequency conversion motor, blade, methane and air mixing tube, methane cylinders, methane sensor, flow meter, electric control box, decompression control valve, data integrator, and computer. A sketch and physical map of the enrichment tower system are shown in Figure 1.
The main function and operation of the enrichment tower is described as follows. The lower part of the enrichment tower has two air holes connected to methane cylinders and blowers, and the upper part of the enrichment tower has the vent holes. An explosion-proof inverter motor is installed in the bottom of the enrichment tower to drive the rotor rotation. The blade size is 40 cm in diameter and 5 cm high, which can achieve frequency control and speed to form the internal methane vortex field.
Three infrared methane sensors (Model: XP3000, Chengdu Xinhaosi Electron Detecting Technology Co. Ltd, Chengdu, China) are installed at the top, middle, and bottom of the enrichment tower, with a spacing of 1 m. Each sensor can monitor methane concentrations at different radial distances and is connected to a controller (Model: JB-TB-AT220D, Chengdu Xinhaosi Electron Detecting Technology Co. Ltd, Chengdu, China), isolated adapter (Model: RS485, Chengdu Xinhaosi Electron Detecting Technology Co. Ltd, Chengdu, China), graphical monitoring system controller, and computer, which convert the data into digital signals and display the methane concentrations in real time on the computer in Table 1. The flowmeter monitors the methane that flows into the tower, and the fan controls the methane volume that goes into the enrichment tower.
2.2. Experiment Plan
To investigate methane enrichment in the tower, the methane mixture is continuously injected in the non-isolated test system so that the methane is free to diffuse in the enrichment tower and then discharge. Injected methane is divided into two types: segregated and non-segregated. The low-concentration methane enrichment in the isolated test system is not discussed in this paper.
In the segregated methane test, as shown in Figure 2a, in order to ensure the accuracy of the test, the outlet of the enrichment tower is opened, filled with air with a fan, and then the methane is filled from the methane pipe. The volume ratio of the methane is 0.5% according to the flow rate. Then, the mixed methane is injected with a velocity of 0.5, 1.0, or 1.5 m/s to meet the movement in the free diffusion.
In the non-segregated methane test, as shown in Figure 2b, the outlet is opened, and the concentration of methane in the air inlet is adjusted using a three-way valve (mixer). This ensures that the methane is fully mixed and the methane concentration in the air inlet is 0.5%. Then, the methane mixture is continuously injected at a rate of 0.5 m/s, 1.0 m/s, and 1.5 m/s to achieve free diffusion. The methane sensors are used to monitor the distribution characteristics of the methane concentration in the tower. In both test states, the methane injection duration is 40 min, ensuring that the methane concentration monitored by each sensor remains stable. After the test, the methane bottle is closed, and air is continually injected in to prevent methane accumulation. When the methane concentration drops to less than 0.10%, the system power is cut, and the laboratory is ventilated.
This paper focuses on the enrichment diffusion characteristics due to buoyancy. The characteristics of methane concentrations in a vortex field will be discussed elsewhere. In vortex field conditions, when the rotational speed of the fan is 80 rpm in the non-isolated system, the concentrations of non-segregation methane in the upper, middle and lower sections of the tower are 0.67%, 0.69%, and 0.37%, respectively. The concentrations of segregation methane in upper, middle and lower sections of the tower are 0.54%, 0.55%, and 0.46%, respectively, which will be discussed elsewhere.
3. Analysis of Physical Test Results
3.1. The Results of the Segregation Methane Enrichment Test
In the non-isolated system, the distribution characteristics of methane concentration are monitored by the methane sensor in real time. Figure 3 shows the change in methane concentration over time for different methane velocities in the tower. Figure 3a shows the relationship between the methane concentration and time at several heights and with an inlet velocity of 0.5 m/s. The methane concentration of Sensor 3 (bottom) increases rapidly after the methane injection, and the methane concentration reaches a maximum value of 0.56% at 6 min before it gradually declines. The methane concentration decreases to 0.38% at 20 min. The concentrations of methane of the Sensors 2 and 1 (middle and top) are similar in the middle and top of the enrichment tower. The change of the methane concentration is small in the first 3 min. For Sensors 2 and 1, the methane concentration continues to increase to a steady state, and the methane concentrations are 0.54% and 0.63%, respectively.
The relationship between the methane concentration and the time with an inlet velocity of 1.0 m/s is shown in Figure 3b. Sensor 3 first shows relatively quick growth in methane concentration. After 5 min, the methane concentration reaches the maximum value of 0.57%, and then the methane concentration begins to decrease. At 18 min, the methane concentration decreases to a steady value of 0.38%. The methane concentrations of Sensors 2 and 1 show a small increase in the first 5 min, and then the methane concentrations continue to increase until reaching a stabilized value. Sensor 2 increases to a stable value of the 0.53% at 25 min, and Sensor 1 increases to a stable value of 0.63% at 30 min.
The relationship between the methane concentration and time with an inlet velocity of 1.5 m/s as shown in Figure 3c. Sensor 3 shows a rapid increase in methane concentration. The methane concentration reaches 0.59% at 4 min and then gradually decreases. The methane concentration decreases to a stable value of 0.38% at 18 min. The trends in methane concentration for Sensors 2 and 1 are similar. The methane concentration changes slightly at 7 min, and then the methane concentration continues to increase until it reaches a stable value. The methane concentration of Sensor 2 reaches a stable value of 0.53% at 19 min, and the methane concentration of Sensor 3 reaches a stable value of 0.64% at 30 min.
The monitoring results above show that the methane concentration of Sensor 3, at the bottom of the enrichment tower, initially increased before declining. The concentration of Sensor 2 is similar to that of Sensor 1. The stable values of concentration of methane of Sensor 1 is higher than that of Sensor 2. The values of the methane concentration in the tower generally increases linearly with height.
3.2. The Results of the Non-Segregation Methane Enrichment Test
The distribution characteristics of non-segregation low-concentration methane in the enrichment tower are shown in Figure 3. When the methane velocity is 0.5 m/s (Figure 4a), Sensor 3 first detects methane concentrations. The methane concentration rapidly increases and reaches its maximum value of 0.52% at 5 min. Then, the methane concentration gradually decreases. The methane concentration reaches a stable value of 0.46% at 15 min. The difference in methane concentrations of Sensors 2 and 1 are small at 3 min and then continue to increase to stable values. The methane concentration of Sensor 2 reaches a stable value of 0.51% at 11 min, and the methane concentration of Sensor 1 reaches a stable value of 0.53% at 21 min.
When the methane velocity is 1.0 m/s (Figure 4b), the methane concentration of Sensor 3 reaches a maximum value of 0.52% at 5 min and then drops slightly, reaching a stable value of 0.46% at 15 min. The methane concentrations of Sensors 2 and 1 change slightly at 3 min and then continue to increase to stable values. The methane concentration of Sensor 2 reaches a stable value of 0.51% at 9 min, and the methane concentration of Sensor 1 reaches a stable value of 0.53% at 18 min.
When the methane velocity is 1.5 m/s (Figure 4c), the methane concentration of Sensor 3 reaches a maximum value of 0.51% at 5 min and then gradually decreases. The methane concentration reaches a stable value of 0.47% at 15 min. The methane concentrations of Sensors 2 and 1 change slightly at 4 min and then continue to increase to stable values. The methane concentration of Sensor 2 reaches a stable value of 0.51% at 8 min, and the methane concentration of Sensor 1 reaches a stable value of 0.54% at 16 min.
4. Analysis and Discussion
In non-isolated systems, because of its low density, segregation methane in air will flow until it forms a stable methane accumulation layer, preventing methane and air from achieving a completely uniform state. For non-homogeneous methane under buoyancy forces, the methane molecules are free to diffuse. After various stages of buoyancy-driven motion, methane stratification or methane enrichment occurs at different heights, and the density of the methane follows the Boltzmann distribution law.
According to the theory of methane molecular motion, and assuming temperature stability and a Boltzmann distribution law, the distribution of molecular density and potential energy is given by
where n is the number of methane molecules per unit volume in space and n0 is the number of methane molecules per unit volume (). When the methane molecules are in the gravitational field, the gravitational potential of the methane molecules is . According to Equation (1), the density of the methane molecules at a certain height can be obtained by
where n0 is the density of the methane particles at the ground surface (z = 0), m is the molar mass of the methane molecules in kg/mol, the acceleration of gravity g = 9.8 m/s2, the Boltzmann constant K = 1.38 × 10⁻²³ J/K, and T is the absolute temperature in Kelvin. The negative sign indicates that a larger density spread results in a smaller density.
Equation (2) reveals the changing characteristics of the density of the methane molecules in a non-isolated system, where variations in molecular density with the height are small. Due to buoyancy, methane expands and floats, and the low-density methane rises relative to the air. Low-concentration methane can be enriched as it rises and concentrates at certain heights. For the static distribution, no temporal variations are considered. Due to buoyancy forces, the methane concentration increases approximately 0.10% for every 10-m rise in vertical height, and the increase in methane density is small. The magnitude of methane enrichment necessary for industrial applications is thus not possible by only concentrating methane at increased heights.
According to previous physical and numerical test data, the methane concentration in the enrichment tower increased from 0.5% to a maximum value of 0.65% under the segregation state. The methane concentration in the enrichment tower increased from 0.50% to a maximum of 0.54% under the non-segregation state. Although both states increased, the magnitude of the increase was small. L. Li adopted an isolated system that was allowed to stand for 59 min. The highest methane concentration increased from 1.0% to 1.0~1.15%, and the total increase was small [31].
However, the paper does not explain whether the methane injected into the enrichment tower is the segregation state or non-segregation state. In the experiment, a few thousand cubic metres of methane are run through the return airway per hour, but for enrichment in a closed static container, industrial applications would be more difficult. When a custom non-isolated system is adopted [29], the methane that is injected into the system is in the segregation state. The initial methane concentration is 0.20%, and the methane density slightly increases to a stable value of 0.25% after 27 min.
The methane concentration in the middle and top of the enrichment tower increases for several reasons. First, the increase in methane concentration in the enrichment tower is not due to the low methane density but because of the segregation state of the methane that is injected into tower. A considerable portion of the methane is in a segregated state, which gradually accumulates. It does not appear that accumulation is caused by non-segregated methane turning into segregated methane. Because of the irregular motion of the methane molecules, conversion of segregated methane to non-segregated methane is irreversible without external energy. Second, the lower section of the enrichment column is continuously injected into the methane mixture in the non-isolated system. The injected methane has a higher kinetic energy and pressure, allowing it to gradually rise due to the transfer of pressure from high to low. The segregated state methane therefore rapidly rises, causing segregated methane enrichment that is monitored. Third, the upper section of the enrichment tower is a cone, with a relatively smaller volume. The unit volume of methane molecules increases, and methane concentration increases are monitored.
In general, the buoyancy-driven enrichment of low-concentration methane results from the interaction of the methane molecules, and the conversion of segregated methane into non-segregated methane is irreversible. If the contact time or the distance between methane and air is increased, then there will be less segregated methane. Without other energy sources (kinetic or heat), the enrichment of methane due to the relative buoyancies of methane and air cannot be achieved.
5. Conclusions
- (1)
- A methane enrichment tower is designed and developed. The device can monitor methane concentration changes in real time, achieving automatic data storage.
- (2)
- In the non-isolated system, when segregated methane at different velocities is injected, the methane concentration shows a decreasing distribution characteristic from the top of the tower to the bottom. The maximum methane concentration is 0.64%. When the methane is in a non-segregated state, the methane concentration decreases gradually from top to bottom. The maximum methane concentration is 0.54%. The data show that enrichment of the segregated methane is higher than that of the non-segregated methane.
- (3)
- The methane concentration of the middle and upper tower sections increases gradually to stable values in the segregated and non-segregated methane enrichment towers, and the stable methane concentration shows a slight increase compared with the initial methane concentration (0.50%). The methane concentration at the bottom of the tower first increases and then decreases to a stable value. The stable methane concentration shows a reducing trend (less than 0.50%).
- (4)
- According to the Boltzmann distribution law for methane molecules, the methane concentration should only slightly increase with height. Due to the interaction of methane molecules in the gravitational field, the transformation from the segregated methane to non-segregated methane state is irreversible. Therefore, low-concentration methane enrichment due to buoyant forces is not feasible for industrial applications.
Acknowledgments
The work is supported by the University Doctoral Program Special Fund, China (20124116130001), the National Natural Science Foundation of China (51604093, 51474096), and the Program for Innovative Research Team at the University of Ministry of Education of China (IRT_16R22).
Author Contributions
Zhenhua Li, Huamin Li, and Wen Wang conceived and designed the experiments; Heng Wang and Dongyin Li performed the experiments; Wen Wang and Huaibin Li analyzed the simulations; Wen Wang wrote the paper.
Conflicts of Interest
The authors declare no conflict of interest.
References
- Karakurt, I.; Aydın, G.; Aydiner, K. Decreasing options of methane gas released from coal mines. In Proceedings of the 3rd Mining and Environmental Symposium, Ankara, Turkey, 11–12 June 2009; pp. 165–172. [Google Scholar]
- Karakurt, I.; Aydin, G.; Aydiner, K. Mine ventilation air methane as a sustainable energy source. Renew. Sustain. Energy Rev. 2011, 15, 1042–1049. [Google Scholar] [CrossRef]
- Kruger, D.; Franklin, P. The methane to markets partnership: Opportunities for coal mine methane utilization. In Proceedings of the 11th US/North American Mine Ventilation Symposium, University Park, PA, USA, 5–7 June 2006. [Google Scholar]
- Brodny, J.; Tutak, M. Analysis of gases emitted into the atmosphere during an endogenous fire. In Proceedings of the 16th International Multidisciplinary Scientific Geo Conference SGEM, Vienna, Austria, 2–5 November 2016; pp. 75–82. [Google Scholar] [CrossRef]
- Intergovernmental Panel for Climate Change. 2006 IPCC Guidelines for National Greenhouse Gas Inventories; Intergovernmental Panel on Climate Change: Geneva, Switzerland, 2006. [Google Scholar]
- Dalianis, G.; Nanaki, E.; Xydis, G.; Zervas, E. New aspects to greenhouse gas mitigation policies for low carbon cities. Energies 2016, 9, 128. [Google Scholar] [CrossRef]
- U.S. Environmental Protection Agency. Coalbed Methane Outreach Program (CMOP); U.S. Environmental Protection Agency: Washington, DC, USA, 2006.
- Aydin, G.; Karakurt, I.; Aydiner, K. Analysis of global methane emissions related to energy: 1990–2010. In Proceedings of the 7th Energy Symposium, Ankara, Turkey, 17–19 December 2009. [Google Scholar]
- Noack, K. Control of gas emissions in underground coal mines. Int. J. Coal Geol. 1998, 35, 57–82. [Google Scholar] [CrossRef]
- Carothers, P.; Deo, M. Technical and economic assessment: Mitigation of methane emissions from coal mine ventilation air. In Coalbed Methane Outreach Program; U.S. Environmental Protection Agency: Washington, DC, USA, 2000. [Google Scholar]
- Karakurt, I.; Aydin, G.; Aydiner, K. The effect of geologic features on methane emissions at underground coal mines. In Proceedings of the 2nd National Workers Health and Occupational Safety in Mining, Adana, Turkey, 19–20 November 2009. [Google Scholar]
- Yang, Z.; Liu, J.; Zhang, L. Catalytic combustion of low concentration coal mine methane over CuO/γ -Al2O3 catalyst: Effect of SO2. RSC Adv. 2014, 4, 39394–39399. [Google Scholar] [CrossRef]
- Ma, X. Exploration and practice of technologies to comprehensively utilize coal mine methane. China Coal Mine Methane 2007, 4, 28–31. [Google Scholar] [CrossRef]
- Majhi, S.; Ohanty, P.; Wang, H.; Pant, K.K. Direct conversion of natural gas to higher hydrocarbons: A review. J. Energy Chem. 2013, 22, 543–554. [Google Scholar] [CrossRef]
- Isaksen, I.S.A.; Berntsen, T.K.; Dalsoren, S.B.; Eleftheratos, K.; Orsolini, Y.; Rognerud, B.; Stordal, F.; Sovde, O.A.; Zerefos, C.; Holmes, C.D. Atmospheric ozone and methane in a changing climate. Atmosphere 2014, 5, 518–535. [Google Scholar] [CrossRef] [Green Version]
- Singh, H.; Mallick, J. Utilization of ventilation air methane in Indian coal mines: Prospects and challenges. Procedia Earth Planet. Sci. 2015, 11, 56–62. [Google Scholar] [CrossRef]
- Zhou, F.; Xia, T.; Wang, X.; Zhang, Y.; Sun, Y.; Liu, J. Recent developments in coal mine methane extraction and utilization in China: A review. J. Nat. Gas Sci. Eng. 2016, 31, 437–458. [Google Scholar] [CrossRef]
- Uddin, N.; Blommerde, M.; Taplin, R.; Laurence, D. Sustainable development outcomes of coal mine methane clean development mechanism Projects in China. Renew. Sustain. Energy Rev. 2015, 45, 1–9. [Google Scholar] [CrossRef]
- Khosravi, A.; Sadeghi, M. Separation performance of poly(urethane–urea) membranes in the separation of C2 and C3 hydrocarbons from methane. J. Membr. Sci. 2013, 434, 171–183. [Google Scholar] [CrossRef]
- Messaoud, S.B.; Takagaki, A.; Sugawara, T.; Kikuchi, R.; Oyama, S.T. Mixed matrix membranes using SAPO-34/polyetherimide for carbon dioxide/methane separation. Sep. Purif. Technol. 2015, 148, 38–48. [Google Scholar] [CrossRef]
- Gosiewski, K.; Jaschik, M.; Pawlaczyk, A.; Tańczyk, M.; Wojdyla, A.; Warmuziński, K. Thermal Coal Mine Ventilation Air Methane Combustion in a Flow Reversal Device with Heat Regeneration and Heat Recovery; Institute of Chemical Engineering of the Polish Academy of Sciences: Gliwice, Poland, 2010; pp. 1–192. (In Polish) [Google Scholar]
- Yang, Y.; Wu, Y.; Liu, H.; Ribeiro, A.M.; Li, P.; Yu, J.; Rodrigues, A.E. Enrichment of ventilation air methane by adsorption with displacement chromatography technology: Experiment and numerical simulation. Chem. Eng. Sci. 2016, 149, 215–228. [Google Scholar] [CrossRef]
- Dundar, E.; Rogacka, J.; Firlej, L.; Wexler, C.; Llewellyn, P.; Boulet, P.; Kuchta, B. Low temperature mechanism of adsorption of methane: Comparison between homogenous and heterogeneous pores. Colloids Surf. A Physicochem. Eng. Asp. 2016, 496, 86–93. [Google Scholar] [CrossRef]
- Mallet, C.W.; Su, S. Progress in developing ventilation air methane mitigation and utilization technologies. In Proceedings of the 3rd International Methane and Nitrous Oxide Mitigation Conference, Beijing, China, 17–21 November 2003. [Google Scholar]
- Yang, X.; Liu, Y.; Zhang, E. Experimental of the low-concentration coal mine methane enrichment by three-bed vacuum swing adsorption. J. China Univ. Min. Technol. 2016, 45, 723–728. [Google Scholar]
- Mao, M.; Liu, Y.; Zheng, B.; Liu, R.; Meng, J. Investigation of temperature distribution uniformity in a preheating catalytic oxidation bed. J. China Coal Soc. 2015, 40, 109–114. [Google Scholar]
- Zhang, B.; Wu, Q. Thermodynamic promotion of tetrahydrofuran on methane separation from low-concentration coal mine methane based on hydrate. Energy Fuels. 2010, 24, 2530–2535. [Google Scholar] [CrossRef]
- Wang, Y.; Wu, Z. Methane lighter than air, methane can “rise”? Saf. Coal Mines 1979, 6, 29–32. [Google Scholar]
- Zou, D.; Cheng, W.; Liu, Y. Research on the principle and experiment of recovering enrichment gas from return air in mine. J. China Coal Soc. 2011, 36, 1506–1510. [Google Scholar]
- Wang, S.; Qiao, J.; Chen, L. Study on feasibility of ventilation air methane accumulation in coal mine by buoyant force. China Coal 2012, 38, 104–106. [Google Scholar] [CrossRef]
- Li, L.; Wang, K.; Le, L. Experimental study of purifying low concentration methane. J. Liaoning Tech. Univ. (Nat. Sci.) 2012, 31, 716–719. [Google Scholar]
Figure 1.
Schematic diagram of methane enrichment tower system. (a) The physical map of the enrichment tower system; (b) the sketch of the enrichment tower system. 1 (1-1, 1-2, 1-3)—methane sensor, 2—tower equipment, 3—data collection system, 4—air inlet, 5—computer, 6—explosion-proof motors by a frequency conversion function, 7—blades, 8—electric control box, 9—fan 10—flowmeter, 11—control valve, 12—methane cylinders, 13—air outlet.

Figure 2.
Diagram of the methane enrichment experiment in free diffusion conditions. (a) The segregation methane experiment; (b) The non-segregation methane experiment.
Figure 2.
Diagram of the methane enrichment experiment in free diffusion conditions. (a) The segregation methane experiment; (b) The non-segregation methane experiment.

Figure 3.
Graph of the segregation methane concentration versus time in the enrichment tower. (a) Speed of methane injection is 0.5 m/s; (b) Speed of methane injection is 1.0 m/s; (c) Speed of methane injection is 1.5 m/s.
Figure 3.
Graph of the segregation methane concentration versus time in the enrichment tower. (a) Speed of methane injection is 0.5 m/s; (b) Speed of methane injection is 1.0 m/s; (c) Speed of methane injection is 1.5 m/s.


Figure 4.
Relation graph of non-segregation methane concentration and time in enrichment tower. (a) Speed of methane injection is 0.5 m/s; (b) Speed of methane injection is 1.0 m/s; (c) Speed of methane injection is 1.5 m/s
Figure 4.
Relation graph of non-segregation methane concentration and time in enrichment tower. (a) Speed of methane injection is 0.5 m/s; (b) Speed of methane injection is 1.0 m/s; (c) Speed of methane injection is 1.5 m/s


Table 1.
Parameter index of XP3000 infrared detector and JB-TB-AT220D Controller.
| Serial Number | XP3000 Infrared Detector | JB-TB-AT220D Controller | ||
|---|---|---|---|---|
| 1 | Parameter introduction | Parameter index | Parameter introduction | Parameter index |
| 2 | Test principle | Infrared detection | Communication loop | HBUS four highway |
| 3 | Test range | 0–5% | Test range | 0–100% |
| 4 | Test accuracy | 0.01% | Display method | 7 inch, 800 × 480 color screen |
| 5 | Voltage | DC 24 V | Voltage | DC 220 V ± 15%/50 Hz |
| 6 | Total Power | ≤1.5 W | Total Power | ≤10 W |
| 7 | Test distance | ≤1500 m | Relative humidity | <93% RH |
| 8 | Sensor size | 180 mm × 170 mm × 100 mm | Sensor size | 180 mm × 170 mm × 100 mm |
| 9 | Operating temperature | −40–70 °C | Operating temperature | 0~550 °C |
© 2018 by the authors. Licensee MDPI, Basel, Switzerland. This article is an open access article distributed under the terms and conditions of the Creative Commons Attribution (CC BY) license (http://creativecommons.org/licenses/by/4.0/).
Share and Cite
MDPI and ACS Style
Wang, W.; Wang, H.; Li, H.; Li, D.; Li, H.; Li, Z. Experimental Enrichment of Low-Concentration Ventilation Air Methane in Free Diffusion Conditions. Energies 2018, 11, 428. https://doi.org/10.3390/en11020428
AMA Style
Wang W, Wang H, Li H, Li D, Li H, Li Z. Experimental Enrichment of Low-Concentration Ventilation Air Methane in Free Diffusion Conditions. Energies. 2018; 11(2):428. https://doi.org/10.3390/en11020428
Chicago/Turabian StyleWang, Wen, Heng Wang, Huamin Li, Dongyin Li, Huaibin Li, and Zhenhua Li. 2018. "Experimental Enrichment of Low-Concentration Ventilation Air Methane in Free Diffusion Conditions" Energies 11, no. 2: 428. https://doi.org/10.3390/en11020428
Note that from the first issue of 2016, this journal uses article numbers instead of page numbers. See further details here.