Capacity Optimization of a Centralized Charging Station in Joint Operation with a Wind Farm
by
 ,
,
Zhe Jiang
1,2,* ,
,
Xueshan Han
3,4,
Zhimin Li
1,
Mingqiang Wang
3,4,
Guodong Liu
5,
Mengxia Wang
3,4,
Wenbo Li
2 and
Thomas B. Ollis
5 1
Department of Electrical Engineering, Harbin Institute of Technology, Harbin 150001, China
2
Electric Power Research Institute, State Grid Shandong Electric Power Company, Jinan 250003, China
3
Key Laboratory of Power System Intelligent Dispatch and Control, Shandong University, Jinan 250061, China
4
Collaborative Innovation Center for Global Energy Interconnection (Shandong), Jinan 250061, China
5
Power and Energy Systems Group, Oak Ridge National Laboratory, One Bethel Valley Road, P.O. Box 2008 MS6007, Oak Ridge, TN 37831, USA
*
Author to whom correspondence should be addressed.
Energies 2018, 11(5), 1164; https://doi.org/10.3390/en11051164
Submission received: 11 April 2018
/
Revised: 27 April 2018
/
Accepted: 4 May 2018
/
Published: 7 May 2018
(This article belongs to the Special Issue Energy Systems Engineering)
Abstract
:In the context of large-scale wind power integration and rapid development of electric vehicles (EVs), a joint operation pattern was proposed to use a centralized charging station (CCS) to address high uncertainties incurred by wind power integration. This would directly remove the significant indeterminacy of wind power. Because the CCS is adjacent to a wind power gathering station, it could work jointly with wind farms to operate in power system as an independent enterprise. By combining the actual operational characteristics of the wind farm and the CCS, a multidimensional operating index evaluation system was created for the joint system. Based on the wind farm’s known capacity, a multi-target capacity planning model was established for CCS to maximize the probability of realizing diverse indices of the system based on dependent-chance goal programming. In this model, planning and dispatching are combined to improve the feasibility of results in the operational stage. This approach takes the effects of randomness into account for wind power and battery swapping. The model was solved through combining Monte Carlo simulation and a genetic algorithm (GA) based on segmented encoding. As shown in the simulation results, the proposed model could comprehensively include factors such as initial investment, wind power price, battery life, etc., to optimize CCS capacity and to ultimately improve the operating indices of the joint system.
1. Introduction
The safe operation of the power system is based on a reliable power supply and accurate load forecasting. However, substantial indeterminacy caused by large-scale wind power integration presents the power system with significant challenges [1,2,3,4]. As the scale of wind power integration continues to increase, fossil energy power generation is gradually subjected to certain constraints. The traditional method of using only fossil energy generators to passively manage the significant indeterminacy of wind power no longer works. This has led to a need to explore regulated means to completely or partially eliminate the uncertainties of wind power before the wind farm becomes integrated into the power system. This initiative can help reduce the impact that wind power integration has on the power grid.
Building a matching energy storage station (ESS) for a wind farm improves wind power controllability [5]. Nevertheless, the investment cost of an ESS is prohibitive, which limits its promotion and application [6,7]. With the rapid development of electric vehicles (EVs), scholars have begun investigating ways to use EVs to store energy to help control the random fluctuations of wind power and to coordinate scheduling between wind power and EVs [8,9,10]. Dramatic uncertainties resulting from EV users’ driving behavior and subjective demands have given rise to strong indeterminacy of EVs as flexible load or energy storage devices, which further affects their coordination with wind power [11]. The battery swapping pattern of centralized charging and unified distribution realizes geographical decoupling between EV battery replacement and charging [12], making it possible to collaborate between a centralized charging station (CCS) and a wind farm. On one hand, the CCS serves as an ESS to provide back-up energy for wind farms to enhance the controllability of wind power and reduce the impact on the power grid. On the other hand, the CCS acts as the flexible load to be charged by wind power directly, thus facilitating local consumption of wind power and avoiding indirect carbon emissions caused by EVs charging from the power grid [13,14]. In this scenario case, zero emissions in its true sense can be realized for EVs. Cooperation between the wind farm and CCS exerting its multiple benefits (energy storage and flexible load) is an effective solution to wind power integration issues.
CCS provides multiple benefits based on its capacity. Excessive redundancy in capacity increases investment cost, as well as operation and maintenance cost, incurring resource waste. In comparison, insufficient redundancy is not conducive to realizing the multiple benefits of CCS, Consequently, collaborative effects of the CCS and the wind farm can be jeopardized; in severe cases, failure in satisfying battery swapping demands may occur. Therefore, CCS capacity optimization is directly associated with the application of its multiple benefits and the revenues gained through its joint operation with the wind farm.
At present, CCSs are mostly constructed and financed by electric power companies [15]. On this basis, research on CCS capacity optimization is typically driven by the internal interests of electric power enterprises, while the benefits to other investors are rarely considered. Based on CCS and transmission line construction cost minimization, a CCS capacity planning model was established [16]. Pan et al. [17] developed a bi-level capacity optimization model to address economic efficiency and power network structure strength. Combining CCS planning with the dispatch of a distribution network, a capacity planning model considering load shifting of CCS was also built to optimize grid load curves and elevate both the security and reliability of power system operation [18]. However, due to the unceasing advances in power market reform and the gradual release of competitive power gird services, CCS is no longer confined to investment from electric power companies. Investment sources now include wind power operators, petroleum companies, and other social capital [19]. If all investors pursue maximization of their own benefits, differences in benefits pursued by different investors have significant influences on their investment decision-making and operation control strategies [20]. Therefore, incorporating investment source variations into CCS capacity planning contributes to effective guidance for CCS investment and construction under the current background of power market reform.
Based on the battery swapping pattern of centralized charging and unified distribution, this paper proposes a collaboration pattern between the CCS and the wind farm, and the corresponding capacity optimization issue of CCS is investigated. The main creative concepts are as follows. (1) Rather than the traditional approach of passively dealing with wind power integration, a joint operation pattern is proposed to directly eliminate significant uncertainties of wind power and to actively cope with its indeterminacy. (2) A multi-objective capacity optimization model of CCS is also presented as part of the proposed joint operation pattern. In addition to battery swapping demands, the model also accounts for the influence of external factors such as wind power consumption and annualized profit of the joint system on capacity optimization results of CCS. (3) To improve the feasibility of the planning results in practical operation, the probability of the joint system realizing its operating indices are maximized, and the impact of uncertainties caused by wind power and battery swapping demand on the planning results is considered simultaneously.
The remainder of this paper is organized as follows: the joint operation mode of the wind farm and the CCS is proposed in Section 2, along with the operating indices. The proposed capacity optimization model of CCS is described in Section 3, simulation analysis is addressed in Section 4, and the conclusions are presented in Section 5.
2. Joint Operation of Wind Farm and CCS
2.1. The Battery Swapping Pattern of Centralized Charging and Unified Distribution
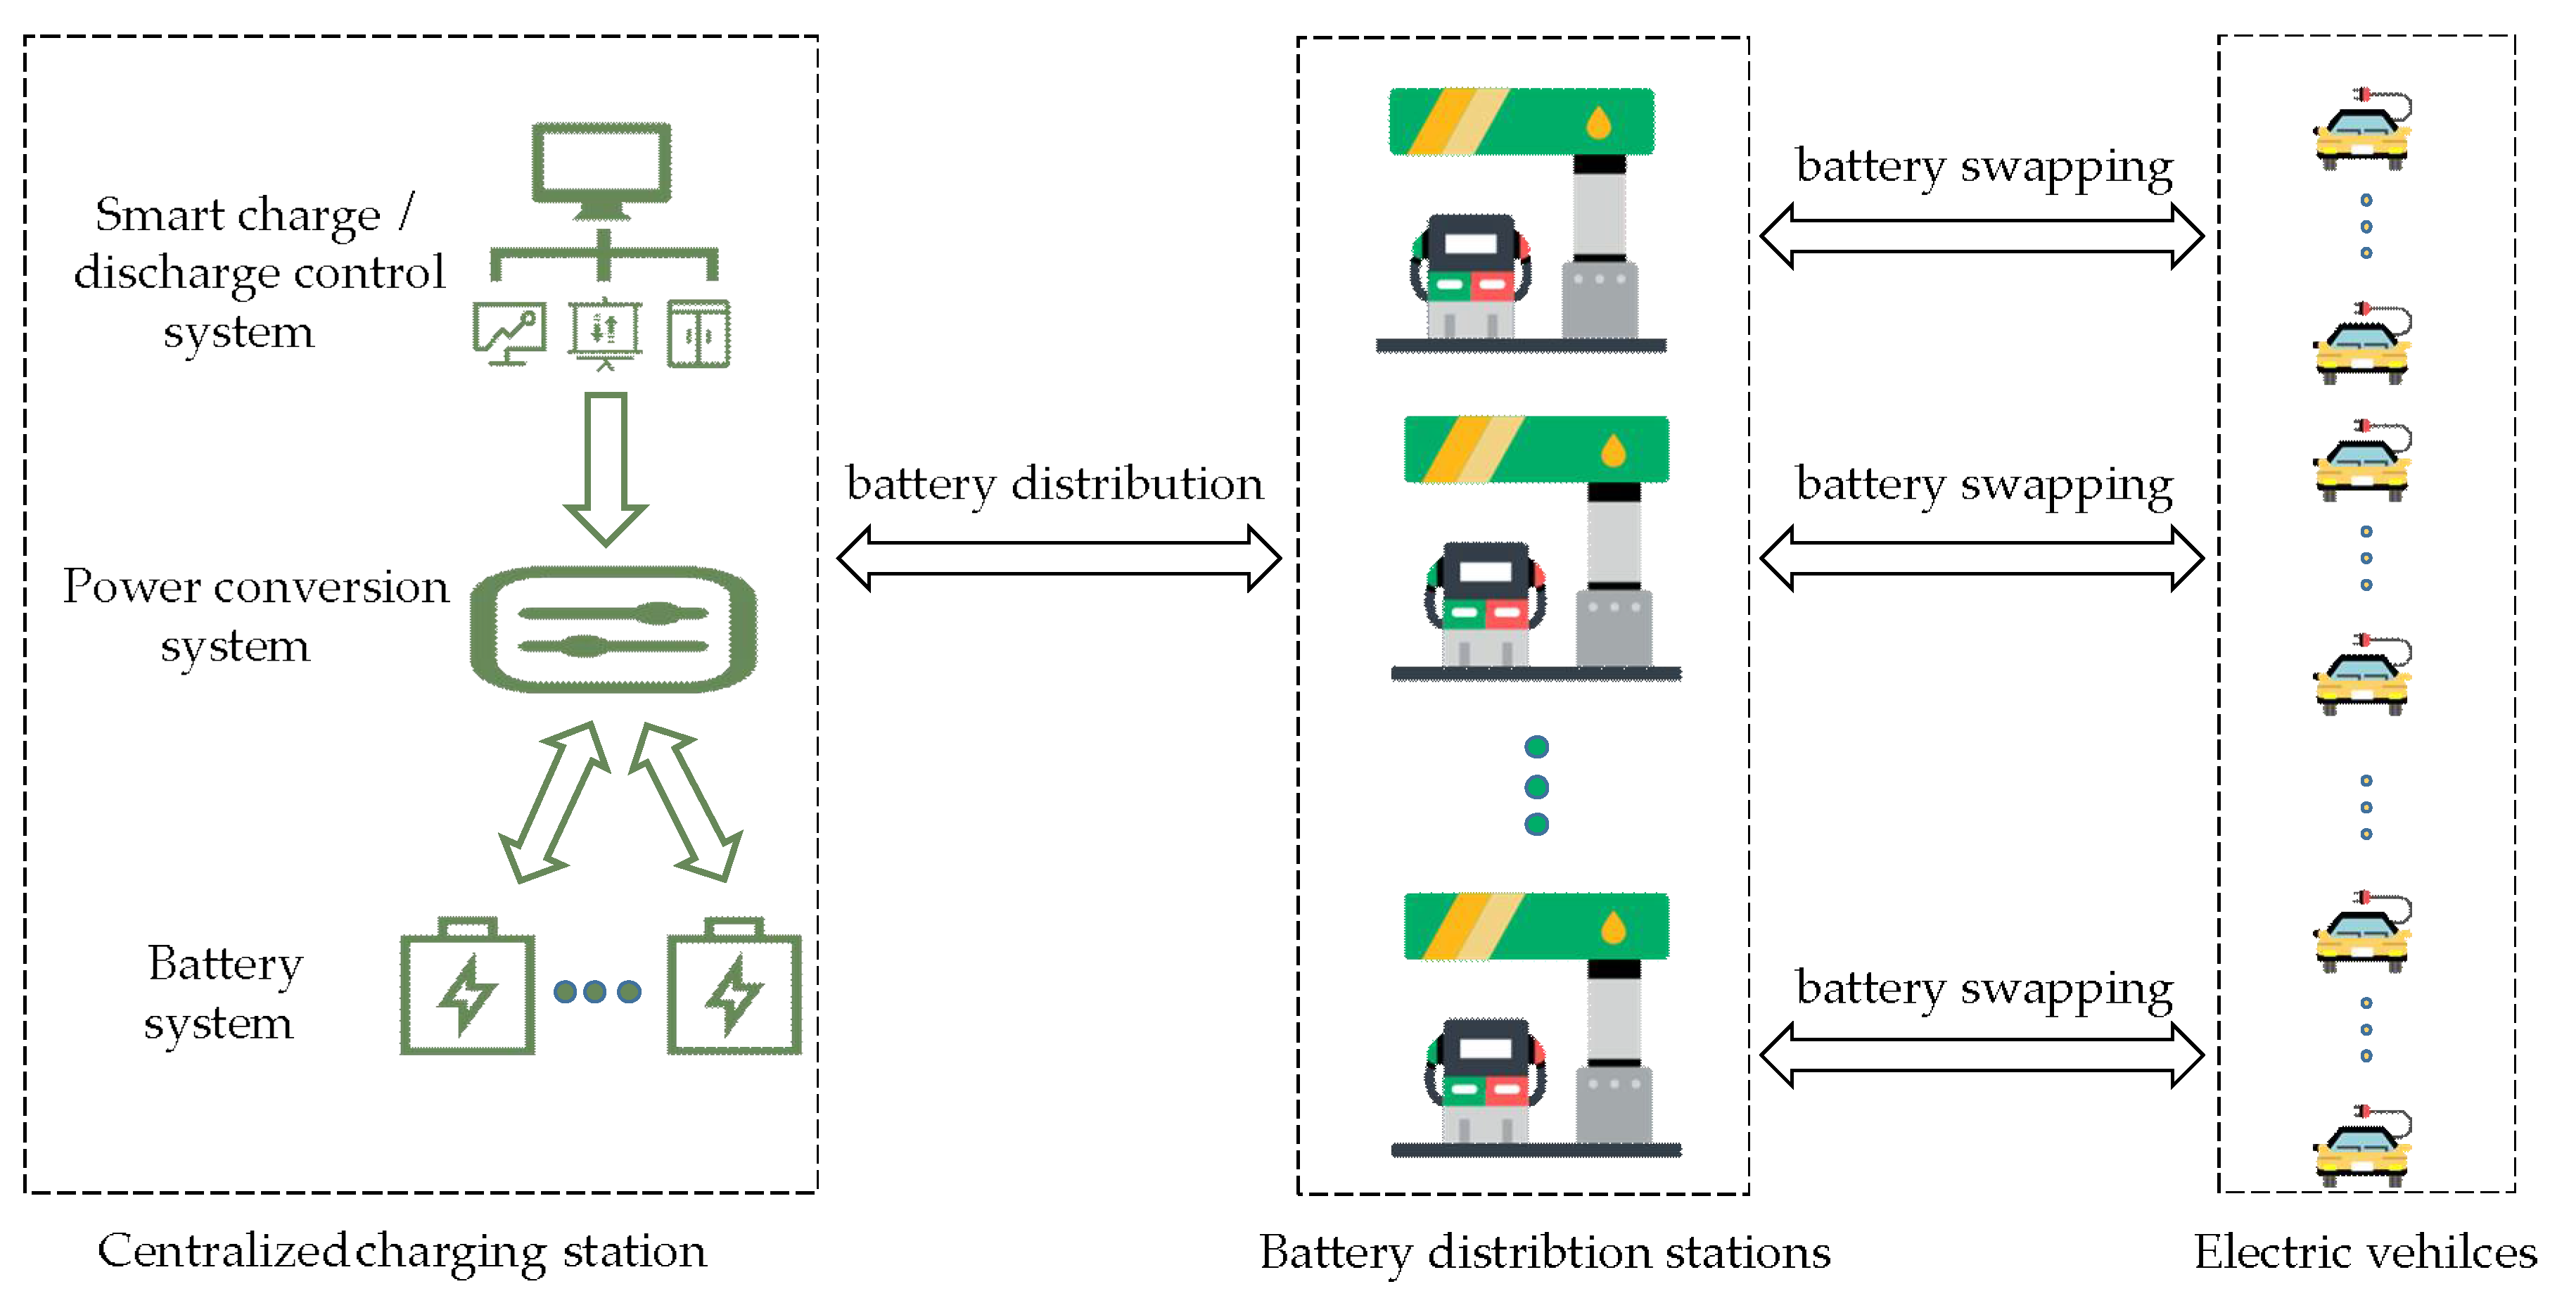
The battery swapping pattern of centralized charging and unified distribution separates battery charging from battery replacement, as shown in Figure 1. In this approach, battery charging and replacement should be implemented at different sites, with separate CCS and battery distribution stations (BDSs).
As regards the BDSs providing battery replacement services and covering a small area, since there is no need to charge batteries, the problem of grid access does not exist. Therefore, BDSs are principally located in the downtown area, much closer to EV users. Empty batteries replaced in BDSs are delivered to the CCS via a logistics system.
The CCS is responsible for unified charging and maintenance of batteries and implements large-scale centralized battery management. It is mainly constituted by a battery system, a power conversion system (PCS), and a smart charge/discharge control system. The PCS is bidirectional, so it can charge batteries or send the power stored in the battery system back to the power grid. The smart charge/discharge control system allows for intelligent optimization of the charge/discharge power of the CCS. As the CCS usually occupies a large area and has a high charge power, it is built adjacent to a transformer substation in the suburbs at a relatively low land price. Fully charged batteries are delivered to BDSs to meet their battery swapping demands.
This a battery swapping pattern can be further classified into four categories, in line with the affiliations and responsibilities of investors, namely, C pattern, M pattern, R pattern and 3P pattern [21]. For example, the CCS and BDSs have the same investors in C pattern. According to M and R patterns, the CCS and BDSs belong to different investors, and battery distribution tasks in two such patterns are respectively assumed by the CCS and the BDSs. For the 3P pattern, the CCS and BDSs also belong to different investors, but the battery distribution work is performed by a third party.
2.2. Joint Operation Pattern
In this analysis, the R battery swapping pattern mentioned above is employed. Therefore, the BDSs and CCS belong to different investors. In addition to providing battery swapping services to users, the BDSs are also responsible for battery delivery. BDSs send empty batteries from EV users to CCS and bring back an equal number of charged replacement batteries. In this battery swapping scenario, some charged batteries can be stored in the BDSs, which is conducive to increasing the number of batteries in the entire battery swapping operation system.
The CCS is constructed based on the wind power gathering station and coordinates with the wind farms to constitute a joint system so that both systems participate in power grid operation as independent enterprises. Examples of such a joint system are presented in Figure 2.
Since the joint system has some schedule flexibility, it can be deemed as a special power plant in the power grid. The joint system must formulate a generation schedule for the next day according to the day-ahead predicted values of power from diverse wind farms and the battery swapping demands submitted by various BDSs; then the joint system must declare the schedule to the power system operator. Combining load predictions and the power grid security assessment, the power system operator modifies the generation schedule described above and sends the final schedule back to the joint system. At the same time, generation schedules are also agreed upon for other thermal power plants. The joint system should track its generation schedule. If any deviation occurs, economic penalties are imposed according to the magnitude of the deviation and the time that it occurs.
Due to low wind power forecasting precision, the output power of the joint system is uncertain. CCS not only takes advantage of wind power to provide battery replacement services to BDSs, but it also serves as an energy storage system. On the one hand, CCS provides a reserve for wind farms to improve the controllability of wind power so that both the output deviation the corresponding economic penalties can be decreased. On the other hand, CCS plays the role of “peak-shaving and valley-filling” for wind power based on wind power price in different time intervals. This allows the wind power to be moved from low to high price time intervals in order to increase the electricity sale revenue of the joint system.
2.3. Operating Indices of the Joint System
The joint system of the wind farm and the CCS has the following operation targets: (1) to satisfy the BDS battery swapping demands to the greatest extent and to improve service satisfaction, (2) to improve the wind power utilization rate and decrease wind curtailment, and (3) to elevate the overall operation revenue of the joint system. The operation targets of the joint system were determined based on three objectives: service satisfaction, environmental benefits, and economic benefits.
● Index of battery swapping demand curtailment
The randomness of EV battery swapping demands results in the randomness of battery swapping demands in the BDSs. When the residual capacity of the CCS is insufficient, then BDS battery swapping demands cannot be met, which leads to a failure in satisfying the EV users’ battery swapping needs. Consequently, user satisfaction declines, which is unbeneficial for EV promotion.
Therefore, the index of battery swapping demand curtailment can be defined according to service satisfaction; that is, the unsatisfied battery swapping demand should be no more than the allowable maximum value denoted by , which is expressed in Equation (1):
where Nt refers to the number of time frames partitioned, and refers to the battery swapping demand unsatisfied at time t.
● Index of wind curtailment
Requirements for mandatory energy conservation and emission reduction have been raised specific to China’s electric power industry. If the precise prediction of wind power is excessively low or if the generation schedule is irrational, then the CCS cannot absorb the excess wind power, and wind curtailment takes place. It is apparent that excessive wind curtailment does not conform with the concept of energy conservation and emission reduction.
To improve the wind power utilization rate, the index of wind curtailment was defined according to environmental benefits, in which wind curtailment should be no more than the allowable maximum wind curtailment denoted by , as written in Equation (2):
where is the length of unit time interval, and is the wind curtailment power at time t.
● Index of annualized profit
With a defined wind farm capacity, the annualized cost of the joint system only covers equivalent annual values CEVB and CPCS of the battery system investment and the PCS investment separately, as well as the annualized operation and maintenance cost Cope of the joint system:
where is the rated capacity of the battery system, is the unit price of the battery capacity, is the discount rate of funds, and LEVB is the service life of batteries.
Discharging batteries to the power grid accelerates battery aging. The increased electricity-selling revenues gained through the method of “charge when low and discharge if high”, together with the discharge cost of batteries, should be qualitatively analyzed to determine whether it is profitable for CCS to join the scheme of “charge when low and discharge if high”. In this study, battery life was used to link the charge/discharge energy of batteries to its charge/discharge costs. High charge/discharge energy corresponds to short battery life and an increase in the equivalent annual values of the initial investment of battery system. This leads to an increase in the investment cost in the joint system. Battery life can be expressed as shown in Equation (4):
where Ncir is the rated charge/discharge cycles of batteries, DoD is the corresponding depth of discharging, is the charging power of CCS at time t, is the number of days in one year, and is the charge efficiency of CCS.
Expression of the equivalent annual value for initial investment in PCS is shown in Equation (5):
where is the rated power of PCS, is the unit price of PCS, and L is a constant value representing the service life of PCS.
Operation and maintenance cost of the joint system is written into Equation (6) below:
where is the economic penalty incurred by the joint system output deviation, and and are the annual maintenance costs of the unit investment of a battery system and the PCS, respectively. Equation (6) includes (1) the economic penalty caused by output deviation of the joint system, (2) the annual maintenance cost of the battery system, and (3) the annual maintenance cost of PCS.
If the joint system fails to track its generation schedule, it should be subjected to corresponding economic penalties according to the magnitude of the power deviation and the occurrence time. Such economic penalties are expressed in Equation (7):
where and stand for scheduled output and the actual output of the joint system at time t respectively, is the grid purchase price of wind power at time t, and is the penalty coefficient of power deviation. The expression of is shown below:
where is the day-ahead predicted value of wind power. Furthermore, represents the scheduled charge/discharge power of CCS, and it should be a positive value in the event of charge, or otherwise it should be a negative value.
Annual income of the joint system comprises annual power selling income , annual battery swapping services income , and the equivalent annual value of the income gained by battery scrap:
where is the battery swapping demand fulfilled at time t, is the unit price of battery swapping, and is the unit price of battery scrap.
The index of annualized profit is defined as follows: Annualized Profit of Joint System ≥ Allowable Minimum Annualized Profit , as presented in Equation (12):
3. CCS Capacity Optimization Based on Dependent-Chance Goal Programming
According to the CCS-wind farm cooperation framework proposed in this paper, CCS not only provides battery swapping services to BDSs, but it also provides multiple other benefits. As a result, CCS capacity optimization should not only account for internal factors such as battery swapping demands, but it also should account for many external factors, such as whether the battery capacity can satisfy the reserve demand of wind power, whether the matching between generation schedule and peak-valley price of wind power can be realized for the joint system, and so on. Due to the high investment cost of batteries, excess redundancy enormously increases costs of investment, as well as operation and maintenance. However, very low redundancy reduces the CCS’s capability to charge when low and discharge if high. Consequently, it becomes less likely for the generation schedule of the joint system to match the peak-valley price. This in turn lowers the benefits earned by electricity selling. As a result, trade-off between the initial investment and the operation revenues should be conducted for the joint system to optimize the CCS’s capacity.
During capacity programming, failure to effectively consider emergencies—including random fluctuations in wind power and battery swapping demands—frequently leads to a decline in the feasibility of joint system optimization outcome in actual operation, and it may even lead to infeasibility. As a consequence, failure to consider emergencies further lowers the cooperation effect of a joint wind farm and CCS. Therefore, the decision-maker of the joint system should focus on optimizing operating indices such as wind curtailment while giving more importance to the relevant risks to realizing operating indices. The dependent-chance programming model [22] clearly conforms to the modeling thoughts presented in this paper.
To sufficiently consider the randomness of wind power and battery swapping demands, a CCS capacity optimization model was developed based on dependent-chance programming. This approach would maximize the realization probability of three operating indices. The operating indices are incompatible with each other, which signifies that the improvement of one index could only be achieved by sacrificing other indices. In such a case, such indices should be balanced. Therefore, a priority structure should be established for the model according to the difference of index importance and the decision-makers’ risk tolerance to these indices. Moreover, by the merit of goal programing, decision-makers can set target values for the operating indices so that their realization probability can reach their target values to the greatest extent.
3.1. Mathematical Modeling
The CCS capacity optimization model is expressed in Equation (13) below:
where Lexmin{·} means that target vectors are minimized lexicographically; Pr{·} refers to the probability of operating index realization; PQds, PQws and PBs are the target values of three indices realization probabilities defined by decision-makers in combination with their own risk preferences; and are the positive and negative deviations, respectively, denoting that realization of the probability of index ranking i has deviated from its target value, and both should be nonnegative numbers. Decision variables of the model cover the rated capacity QEVB of the battery system, the rated power PPCS of the PCS, and the generation schedule of the joint system. By contrast, the actual wind power and the practical battery swapping demands at each time interval are random variables.
Given the reality in China, a company with large wind farms and CCS is more likely to be a state-owned enterprise, with decision-makers often focusing primarily on national policy and social responsibility. Therefore, in this model, the priority order of the three indices from high to low is battery swapping demand curtailment index, wind curtailment index and annualized profit index. Of course, the priority order can also be reasonably established according to the actual situation of the joint system, which will not affect the applicability of the model.
Constraint condition mainly consists of the following five aspects:
(1) Maximum capacity constraints over the battery system and PCS
where is the maximum constraint over the rated capacity of the battery system, and is the maximum rated power of the PCS. Both of these are under the constraints of multiple conditions, including the area, the cost, the transformer capacity, etc.
(2) Charge/discharge power constraint
(3) CCS power constraint
where Qt is the energy storage of CCS at time t. Because over discharge shortens the battery life, the energy storage of the CCS should be no less than the minimum value Qmin according to the requirement. It is assumed that specifications of the batteries in the CCS were identical and that the charge/discharge strategy of a single battery satisfies the battery capacity constraint, so the iterative formula for the energy storage Qt of CCS is similar to that of ESS, that is:
where is discharge efficiency of CCS, and is the charge power and is the discharge power at time t, which can be expressed as follows:
(4) CCS energy storage constraint at the end of a decision-making cycle
where Qini is the initial energy storage of CCS. To realize decoupling of various decision-making cycles, energy storage at the end of a decision-making cycle should be the same as that of Qini.
(5) Zero emission constraint over EVs
To realize zero emissions of EVs, the CCS is only charged by wind power.
Satisfied battery swapping demand and unsatisfied battery swapping demand of CCS at time t can be written in the two equations below, respectively:
At time t, actual output of the joint system can be expressed as follows:
Minimum value for available CCS charge/discharge power at time t is expressed as follows:
Expression of wind curtailment power at time t is as follows:
The maximum value for the available CCS charge/discharge power at t is written as follows:
At time t, the charge/discharge power of CCS can be expressed as follows:
3.2. A Solving Method Combining Monte Carlo Simulation and Genetic Algorithm (GA)
In practice, it is difficult to solve the multi-target stochastic optimization problems presented above. This is mainly due to the need to predict variations in wind power and battery swapping demand and the complexity of resolving a model involving probability calculation.
Even though it is difficult to predict wind power and battery swapping demands, many research findings have demonstrated that errors of relevant predicted values obey normal distribution [23,24]. Therefore, Monte Carlo simulation can be used for this effort using the law of large numbers to determine the realization probability of all indices if the probability distribution has been mastered for predictive errors related to wind power and battery swapping demands.
The flow chart of the Monte Carlo simulation is shown in Figure 3. Based on the probability distribution functions, m groups of scenarios are generated randomly to simulate the fluctuations of wind power and battery swapping demand:
For each scenario, the unsatisfied battery swapping demand, wind curtailment and annualized profit are calculated. When m is large enough, the realization probabilities of each index could be expressed as:
Furthermore, the global optimization of the model has been implemented by a genetic algorithm (GA).
Any changes in the rated capacity of the battery system, the rated power of the PCS, or the generation schedule will influence the index of battery swapping demand curtailment, the index of wind curtailment, and the index of annualized profit. To increase the diversity of each group of variables in chromosomes and improve the search efficiency and local search ability of the GA, the segmented chromosome operation was used, and the three groups of variables were adjusted separately in the process of optimization.
The chromosome is logically divided into three segments; the segmented coding of the chromosomes is shown in Figure 4. Segment 1 is the rated capacity of the battery system, and segment 2 is the rated power of PCS, and both of these segments are planning variables. Segment 3 is the joint system generation schedule, which is an operating variable. The planning variable prescribes a limit to the decision space of the operating variable, and the operating variables affect the planning variables by exerting influence on the realization probability of the joint system’s operating indices.
4. Simulation Analysis
4.1. Simulation Parameter Setting
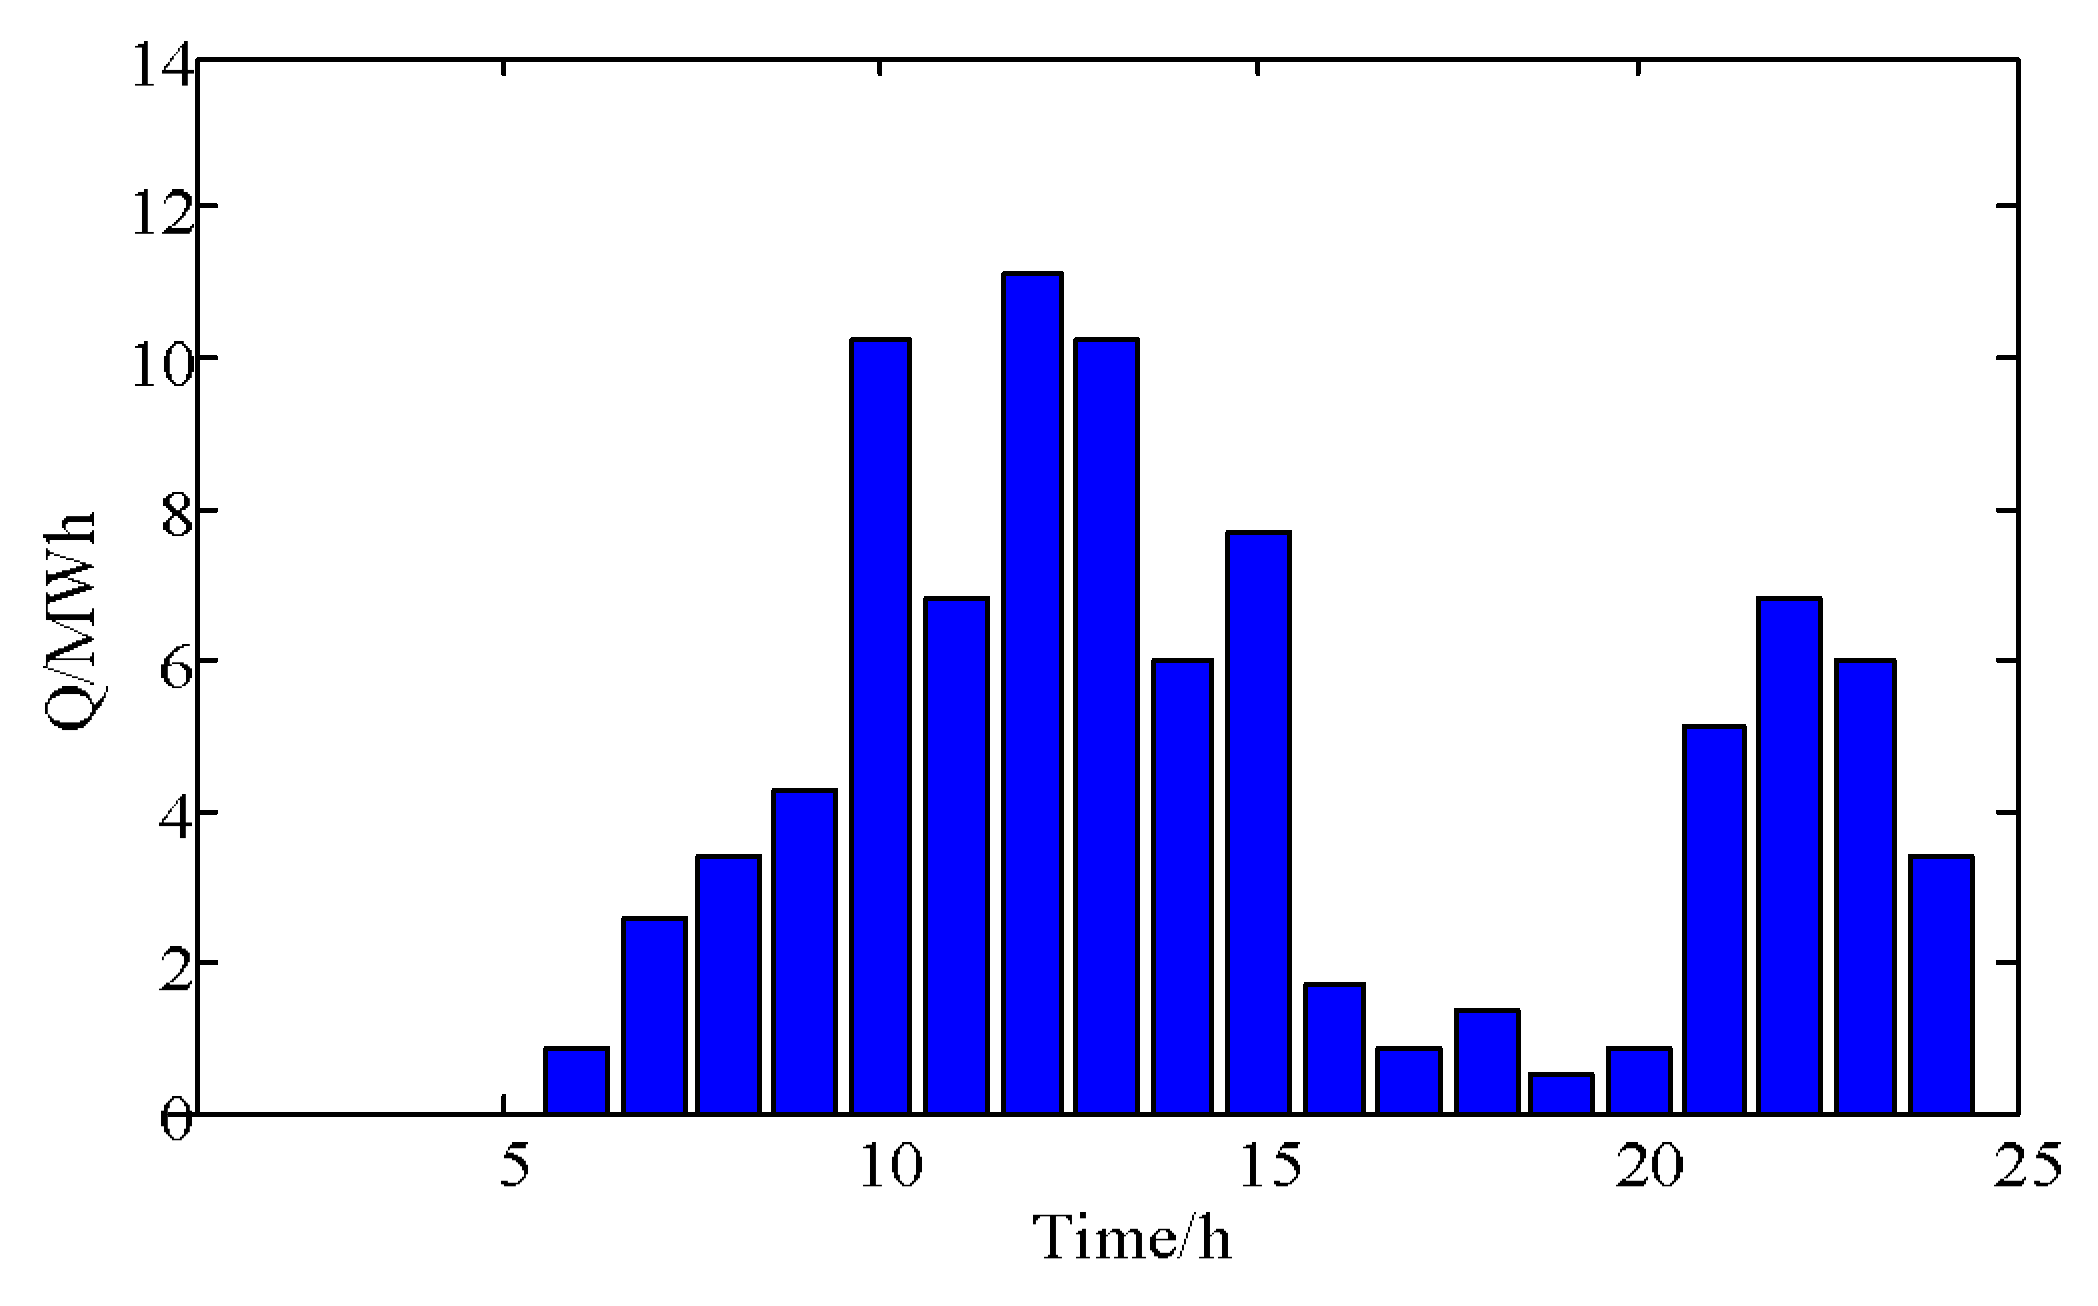
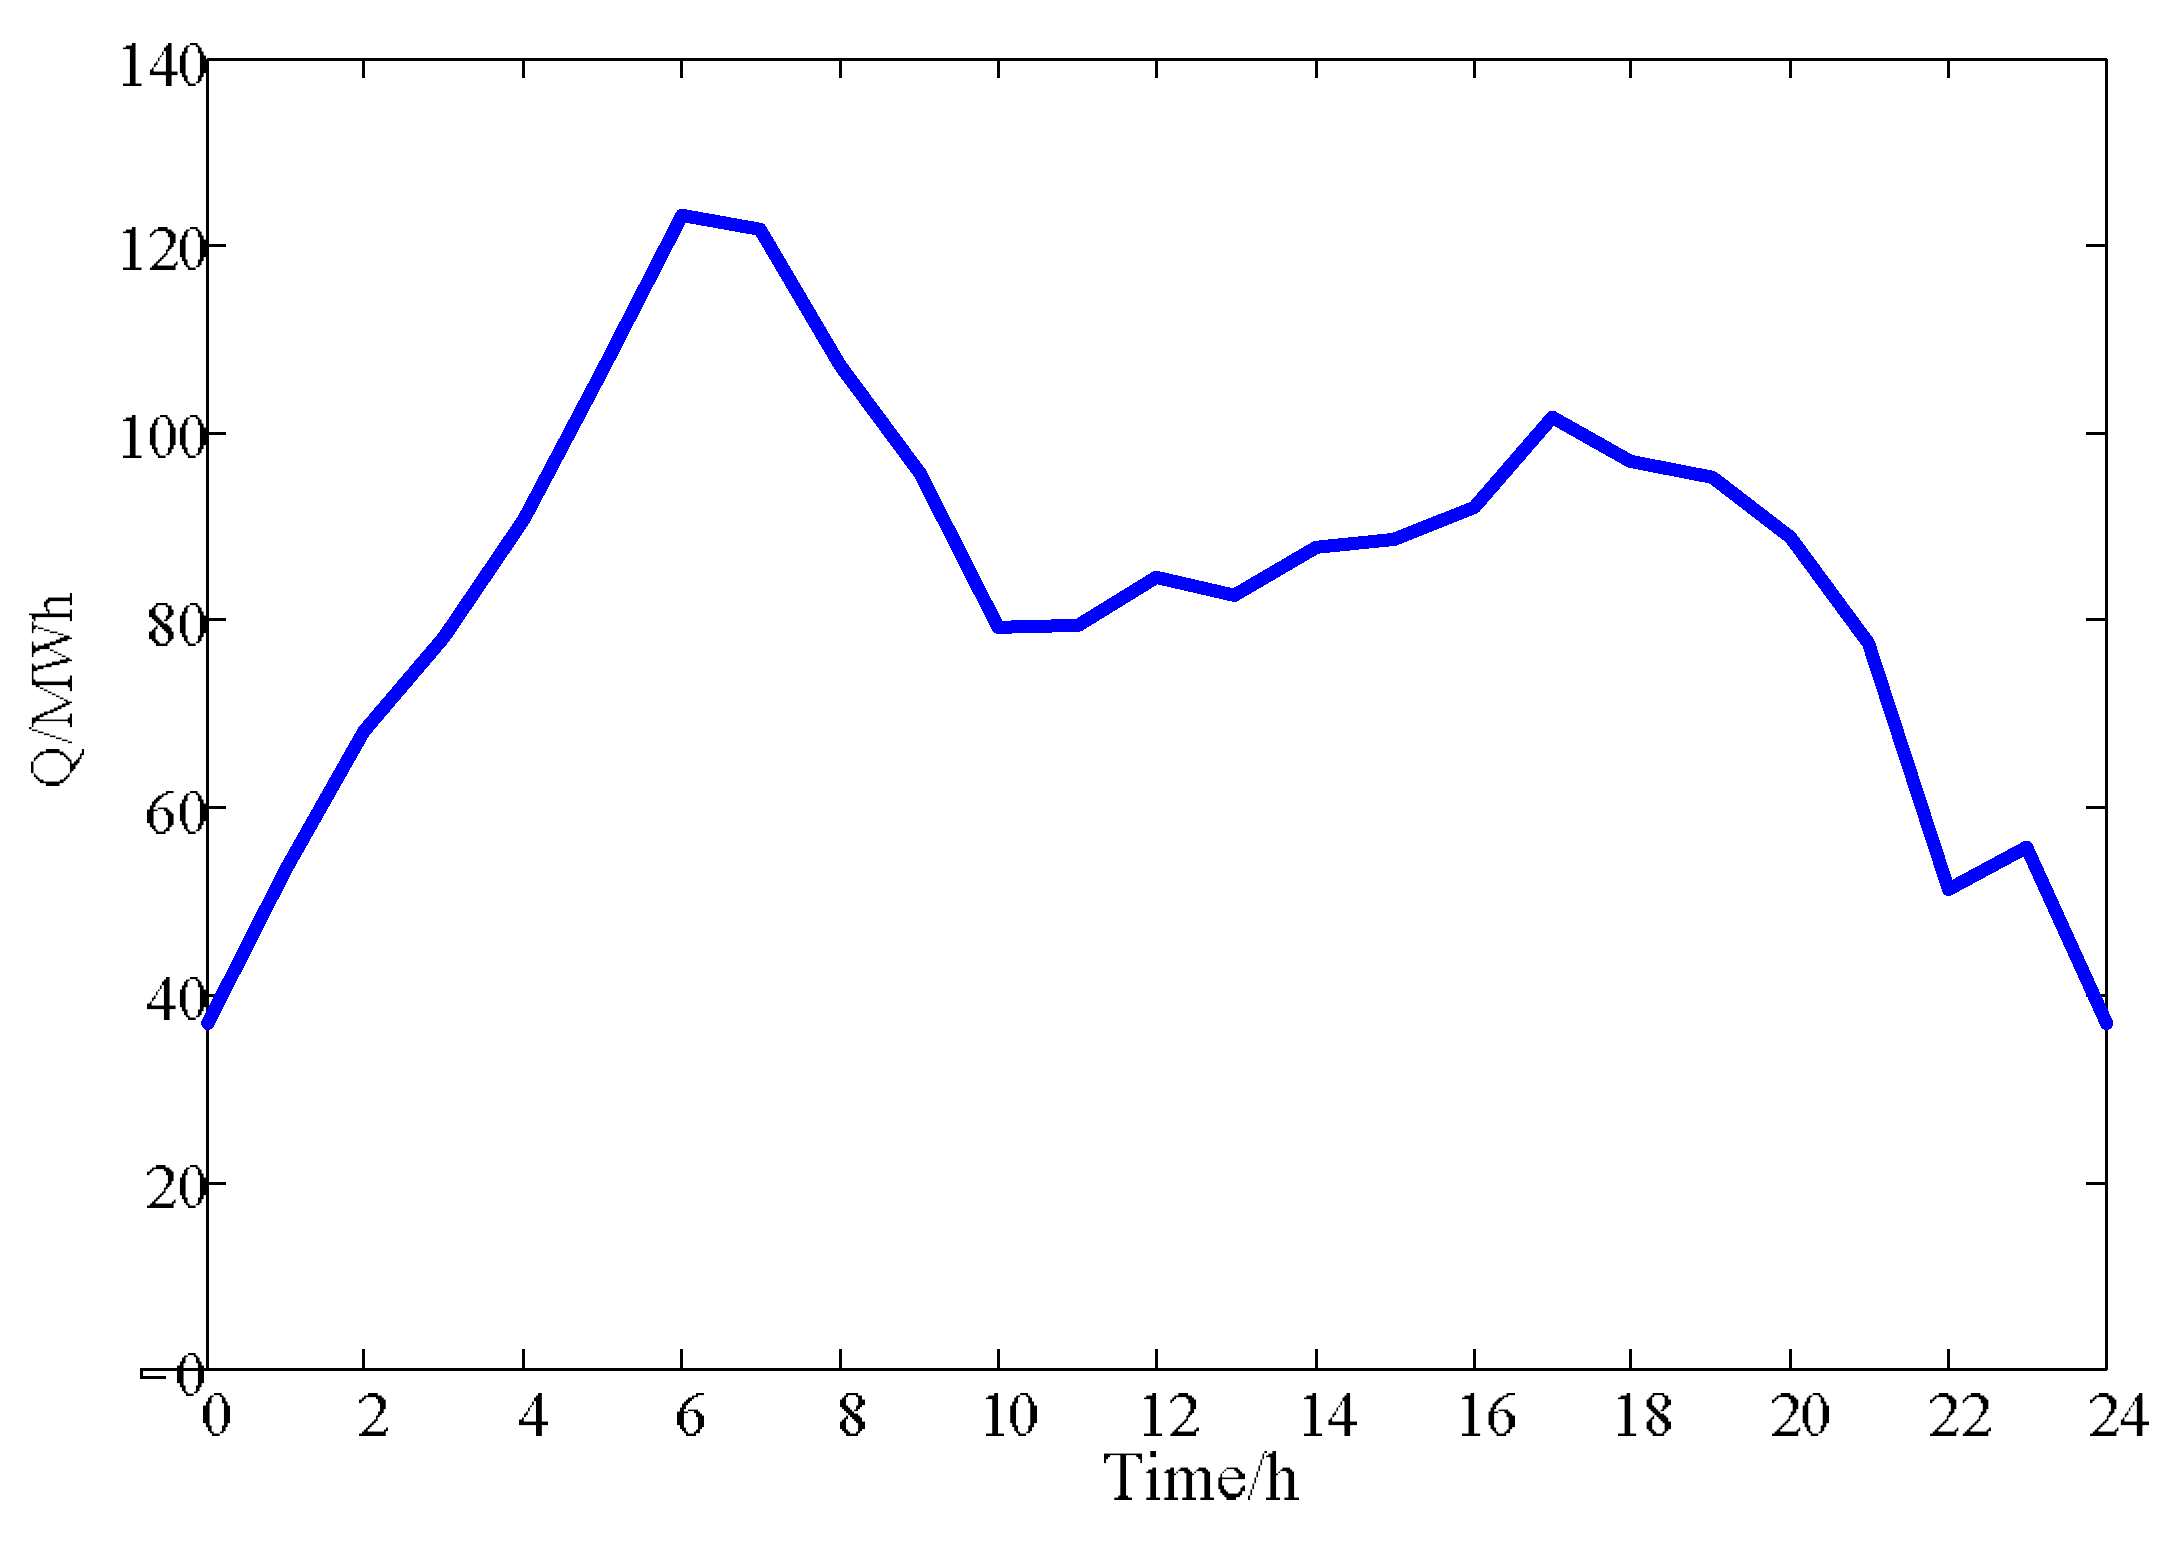
Data of a real CCS in Shandong Province were used for reference to construct the CCS presented in this paper. The actual battery swapping demand on one day was selected as the predicted value of battery swapping demand on a typical day, as presented in Figure 5. The parameter of the CCS is presented in Table 1. The initial energy storage Qini and the minimum energy storage Qmin of the CCS occupied 30% and 10% in the rated capacity of battery system, respectively.
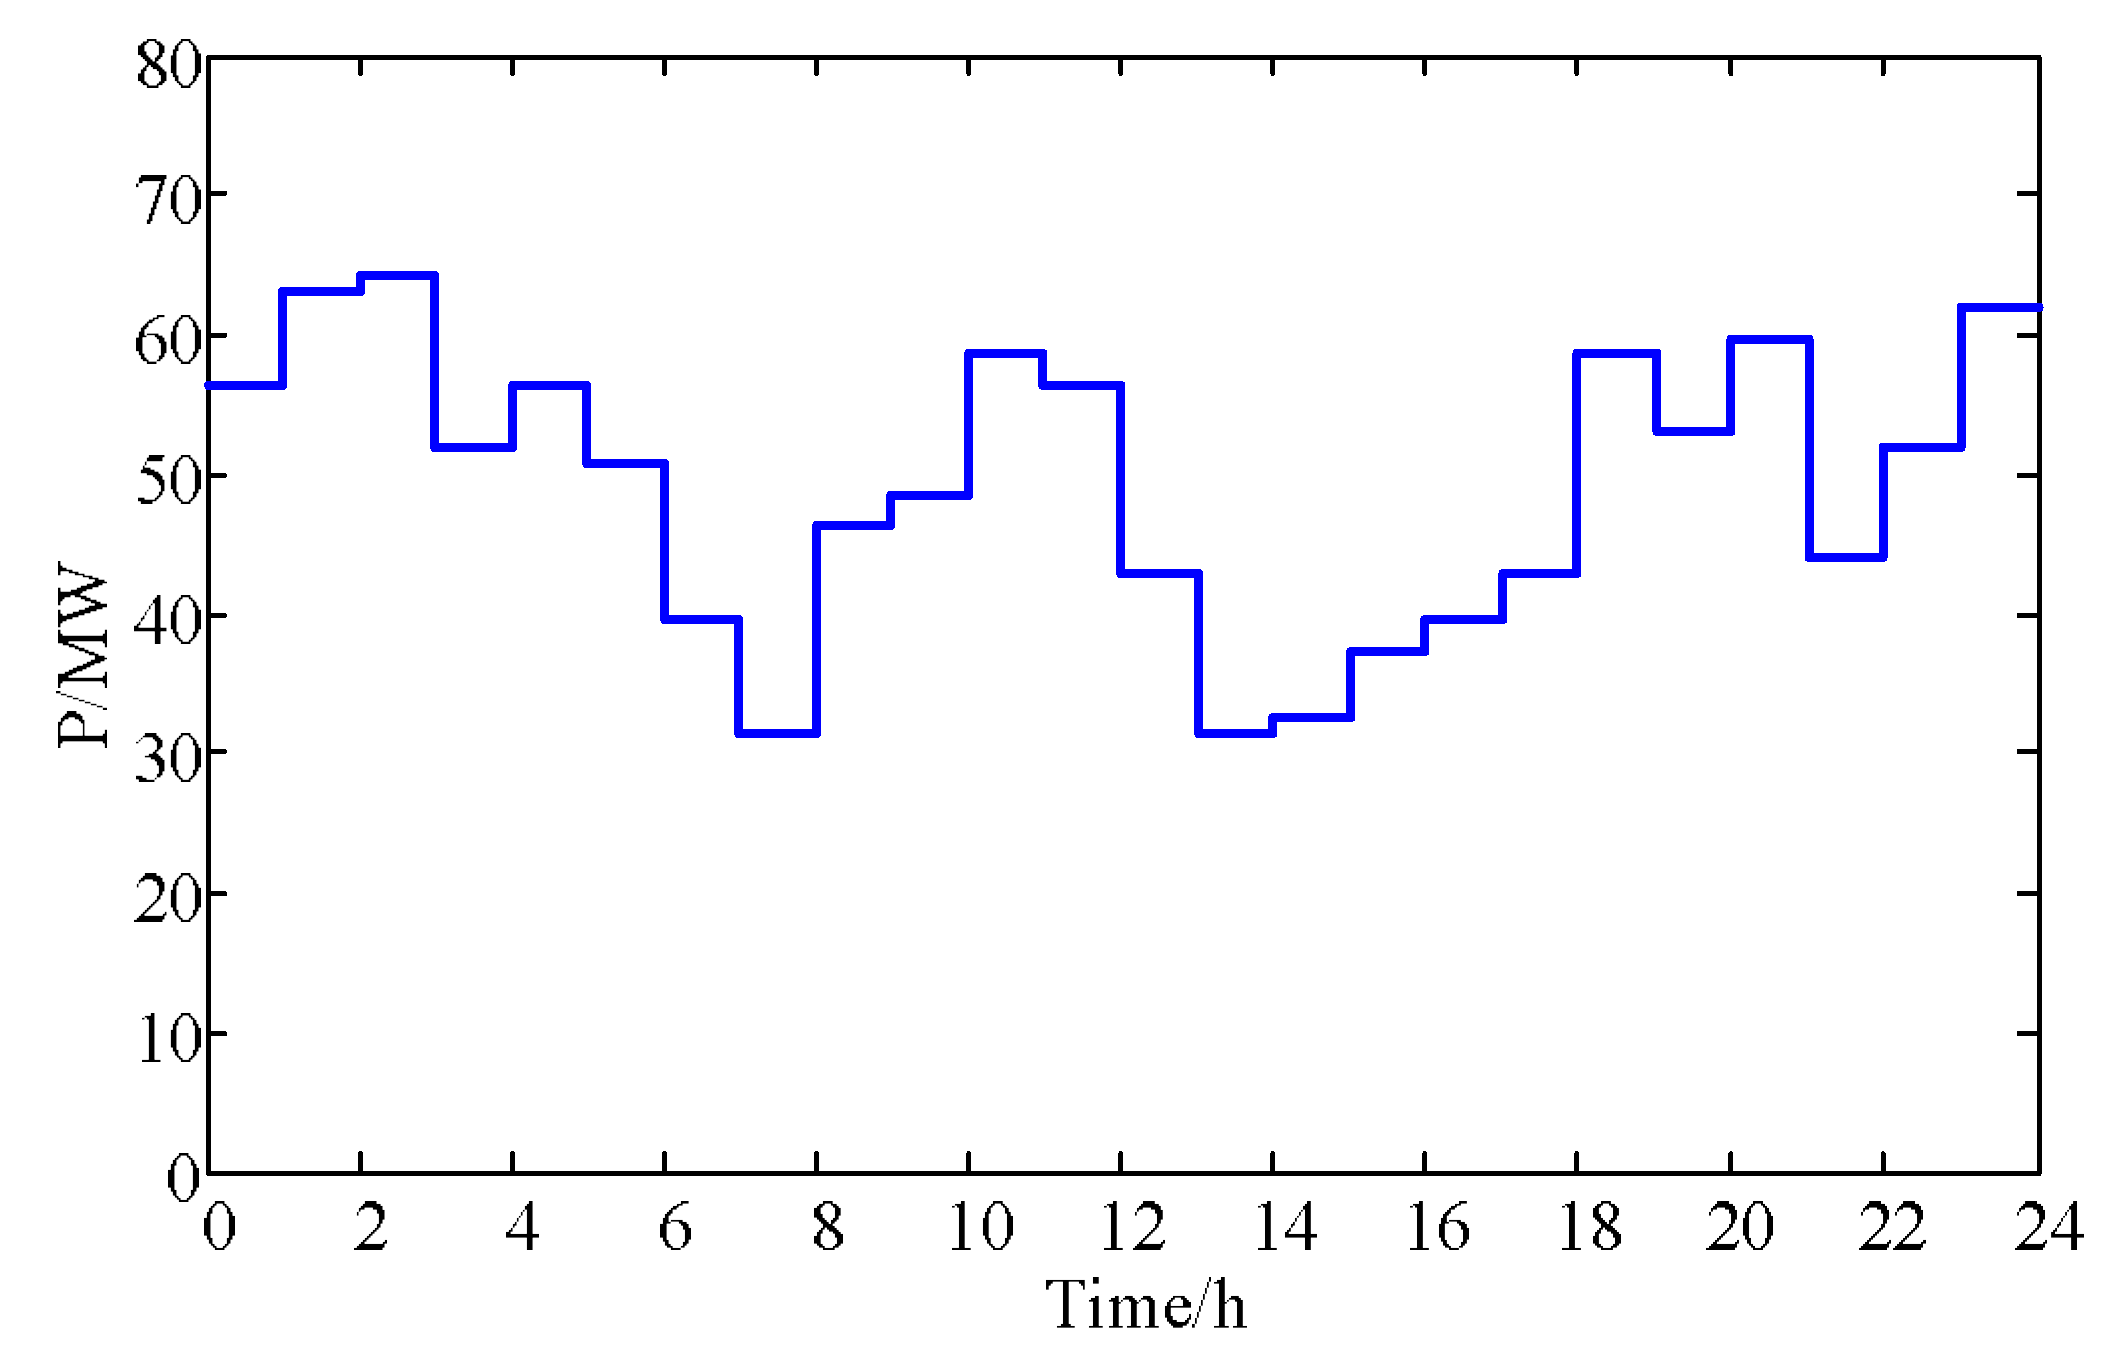
Multiple wind farms could be aggregated into one wind farm in the model. Data of an equivalent wind farm were selected from those of an actual wind farm in Shandong Province. The installed capacity of the wind farm is 99 MW, and predicted values selected for the wind power on a typical day are presented in Figure 6. As assumed, relative predictive errors of wind power and battery swapping demands conform to normal distribution of N(0, 0.12) [11].
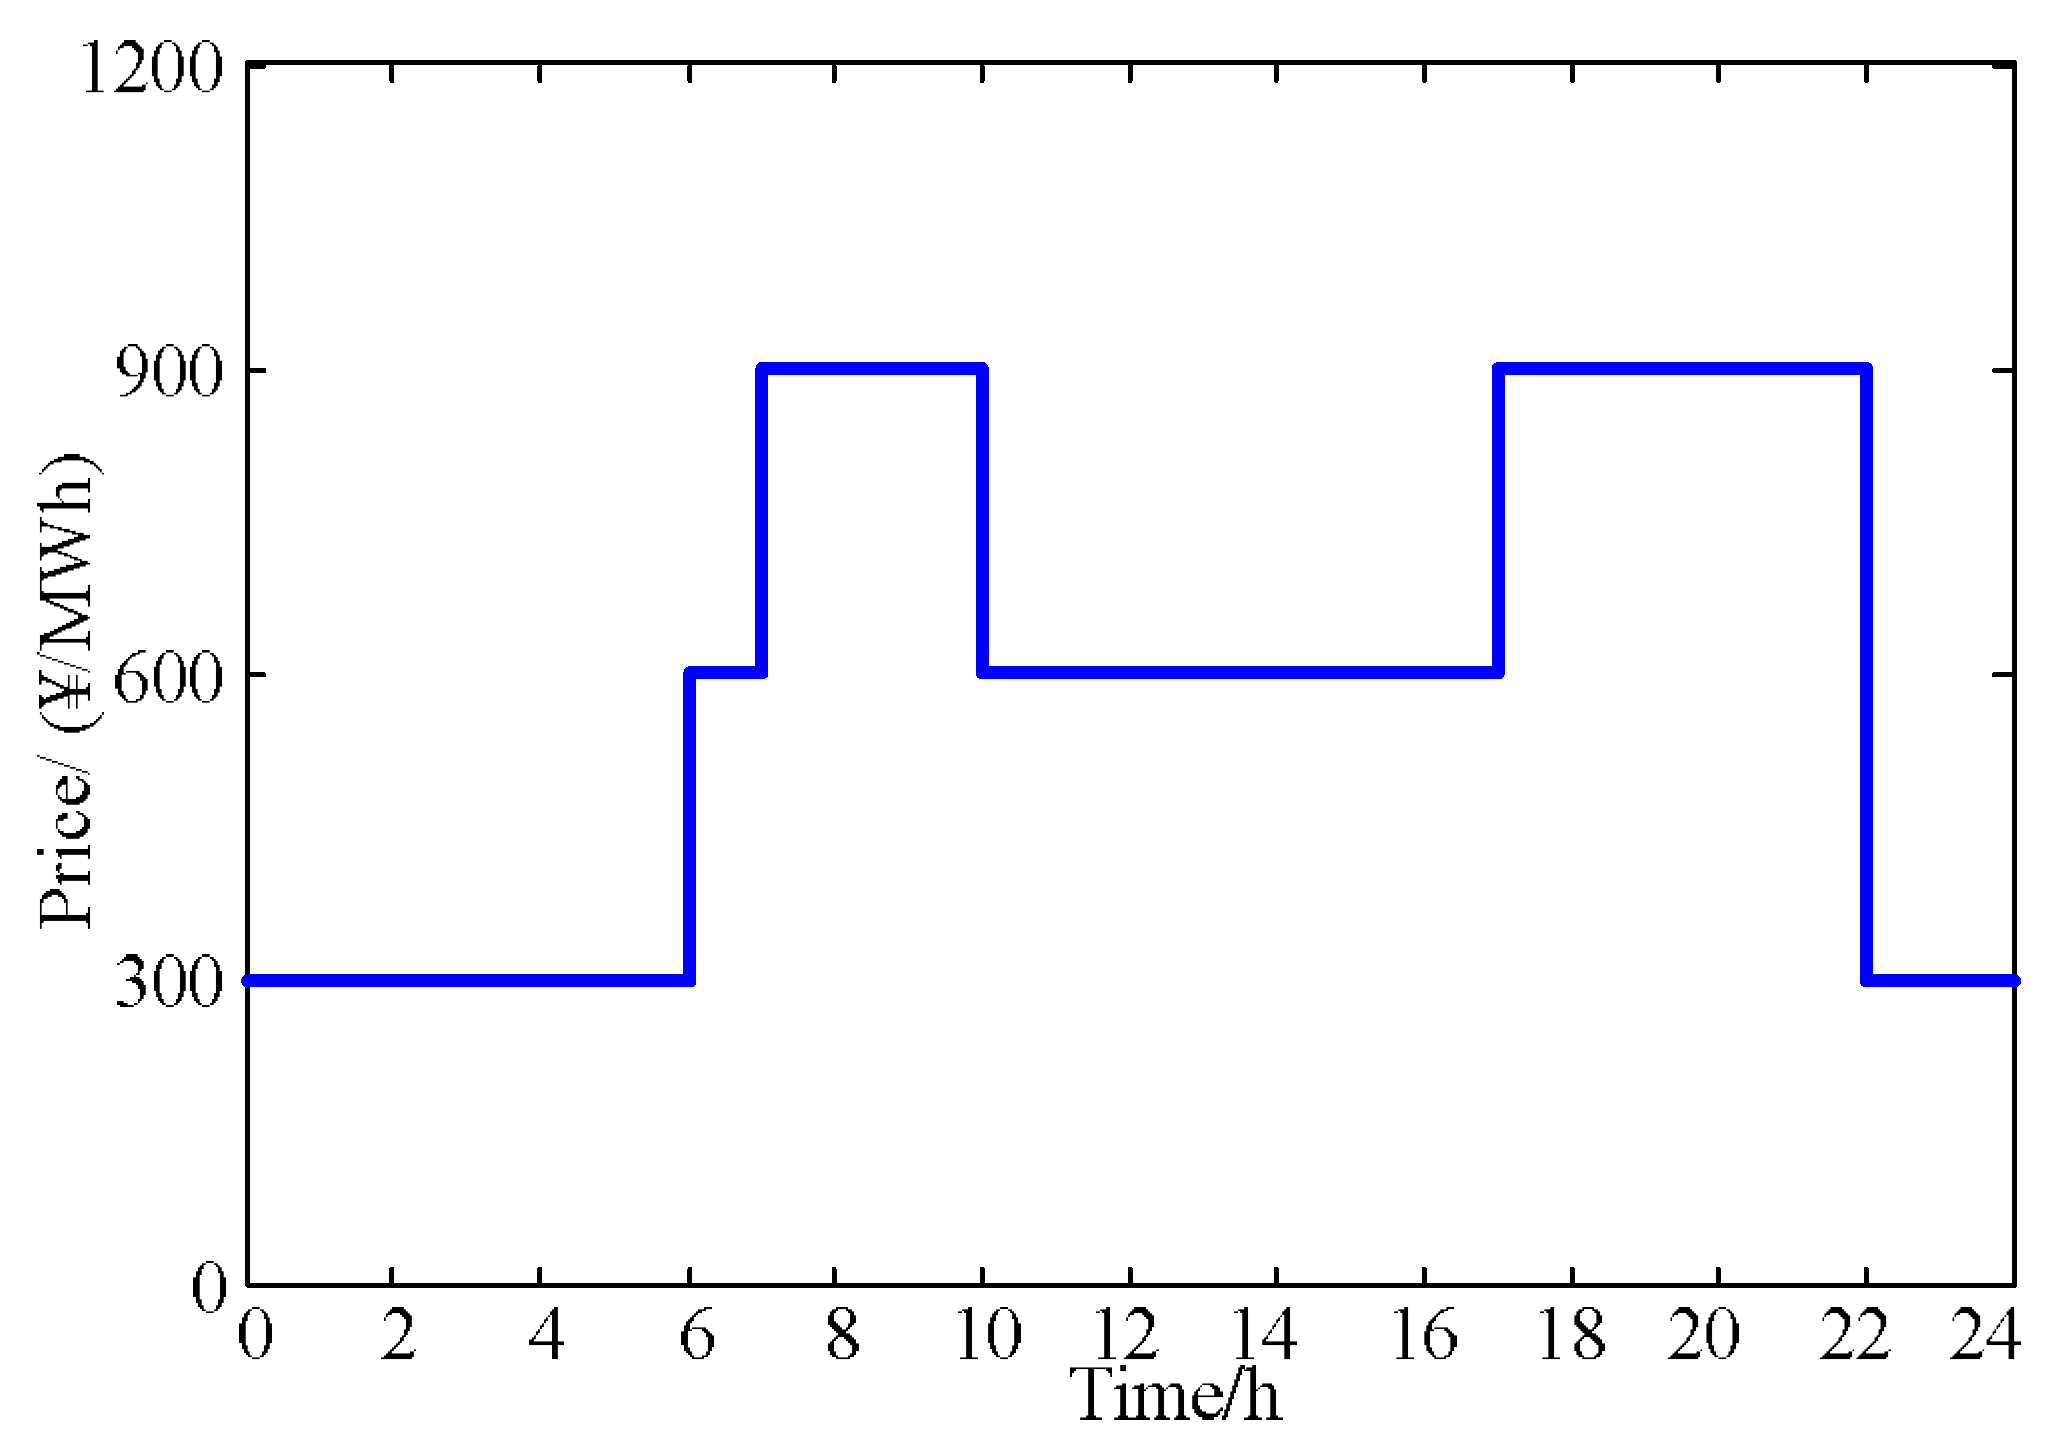
The grid purchase price of wind power is known, and the peak-valley price was adopted as given in Figure 7. The penalty coefficient α for the joint system’s power deviation was defined to be 0.3.
The decision-making cycle consists of 24 time intervals in a typical day. The decision-maker sets the priority order and target values for the realization probabilities of three operating indices according to the importance of these indices, including the decision-maker’s risk tolerance, as shown in Table 2.
4.2. Optimization Result Analysis
Based on the conditions presented above as optimized by the model proposed in this paper, the rated capacity of the battery system was 123 MWh, and the rated power of the PCS was 25 MW. In accordance with optimization results, the realization probability of the first two operating indices reaches the target values of 95%. However, the realization probability of the annualized profit index is only 78%, failing to arrive at the 85% target value. Such phenomena reflect that decision-maker is risk averse. He or she attach different degrees of importance to diverse indices. Being risk averse, high target values are set for the probability of realizing the first two indices described above. In other words, the index of annualized profit is sacrificed for the purpose of ensuring that the first two indices will be satisfied.
● Sensitivity analysis of battery unit price
According to the principle of “charge when low and discharge if high”, the revenue of electricity increases, which in turn incurs the corresponding increase in cost. The cost increase consists of two aspects. First, it involves additional investment and operation and maintenance costs caused by the need for configuration of the redundant battery capacity. Second, the annualized investment cost is increased because of shortened battery life due to battery discharge. The rated capacity optimization results of the battery system at different battery unit prices are presented in Figure 8.
As shown in Figure 8, the cost required by “charge when low and discharge if high” of the CSS is low when the unit price of battery is low. Hence, the CCS is configured with a higher redundant capacity to achieve the excess returns gained by selling electricity according to the price difference between peak and valley electricity levels. The unit price increase of batteries is accompanied by an increase in the initial investment, as well as an increase in the operation and maintenance costs of the joint system. Therefore, the cost required by the “charge when low and discharge if high” approach continues to increase as the unit price increases. In this case, additional returns gained by selling electricity based on a principle of “charge when low and discharge if high” are insufficient to offset the additional costs. Consequently, the discharged energy of the CCS declines continuously, and the extra capacity configured for “charge when low and discharge if high” decreases along with the decline in energy. If the unit price of battery exceeds ¥4 million/MWh, however, then the capacity of such a battery system nearly no longer drops with the rise of such a unit price. This is because the CCS needs the necessary battery capacity to provide a reserve for battery swapping demands and wind power in order to satisfy the first two indices of joint system.
Table 3 presents implementation situations of indices corresponding to different battery unit prices. Table 3 shows that realization probabilities for first two indices reach the target values (95%) prescribed by the decision-maker when the battery unit prices differ. When analyzed in combination with Figure 8, it can be seen that the rated capacity of the battery system does not always decrease with the rise of unit prices to guarantee that first two indices can be realized. In fact, the rated capacity drops to a certain value and no longer changes. This reserves sufficient redundant capacity for battery swapping demands and wind power. However, this leads to a constant reduction in the annualized profit of the joint system, and the realization probability for this index also goes down accordingly. If the unit price of the battery increases beyond ¥3 million/MWh, then it becomes impossible for the annualized profit of the joint system to reach its target value (¥219 million), indicating that the probability of realizing the index of annualized profit reduces to 0.
● Sensitivity analysis of PCS unit price
The rated power of the PCS and the annualized profit of the joint system were obtained through optimization and are given in Table 4 under conditions of different PCS unit prices. The rise of the PCS unit price results in the decrease of its rated power. Nevertheless, when the unit price of the PCS exceeds ¥2 million/MW, the rated power reduces to 20.2 MW, after which it no longer declines. This illustrates that, in order to satisfy the first two indices of the joint system, the economic efficiency of the system should be abandoned to provide reserve energy for battery swapping demands and wind power. This should be accomplished by configuring the necessary rated power of the PCS. Moreover, with the increase in the unit price of the PCS, both the probability for annualized profit of the joint system to be satisfied and the expected value of annualized profit drop accordingly.
● Sensitivity analysis of wind power price
The grid purchase price of wind power affects the capacity optimization by exerting its influence on the electricity-selling revenue of the joint system. To analyze the influence of peak and off-peak wind power price differences on joint system capacity optimization, wind power price in the peak hours was altered (¥300/MWh), while the prices of wind power in the valley and average hours remained unchanged (¥600/MWh). Relevant results are presented in Table 5.
Clearly, as the wind power price rises in the peak hours, the peak and off-peak wind power price difference goes up so that the CCS can acquire higher returns from selling electricity based on the principle of “charge when low and discharge if high”. The result is that the discharged energy of the CCS keeps increasing, and correspondingly, more standby batteries are configured in the joint system with the increase in the PCS’s rated power.
● Analysis of generation schedule optimization results
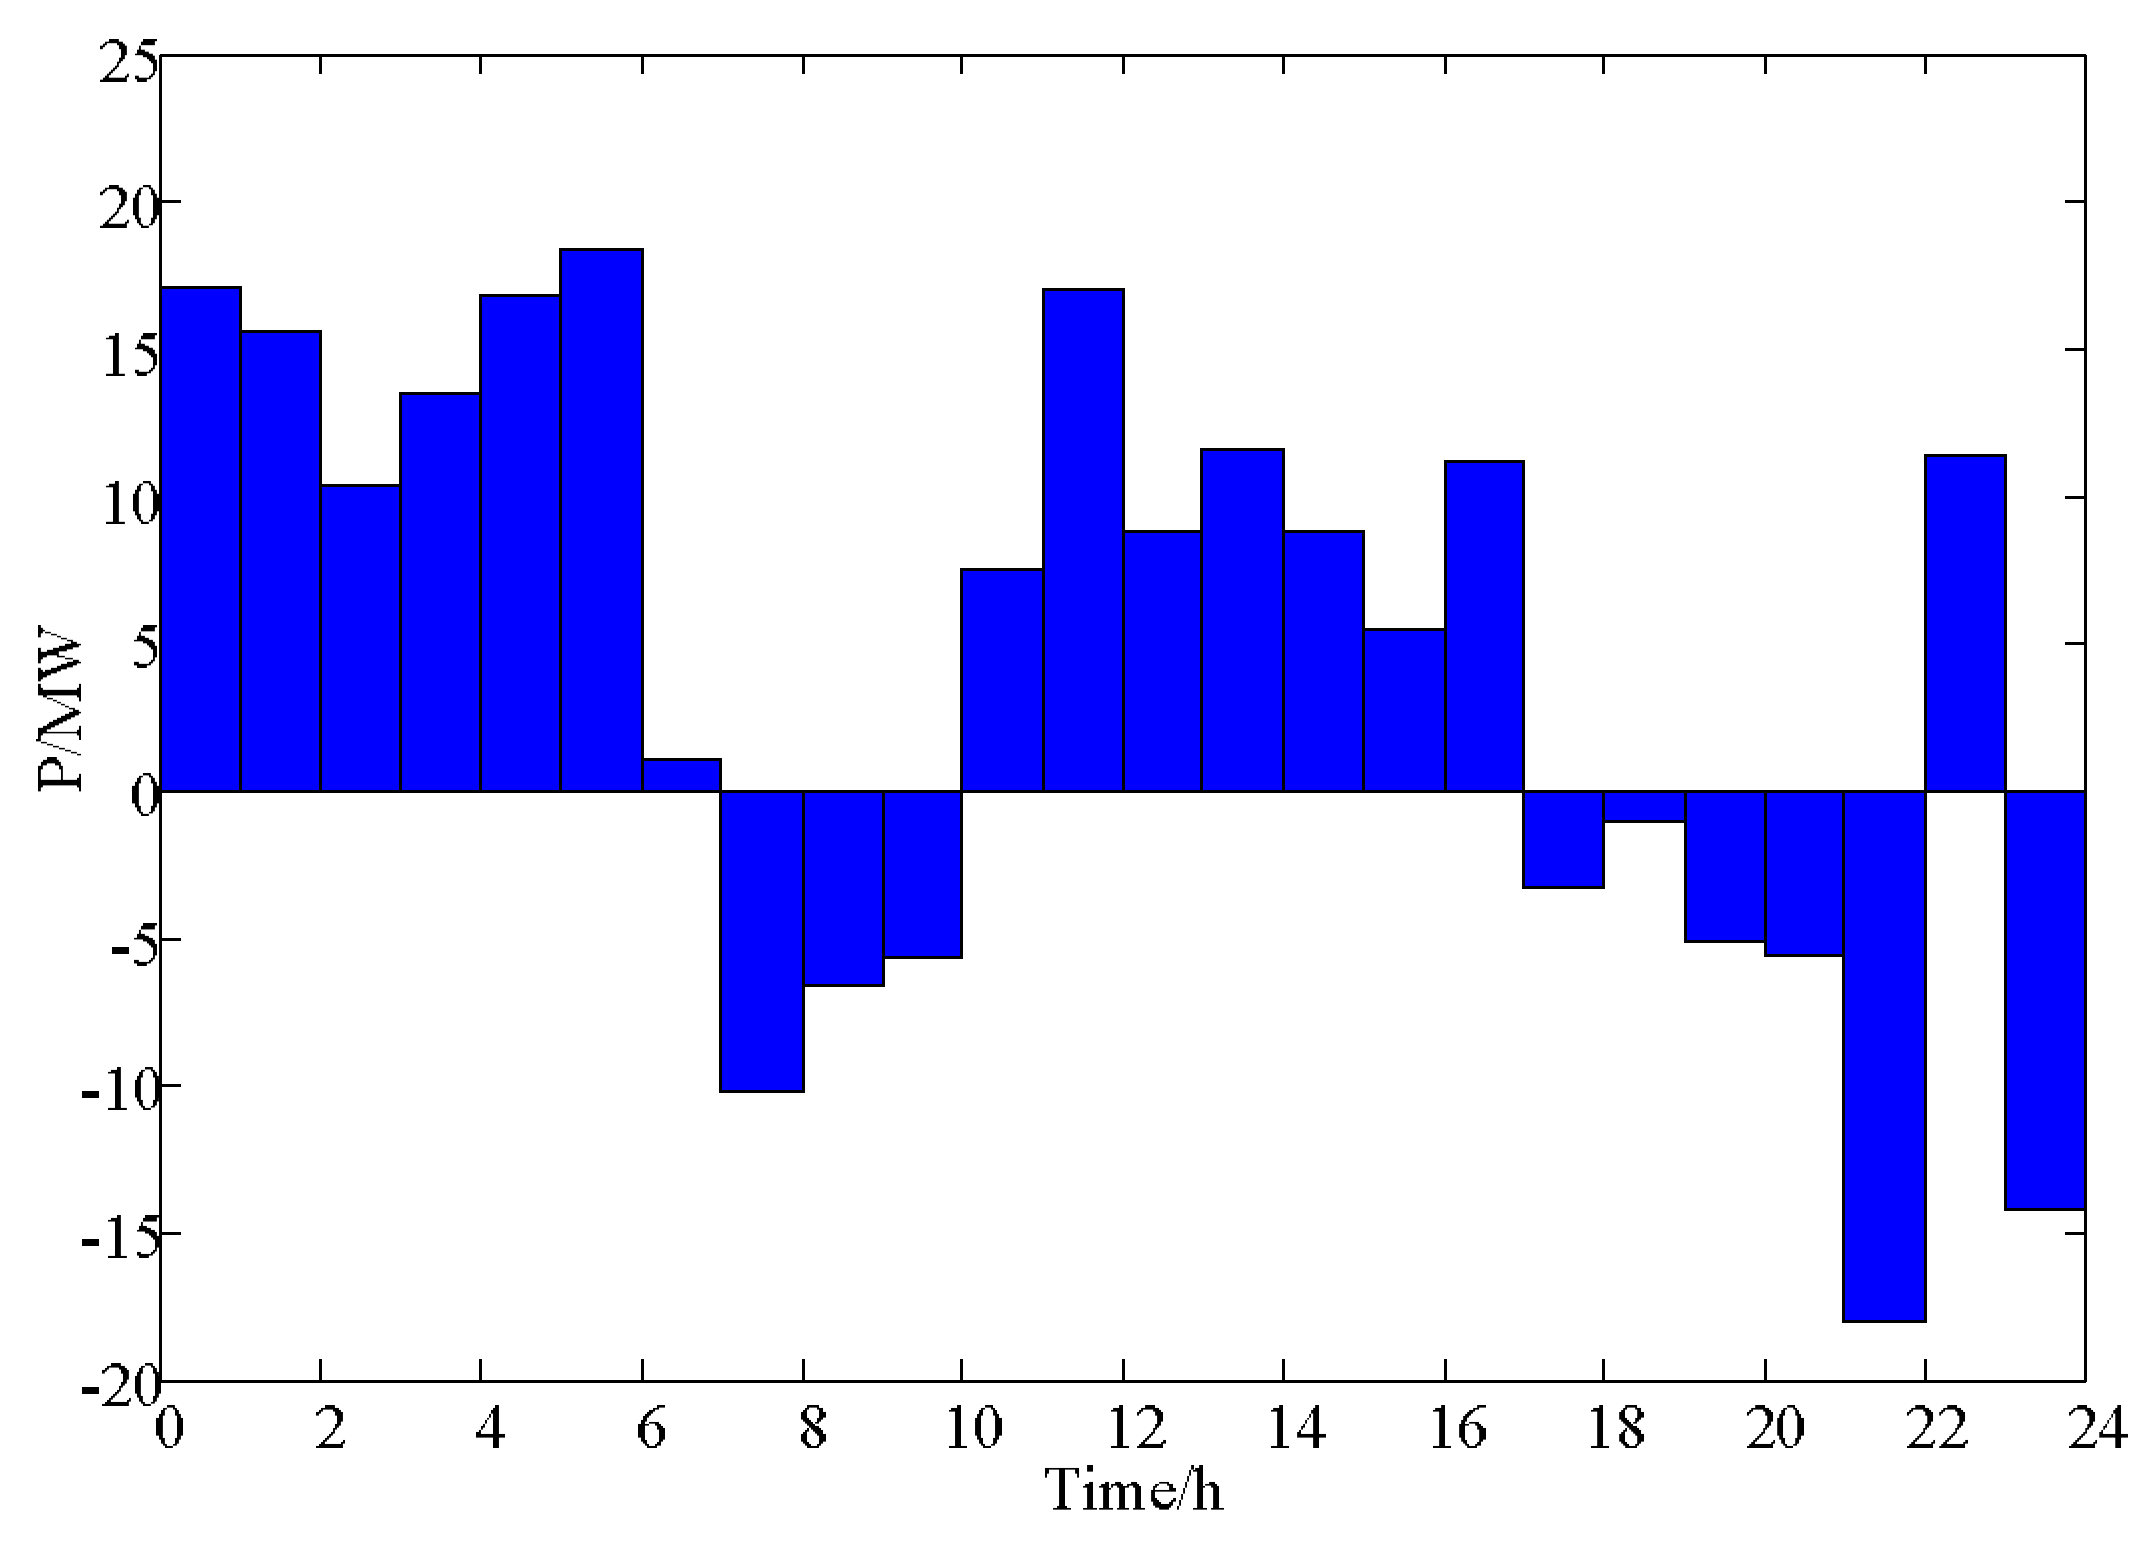
Not only can the rated capacity of the battery system and the rated power of the PCS be optimized by the optimal capacity planning model proposed here, but the model could also obtain generation scheduling of the joint system and could schedule the charge/discharge power of the CCS simultaneously, as shown in Figure 9 and Figure 10.
Figure 9 clearly indicates that the CCS implements charge at a high power level during wind power price valley periods as seen in time intervals 0–6. This serves to prepare for upcoming battery swapping demands and to store wind power. In periods of wind power price peaks as seen in time frames 18–22, the CCS releases the wind power that was previously reserved, using the price difference between the peak and valley of electricity to improve the electricity selling revenue of the joint system. During time interval 11–17, the wind power price is at an intermediate level, and the charge power of CCS is lower than that in valley price periods. This serves to meet battery swapping demands.
The charge/discharge power of the CCS has been closely correlated to the grid purchase price of wind power. Figure 10 illustrates that the CCS discharges, and the joint system output power is higher than the predicted wind power when the wind power price is high. By contrast, if the price is low, then the CCS goes into the mode to charge, and the output power of joint system becomes lower than the predicted wind power. On this basis, the grid purchase price can be rationally set, directing the joint system to generate more power during peak load hours but less power during the load valley. In this way, the joint system pursues self-interest and brings down the load-shifting pressure of the power grid. Meanwhile, the collaborative unification of joint system and power grid dispatching is realized. Additionally, the fact that the output power of the joint system in all time intervals is above 0 indicates that the CCS could meet battery swapping demands without purchasing energy from power grid, which makes zero emission of EVs a reality.
Energy storage in the CCS is plotted over one day in Figure 11. In all time intervals, the residual energy of the CCS is far above its minimum value allowable (12.3 MWh), signifying that the decision-maker gives priority to the index of battery swapping demand curtailment. To prevent unfulfilled battery swapping demands, the CCS must reserve sufficient back-up energy to meet battery swapping demands. Reserve for the wind power should be provided to accommodate both capacity and power. Figure 11 illustrates that energy storage of the CCS is lower than the rated capacity of the battery system, with an aim to avoid wind curtailment and provide standby capacity for wind power. Furthermore, as shown in Figure 9, it has been found that the charge/discharge power of the CCS is always below the rated power of the PCS because standby power should be provided to prediction errors of wind power. This would help prevent random fluctuations of wind power that cause the joint system’s actual output to deviate from its generation schedule. Consequently, the associated economic penalties are lowered.
5. Conclusions
To achieve cooperation between the CCS and the wind farm, a joint operation pattern was proposed, and the capacity optimization issues of the CCS were subjected to the pattern. Relevant simulation analysis results demonstrate that the following:
- (1)
- Joint operation of the CCS and the wind farm generates a benefit in coordination. On one hand, the CCS provides a standby capacity for the wind farm to improve controllability of wind power and to reduce economic penalties incurred by joint system power deviation. On the other hand, the CCS takes advantage of the wind power to charge batteries so that zero emission of EVs can be realized.
- (2)
- The joint system responds to the grid purchase price of wind power to further improve its electricity selling revenue. The capacity optimization model proposed in this paper comprehensively accounts for investment cost, wind power price, battery life, and other factors, and then the system weighs whether a principle of “charge when low and discharge if high” can be adopted so that the CCS will earn profits. On this basis, the optimal capacity of the CCS is determined, along with the optimal generation schedule of the joint system.
- (3)
- The generation schedule of the joint system is closely related to wind power price. The grid purchase price of the wind power should be rationally specified to effectively direct the output power of the joint system and to determine a win-win strategy between the power grid and the proposed joint system.
To further improve the model proposed in this paper, the logistic distribution constraints of batteries and the uncertainties of the wind power price should be two research objectives worth investigating in the future.
Author Contributions
Zhe Jiang completed major research tasks and wrote the paper. Xueshan Han directed the research. Zhimin Li and Guodong Liu put forward some important suggestions. Mingqiang Wang, Wenbo Li, Mengxia Wang and Thomas B. Ollis participated in the revision work.
Acknowledgments
This paper is supported by the National Natural Science Foundation of China (51477091, 51407111, 51407106).
Conflicts of Interest
The authors declare no conflict of interest.
References
- Basit, A.; Hansen, A.D.; Sørensen, P.E.; Giannopoulos, G. Real-time impact of power balancing on power system operation with large scale integration of wind power. J. Mod. Power Syst. Clean Energy 2017, 5, 202–210. [Google Scholar] [CrossRef]
- Le, H.T.; Santoso, S.; Nguyen, T.Q. Augmenting Wind Power Penetration and Grid Voltage Stability Limits Using ESS: Application Design, Sizing, and a Case Study. IEEE Trans. Power Syst. 2015, 27, 161–171. [Google Scholar] [CrossRef]
- Liu, G.; Tomsovic, K. Quantifying spinning reserve in systems with significant wind power penetration. IEEE Trans. Power Syst. 2012, 27, 2385–2393. [Google Scholar] [CrossRef]
- Smith, J.C.; Milligan, M.R.; Demeo, E.A.; Parsons, B. Utility Wind Integration and Operating Impact State of the Art. IEEE Trans. Power Syst. 2007, 22, 900–908. [Google Scholar] [CrossRef]
- Kim, C.; Muljadi, E.; Chung, C.C.; Sciubba, E. Coordinated Control of Wind Turbine and Energy Storage System for Reducing Wind Power Fluctuation. Energies 2017, 11, 52. [Google Scholar] [CrossRef]
- Wang, P.; Gao, Z.; Bertling, L. Operational Adequacy Studies of Power Systems with Wind Farms and Energy Storages. IEEE Trans. Power Syst. 2012, 27, 2377–2384. [Google Scholar] [CrossRef]
- Qin, M.; Chan, K.W.; Chi, Y.C.; Wu, T. Optimal planning and operation of energy storage systems in radial networks for wind power integration with reserve support. IET Gener. Transm. Distrib. 2016, 10, 2019–2025. [Google Scholar] [CrossRef]
- Zhao, J.; Wen, F.; Dong, Z.; Wong, K.P. Optimal Dispatch of Electric Vehicles and Wind Power Using Enhanced Particle Swarm Optimization. IEEE Trans. Ind. Inform. 2012, 8, 889–899. [Google Scholar] [CrossRef]
- Khodayar, M.E.; Wu, L.; Shahidehpour, M. Hourly Coordination of Electric Vehicle Operation and Volatile Wind Power Generation in SCUC. IEEE Trans. Smart Grid 2012, 3, 1271–1279. [Google Scholar] [CrossRef]
- Shao, C.; Wang, X.; Wang, X.; Du, C.; Dang, C.; Liu, S. Cooperative Dispatch of Wind Generation and Electric Vehicles with Battery Storage Capacity Constraints in SCUC. IEEE Trans. Smart Grid 2014, 5, 2219–2226. [Google Scholar] [CrossRef]
- Jiang, Z.; Han, X.; Li, Z.; Li, W.; Wang, M.; Wang, M. Two-Stage Multi-Objective Collaborative Scheduling for Wind Farm and Battery Switch Station. Energies 2016, 9, 886. [Google Scholar] [CrossRef]
- Luo, Z.; Hu, Z.; Song, Y.; Xu, Z.; Jia, L. Study on charging load modeling and coordinated charging of electric vehicles under battery swapping modes. Proc. CSEE 2012, 32, 1–10. [Google Scholar]
- Hübner, M.; Zhao, L.; Mirbach, T.; Haubrich, H.J.; Moser, A. Impact of large-scale electric vehicle application on the power supply. In Proceedings of the 2009 IEEE Electrical Power & Energy Conference (EPEC), Montreal, QC, Canada, 22–23 October 2009; pp. 1–6. [Google Scholar]
- Doucette, R.T.; McCulloch, M.D. Modeling the CO2 emissions from battery electric vehicles given the power generation mixes of different countries. Energy Policy 2011, 39, 803–811. [Google Scholar] [CrossRef]
- Chen, L.; Hao, Z.; Feng, N.I.; Zhu, J. Present situation and development trend for construction of electric vehicle energy supply infrastructure. Autom. Electr. Power Syst. 2011, 35, 11–17. [Google Scholar]
- Gao, C.; Zhang, L.; Xue, F.; Liu, H. Grid Planning Considering Capacity and Site of Large-scale Centralized Charging Stations. Proc. CSEE 2012, 32, 40–46. [Google Scholar]
- Pan, Z.J.; Zhang, Y. A novel centralized charging station planning strategy considering urban power network structure strength. Electr. Power Syst. Res. 2016, 136, 100–109. [Google Scholar] [CrossRef]
- Suo, L.; Tang, W.; Bai, M.; Zhang, L. Locating and sizing of centralized charging stations in distribution network considering load shifting. Proc. CSEE 2014, 34, 1052–1060. [Google Scholar]
- Suo, L.; Xiang, C.; Tang, W.; Liu, Z.; Zhao, H. Multi-objective Bi-level Programming of Centralized Charging Station Considering Benefits Balance for Different Subjects. Autom. Electr. Power Syst. 2016, 40, 100–107. [Google Scholar]
- Xu, F.; Tan, Y.; Yang, H.; Yin, Q. Optimal Planning of Centralized Charging Stations Considering Benefits for Different Roles. High Volt. Eng. 2017, 43, 1256–1262. [Google Scholar]
- Liu, W.; Zhao, T.; Wei, Q.; Zhang, J. Operation optimization of centralized battery swap charging system based on closed-loop supply chain. Proc. CSEE 2014, 34, 3732–3742. [Google Scholar]
- Liu, B. Dependent-chance programming: A class of stochastic optimization. Comput. Math. Appl. 1997, 34, 89–104. [Google Scholar] [CrossRef]
- Ding, H.; Hu, Z.; Song, Y. Stochastic optimization of the daily operation of wind farm and pumped-hydro-storage plant. Renew. Energy 2012, 48, 571–578. [Google Scholar] [CrossRef]
- Tian, L.; Shi, S.; Jia, Z. A Statistical Model for Charging Power Demand of Electric Vehicles. Power Syst. Technol. 2010, 34, 126–130. [Google Scholar]
Figure 1.
Operational structure of the centralized charging and unified distribution pattern.

Figure 2.
Structure diagram of the joint system.
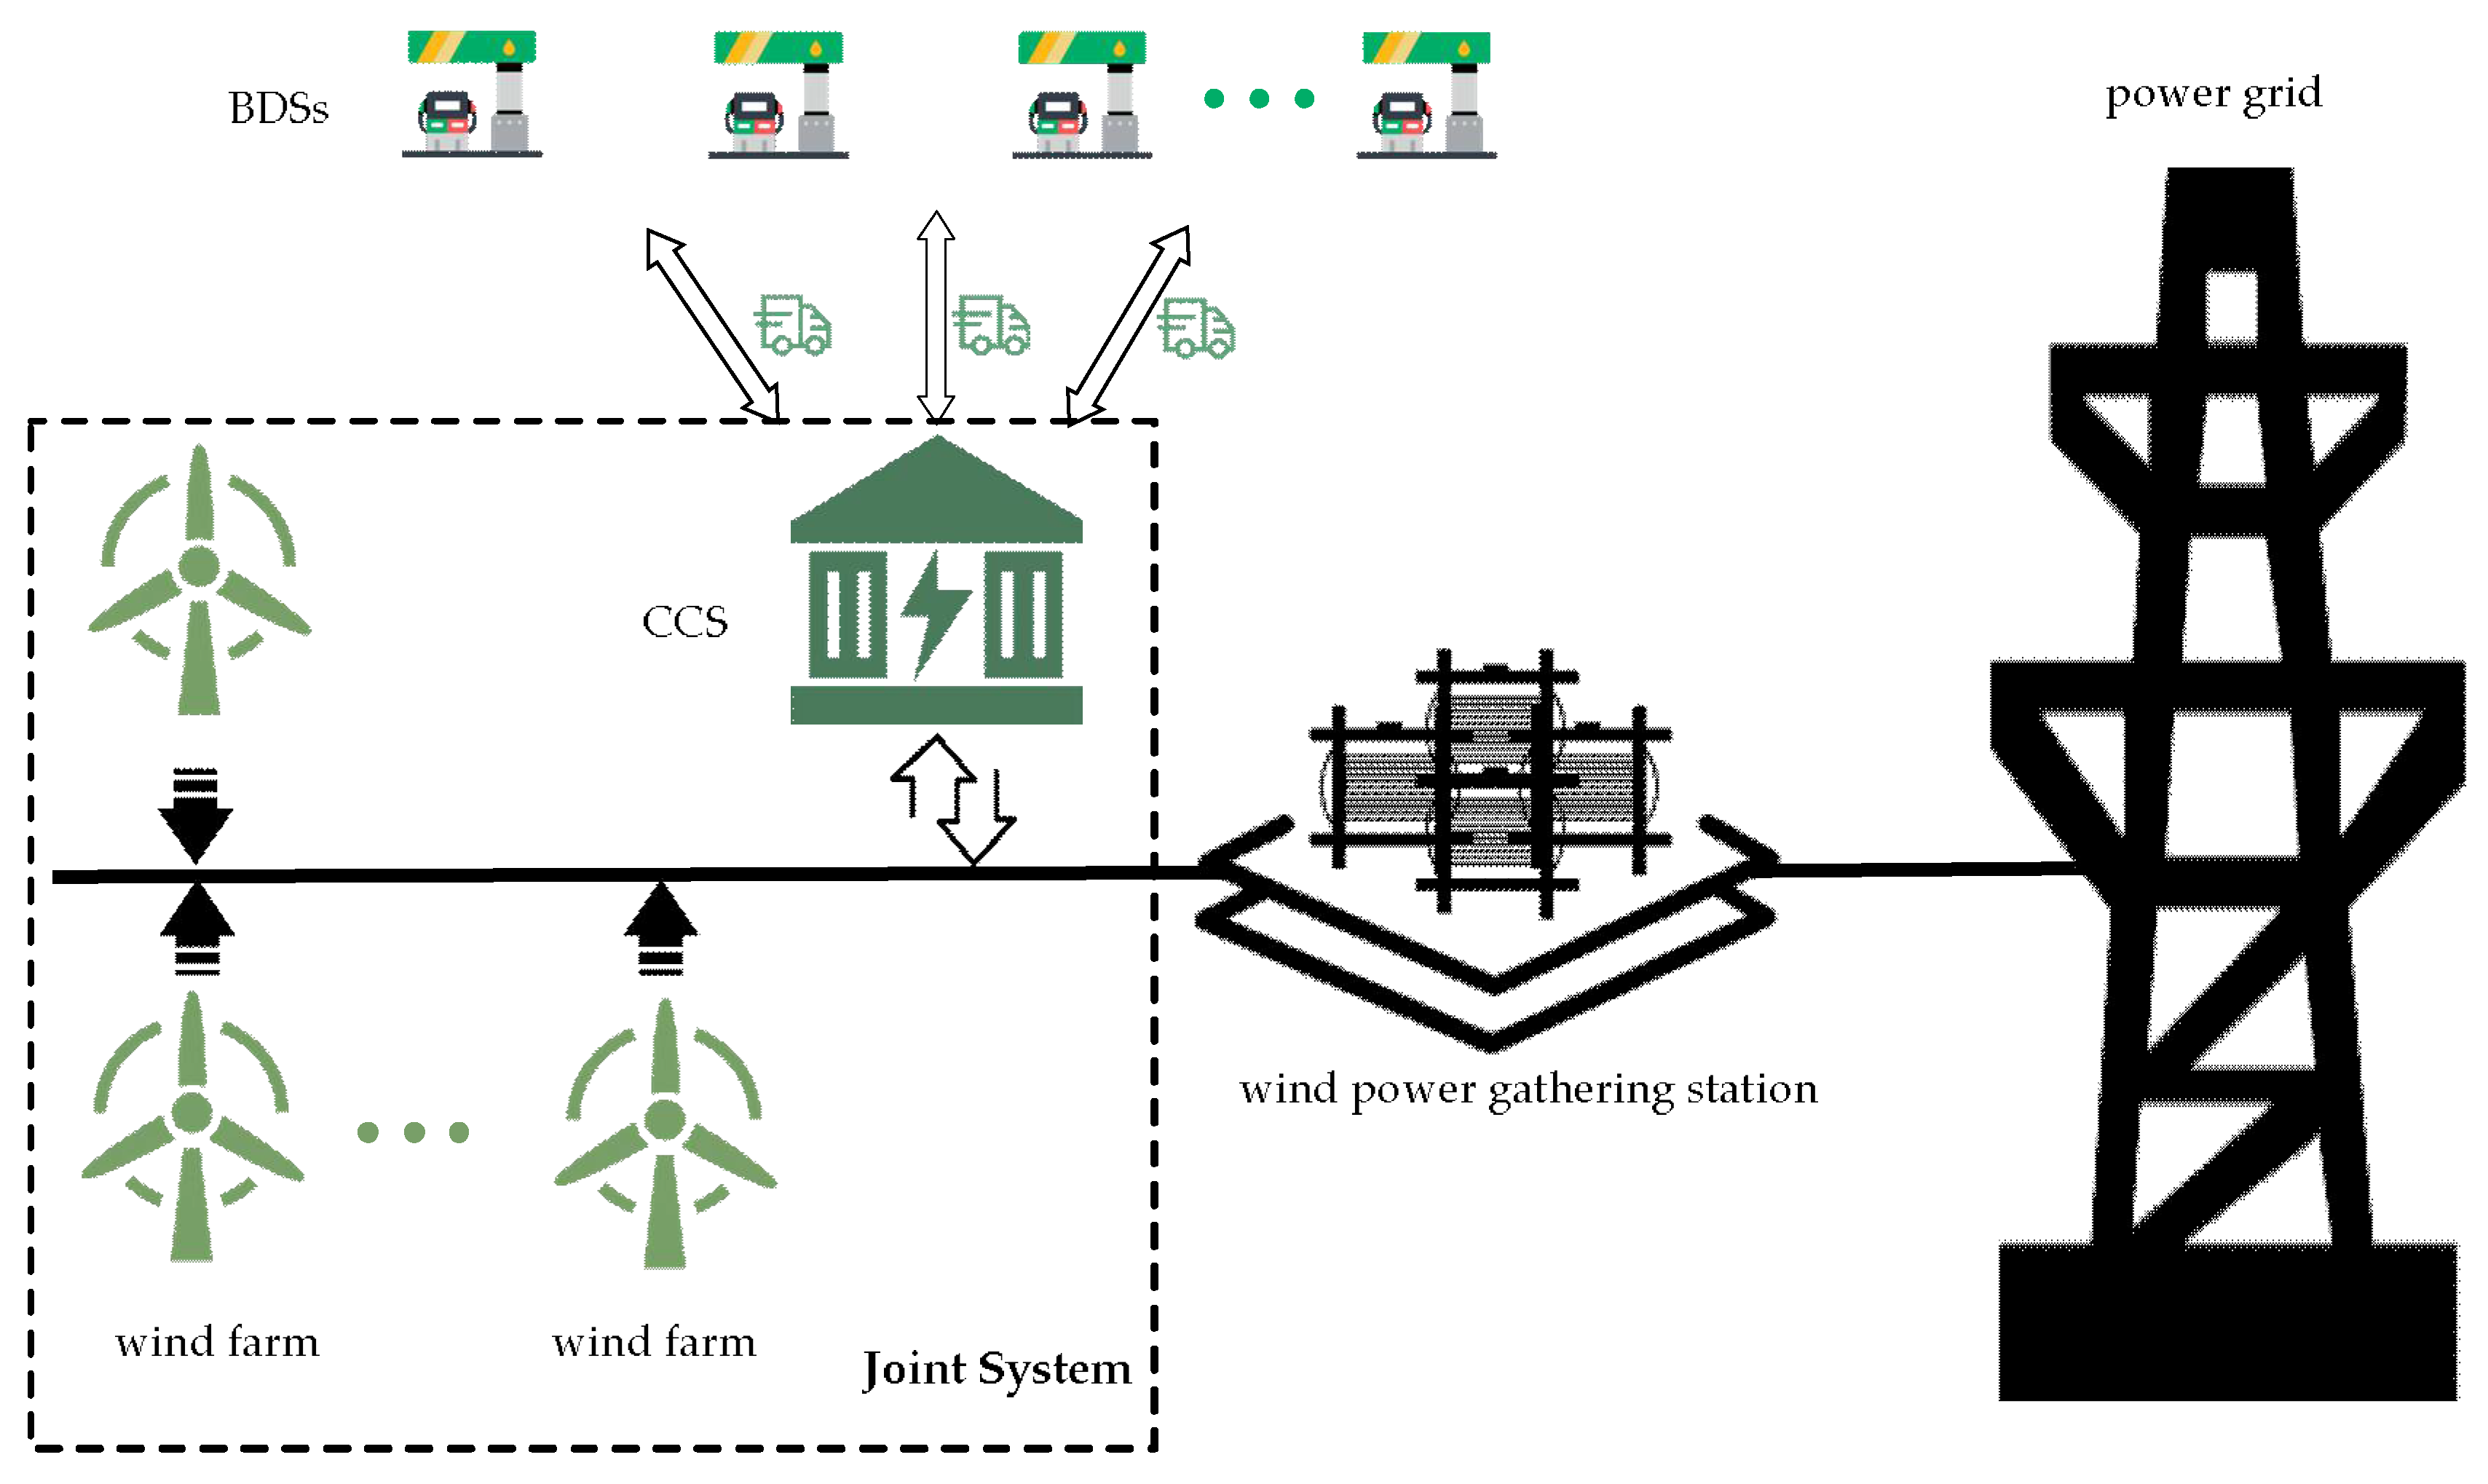
Figure 3.
Flowchart of the Monte Carlo simulation.

Figure 4.
Segmented coding of the chromosome.

Figure 5.
Prediction of battery swapping demand in a typical day.

Figure 6.
Prediction of wind power in a typical day.

Figure 7.
Pool purchase price of wind power.

Figure 8.
Optimization of battery capacity at different unit prices.

Figure 9.
Charging/discharging schedule of the centralized charging station.

Figure 10.
Comparison of the generation schedule of the integrated system and the wind power prediction.
Figure 10.
Comparison of the generation schedule of the integrated system and the wind power prediction.
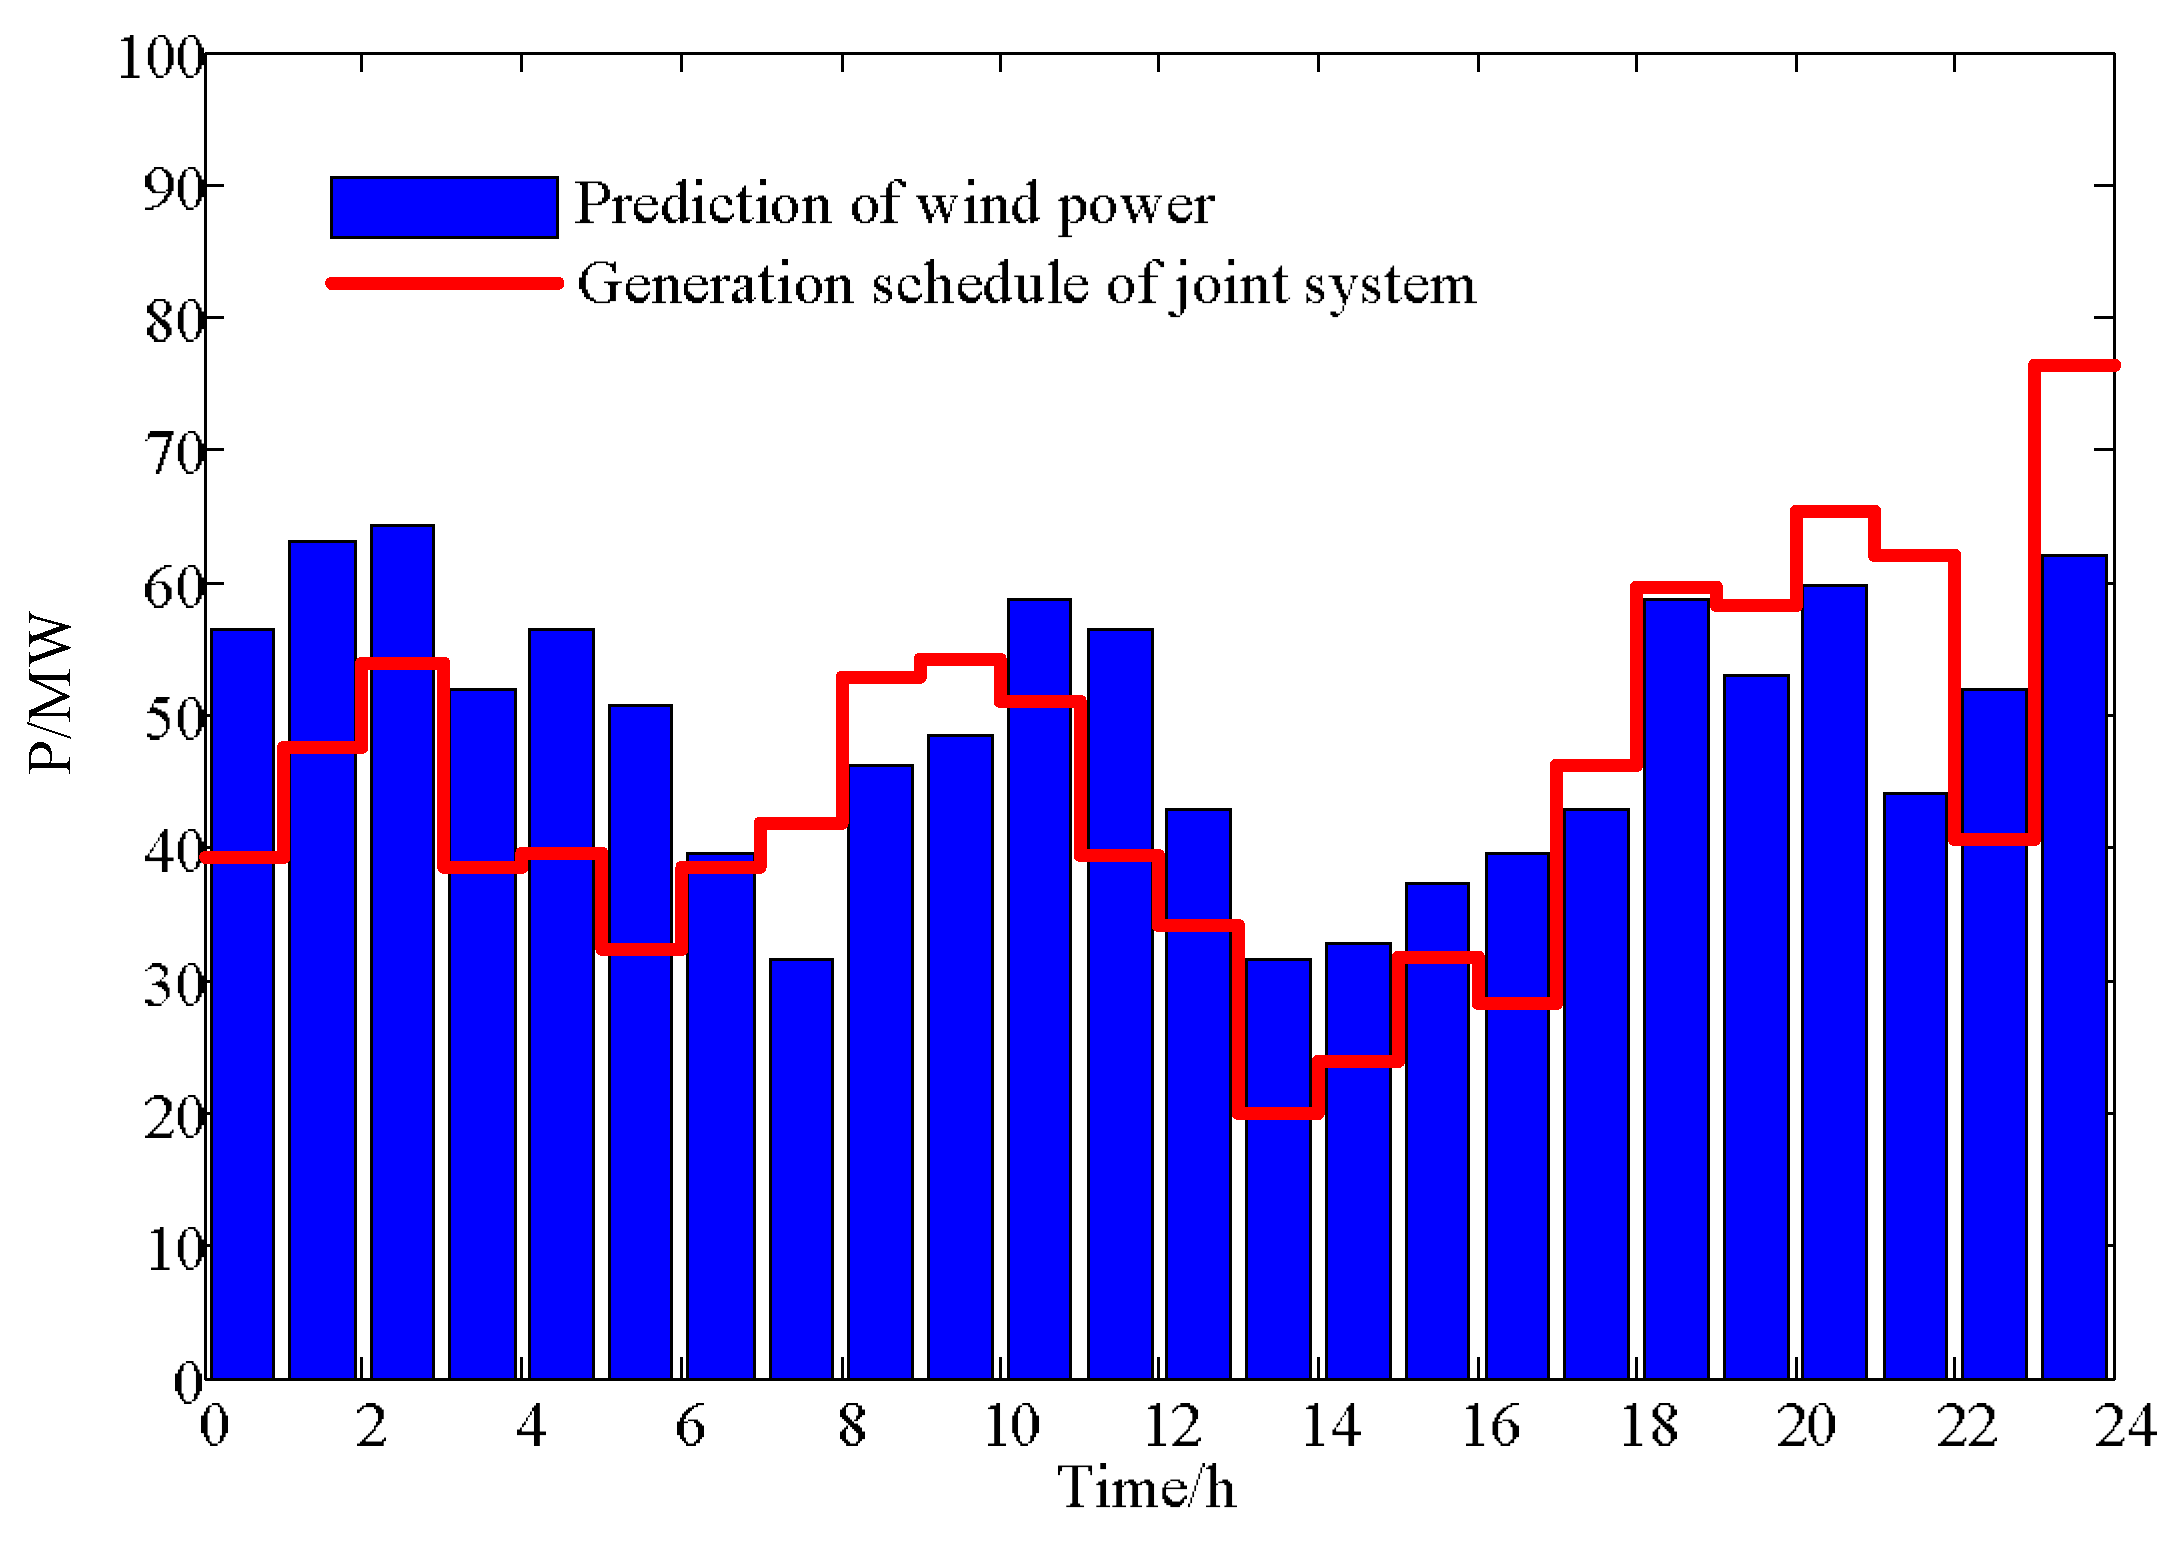
Figure 11.
Energy storage in the centralized charging station.


Table 1.
Parameters of the centralized charging station.
| No. | Parameters | Quantity 1 |
|---|---|---|
| 1 | 270 MWh | |
| 2 | 42 MW | |
| 3 | 1,950,000 ¥/MWh | |
| 4 | 507,000 ¥/MWh | |
| 5 | 390,000 ¥/MW | |
| 6 | 315 ¥/MWh | |
| 7 | 95% | |
| 8 | 92% | |
| 9 | 1% | |
| 10 | 1% | |
| 11 | 5300 | |
| 12 | DoD | 95% |
| 13 | L | 10 years |
| 14 | 6% |
1 In this paper, RMB is used as the monetary unit. RMB ¥1 is equal to US $0.16.
Table 2.
The joint system operating indices and the target values for their realization probabilities.
Table 2.
The joint system operating indices and the target values for their realization probabilities.
| Priority Order | Index | Desired Value of Index | Target Value for Realization Probability |
|---|---|---|---|
| 1 | battery swapping demand curtailment | 0.2 MWh | 95% |
| 2 | wind curtailment | 35 MWh | 95% |
| 3 | annualized profit | 219 million ¥ | 85% |
Table 3.
Effects of battery unit prices on indices.
| Unite Price (million ¥/MWh) | Realization Probability of Index 1 | Realization Probability of Index 2 | Realization Probability of Index 3 | Annualized Profit Expectation (million ¥) |
|---|---|---|---|---|
| 1.95 | 95% | 95% | 78% | 220 |
| 3.0 | 95% | 95% | 0% | 206 |
| 4.0 | 95% | 95% | 0% | 193 |
| 5.0 | 95% | 95% | 0% | 180 |
Table 4.
Effect of PCS unit price on its rated power and the index of annualized profit.
| PCS Unit Price (million ¥/MWh) | Rated Power (MW) | Annualized Profit Expectation (million ¥) | Realization Probability of Index 3 |
|---|---|---|---|
| 0.39 | 25.1 | 220 | 78% |
| 0.7 | 23.6 | 219 | 70% |
| 1.0 | 20.8 | 218 | 40% |
| 2.0 | 20.2 | 215 | 0% |
| 3.0 | 20.2 | 212 | 0% |
Table 5.
Effect of peak and valley difference of wind power price on optimization result.
| Wind Power Price in Peak Hours (¥/MWh) | Battery System Rated Capacity (MWh) | PCS Rated Power (MW) | Realization Probability of Index 3 | Discharged Energy (MWh) |
|---|---|---|---|---|
| 800 | 88 | 22.0 | 0% | 31 |
| 900 | 123 | 25.1 | 78% | 70 |
| 1000 | 132 | 26.5 | 100% | 95 |
© 2018 by the authors. Licensee MDPI, Basel, Switzerland. This article is an open access article distributed under the terms and conditions of the Creative Commons Attribution (CC BY) license (http://creativecommons.org/licenses/by/4.0/).
Share and Cite
MDPI and ACS Style
Jiang, Z.; Han, X.; Li, Z.; Wang, M.; Liu, G.; Wang, M.; Li, W.; Ollis, T.B. Capacity Optimization of a Centralized Charging Station in Joint Operation with a Wind Farm. Energies 2018, 11, 1164. https://doi.org/10.3390/en11051164
AMA Style
Jiang Z, Han X, Li Z, Wang M, Liu G, Wang M, Li W, Ollis TB. Capacity Optimization of a Centralized Charging Station in Joint Operation with a Wind Farm. Energies. 2018; 11(5):1164. https://doi.org/10.3390/en11051164
Chicago/Turabian StyleJiang, Zhe, Xueshan Han, Zhimin Li, Mingqiang Wang, Guodong Liu, Mengxia Wang, Wenbo Li, and Thomas B. Ollis. 2018. "Capacity Optimization of a Centralized Charging Station in Joint Operation with a Wind Farm" Energies 11, no. 5: 1164. https://doi.org/10.3390/en11051164
Note that from the first issue of 2016, this journal uses article numbers instead of page numbers. See further details here.