Evaluation of a Distributed Photovoltaic System in Grid-Connected and Standalone Applications by Different MPPT Algorithms

1
Department of Systems and Naval Mechatronics Engineering, NCKU, Tainan 701, Taiwan
2
Research Center for Energy Technology and Strategy, NCKU, Tainan 701, Taiwan
*
Author to whom correspondence should be addressed.
Energies 2018, 11(6), 1484; https://doi.org/10.3390/en11061484
Submission received: 19 May 2018
/
Revised: 4 June 2018
/
Accepted: 5 June 2018
/
Published: 7 June 2018
(This article belongs to the Special Issue Selected Papers from the IEEE ICASI 2018)
Abstract
:Due to the shortage of fossil fuel and the environmental pollution problem, solar energy applications have drawn a lot of attention worldwide. This paper reports the use of the latest patented distributed photovoltaic (PV) power system design, including the two possible maximum power point tracking (MPPT) algorithms, a power optimizer, and a PV power controller, in grid-connected and standalone applications. A distributed PV system with four amorphous silicon thin-film solar panels is used to evaluate both the quadratic maximization (QM) and the Steepest descent (SD) MPPT algorithms. The system’s design is different for the QM or the SD MPPT algorithm being used. The test result for the grid-connected silicon-based PV panels will also be reported. Considering the settling time for the power optimizer to be 20 ms, the test result shows that the tracking time for the QM method is close to 200 ms, which is faster when compared with the SD method whose tracking time is 500 ms. Besides this, the use of the QM method provides a more stable power output since the tracking is restricted by a local power optimizer rather than the global tracking the SD method uses. For a standalone PV application, a solar-powered boat design with 18 PV panels using a cascaded MPPT controller is introduced, and it provides flexibility in system design and the effective use of photovoltaic energy.
1. Introduction
In recent years, the shortage of fossil fuels and environmental pollution awareness have been two important issues that affect people’s daily lives, and therefore many countries are actively doing research and developing renewable energy resources. Solar energy is one of the most promising options. It can be found that most grid-connected solar applications are based on a ‘centralized’ control architecture. That is, multiple photovoltaic (PV) panels are connected in series and in parallel to share one inverter having a centralized maximum power point tracker. However, a well-known power loss problem encountered by a centralized photovoltaic system is due to a panel’s mismatch, degradation, or partial shading effect. For such a reason, a PV system’s power characteristic also exhibits multiple maxima power points which make it more difficult for the maximum power point tracking (MPPT) algorithm to track the global maximum power point. A PV system that exhibits multiple maxima has been discussed by many researchers; for example [1,2,3]. Techniques that tackle a PV system’s partial shading effect are also known as the soft computing method or the equivalent circuit method [4]. The soft computing method involves the development of various MPPT algorithms in different array configurations. The equivalent circuit method uses a different PV system architecture and different converter topologies. There are advantages and disadvantages among these methods, and one can also refer to review articles for more information [5,6].
A popular PV system design to avoid the multi-peak tracking problem is to rearrange the system into a distributed format [7]. A ‘distributed’ photovoltaic power system is designed to use a dedicated direct current (DC)/DC converter attaching to each of the PV panels. Therefore, one can individually control each PV panel to obtain the maximum power output and to minimize the power loss caused by panel shading or mismatching. There are two types of distributed PV system design with different tracking philosophies. One method treats a PV panel independently and thus can adopt a currently available MPPT method from a centralized system to perform panel-level tracking [8]. As a result, a module-integrated converter (MIC) or a power optimizer is attached to each of the PV panels. A central controller is required to coordinate the entire MIC network for power harvesting.
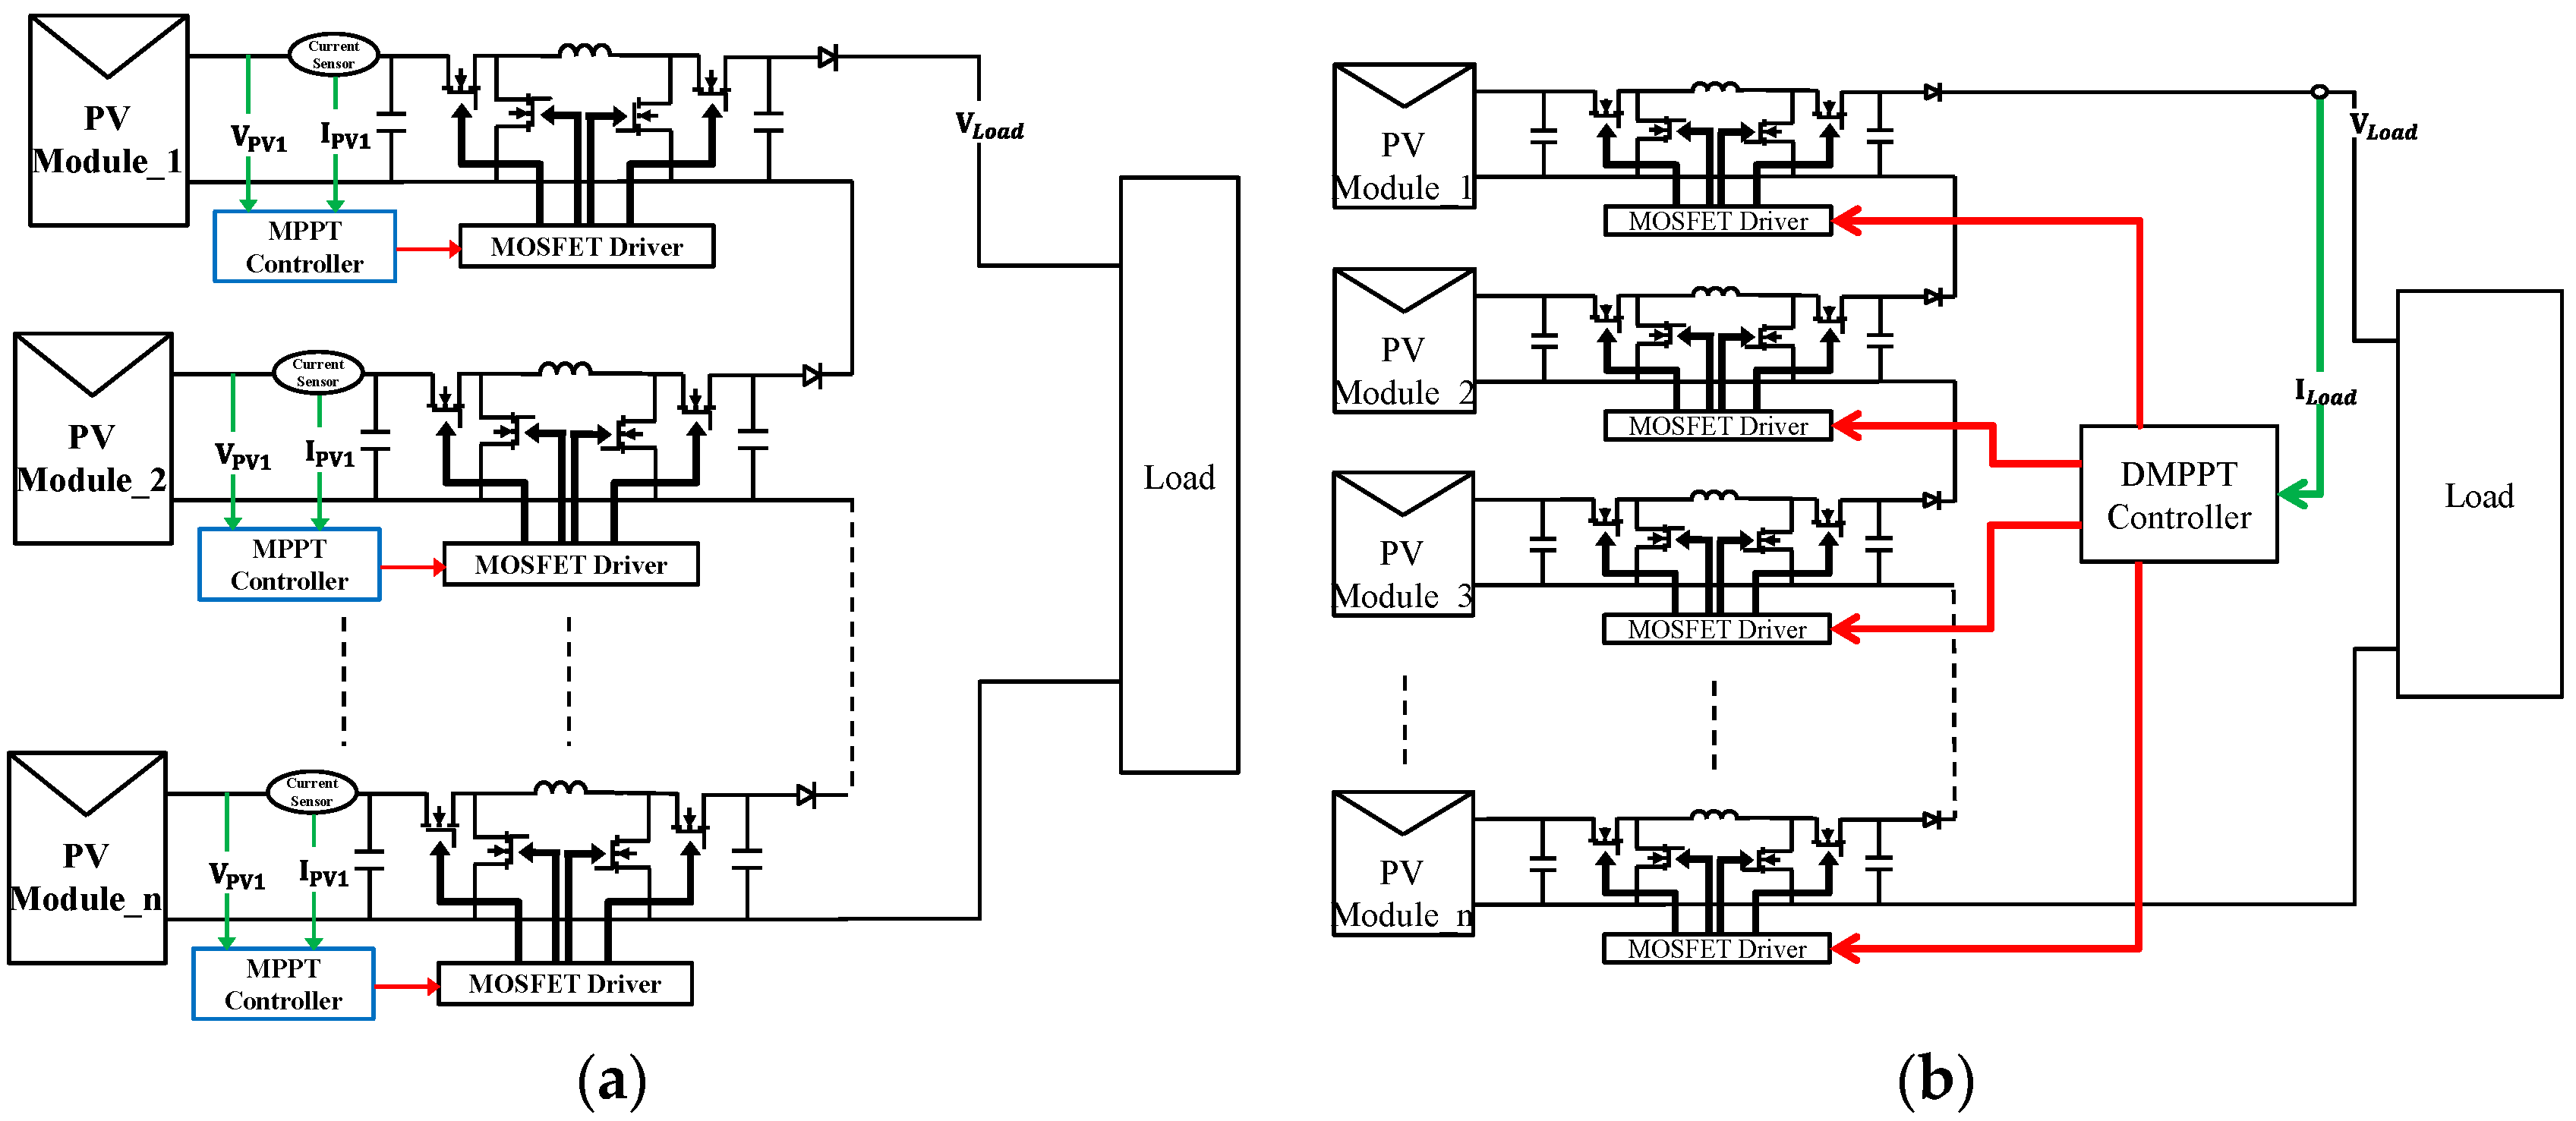
A global multivariable PV system uses only one set of current and voltage information for the entire system. The total number of current and voltage sensors can be reduced. The difference between these two hardware arrangements is best described in Figure 1. In general, a distributed MPPT system uses a local maximum power point tracking technique with I and V measurements on the MIC to ensure the local maximum power output (see Figure 1a). A multivariable PV system uses a global MPPT controller to modulate all of the MIC duty ratios simultaneously by using the system’s VLoad and ILoad data (Figure 1b). For example, a global MPPT method using perturb and observation (P&O) has been studied by [9] and the particle swarm optimization (PSO) method by [10] in two or three dimensional cases. When the number of panels increases, the tracking time is expected to increase drastically due to the sequential operation of P&O or the higher number of search agents required for PSO to cover the entire search domain. A PSO in conjunction with multicore calculation provides a solution for higher degrees of tracking space with an acceptable tracking speed [11].
Recently, our has team focused on the development of a new distributed system including the use of various MPPT algorithms, an award winning design of a DC/DC converter, and a patented controller system for PV applications. In this paper, the grid-connected and the standalone distributed PV applications associated with a particular MPPT algorithm are presented. The quadratic maximization (QM) MPPT was introduced in [12], and has been proved to have a faster convergent speed than other MPPT methods, such as the classical perturb and observation method. Thus, one is intuitively able to see the benchmark comparison of this method with the newly proposed multivariable MPPT method. For a distributed PV (DPV) system using either the modified QM or the steepest gradient method with the golden section search method, both are simulated by the NI Multisim software (National Instrument, Austin, TX, USA) using four Chimei CSSS-100A/90A photovoltaic panels (Chimei Energy, Taiwan). Some of the simulated results are shown here. Experimental tests for both MPPT algorithms are also compared. On site experiments for the DPV system are tested and both MPPT methods are proved to be useful for various applications without any limitation. A grid-connected PV system test using a number of silicon-based PV panels is also presented. Lastly, a solar-power boat is used to demonstrate a complicated standalone PV application, since the vessel in a rolling and a pitching motion encounters fast changing of solar insolation intensity over the PV panels on board. Previously, a technique called the dynamic MPPT process in conjunction with the QM method was developed which is very suitable for marine applications [13]. The solar power is further fed into the power system of the ship, increasing its overall green energy efficiency. By integrating the hardware of the distributed PV system, firmware that runs within the controllers, and the MPPT technique, the standalone system is realized by a re-modelled solar boat running on the Love River in Kaohsiung City, Taiwan. This work provides a framework to help the domestic leisure yacht industry adopt renewable solar energy technology and promote a new solar ship design with higher green energy efficiency.
2. The Solar System
2.1. The Maximum Power Point Tracking (MPPT) Controller
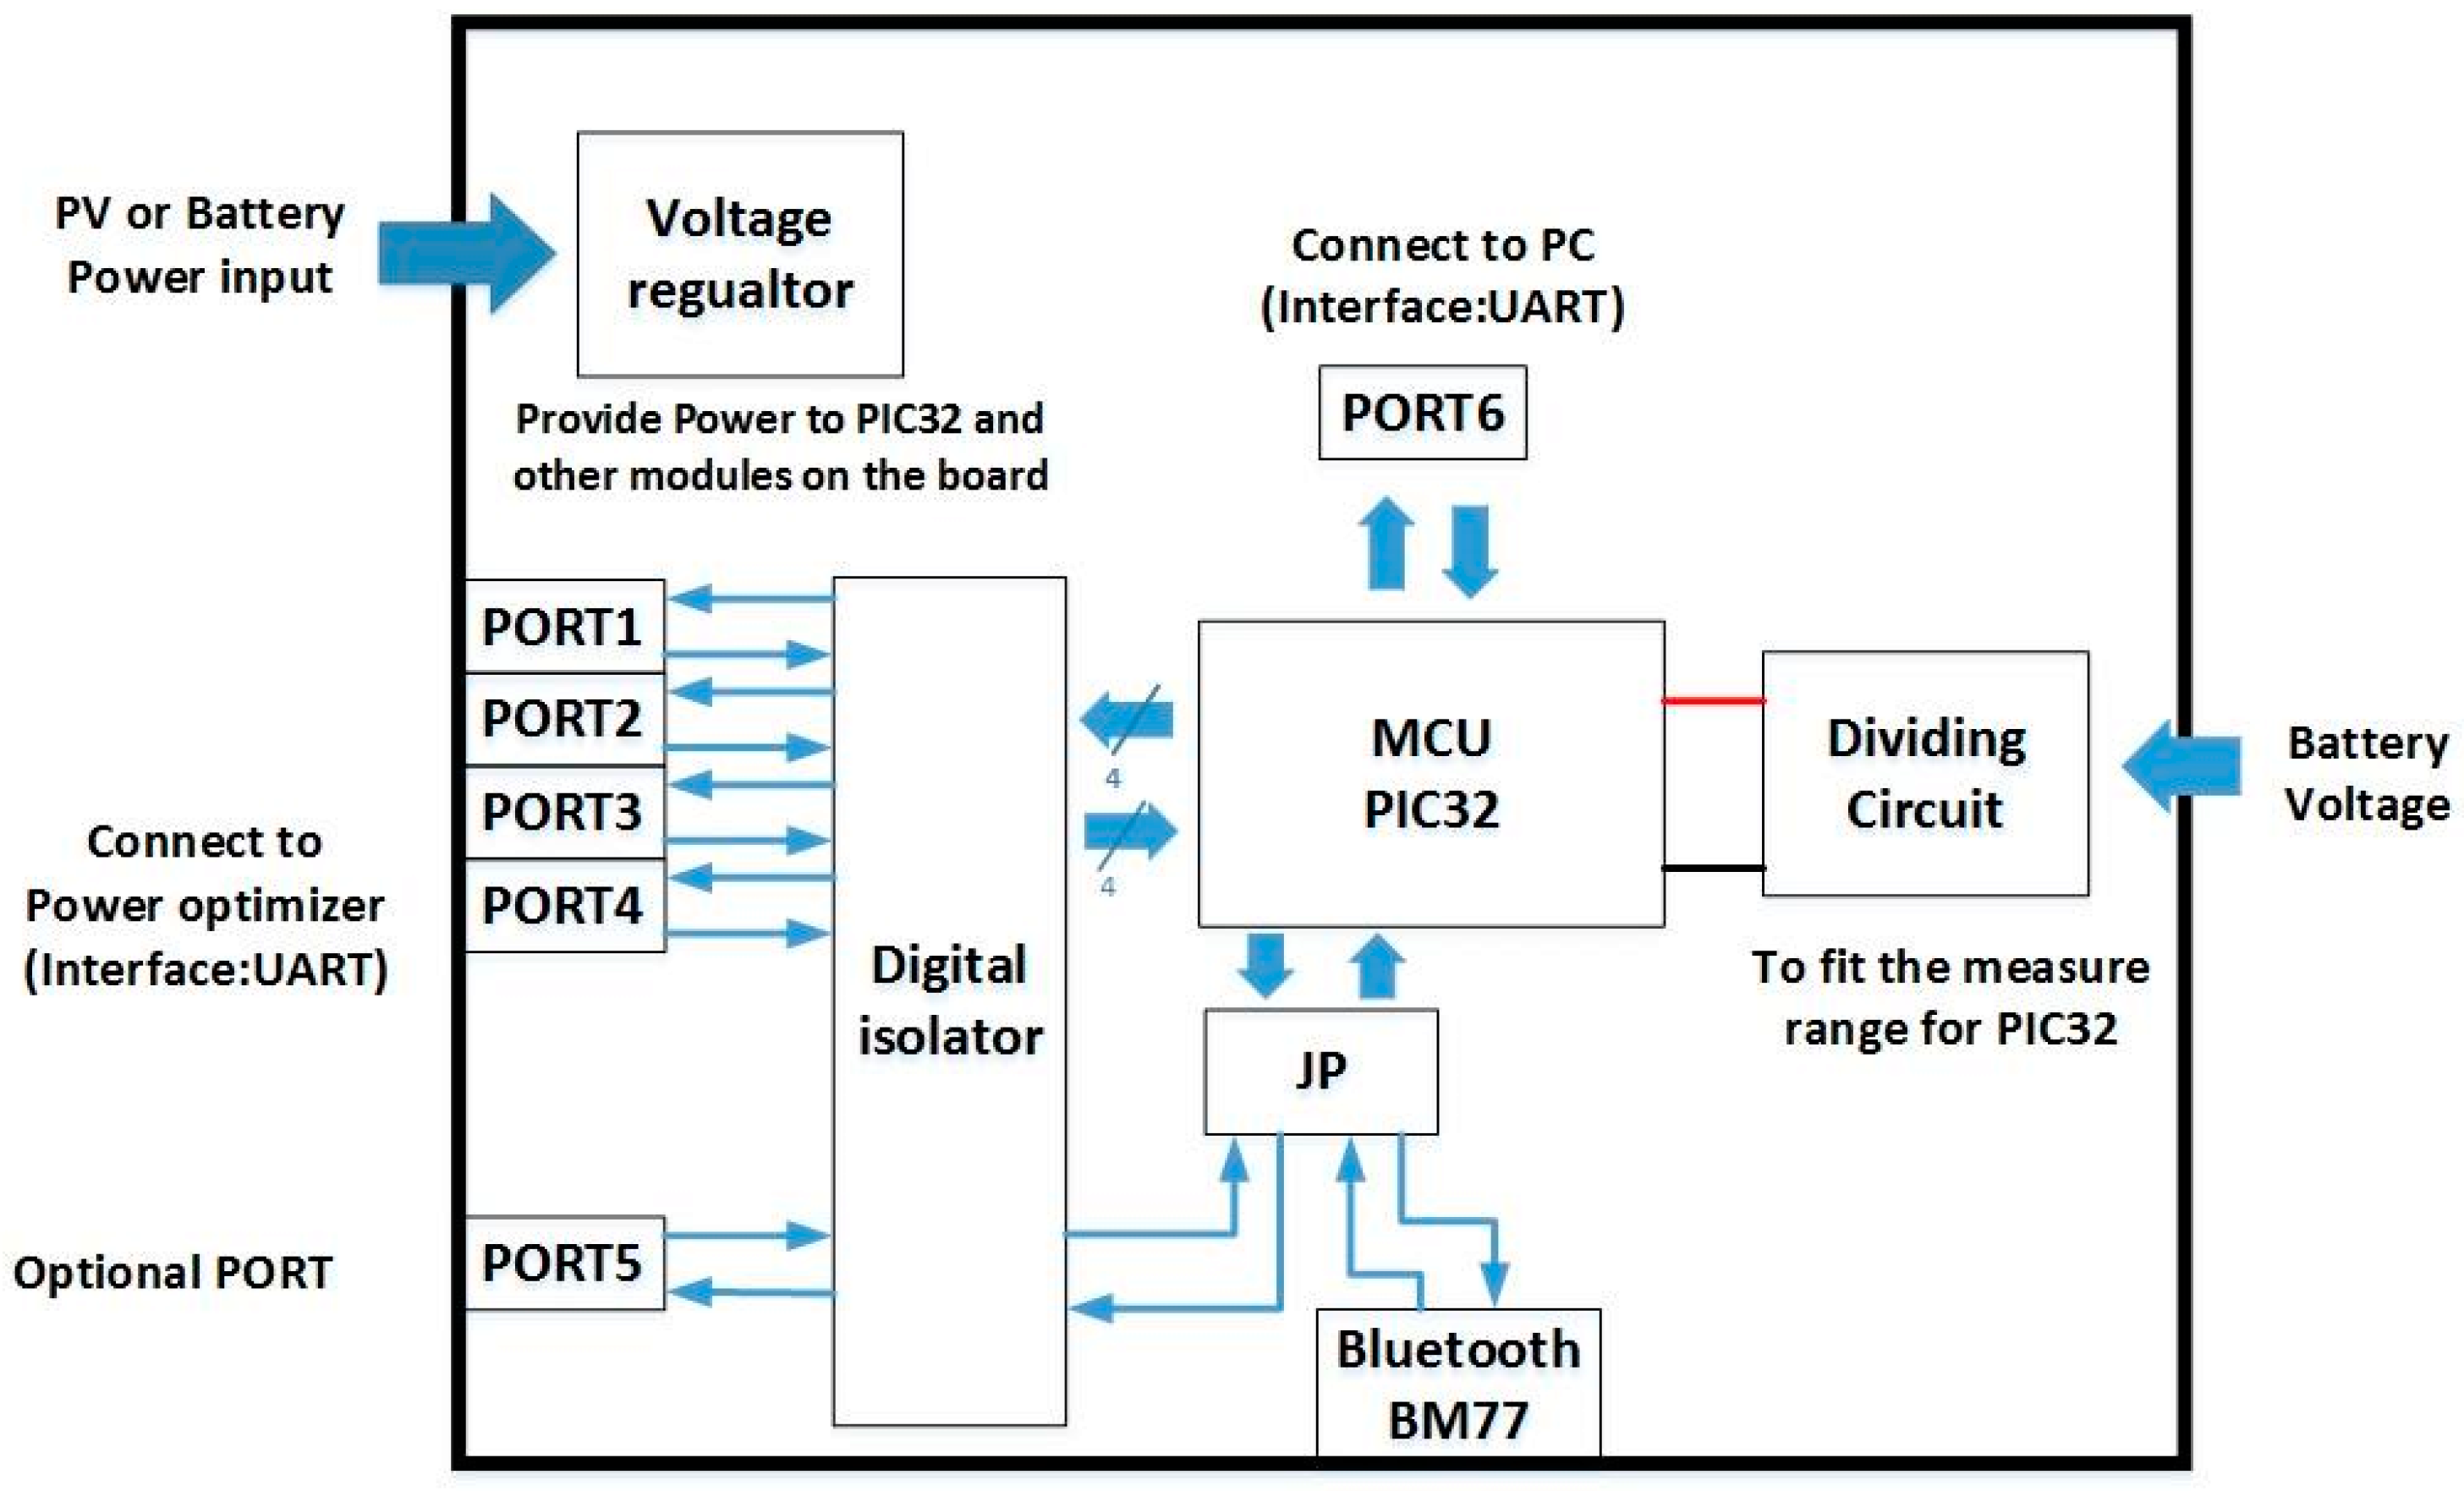
An MPPT controller is used to coordinate the operation of each connected power optimizer and to make work in a specific operation mode. Therefore, it requires communication between multiple microprocessors. Our group uses the PIC32 architecture to design the MPPT controller (see Figure 2). A total of six UART communication ports are used, including four PV converters, one personal computer, and a Bluetooth device. It can be powered either by a nearby renewable energy source or by a battery pack. The Bluetooth device is used to communicate with a portable device to set up the PV panel characteristic data where a standalone application is preferred, and it can also display instantaneous operation information for the user on his/her smart device. In some cases, one can disable Bluetooth communication for an extra PV panel connection. For a low PV power application, a controller powered by a PV panel is preferable for easy set up. For a larger system, such as a grid connected system or a PV boat, external power from the grid or battery provides a stable power source for the entire system to run smoothly. Multiple controllers can be integrated into a larger PV system using the UART communication protocol. In order to reject signal noise from the DC/DC converters, digital isolator circuitry is applied.
2.2. The Power Optimizer
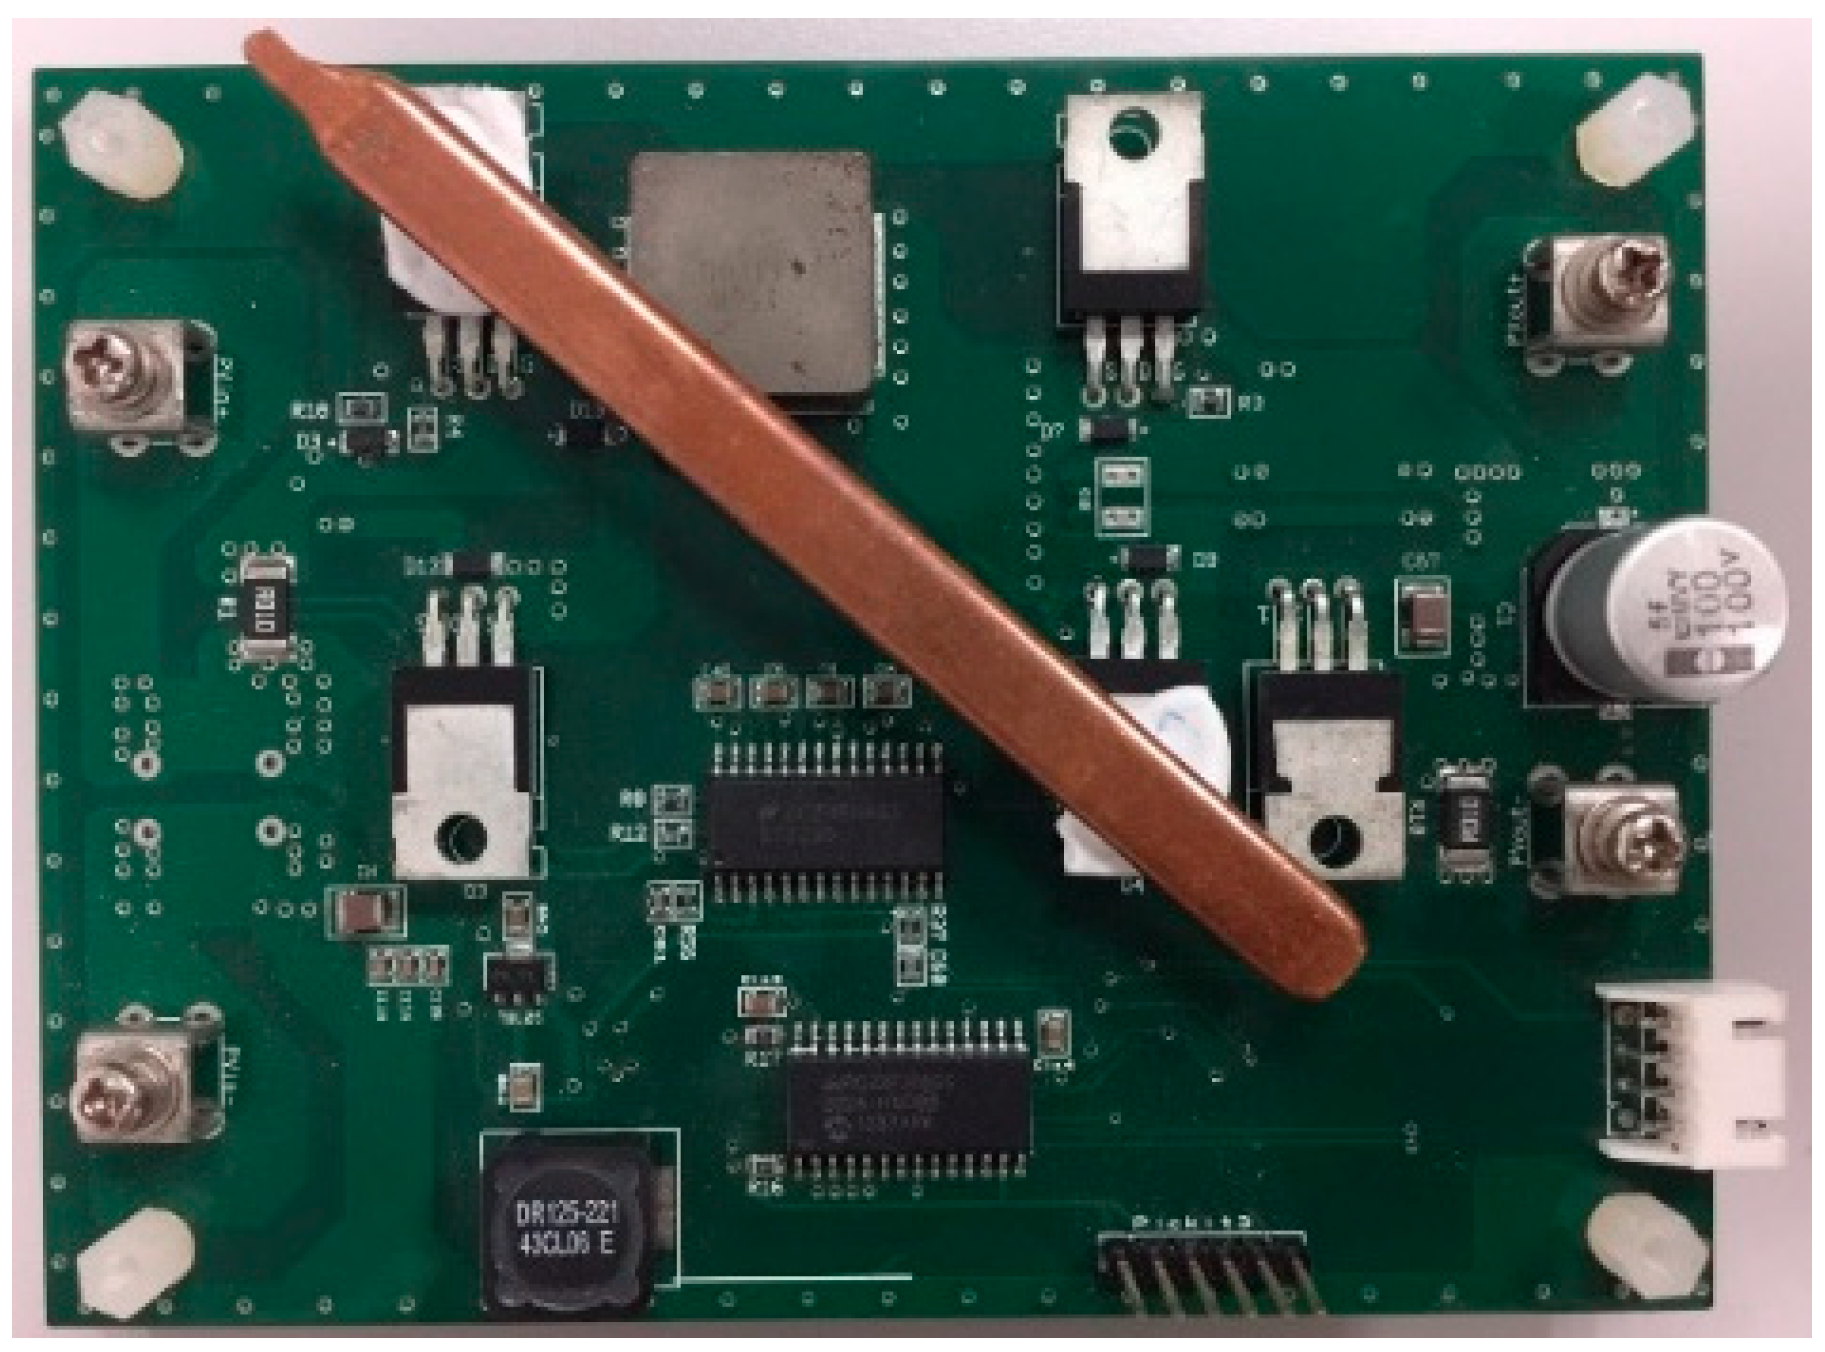
The new power optimizer design for a silicon-based PV panel is required: (a) to survive under higher current but a low operation voltage; (b) to be able to be powered by PV cells or a battery; and (c) to have its MPPT use an internal voltage measurement for PI regulation. An SM72295 (Texas Instruments, USA) PV full-bridge drive is used for switching control. Several voltage equalizers are used to provide various voltage levels at 10V, 5V, and 3.3V. PI voltage control can be achieved by an MCU such as dsPIC33 (Microchip, USA), which can be used for I and V measurement. An OP amplifier, such as LT1013 (Linear Tech. USA) is used to increase the measurement accuracy and also decrease the circuit noise. I and V measurement calibration for the optimizer is necessary and is performed by the NI9229 and NI9227 (National Instruments, USA) measurement modules. Figure 3 shows the image of the designed power optimizer. In order to dissipate the heat generated by the electronic devices, a heat pipe is connected to the hot surfaces of the MOSFET.
2.3. Modified Quadratic Maximization MPPT Algorithm
The quadratic maximization (QM) algorithm for maximum power point tracking was developed previously and applied to a small experimental solar boat [12,13]. It has been proven to be quite efficient for fast changing insolation and temperature variation conditions if compared with other MPPT techniques, such as the perturb and observation method. Different from our previous work is that the PI voltage regulation is enforced. Some of the detail is briefly discussed here; for more details, the reader can refer to [14,15].
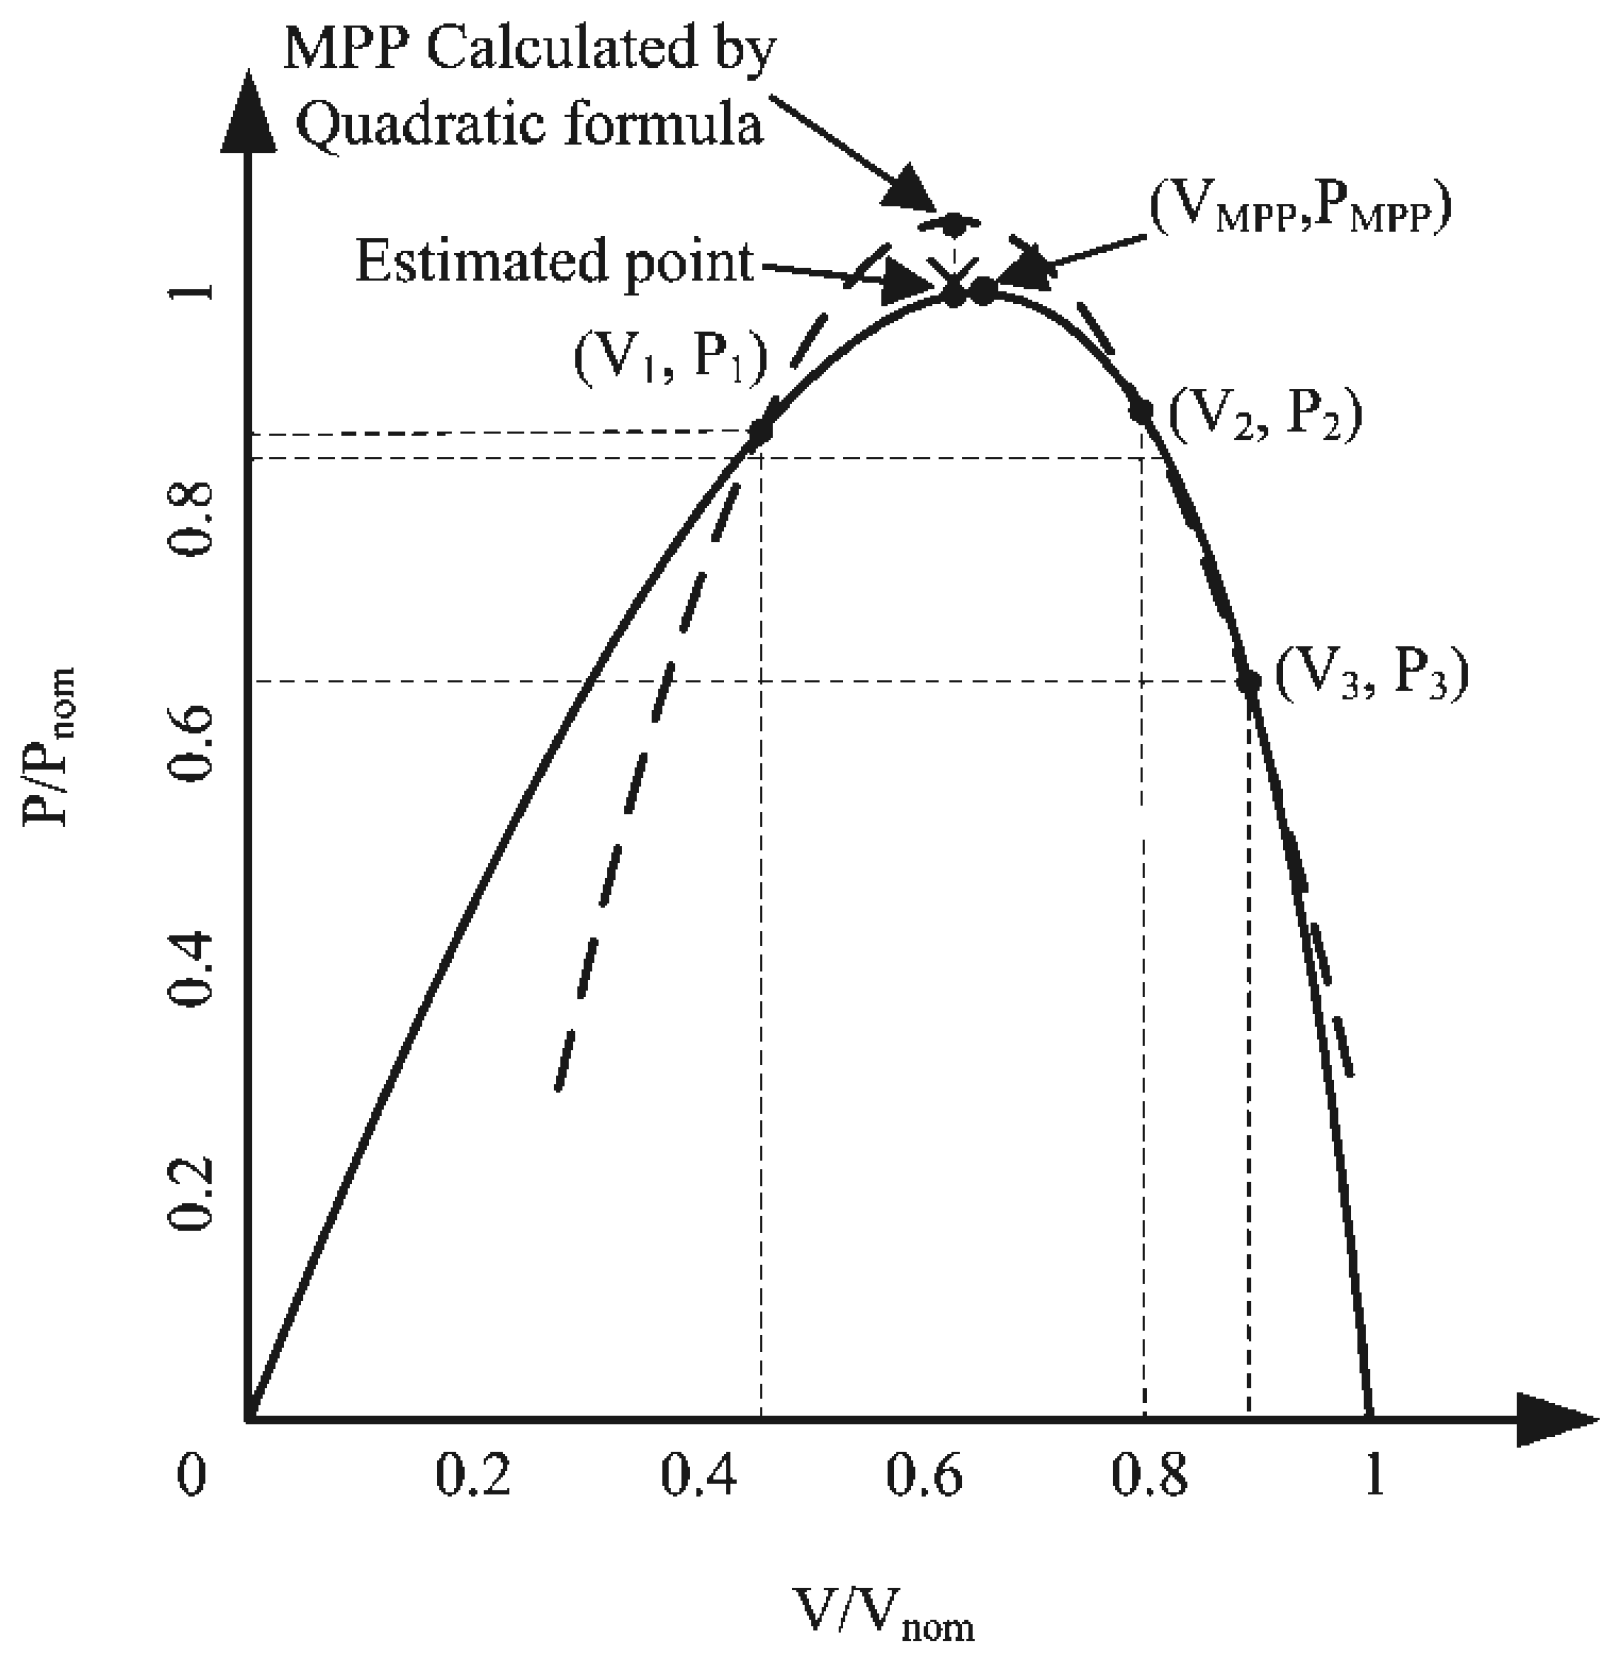
The tracking algorithm based on the operation of the PV output voltage is briefly shown in Figure 4, where the solid line is the PV characteristic curve and the dashed line represents a mathematical quadratic curve used to find the maximum power point. The control variable is the regulated voltage output instead of the duty cycle as in previous work. Depending on the relative positions of (V1, P1), (V2, P2), and (V3, P3) on the power curve, the tracking method encounters three different cases: (a) P2 > P1 and P2 > P3, and the estimated maximum power point for the operating voltage given by Equation (1); (b) P1 > P2 > P3; and (c) P3 > P2 > P1, which are required for different duty-shifting operations before they come to case (a).
The original QM method has the following limitations:
- Shifting: The difference between V1 and V2, and the difference between V2 and V3, are marked by ΔV1 and ΔV2, respectively, and are gradually decreased while converging to the MPP. However, if duty shifting is required for the subsequent tracking process, a smaller ΔV1 or ΔV2 means extra tracking time for the algorithm.
- Re-tracking: The QM method restarts the MPPT process when a significant change of output power occurs. If ΔV1 and ΔV2 become smaller during the previous MPPT process, they are not suitable for the next iteration and have to be reset in order to restart the MPPT process, which might deteriorate the efficiency of the MPPT method.
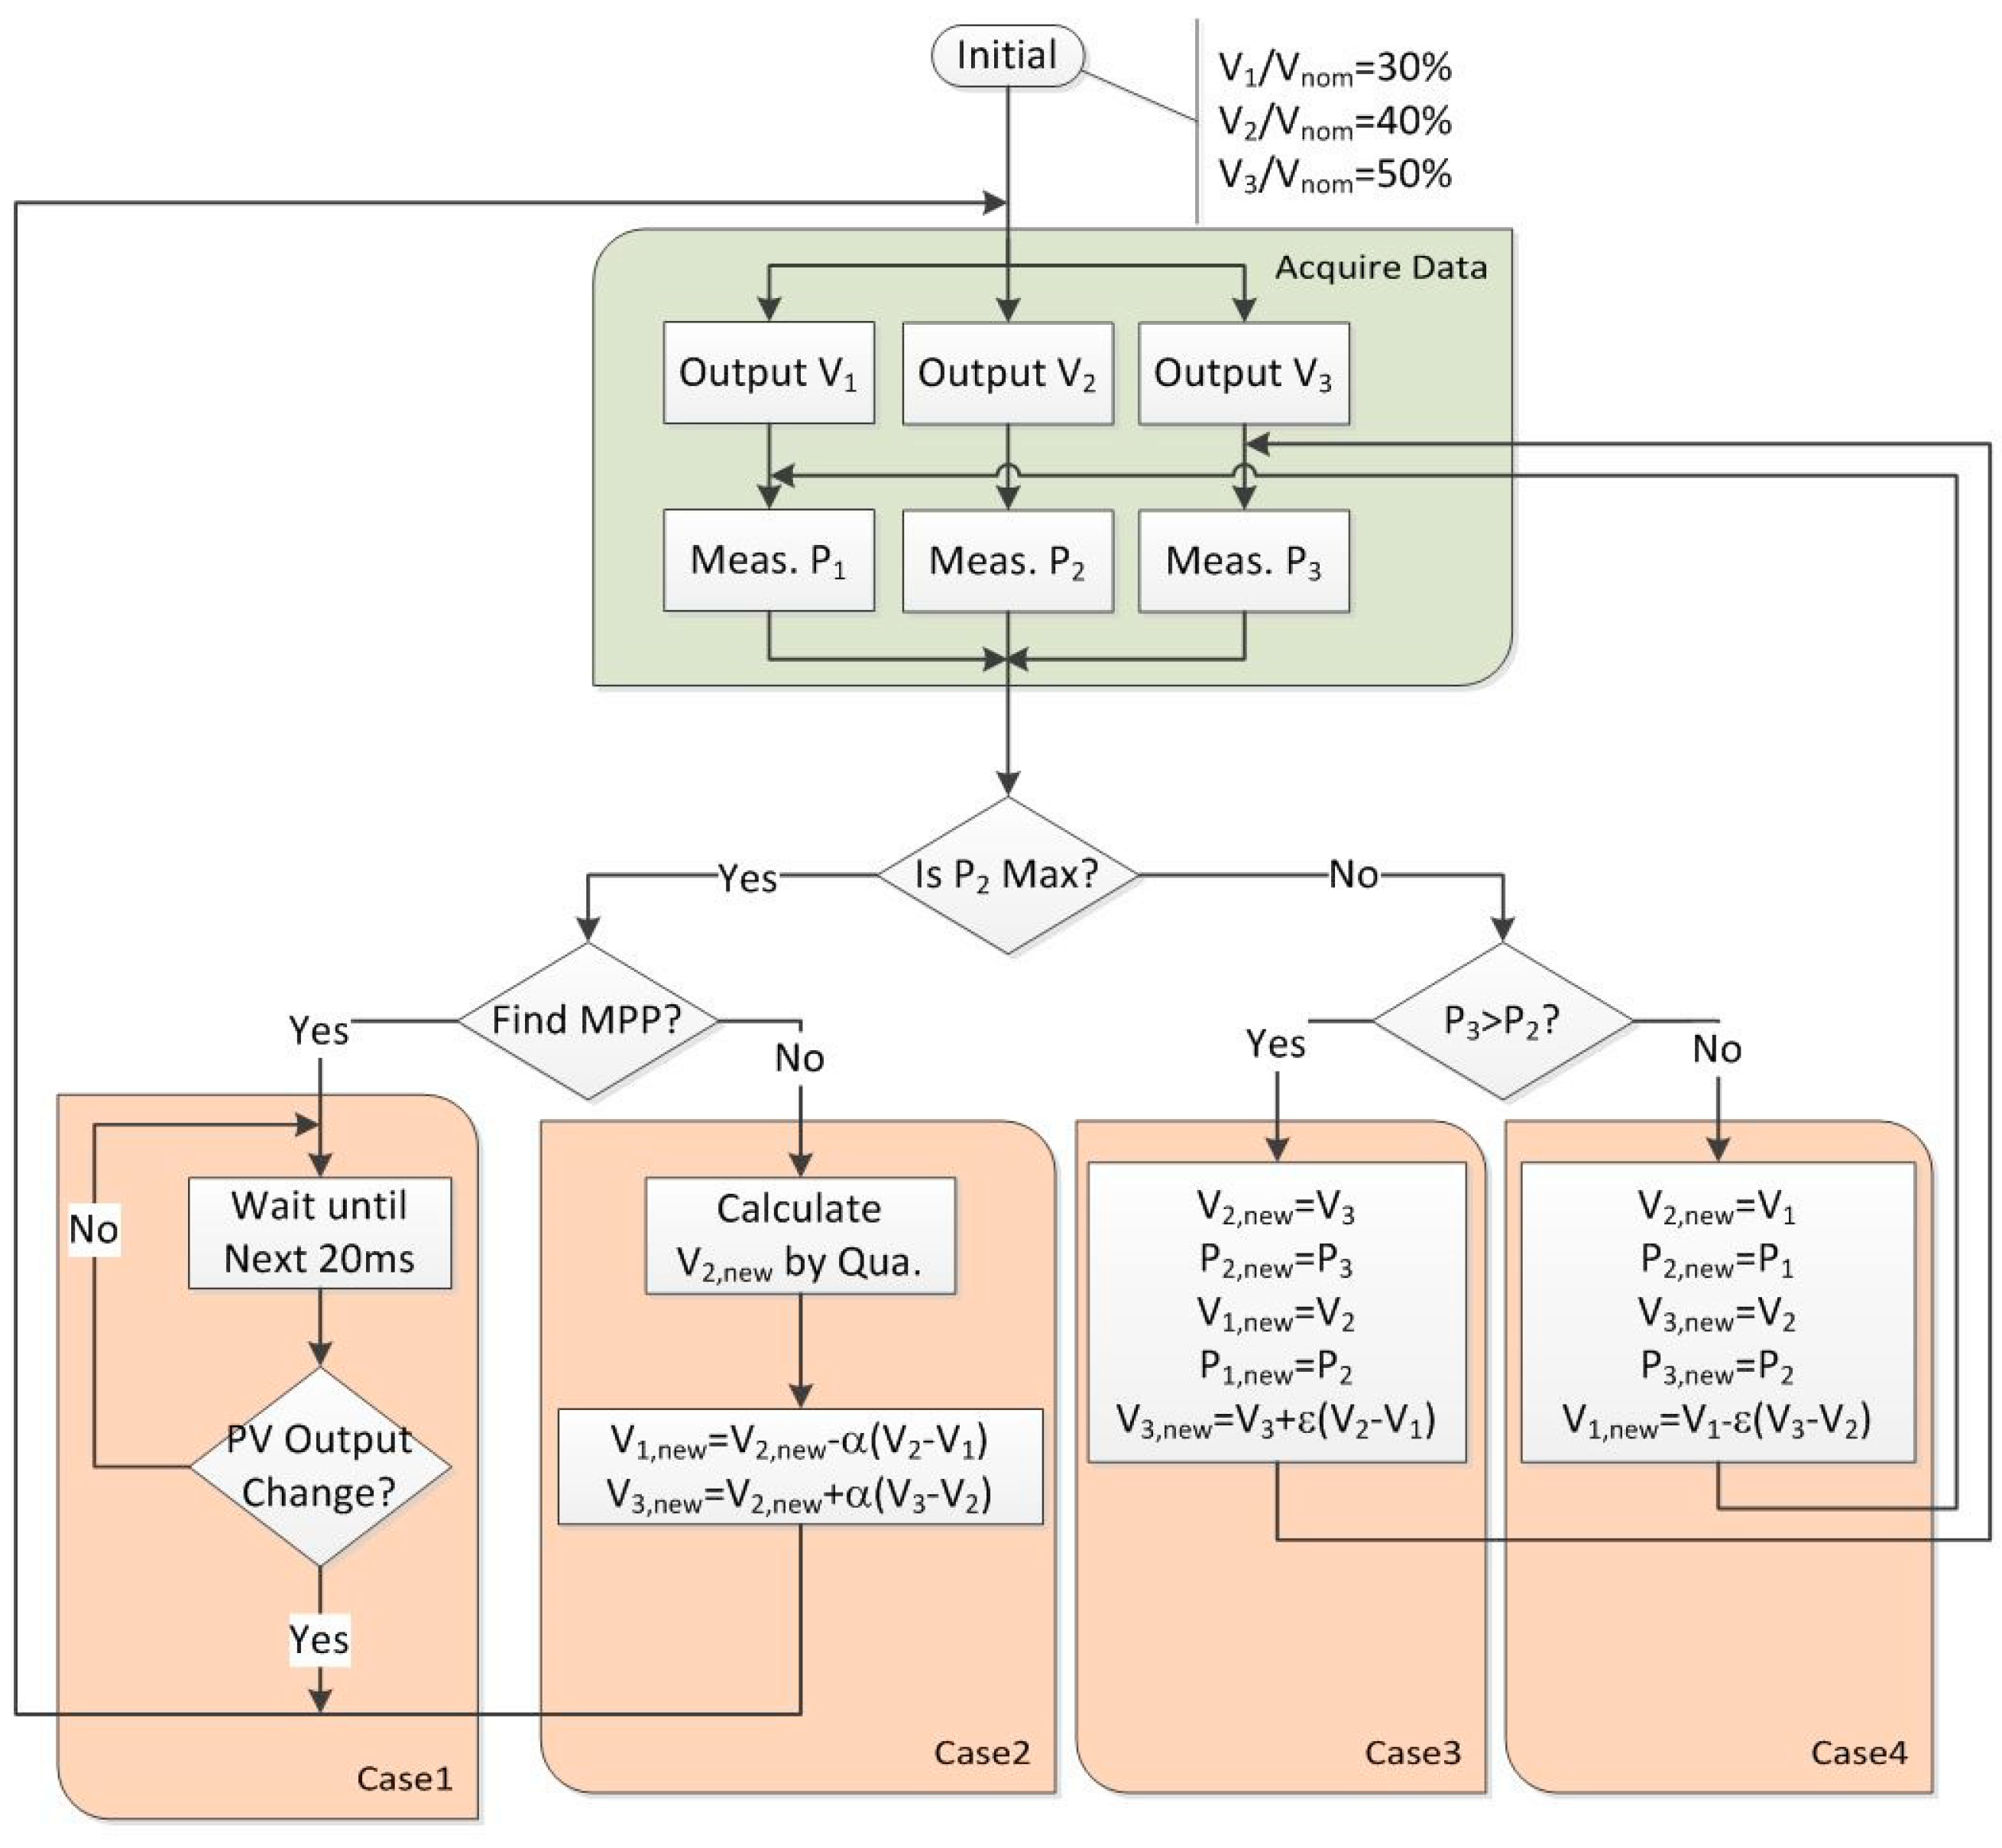
Based on previous work with a PV application on a moving vehicle, we define a parameter called the dynamic step size on voltage that refers to ΔV1 and ΔV2. For the three cases under consideration, the modified QM method will decrease, maintain, or increase the step sizes depending on the tracking status.
A flowchart for the modified QM MPPT algorithm is also shown in Figure 5. The values of α and ε are found by trial and error based on several simulation results, and the following values are used: α = 0.625, ε = 1.6.
2.4. The Steepest Descent with Golden Section Search MPPT Algorithm
Consider a distributed PV system whose controllable parameters are the duty cycles of every attached power optimizer. To find the global maximum power output of the system is to identify the optimal set of the controlled duties of the system. An optimization problem is then set as the following [16]
Note that is the power function of the n-dimensional PV system. The vector d is a n-dimensional vector of independent variables , which are also the duty values ( between 0 and 1) to be set on the optimizer. The steepest descent optimization method finds the optimal value along the gradient direction whose step size is to be determined in order to achieve the maximum value for the power output. That is,
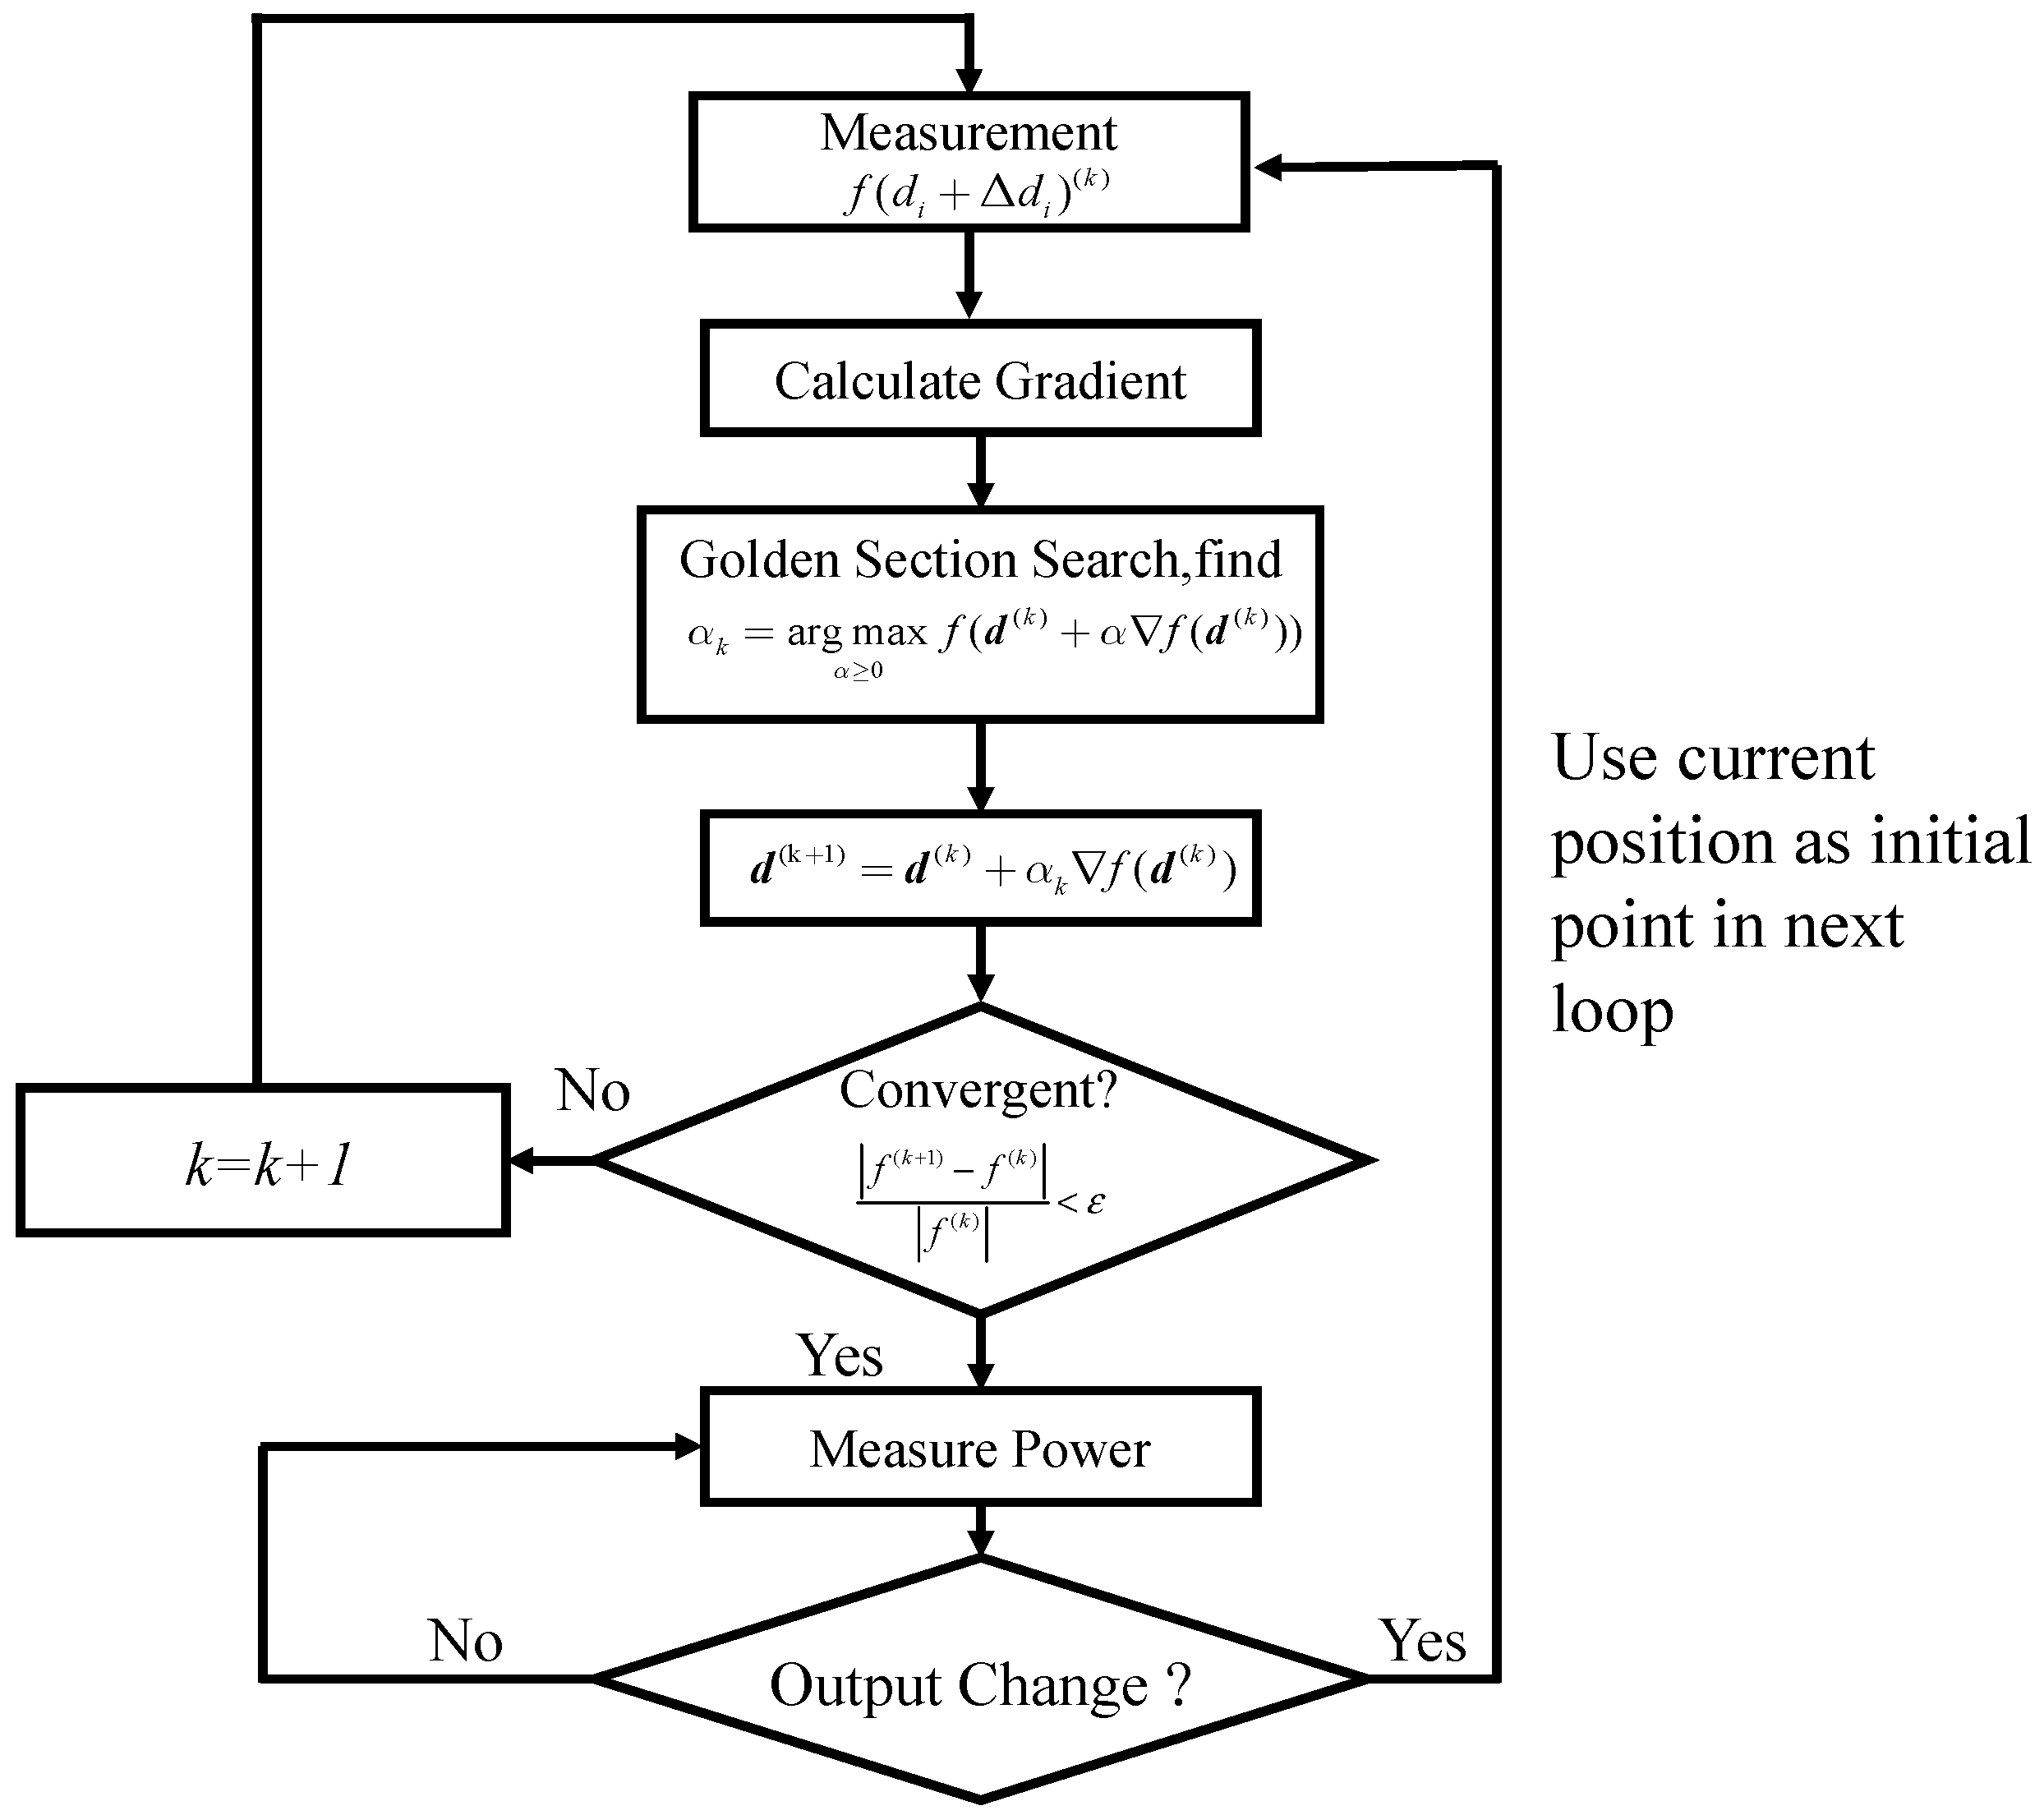
where is the optimal step size, is the gradient of power function, and k is the iteration step. The steepest descent algorithm can be summarized as follows: at the kth iteration, starting from , a line search with a positive step size α is conducted in the direction of until a maximum, , is found, and is the optimal step size. According to (3), the steepest descent method uses a line search algorithm at every iteration. There are several line search methods available, such as the Fibonacci search method, the golden section search method, Newton’s method, and the secant method. The golden section method is used because it calculates only one new searching point at a step and thus it converges faster than other methods to the maximum power point. The arg max in (3) represents the calculation of f(d) function in the kth steepest gradient direction, wherein f(d) gives its maximum at step size . Figure 6 shows the searching algorithm for the proposed method.
The gradient for the objective function is calculated by sequentially changing the duty ratio for each DC/DC converter by Δd. Then, the corresponding output power, f, is measured and the gradient is calculated. For clarity, if one considers a two-PV system, and the operating duties at the kth iteration are defined by (d1, d2), then the gradient function can be calculated by
Once the gradient is calculated, a line search using the golden section method in the direction of its gradient is conducted until a maximum value, f(d(k+1)), is found. The interval for the line search shall be defined in order to avoid unnecessary searching steps to the local maximum point. In this paper, the maximum search step is limited to 75% of the duty ratio and it cannot reach over 100%. The convergent condition for this method can be described by Equation (5), where δ is a small number, such as 0.01:
3. System Simulation and Experiment
3.1. Characteristic Curve Simulation of Photovoltaic System
The characteristic of a distributed PV system is simulated by the NI Multisim software using a single-diode PV model which can be easily found in the literature. For a better demonstration of the proposed work, two CSSS-90A PV panels (Voc = 99 V, Isc = 1.6 A, Vmpp = 71.4 V, Impp = 1.26 A) fabricated by CHIMEI Energy, Taiwan are serially connected through buck converters (see Figure 7).
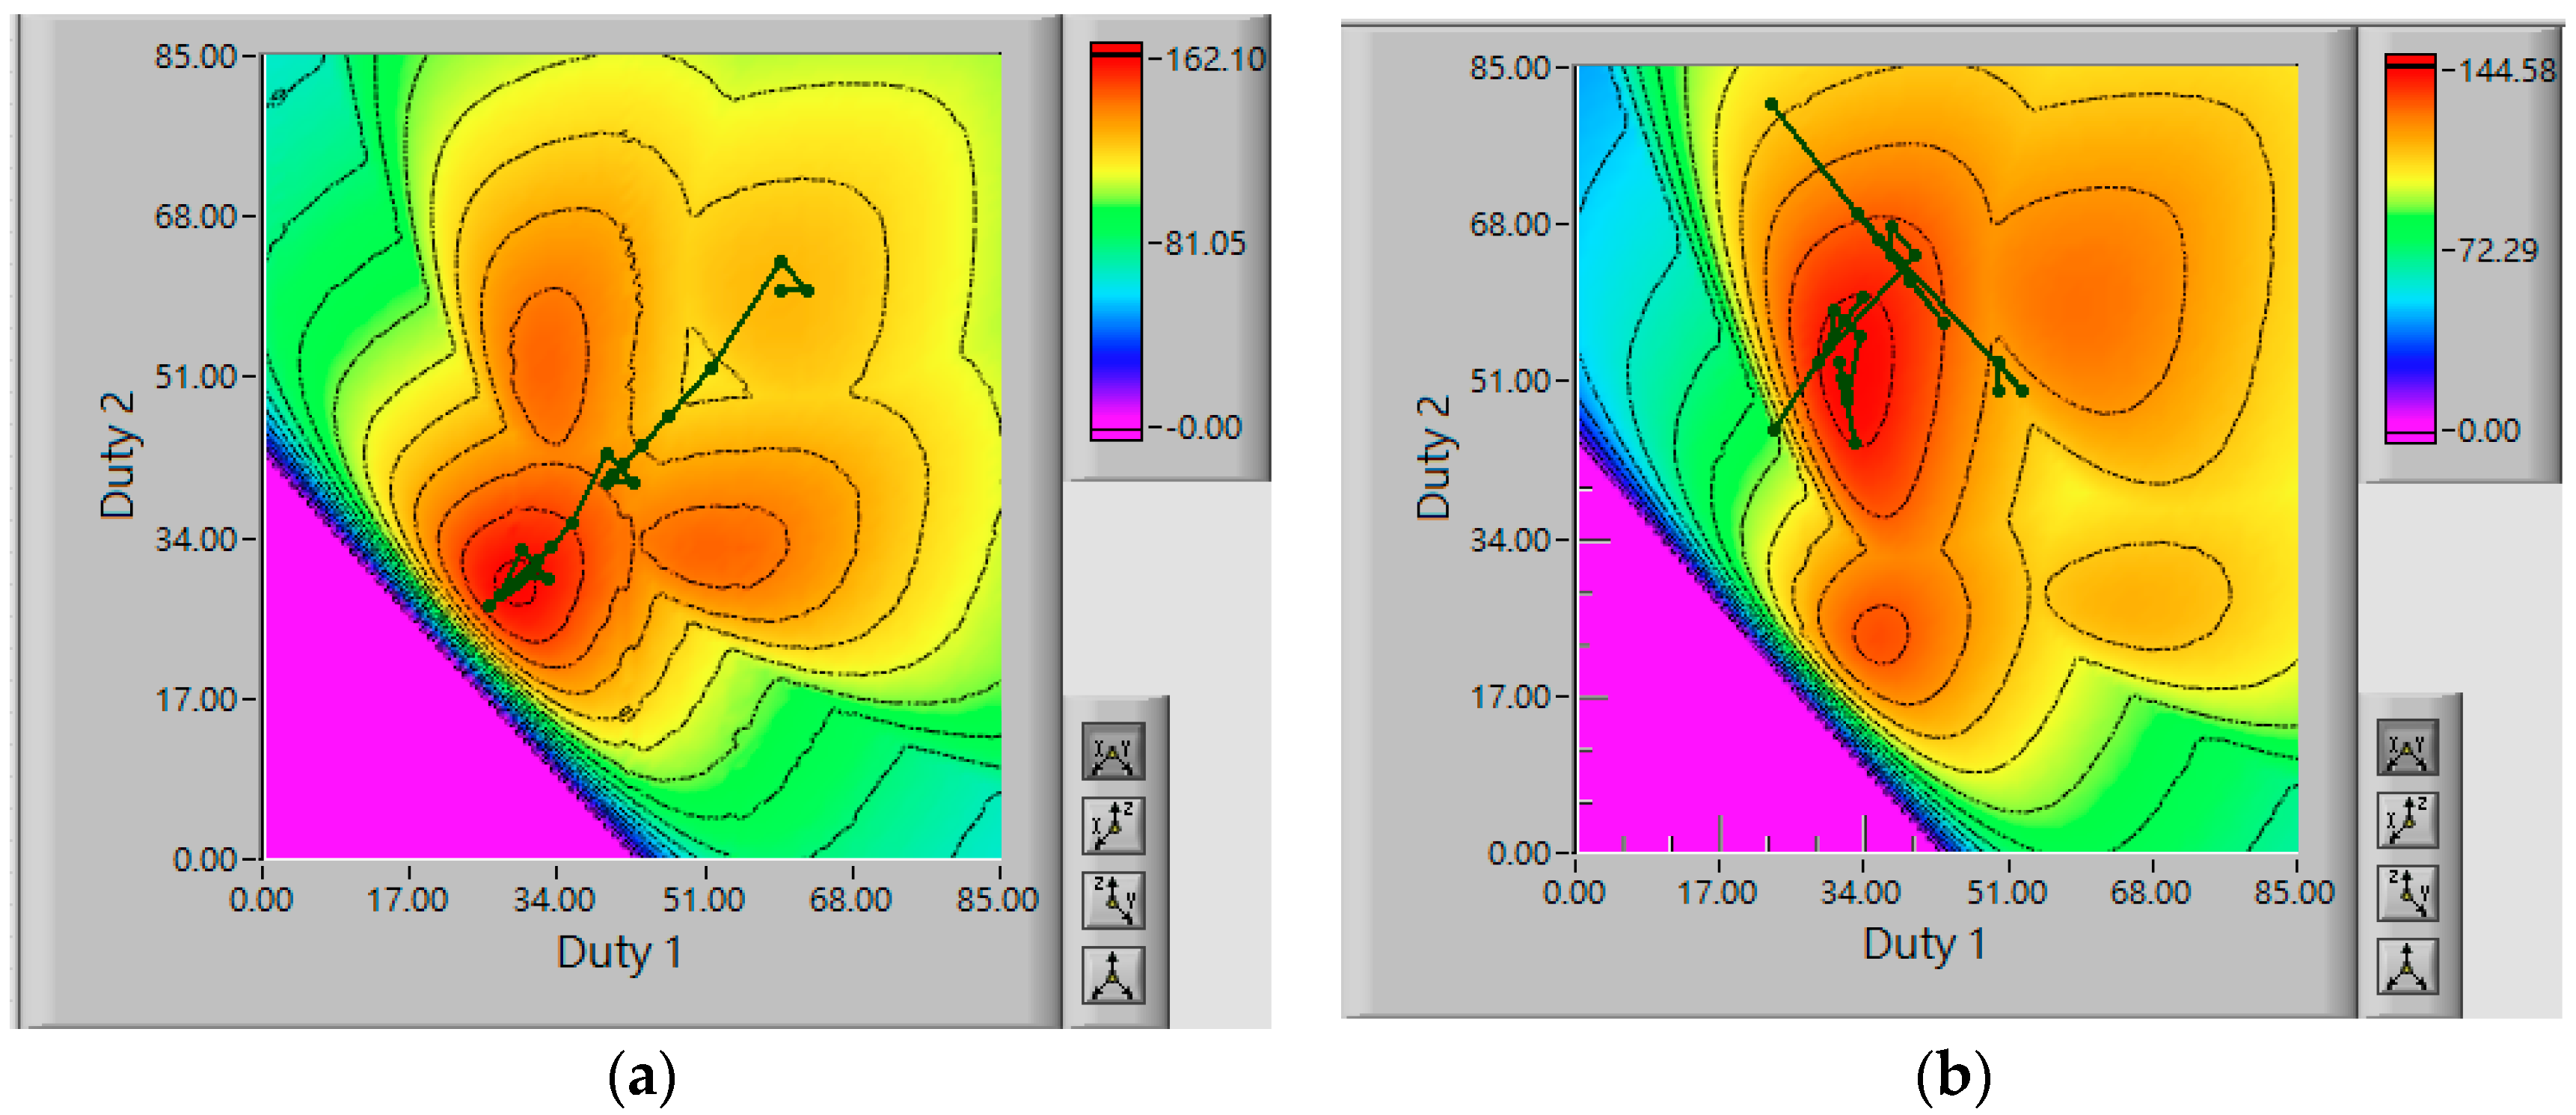
The characteristic of the PV system is presented by a two-dimensional plot for various combinations of duty ratios of MICs in any weather conditions. Let us now replace panel A (or B) in Figure 7 by two identical CSSS-90As with different insolations. This setup creates a possible scenario for a panel-level partial shading effect and thus multiple maxima (local or global) for the distributed two-panel system is demonstrated (see Figure 8). When panel A is partially shaded (using A1 and A2 in different insolations), and B has an identical shading condition, the system’s characteristic curve is shown by Figure 8a and A and B in different shading conditions in Figure 8b. The steepest descent (SD) MPPT simulation results are also shown in Figure 8, where the tracking process can be monitored. In both cases, the steepest gradient method with the golden section linear search method can easily find the global maximum power point of the system under consideration. If one starts tracking at its local maximum, the line search will adjust the control variables to move toward a higher output point. After three to four searching loops, it reaches close to the global maximum power point.
3.2. Experiment of the Photovoltaic System
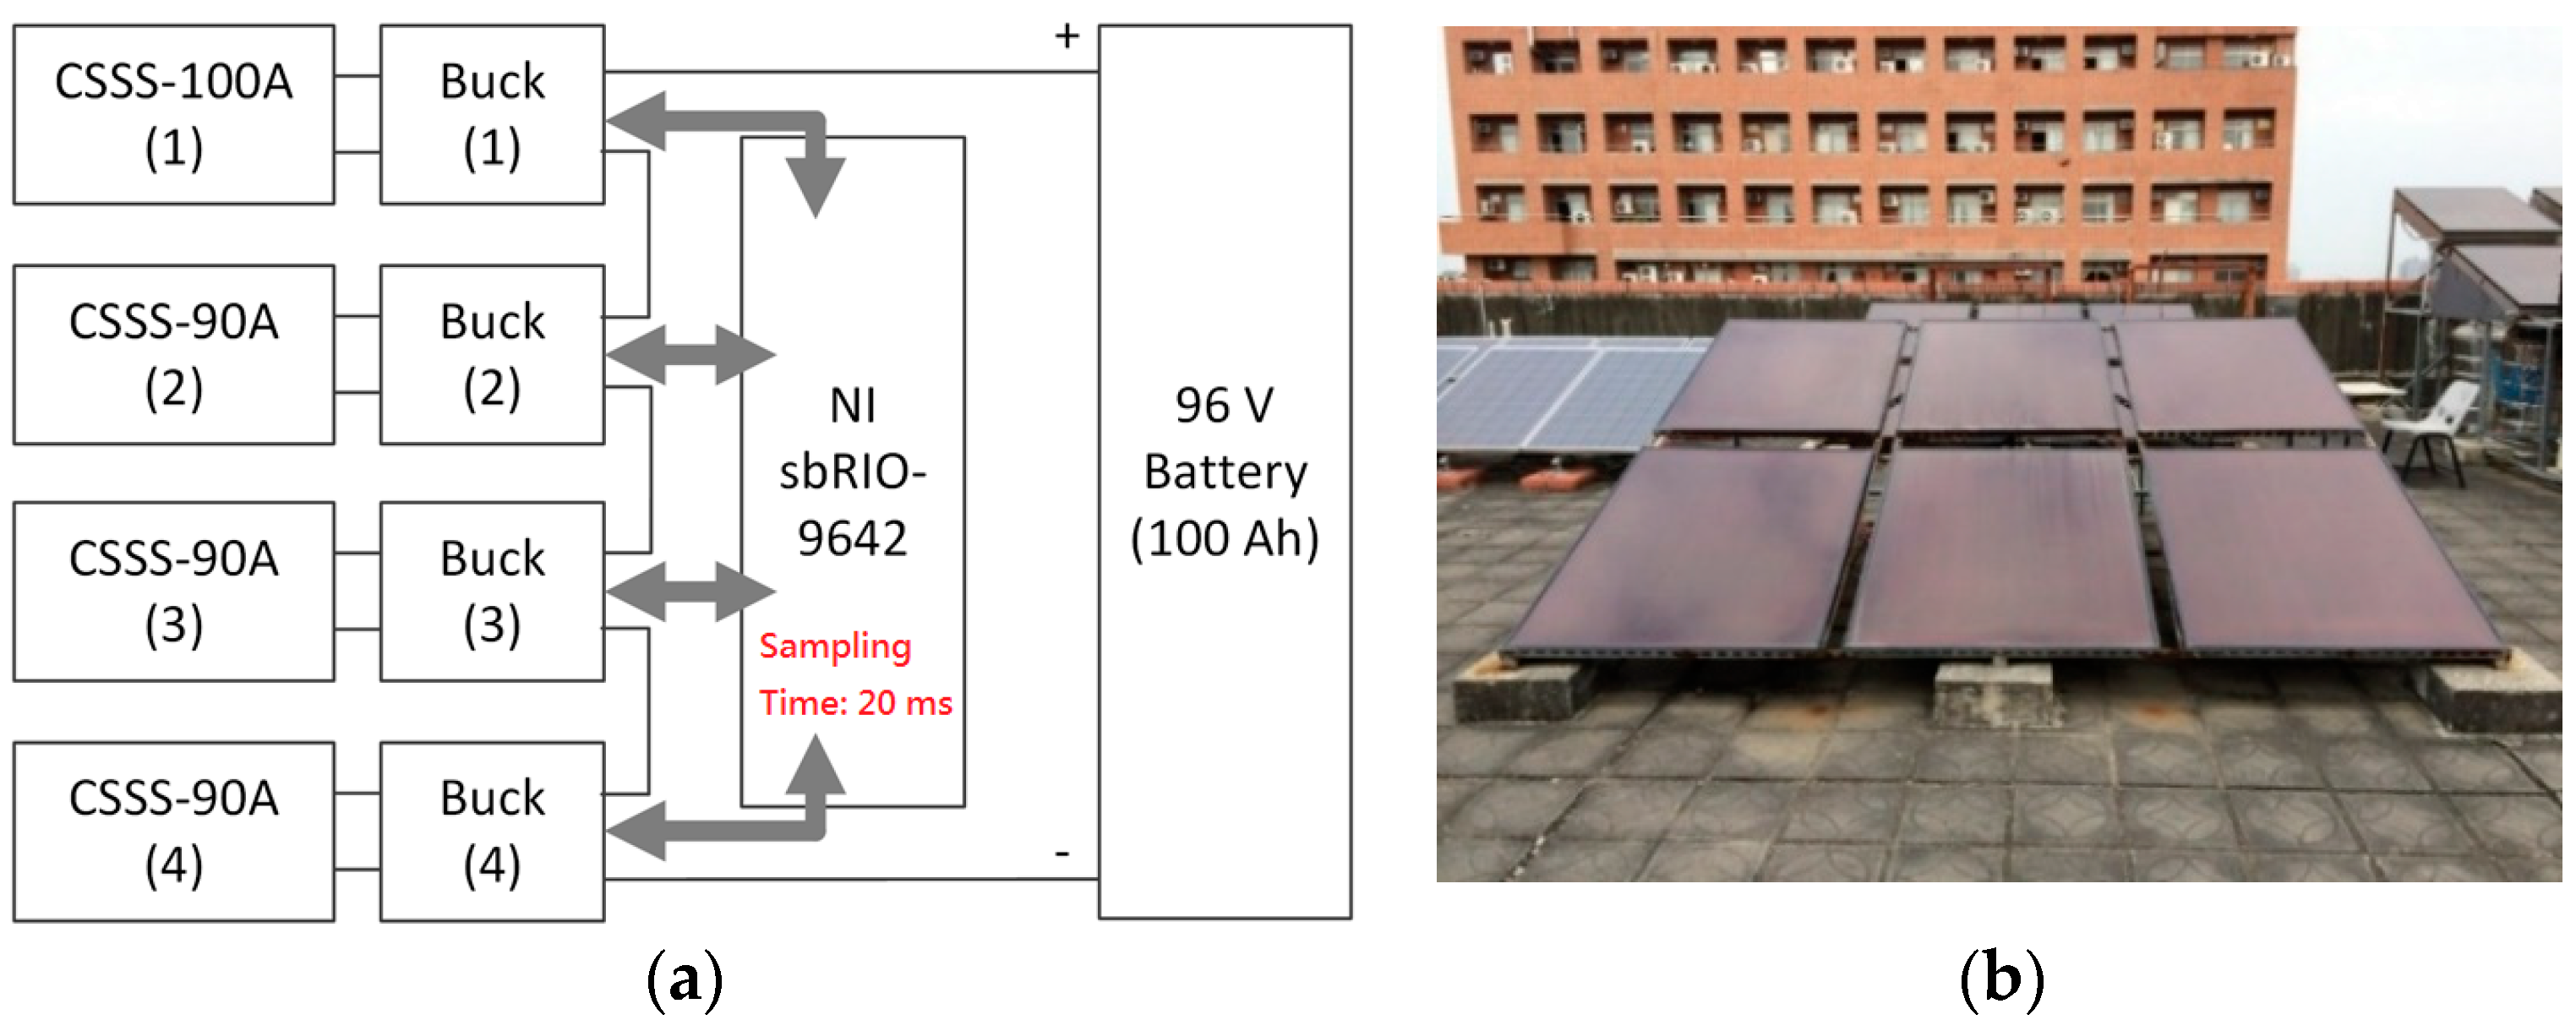
The experimental setup for the global MPPT system is shown in Figure 9. The four thin-film photovoltaic panels are serially connected through their own buck converters and are then connected to a 96-V battery bank. Notice that the CSSS-100A is intentionally connected to the system to demonstrate an initial panel mismatch condition. The battery bank consists of eight 12-V valve regulated lead-acid batteries (EP100-12, 100 Ah, manufactured by BB Battery). The sampling time for the MPPT process is 20 ms, which is determined by the settling time of the sensing variable, i.e., the output current.
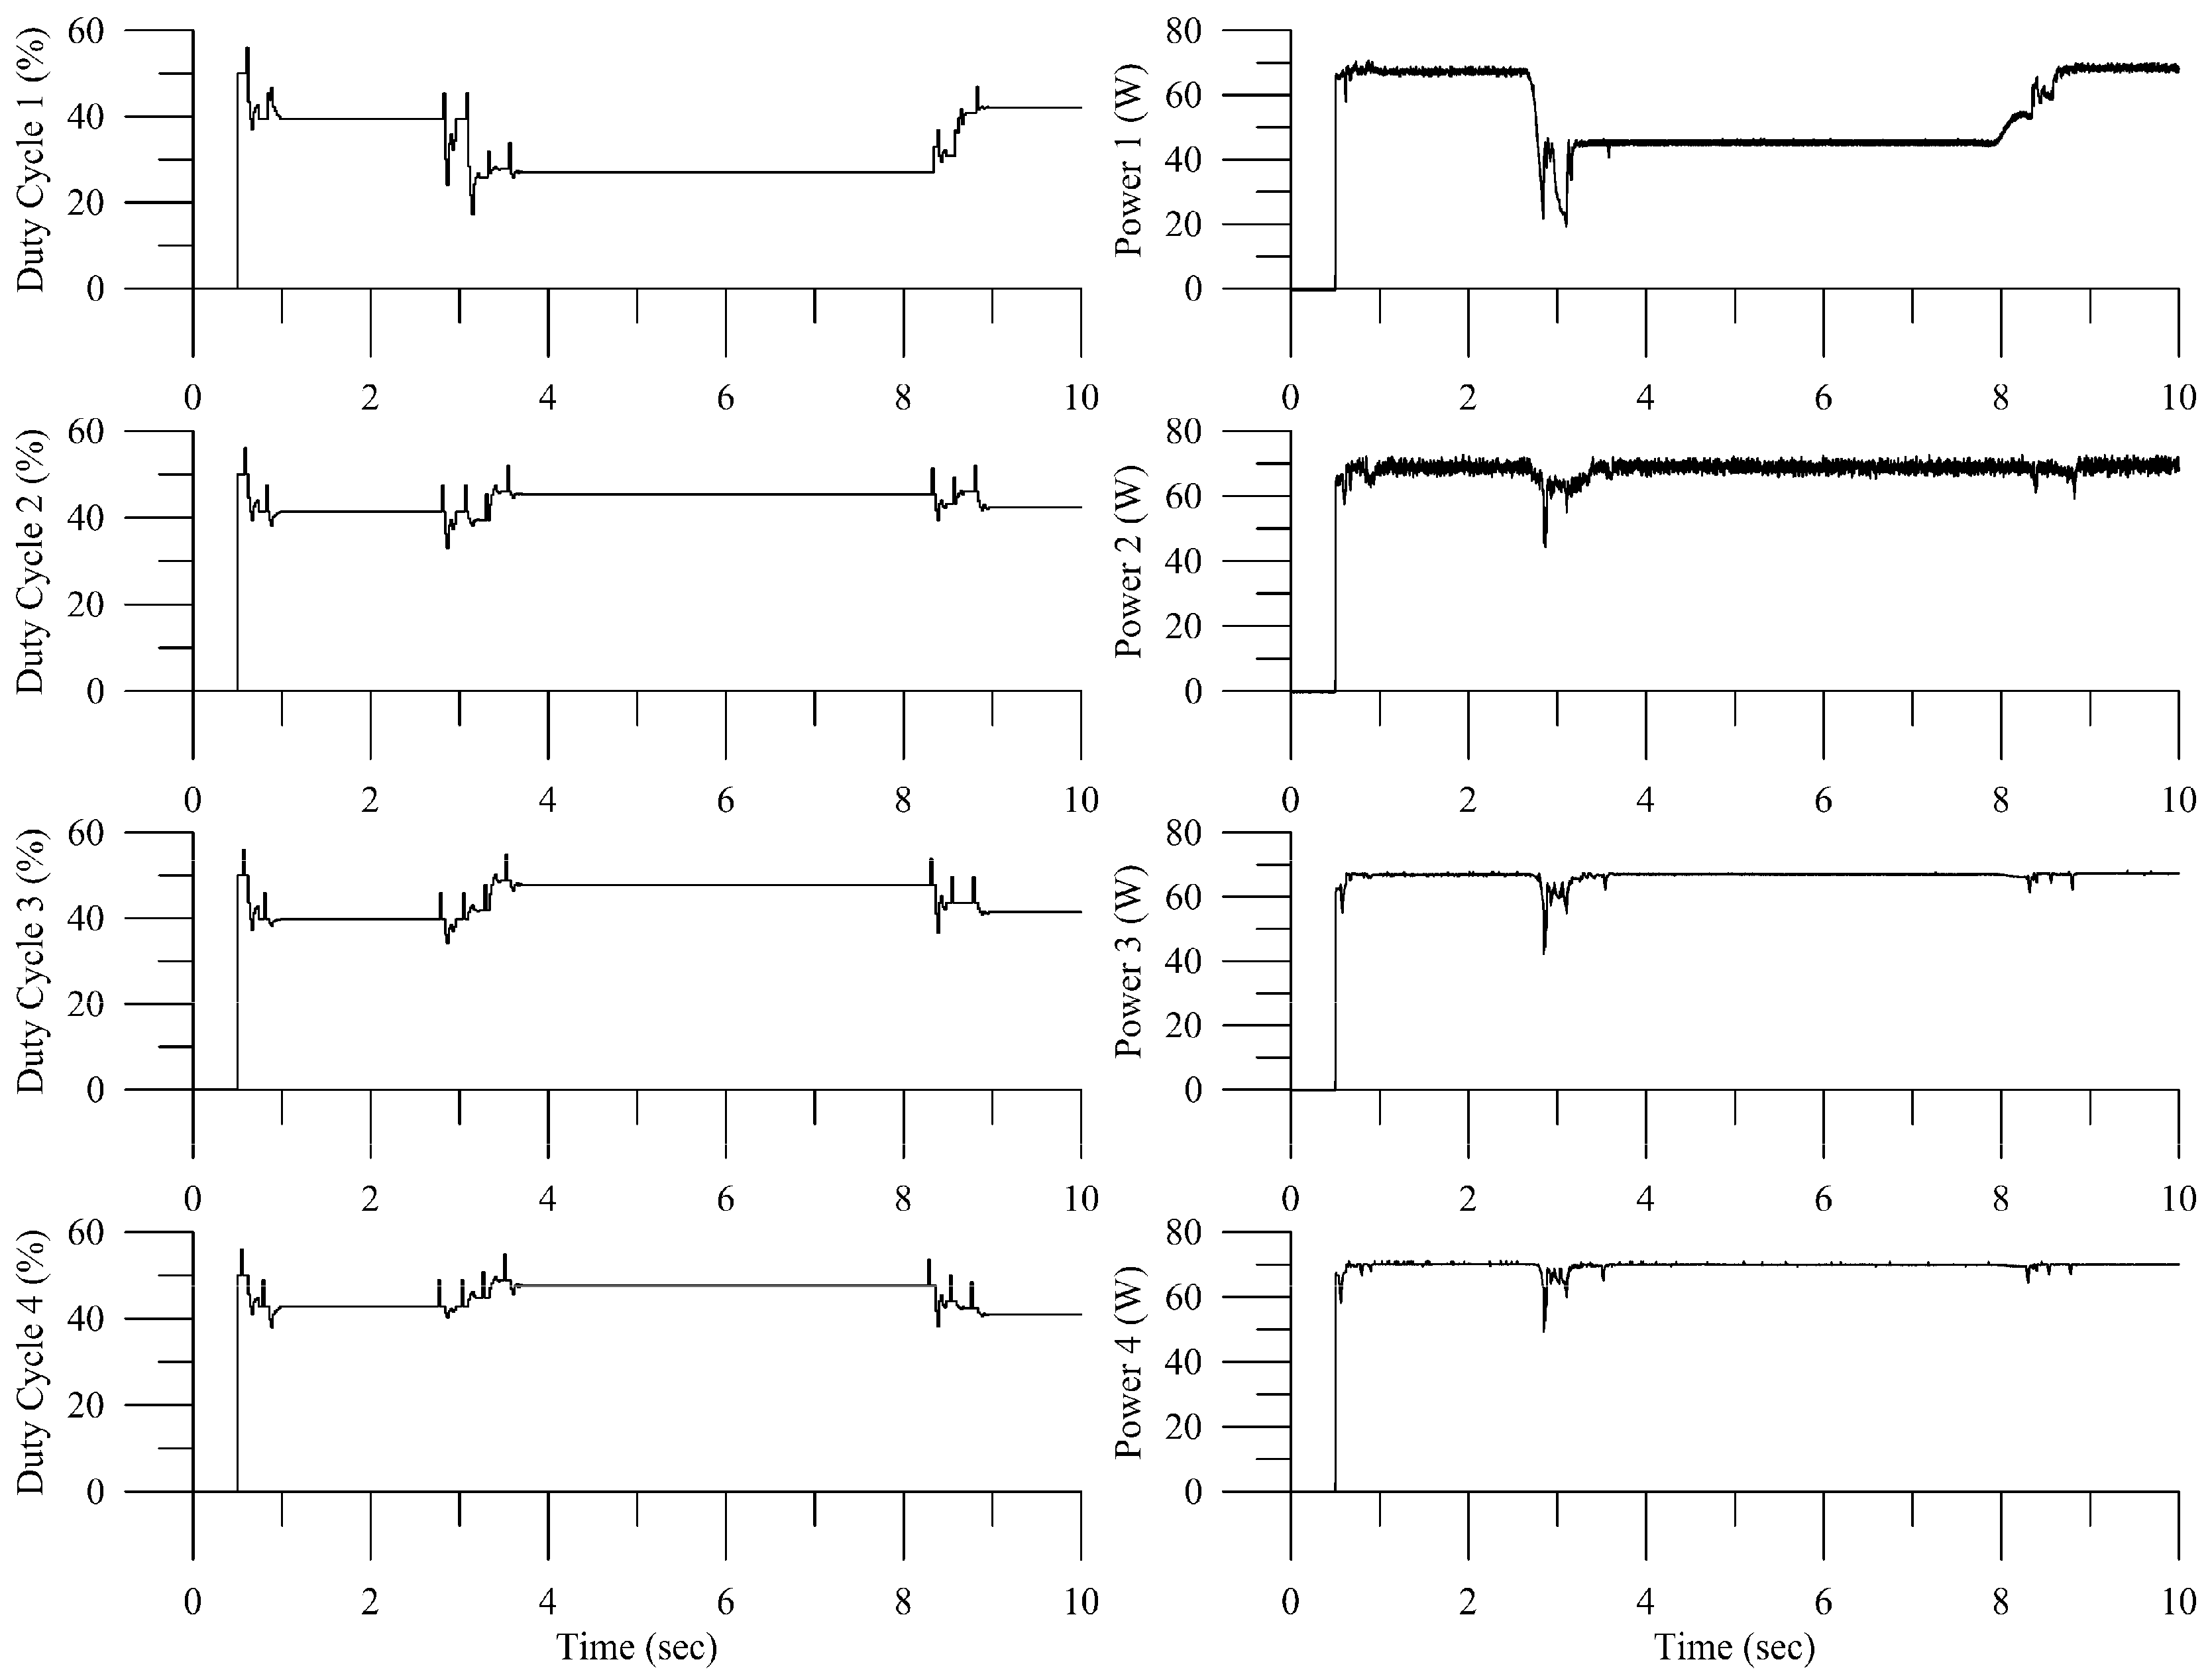
The global maximum power point tracking result by the proposed method at two different operating conditions is discussed; either the panel is unshaded or shaded. A sun visor of 50 cm by 60 cm is used to cover the upper-left corner of the PV panel, which counts for 19% of the surface area of the amorphous silicon PV panel. When the panels are not shaded, the global MPPT (GMPPT) algorithm finds the operation duties very close to the maximum power point within 200 ms and converges to a stable result within 500 ms. After that, the panels are tested in a sequentially shaded condition. When the first panel is shaded, the GMPPT adjusts the output duties for every MIC, causing an output power disturbance for every PV panel. Eventually, only the one with a shading visor has less power output, whereas others remain the same (see Figure 10). A similar result was obtained when the other panels were covered by the visor.
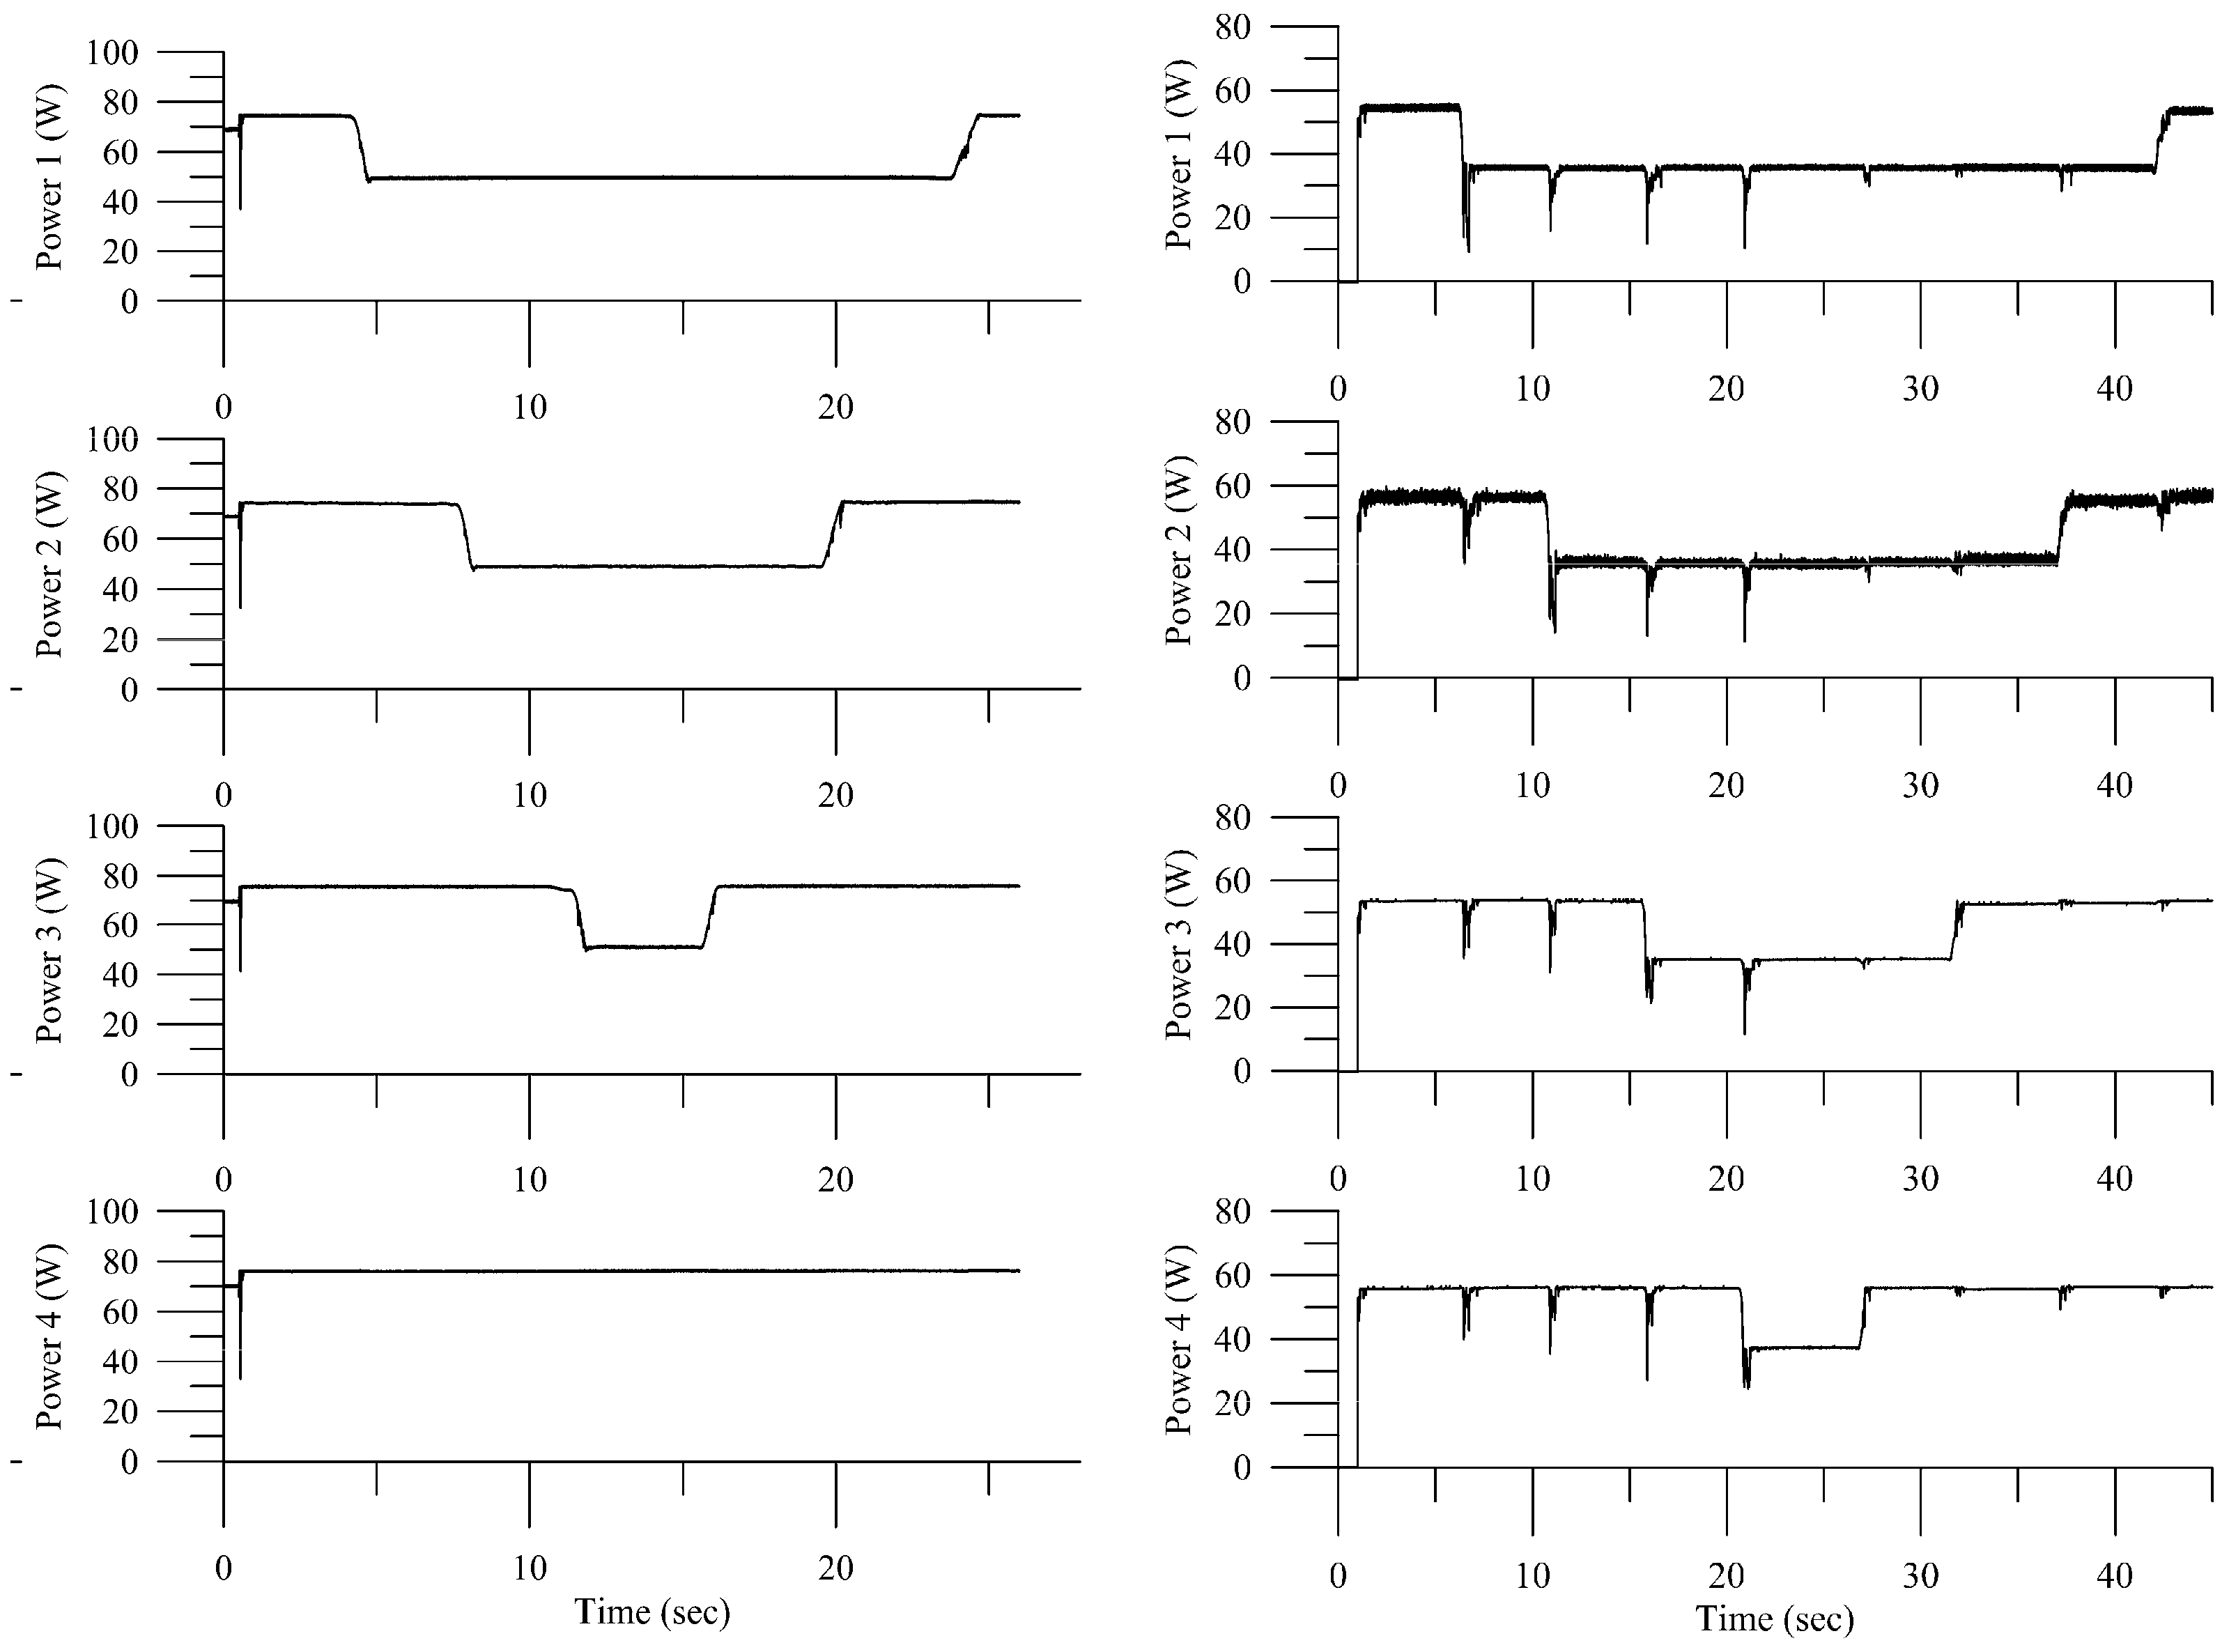
For the grid-connected experiment for the QM algorithm, the battery bank in Figure 9 is replaced by an Eaton 2000 inverter without the MPP tracker inside. It requires only 200 ms to reach its global maximum power point. For comparison, the two test results are shown in Figure 11. It is clearly shown that the use of the QM method has only a local effect during the tracking process, whereas the multivariable global tracking by the SD method results in extensive fluctuation at every power optimizer.
From the experiment result, the distributed PV system using the QM MPPT algorithm usually has a faster convergence speed than the system using the SD method. However, the use of the QM method requires power measurement and PI voltage regulation at each panel, and the SD method can tune the control duty simultaneously with less set up cost. More simulation results for a larger PV system using the SD MPPT algorithm are shown in Table 1. The tracking time and accuracy are within satisfactory confidence intervals.
4. System Evaluation
Since the use of the QM or the SD MPPT algorithm involves different hardware setups for a distributed PV system, the following application only refers to the QM MPPT method with PI voltage regulation at the power converter.
4.1. Grid-Connected Application
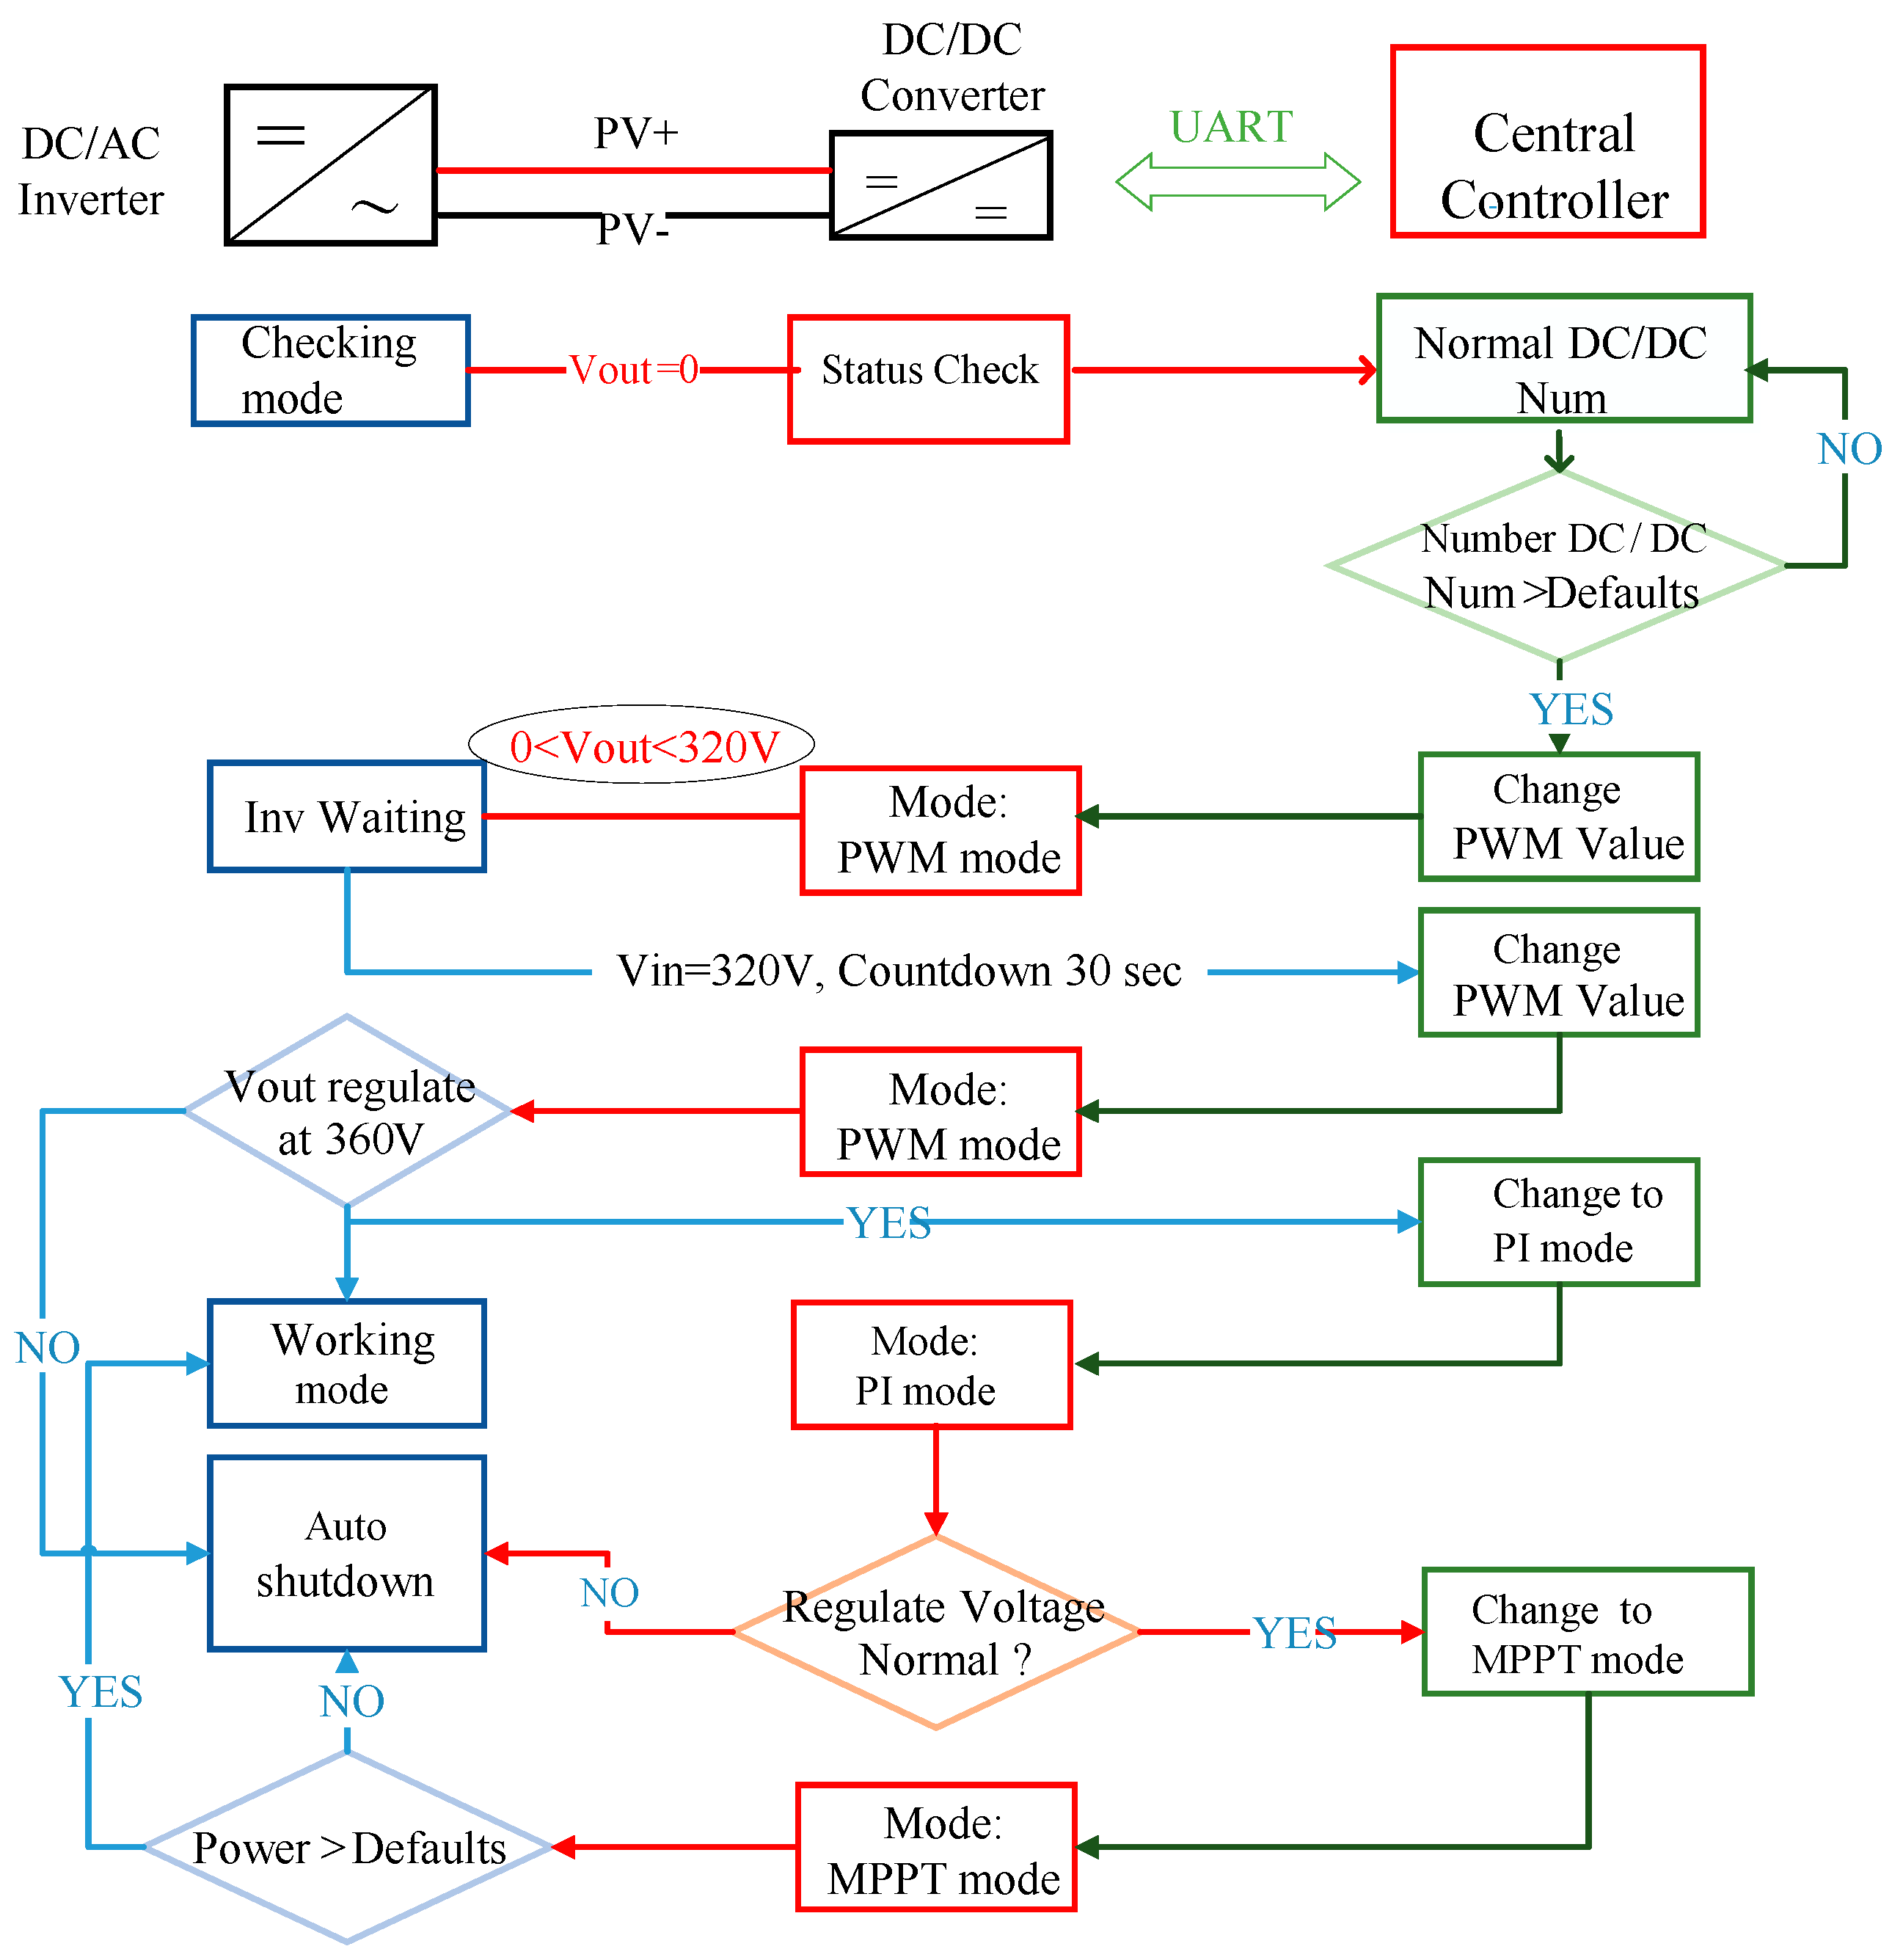
In order to test the proposed distributed PV system, a grid-connected solar inverter is required. Since there are a lot of safety regulations to be met if the PV system is going to connect to the grid, we work closely with PCM Powercom Co., Taiwan, a famous inverter provider worldwide. The Solar King SLK-3000 is used on this project, where the MPPT function inside of the inverter is disabled, which will allow us to use the QM algorithm on the PV side. The inverter starts power conversion when it detects a certain voltage level. The central controller is in charge of the communication between the converter and the inverter. Firstly, the controller boots up the converter using a PWM signal with the minimum power output, but the voltage level is high enough to wake up the inverter while it is in waiting mode. Secondly, the central controller is switched to PI mode to make sure the converter is working properly and the inverter is in working mode and is ready to convert the DC power into the grid line. Finally, the distributed system is on itself and running the proposed MPPT algorithm for maximum power conversion. If the converter responds with abnormal information, the central controller will call off the operation and the inverter will be shut down due to the low voltage value detected. The communication flow chart is shown in Figure 12.
Notice that the SG-2300 PV (Solar Gate, Taiwan) panel is used for an evaluation purpose and three different PV systems are tested. The centralized PV system uses eight panels in series, and the distributed PV system in an arc or flat format has only five panels. In general, without partial shading, the centralized PV (CPV) system generates 5~10% more solar energy. This is because the power optimizer consumes about 5% of energy to operate (around 10 W). In winter-time, the DPV system shows superior power output performance due to the shading effect. In a dust-rich environment in Taiwan, the labor cost to clean the PV panels in order for a PV system to maintain a reasonable power output is high. A distributed PV system can be a solution to help maintain PV power output while reducing the operation cost. Figure 13 shows the PV testing site at National Cheng Kung University (NCKU) and the power harvesting results for three PV systems.
4.2. Standalone PV Application: Solar Boat Design
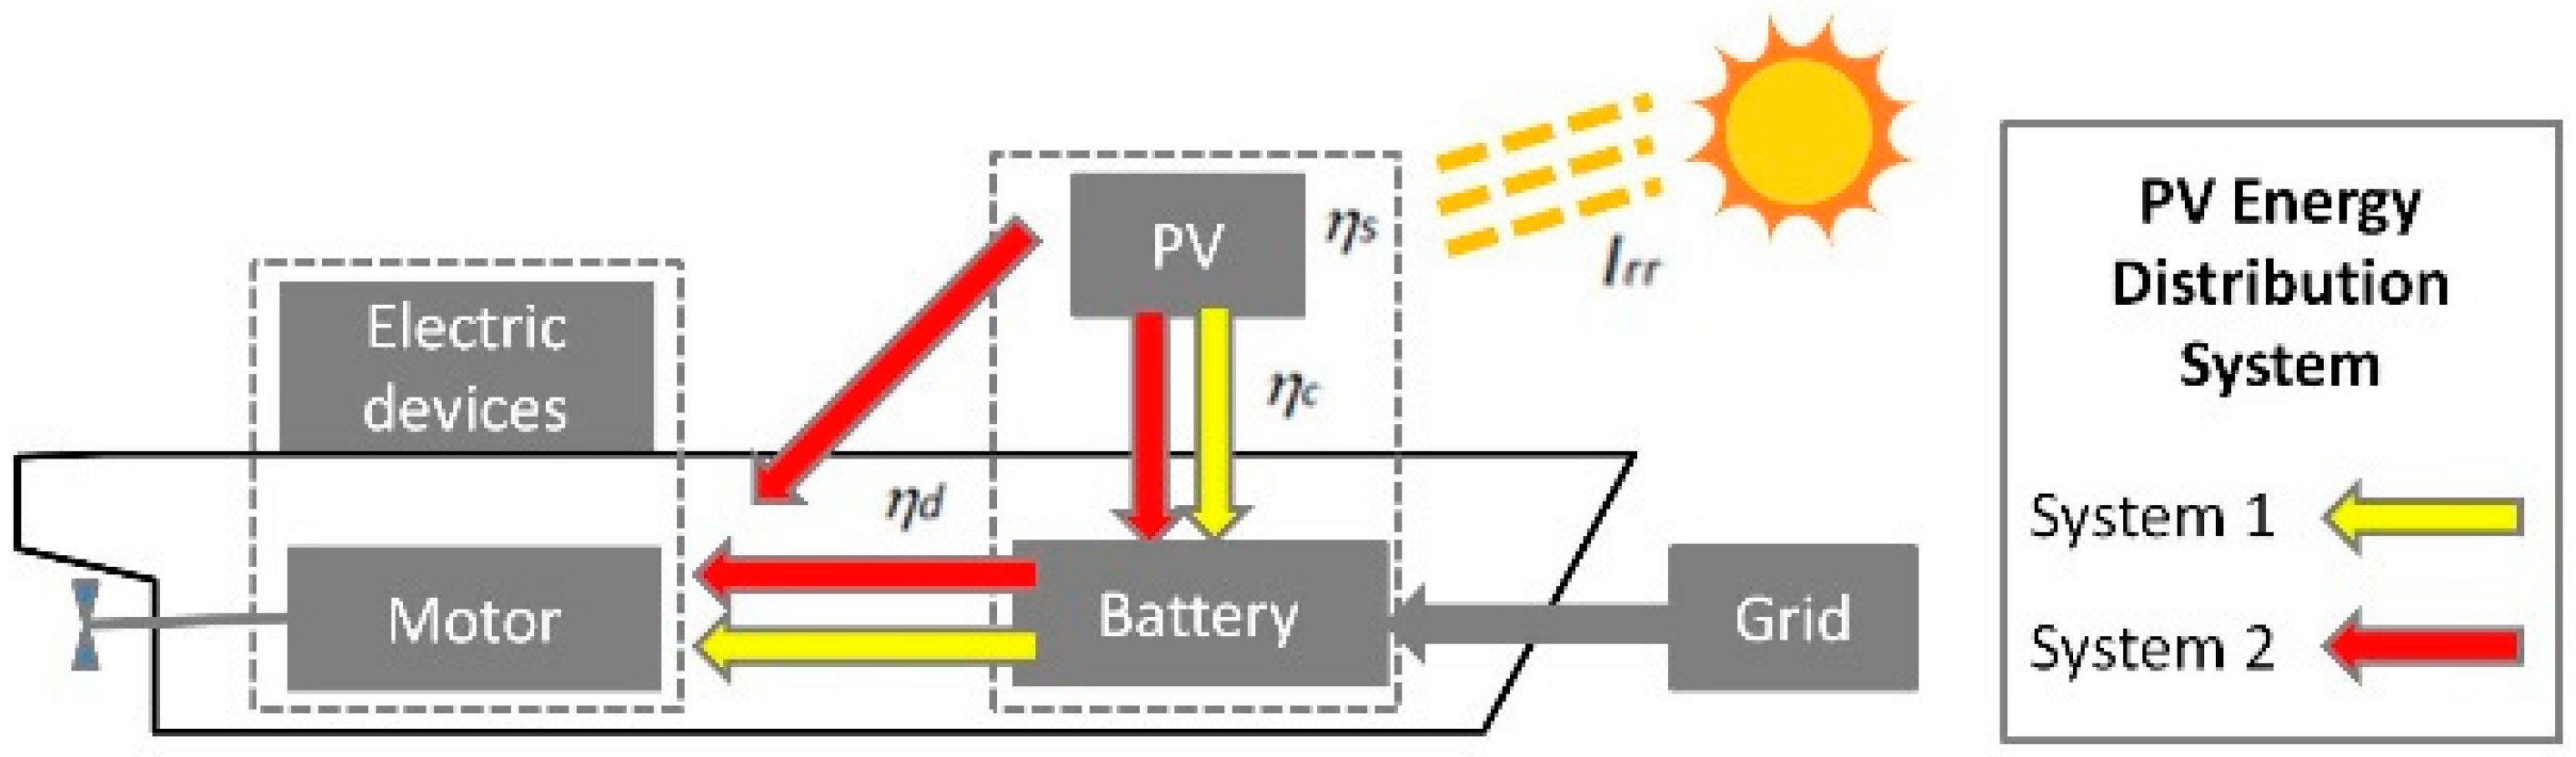
Every ship follows its routine preliminary design procedure in deciding the ship size and its hull form. When the resistance curve has been found, the power requirement to drive the vessel is determined. For a solar boat, the operation speed and the location of the PV panels and their weight, including the battery bank, will have a great impact on the overall performance of the vessel. The optimal design of a solar-powered catamaran has been discussed in [17]. Based on their design, up to 32 PV panels can be installed and the use of an AGM-type battery is more economical than using a Li-ion-type battery. Figure 14 compares two possible mechatronic systems that can be used for a solar boat. System 1 uses solar power as a secondary power source, which is usually the case. Most of the electric power relies on grid-power recharging while ducking at the harbor. It is simple, but it has less green power efficiency. System 2 directly feeds the solar electric power into the propulsion system while the ship is running. Without energy loss due to charging/recharging, System 2 uses solar energy as the primary electric source, and the capacity of the battery system can be reduced. This is exactly how a distributed PV system can contribute to this type of application.
A mechatronic system for a solar power boat, including the distributed PV system, a battery management system, and motor control and operation control systems, is proposed. The schematic diagram of the system is shown in Figure 15. The distributed PV system uses the MPPT controller, which is capable of connecting up to five PV panels. Each PV panel is connected to a dedicated power optimizer running in MPPT mode or PI mode for various power demands. The central controller communicates with the battery management system and the motor control system. If necessary, the onboard controller and the central controller can be integrated. The NI my-RIO FPGA embedded system also shows flexibility for system control and monitoring. Communication between the onboard controller and the motor uses the UART or Modbus protocol. When the catamaran is running at cruising speed, the central controller makes a request to the MPPT controller for the maximum power output. Otherwise, depending on the energy level of the battery system, it carefully controls the PV output to ensure that the battery system will not be overcharged. The central controller can control over four MPPT controllers for a maximum of 20 PV panels, which is equivalent to 5~6 kWp of solar power.
An example of a solar electric boat is realized by remodeling the one running on the Love River, Kaohsiung City. There are 18 PV panels in the 2P9S format, and the Li-ion battery system is 320 V for operation. Before remodeling, the vessel carried a 60 kW-h battery system. After remodeling, the vessel uses the distributed PV system for energy harvesting and only carries 33 kW-h of batteries. With a smaller battery storage capacity, the new system can run the same number of trips per day. However, obviously, the cost for the batteries is reduced by more than 45%.
5. Discussions and Conclusions
This paper provides an evaluation of two distributed PV systems with two different MPPT algorithms. Both PV systems can be applied to grid-connected or standalone applications with some modification. The distributed PV system using the QM MPPT algorithm requires only 200 ms to reach the maximum power point, and the SD method needs about 500 ms in an on-site test condition. The QM MPPT method is faster in convergence speed than the SD method. The QM method also has the advantage of providing better energy quality, since tracking one PV panel will not affect the output of other panels. However, the use of the QM method requires power measurement and PI voltage regulation at each panel, and the SD method can tune the control duty simultaneously with less set up cost. In a real world application, the shading effect caused by cloud movement is within a few seconds. The tracking speed for the SD method is still acceptable. A long-term test is still underway for the distributed PV system using the QM MPPT algorithm. The use of an arc-shaped design provides another opportunity for a PV application to be visually friendly to the community and helps to fine tune the control algorithm for the entire system to work as expected. When a distributed PV system is to be integrated with another power system to build up a smart home environment, the stochastic, adaptive, and dynamic control of the entire energy system can further minimize power loss [18], and scheduling deferrable appliances and energy resources can also increase the total efficiency of using renewable energy [19].
For the first time in history, the Taiwanese ship building industry can take advantage of a state-of-the-art solar energy harvesting system for leisure purposes. A distributed PV system can be integrated into a propulsion system and is directly connected to a battery bank for motor operation. Most of the time, solar energy is used only for auxiliary equipment, such as light and a secondary battery bank. The endurance of the solar boat totally relies on the capacity of the battery bank carried onboard. By directly utilizing solar energy without unnecessary energy loss due to battery charging/discharging, the new design can instantly improve the energy efficiency by almost 28% (assuming that the charging/discharging efficiency is 85%). Besides this, the cost of a Li-ion battery is at least 3 times greater than that of a gel-type lead-acid battery and the Li-ion battery management system for large capacity is very sensitive and vulnerable. Every five years, ship owners struggle with the replacement of a new battery system due to finance reasons. An independent study has shown that, after the optimal design of a solar boat, the total cost of the solar system for a 45-foot boat can be 6 times more if a Li-ion system is used rather than a lead-acid battery. However, a 1000 kg weight reduction is necessary for such a vessel. Properly defining the purpose of a solar boat and its operation mode will definitely help to promote solar systems to the ship-building industry. Also, one can use a dynamic and adaptive approach to reconfigure several renewables and to determine the distance between charging stations in order to minimize the daily operation cost [20]. Lastly, modeling the behavior of the captain with respect to the value of incentives [21] will make solar boats more attractive to the community. Hopefully, it will not be too long before we see a sustainable green vessel running at a site with beautiful scenery, such as the Sun Moon Lake in Taiwan.
6. Patents
The following patents issued by Intellectual Property Office, Taiwan, ROC are also included in this work: I409611, I499887, I514714, M547776, and M550516.
Author Contributions
Conceptualization, R.-M.C.; Methodology, R.-M.C. and S.-H.K.; Validation, H.-K.L.; Investigation, I.-K.W. and S.-H.K.
Acknowledgments
The support by the Ministry of Science and Technology under MOST 104-2221-E-006-255-MY3 and 106-2622-E-006-031-CC2 is acknowledged. The figures provided by A. Nasirudin and C. W. Hsieh are also acknowledged.
Conflicts of Interest
The authors declare no conflicts of interest.
References
- Paraskevadaki, E.V.; Papathanassiou, S.A. Evaluation of MPP voltage and power of mc-Si PV modules in partial shading conditions. IEEE Trans. Energy Convers. 2011, 26, 923–932. [Google Scholar] [CrossRef]
- Mäki, A.; Valkealahti, S.; Leppäaho, J. Operation of series-connected silicon-based photovoltaic modules under partial shading conditions. Prog. Photovolt. Res. Appl. 2012, 20, 298–309. [Google Scholar] [CrossRef]
- Kouchaki, A.; Iman-Eini, H.; Asaei, B. A new maximum power point tracking strategy for PV arrays under uniform and non-uniform insolation conditions. Sol. Energy 2013, 91, 221–232. [Google Scholar] [CrossRef]
- Bidram, A.; Davoudi, A.; Balog, R.S. Control and Circuit Techniques to Mitigate Partial Shading Effects in Photovoltaic Arrays. IEEE J. Photovolt. 2012, 4, 532–546. [Google Scholar] [CrossRef]
- Ishaque, K.; Salam, Z. A review of maximum power point tracking techniques of PV system for uniform insolation and partial shading condition. Renew. Sustain. Energy Rev. 2013, 19, 475–488. [Google Scholar] [CrossRef]
- Mohapatra, A.; Nayak, B.; Das, P.; Mohanty, K.B. A review on MPPT techniques of PV system under partial shading condition. Renew. Sustain. Energy Rev. 2017, 80, 854–867. [Google Scholar] [CrossRef]
- Walker, G.R.; Sernia, P.C. Cascaded DC-DC converter connection of photovoltaic modules. In Proceedings of the IEEE 33rd Annual Power Electronics Specialists Conference, Cairns, Qld., Australia, 23–27 June 2002; Volume 1, pp. 24–29. [Google Scholar]
- Femia, N.; Lisi, G.; Petrone, G.; Spagnuolo, G.; Vitelli, M. Distributed maximum power point tracking of photovoltaic arrays: Novel approach and system analysis. IEEE Trans. Ind. Electron. 2008, 55, 2610–2621. [Google Scholar] [CrossRef] [Green Version]
- Petrone, G.; Ramos-Paja, C.A.; Spagnuolo, G.; Vitelli, M. Granular control of photovoltaic arrays by means of a multi-output Maximum Power Point Tracking algorithm. Prog. Photovolt. Res. Appl. 2012, 21, 918–932. [Google Scholar] [CrossRef]
- Miyatake, M.; Veerachary, M.; Toriumi, F.; Ko, H. Maximum power point tracking of multiple photovoltaic arrays: PSO approach. IEEE Trans. Aerosp. Electron. Syst. 2011, 47, 367–380. [Google Scholar] [CrossRef]
- Chao, R.M.; Nasirudin, A.; Wang, I.K.; Chen, P.O. Multicore PSO Operation for Maximum Power Point Tracking of a Distributed Photovoltaic System under Partially Shading Condition. Int. J. Photoenergy 2016. [Google Scholar] [CrossRef]
- Pai, F.S.; Chao, R.M.; O, S.H.K.; Lee, T.S. Performance Evaluation of Parabolic Prediction to Maximum Power Point Tracking for PV Array. IEEE Trans. Sustain. Energy 2011, 2, 60–68. [Google Scholar] [CrossRef]
- Ko, S.H.; Chao, R.M. Photovoltaic dynamic MPPT on a moving vehicle. Sol. Energy 2012, 86, 1750–1760. [Google Scholar] [CrossRef]
- Chao, R.M.; Ko, S.H.; Chen, P.L. Evaluation of a FPGA controlled distributed PV system under partial shading condition. Adv. Energy Res. 2013, 1, 97–106. [Google Scholar] [CrossRef]
- Chao, R.M.; Lin, H.K.; Wu, C.H. Solar-Powered Boat Design Using Standalone Distributed PV System. In Proceedings of the IEEE ICASI, Chiba, Japan, 13–17 April 2018. [Google Scholar]
- Chong, E.K.P.; Zak, S.H. An Introduction to Optimization, 2nd ed.; Wiley: New York, NY, USA, 2001. [Google Scholar]
- Nasirudin, A.; Chao, R.M.; Utama, I.K.A.P. Solar Powered Boat Design Optimization. Procedia Eng. 2017, 194, 260–267. [Google Scholar] [CrossRef]
- Rahmani-Andebili, M. Stochastic, adaptive, and dynamic control of energy storage systems integrated with renewable energy sources for power loss minimization. Renew. Energy 2017, 113, 1462–1471. [Google Scholar] [CrossRef]
- Rahmani-Andebili, M. Scheduling deferrable appliances and energy resources of a smart home applying multi-time scale stochastic model predictive control. Sustain. Cities Soc. 2017, 32, 338–347. [Google Scholar] [CrossRef]
- Rahmani-Andebili, M. Dynamic and adaptive reconfiguration of electrical distribution system including renewables applying stochastic model predictive control. IET Gener. Transm. Distrib. 2017, 11, 3912–3921. [Google Scholar] [CrossRef]
- Rahmani-Andebili, M.; Fotuhi-Firuzabad, M. An Adaptive Approach for PEVs Charging Management and Reconfiguration of Electrical Distribution System Penetrated by Renewables. IEEE Trans. Ind. Inf. 2018, 14, 2001–2010. [Google Scholar] [CrossRef]
Figure 1.
Two hardware designs for the distributed photovoltaic (DPV) system evaluation: (a) distributed maximum power point tracking (DMPPT) control; (b) multivariable MPPT control.
Figure 1.
Two hardware designs for the distributed photovoltaic (DPV) system evaluation: (a) distributed maximum power point tracking (DMPPT) control; (b) multivariable MPPT control.

Figure 2.
Schematic design of the MPPT controller for a distributed PV application.

Figure 3.
Front side of the direct current (DC)/DC optimizer with a heat pipe for a heat sink.

Figure 4.
Illustration of the quadratic maximization MPPT mechanism. Solid line, original PV curve; dashed line, quadratic approximated PV curve.
Figure 4.
Illustration of the quadratic maximization MPPT mechanism. Solid line, original PV curve; dashed line, quadratic approximated PV curve.

Figure 5.
Flowchart for the Modified Quadratic maximization (QM) MPPT algorithm. α = 0.625 and ε = 1.6.
Figure 5.
Flowchart for the Modified Quadratic maximization (QM) MPPT algorithm. α = 0.625 and ε = 1.6.

Figure 6.
Flow chart of the proposed global MPPT algorithm using the steepest descent method.

Figure 7.
Simulation configuration for two CSSS-90A PV panels connected in series (through a DC/DC converter).
Figure 7.
Simulation configuration for two CSSS-90A PV panels connected in series (through a DC/DC converter).
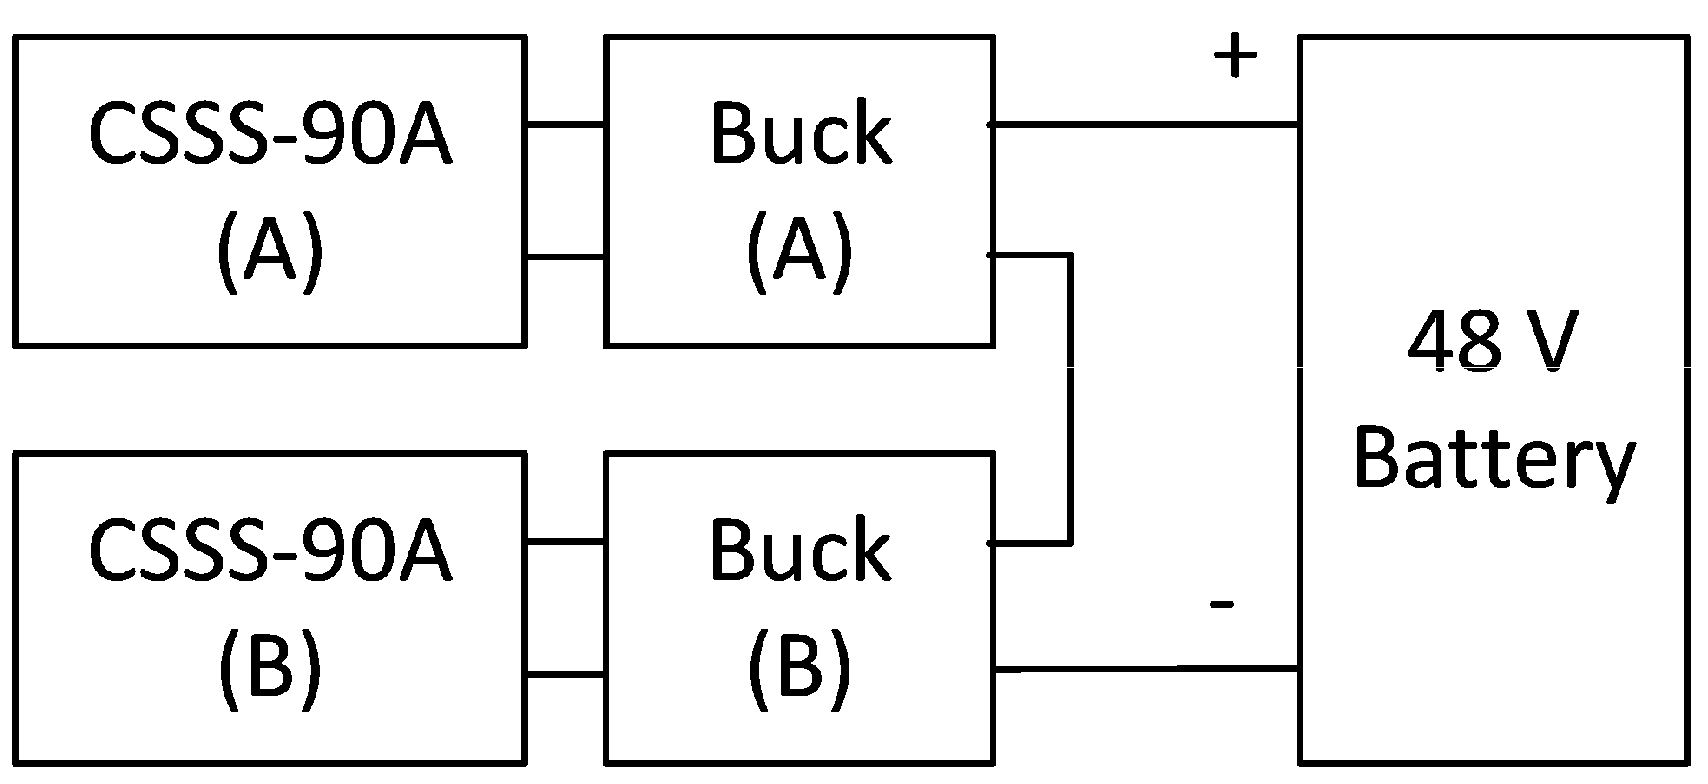
Figure 8.
Simulation results of a DPV system under various insolation conditions with the temperature set to 50 °C: (a) Panels A1 and B1 with S1 = 600 W/m2 and A2 and B2 with S2 = 1000 W/m2; tracking starts at duties = (60%, 60%); (b) Panel A1 with S3 = 400 W/m2 and A2 and B2 with S2 = 1000 W/m2, Panel B1 with S1 = 600 W/m2; tracking starts at duties = (50%, 50%).

Figure 9.
A distributed PV system: (a) design for the Global MPPT test using four PV panels, and (b) testing site at NCKU.
Figure 9.
A distributed PV system: (a) design for the Global MPPT test using four PV panels, and (b) testing site at NCKU.

Figure 10.
Global multidimensional MPPT transient results, where the first panel is partially shaded at time = 2.5 s, and the sun visor is removed at time = 8.0 s.
Figure 10.
Global multidimensional MPPT transient results, where the first panel is partially shaded at time = 2.5 s, and the sun visor is removed at time = 8.0 s.

Figure 11.
MPPT experimental result: Output power using modified QM with PI voltage control, where panels #1, #2, and #3 were sequentially partially shaded then unshaded (Left); Global multidimensional MPPT using the steepest descent method, where panels #1, #2, #3, and #4 were partially shaded then unshaded (Right).

Figure 12.
Flow chart for the communication among the inverter, converter, and central controller in a distributed PV system.
Figure 12.
Flow chart for the communication among the inverter, converter, and central controller in a distributed PV system.

Figure 13.
Distributed Solar system testing site at NCKU (a) showing arc-shaped and flat formats; and (b) the test result of CPV, DPV (Flat), and DPV (Arc).
Figure 13.
Distributed Solar system testing site at NCKU (a) showing arc-shaped and flat formats; and (b) the test result of CPV, DPV (Flat), and DPV (Arc).
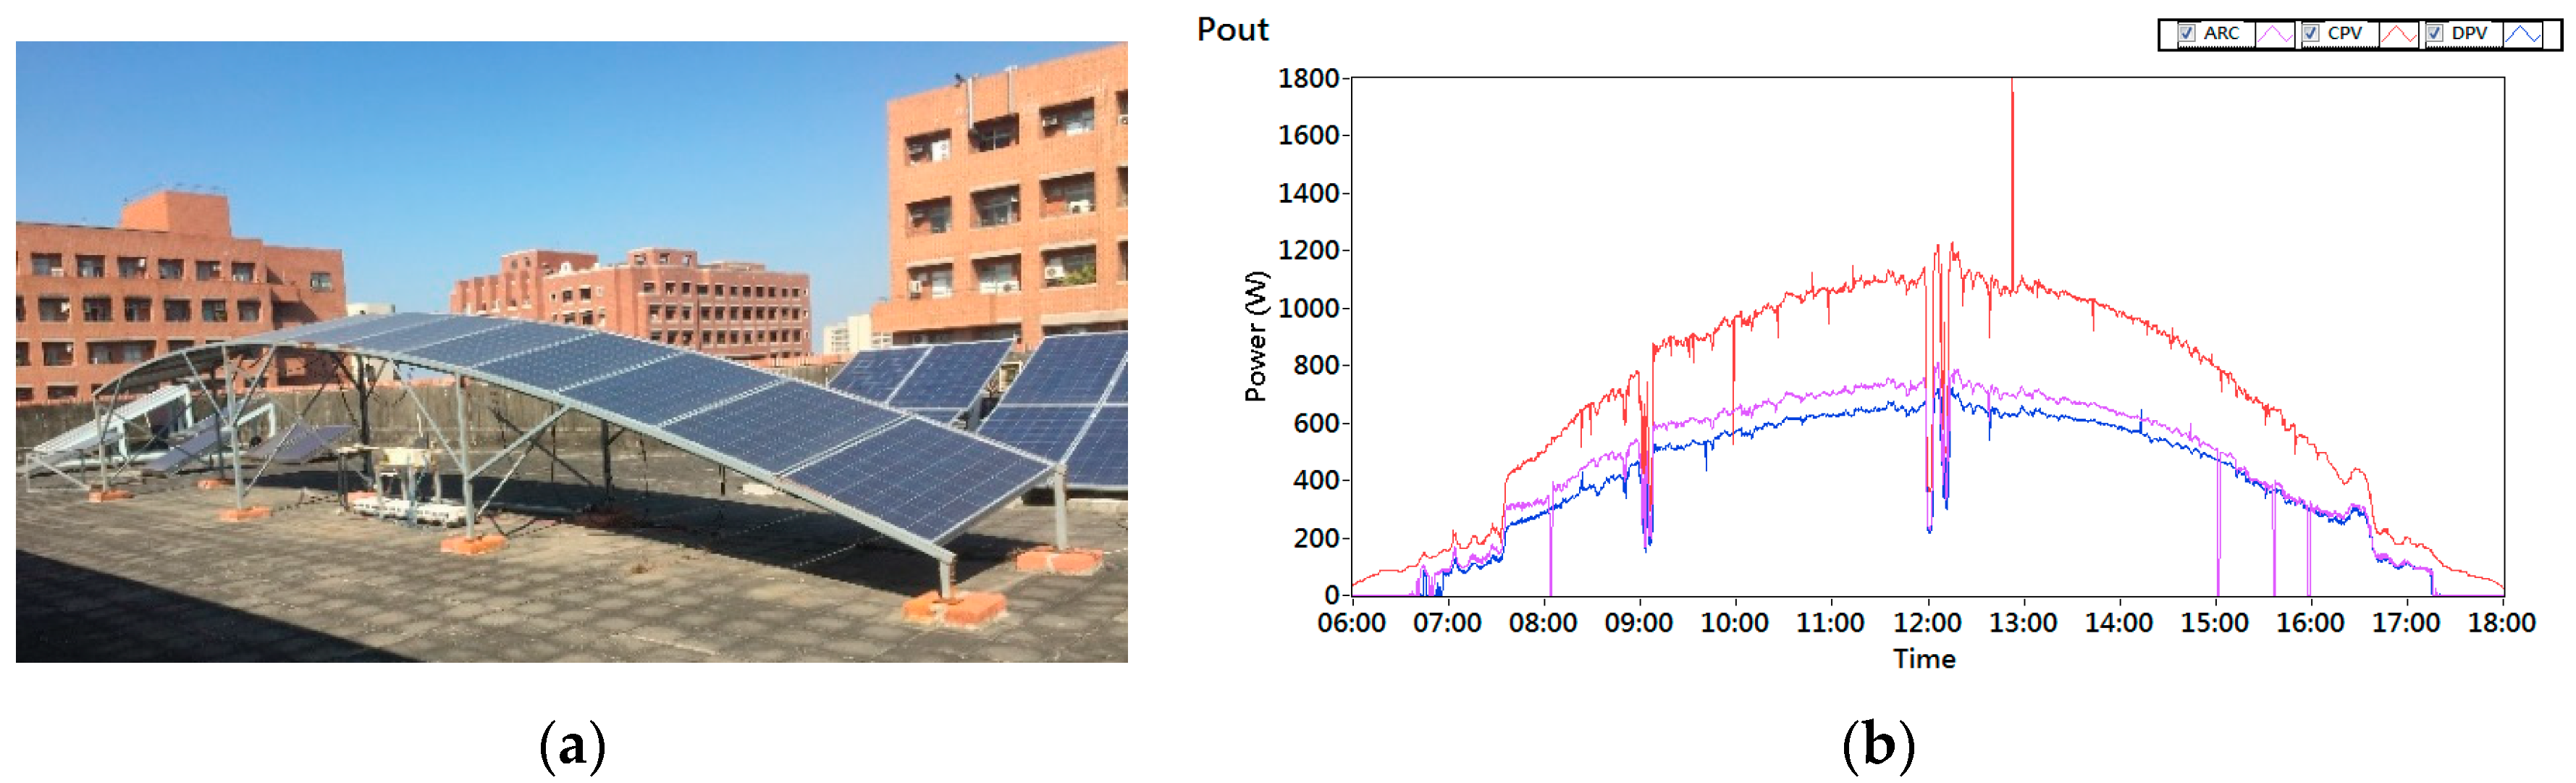
Figure 14.
Two types of mechatronic system design for a solar-powered boat.

Figure 15.
Schematic diagram for the solar boat mechatronic system. AC, alternating current.


Table 1.
Performance of the steepest descent maximum power point tracking (MPPT) algorithm using LabVIEW (National Instruments, USA).
Table 1.
Performance of the steepest descent maximum power point tracking (MPPT) algorithm using LabVIEW (National Instruments, USA).
| PV Panel | PV Format | Average Tracking Steps | Overall Accuracy, % | Accuracy w/o Shading % | Accuracy w/Shading % |
|---|---|---|---|---|---|
| 4 PV | 4S | 35.8 | 99.99 | 99.99 | 99.99 |
| 4 PV | 2P2S | 26.2 | 99.97 | 99.99 | 99.94 |
| 8 PV | 8S | 40.6 | 99.97 | 99.95 | 99.99 |
| 8 PV | 2P4S | 31 | 99.29 | 98.87 | 99.92 |
| 8 PV | 4P2S | 21.4 | 99.32 | 99.98 | 98.32 |
| 12 PV | 12S | 38.2 | 98.51 | 99.15 | 97.56 |
| 12 PV | 2P6S | 38.2 | 99.46 | 99.21 | 99.83 |
| 12 PV | 3P4S | 38.2 | 99.43 | 99.14 | 99.85 |
| 16 PV | 16S | 35.8 | 96.99 | 99.66 | 92.98 |
| 16 PV | 2P8S | 45.4 | 99.58 | 99.41 | 99.83 |
| 16 PV | 4P4S | 40.4 | 99.59 | 99.45 | 99.78 |
| 16 PV | 8P2S | 31 | 99.63 | 99.99 | 99.08 |
© 2018 by the authors. Licensee MDPI, Basel, Switzerland. This article is an open access article distributed under the terms and conditions of the Creative Commons Attribution (CC BY) license (http://creativecommons.org/licenses/by/4.0/).
Share and Cite
MDPI and ACS Style
Chao, R.-M.; Ko, S.-H.; Lin, H.-K.; Wang, I.-K. Evaluation of a Distributed Photovoltaic System in Grid-Connected and Standalone Applications by Different MPPT Algorithms. Energies 2018, 11, 1484. https://doi.org/10.3390/en11061484
AMA Style
Chao R-M, Ko S-H, Lin H-K, Wang I-K. Evaluation of a Distributed Photovoltaic System in Grid-Connected and Standalone Applications by Different MPPT Algorithms. Energies. 2018; 11(6):1484. https://doi.org/10.3390/en11061484
Chicago/Turabian StyleChao, Ru-Min, Shih-Hung Ko, Hung-Ku Lin, and I-Kai Wang. 2018. "Evaluation of a Distributed Photovoltaic System in Grid-Connected and Standalone Applications by Different MPPT Algorithms" Energies 11, no. 6: 1484. https://doi.org/10.3390/en11061484
Note that from the first issue of 2016, this journal uses article numbers instead of page numbers. See further details here.