Reducing Irradiation Damage in a Long-Life Fast Reactor with Spectral Softening

1
Department of Mechanical Engineering, The Colorado School of Mines, Golden, CO 80401, USA
2
Nuclear Science and Engineering, The Colorado School of Mines, Golden, CO 80401, USA
*
Author to whom correspondence should be addressed.
Energies 2018, 11(6), 1507; https://doi.org/10.3390/en11061507
Submission received: 4 May 2018
/
Revised: 1 June 2018
/
Accepted: 6 June 2018
/
Published: 9 June 2018
Abstract
:Long-life fast reactors receive considerable attention for their potential of using uranium efficiently, and because they can operate for extended periods without refueling. However, the main obstacle to achieving maximum operating times and fuel burnup is the neutron radiation damage that accumulates in the cladding and structural materials. Simulations of metal-fueled high-burnup fast reactors showed that the damage in these reactors’ cladding material reached 200 displacements per atom (dpa) long before the maximum burnup was achieved. One possibility for overcoming this problem is spectral softening, which would reduce the kinetic energy imparted to reactor materials when neutrons collide with them. In this work, we compared the peak irradiation damage in metal- and oxide-fueled fast reactors with that in equivalent reactors containing beryllium in the fuel and reflectors. We showed that the peak damage to the cladding in a metal-fueled reactor was reduced from 273 dpa to 230 dpa when beryllium was included in the core. In an oxide-fueled reactor, the peak damage to the cladding was reduced from 225 dpa to 203 dpa. All four reactors were operated with a core-average burnup of 112 MWd/kg of initial heavy metal (IHM), without reshuffling or refueling, and contained the same initial actinide mass profiles.
1. Introduction
The sustainability of nuclear power depends in large part on its economic competitiveness and its long-term impact on the environment. Fast-neutron spectrum reactors can achieve high levels of fuel burnup, which increases both the amount of electricity that a unit mass of fuel can produce, and the burnout of transuranic nuclides which give nuclear waste its long-term radioactive signature. Long-life fast reactors have been of interest for decades, in part because of their potential to run for extended periods without refueling, and to operate as a “nuclear battery” which could reduce both the cost and the proliferation risks associated with nuclear energy [1].
Advanced fast-reactor designs can achieve peak burnup values of over 500 MWd/kg of initial heavy metal (IHM) before the accumulation of fission products stops the chain reaction [2]. However, the main limiting factor in achieving maximum fuel burnup in fast reactors is the neutron damage to core structural and cladding materials. High-energy neutrons collide with atoms in these materials, and displace them from their equilibrium lattice positions. Over time, this leads to macroscopic changes in the materials, such as swelling and embrittlement, which can cause the core to deform, and the cladding to rupture. Studies of proposed Generation-IV fast-reactor systems showed that operating these cores produces damage levels ranging from 200 displacements per atom (dpa) to 250 dpa [3] in the cladding. At present, the best candidate material for these applications, HT-9 steel, was demonstrated to have damage levels of only ~200 dpa at temperatures below 873 K [4,5]. Advanced materials that could withstand higher dpa levels, and maintain their mechanical properties are in development [6]; however, they are unlikely to be available for practical use anywhere in the near term.
Past work showed that spectral softening could be used to reduce irradiation damage in a fission wave reactor [7]. The softer spectrum reduces the kinetic energy imparted to reactor materials when neutrons collide with them. Here, we compared the dpa levels in long-life fast-reactor cores with and without beryllium in the fuel and reflectors. Beryllium was proposed as an additive to uranium dioxide fuel for light-water reactors in order to improve its thermal conductivity [8], and beryllium reflectors were used in studies of liquid-metal-cooled fast reactors to improve their safety [9,10]. We showed that the addition of beryllium reduced the peak dpa in a mixed-oxide-fueled core from 225 dpa to 203 dpa, and in a metal-fueled core from 273 dpa to 230 dpa. In all cases, the average burnup level was 112 MWd/kgIHM, and was achieved without the refueling or reshuffling of fuel. All cores had the same initial mass of actinides, and fuel densities were adjusted where appropriate to accommodate the beryllium. A high degree of core-average burnup was achieved by axially and radially grading the initial plutonium content of the fuel so as to flatten the power profile. The cores included diluent regions of sodium to reduce neutron flux in the regions that otherwise experienced the greatest irradiation damage.
2. Results
The biggest obstacle to the practical implementation of a long-life fast reactor is the high degree of irradiation damage to in-core materials. However, spectral softening, and the use of diluent regions to reduce the peak neutron fluence to materials can be used in combination to overcome both problems. In the core designs presented in this work, a reduction in the relative population of high-energy neutrons was achieved through the use of beryllium-doped oxide fuel and beryllium reflectors. The axial and radial grading of the fresh fuel, along with the beryllium reflectors and a diluent region, flattened the power profile and allowed for a high core-average burnup before maximum allowable dpa levels were reached.
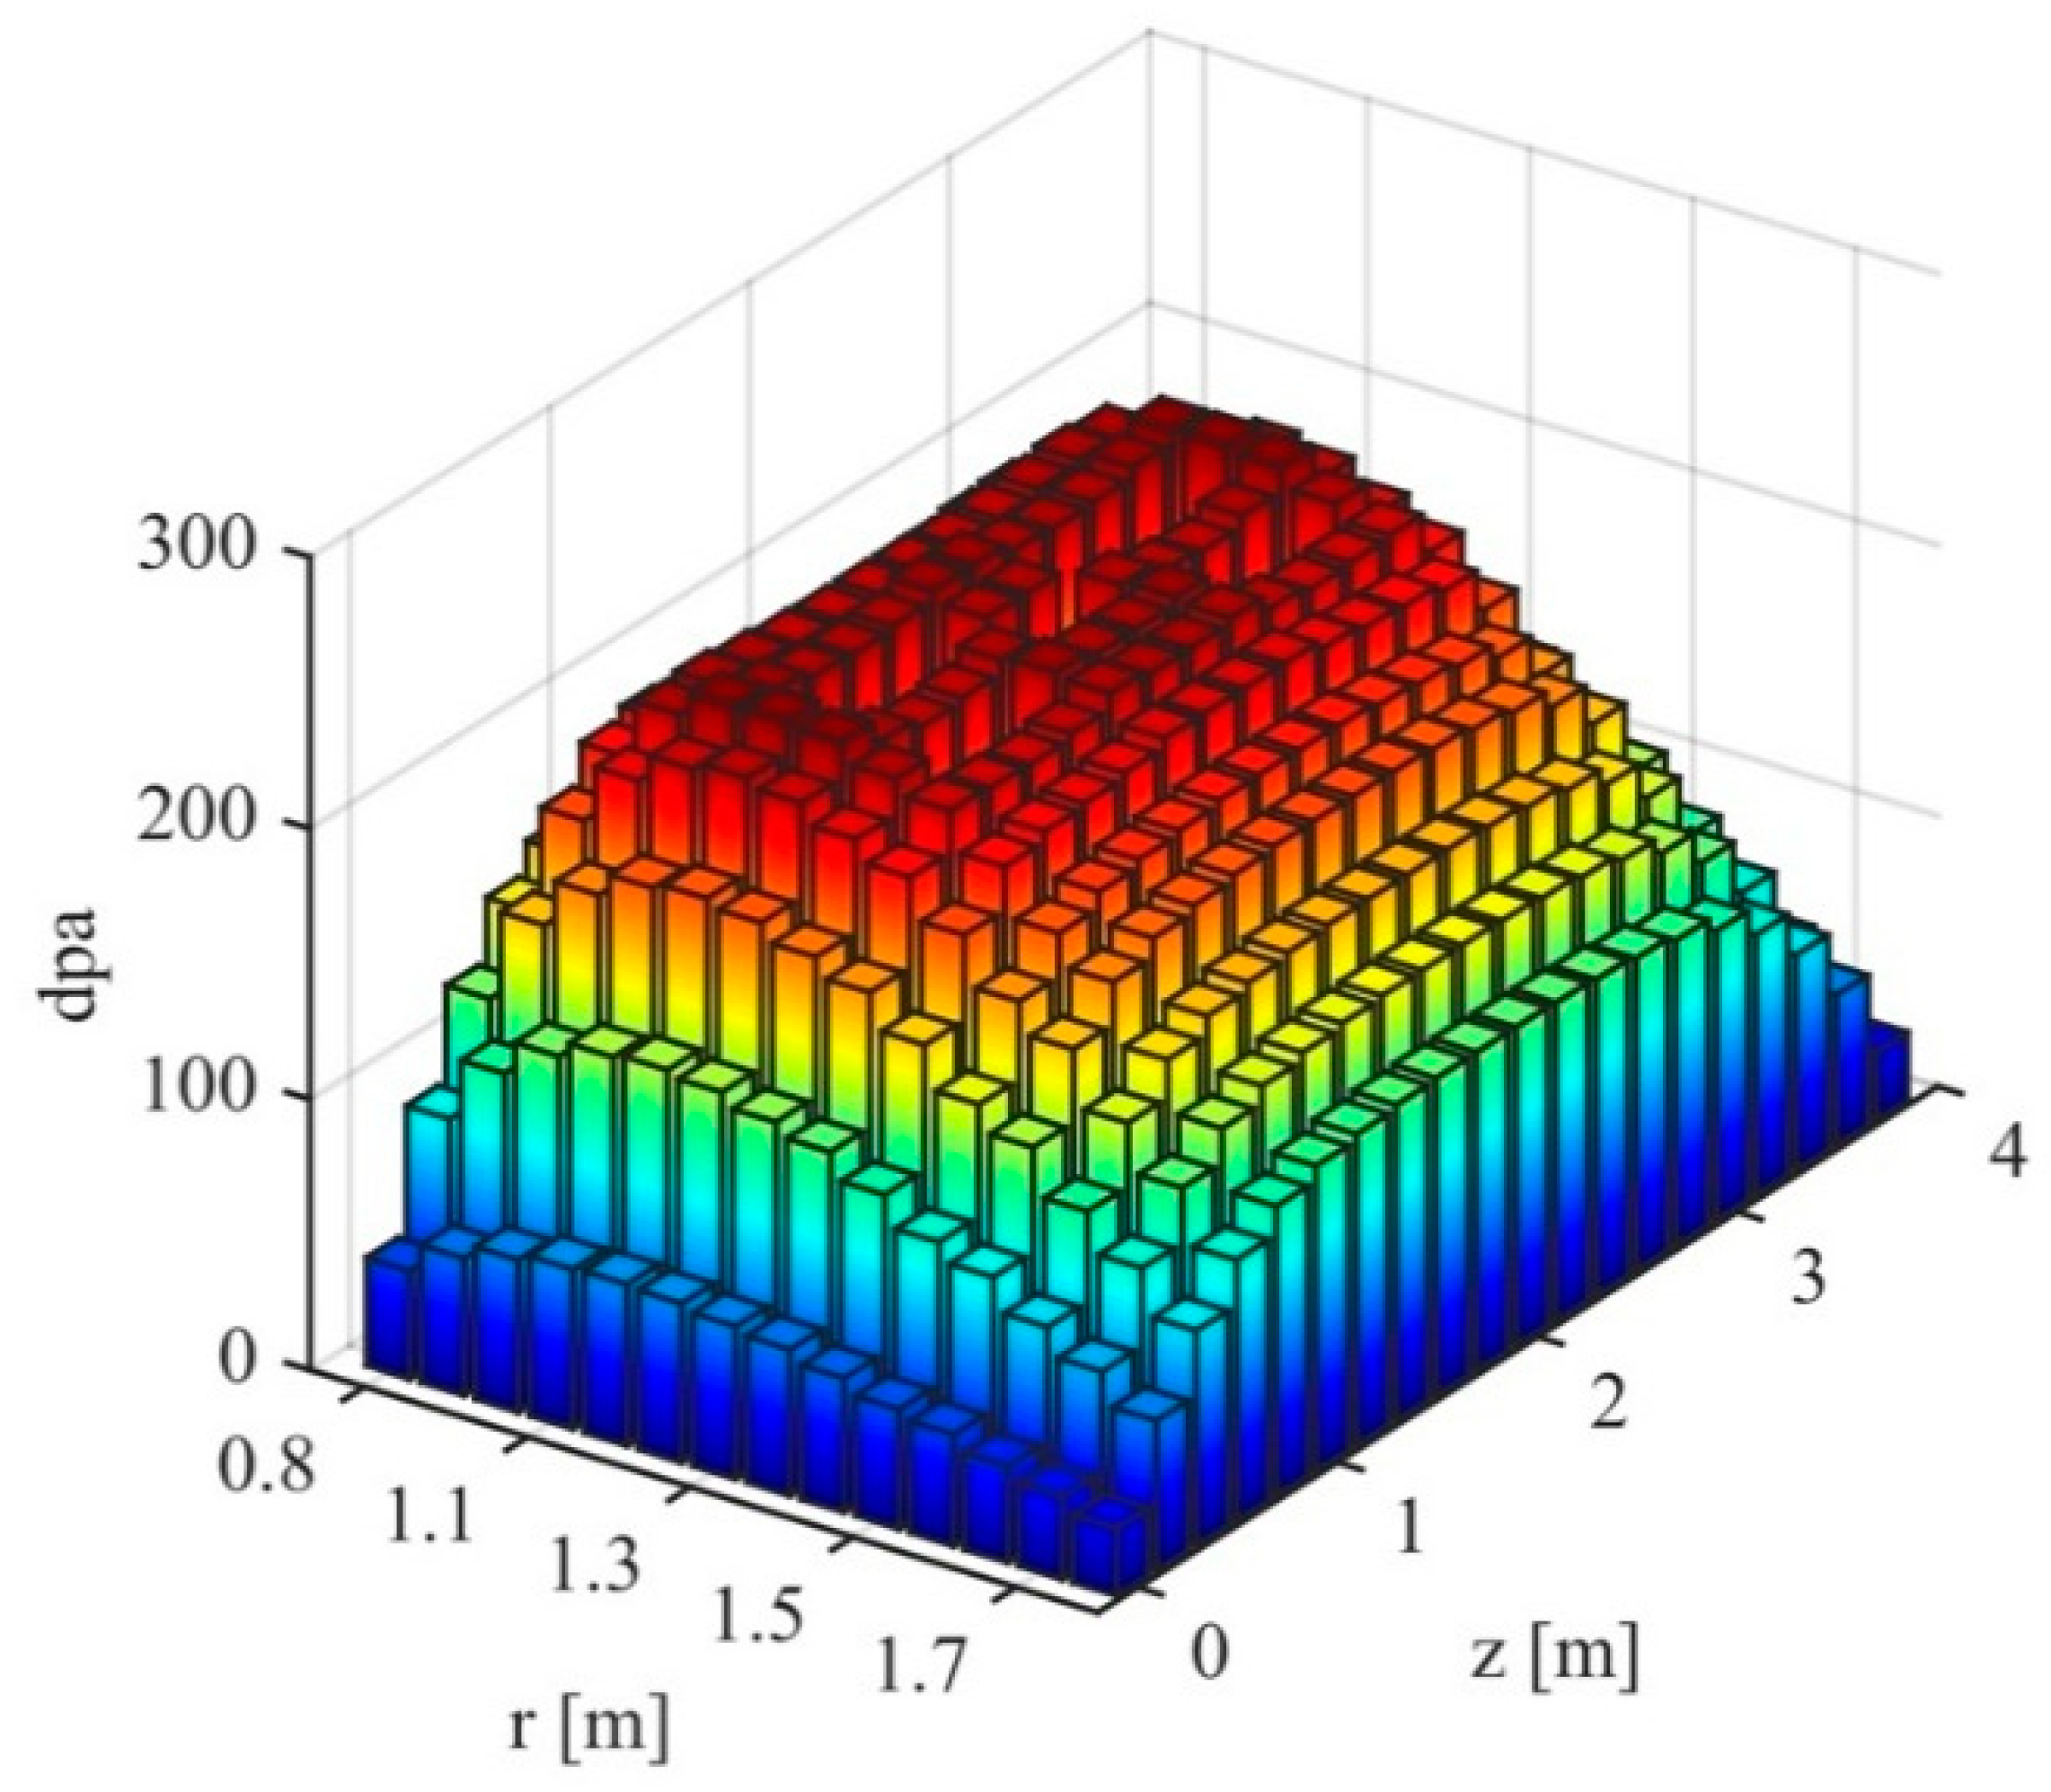
Figure 1 shows the dpa levels in the metal-fueled core, with sodium in the reflector regions and no beryllium in the fuel. The maximum cladding dpa occurred close to the inner region, and reached a level of 273 dpa at 8.4 years. The maximum damage levels were lower close to the reflectors due to lower overall fluence away from the center of the core.
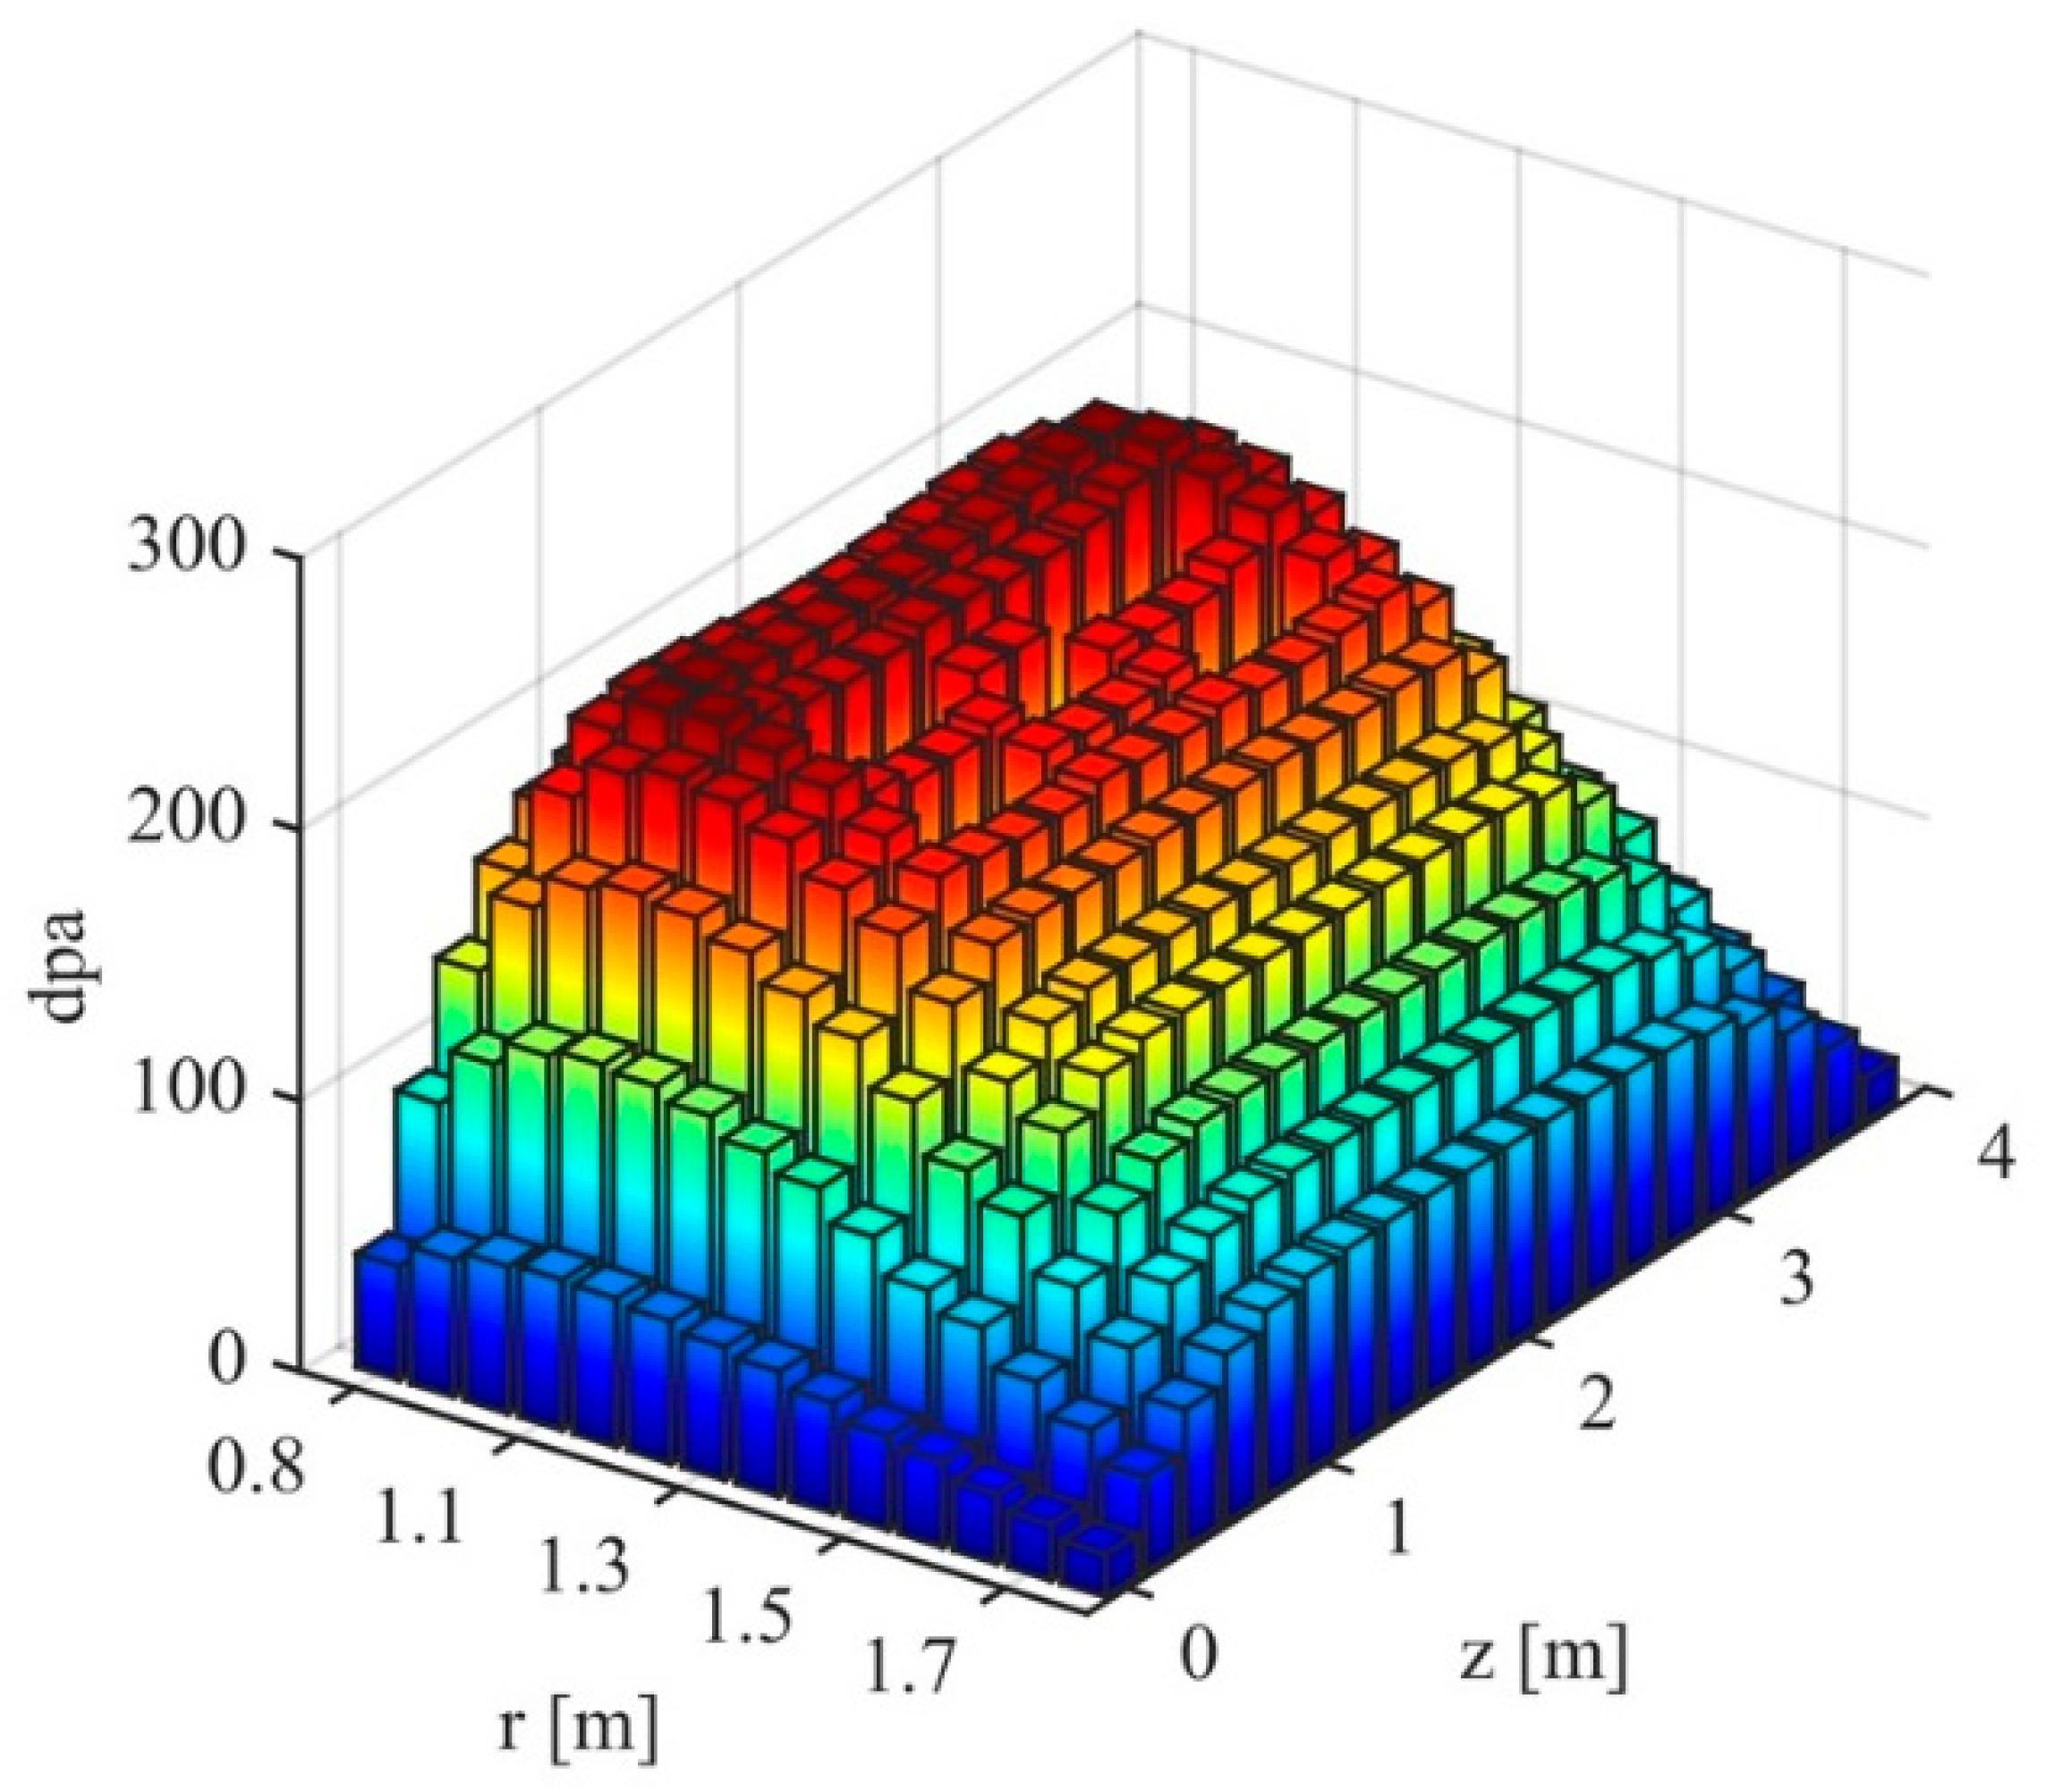
Figure 2 shows the dpa levels in the metal-fueled core, with beryllium rods in the reflector regions, and 10-atom-percent beryllium doping in the fuel. The maximum cladding damage occurred close to the inner region, and reached a level of 230 dpa at 8.4 years. The maximum damage levels were lower close to the reflectors due not only to lower fluence values, but also to a softer neutron spectrum.
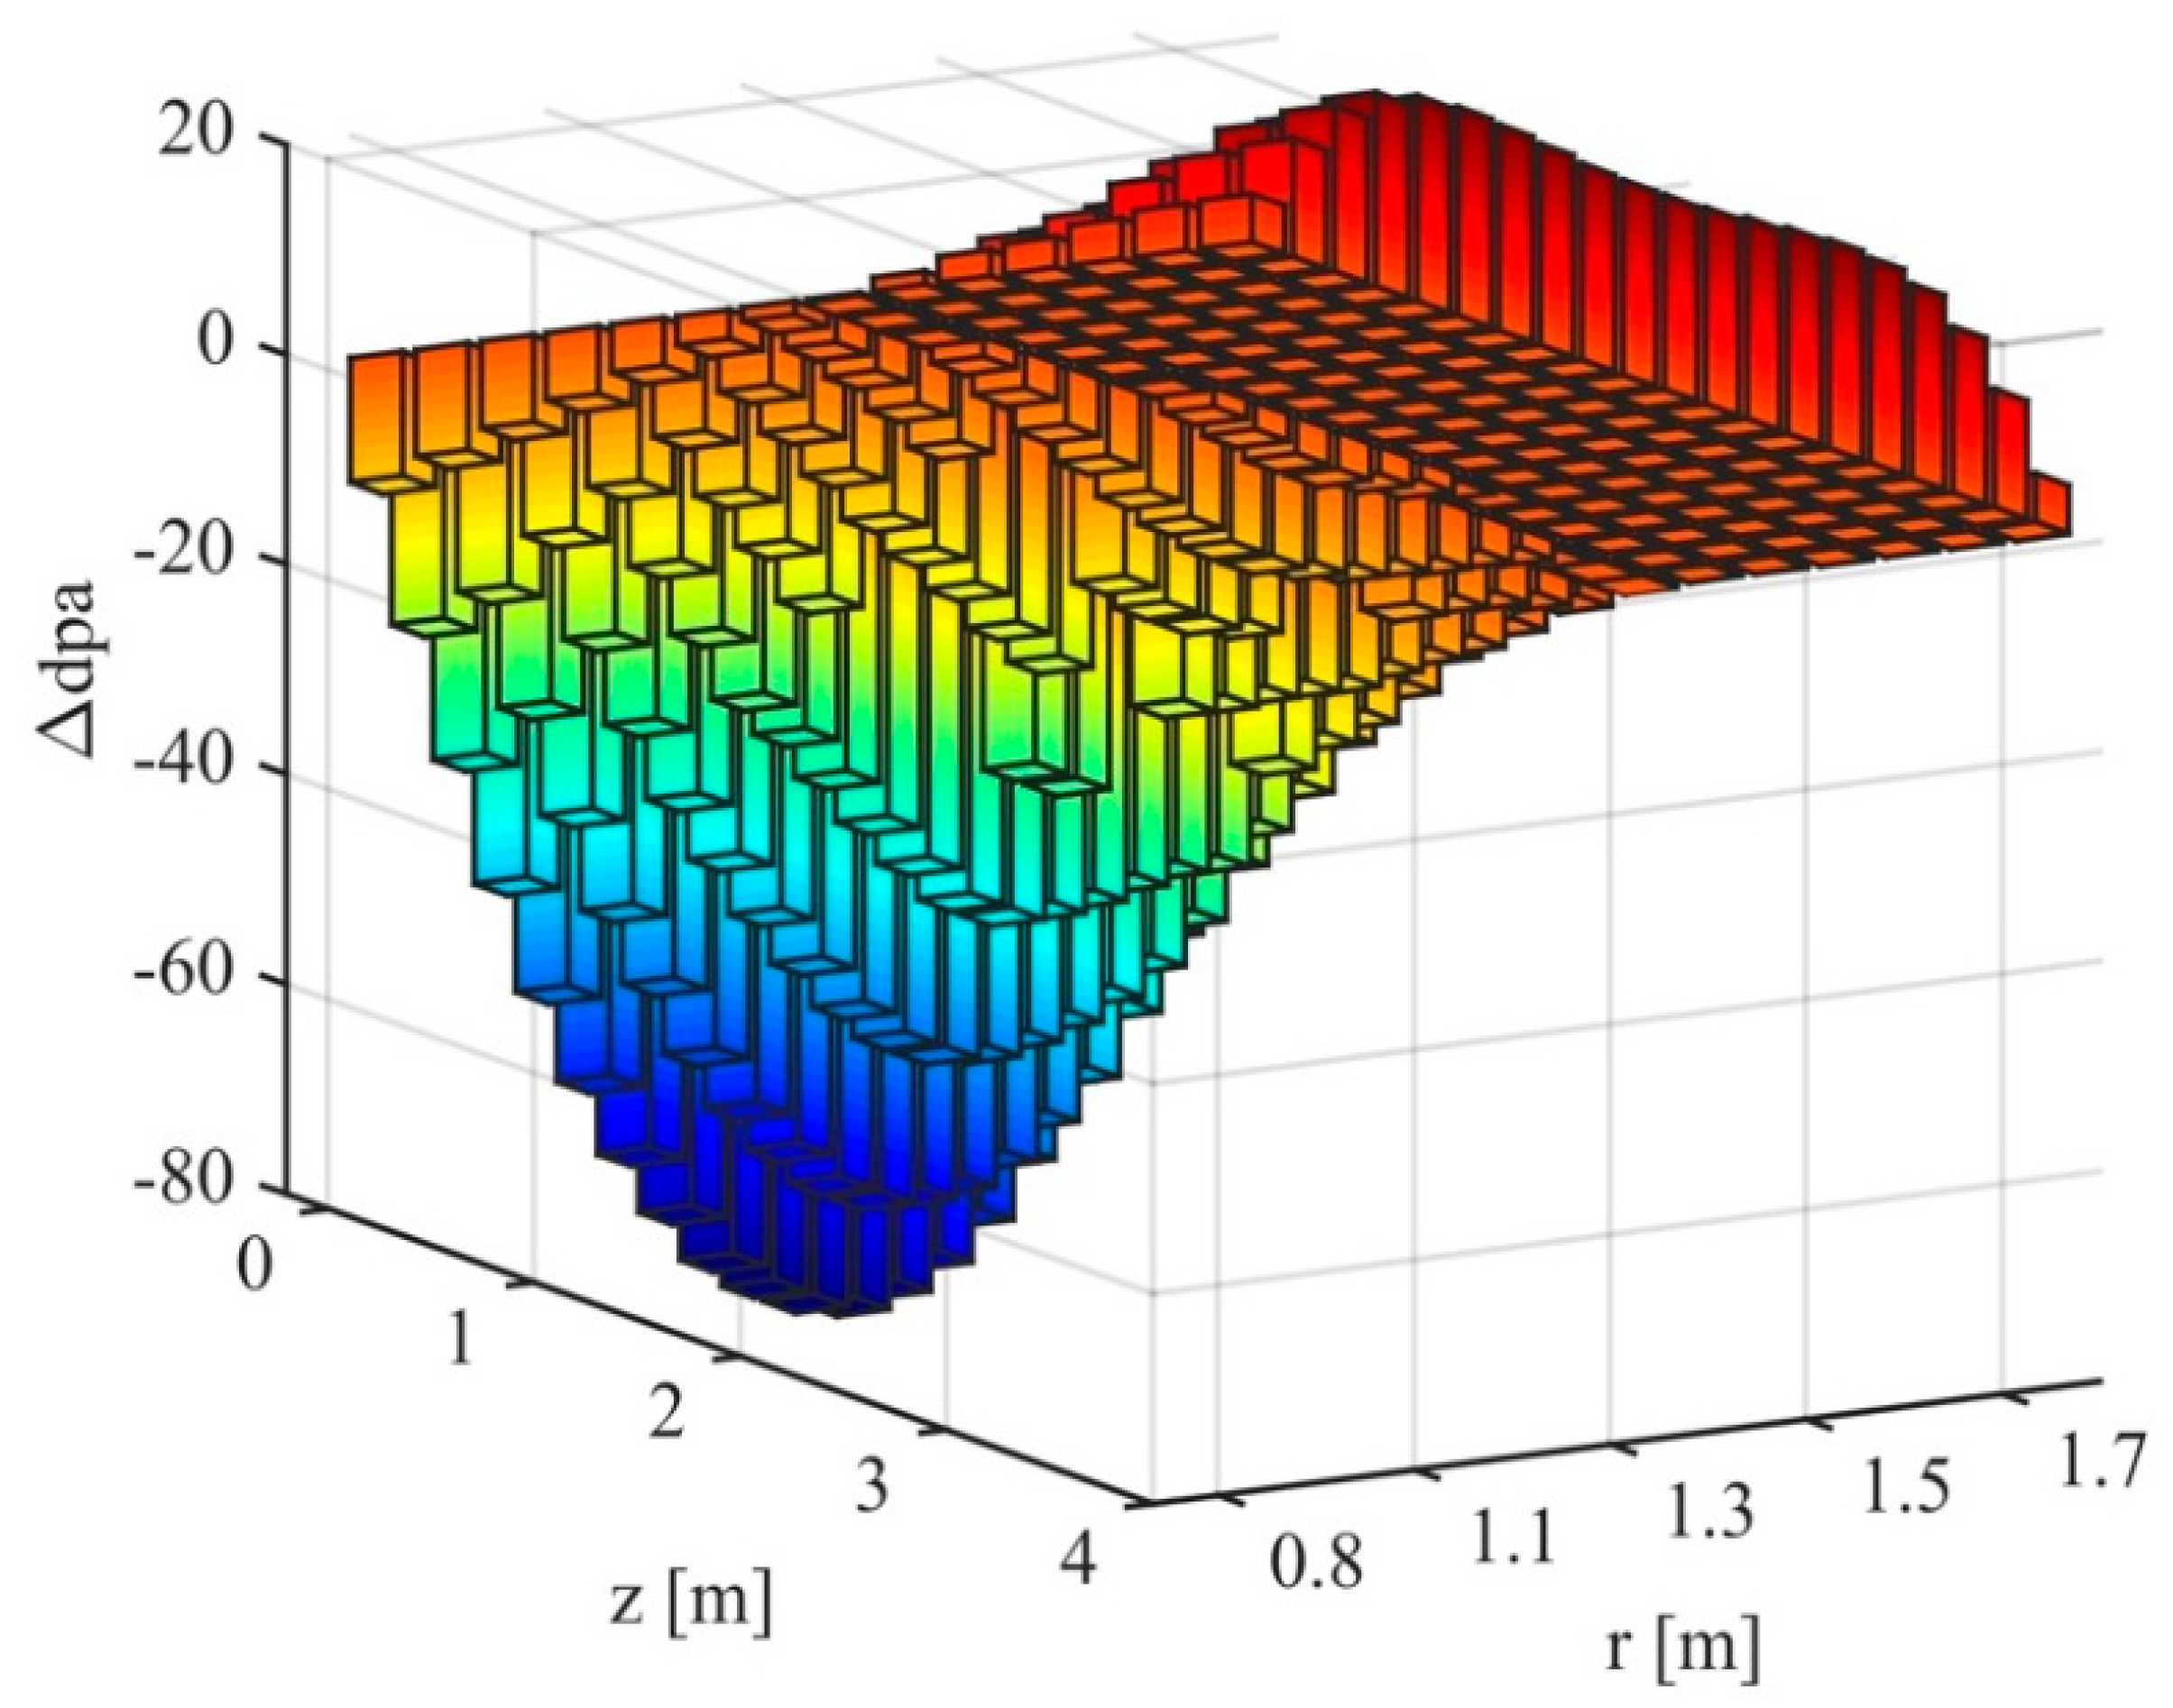
Figure 3 shows the difference in dpa between the metal-fueled core, with beryllium reflectors and beryllium in the fuel, and the metal-fueled core with sodium in the reflector region and no beryllium in the fuel. The greatest reduction in dpa was near the axial and radial centerline where ∆dpa was −75.8. The dpa increased by a maximum of 19.9 dpa in the outer radial regions due to the reflectors causing an increase in fission rate; however, in the outer radial regions, the dpa value remained well below 200, as shown in Figure 2.
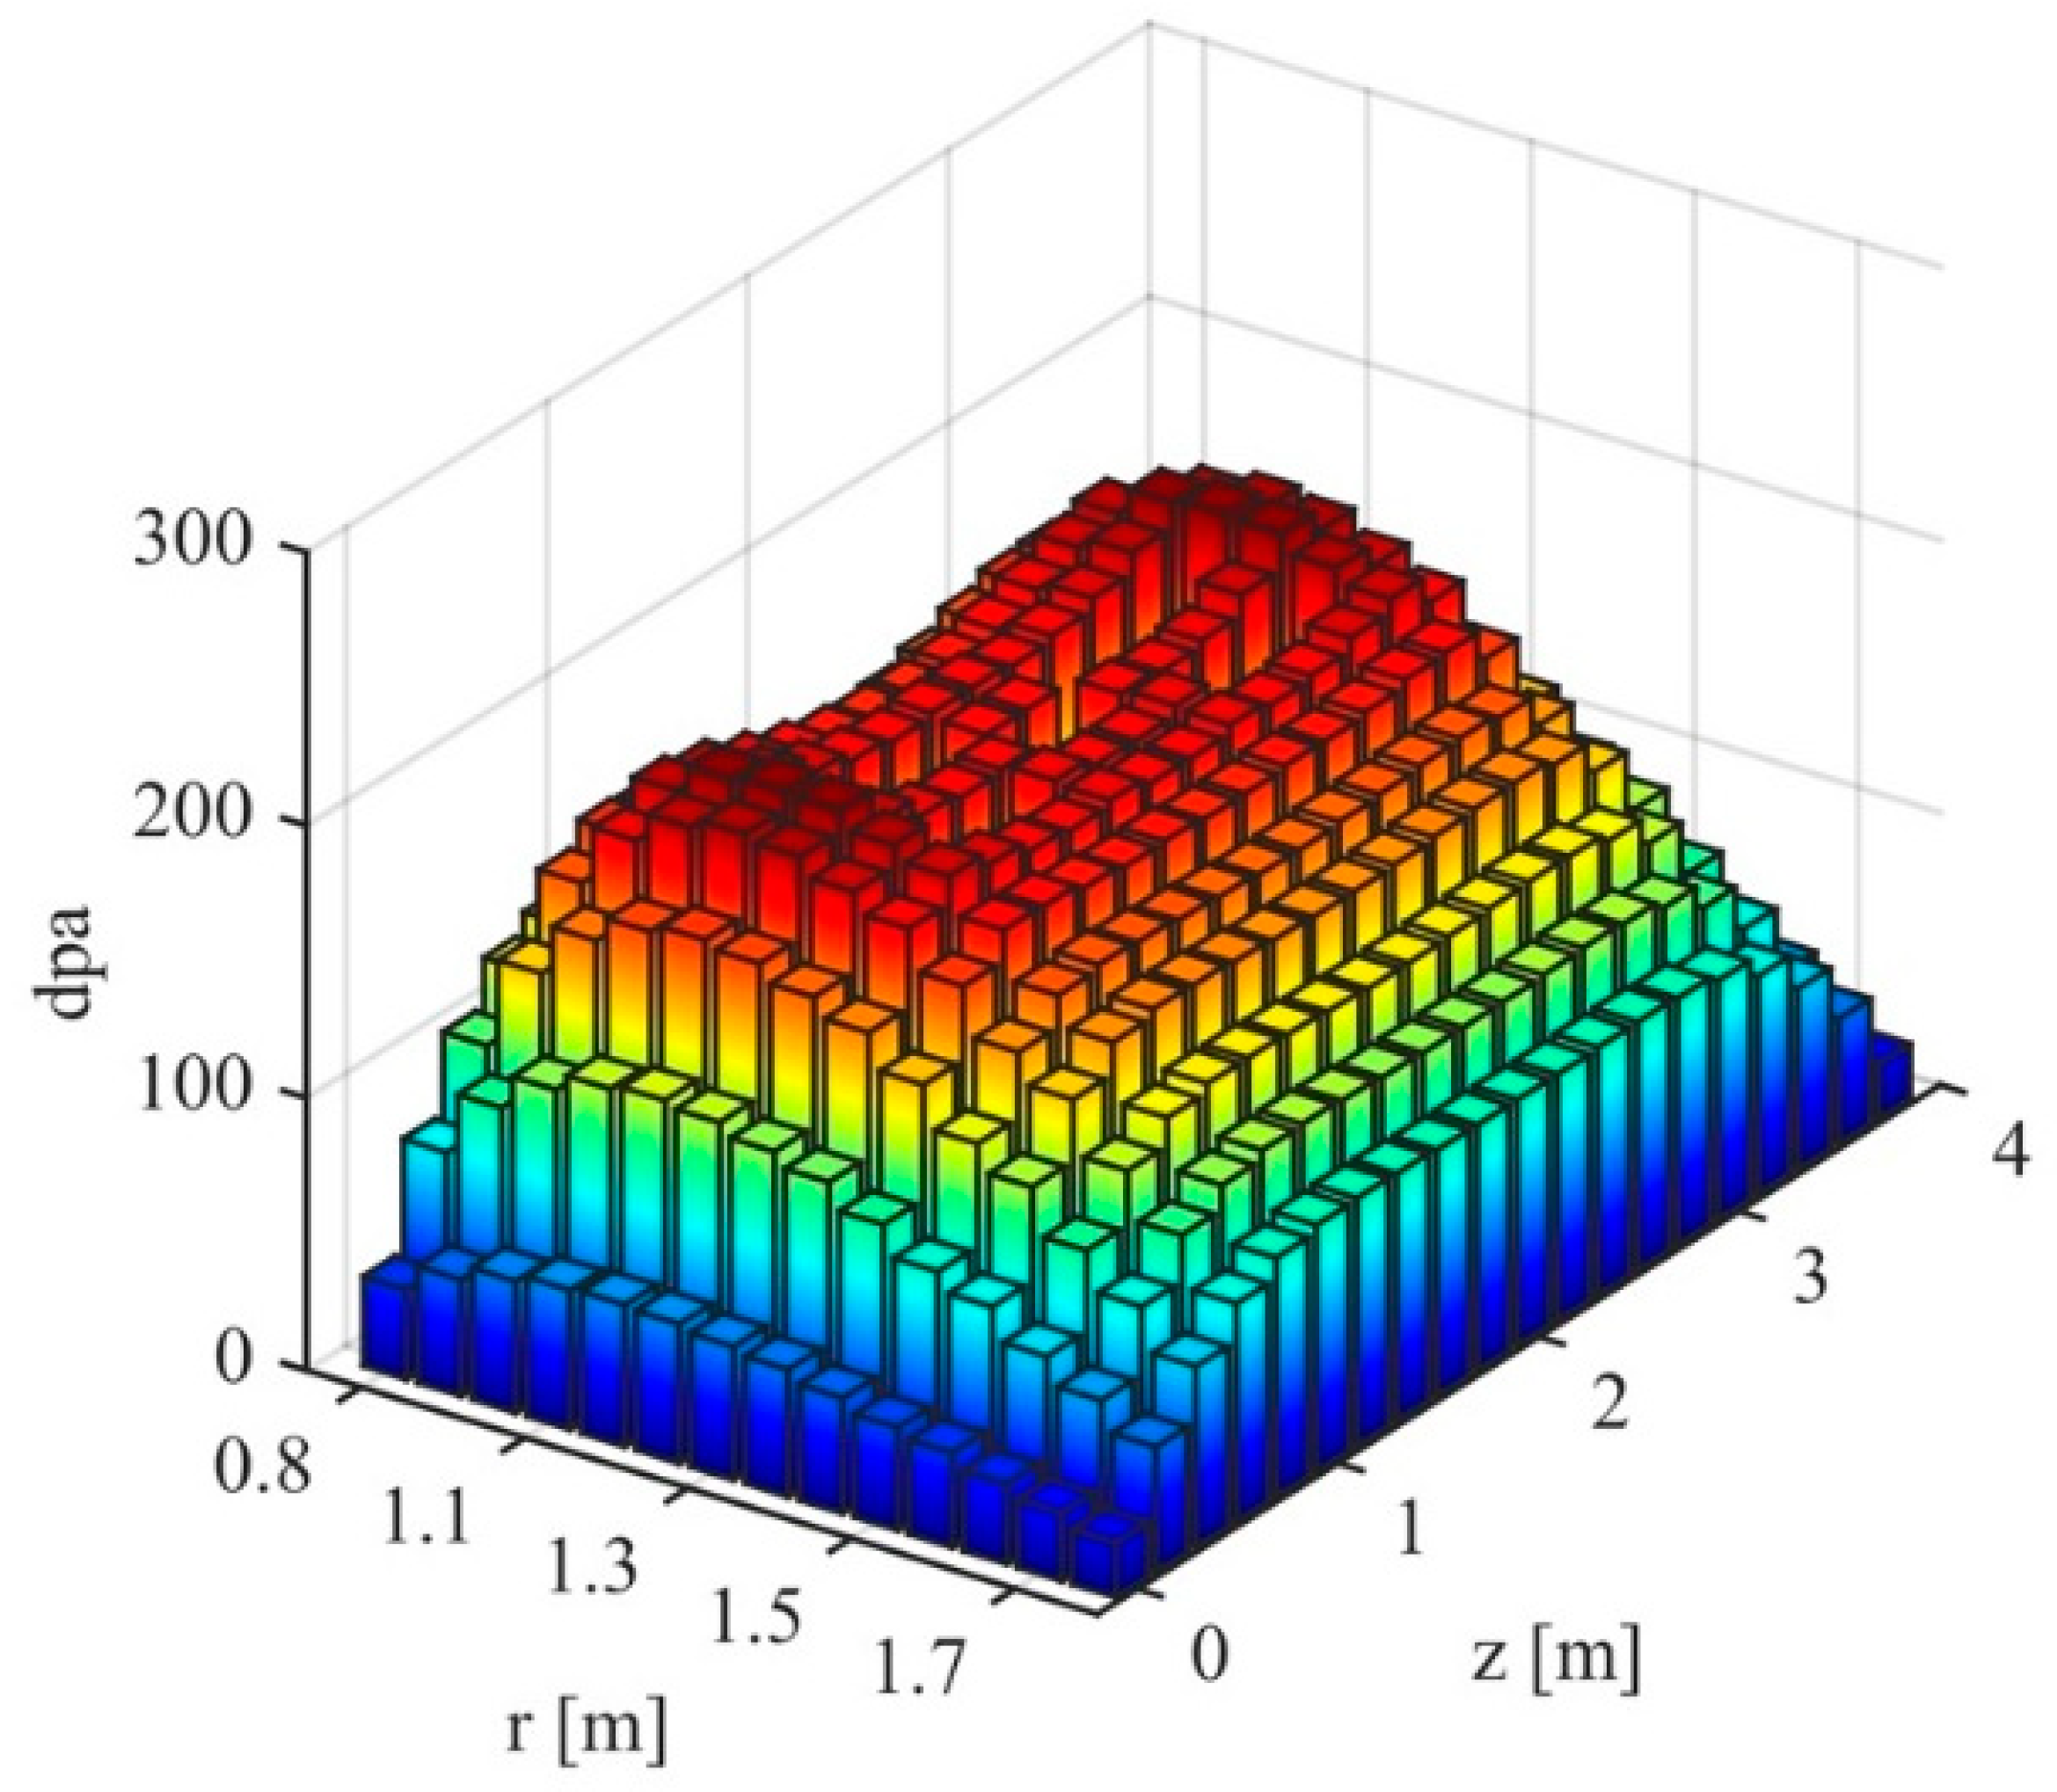
Figure 4 shows the dpa levels in the mixed-oxide-fueled core, with sodium in the reflector regions and no beryllium doping in the fuel. The maximum cladding damage occurred close to the inner region, and reached a level of 225 dpa at 8.4 years. The maximum damage levels were lower close to the reflectors due to lower overall fluence away from the center of the core. The overall damage levels were lower relative to either of the metal-fueled cores due to the presence of oxygen atoms which produced a softer neutron spectrum.
Figure 5 shows the dpa levels in the mixed-oxide-fueled core, with beryllium rods in the reflector regions and a beryllium doping of 10 atom percent in the fuel. The maximum cladding dpa occurred in the vicinity of the diluent, and reached a level of 203 dpa at 8.4 years. The maximum damage levels were lower close to the reflectors due not only to lower flux values, but also a softer neutron spectrum. Here, the presence of oxygen and beryllium in combination lowered the average neutron energy even further.
Figure 6 shows the difference in dpa between the oxide-fueled core with beryllium reflectors and beryllium in the fuel, and the oxide-fueled core with sodium in the reflector region and no beryllium in the fuel. The greatest reduction in dpa was near the axial and radial centerline, where ∆dpa was −61.6. The dpa increased by a maximum of 19.0 dpa in the outer radial regions due to the reflectors causing an increase in fission rate; however, in the outer radial regions, the dpa value remained well below 200, as shown in Figure 5.
Figure 7 shows the neutron flux in the mixed-oxide-fueled core, with beryllium rods in the reflector regions and a beryllium doping of 10 atom percent in the fuel. The profiles are shown at t = 0 years, and t = 8.4 years, the time at which peak cladding damage hit 203 dpa. The increase in flux in the central region of the reactor was clearly evident at 8.4 years, and was due to an increase in transuranic content in that region of the reactor. The axial and radial plutonium grading, along with the diluent and reflectors, produced a shifting flux distribution that produced a more even burnup profile. This allowed for a high core-average burnup before maximum dpa levels were reached, without the need for reshuffling or reforming the fuel. Plots of neutron flux and dpa levels, including error bars reflecting Monte Carlo statistical uncertainty, can be found in Supplementary Note 1.
Figure 8 shows the position-dependent burnup profile, as well as the uranium utilization at 8.4 years in the mixed-oxide-fueled core, with beryllium rods in the reflector regions and a beryllium doping of 10 atom percent in the fuel. The maximum fuel burnup at this point was 163.4 MWd per kg of initial heavy metal, which occurred in the vicinity of the diluent. The core-average burnup at this time was 112 MWd per kg of initial heavy metal, with a minimum of 22.3 MWd per kg of initial heavy metal in the upper and lower axial locations, and outermost radial locations. The center region also experienced the greatest uranium burnup—21.6 atom percent of the initial depleted uranium. The core-average burnup was 14.7 atom percent of the initial uranium, fixed by the power, burn duration, and initial uranium mass of the core. This diminished to 2.7 atom percent in the upper and lower axial regions.
Figure 9 shows the neutron multiplication factor as a function of time in the mixed-oxide-fueled core, with beryllium rods in the reflector regions and a beryllium doping of 10 atom percent in the fuel. Axial and radial grading of the fresh core, along with the use of reflectors, had a significant effect on the reactivity of the reactor. The reactor experienced a reactivity swing because of breeding and burning, but it stayed above critical levels throughout the 8.4 years. The core started its life with keff = 1.015, peaked at 1.028, and was 1.001 at 8.4 years. The beginning of life keff was smaller than that for some conventional fast-reactor designs which run oxide fuel, as was the reactivity swing from the beginning to the end of life [11].
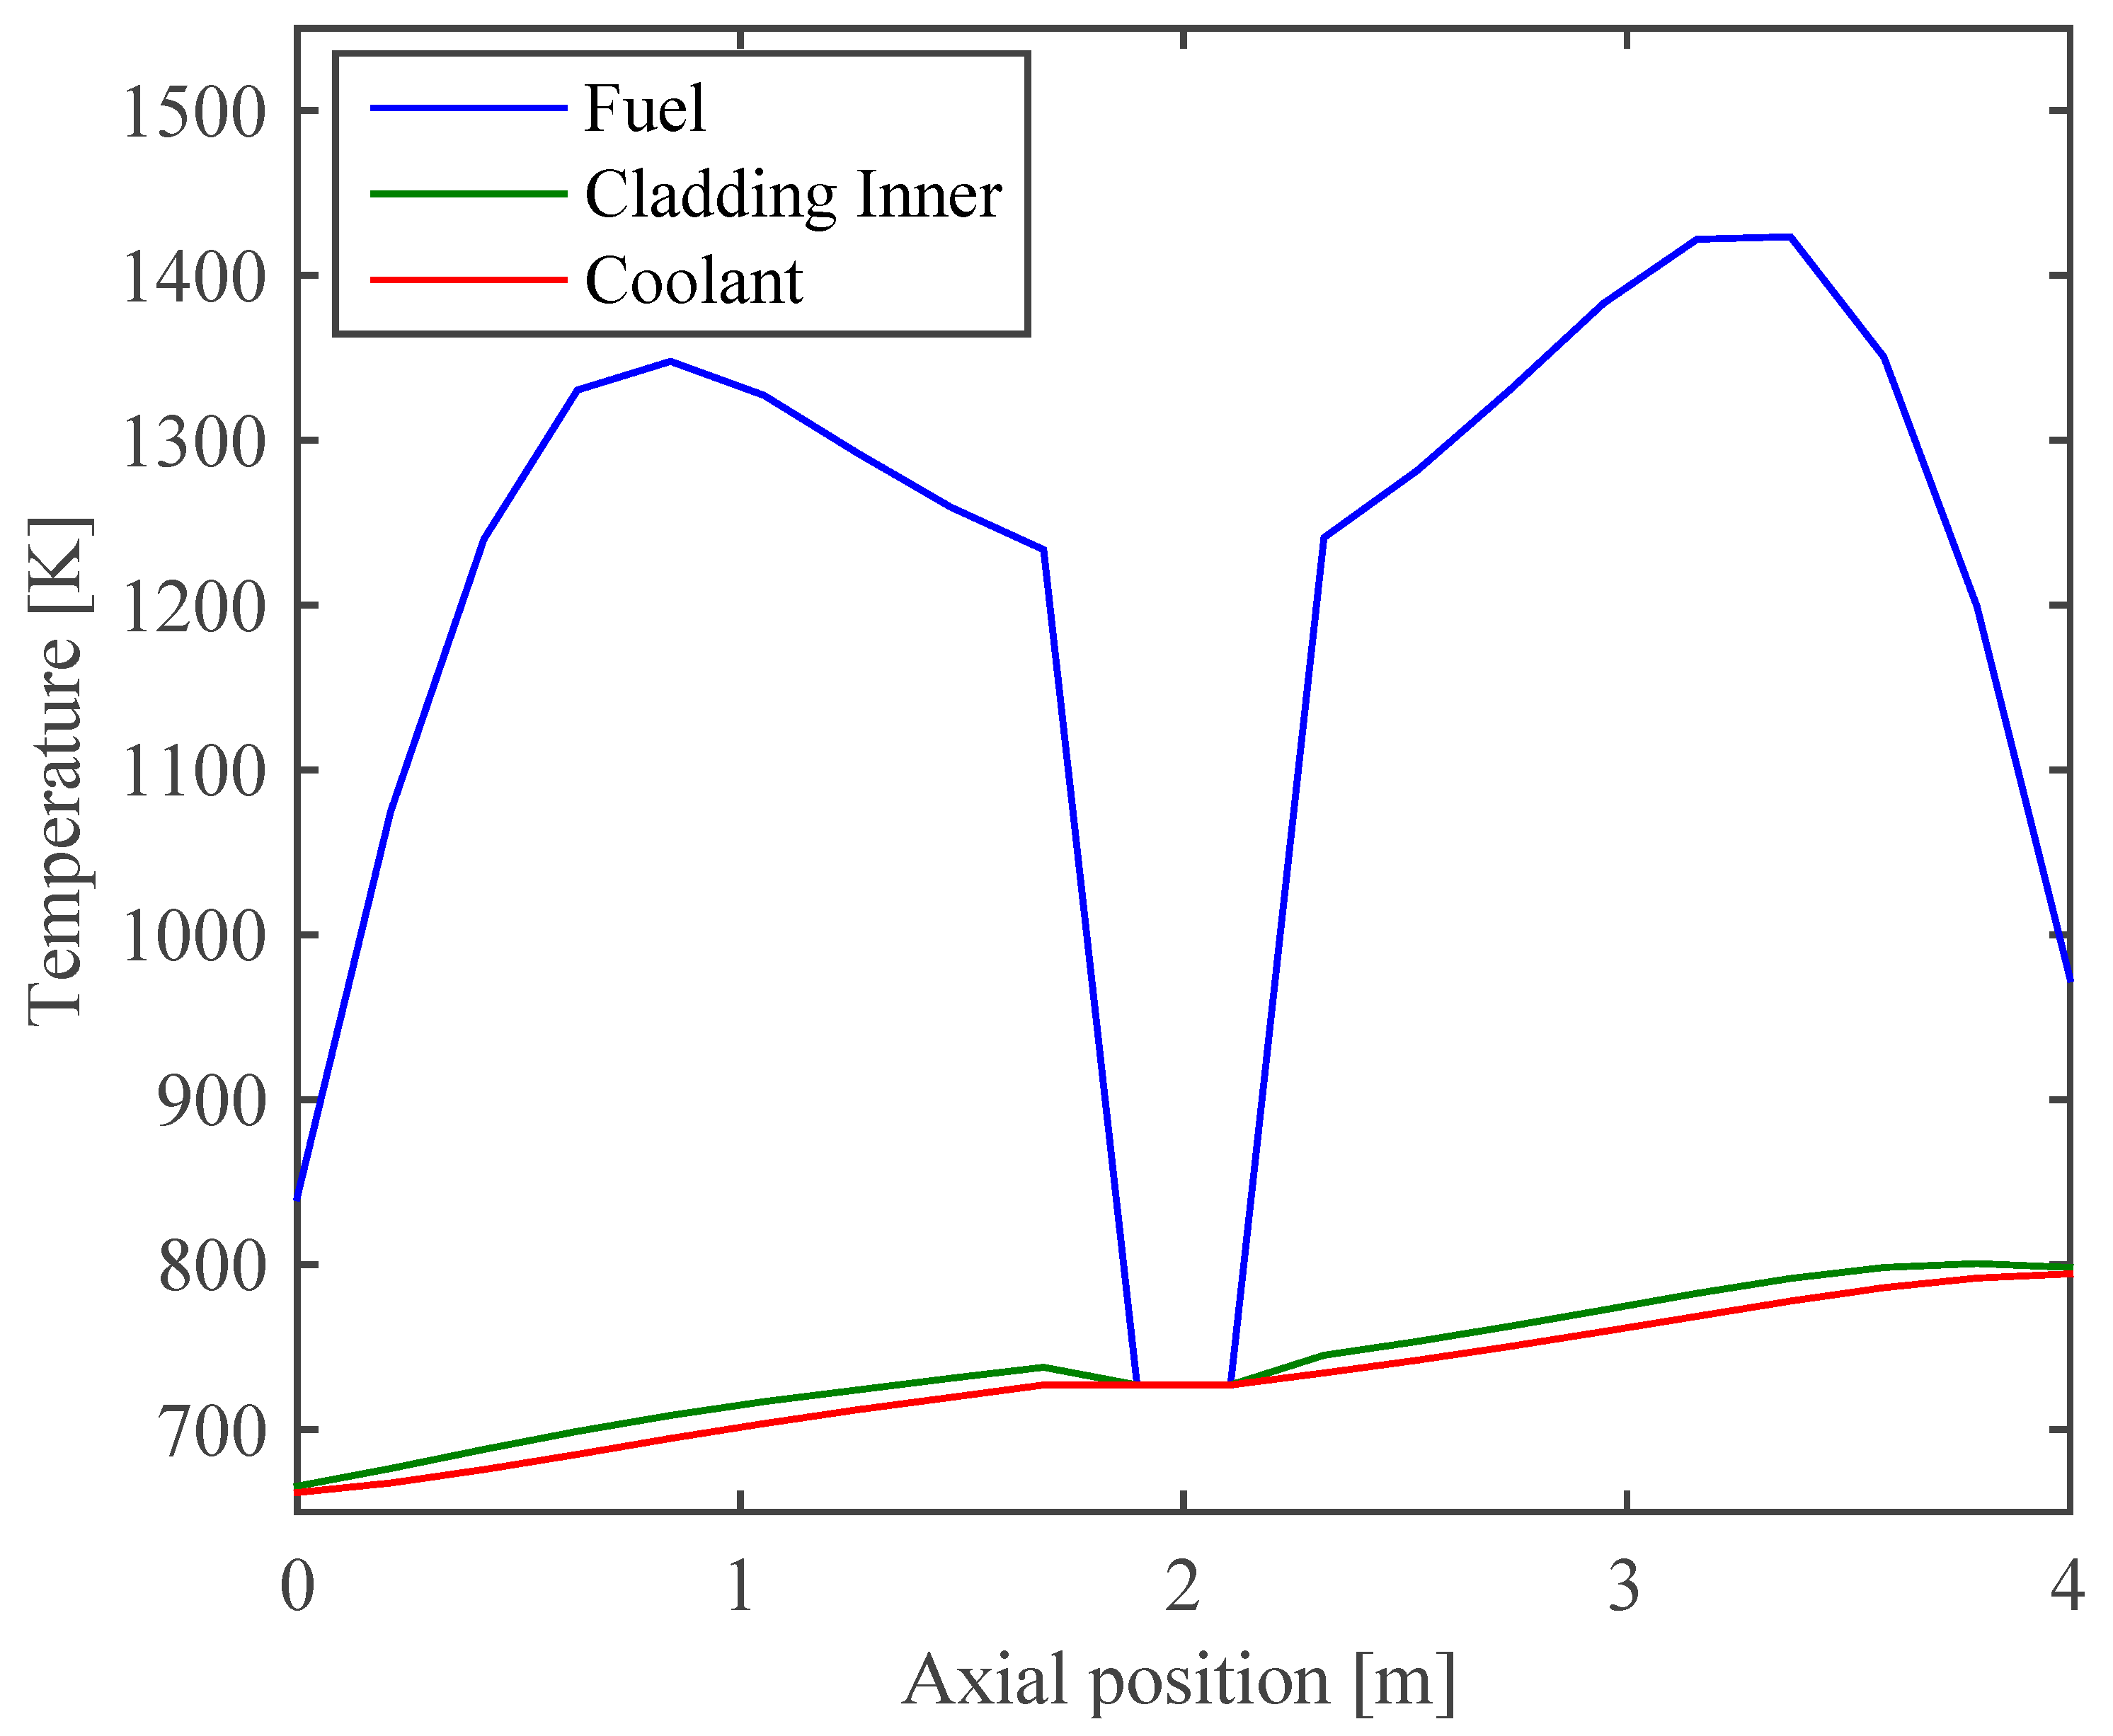
Figure 10 shows the axial temperature profiles of the fuel, the cladding, and the coolant in the hottest radial position at the beginning of life in the mixed-oxide-fueled core, with beryllium rods in the reflector regions and a beryllium doping of 10 atom percent in the fuel. The temperatures in each region remained well below material limits. These temperature profiles were perturbed to estimate the reactivity coefficients at the beginning, middle, and end of life of the core, corresponding to 0 years, 4.4 years, and 8.4 years of operation.
The reactivity coefficients are listed in Table 1. All reactivity coefficients quoted were isothermal, corresponding to spatially uniform changes in fuel or coolant temperatures. The large positive void and the coolant reactivity coefficients were in part mitigated by a large negative Doppler reactivity feedback. The restructuring of oxide fuel with burnup introduced large uncertainties in the estimates of the behavior of the fuel as a function of temperature [12]. Because of this, thermal expansion of the fuel was an unreliable mechanism for additional negative reactivity feedback, and was not included in this analysis.
3. Discussion
Simulations of long-life fast-reactor cores were done using Serpent 2.1.28, and confirmed with MCNPX 2.7.0. The metal-fueled core without beryllium experienced the greatest peak damage to cladding (273 dpa), which was brought down to 230 dpa when the fuel was doped with beryllium, and when beryllium reflectors were added. The mixed-oxide-fueled core without beryllium experienced a peak cladding damage level of 225 dpa, which was brought down to 203 dpa when the fuel was doped with beryllium, and when beryllium reflectors were added. This showed that, by configuring a fast-reactor core with light elements, the dpa could be reduced by 25%.
The reactor that experienced the least cladding damage was configured with an oxide fuel doped with 10 atom percent beryllium, and with plutonium content, graded axially and radially. When coupled with beryllium reflectors and a sodium diluent, this enabled the simulated reactor to operate for 8.4 years at a thermal output of 4740 MW, with a peak cladding damage of 203 dpa.
The reactor developed an average uranium burnup of 14.7 atom percent of the initial uranium after 8.4 years. The average overall burnup was 112 MWd per kg of initial heavy metal. This was achieved without reshuffling or recladding the fuel, and without any additional input of fresh fuel. Crucially, this performance was for an unoptimized core, and was achievable with materials for which there was operational history. By using an optimized fuel shuffling strategy, the overall and uranium burnup values would be increased significantly. The results assumed that all fission products remained in the fuel. In reality, a significant fraction of the fission product gas would either escape into a plenum, or leave the core altogether in vented-fuel-pin designs. The partial removal of fission products would produce a small increase in criticality. While venting fission products to the sodium coolant with subsequent removal was proposed for high-burnup fast reactors [13], the implications for safety and licensing should be addressed for any design using this operating strategy.
The simulations which are shown here indicated that Doppler broadening in the fuel could compensate for the positive coolant temperature reactivity effect at the beginning of life in spectrally softened cores. However, for the simulations shown here, this was no longer the case after the middle of life. Additionally, the results in Table 1 show that the core suffered from a large void reactivity. One approach to mitigating these issues would be to use a gas expansion module system, which injects neutron poison into the core when the coolant heats up. These types of control devices were successfully demonstrated at the Fast Flux Test Facility [12]. A similar approach using a lithium injection device was proposed for reactivity control in breed-burn fast reactors [14], and transient analyses showed that this type of device could enable fast reactors with large positive coolant temperature reactivity coefficients to operate safely [15]. Additionally, mechanisms such as grid-plate expansion and axial fuel expansion could help reduce the large coolant temperature reactivity coefficient in both metal- and oxide-fueled cores. However, these mechanisms were not included in this work as their effect on the reactivity coefficients was found to be small relative to Doppler broadening, and coolant thermal expansion or voiding, for metal-fueled sodium-cooled fast reactors with low leakage [14]. Axial fuel-rod expansion was also understood to be an unreliable mechanism for reactivity control in oxide-fueled cores, due to the lack of structural integrity at high levels of burnup [12]. However, these effects, as well as other secondary effects such as control-rod driveline expansion and assembly bowing, should be investigated, as they could produce a strong negative reactivity feedback when combined.
Importantly, the insertion of moderating materials into a fast-reactor core introduced side effects, such as disturbing the power profile of the core, as well as significantly reducing the neutron multiplication factor. These effects were consistent with past studies on fast reactors operating with additional moderating materials (e.g., References [16] and [17]). However, the usual limiting factor in achieving high burnup in sodium-cooled fast reactors is not reactivity, but rather, damage to cladding [12,18]. Figure 9 shows that keff remained above 1 when the cladding damage reached 200 dpa. More details on these specific effects are provided in Supplementary Note 2. Additionally, while the densities of fuel in this work were adjusted to accommodate mixing in beryllium, the effect of this on other thermo-physical properties of the fuel, as well as fuel performance under irradiation and burnup, was not addressed. Although experimental data on the thermo-physical properties of fresh UO2-BeO pellets exist [8], the optimal moderator composition and geometry need to be explored. Moderator materials, such as boron carbide (enriched to 99% 11B to limit neutron capture) and zirconium hydride, are options with significant operational experience, and are known to improve the safety characteristics of sodium-cooled fast reactors [16,17].
4. Materials and Methods
Four core designs were simulated: (i) a metal-fueled (U-Pu-Zr) core with sodium reflectors (an unsoftened metal core); (ii) a metal-fueled, beryllium-doped (U-Pu-Zr-Be) core with beryllium reflectors (a softened metal core); (iii) a mixed-oxide-fueled core (an unsoftened mixed oxide core); and (iv) a mixed-oxide-fueled, beryllium-doped core with beryllium reflectors (a softened mixed oxide core). Each core had an identical geometry and mass of actinides in order to compare the effect of spectral softening on an even basis. The main design parameters of the simulated cores are given in Table 2.
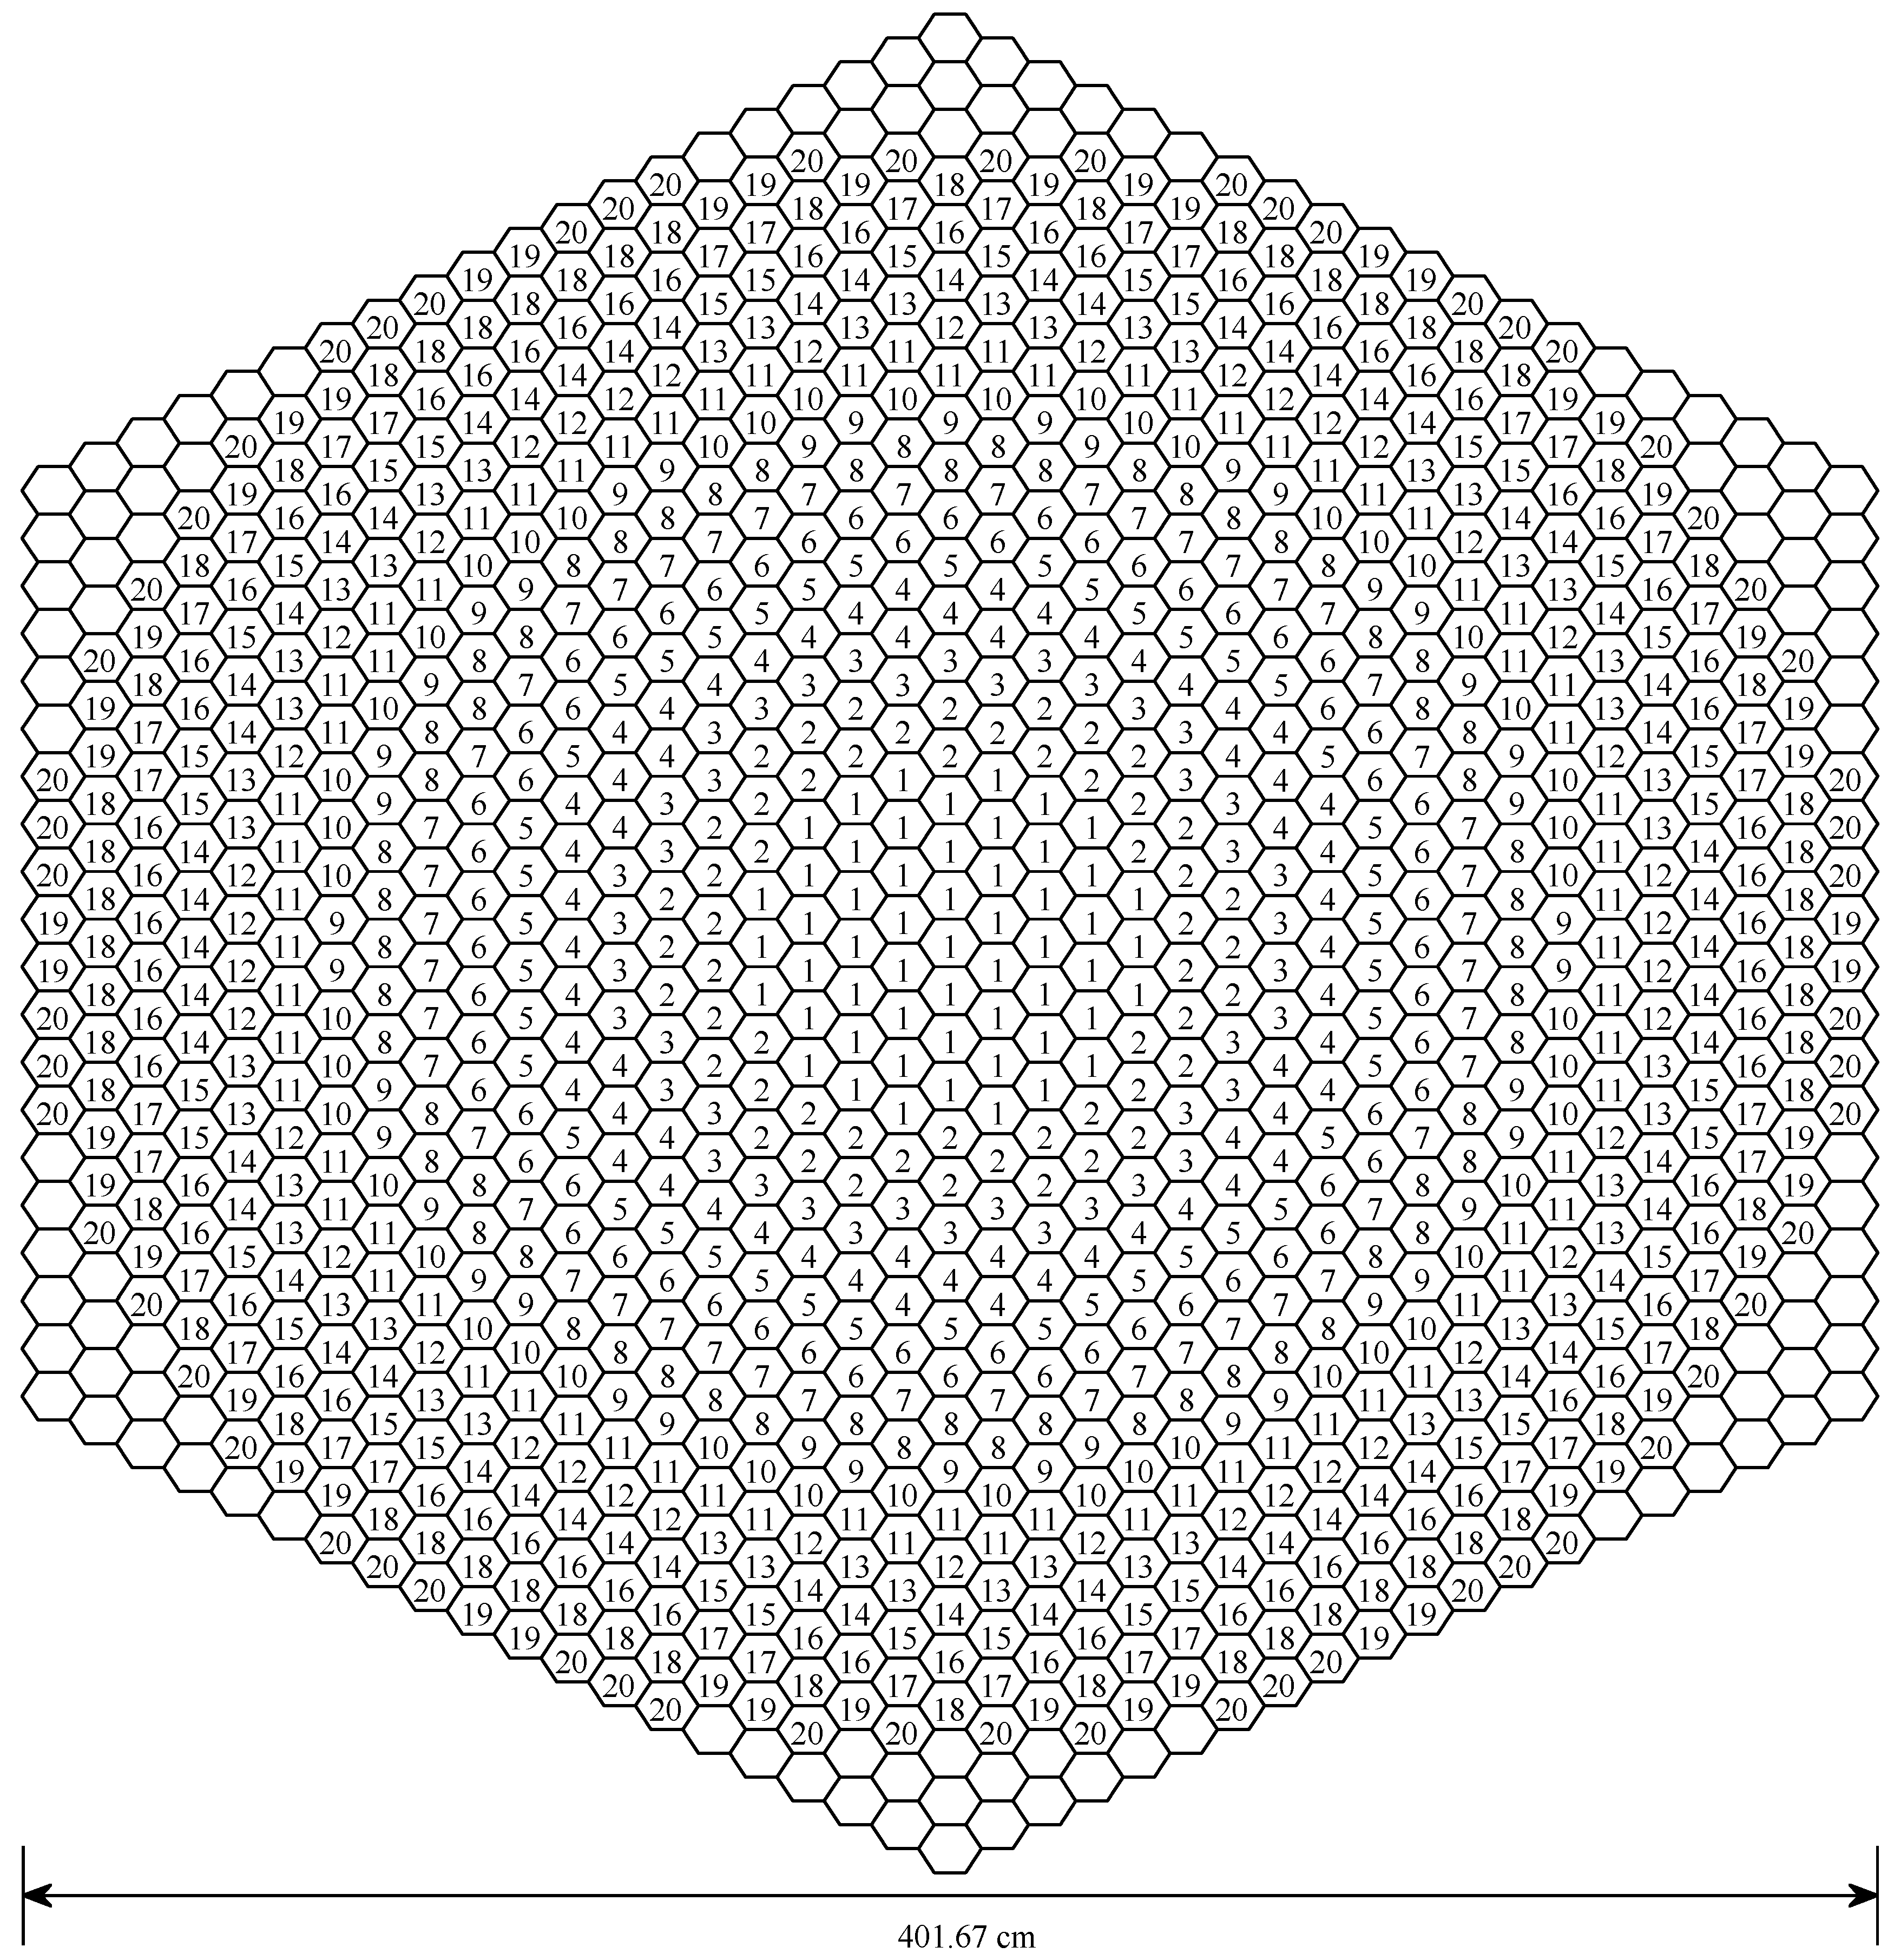
The simulated reactors were 400 cm long, with a flat-to-flat diameter of 401.67 cm. The thermal power (4740 MW) was chosen to keep the maximum inner cladding temperature of the softened mixed-oxide core below 823 K [19]. In the simulations, the cores were divided into ten axial regions of 20 cm in height, and 20 radial regions ranging from 36 to 66 assemblies each. The cores were radially and axially heterogeneous. The plutonium content of the fuel was radially and axially graded to flatten the power and flux profiles during the lifetime of the cores. The innermost 109 assemblies and the outermost 204 assemblies made up the reflectors, which were pins filled with either beryllium (in the case of the softened cores) or sodium (in the case of the unsoftened cores). A sodium diluent was incorporated into the regions situated ±100 cm from the axial center of the cores, in order to further flatten the flux and reduce the dpa in regions that would have otherwise experienced the most damage. Figure 11 shows a schematic of the core to scale, with individual material regions numbered. The specific positions and compositions of the fuel, reflector, and diluent regions, corresponding to the numbered schematic in Figure 11, are listed in Table 3. Top-down diagrams of the core composition at every axial location are given in Supplementary Note 3, Figures S10–S19. In all four core designs, the hexagonal assemblies contained 127 annular fuel, reflector, and diluent rods clad in HT-9 steel, with sodium coolant flowing between the pins. More details on the pin-level core geometry and the materials can be found in Supplementary Note 4.
Serpent 2.1.28 [20] was used for the simulations, and the results were corroborated using MCNPX 2.70 [21]. Additional details can be found in Supplementary Note 5. The spatial mesh used in the simulations had an axial grid of 20 segments with Δz = 20 cm. The materials were burned at a thermal power of 4740 megawatts with a time step of 114 days, until a peak irradiation damage of 203 dpa was reached. The simulations tracked a total of 19.2 million neutron histories per burnup step. A thermal resistor model was used to determine the approximate fuel and coolant temperatures in all radial and axial regions, and these were fed back into the Monte Carlo simulations at the beginning, middle and end of life, in an effort to compute the isothermal reactivity coefficients. More information on the heat transfer model can be found in Supplementary Note 6.
4.1. Irradiation Damage
The displacements per atom of cladding and structural materials were computed using
Here, σD is the energy-dependent microscopic displacement cross section (barns), φ is the neutron flux (1/b-s), and Ei is the incident neutron energy (eV). The integrals are over both energy and time.
The displacement cross section took into consideration the different types of neutron–material interactions that were sufficient to dislodge an atom. For steels, the elastic scattering on 56Fe was the dominant mechanism through which atoms were displaced, but neutron absorption, and inelastic scattering, (n, p), (n, α), (n, n), (n, 2n), etc., all contributed. The total microscopic displacement cross section was then the sum of the displacement cross sections for the individual mechanisms:
The output of the Serpent simulations was used to compute a flux in 494 energy bins ranging from 10−4 to 20 MeV for each location and time step. We used the NJOY [22] code to compute σD in the same 494-group structure as the flux. More details can be found in Supplementary Note 7.
4.2. Fuel and Cladding Temperature
Temperatures for the fuel, coolant, and cladding were computed as a function of axial and radial position in the reactor using a one dimensional (1D) thermal resistor model [12,23,24], and thermo-physical quantities were drawn from References [25,26,27]:
where q′ is the linear power density of the fuel (W/m), and R′ and ΔT are the linear thermal resistance (m-K/W) and the temperature difference (K), respectively, between the fuel and the coolant.
In order to reduce peak temperatures, the fuel was comprised of annular pins, which were clad in HT-9 steel with a helium bond. While sodium bonds are normally used in combination with metal fuel, we chose a helium bond for all fuel types in order to keep as many design parameters constant between cores. The 1D thermal transport model assumed no radial heat transfer between coolant channels. Additional details can be found in Supplementary Note 6.
4.3. Reactivity Coefficients
The core-average Doppler coefficient for the fuel was computed by uniformly perturbing the temperature of the fuel in the reactor by +300 K, and by recomputing the neutron multiplication factor. All other variables remained the same in order to isolate the effect of Doppler broadening. The coefficient was computed according to Reference [28]:
The core-average reactivity coefficient for the sodium coolant was computed by uniformly perturbing the coolant temperature by +300 K, by adjusting the sodium densities accordingly, and by recomputing the neutron multiplication factor:
The core-average void coefficients were computed using Reference [28] by uniformly reducing the coolant density by 90%, and by recomputing the neutron multiplication factor. All other variables remained the same to isolate the effect of coolant voiding:
where x is the core-average void fraction. Reactivity coefficients were computed at the beginning, middle (t = 4.4 years), and end of life. In all cases, this was done by sampling the materials from the burnup simulation at 0 years, 4.4 years, and 8.4 years, by performing the relevant temperature or density perturbation, and by recomputing the neutron multiplication factor using 432 million total neutron histories.
The uncertainties of keff values of Figure 9 were computed by repeating the Monte Carlo simulation five times, each with a different random number seed, and by calculating the mean and standard deviation of the results. The uncertainties in the reactivity coefficients were computed using the error propagation formula on the standard deviations for k, quoted by the Monte Carlo code. The errors were, in many cases, extremely small, as they reflected the statistical uncertainties in the Monte Carlo neutron transport. Additional details can be found in Supplementary Note 8.
5. Conclusions
While the impact of spectral softening on both metal- and oxide-fueled long-life fast-reactor cores is significant, this paper only provided a demonstration of unoptimized core designs. Although the mixed-oxide-fueled, beryllium-doped core with beryllium reflectors presented in this paper achieved good performance, the unexplored parameter space for long-life fast-reactor design using a softened neutron spectrum is large. Additionally, the fuel densities in the metal-fueled cores, as well as in the mixed-oxide-fueled core without beryllium, were reduced in order to enable an even comparison with the mixed-oxide core containing beryllium. In reality, the fuel densities of the three higher-damage designs would be greater, which would give a bonus to neutron economy. This suggested that the optimal design of maximizing burnup while keeping dpa low might be achieved using a metal-fueled core with additional beryllium. Finally, a key goal would be to find the fuel-loading strategy which enables long-life cores to be operated using recycled actinides from their own discharged fuel. This would significantly reduce the net production of transuranics, which are the nuclides responsible for giving nuclear waste its long-lived signature.
Supplementary Materials
The following are available online at https://www.mdpi.com/1996-1073/11/6/1507/s1. Supplementary-Document.pdf.
Author Contributions
Data curation, Andrew Osborne; Formal analysis, Mark Deinert; Investigation, Andrew Osborne; Methodology, Mark Deinert; Project administration, Mark Deinert; Resources, Mark Deinert; Software, Andrew Osborne; Writing-original draft, Andrew Osborne and Mark Deinert; Writing-review & editing, Andrew Osborne and Mark Deinert.
Funding
This research was funded by The US Nuclear Regulatory Commission grant number NRC-38-08-946.
Acknowledgments
We thank Jaakko Leppanen and Tuomas Viitanen of the VTT Technical Research Centre of Finland for their helpful advice on the Serpent Monte Carlo code. We also thank Nathaniel Mendoza and Chris Hempel of the Texas Advanced Computing Center for their assistance with parallelization of Monte Carlo codes.
Conflicts of Interest
The authors declare no conflict of interest. The founding sponsors had no role in the design of the study; in the collection, analyses, or interpretation of data; in the writing of the manuscript, and in the decision to publish the results.
References
- Kim, T.K.; Taiwo, T.A. Feasibility study of ultra-long life fast reactor core concept. In PHYSOR 2010; American Nuclear Society, Inc.: Pittsburgh, PA, USA, 2010. [Google Scholar]
- Osborne, A.G.; Deinert, M.R. Comparison of neutron diffusion and monte carlo models for a fission wave. In Proceedings of the International Conference on Mathematics and Computational Methods Applied to Nuclear Science & Engineering, Sun Valley, ID, USA, 5–9 May 2013; American Nuclear Society: Sun Valley, ID, USA, 2013. [Google Scholar]
- Cheon, J.S.; Lee, C.B.; Lee, B.O.; Raison, J.P.; Mizuno, T.; Delange, F.; Carmack, J. Sodium fast reactor evaluation: Core materials. J. Nucl. Mater. 2009, 392, 324–330. [Google Scholar] [CrossRef] [Green Version]
- Byun, T.S.; Lewis, W.D.; Toloczko, M.; Maloy, S.A. Impact properties of irradiated HT9 from the fuel duct of FFTF. J. Nucl. Mater. 2012, 421, 104–111. [Google Scholar] [CrossRef]
- Toloczko, M.B.; Garner, F.A.; Eiholzer, C.R. Irradiation creep and swelling of the US fusion heats of HT9 and 9Cr-1Mo to 208 dpa at ~400 °C. J. Nucl. Mater. 1994, 212, 604–607. [Google Scholar] [CrossRef]
- Maloy, S.A.; Toloczko, M.; Cole, J.; Byun, T.S. Core materials development for the fuel cycle R&D program. J. Nucl. Mater. 2011, 415, 302–305. [Google Scholar]
- Osborne, A.G.; Deinert, M.R. Neutron damage reduction in a traveling wave reactor. In Proceedings of the PHYSOR 2012: Advances in Reactor Physics, Knoxville, TN, USA, 15–20 April 2012. [Google Scholar]
- Camarano, D.M.; Mansur, F.A.; Santos, A.M.M.; Ferraz, W.B.; Ferreira, R.A.N. Effects of beryllium and compaction pressure on the thermal diffusivity of uranium dioxide fuel pellets. Int. J. Thermophys. 2017, 38, 137. [Google Scholar] [CrossRef]
- Bailey, H.S.; Lu, Y.S. Nuclear performance of liquid-metal fast breeder reactors designed to preclude energetic hypothetical core disruptive accidents. Nucl. Technol. 1979, 44, 76–82. [Google Scholar] [CrossRef]
- Greebler, P.; Hutchins, B.A.; Sueoka, J.R. Calculation of Doppler Coefficient and Other Safety Parameters for a Large Fast Oxide Reactor; General Electric Company: Boston, MA, USA, 1961. [Google Scholar]
- Palmiotti, G.; Hill, R.; Wade, D. Physics of Plutonium Recycling; Organisation for Economic Cooperation and Development: Paris, France, 1995; Volume iv. [Google Scholar]
- Waltar, A.E.; Todd, D.R.; Tsvetkov, P.V. Fast Spectrum Reactors; Springer: Heidelberg/Berlin, Germany, 2012. [Google Scholar]
- Ahlfeld, C.; Burke, T.; Ellis, R.; Hejzlar, P.; Weaver, K.; Whitmer, C.; Gilleland, J.; Cohen, M.; Johnson, B.; Mazurkiewicz, S.; et al. Conceptual design of a 500 MWe traveling wave demonstration reactor plant. In Proceedings of the International Congress on Advances in Nuclear Power Plants, Nice, France, 2–6 May 2011. [Google Scholar]
- Qvist, S.; Greenspan, E. An autonomous reactivity control system for improved fast reactor safety. Prog. Nucl. Energy 2014, 77, 32–47. [Google Scholar] [CrossRef]
- Qvist, S.A.; Hellesen, C.; Gradecka, M.; Dubberley, A.E.; Fanning, T.; Greenspan, E. Tailoring the response of autonomous reactivity control (ARC) systems. Ann. Nucl. Energy 2017, 99, 383–398. [Google Scholar] [CrossRef]
- Merk, B.; Fridman, E.; Weiß, F.-P. On the use of a moderation layer to improve the safety behavior in sodium cooled fast reactors. Anna. Nucl. Energy 2011, 38, 921–929. [Google Scholar] [CrossRef]
- Merk, B.; Weiß, F.-P. Analysis of the influence of different arrangements for ZrH moderator material on the performance of a sfr core. Ann. Nucl. Energy 2011, 38, 2374–2385. [Google Scholar] [CrossRef]
- Fei, T.; Driscoll, M.J.; Shwageraus, E. Uranium startup fast reactors with metal fuel using once-through fuel cycle. Fuel Cycle Manag. 2013, 186, 378–389. [Google Scholar] [CrossRef]
- Chen, Y. Irradiation effects of HT-9 martensitic steel. Nucl. Eng. Technol. 2013, 45, 311–322. [Google Scholar] [CrossRef]
- Leppanen, J. Serpent—A continuous-energy monte carlo reactor physics burnup calculation code. User's Manual. 2013. Available online: http://montecarlo.vtt.fi/download/Serpent_manual.pdf (accessed on 6 June 2018).
- Pelowitz, D. MCNPX User’s Manual Version 2.7.0; LA-CP-11-00438; Los Alamos National Laboratory: Los Alamos, NM, USA, 2011. [Google Scholar]
- MacFarlane, R.E.; Muir, D.W. The NJOY Nuclear Data Processing System Version 91; LA-12740-M; Los Alamos National Laboratory: Los Alamos, NM, USA, 1994. [Google Scholar]
- Recktenwald, G.D.; Deinert, M.R. Effect of burnable absorbers on inert matrix fuel performance and transuranic burnup in a low power density light-water reactor. Energies 2013, 6, 2291–2304. [Google Scholar] [CrossRef]
- Incropera, F.P.; Dewitt, D.P.; Bergman, T.L.; Lavine, A.S. Fundamentals of Heat and Mass Transfer, 6th ed.; John Wiley & Sons: Hoboken, NJ, USA, 2007. [Google Scholar]
- Lamarsh, J.R.; Baratta, A.J. Introduction to Nuclear Engineering, 3rd ed.; Prentice Hall: Upper Saddle River, NJ, USA, 2001; 783p. [Google Scholar]
- Karahan, A. Modeling of Thermo-Mechanical and Irradiation Behavior of Metallic and Oxide Fuels for Sodium Fast Reactors; Massachussetts Institute of Technology: Cambridge, MA, USA, 2009. [Google Scholar]
- IAEA. Status and Trends of Nuclear Fuels Technology for Sodium Cooled Fast Reactors; NF-T-4.1; International Atomic Energy Agency: Cambridge, MA, USA, 2011. [Google Scholar]
- Nuclear Regulatory Commission Technical Training Center. In Power Plant Engineering Course Manual. Available online: https://www.nrc.gov/docs/ML0230/ML023020604.pdf (accessed on 6 June 2018).
Figure 1.
Radial and axial displacements per atom (dpa) in the unsoftened metal core. The depression in the center was due to the diluent region. The peak damage at 8.4 years was 273 dpa in assembly region 5 between 180 cm and 220 cm along the axial direction. The dpa was significantly lower near the sodium reflector regions (corresponding to regions 1, 2, and 17–20 in Figure 11) due to a lower overall fluence. The peak dpa in the fuel regions adjacent to the inner and outer reflectors were 232 and 99, respectively.

Figure 2.
Radial and axial dpa in the softened metal core. The depression in the center was due to the diluent region. The peak dpa at 8.4 years was 230 in assembly region 7 between 80 cm and 100 cm along the radial direction, and between 300 cm and 320 cm along the axial direction. The dpa was significantly lower near the beryllium reflector regions (corresponding to regions 1, 2, and 17–20 in Figure 11) due to both a softer neutron spectrum, and a lower overall fluence. The peak dpa in the fuel regions adjacent to the inner and outer reflectors were 161 and 117, respectively.

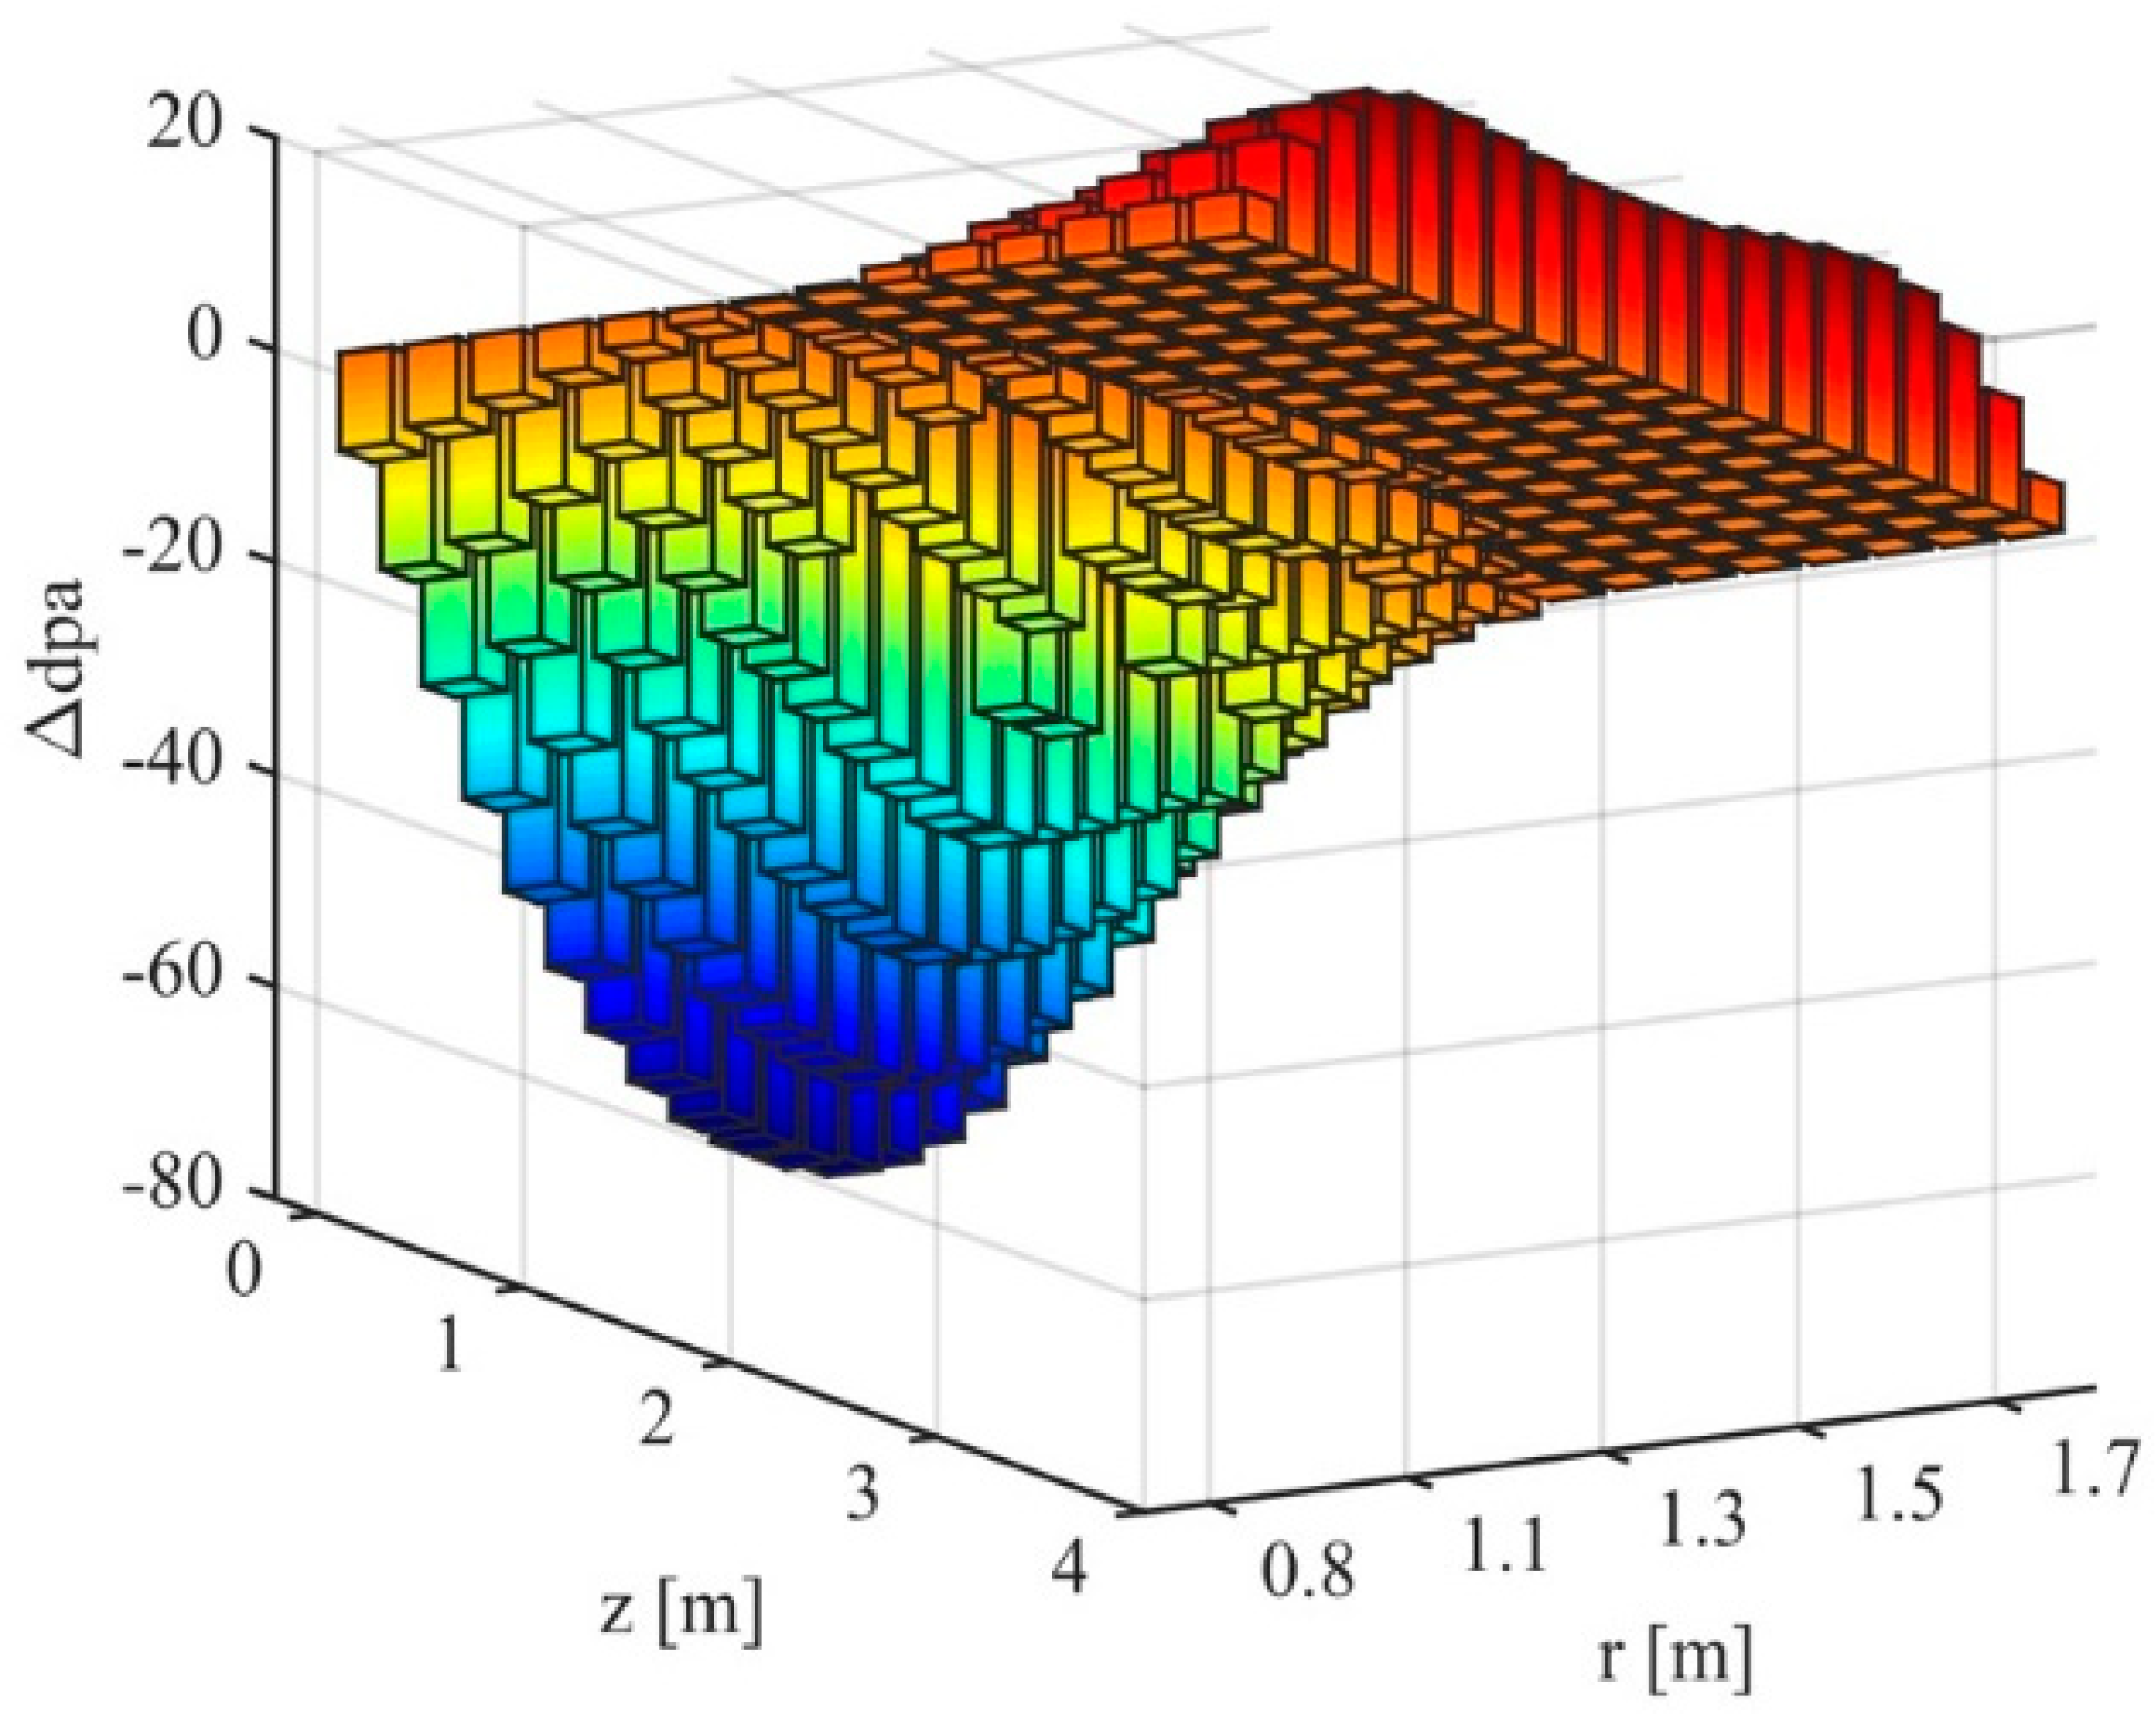
Figure 3.
Changes in dpa in due to spectral softening in the metal core. The core centerline experienced the greatest reduction in dpa, with a corresponding axial position of 180 cm to 220 cm (assembly region 3 in Figure 11). The rise in dpa at the outer edge of the core was due to neutrons being reflected back into the core when a beryllium reflector was present.

Figure 4.
Radial and axial dpa in the unsoftened mixed-oxide core. The depression in the center was due to the diluent region. The peak dpa at 8.4 years was 225 in assembly region 6 between 80 cm and 100 cm along the radial direction, and between 300 cm and 320 cm along the axial direction. The dpa was significantly lower near the beryllium reflector regions (corresponding to regions 1, 2, and 17–20 in Figure 11) due to a lower overall fluence. The peak dpa in the fuel regions adjacent to the inner and outer reflectors were 181 and 73, respectively.

Figure 5.
Radial and axial dpa in the softened mixed-oxide core. The depression in the center was due to the diluent region. The peak dpa at 8.4 years was 203 in assembly region 7 between 80 cm and 100 cm along the radial direction, and between 300 cm and 320 cm along the axial direction. The dpa was significantly lower near the beryllium reflector regions (corresponding to regions 1, 2, and 17–20 in Figure 11) due to both a softer neutron spectrum, and a lower overall fluence. The peak dpa in the fuel regions adjacent to the inner and outer reflectors were 130 and 91, respectively.

Figure 6.
Changes in dpa in due to spectral softening in the oxide core. The core centerline experienced the greatest reduction in dpa, with a corresponding axial position of 180 cm to 220 cm (assembly region 3 in Figure 11). Again, the rise in dpa at the outer edge of the core was due to neutrons being reflected back into the core when a beryllium reflector was present.

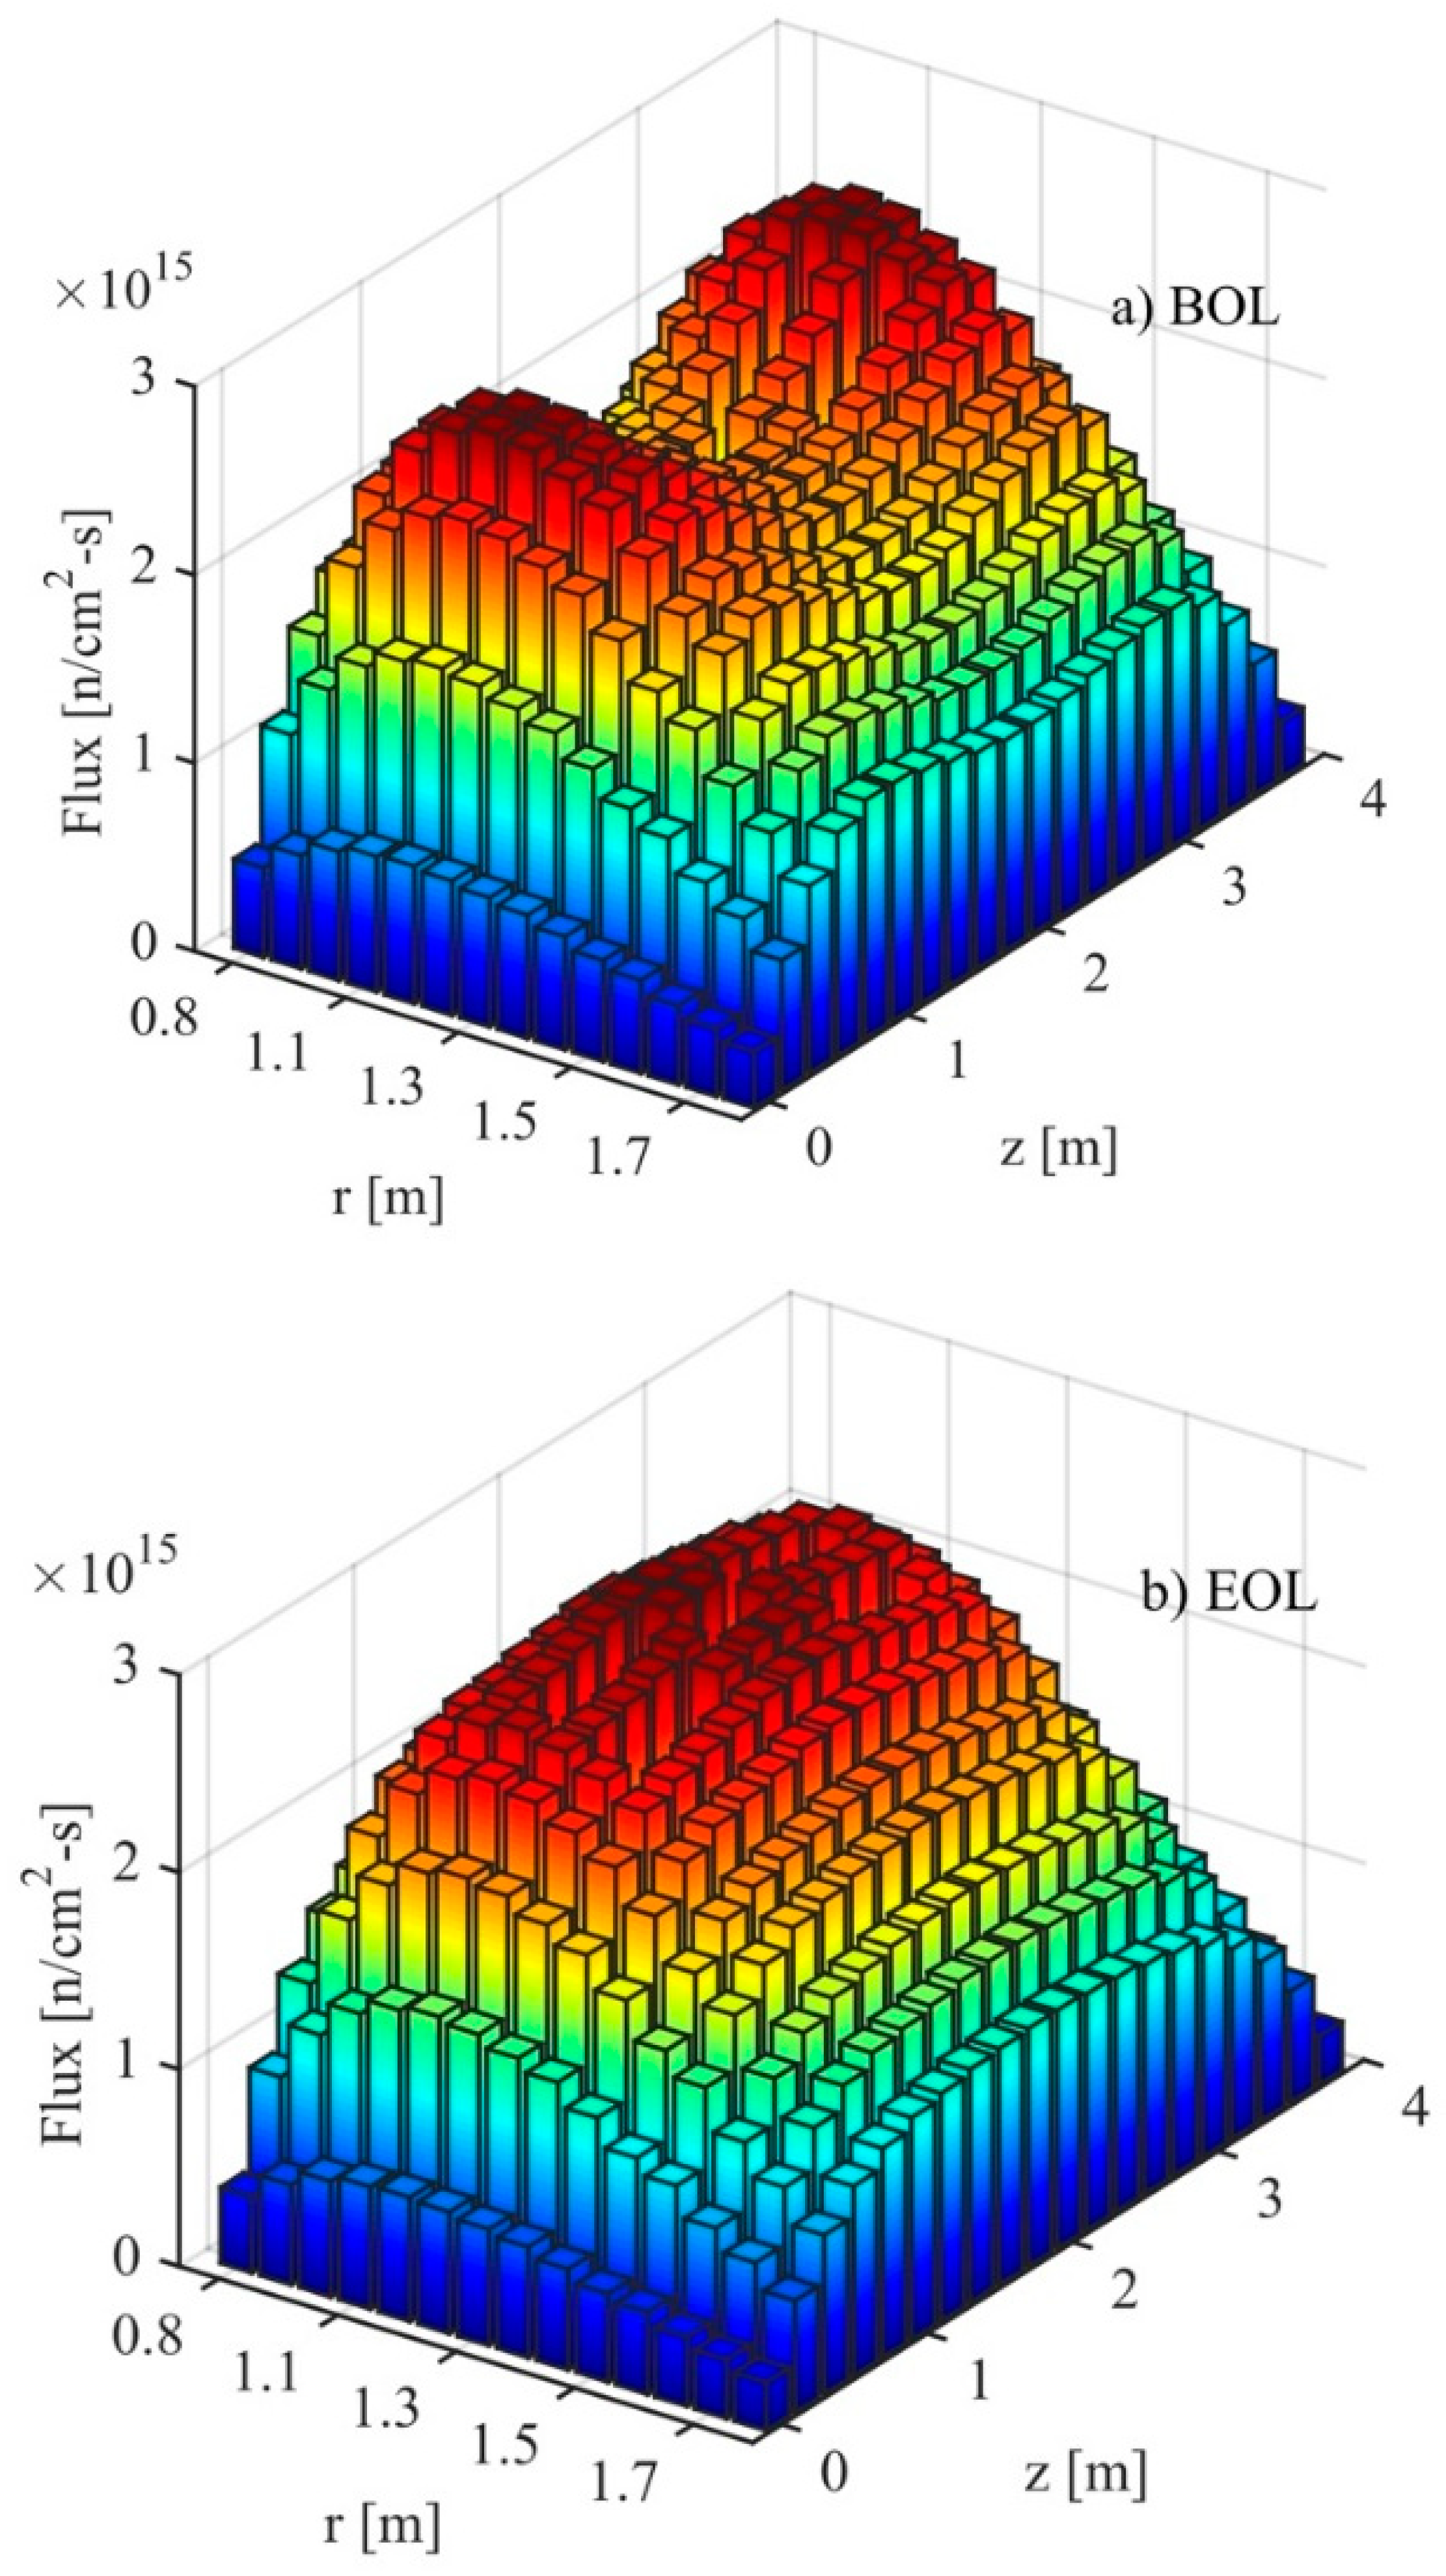
Figure 7.
Three dimensional (3D) neutron flux profiles in the softened mixed-oxide core. (a) Neutron flux at the beginning of life (BOL). Peak flux was 2.76 × 10¹⁵ n/cm2-s in assembly region 7 between 80 cm and 100 cm along the radial direction, and between 300 cm and 320 cm along the axial direction. (b) Neutron flux at the end of life (EOL), 8.4 years. Peak flux was 2.79 × 10¹⁵ n/cm2-s in assembly region 7 between 180 cm and 220 cm along the axial direction. The flux gradually changed shape due to the increasing concentration of Pu in the inner region of the core.

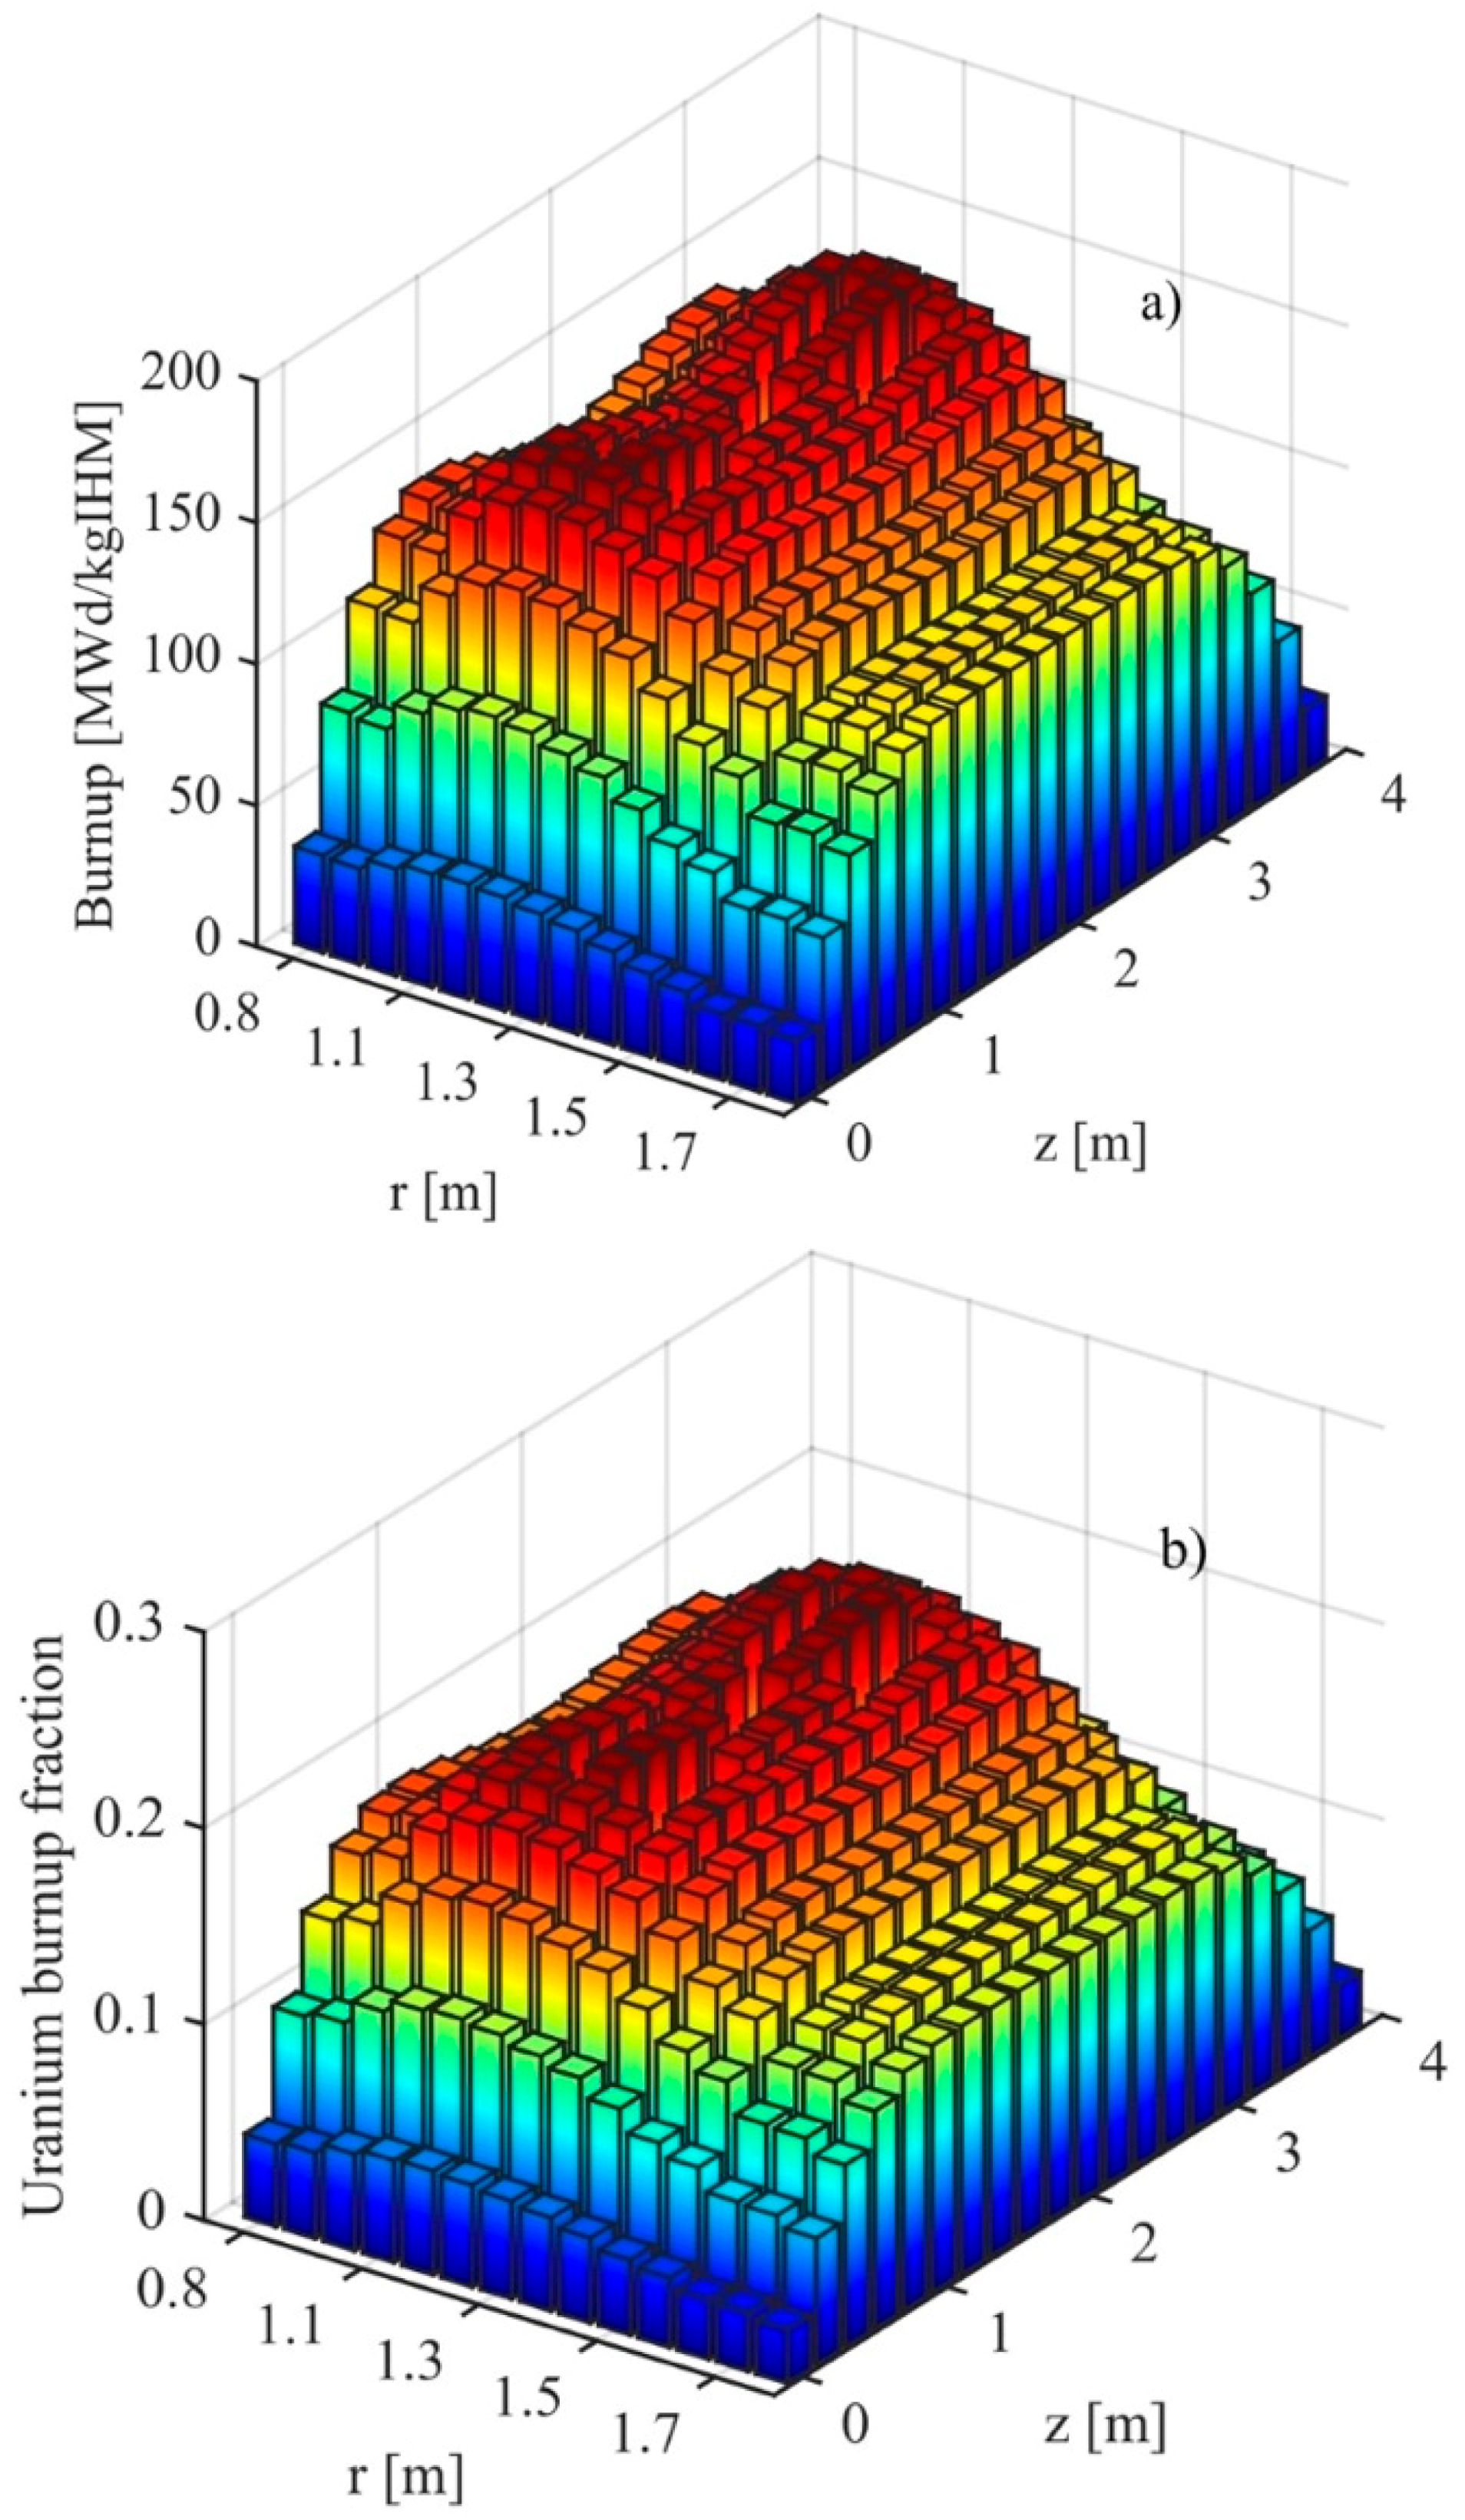
Figure 8.
Position-dependent fuel burnup at 8.4 years in the softened mixed-oxide core. (a) Overall burnup. Peak burnup was 163.4 MWd/kg of initial heavy metal (IHM) in assembly region 7 between 80 cm and 100 cm, and between 300 cm and 320 cm along the axial direction. Core-averaged burnup was 112 MWd/kgIHM. (b) Uranium burnup. The peak uranium burnup fraction was 21.6 a/o in assembly region 8 between 100 cm and 120 cm along the radial direction, and between 280 cm and 300 cm along the axial direction. The core-averaged uranium burnup fraction was 14.7 a/o. The diluent is shown in the empty region in both figures where no burnup was experienced.

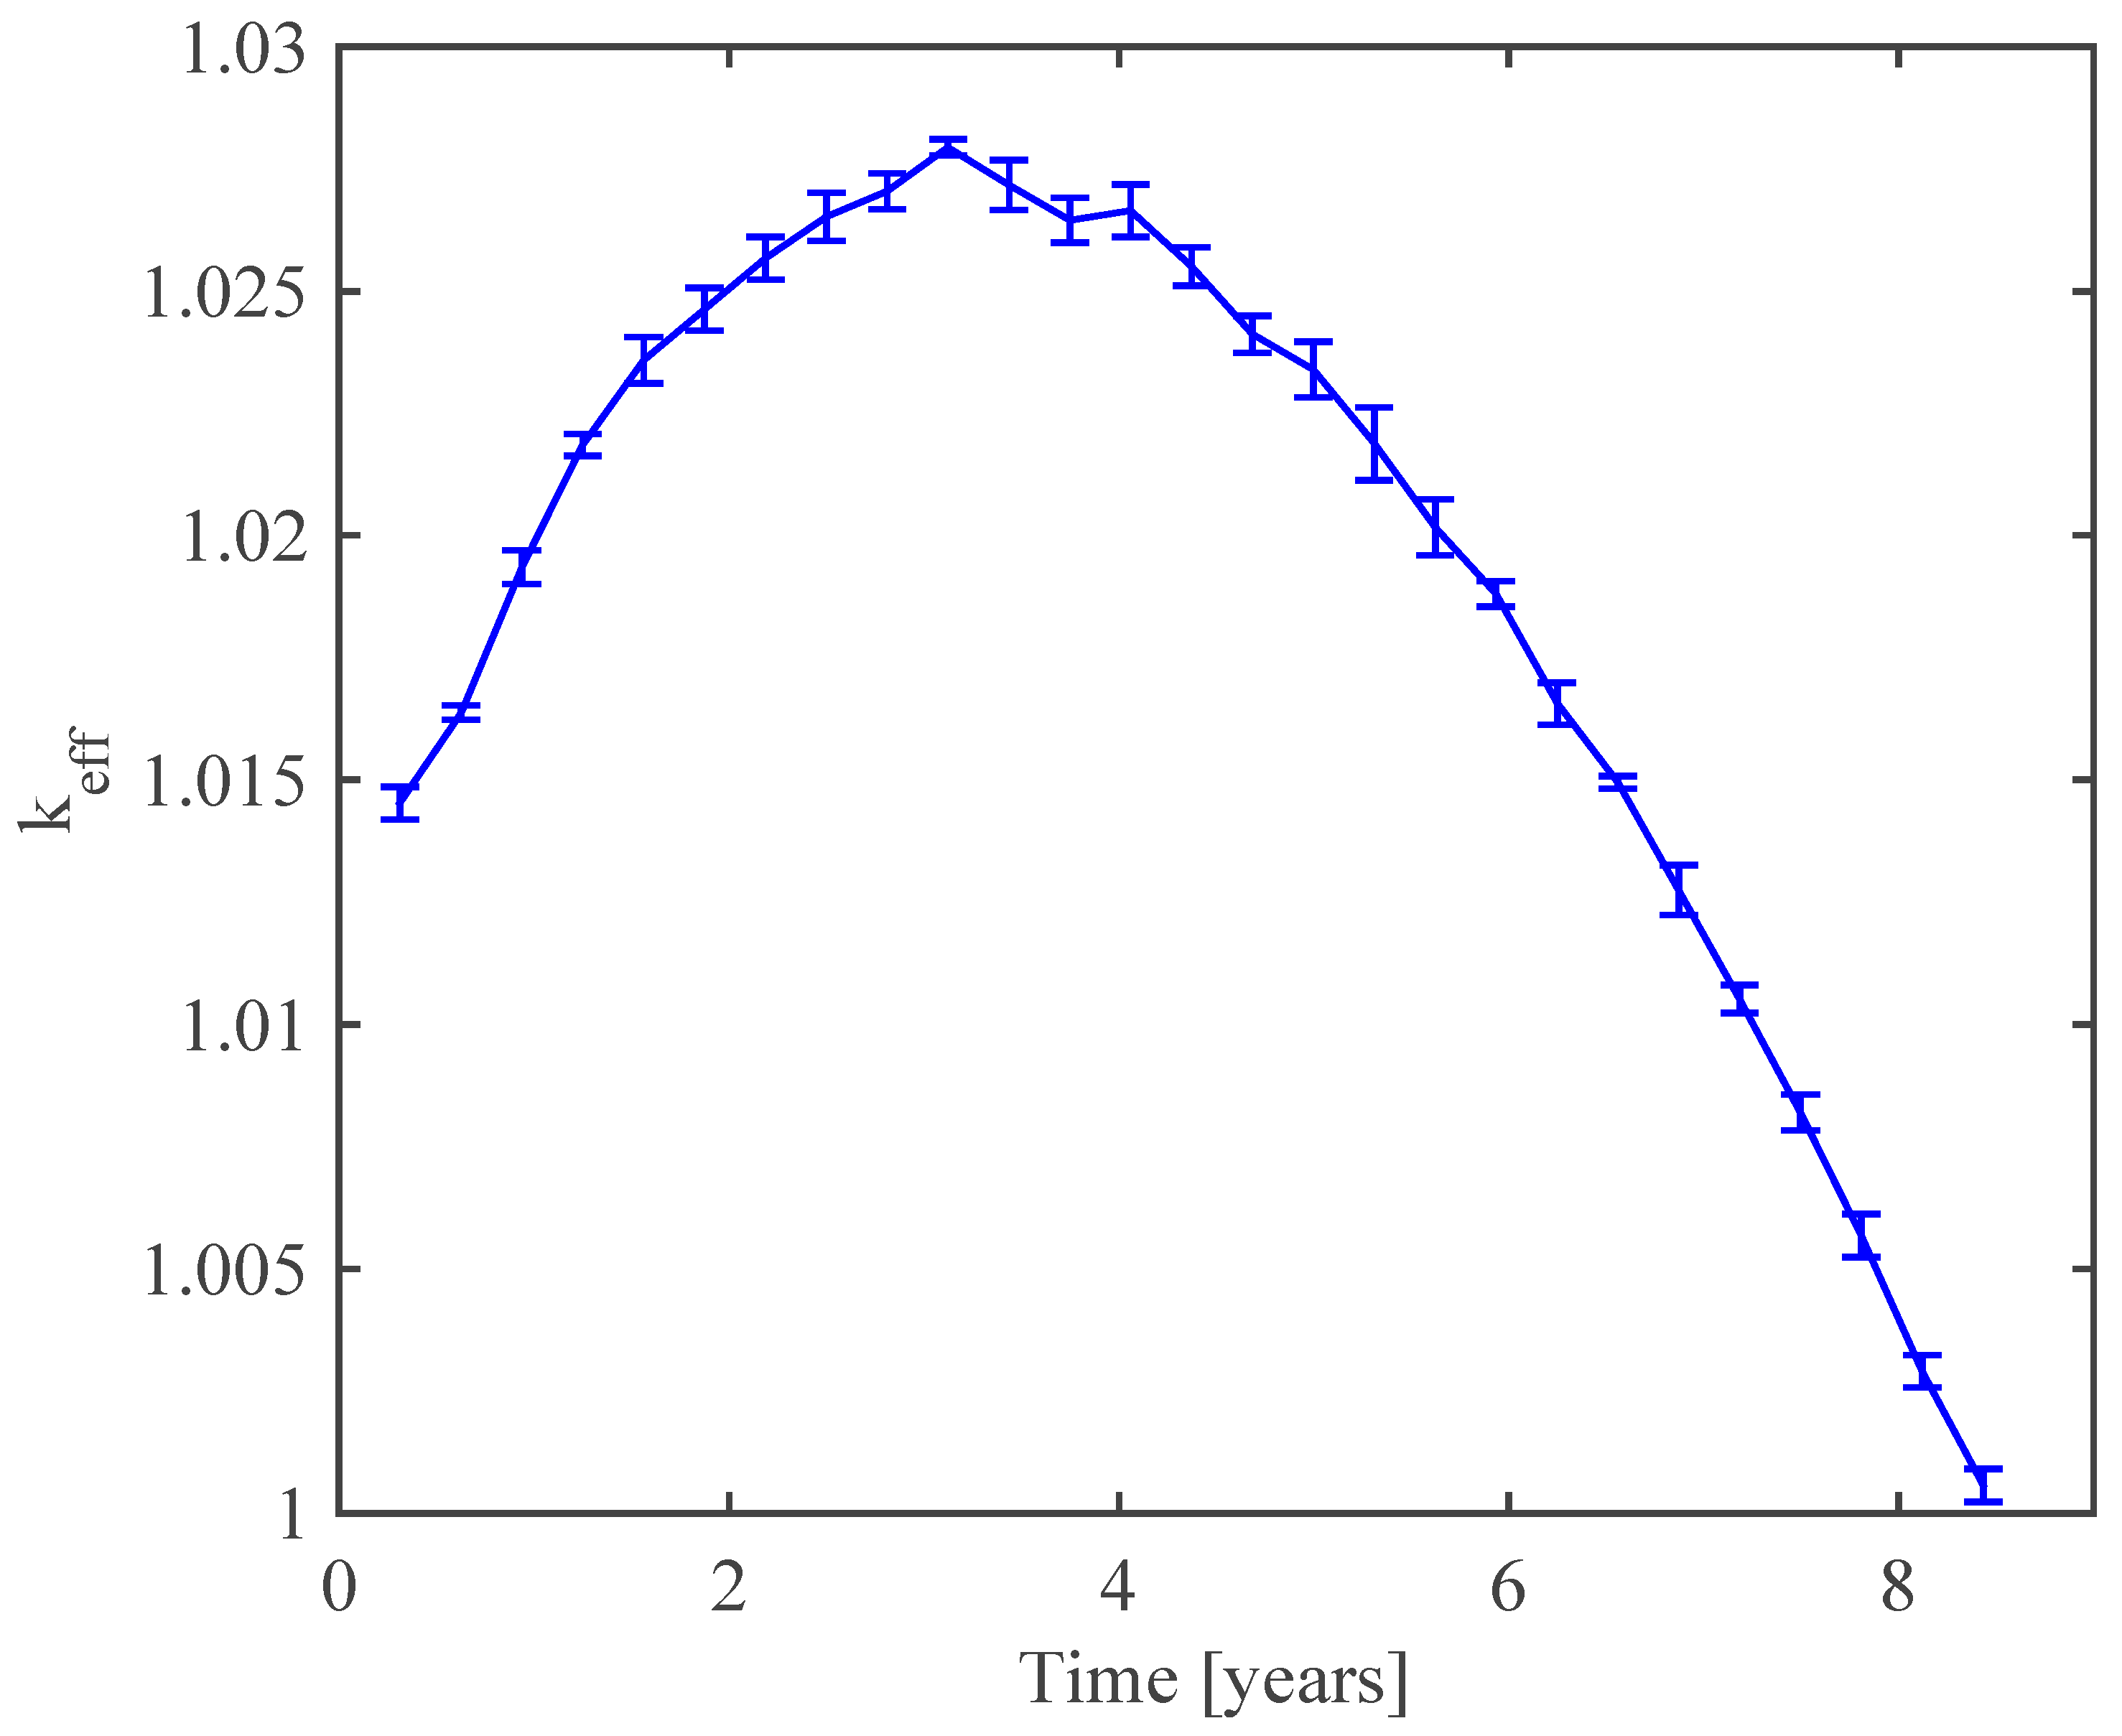
Figure 9.
keff as a function of time in the softened mixed-oxide core. The neutron multiplication factor increased for the first 2.8 years as plutonium was bred in. The peak keff was 1.028 at t = 2.8 years. At t = 8.4 years, corresponding to 203 dpa, keff = 1.001. The keff shown is the average of five burnup simulations of the softened mixed-oxide core using different random number seeds. The error bars are shown for one standard deviation, corresponding to the 68% confidence level. More details on the calculation of uncertainties are given in Supplementary Note 8.

Figure 10.
Temperature profiles of the fuel, cladding, and coolant. Blue, green, and red lines represent the temperatures of the fuel, inner cladding, and coolant, respectively. Data represent the axial temperature in assembly region 8 of the reactor which reached the highest fuel temperature—1423 K. The profiles were computed at the beginning of life. The central dip feature was due to the diluent at the z = 2 m axial position.

Figure 11.
Reactor core structure. Numbered cells belong to a single material region. Material content varied with axial and radial position. Material regions 1, 2, 17, 18, 19, and 20 contained beryllium assemblies (softened cores), or sodium-filled assemblies (unsoftened cores) in all axial locations. Material regions 3 to 16 contained fuel, with each numbered cell belonging to a single burnup region, or sodium diluent, which varied axially. Specific contents of each radial and axial material region are listed in Table 3.


Table 1.
Reactivity coefficients. The coefficients were computed by perturbing the fuel temperature only, the coolant temperature, and the coolant density only.
Table 1.
Reactivity coefficients. The coefficients were computed by perturbing the fuel temperature only, the coolant temperature, and the coolant density only.
| Core | Metal, Unsoftened | Metal, Softened | Mixed Oxide, Unsoftened | Mixed Oxide, Softened |
|---|---|---|---|---|
| Beginning of life αDoppler (K−1) αcoolant (K−1) αvoid (per % void) | −2.7 ± 0.2 × 10⁻⁶ 9.7 ± 0.2 × 10⁻⁶ 3.3 ± 0.006 × 10⁻⁴ | −5.0 ± 0.2 × 10⁻⁶ 1.1 ± 0.02 × 10⁻⁵ 3.5 ± 0.006 × 10⁻⁴ | −8.2 ± 0.2 × 10⁻⁶ 5.3 ± 0.2 × 10⁻⁶ 1.8 ± 0.007 × 10⁻⁴ | −9.5 ± 0.2 × 10⁻⁶ 7.1 ± 0.2 × 10⁻⁶ 2.1 ± 0.007 × 10⁻⁴ |
| Middle of life αDoppler (K−1) αcoolant (K−1) αvoid (per % void) | −2.0 ± 0.2 × 10⁻⁶ 1.2 ± 0.06 × 10⁻⁵ 4.1 ± 0.006 × 10⁻⁴ | −4.0 ± 0.2 × 10⁻⁶ 1.3 ± 0.02 × 10⁻⁵ 3.8 ± 0.006 × 10⁻⁴ | −6.0 ± 0.2 × 10⁻⁶ 7.7 ± 0.2 × 10⁻⁶ 2.7 ± 0.007 × 10⁻⁴ | −6.9 ± 0.2 × 10⁻⁶ 7.7 ± 0.2 × 10⁻⁶ 2.6 ± 0.007 × 10⁻⁴ |
| End of life αDoppler (K−1) αcoolant (K−1) αvoid (per % void) | −2.3 ± 0.2 × 10⁻⁶ 1.3 ± 0.02 × 10⁻⁵ 4.4 ± 0.007 × 10⁻⁴ | −2.7 ± 0.2 × 10⁻⁶ 1.3 ± 0.02 × 10⁻⁵ 4.0 ± 0.007 × 10⁻⁴ | −4.7 ± 0.2 × 10⁻⁶ 8.5 ± 0.2 × 10⁻⁶ 3.0 ± 0.007 × 10⁻⁴ | −5.5 ± 0.2 × 10⁻⁶ 8.9 ± 0.2 × 10⁻⁶ 2.9 ± 0.007 × 10⁻⁴ |
Table 2.
Design parameters for all four cores. The fuel densities shown were the actual densities used in the simulation. The fuel density of the softened mixed oxide core was computed by adding mixed-oxide fuel at a density of 11 g/cm3 with beryllium at 1.85 g/cm3 in a density-weighted linear fashion, given 9.675 a/o Be and assuming a 95% smear density. The fuel densities of the softened metal core and the unsoftened cores were computed using the softened mixed-oxide core fuel as a basis, and by requiring that the overall mass of actinides in each core was the same.
| Core | Metal, Unsoftened | Metal, Softened | Mixed Oxide, Unsoftened | Mixed Oxide, Softened |
|---|---|---|---|---|
| Power (MWth) | 4740 | |||
| Number of assemblies | 1039 | |||
| Fuel form | U-Pu-Zr | U-Pu-Zr-Be | Mixed oxide (MOX) | MOX-Be |
| Beryllium a/o, relative to actinides | 0% | 9.675% | 0% | 9.675% |
| Zirconium w/o, overall | 10% | 10% | 0% | 0% |
| Fuel density (g/cm3) | 9.95 | 9.98 | 10.16 | 10.26 |
| Fuel/coolant/void/structural volume ratios | 42.18/25.24/7.44/25.13% | |||
| Inlet coolant temperature (K) | 659 | |||
| Core flat-to-flat diameter (cm) | 401.66 | |||
| Assembly flat-to-flat diameter (cm) | 11.5917 | |||
| Duct thickness (cm) | 0.1 | |||
| Pins per assembly | 127 | |||
| Cladding thickness (cm) | 0.038 | |||
| Fuel pellet diameter (cm) | 0.754 | |||
| Helium gap thickness (cm) | 0.01 | |||
| Helium void diameter (cm) | 0.2435 | |||
| Assembly pitch (cm) | 11.7917 | |||
| Pin pitch (cm) | 1.0175 | |||
| Pin diameter (cm) | 0.85 | |||
| Relative abundance of plutonium nuclides | 238Pu 0.8 atom % 239Pu 63.18 atom % 240Pu 32.71 atom % 241Pu 1.24 atom % 242Pu 2.07 atom % | |||
Table 3.
Radial and axial plutonium concentration. Column headings refer to axial positions. The axial concentration from 0 cm to −200 cm is the reflection of the concentration from 0 cm to 200 cm, and the core was reflected about z = 0 cm. Values are plutonium concentrations as a proportion of total heavy metal in each region, in atomic percent.
| Axial Position | 0–20 cm | 20–40 cm | 40–60 cm | 60–80 cm | 80–100 cm | 100–120 cm | 120–140 cm | 140–160 cm | 160–180 cm | 180–200 cm |
|---|---|---|---|---|---|---|---|---|---|---|
| Material Region | ||||||||||
| 3 | 12.00 | 12.44 | 12.89 | 13.33 | 13.78 | 14.22 | 14.67 | 15.11 | 15.56 | 16.00 |
| 4 | 12.31 | 12.72 | 13.13 | 13.54 | 13.95 | 14.36 | 14.77 | 15.18 | 15.59 | 16.00 |
| 5 | 12.62 | 12.99 | 13.37 | 13.74 | 14.12 | 14.50 | 14.87 | 15.25 | 15.62 | 16.00 |
| 6 | 12.92 | 13.26 | 13.61 | 13.95 | 14.29 | 14.63 | 14.97 | 15.32 | 15.66 | 16.00 |
| 7 | 13.23 | Na | Na | Na | Na | 14.77 | 15.08 | 15.38 | 15.69 | 16.00 |
| 8 | Na | 13.81 | 14.09 | 14.36 | 14.63 | 14.91 | 15.18 | 15.45 | 15.73 | 16.00 |
| 9 | 13.85 | 14.09 | Na | Na | Na | 15.04 | 15.28 | 15.52 | 15.76 | 16.00 |
| 10 | 14.15 | 14.36 | 14.56 | 14.77 | 14.97 | 15.18 | 15.38 | 15.59 | 15.79 | 16.00 |
| 11 | 14.46 | 14.63 | 14.80 | 14.97 | 15.15 | 15.32 | 15.49 | 15.66 | 15.83 | 16.00 |
| 12 | 14.77 | 14.91 | 15.04 | 15.18 | 15.32 | 15.45 | 15.59 | 15.73 | 15.86 | 16.00 |
| 13 | 15.08 | 15.18 | 15.28 | 15.38 | 15.49 | 15.59 | 15.69 | 15.79 | 15.90 | 16.00 |
| 14 | 15.38 | 15.45 | 15.52 | 15.59 | 15.66 | 15.73 | 15.79 | 15.86 | 15.93 | 16.00 |
| 15 | 15.69 | 15.73 | 15.76 | 15.79 | 15.83 | 15.86 | 15.90 | 15.93 | 15.97 | 16.00 |
| 16 | 16.00 | 16.00 | 16.00 | 16.00 | 16.00 | 16.00 | 16.00 | 16.00 | 16.00 | 16.00 |
© 2018 by the authors. Licensee MDPI, Basel, Switzerland. This article is an open access article distributed under the terms and conditions of the Creative Commons Attribution (CC BY) license (http://creativecommons.org/licenses/by/4.0/).
Share and Cite
MDPI and ACS Style
Osborne, A.G.; Deinert, M.R. Reducing Irradiation Damage in a Long-Life Fast Reactor with Spectral Softening. Energies 2018, 11, 1507. https://doi.org/10.3390/en11061507
AMA Style
Osborne AG, Deinert MR. Reducing Irradiation Damage in a Long-Life Fast Reactor with Spectral Softening. Energies. 2018; 11(6):1507. https://doi.org/10.3390/en11061507
Chicago/Turabian StyleOsborne, Andrew G., and Mark R. Deinert. 2018. "Reducing Irradiation Damage in a Long-Life Fast Reactor with Spectral Softening" Energies 11, no. 6: 1507. https://doi.org/10.3390/en11061507
Note that from the first issue of 2016, this journal uses article numbers instead of page numbers. See further details here.