Space Charge Modulated Electrical Breakdown of Oil Impregnated Paper Insulation Subjected to AC-DC Combined Voltages


1
State Key Laboratory of Electrical Insulation and Power Equipment, Xi’an Jiaotong University, Xi’an 710049, China
2
School of Electronics and Computer Science University of Southampton, Southampton SO17 1BJ, UK
*
Author to whom correspondence should be addressed.
Energies 2018, 11(6), 1547; https://doi.org/10.3390/en11061547
Submission received: 14 May 2018
/
Revised: 29 May 2018
/
Accepted: 31 May 2018
/
Published: 13 June 2018
(This article belongs to the Section F: Electrical Engineering)
Abstract
:Based on the existing acknowledgment that space charge modulates AC and DC breakdown of insulating materials, this investigation promotes the related investigation into the situations of more complex electrical stress, i.e., AC-DC combined voltages. Experimentally, the AC-DC breakdown characteristics of oil impregnated paper insulation were systematically investigated. The effects of pre-applied voltage waveform, AC component ratio, and sample thickness on AC-DC breakdown characteristics were analyzed. After that, based on an improved bipolar charge transport model, the space charge profiles and the space charge induced electric field distortion during AC-DC breakdown were numerically simulated to explain the differences in breakdown characteristics between the pre-applied AC and pre-applied DC methods under AC-DC combined voltages. It is concluded that large amounts of homo-charges are accumulated during AC-DC breakdown, which results in significantly distorted inner electric field, leading to variations of breakdown characteristics of oil impregnated paper insulation. Therefore, space charges under AC-DC combined voltages must be considered in the design of converter transformers. In addition, this investigation could provide supporting breakdown data for insulation design of converter transformers and could promote better understanding on the breakdown mechanism of insulating materials subjected to AC-DC combined voltages.
1. Introduction
The high voltage direct current (HVDC) technique is widely employed in long distance power transmission due to its advantages of low line loss and high operating stability [1]. According to a statistical data by the end of 2016, 4 ± 800 kV HVDC transmission lines have already been put in operation and six HVDC lines are now under construction in China [2]. Converter transformer is one of the key equipment in HVDC transmission system, which operates in long-term complex voltage conditions including DC, AC, polarity reversal, and AC-DC combined voltages. According to CIGRE, the failure rate of converter transformers is 10.3 per 100 units, which is far larger than extra high voltage (EHV) AC transformers. Among all the failures, insulation breakdown accounts for more than 50%, and mainly occurs at the ends of valve-side winding, caused by AC-DC combined voltages [3].
Oil impregnated paper (OIP) is a typical cellulose-liquid biphasic insulating material, and is the main insulating material in converter transformers. Since the 1930s, large numbers of investigations on breakdown characteristics of OIP have been conducted. Due to the limitations in testing equipment, the earlier investigations focus on the breakdown characteristics of OIP under single or simple voltage waveforms (DC, AC, and steep front impulse etc.) [4,5,6,7,8]. Among these investigations, Kurita et al. investigated DC breakdown characteristics of OIP and discovered that DC breakdown voltage along paper layers is not as high as that through the laminated paper layers [6]. Moreover, it was found that the DC breakdown voltage along a paper layer is approximately equal to that of transformer oil. Yoshida et al. investigated the AC and impulse breakdown characteristics of OIP at different temperatures [7], and concluded that the AC breakdown voltage of OIP is smaller than its impulse breakdown voltage. In the above investigations, the breakdown characteristics of OIP under single electrical stress were systematically discussed, it is concluded that the breakdown characteristics of OIP change tremendously with applied voltage waveform. However, these investigations ignored the combined voltage conditions and may not meet the practical operating condition of OIP in converter transformers.
In the late 20th century, owning to the development of experimental techniques, breakdown characteristics of OIP under combined electrical stresses are initially investigated [9,10,11,12]. Wang et al. discovered that the breakdown voltage of OIP decreases remarkably with increasing AC ratio of AC-DC combined voltage [11]. Mosinski et al. concluded that the effect of temperature on the DC component in pulsating voltage breakdown is especially obvious, while this is slight on the AC component [12]. Investigations related to partial discharge in OIP under combined voltages were also carried out [13,14]. It was concluded that partial discharge under AC-DC combined voltage occurs at a constant AC component, and the inception voltage of partial discharge shows a downward trend with increasing DC pre-stress. These studies supplemented the knowledge on breakdown characteristics of OIP under AC-DC combined voltages. However, a widely admitted explanation of breakdown mechanism subjected to AC-DC combined voltages has not been revealed. Moreover, the content ratio of AC to DC component is one of the most important factors that affect AC-DC breakdown performance of OIP. This value is not a constant under operation conditions [15], and in fault and extreme conditions, such as polarity reversal and DC bias magnetic problems, the relative value of AC to DC component could even vary in an extremely large range. Therefore, a systemic breakdown investigation that covers a large range of AC content ratio is needed.
Recently, space charge is considered one of the main factors that determines the breakdown mechanism of insulating materials under different voltage waveforms [16,17,18,19,20]. The decreasing breakdown strength with increasing sample thickness, i.e., the geometry effect, in DC breakdown is explained through the accumulation of homo-charges in materials [17,19,20]. Moreover, the mechanism of DC breakdown strength of an insulating material being twice higher than AC breakdown strength is found strongly related to space charges accumulated within 2 μm in vicinity of the sample-electrode interface [19,20,21]. Generally, it can be concluded that the breakdown of insulating materials is space charge modulated. For complex voltage waveform conditions, the investigation of space charge dynamics is at its preliminary stage [20,21]. Zhou et al. compared the space charge accumulations between DC and AC-DC combined voltage [21]. However, this investigation was conducted under a constant electrical stress, which can hardly be utilized in studying breakdown characteristics of insulating materials subjected to ramped voltages. In this regard, how space charge affects the AC-DC combined voltage breakdown is still a debated issue, and is urgently needed to be understood in supporting the insulation design of converter transformers.
Based on the discussion mentioned above, this investigation mainly focuses on obtaining systematical breakdown characteristics, and revealing the space charge modulated electrical breakdown mechanism of OIP under AC-DC combined voltages. More specifically, the breakdown characteristics of OIP under AC-DC combined voltages were first experimentally investigated under two pre-applied voltage methods, i.e., the pre-applied AC method and the pre-applied DC method. After that, the space charge profiles of OIP in AC-DC combined voltage breakdown process were obtained through numerical simulations. The differences in breakdown characteristics between pre-applied AC method and pre-applied DC method were discussed and explained by space charge induced electric field distortion in the vicinity of electrodes.
2. Materials and Methods
This section covers the descriptions of sample preparation, test system, breakdown test procedure, and simulation model.
2.1. Sample Preparation
The insulating paper used in this investigation is provided by Xi’an Power Transformer Corporation, China. The thickness of the insulating paper is 70 μm. The transformer oil used is the Karamay 25# (Kunlun KI25X) transformer oil, which has been widely used in various types of transformers in China.
The Kraft insulating paper was firstly cut into 60 mm × 60 mm square pieces and placed into a 100 Pa and 80 °C oven for 48 h to remove moisture. After that, the insulating paper was kept at 25 °C, 50 Pa for 24 h. After this treatment, the water content in insulating paper was ≤0.2%, which meets the engineering requirement. The Karamay 25# transformer oil was firstly filtered with a double-stage vacuum oil purifier. Then, the filtered oil was heated at 80 °C and 50 Pa for 4 h. After this treatment, the water content in the transformer oil was ≤5 ppm, the air content was ≤0.1%, and the impurity granularity was ≤3 μm.
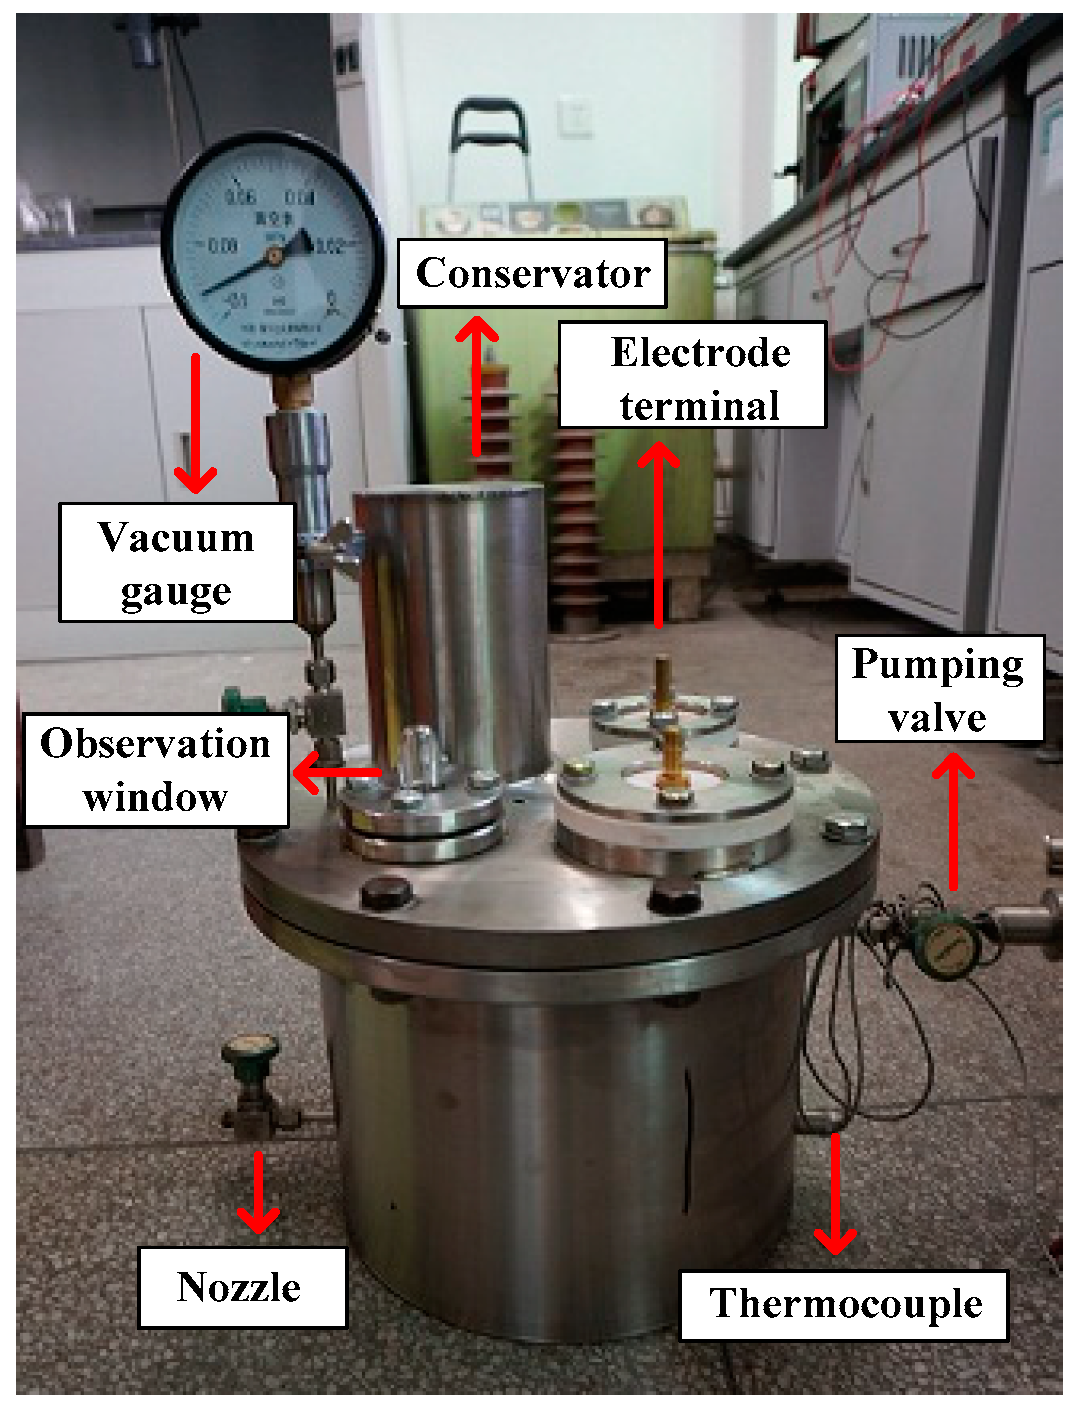
In order to guarantee a same initial condition of OIP samples before breakdown, a vacuum oiling chamber was employed in oil impregnation process. The structure of the vacuum oiling chamber is shown in Figure 1.
Considering a similar process to the practical engineering procedure, the vacuum oiling process is demonstrated as below. The insulating paper was firstly put into a clean oiling chamber, and dried again in vacuum (50 Pa) at 115 °C for 4 h. After that, the Karamay 25# transformer oil was injected. Finally, the vacuum oiling chamber with OIP samples inside was kept at 90 °C for 24 h.
2.2. Test System
The breakdown tester is provided by Xi’an Hongduo electronic and electrical Technology Co., Ltd., which can provide up to 200 kV AC-DC combined voltage waveform (100 kV AC and 100 kV DC).
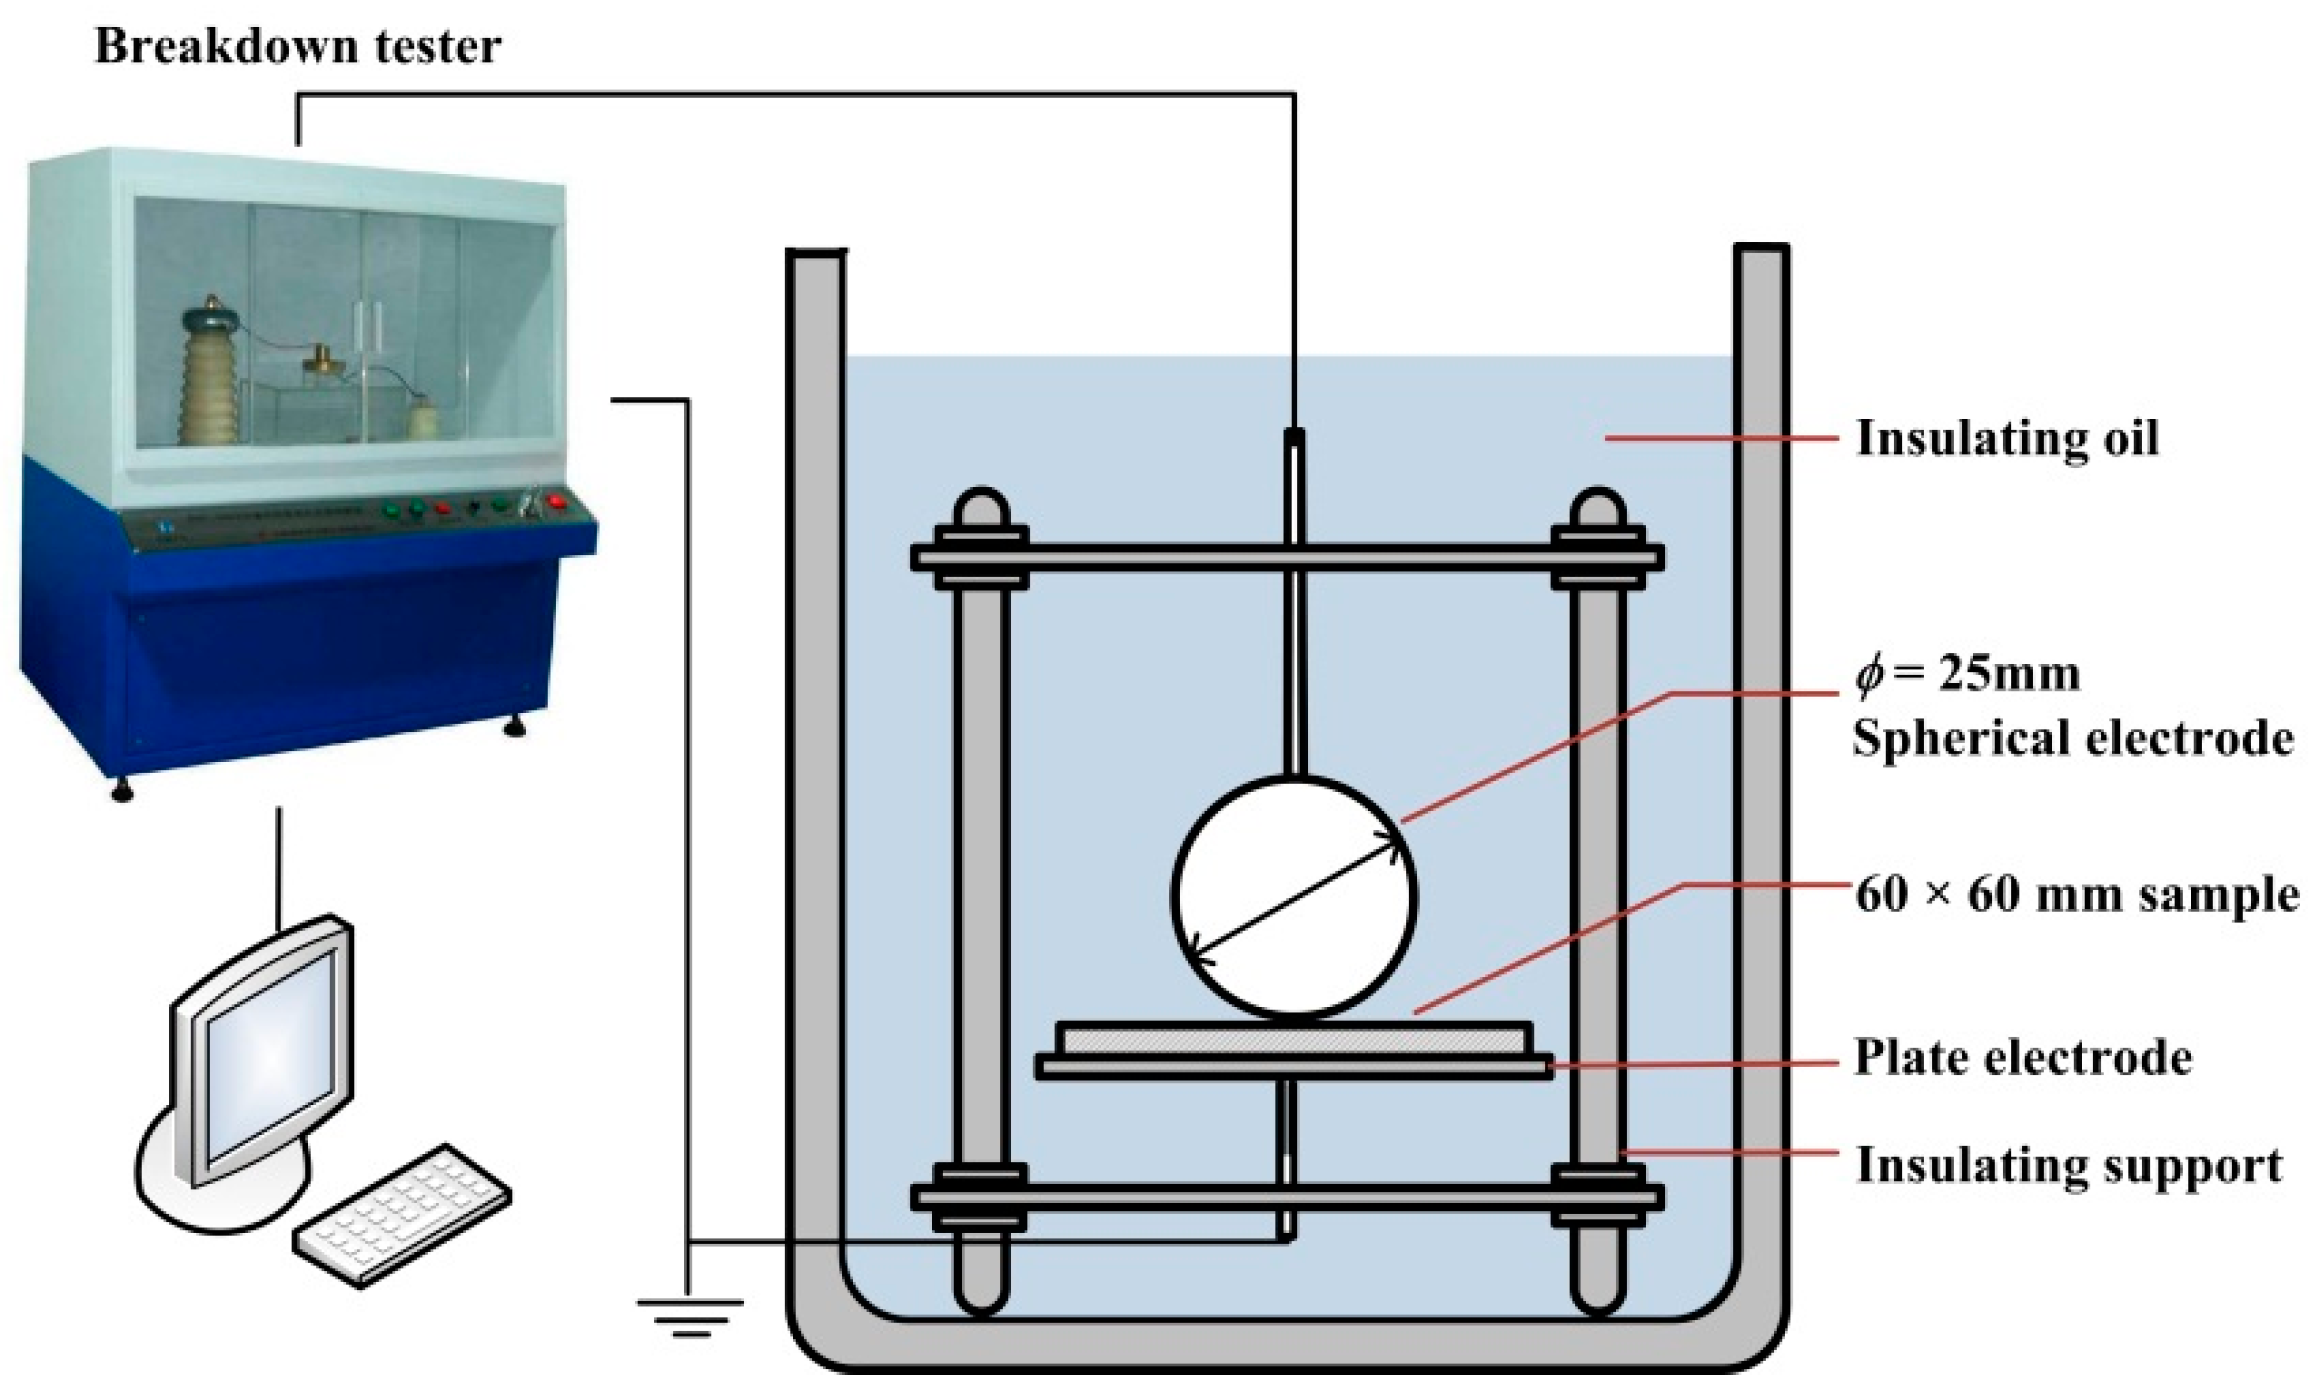
In breakdown tests, a brass spherical-plate electrode (φ = 25 mm) was employed, which could ensure a uniform electric field distribution and reduce physical damage on the surface of OIP samples. The details of the electrodes are shown in Figure 2. In breakdown tests, the spherical electrodes with the OIP sample were immersed into fresh Karamay 25# transformer oil. The upper spherical electrode was connected to the high voltage source, and the lower plate electrode was grounded.
2.3. Breakdown Test Procedure
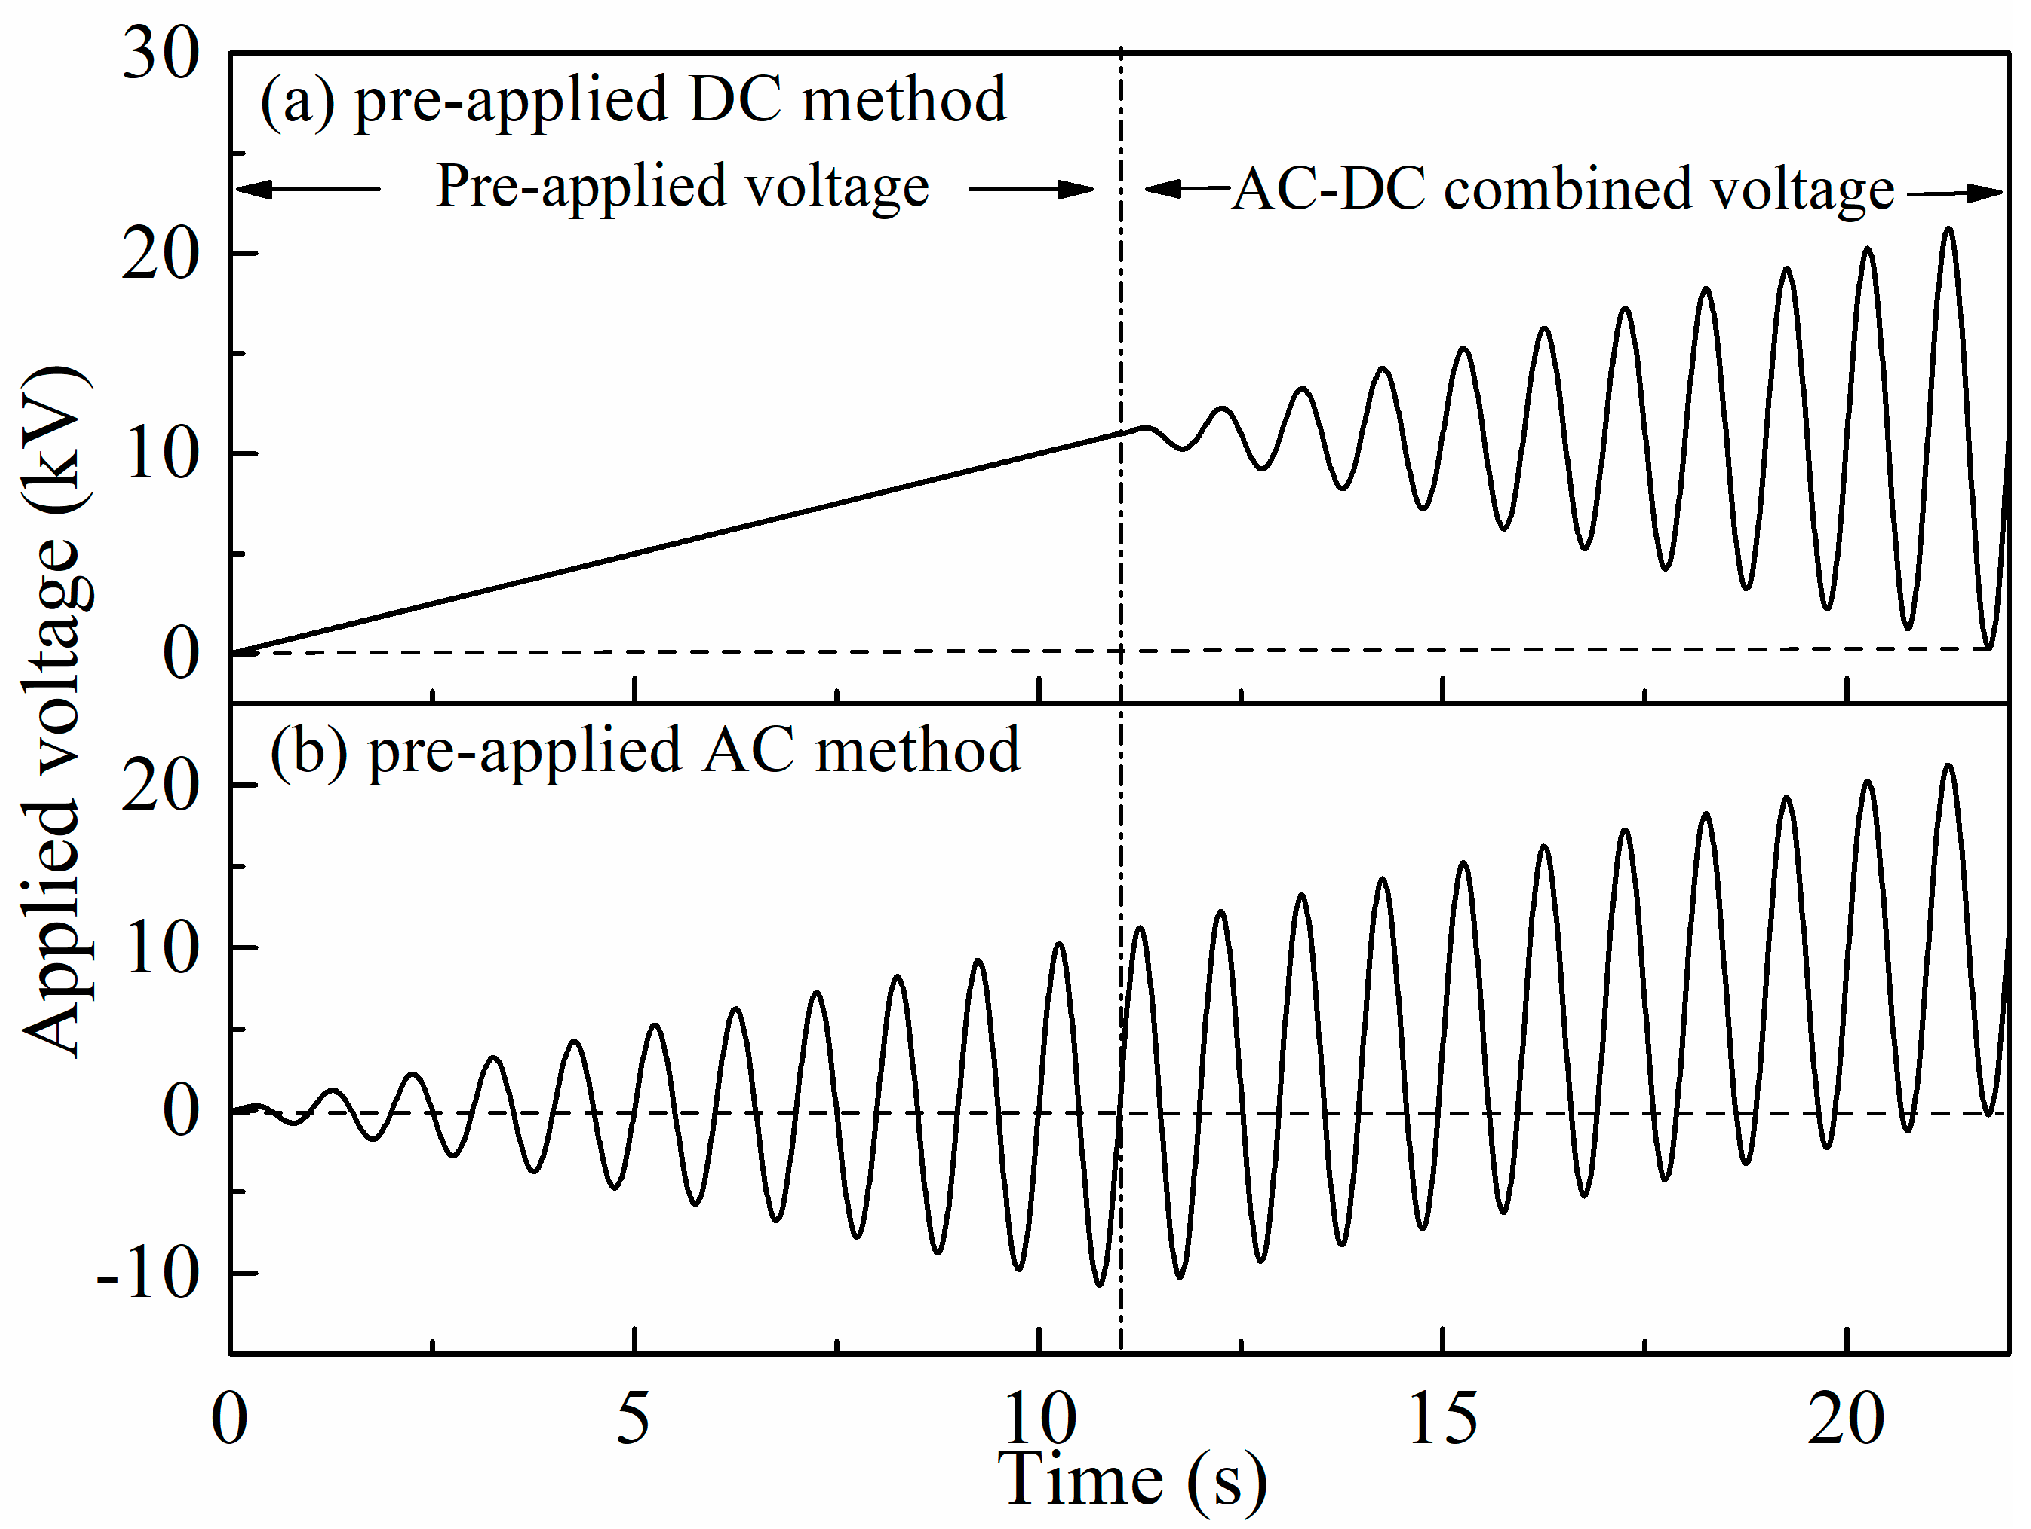
The breakdown tests of OIP under AC-DC combined voltages include two methods, i.e., the pre-applied DC method and pre-applied AC method. In the pre-applied DC method, a DC component is firstly applied on the OIP sample and is elevated at 1 kV/s until a pre-set value. Then, the DC component is kept at a pre-set value and the AC component is applied and gradually increases at 1 kV/s until breakdown, as shown in Figure 3a. When breakdown occurs, the DC component and AC component are separately recorded. In the pre-applied AC method, an AC component is firstly applied, and the voltage ramping rule is similar with the pre-applied DC method, as shown in Figure 3b. In order to ensure the reliability of experimental data, each test is performed 15 times. The AC component is recorded in peak-to-peak value.
2.4. Simulation Model
After considering the characteristics of charge injection, hopping, and diffusion, the charge transport behaviors in OIP in AC-DC combined voltage breakdown process were numerically investigated.
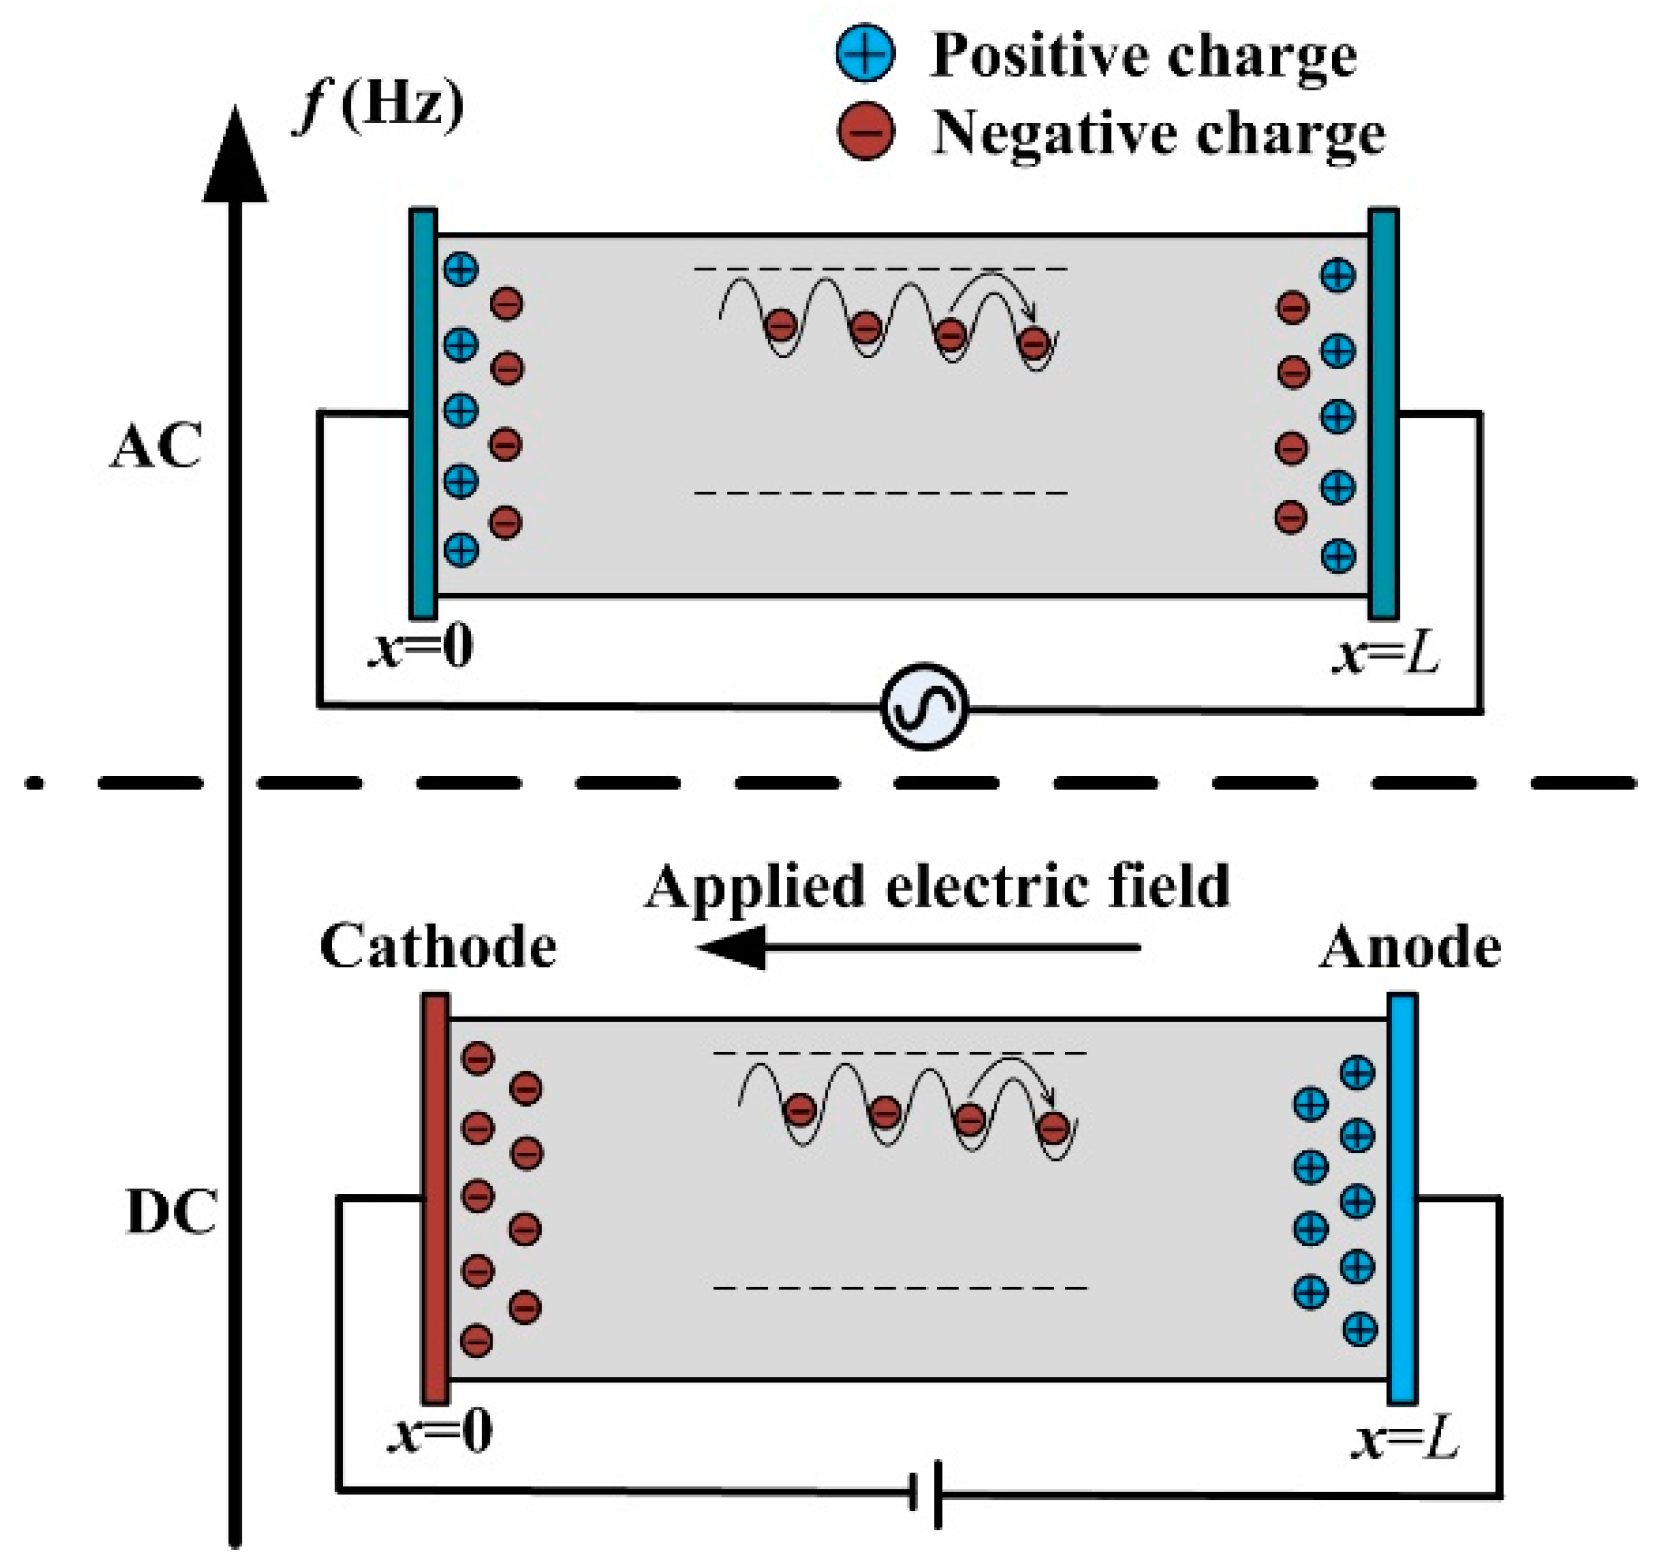
When a voltage is applied to an insulating material, charges can be injected from the electrodes [22]. We utilize a bipolar charge transport (BCT) model to investigate space charge dynamics in oil impregnated paper, as shown in Figure 4. We consider a system consisting of the oil impregnated paper sample with the thickness of L clamped by two electrodes. A one-dimensional coordinate, x, is set up for the sample, where x = 0 corresponds to the interface between the material and the left electrode, while x = L corresponds to the interface between the material and the right electrode.
The electric conduction of OIP under high electric field (>107 V/m) obeys hopping conduction [19]. In this investigation, based on the theory of hopping conduction, space charge dynamics of OIP in AC-DC combined voltage breakdown process were simulated. The assigned parameters in numerical simulation were obtained based on our previous simulations [23,24] and through isothermal surface potential decay (ISPD) experiments, as shown in Nomenclature [19]. To be noted is that the Maxwell-Wagner polarization between layers of oil impregnated paper is ignored in the current stage of simulation.
At room temperature, the charge injection follows Schottky thermionic emission:
where jin is the Schottky emission current in A/m2; A is the Richardson constant; T is the absolute temperature in K; ϕin is the Schottky injection barrier in eV; EF is the electric field in V/m; kB is the Boltzmann constant; qe is the elementary charge in C; ε0 is the vacuum permittivity in F/m; and εr is the dielectric constant (εr = 3.4 for OIP).
The charges in dielectric materials are governed by a set of self-consistent equations.
(a). Charge transport equation:
(b). Charge continuity equation:
(c). Poisson’s equation:
(d). Charge dynamic equation:
where, jc is the conduction current in A/m2; x is the position of sample in m; t is time in s; Q is total charge density in the dielectric in C/m3; μ is the carrier mobility in m2/V; φ is the potential of the charged material in V; S is the source term, R is the recombination coefficient; Qe is negative charge density in C/m3; and Qh is positive charge density in C/m3.
3. Experimental Results
As introduced in Section 2.3, the breakdown tests of OIP under AC-DC combined voltage were conducted in two methods, i.e., the pre-applied DC method and the pre-applied AC method. The results were demonstrated separately as below.
3.1. The Breakdown Characteristics under Pre-Applied DC Method
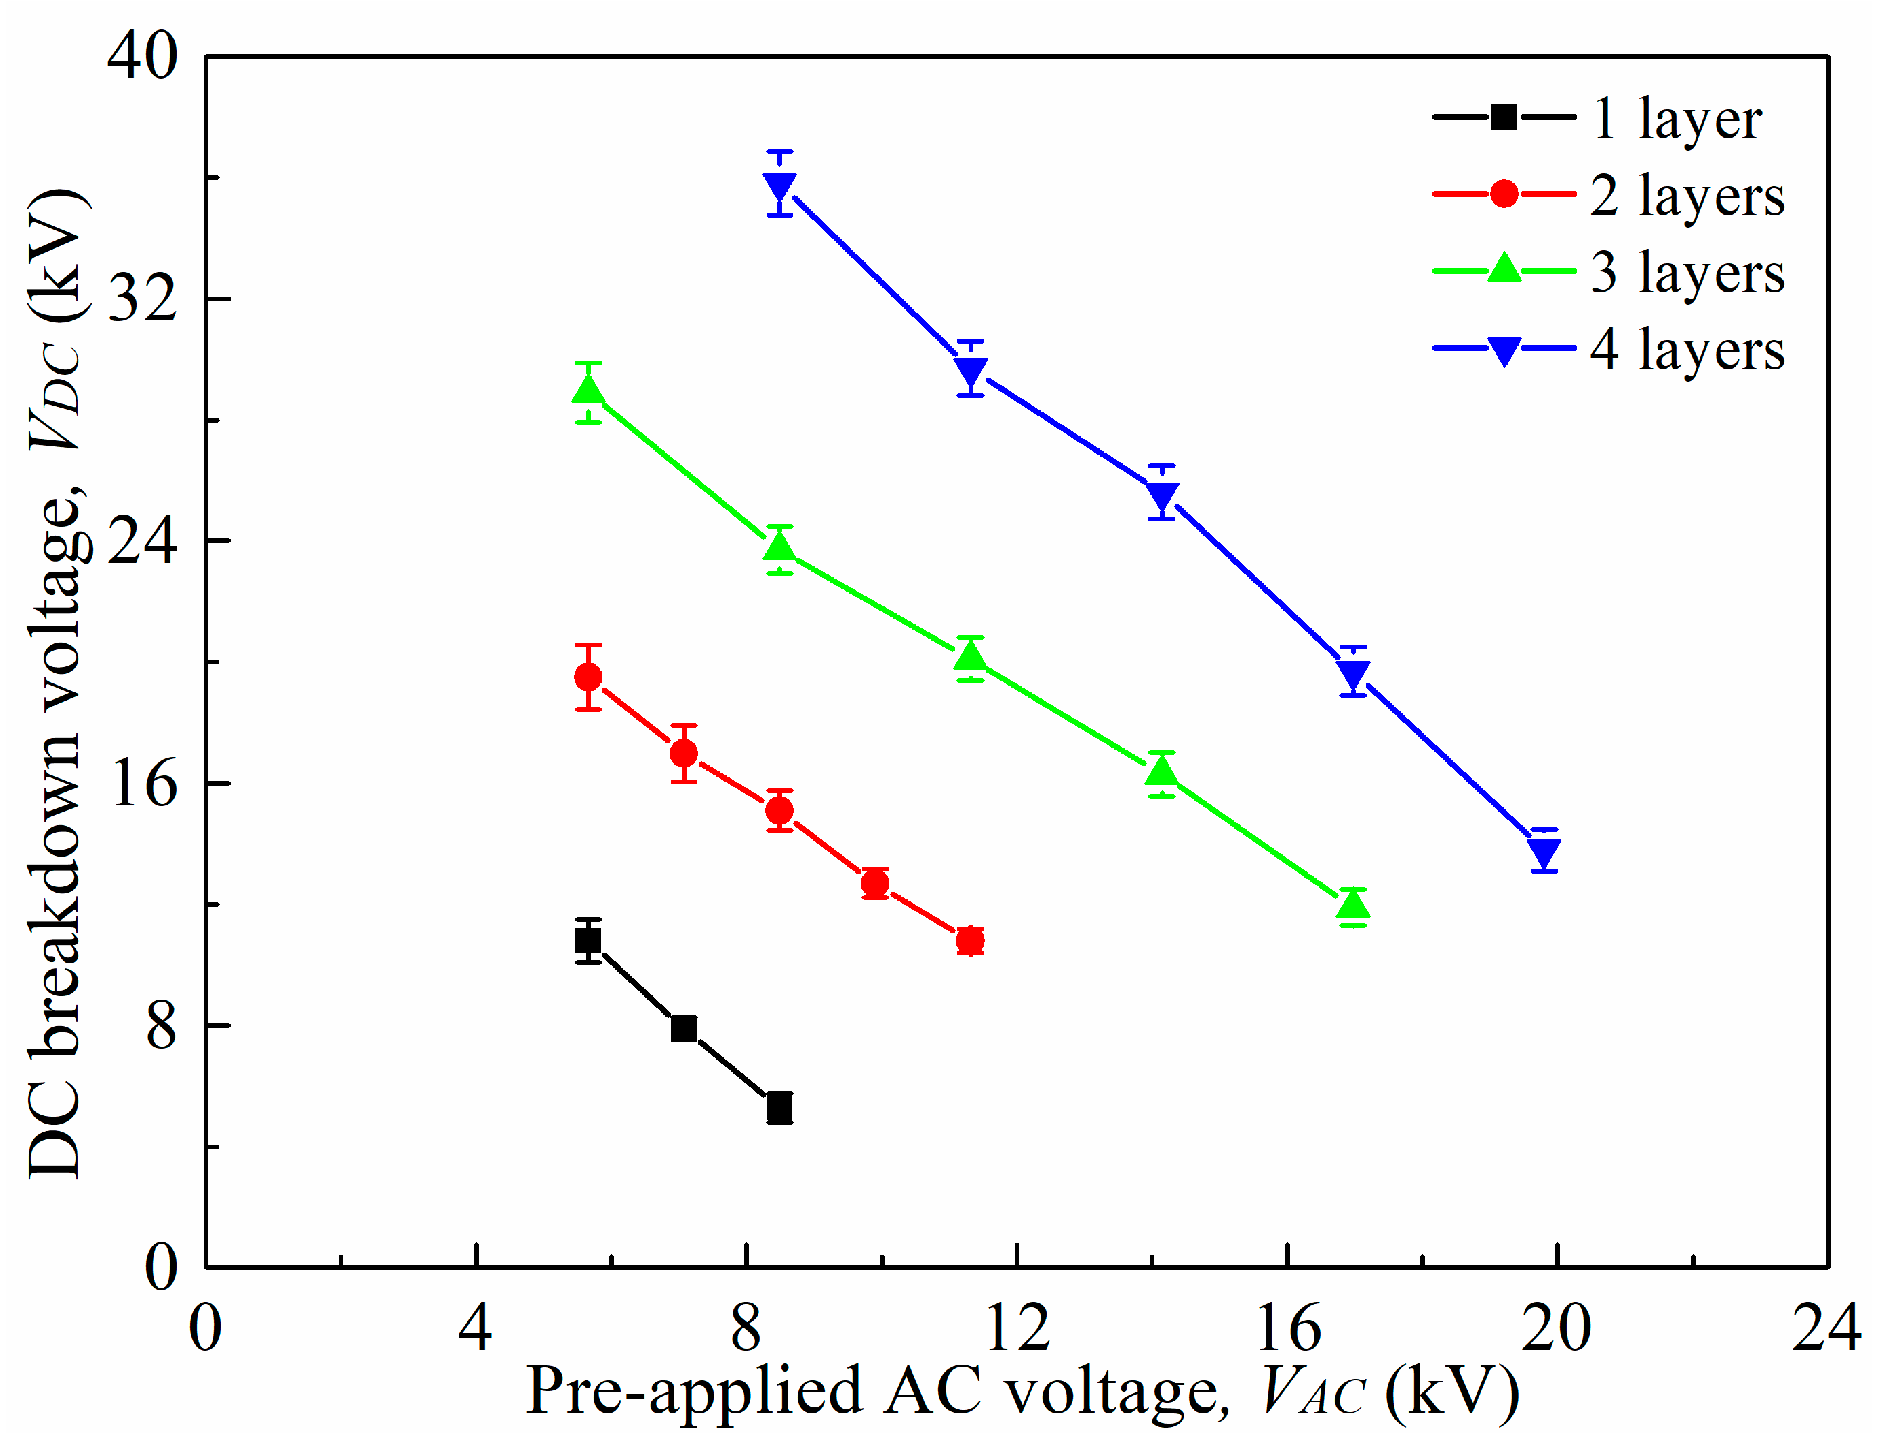
Figure 5 demonstrates the breakdown characteristics of one to four layers of OIP in the pre-applied DC method. VDC is the pre-applied DC voltage; VAC is the AC breakdown voltage in peak value, which is applied after pre-applied DC voltage. It can be observed that VAC decreases with increasing VDC. Moreover, a small increase in VAC can lead to about a two times decrease in VDC, which indicates that the AC breakdown strength of OIP is about half of its DC breakdown strength.
Two parameters were defined to describe the influence of AC component on AC-DC breakdown characteristics of OIP:
where Vtotal is the sum of VAC and VDC, labeled as the total breakdown voltage, and k is the AC content ratio in Vtotal.
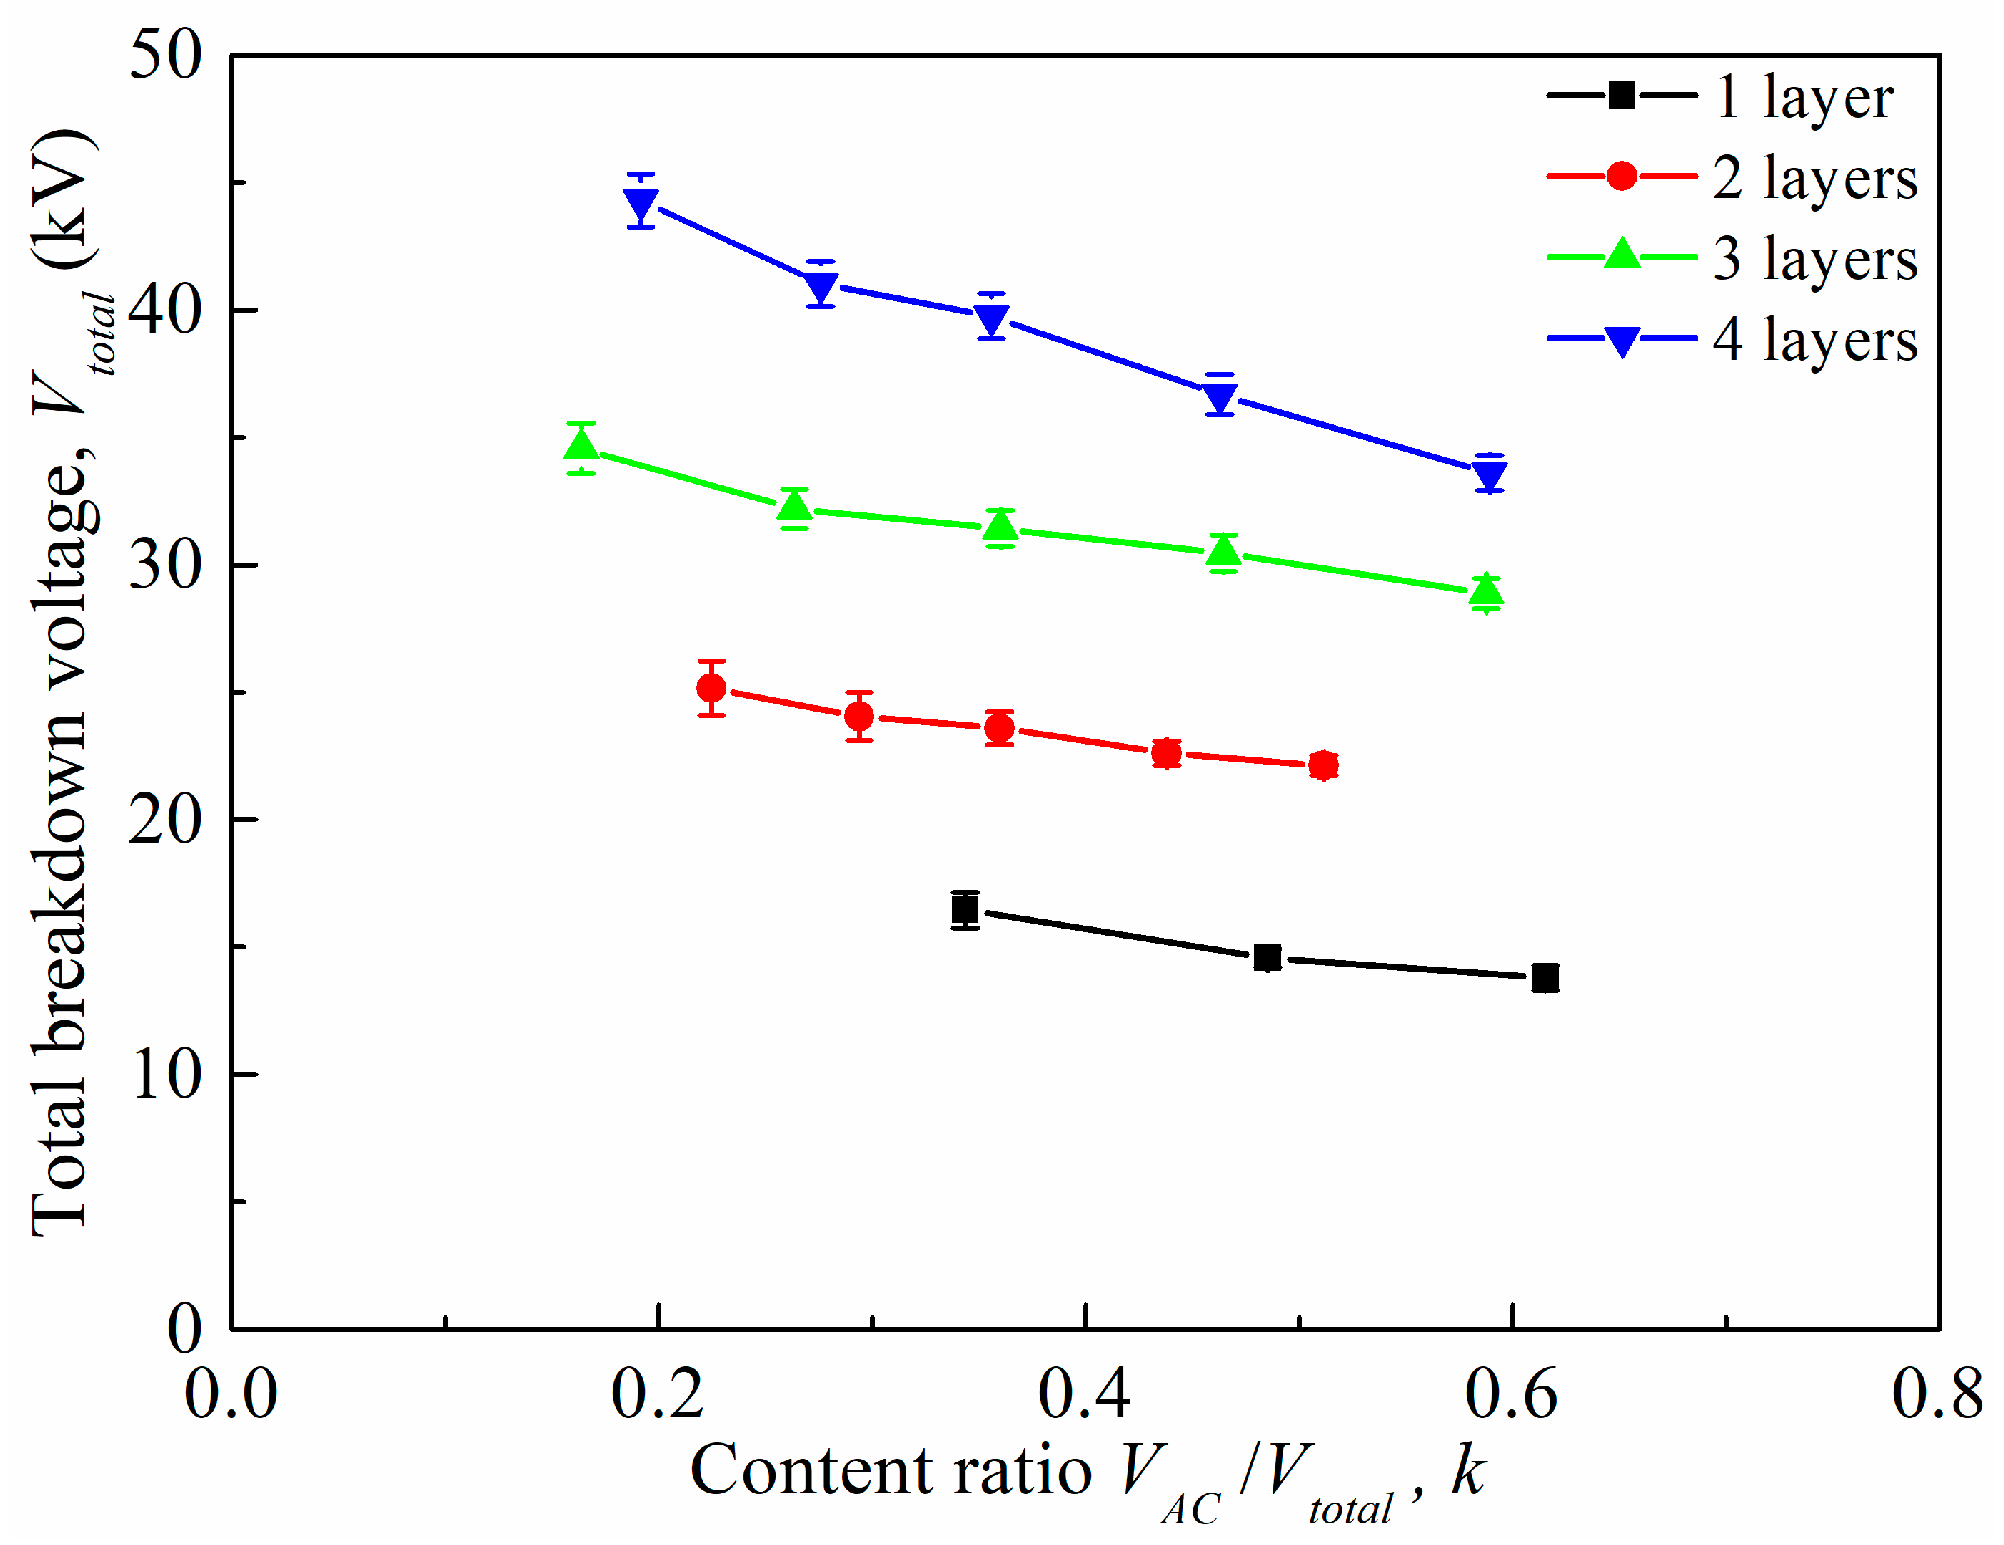
The relationship between total breakdown voltage, Vtotal, and k for one to four layers of OIP can be obtained through Figure 5, and is demonstrated as Figure 6. It can be observed that Vtotal increases with increasing sample layers. This increase becomes smaller as increasing sample layers, which can be explained by geometrical effect observed in dielectric breakdown [25]. Moreover, Vtotal decreases with increasing AC content ratio k. It implies an easier breakdown process of OIP under AC-DC combined voltage with large AC content ratio. Compared to the breakdown characteristics of OIP under single DC and AC voltage, Vtotal is smaller than its DC breakdown voltage, but is larger than 50 Hz AC breakdown voltage, whatever the content ratio k is (for one layer OIP, AC breakdown occurs at 9.1 kV, and DC breakdown occurs at 18.7 kV).
3.2. The Breakdown Characterisitics under Pre-Applied AC Method
In this section, an AC component was firstly applied, and then a DC component was applied until breakdown. Figure 7 shows the breakdown characteristics of one to four layers OIP under the pre-applied AC method. VAC is the pre-applied AC voltage, and VDC is the DC breakdown voltage. It can be observed that the breakdown voltage, VDC, decreases with increasing pre-applied voltage, VAC, which is in accordance with the trend in pre-applied DC method. The relationship between total breakdown voltage, Vtotal, and k is shown in Figure 8. For different layers of OIP, there is a rise in total breakdown voltage, Vtotal, from one layer to four layers sample. The total breakdown voltage decreases with increasing content ratio, k. Compared to the pre-applied DC method, the absolute slope of Vtotal is smaller. Through a joint observation of Figure 6 and Figure 8, it is observed that the total breakdown voltage in the pre-applied AC method is larger than that in the pre-applied DC method, whatever the content ratio, k, is.
4. Discussion
To clearly demonstrate the differences in breakdown voltages of OIP between the two pre-applied voltage methods, the total breakdown voltages of two layers and four layers of OIP were compared, as shown in Figure 9.
It is observed that the total breakdown voltage in pre-AC method is larger than that in pre-DC method for two layers of OIP. This difference between the two pre-applied methods becomes more obvious for four layers of OIP. A similar result was obtained by Li et al. [26], confirming the influence of pre-applied voltage waveform on AC-DC combined voltage breakdown characteristics of OIP.
As it has already been revealed that DC and AC breakdown is modulated by space charges [19,20,27], the charge transport behaviors in AC-DC combined voltage breakdown (pre-DC and pre-AC methods) were investigated through numerical simulations.
For two layers OIP, experimental breakdown occurs at 21.8 kV in the pre-DC method, and at 22.3 kV in the pre-AC method (when k = 0.5), as shown in Figure 9. Due to the limitation of paper and the similarity in charge distributions at different voltage amplitudes, the space charge dynamics in process of voltage ramping of 11 kV DC + 11 kV AC combined voltage (k = 0.5) are demonstrated and discussed as an example.
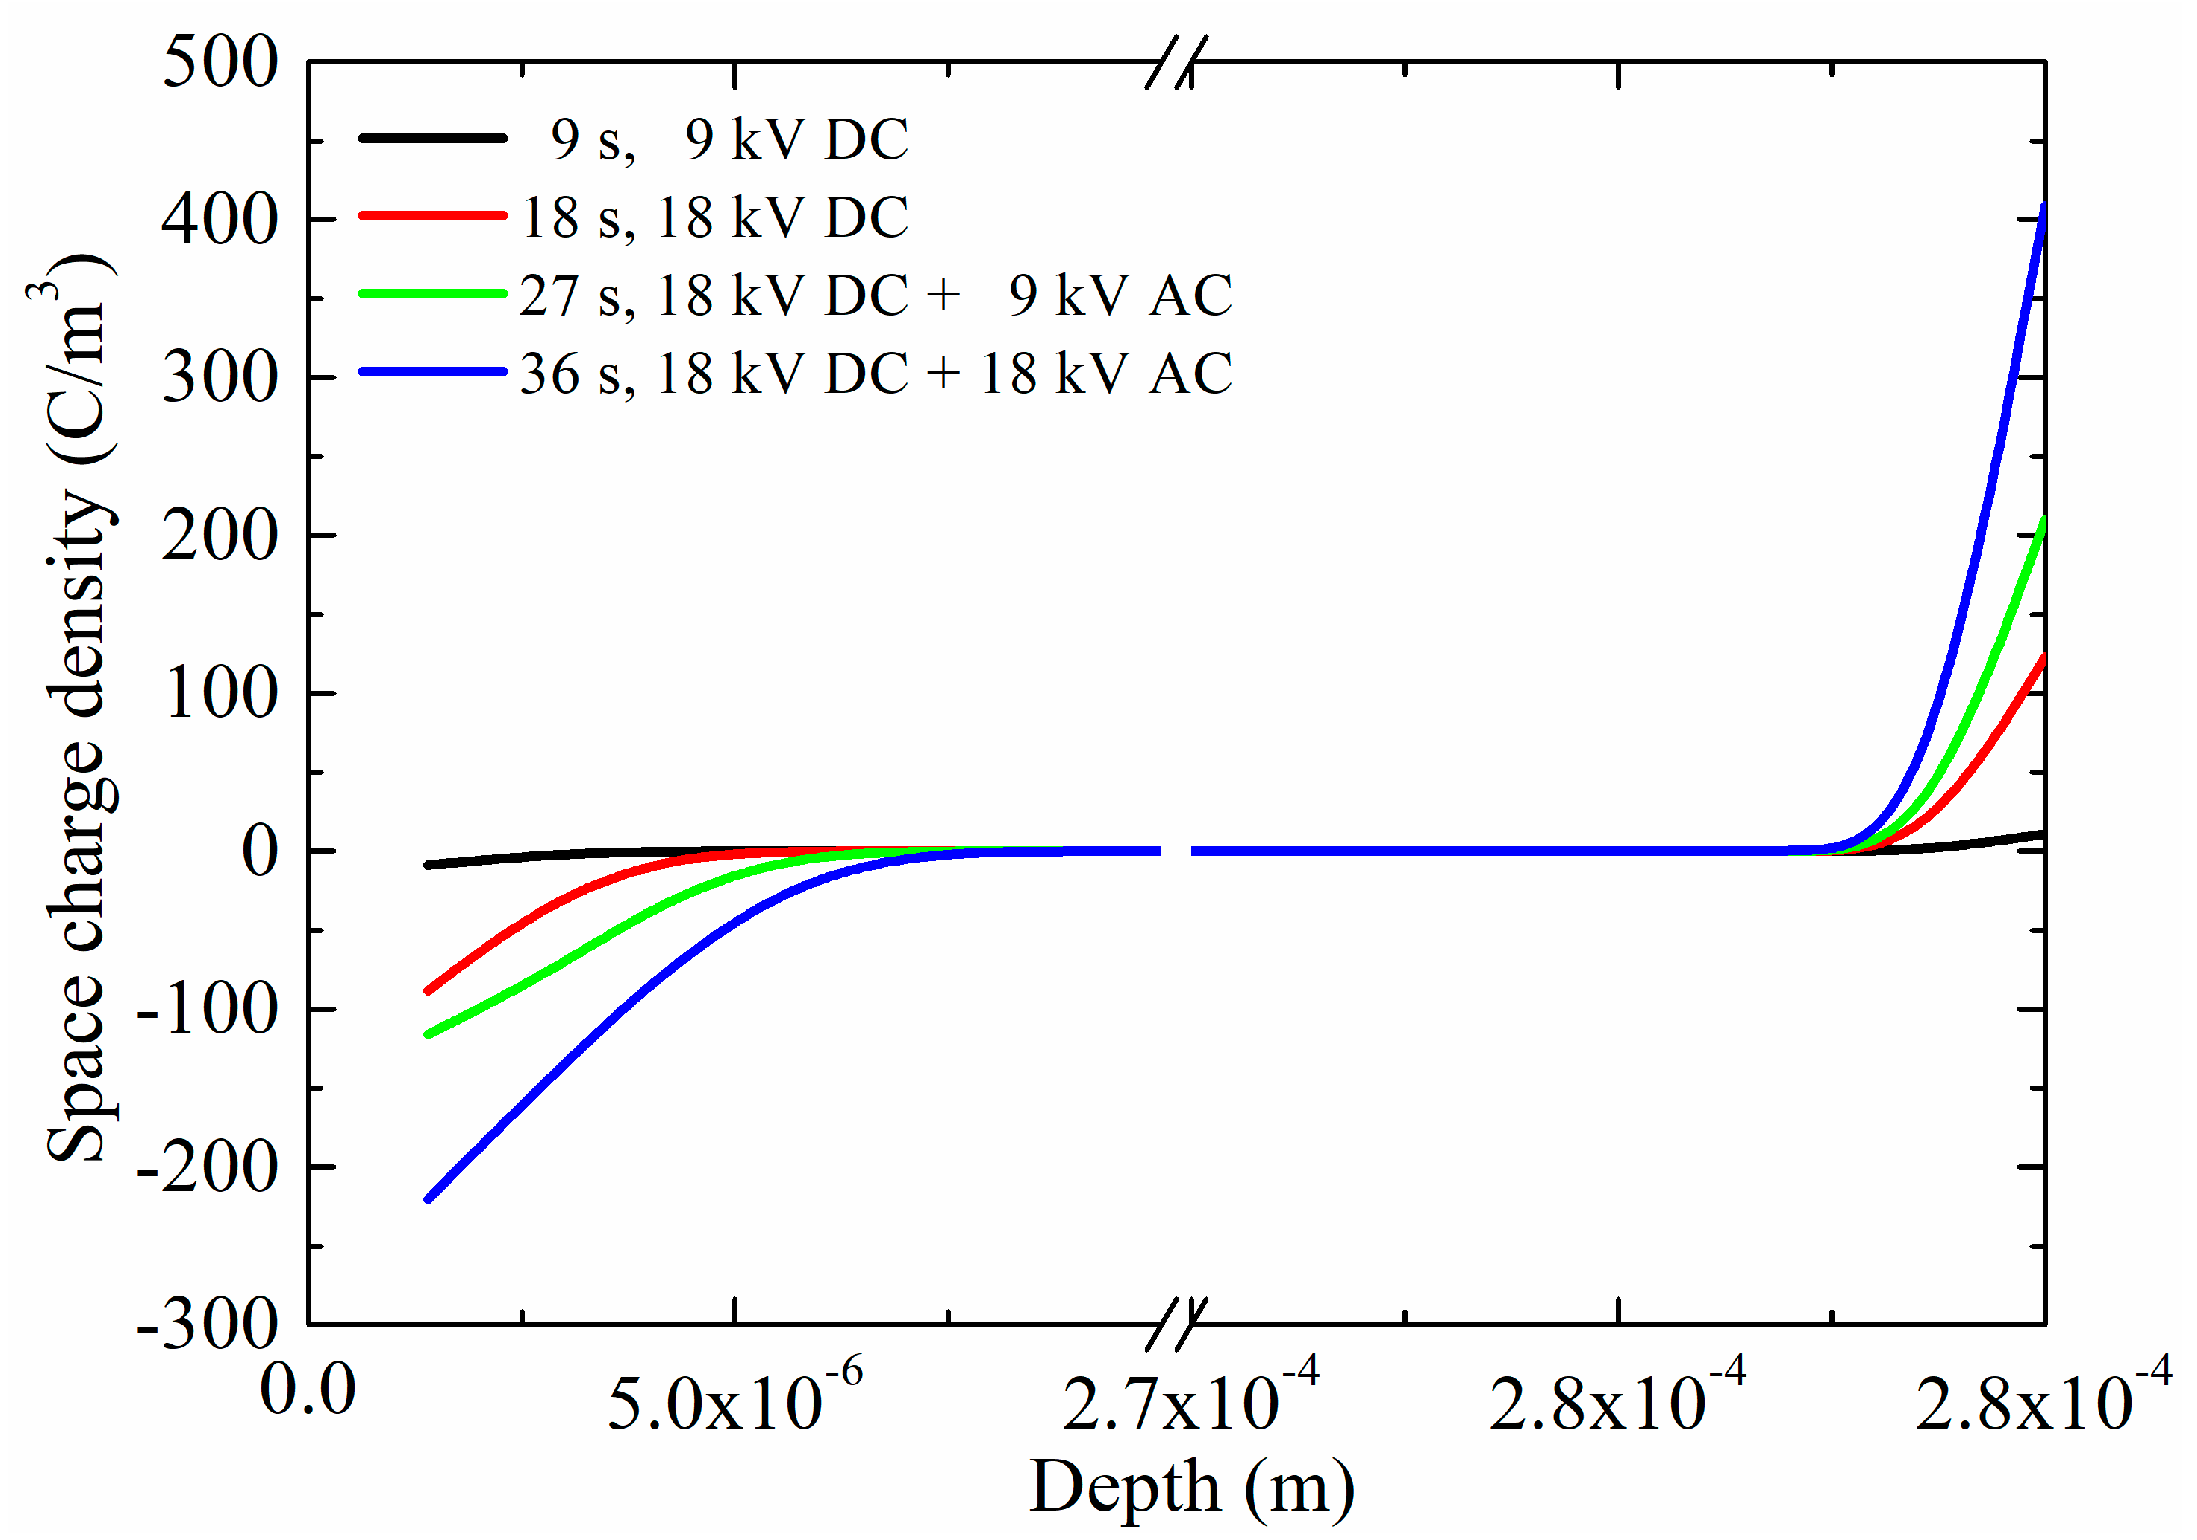
In the pre-applied DC method, the space charge distributions during breakdown process are shown as Figure 10. In accordance with the experimental process, the numerical simulations are divided into two periods, i.e., the pre-applied voltage period (1–11 s), and the AC-DC combined voltage breakdown period (11–22 s), the applied voltage waveform is shown in Figure 3. In the pre-applied DC period (1–11 s), space charges are injected from the electrodes under the ramping DC voltage, forming homo-charge distributions. The space charge density is increasing with time in the vicinity of the electrodes. At 11 s, the negative charge density reaches −34.1 C/m3 near the left electrode.
After that, in AC-DC combined voltage period (11–22 s), the charge density in OIP continues to increase. With the elevation in amplitude of applied voltage, the increase in charge density becomes even more dramatic. Attributed to the 11 kV DC bias-voltage, no charge extraction is observed during the application of AC component. At the end of 22 s, the negative charge density reaches −251.8 C/m3 near the left electrode.
Generally, the space charge ACcumulation in voltage ramping process is sufficiently strong to affect the breakdown performance of insulating materials [19,20]. The injected charges are accumulated within 5 μm in the vicinity of electrodes, which can significantly distort inner electric field in electrical breakdown process [19].
In the pre-applied AC method, an AC component is firstly applied in 1–11 s, positive and negative charges are accumulated near both electrodes, as shown in Figure 11. Zhou et al. obtain similar results in analyzing space charge dynamics low density polyethylene (LDPE) under AC stress [21]. It can be easily observed that the position of positive charges is closer to the electrodes, which is controlled by its relatively smaller mobility compared to negative charges [28]. At the end of 11 s, the maximum charge density near left electrode reaches 0.36 C/m3, which is much smaller compared to −34.1 C/m3 in the pre-applied DC method. After the application of AC component, a DC component is applied, forming AC-DC combined voltage waveform. It can be observed that the positive charges previously injected are firstly neutralized near the left electrode. After that, the negative charge density starts to increase. At the end of 22 s, the maximum negative charge density reaches −182.5 C/m3 near the left electrode, which is smaller than that in pre-applied DC method (−251.8 C/m3). Correspondingly, positive charges accumulate near the right electrode, and the maximum charge density is 217.1 C/m3 at 22 s.
To more clearly demonstrate the differences in charge accumulations between the two pre-applied voltage methods, the average space charge densities over time are compared, as shown in Figure 12. In the pre-applied DC method, homo-charges are injected under pre-applied DC voltage, and the average space charge density reaches 0.82 C/m3 at the end of pre-applied DC period (11 s). As the AC component begins to ramp after 11 s, the average space charge density increases tremendously and reaches 7.44 C/m3 at 22 s. Comparatively, in the pre-applied AC method, the average space charge density is extremely small (0.01 C/m3) at the end of the pre-applied AC period. These charges are insufficient to significantly distort the electric field distribution inside the OIP sample. During the later AC-DC combined voltage ramping period (11–22 s), large amount of charges are continuously injected into the sample. With the increase in amplitude of AC-DC combined voltage, the charge injection is gradually strengthened. At the end of 22 s, the average space charge density reaches 4.63 C/m3. This accumulation is smaller compared to pre-applied DC method (7.44 C/m3).
Space charge distributions affect the breakdown characteristics of insulating materials through induced electric field distortion [19]. The homo-charges weaken the electric field near the sample-electrode interface, which suppress the effect of electric field concentration introduced by glitches on the surface of electrode, and reduce the possibility of discharge and breakdown in the vicinity of the sample-electrode interface. The homo-charges also lead to an increased electric strength in the bulk of the sample. The more charges that accumulate, the higher the inner electric strength that is formed.
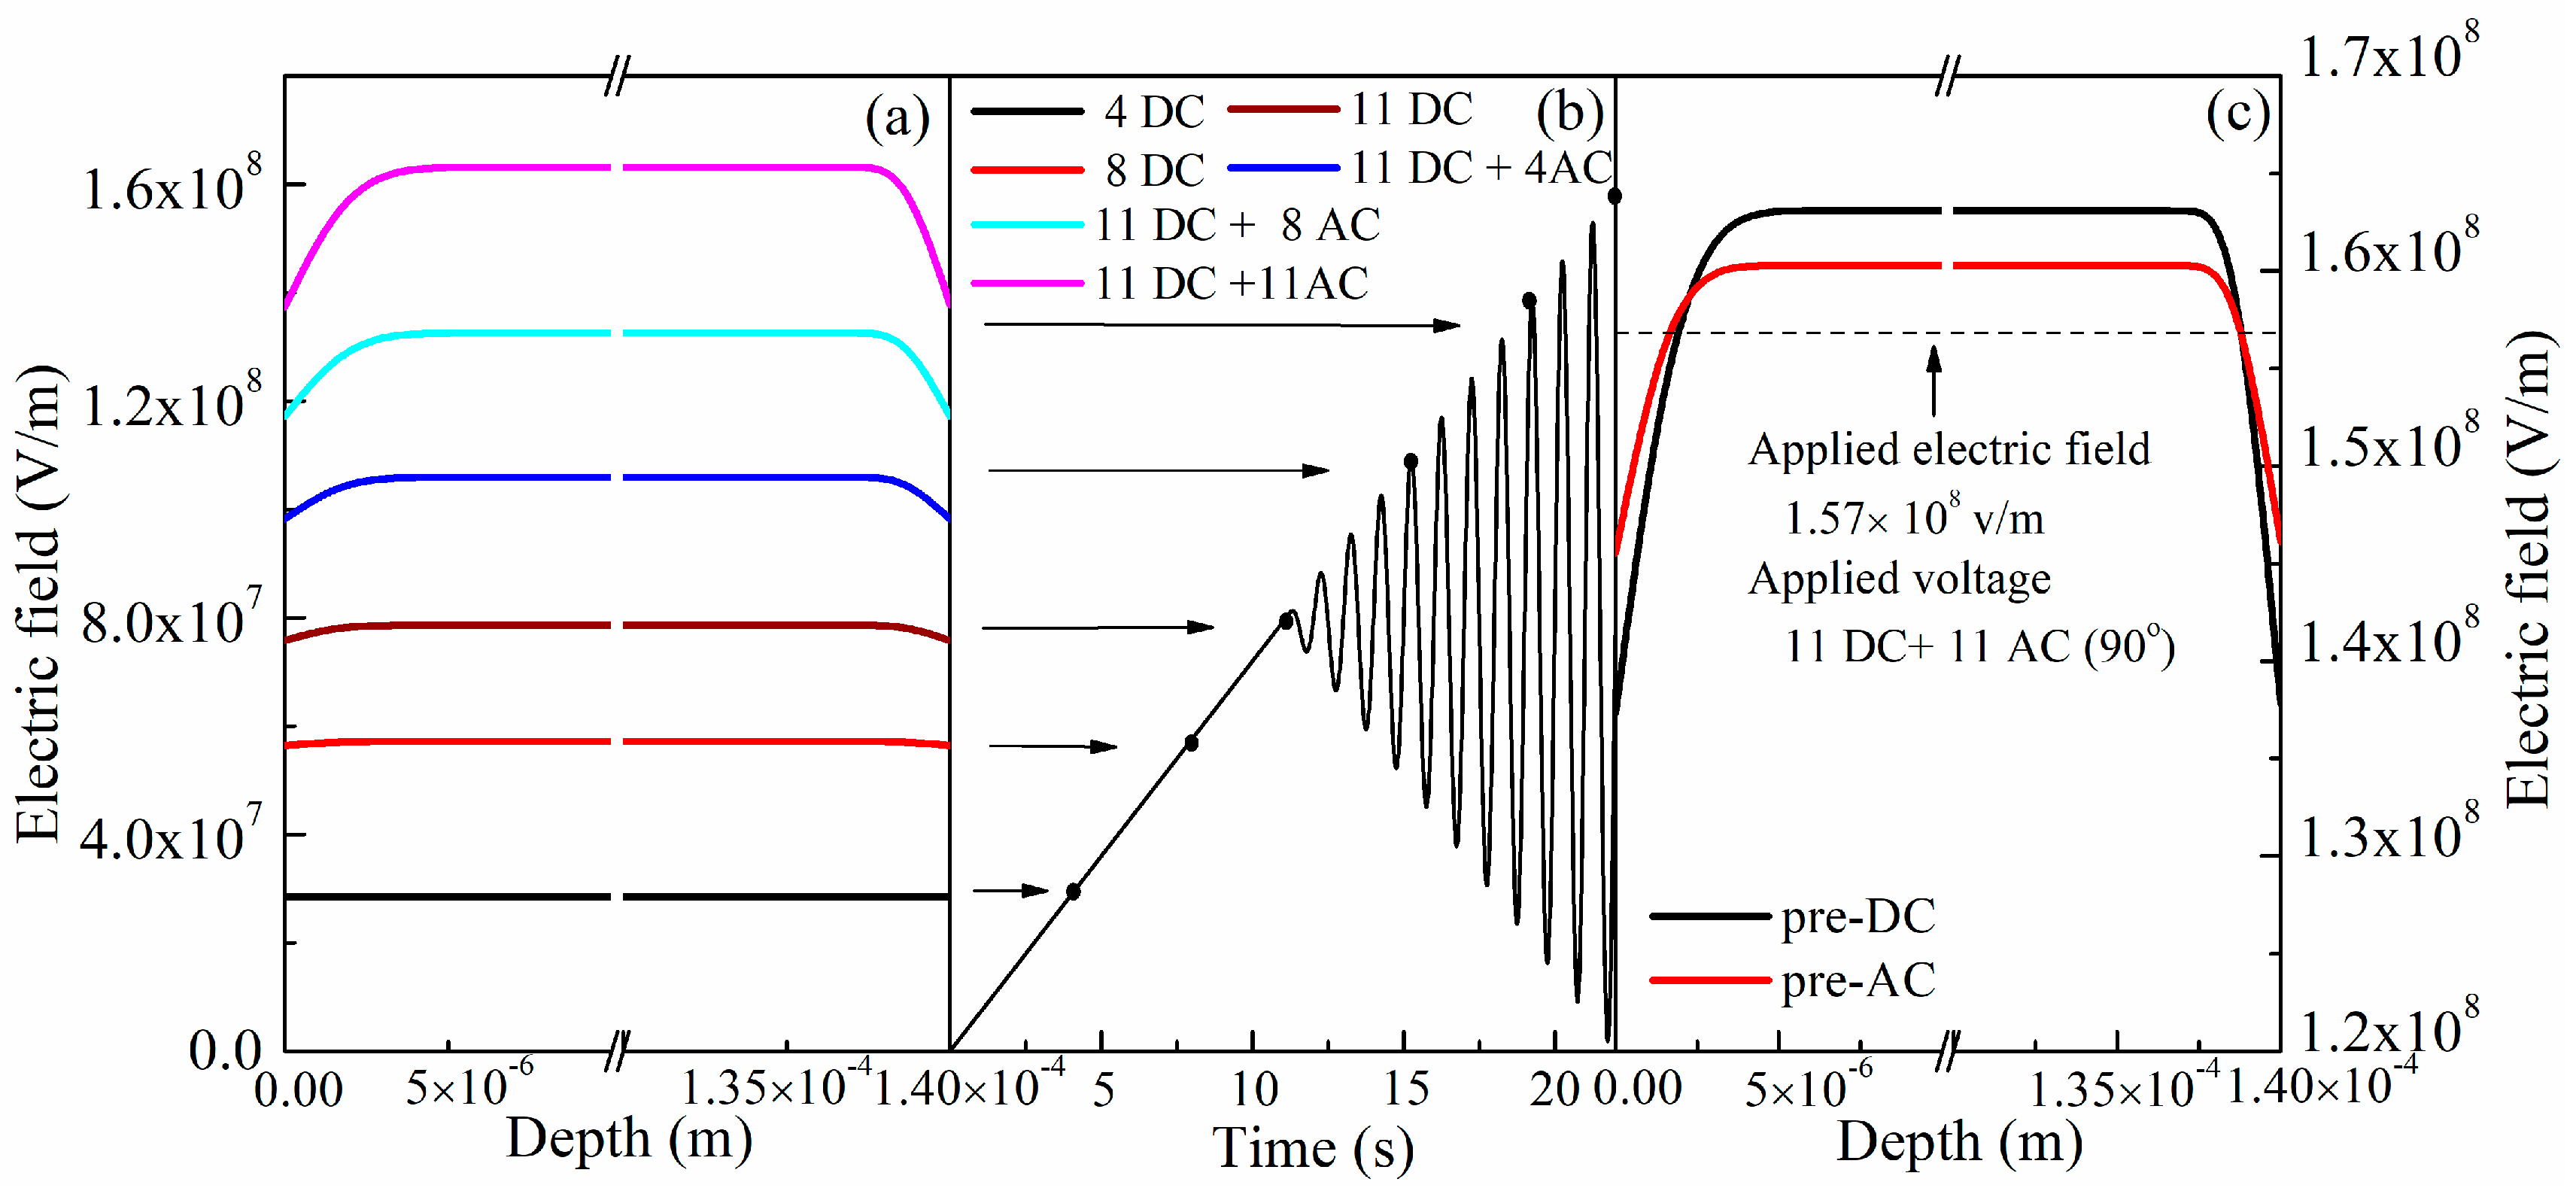
In numerical simulations, it is assumed that electrical breakdown occurs at the position where sustains the maximum electric strength. Through a basic analysis by employing Poisson’s equation, it can be easily concluded that the inner electric field reaches its maximum at the phase angle of 90° in one cycle of AC component. Therefore, the electric field distributions are demonstrated at the phase angle of 90° in Figure 13a–c. Figure 13a shows the electric field evolutions of OIP in the pre-applied DC method. Figure 13b shows the voltage waveform corresponding to Figure 13a. It is observed that the electric field distortion is becoming more dramatic with the elevation of applied voltage. The electric strength in the vicinity of the electrodes decreases with increasing applied voltage, while the electric strength in bulk of the OIP sample correspondingly increases.
It is clearly demonstrated in Figure 10 and Figure 11 that homo-charges are accumulated inside OIP in both the pre-applied DC and pre-applied AC methods at the end of 22 s, and the average space charge density is larger under the pre-applied DC method. As a result, the induced maximum electric field is larger in pre-DC method (1.63 × 10⁸ V/m in the pre-applied DC method and 1.60 × 10⁸ V/m in the pre-applied AC method), as shown in Figure 13c, which indicates that the applied voltage in the pre-DC method only needs to reach a relatively small value, and the induced maximum electric field could reach the intrinsic breakdown strength of insulating material and triggers the breakdown process. More specifically, the differences in maximum electric fields between the two methods imply that the breakdown voltage in the pre-DC method shall be 0.42 kV (0.03 × 10⁸ V/m × 0.14 mm) lower than in the pre-AC method, which is in accordance with the experimental results in Figure 9 (about 0.5 kV).
For four layers of OIP sample, the deviation in breakdown voltages between the pre-AC method and the pre-DC method is expanded, which is considered to be contributed by the increase in application duration of applied voltage, which leads to larger homo-charge injection and a more distorted electric field. The charge transport behaviors in AC-DC combined voltage breakdown of four layer oil impregnated paper samples are demonstrated in Figure 14, Figure 15, Figure 16 and Figure 17.
In Figure 14 and Figure 15, as a consequence of the prolonged applied duration of ramped voltage, the space charges move into the inner space of the bulk in four layers breakdown compared to that in two layers breakdown (Figure 10 and Figure 11). The space charge densities near the sample-electrode interface are decreased compared to two layers breakdown (in the pre-DC method of four layers, the largest space charge density is −220 C/m3 near the left electrode, but it is nearly −250 C/m3 in two layers breakdown). However, the total amount of space charge is increased, as some of the charges moves into the inner space of the sample. This increase can be verified in Figure 16.
In Figure 16, it can be observed that the average space charge densities reach 4.38 C/m3 and 2.46 C/m3 in the pre-DC and pre-AC methods, respectively, in four layers breakdown, which indicate 0.012264 C/m2 and 0.006888 C/m2 of total space charges. In two layers breakdown, the data are 0.010416 C/m2 and 0.006482 C/m2 for the pre-DC and pre-AC methods, respectively. Therefore, it is concluded that the amount of injected space charges is larger in four layers breakdown, which could lead to more distorted electric field, as shown in Figure 17.
In Figure 17, it is observed that the differences of inner electric field between the pre-DC and pre-AC methods reach 0.041 × 10⁸ V/m (1.342 × 10⁸ in pre-DC and 1.301 × 10⁸ in the pre-AC method), indicating a 1.15 kV (0.041 × 10⁸ V/m × 0.28 mm) difference in breakdown voltages. In two layers breakdown, the difference is 0.42 kV (0.03 × 10⁸ V/m × 0.14 mm). Therefore, the model anticipates larger difference in breakdown strength for four layers breakdown, which is in accordance with the experimental results, demonstrated in Figure 9.
5. Conclusions
In this paper, the AC-DC combined voltage breakdown characteristics of one to four layers of oil impregnated paper insulation were systemically investigated. The space charge distributions and their induced electric field distortion in modulating AC-DC breakdown were discussed through numerical simulations. The main conclusions can be drawn as follows.
- The total AC-DC breakdown voltage, Vtotal (VAC + VDC), of oil impregnated paper decreases as the increasing AC content ratio, k (VAC/Vtotal), and is smaller than DC breakdown voltage, but larger than AC breakdown voltage. Vtotal in the pre-applied AC method is larger than that in the pre-applied DC method, whatever the value of k is. This deviation in total breakdown voltages between the two pre-applied methods is enlarged with increasing sample thickness.
- Large amount of space charges are formed during the AC-DC breakdown of oil impregnated paper insulation. These accumulated charges form dramatically distorted inner electric field in insulation, which leads to variations of breakdown strengths of oil impregnated paper. Therefore, space charges must be considered in the design of converter transformers. By considering the amplitude and applied duration of ramped voltages in operating conditions, the changes in breakdown voltages can be estimated through numerical simulations.
- During the AC-DC combined voltage breakdown of oil impregnated paper, homo-charges are formed in both the pre-AC and pre-DC methods, and more charges are accumulated in the pre-applied DC method. These injected charges accumulate within 5μm in the vicinity of the sample-electrode interface, inducing a significantly distorted electric field in oil impregnated paper samples. This induced electric field distortion is more dramatic in the pre-applied DC method, which leads to its smaller AC-DC breakdown voltage compared with the pre-applied AC method.
Author Contributions
Y.Z. and S.L. (Shengtao Li) designed the experiments; D.M. wrote the simulation program; Y.Z. did the experiments and simulations; S.L. (Shijun Li), H.C. and G.C. contributed discussion.
Funding
This research is funded by the National Basic Research Program (973 Program) of China, grant Nos. 2011CB209404, 2015CB251003; the National Key Research and Development Program of China, grant No. 2017YFB0902705.
Acknowledgments
The authors thank F. Tang for contributions to the experiments.
Conflicts of Interest
The authors declare no conflict of interest.
Nomenclature
| Parameters | Unit | Value |
| Absolute temperature, T | K | 300 |
| Boltzmann constant, kB | J/K | 1.38 × 10⁻²³ |
| Charge attempt-to-escape frequency, νATE | Hz | 3 × 10¹² |
| Charge hopping distrance, a | m | - |
| Electron hopping distance, a(e) | m | 2.5 × 10⁻⁹ |
| Hole hopping distance, a(h) | m | 1.4 × 10⁻⁹ |
| Charge hopping barrier height, u0 | eV | - |
| Electron hopping barrier height, u0(e) | eV | 0.68 |
| Hole hopping barrier height, u0(h) | eV | 0.78 |
| Dielectric constant of OIP, εr | - | 3.4 |
| Elementary charge, qe | C | 1.6 × 10⁻¹⁹ |
| Richardson constant, A | A/m2 K2 | 1.2 × 10⁻⁶ |
| Schottky injection barrier, ϕin | eV | 1.1 |
| Vacuum permittivity, ε0 | F/m | 8.85 × 10⁻¹² |
| Carrier mobility, μ | m2/V | variable |
| Conduction current, jc | A/m2 | variable |
| Electric field strength, EF | V/m | variable |
| Electric potential, φ | V | variable |
| Position, x | m | variable |
| Sample thickness, L | m | variable |
| Schottky emission current, jin | A/m2 | variable |
| Source term, S | - | variable |
| Time, t | s | variable |
| Total charge density, Q | C/m3 | - |
| Electron density, Q(e) | C/m3 | variable |
| Hole density, Q(h) | C/m3 | variable |
| AC content ratio in total breakdown voltage, k | - | variable |
| AC component in breakdown voltage, VAC | kV | variable |
| DC component in breakdown voltage, VDC | kV | variable |
| Total breakdown voltage, Vtotal | kV | variable |
References
- Schober, F.; Küchler, A.; Krause, C. Oil Conductivity—An Important Quantity for the Design and the Condition Assessment of HVDC Insulation Systems. FHWS Sci. J. 2013, 1, 59. [Google Scholar]
- Min, W. State Grid Corporation of China’s Yearbook; China Electric Power Press: Beijing, China, 2016; pp. 67–77. (In Chinese) [Google Scholar]
- Tang, G.; Liu, Z. A Review of CIGRE 2010 on HVDC Transmission and Power Electronic Technology. Autom. Electr. Power Syst. 2011, 5, 1–4. [Google Scholar]
- Vandermaar, A.; Wang, M.; Neilson, J.; Srivastava, K. The Electrical Breakdown Characteristics of Oil-Paper Insulation under Steep Front Impulse Voltages. IEEE Trans. Power Deliv. 1994, 9, 1926–1933. [Google Scholar] [CrossRef]
- Kurita, A.; Takahashi, E.; Ozawa, J.; Watanabe, M.; Okuyama, K. DC Flashover Voltage Characteristics and Their Calculation Method for Oil-Immersed Insulation System in HVDC Transformers. IEEE Trans. Power Deliv. 1986, 1, 184–190. [Google Scholar] [CrossRef]
- Hasegawa, T.; Yamaji, K.; Hatano, M.; Kouan, T.; Hosokawa, N. Dielectric Strength of Transformer Insulation at DC Polarity Reversal. IEEE Trans. Power Deliv. 1997, 12, 1526–1531. [Google Scholar] [CrossRef]
- Yoshida, H.; Ishioka, Y.; Suzuki, T. Degradation of Insulting Materials of Transformers. IEEE Trans. Electr. Insul. 1987, EI-22, 795–800. [Google Scholar] [CrossRef]
- Sima, W.; Sun, P.; Yang, M.; Wu, J.; Hua, J. Impact of Time Parameters of Lightning Impulse on the Breakdown Characteristics of Oil Paper Insulation. High Volt. 2016, 1, 18–24. [Google Scholar] [CrossRef]
- Nowaczyk, H.; Grzybowski, S.; Kuffel, E. Electrical Breakdown Strength of Paper-oil Insulation under Pulsating Voltages. IEEE Trans. Electr. Insul. 1987, EI-22, 249–253. [Google Scholar] [CrossRef]
- Raghuveer, M.; Kolaczkowski, Z.; Jin, W.; Kuffel, E. Surface Electric Strength of Processed Pressboard under Composite AC and DC and Conventional Stresses. IEEE Trans. Electr. Insul. 1990, 25, 341–350. [Google Scholar] [CrossRef]
- Wang, Y.; Wei, X.; Chen, Q.; Huang, Y.; Nie, H. Breakdown Characteristics of Converter Transformer Insulation under Composite AC and DC Voltage. In Proceedings of the 9th International Conference on Properties and Applications of Dielectric Materials (ICPADM), Harbin, China, 19–23 July 2009. [Google Scholar]
- Mosinski, F.; Wodzinski, J.; Sikorski, L.; Ziencikiewicz, J. Electrical Strength of Paper-oil Insulation Subjected to Composite Voltages. IEEE Trans. Dielectr. Electr. Insul. 1994, 1, 615–623. [Google Scholar] [CrossRef]
- Takahashi, E.; Tsutsumi, Y.; Okuyama, K.; Ogata, F. Partial Discharge Characteristics of oil Immersed Insulation Systems under DC, Combined AC-DC and DC Reversed Polarity Voltage. IEEE Trans. Power Appar. Syst. 1976, PAS-95, 411–420. [Google Scholar] [CrossRef]
- Sha, Y.; Zhou, Y.; Li, J.; Wang, J. Partial Discharge Characteristics in oil-Paper Insulation under Combined AC-DC Voltage. IEEE Trans. Dielectr. Electr. Insul. 2014, 21, 1529–1539. [Google Scholar] [CrossRef]
- IEEE Working Group on Dielectric Tests for HVDC Stressed Transformers and Reactors. Recommended dielectric tests and test procedures for converter transformers and smoothing reactors. IEEE Trans. Power Deliv. 1986, 1, 161–166. [Google Scholar]
- Hao, J.; Zou, R.; Liao, R.; Yang, L.; Liao, Q. New Method for Shallow and deep trap Distribution Analysis in oil Impregnated Insulation Paper Based on the Space Charge Detrapping. Energies 2018, 11, 271. [Google Scholar] [CrossRef]
- Min, D.; Li, S.; Ohki, Y. Numerical Simulation on Molecular Displacement and DC Breakdown of LDPE. IEEE Trans. Dielectr. Electr. Insul. 2016, 23, 507–516. [Google Scholar] [CrossRef]
- Tang, C.; Huang, B.; Hao, M.; Xu, Z.; Hao, J.; Chen, G. Progress of Space Charge Research on oil-Paper Insulation Using Pulsed Electroacoustic Techniques. Energies 2018, 11, 53. [Google Scholar] [CrossRef]
- Li, S.; Zhu, Y.; Min, D.; Chen, G. Space Charge Modulated Electrical Breakdown. Sci. Rep. 2016, 6. [Google Scholar] [CrossRef] [PubMed]
- Chen, G.; Zhao, J.; Li, S.; Zhong, L. Origin of Thickness Dependent DC Electrical Breakdown in Dielectrics. Appl. Phys. Lett. 2012, 100, 222904. [Google Scholar] [CrossRef]
- Zhou, C.; Chen, G. Space Charge Behaviours in Polyethylene under Combined AC and DC Electric Fields. In Proceedings of the Annual Report Conference on Electrical Insulation and Dielectric Phenomena, Des Moines, IA, USA, 19–22 October 2014. [Google Scholar]
- Teyssèdre, G.; Laurent, C. Charge Transport Modeling in Insulating Polymers: From Molecular to Macroscopic scale. IEEE Trans. Dielectr. Electr. Insul. 2005, 12, 857–875. [Google Scholar] [CrossRef]
- Min, D.; Cho, M.; Khan, A.R.; Li, S. Charge Transport Properties of Dielectrics Revealed by Isothermal Surface Potential Decay. IEEE Trans. Dielectr. Electr. Insul. 2012, 19, 1465–1473. [Google Scholar] [CrossRef]
- Min, D.; Li, S. A Comparison of Numerical Methods for Charge Transport Simulation in Insulating Materials. IEEE Trans. Dielectr. Electr. Insul. 2013, 20, 955–964. [Google Scholar]
- Kim, H.; Shi, F. Thickness Dependent Dielectric Strength of a low Permittivity Dielectric film. IEEE Trans. Dielectr. Electr. Insul. 2001, 8, 248–252. [Google Scholar] [CrossRef]
- Li, B.; Chen, H.; Sun, Q.; Li, J.; Li, G.; Deng, J.; Fan, W.; Xu, H. Influences of AC and DC voltage Component on Typical Insulation Model Breakdown Characteristics in Transformer oil. Trans. China Electrotech. Soc. 2011, 26, 34–38. [Google Scholar]
- Liu, N.; Zhou, C.; Chen, G.; Xu, Y.; Cao, J.; Wang, H. Model to Estimate the Trapping Parameters of Cross-Linked Polyethylene Cable Peelings of Different Service Years and Their Relationships with DC Breakdown Strengths. High Volt. 2016, 1, 95–105. [Google Scholar] [CrossRef]
- Laurent, C.; Teyssedre, G.; Le Roy, S.; Baudoin, F. Charge Dynamics and its Energetic Features in Polymeric Materials. IEEE Trans. Dielectr. Electr. Insul. 2013, 20, 357–381. [Google Scholar] [CrossRef]
Figure 1.
The vacuum oiling chamber.

Figure 2.
Schematic of the test system employed in breakdown experiments.

Figure 3.
Schematic of voltage waveforms in AC-DC combined voltage breakdown (a) pre-applied DC method (b) pre-applied AC method (Schematic, the frequency in this figure does not represent the real situation of 50 Hz).
Figure 3.
Schematic of voltage waveforms in AC-DC combined voltage breakdown (a) pre-applied DC method (b) pre-applied AC method (Schematic, the frequency in this figure does not represent the real situation of 50 Hz).

Figure 4.
Schematic of the bipolar charge transport model used in numerical simulations.

Figure 5.
The variations of 50 Hz AC breakdown voltage as pre-applied DC voltage changes for one to four layers of oil impregnated paper.
Figure 5.
The variations of 50 Hz AC breakdown voltage as pre-applied DC voltage changes for one to four layers of oil impregnated paper.
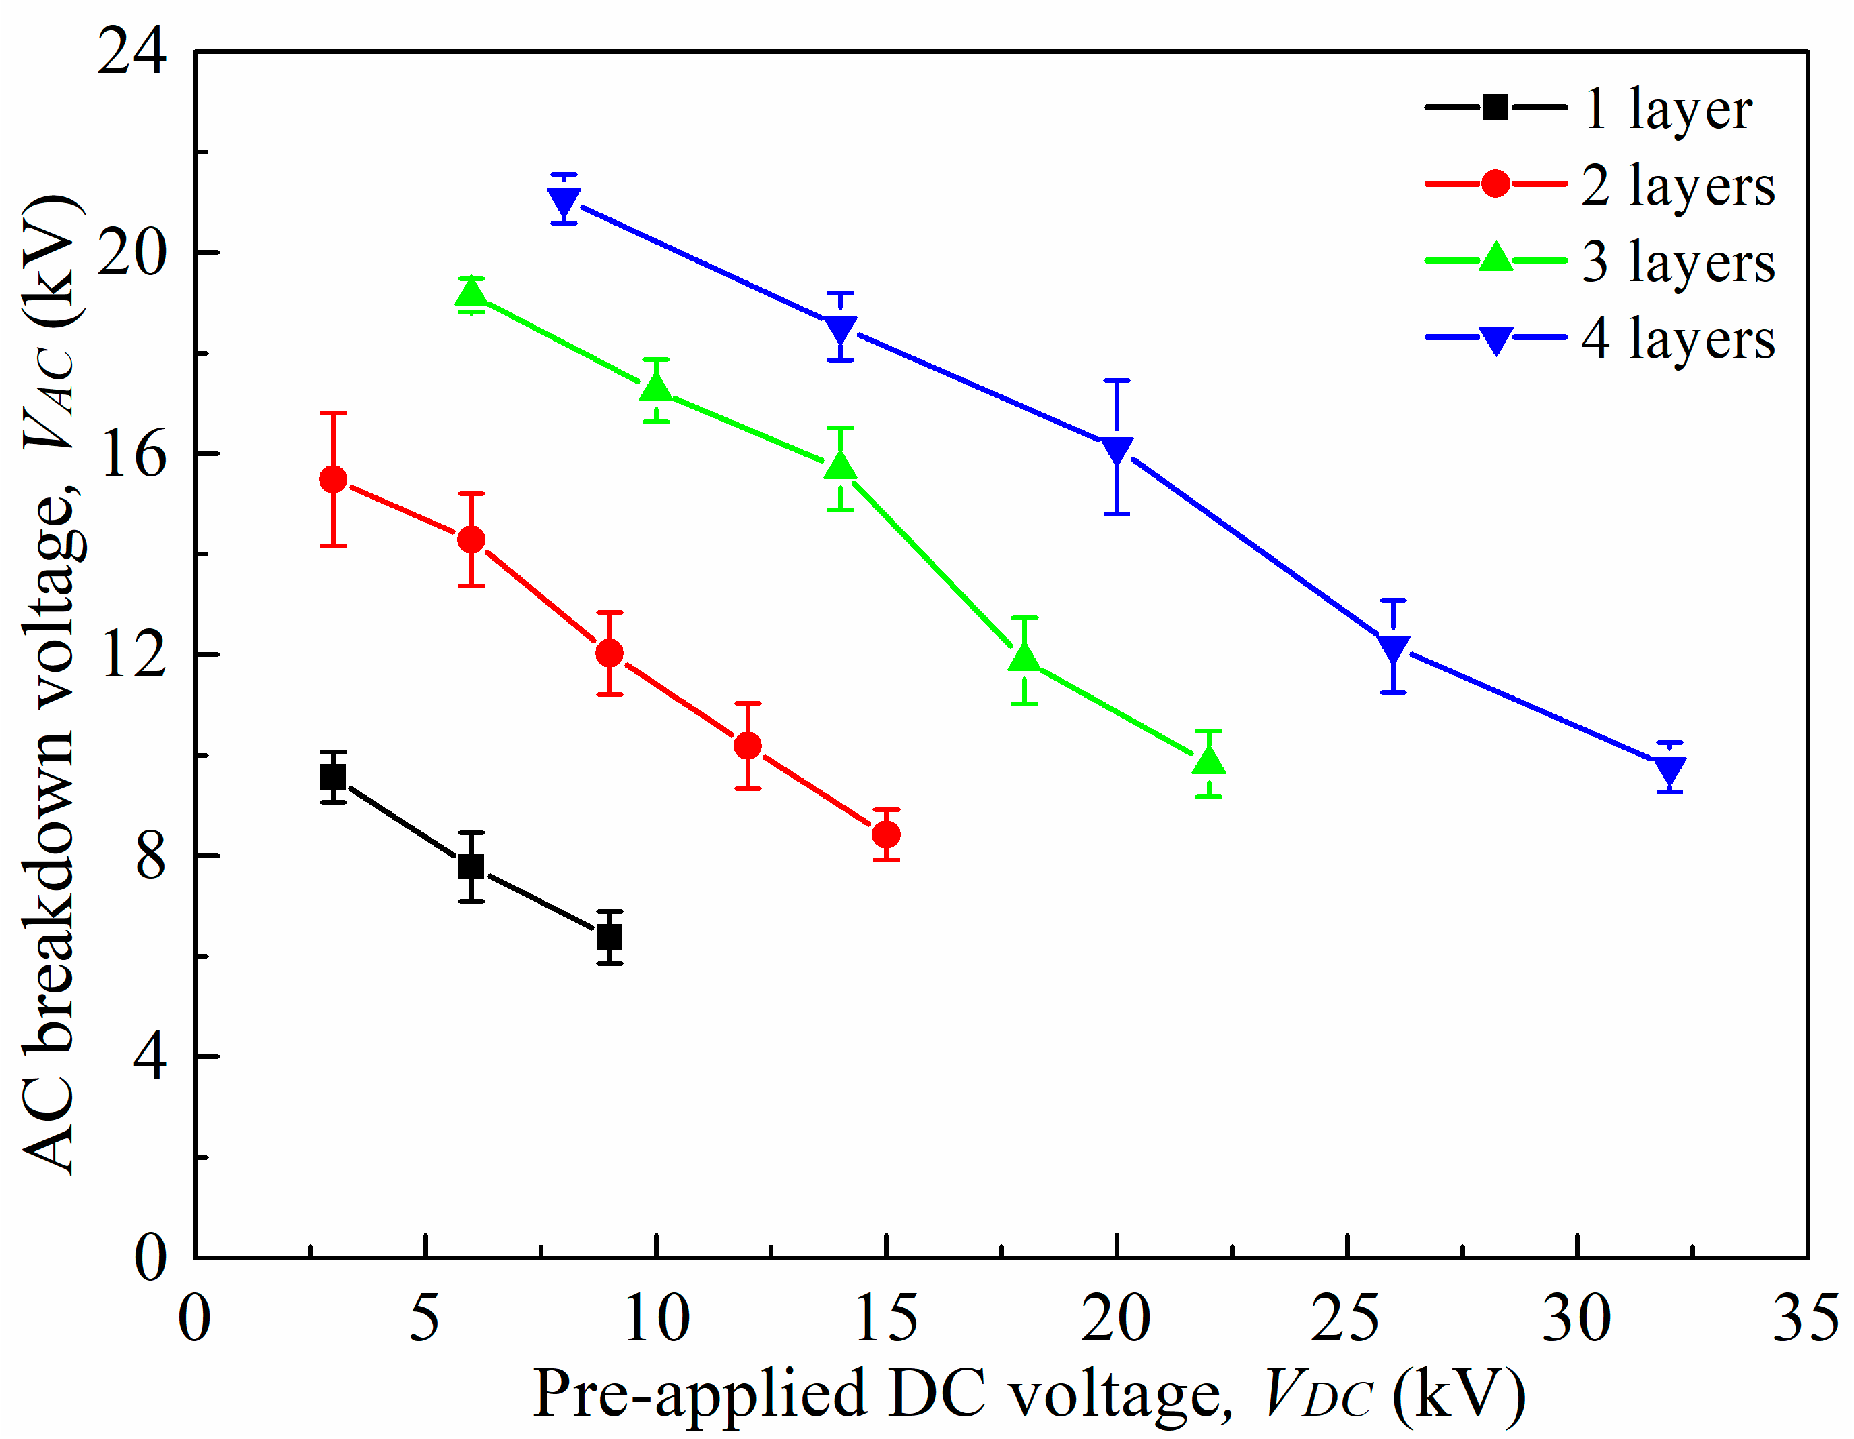
Figure 6.
The variations of total breakdown voltage, Vtotal, as k changes for one to four layers of oil impregnated paper in pre-applied DC method.
Figure 6.
The variations of total breakdown voltage, Vtotal, as k changes for one to four layers of oil impregnated paper in pre-applied DC method.
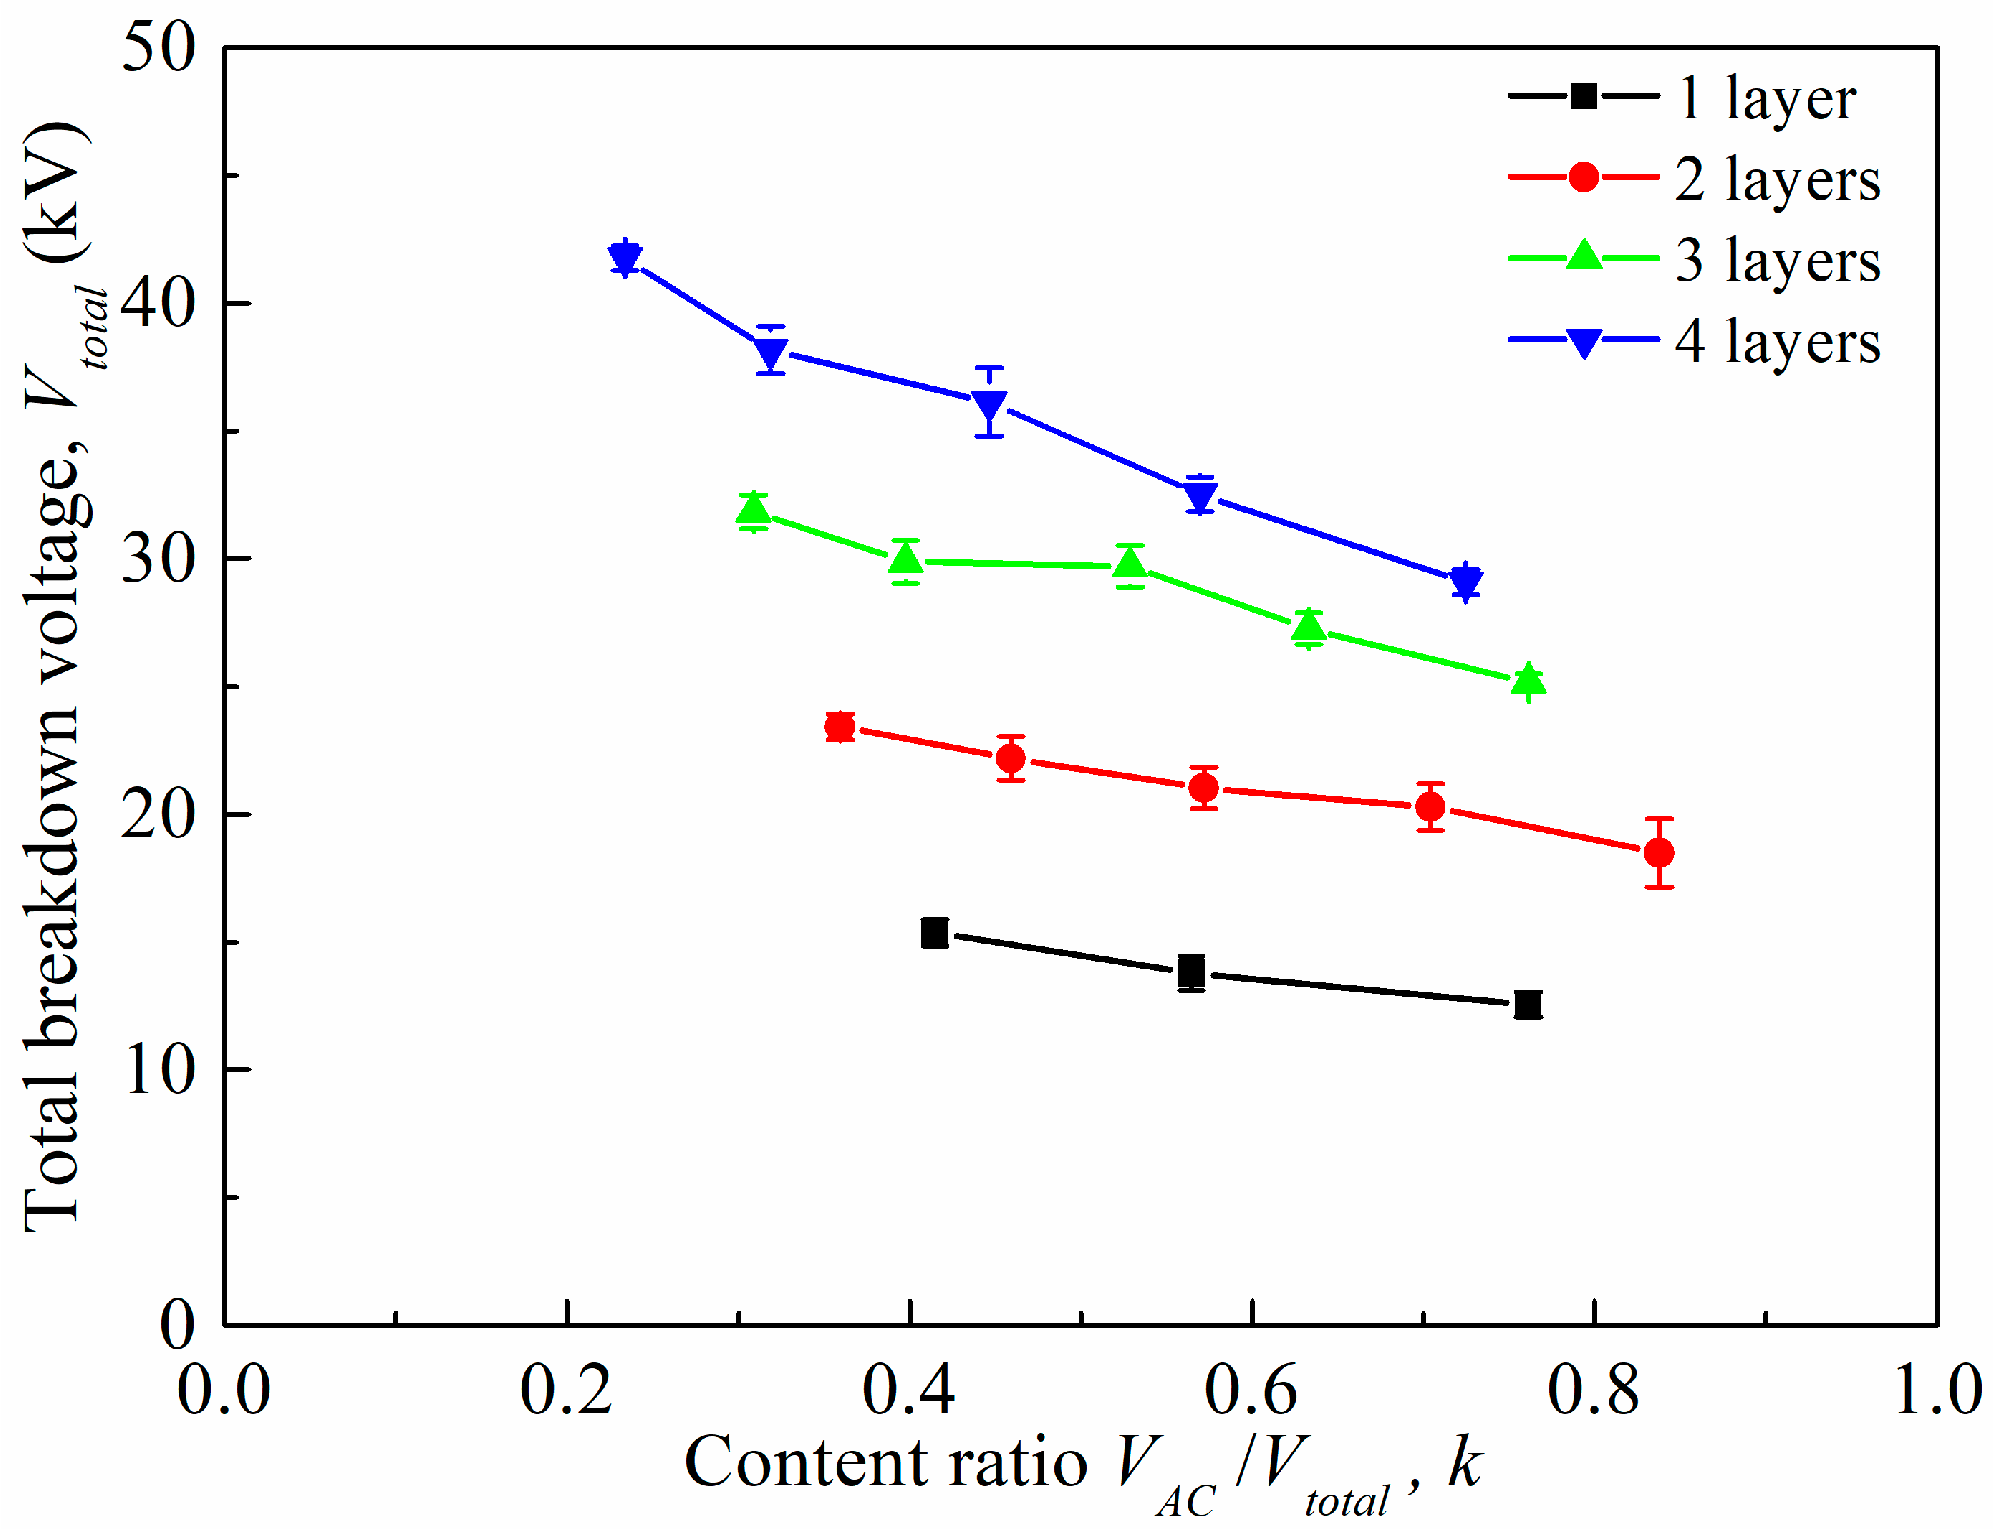
Figure 7.
The variations of DC breakdown voltage as pre-applied 50 Hz AC voltage changes for l–4 layers of oil impregnated paper.
Figure 7.
The variations of DC breakdown voltage as pre-applied 50 Hz AC voltage changes for l–4 layers of oil impregnated paper.

Figure 8.
The variations of total breakdown voltage, Vtotal, as k changes for one to four layers of oil impregnated paper in the pre-applied AC method.
Figure 8.
The variations of total breakdown voltage, Vtotal, as k changes for one to four layers of oil impregnated paper in the pre-applied AC method.

Figure 9.
Comparisons of total breakdown voltages as k changes between the pre-applied DC and pre-applied AC methods for two layers and four layers of oil impregnated paper.
Figure 9.
Comparisons of total breakdown voltages as k changes between the pre-applied DC and pre-applied AC methods for two layers and four layers of oil impregnated paper.
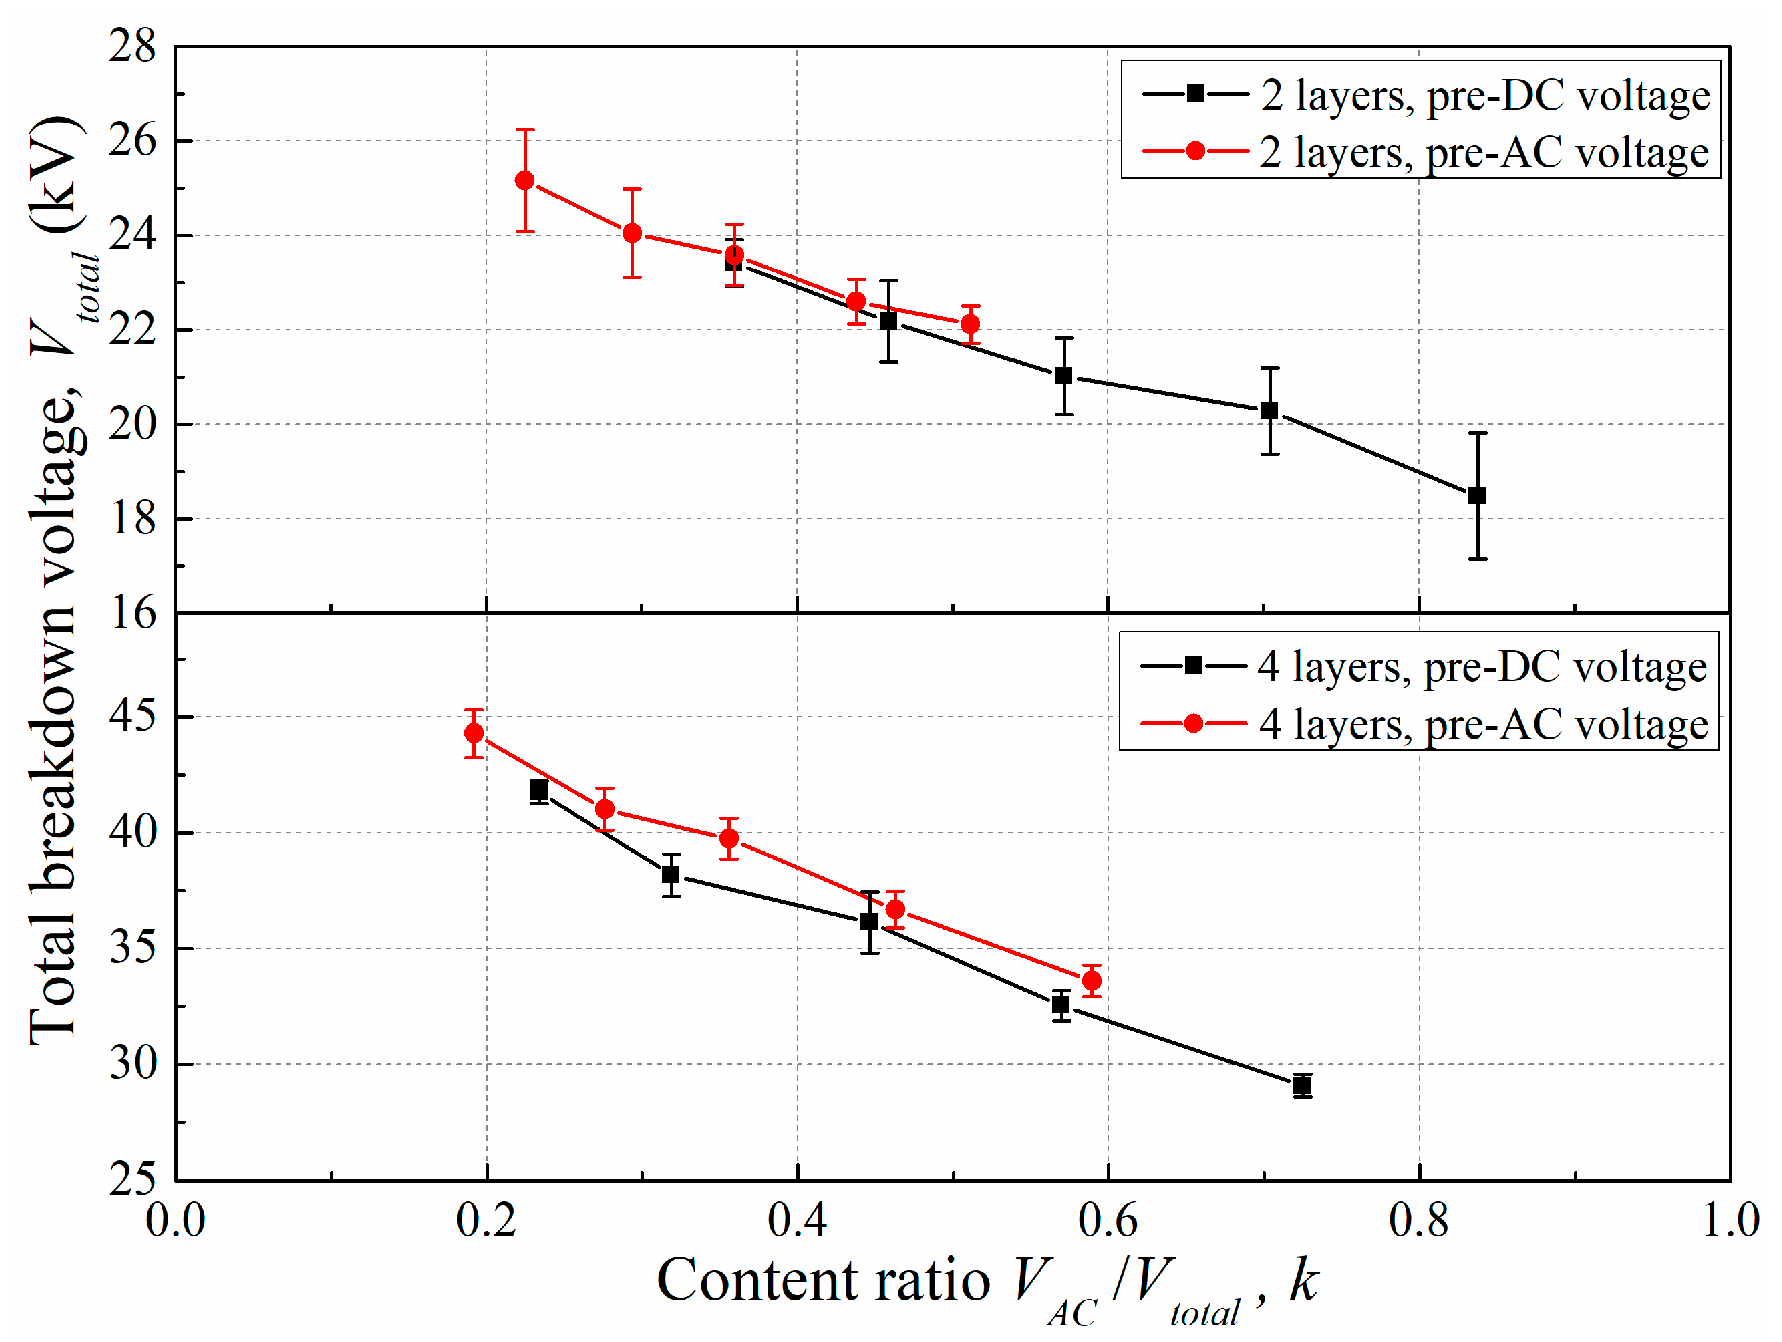
Figure 10.
Space charge distributions of two layers of oil impregnated paper in the voltage ramping process of 11 kV DC and 11 kV AC combined voltage in the pre-applied DC method.
Figure 10.
Space charge distributions of two layers of oil impregnated paper in the voltage ramping process of 11 kV DC and 11 kV AC combined voltage in the pre-applied DC method.
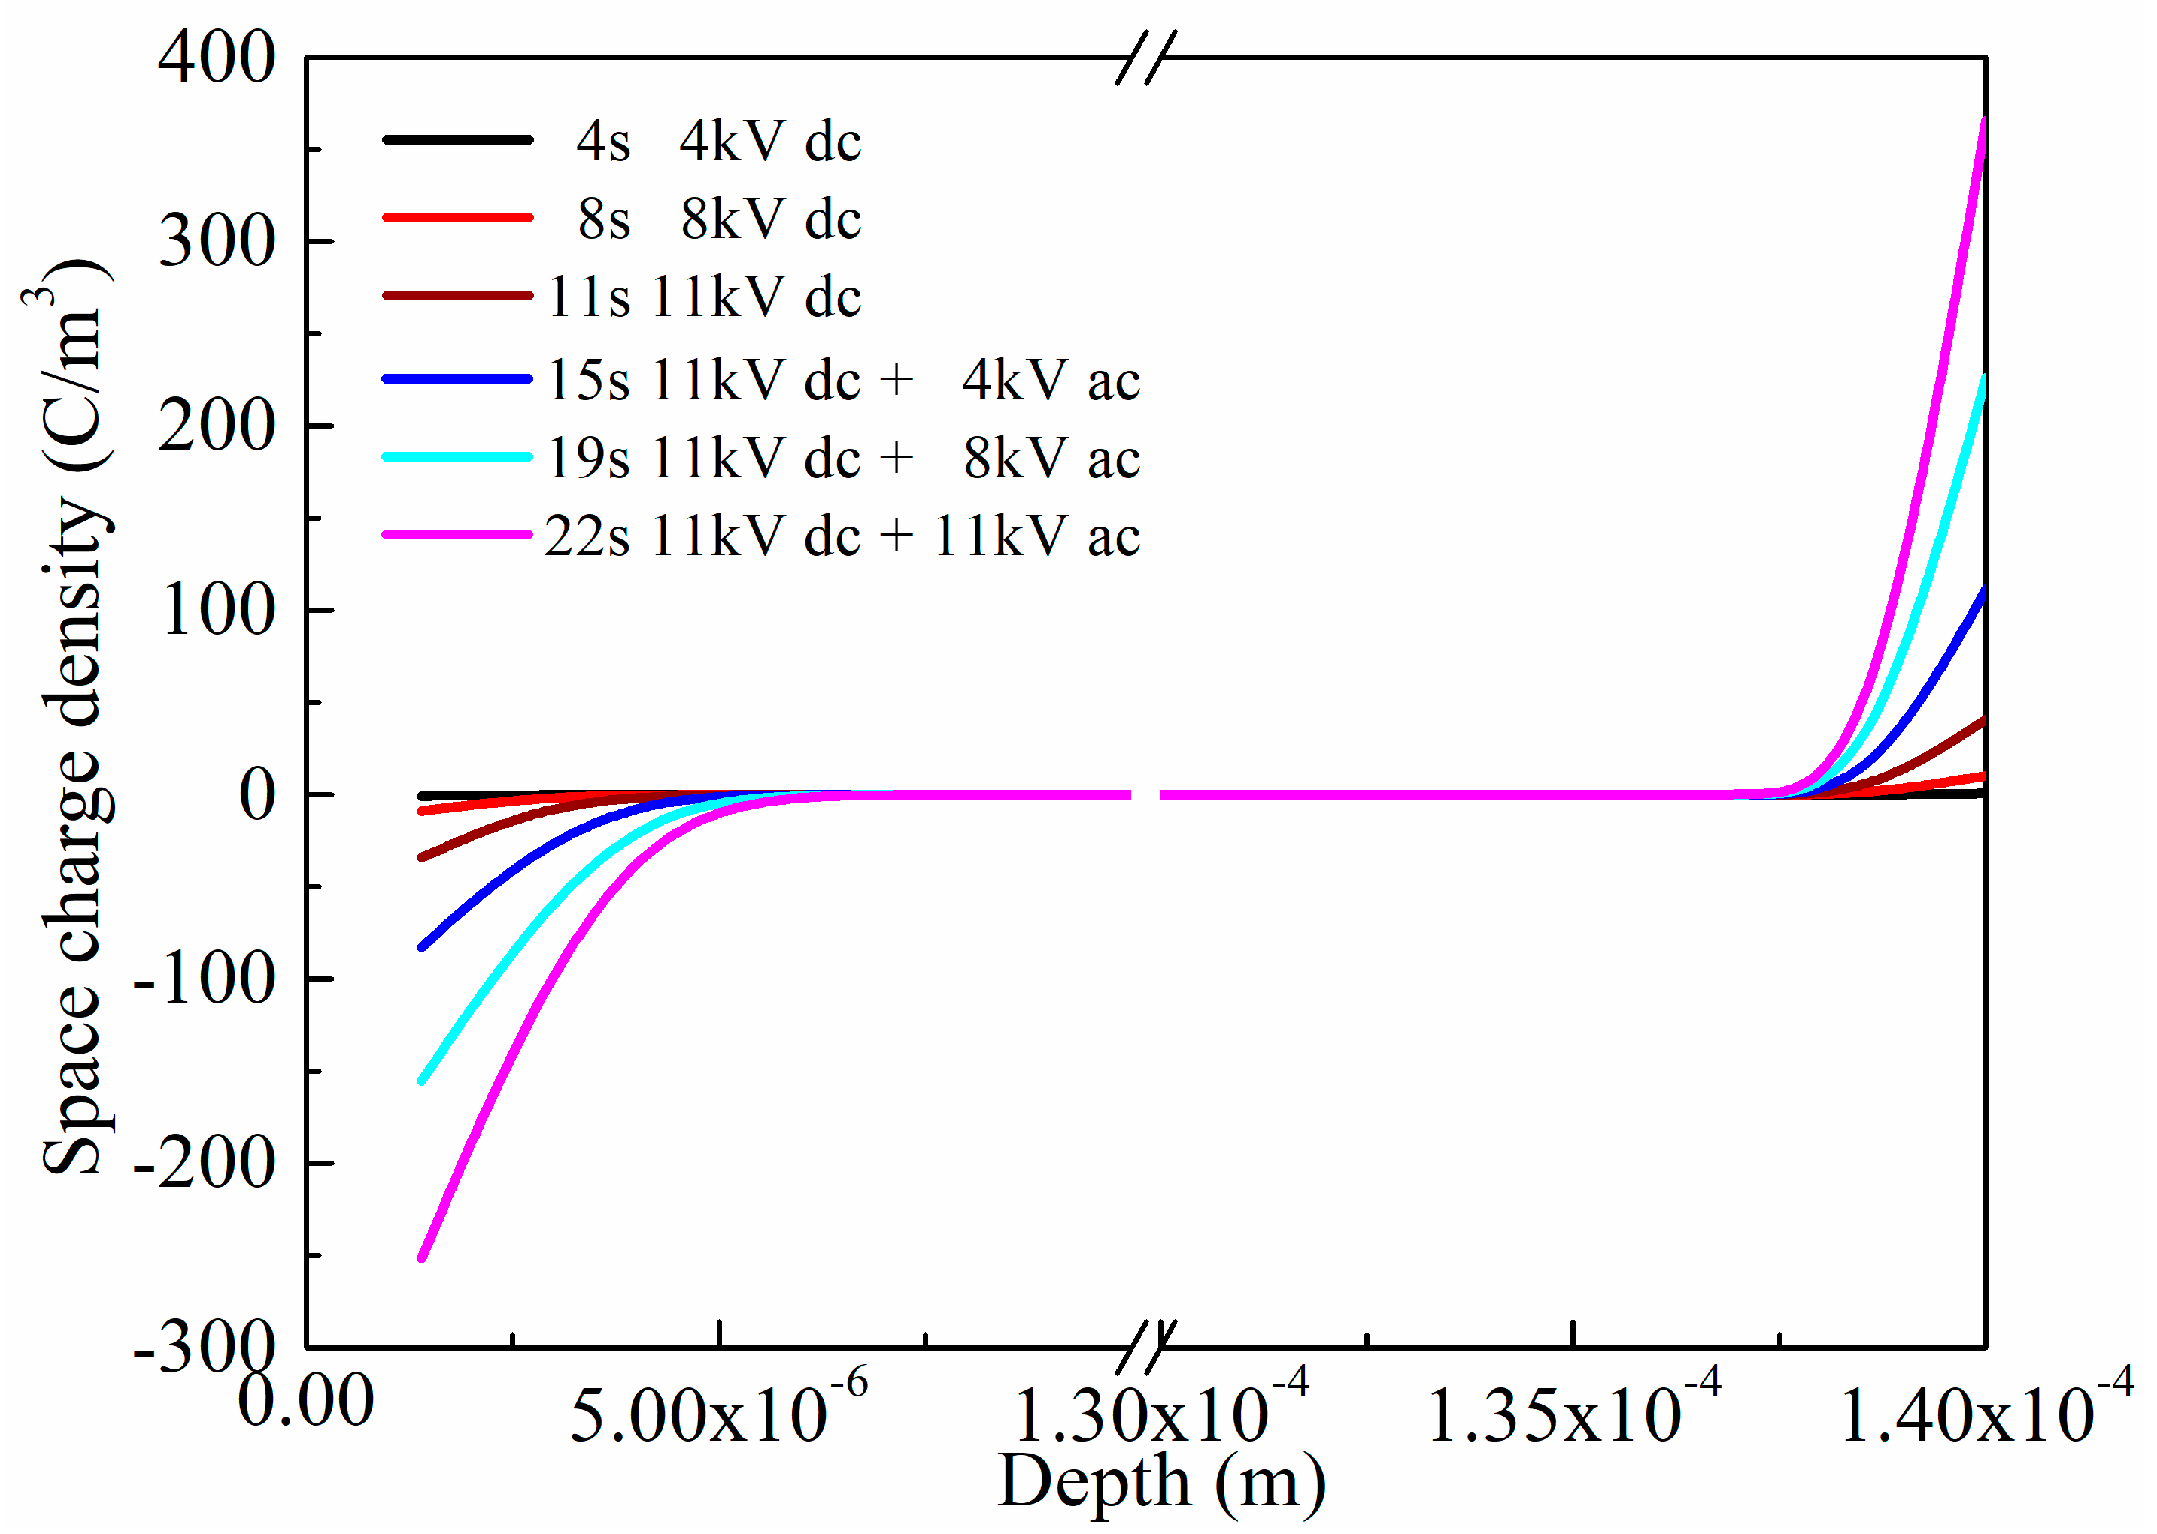
Figure 11.
Space charge distributions of two layers of oil impregnated paper in the voltage ramping process of 11 kV AC and 11 kV DC combined voltage in the pre-applied AC method.
Figure 11.
Space charge distributions of two layers of oil impregnated paper in the voltage ramping process of 11 kV AC and 11 kV DC combined voltage in the pre-applied AC method.
Figure 12.
The variations of average space charge densities as time changes in two layers of oil impregnated paper between the pre-applied AC and pre-applied DC methods.
Figure 12.
The variations of average space charge densities as time changes in two layers of oil impregnated paper between the pre-applied AC and pre-applied DC methods.
Figure 13.
Electric field distributions in two layers of oil impregnated paper under AC-DC combined voltages (a) the evolutions of electric field distortion in the pre-applied DC method under 11 kV DC and 11 kV AC combined voltages (90°); (b) schematic of voltage waveform in the pre-applied DC method (11 kV DC and 11 kV AC); (c) comparison of electric field distributions between the pre-DC and pre-AC methods under 11 kV DC + 11 kV AC combined voltage.

Figure 14.
Space charge distributions of four layers of oil impregnated paper in voltage ramping process of 18 kV DC and 18 kV AC combined voltage in the pre-applied DC method.
Figure 14.
Space charge distributions of four layers of oil impregnated paper in voltage ramping process of 18 kV DC and 18 kV AC combined voltage in the pre-applied DC method.

Figure 15.
Space charge distributions of four layers of oil impregnated paper in voltage ramping process of 18 kV AC and 18 kV DC combined voltage in the pre-applied DC method.
Figure 15.
Space charge distributions of four layers of oil impregnated paper in voltage ramping process of 18 kV AC and 18 kV DC combined voltage in the pre-applied DC method.
Figure 16.
The variations of average space charge densities as time changes in four layers of oil impregnated paper between the pre-applied AC and pre-applied DC methods.
Figure 16.
The variations of average space charge densities as time changes in four layers of oil impregnated paper between the pre-applied AC and pre-applied DC methods.
Figure 17.
Comparison of electric field distributions between the pre-DC and pre-AC methods under 18 kV DC + 18 kV AC combined voltage (90°) for four layers of oil impregnated paper.
Figure 17.
Comparison of electric field distributions between the pre-DC and pre-AC methods under 18 kV DC + 18 kV AC combined voltage (90°) for four layers of oil impregnated paper.
© 2018 by the authors. Licensee MDPI, Basel, Switzerland. This article is an open access article distributed under the terms and conditions of the Creative Commons Attribution (CC BY) license (http://creativecommons.org/licenses/by/4.0/).
Share and Cite
MDPI and ACS Style
Zhu, Y.; Li, S.; Min, D.; Li, S.; Cui, H.; Chen, G. Space Charge Modulated Electrical Breakdown of Oil Impregnated Paper Insulation Subjected to AC-DC Combined Voltages. Energies 2018, 11, 1547. https://doi.org/10.3390/en11061547
AMA Style
Zhu Y, Li S, Min D, Li S, Cui H, Chen G. Space Charge Modulated Electrical Breakdown of Oil Impregnated Paper Insulation Subjected to AC-DC Combined Voltages. Energies. 2018; 11(6):1547. https://doi.org/10.3390/en11061547
Chicago/Turabian StyleZhu, Yuanwei, Shengtao Li, Daomin Min, Shijun Li, Huize Cui, and George Chen. 2018. "Space Charge Modulated Electrical Breakdown of Oil Impregnated Paper Insulation Subjected to AC-DC Combined Voltages" Energies 11, no. 6: 1547. https://doi.org/10.3390/en11061547
Note that from the first issue of 2016, this journal uses article numbers instead of page numbers. See further details here.