Abstract
Over the years, sustainability and impact on the environment, as well as operation expenditure, have been major concerns in the deployment of mobile cellular base stations (BSs) worldwide. This is because mobile cellular BSs are known to consume a high percentage of power within the mobile cellular network. Such energy consumption contributes to the emission of greenhouse gases (GHGs) through the use of conventional diesel generating set (gen-set). As a result, mobile cellular operators are faced with the dilemma of minimizing the power consumption, GHG emissions, and operation cost, while improving the quality of service (QoS) of the networks. In attempting to find a solution, this study presents the feasibility and simulation of a solar photovoltaic (PV)/battery hybrid power system (HPS), as a predominant source of power for a specific mobile cellular BS site situated in the Soshanguve area of the city of Pretoria, South Africa. It also presents the technical development and shows the environmental advantage and cost benefits of using a solar PV/battery HPS to power a BS site with a 24 h daily load of 241.10 kWh/d and peak load of 20.31 kW as compared to using the HPS with a solar PV/diesel gen-set/battery. The solar resource pattern for the city of Pretoria was collected from the National Aeronautics and Space Administration and was modeled statistically. The statistical modeling done using solar radiation resource exposure characteristic patterns of Pretoria, South Africa revealed an average annual daily solar radiation of 5.4645 Wh/m2/d and a 0.605 clearness index. The simulation and the design were done using Hybrid Optimization Model for Electric Renewables (HOMER) and Matlab/Simulink software. The simulation finding showed that the HPS of the solar PV/battery combination has about a 59.62% saving in the net present cost (NPC) and levelized cost of energy (LCOE) and an 80.87% saving in operating cost as against conventional BSs powered with a gen-set/battery.
1. Introduction
Growth in the use of mobile cellular communications worldwide has led to an increase in the electrical consumption in the mobile telecommunication industries of about 10% between the years 2013 and 2018 [1,2,3,4,5]. According to [6], mobile cellular base stations (BSs) primarily contribute about 60% of the total electrical power consumption within mobile cellular networks. Consequently, given the rise in the number of BSs daily, there is a corresponding rise in the operational expenditure (OPEX), to an estimation of a multiple of factor 10 [7]. Parallel to this increase in cost, the level of greenhouse gas (GHG) emissions will also experience a direct increase of about 3 factors between the years 2007 and 2020 [8]. Often cited to support the increase in GHG emissions is a report of GHG emissions by Standards, Monitoring, Accounting, Rethink, Transform (SMART) 2020 [9].
In addition to the high rate of mobile service subscribers in urban areas, rural areas are now experiencing a significant increase in the number of subscribers to mobile cellular services. Globally, there was the addition of about 1 billion new subscribers to the mobile cellular service from rural areas between the years 1997 and 2012 [3]. Therefore, to increase their rural capacity, coverage, and profit, mobile cellular service providers are augmenting their services through the installation of new mobile cellular BSs to join the existing stations [10]. It is estimated that there are over 4 million deployed mobile cellular BSs across the globe; however, most of them in rural areas are powered using a diesel generating set (gen-set) as a standalone because of the lack of a dependable grid system, thus leading to increases in GHG emissions and a higher cost of OPEX [11,12]. This is because irregular power and the lack of a dependable functioning grid system affect the supply of electrical energy to these BSs in most parts of developing countries. Hence, the lack of a regular uninterrupted power supply could limit the BSs from being able to discharge their minimum required quality of service (QoS) to the satisfaction of the subscribers [6]. In addition to this, a reduction in the BSs’ QoS is caused as a result of overloading and high power consumption [13,14]. To solve these mentioned challenges, particularly in rural areas, there is a need for an uninterrupted, reliable, efficient, cost-effective, and environmentally friendly power supply.
Among various attempts to solve the aforementioned problem, of note is the global deployment of a diesel gen-set at rural BSs. Because of global warming, air pollution, lack of reliability, high operational and maintenance (O&M) costs, low efficiency, high total cost of ownership (TCO), and unavailability, attempting to use a diesel gen-set as the main power source has become unattractive [15,16,17,18]. The use of the renewable hybrid power source method is now becoming attractive because of prominent features such as sustainability, reliability, cost efficiency, environmental benefits, and guaranteed return on investment. Through the utilization of advanced solar technology, these important key features can be met. Solar energy is clean, available in abundance, free in nature, and accessible throughout the seasons; hence, this study explores it. Another factor considered is the solar exposure patterns, such as radiation, temperature, and intensity of the location.
This study aims to investigate the techno-economic feasibility of adopting a hybrid power system (HPS) with a solar photovoltaic (PV)/battery arrangement for a mobile cellular BS of a site located in the Soshanguve rural area. The statistical modeling and simulation were based on the average daily South African solar radiation exposure pattern. Using the Hybrid Optimization Model for Electric Renewables (HOMER) version X64 3.11.5 Pro Editionsimulation software from HOMER Energy, 100 Boulder, CO, USA, and its mathematical models, this article presents both the economic and environmental impacts of using the HPS model in this area. The main contributions of this study are the following:
- The determination of the feasibility of the solar PV power system under different average daily solar exposure patterns at this location to generate sufficient power to feed the mobile cellular BS.
- Using HOMER software and its mathematical models, both the technical and economic feasibilities of using this proposed hybrid power system were determined.
- An environmental and economic comparison of this proposed hybrid power system against the conventional use of a diesel gen-set is provided.
2. Overview and System Modeling
The aim of this section is to provide the architecture and design of the major components of the solar PV-powered BS and their mathematical models. Although there are many renewable sources, only solar is considered in this work because of its high availability potential and cost effectiveness.
2.1. Solar PV-Powered System Architecture
We consider Figure 1, which gives a block diagram of a typical BS powered by the hybrid power system (HPS). It is made up of two systems, namely, hybrid energy sources and the mobile cellular BS. In this system, the HPS supplies the power needed to the BS on the basis of the available energy resources from the solar PV, the battery, or the diesel gen-set controls by the flowchart in Figure 2. The mobile cellular BS system, as illustrated in Figure 1, uses direct current (DC), the load that is fed directly by solar PV modules. The excess electrical energy is stored in the array of the battery bank. Both the battery bank and diesel gen-set/grid system compensate for any discrepancy in energy level from the solar PV system. Figure 2 describes the power management and control operation of this hybrid system. It also gives the power source control management algorithm flowchart module. The purpose of this algorithm is to orchestrate a constant supply of power to the mobile cellular BS without any downtime in the operation of the BS from the HPS. The feasibility of this process depends on the availability of a constant supply of power to the BS. Therefore, the reliability of this HPS is determined by the loss-of-load probability (LOLP). The LOLP defines the average probability percentage of time over which the HPS could not meet the BS’s load requirements [19]. Figure 2 considers the LOLP in executing the power management process. Thus, the higher the LOLP, the lower the reliability of the HPS. The LOLP is taken to have an approximately zero value for the life period of 10 useful years for this HPS. It also manages the proper use of energy harvested by the solar PV panels. The HPS in Figure 1 is controlled using the scheduling method in Figure 2. The required power demanded by the mobile cellular BS is supplied by the power generated from the solar PV. During the day, excess energy is used to charge the battery for later use at night. During the night, the battery bank supplies the required power to the mobile cellular BS. The simulation and sizing of this HPS were carried out using HOMER. Solar power is seen as the most appropriate energy harvesting technology because of its global availability and good quality performance of the PV panels. Although the use of solar PVs to power mobile cellular BSs started with second-generation (2G) technology, their utilization is mostly in rural areas where there is no access to the grid system [20]. Nonetheless, the solar PV-powered BS is becoming widely accepted in urban areas as a result of a reduction in OPEX, advancements in renewable energy research, and the viability of new BSs with a low power consumption and that take up less space [21,22].
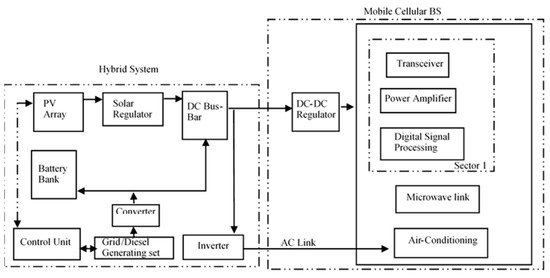
Figure 1.
Hybrid power system (HPS)-powered mobile cellular base station (BS) [23].
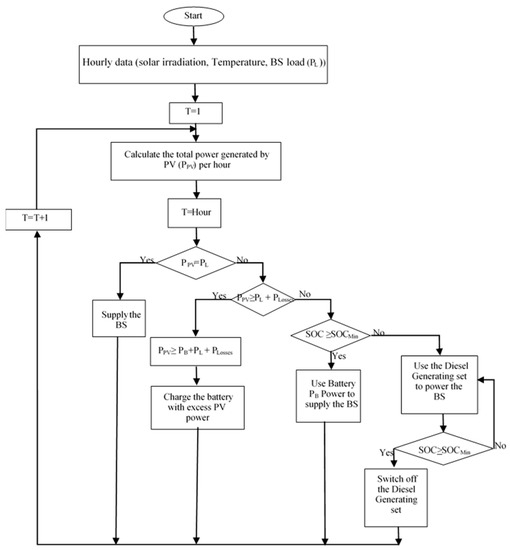
Figure 2.
HPS management algorithm flowchart.
2.2. Mathematical Models for Hybrid Power System
The goal of this section is to provide insight into the mathematically formulated models used in determining the relationship between all the components, such as the BS and HPS, and the costs in this hybrid power system. While the mathematical cost models assist in estimating the life-cycle cost of the system and its advantages, other system element models ensure energy management balance between the energy delivered by the HPS and the energy required by the mobile cellular BS. The mathematical equations used in this work are based on the HOMER mathematical models as obtained from the literature.
2.2.1. Mobile Cellular Base Stations (BS) Modeling
According to [16,24,25], a BS can be described as a link that provides a direct path from the mobile core network to the mobile stations covering various cells. The solar PV panel can power the BS directly because the BS is primarily a DC load that is mainly comprised of power amplifiers (PAs), a transceiver (RF), the baseband unit (BB), microwave backhaul, and auxiliary equipment such as lighting and air conditioning [25], as shown in Figure 1. Figure 3 shows the percentage of power consumption in each unit of the mobile cellular BS shown in Figure 1. There are several types of mobile cellular BSs, such as macro BSs, micro BSs, femto BSs, and pico BSs. These BSs are categorized on the basis of their size and power consumption. Of all these BSs mentioned, macro BSs are the most commonly used [6]. The total power requirement of the site was calculated using [26].
where P is the total capacity of the BS DC load power, is the energy consumption of all the equipment on site, and represents the corresponding run time of the equipment energy.
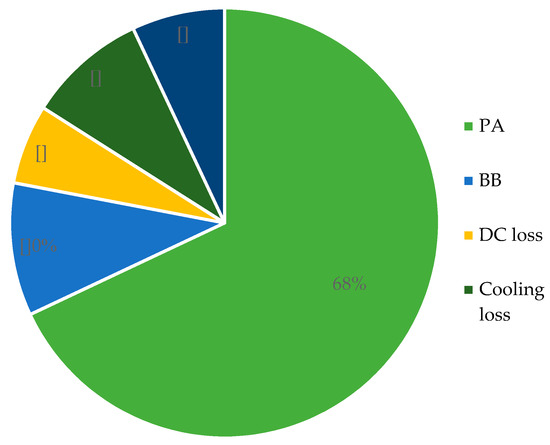
Figure 3.
Percentage of power consumption in a macro base station (BS) [24].
As given in [24,25,27,28], macro BS models power consumption according to Equation (2):
In Equation (2), is the total number of transceivers, at zero traffic or no load; is the power consumed, ranging above 118.7 W; and the BS manufacturer represents the BS constant by , with its value ranging above 2.66. The power amplifier at maximum load or traffic is given by ; its value also ranges from 40 W for a macro mobile cellular BS. The normalized traffic at a given time is represented by K. From Equation (1), the power consumed by a BS depends on the traffic load, which depends on the time of day. Thus, the normalized traffic load for a BS at any given time is modeled by [29] as
In Equation (3), at any time, the number of active traffic loads is , while at any spectrum distributed to the BS, the greatest number of users allowed by the BS at any given normalized time is .
2.2.2. Hybrid System Modeling
The HPS consists of solar PV panels, the batteries, a converter, and the power back, such as the grid or diesel gen-sets, as seen in Figure 1. The mathematical models for each one of these are based on the HOMER models as given by [30], which were used to calculate the simulation parameters used in this study.
2.2.3. Solar PV Array Model
A solar PV array is a combination of many interconnecting different solar modules formed through the fusion of many solar cells. The PV panels are rated in DC, on the basis of the power they can generate when the solar power available on them is 1 kW/m2. Presently, commonly used PV cells with an efficiency of about 15–19% are monocrystalline and polycrystalline silicon in large-scale applications [6,31]. According to [12,32], the output power of the PV modules is determined by the PV cell material, the cell temperature, the solar radiation incident on the PV modules, the DC–AC loss factor, and the tilt of the PV panel, as well as by the geographical location of the site. Masoulel et al., and Akinyele et al. in [33,34,35] explained that these solar cells act as a membrane that attracts and converts short irradiance waves to DC electricity. Mathematically, HOMER proved the yearly total energy produced by the solar PV array using Equation (4), which is based on equations by [21]:
From Equation (4), the peak capacity of the PV array measured in kilowatts is represented by . The average daily solar radiation is the peak solar hour (PSH), measured per hour. Other factors such as dust, temperature, and wire losses that can affect the wattage output of the solar PV are expressed as the PV derating factor . The overall efficiency of the solar PV modules is called the derating factor. These PV arrays are interconnected in a parallel-series configuration and are grouped together in a unit to form what is referred to as a solar PV module. Therefore, through the use of Kirchhoff’s Voltage Law in Equation (5), the output current could be estimated in Matlab/Simulink tool box version R2018a by the MathWorks from Natick, MA, USA.
where is the shunt resistance voltage and is the diode current, which can expressed using the diode current expression in Equation (6):
The current-generated light or solar radiation can be obtained using Equation (7):
where G is the radiation (W/m2); is the radiation under standard conditions, 1000 W/m2; is the photoelectric current under standard conditions, 0.15 A; TCref is the module temperature under standard conditions, 298 K; αISC is the temperature coefficient of the short-circuit current, (A/K) = 0.0065/K; and is the light-generated current (radiation).
In most of the literature, in Equation (6) is an ideal value between 1 and 2; is the Boltzmann constant, which is J/K; and T is the operating temperature given by Equation (8):
is the ambient air temperature, and is the nominal operating temperature of the PV cell. Often, is assumed. Therefore, can be expressed using Equation (9):
In Equation (6), is the electron charge, which is , and is the open-circuit voltage, which is sensitive to temperature and can be obtained via Equation (10):
Then, the output current and voltage from the solar panel are derived as a function of time. The output power of the cell can be obtained in a similar way using Equation (11):
where F is the cell fill factor, which can be formulated using Equation (12):
2.2.4. Battery System Model
A battery system is a type of electrochemical energy storage device that stores and converts excess electrical energy (DC) from the solar panel or grid in the form of electrochemical energy for later usage. However, each battery technology has a separate way in which it must be treated. Majorly, the mathematical modeling of a battery system in a hybrid system depends on the battery state of charge (SOC), the depth of discharge (DOD), and the state of health (SOH) [36,37]. The SOC is the cumulative sum of charge or discharge transfers of the battery daily. The mathematical model of the battery, the fitted controller, and the converter is produced according to the following equations given in [38,39,40,41]. The size of the battery can be derived using Equation (13):
where
In Equation (13), is the size of the battery, and stands for the total number of batteries within the battery bank. is the energy stored in the battery per hour t (kWh), and is the energy stored in the battery at hour t − 1 (kWh). is the hourly energy output from the charge controller (kWh), and is the battery charging efficiency.
Additionally, the available energy within the battery bank during the discharge at any time t can be modeled as Equation (15) from Equation (14):
is the energy needed at a particular period of time.
The DOD, which is a measure of the percentage of energy that can be withdrawn from the battery, can also be modeled as follows:
where is the ratio of the minimum allowable SOC voltage to the maximum SOC voltage across the battery terminals when fully charged. is the minimum SOC of the battery bank.
Therefore, the power available within the battery bank is mathematically modeled as
where is the simulation time step.
Furthermore, the overall lifetime using the battery can be expressed using Equation (19) according to [30]:
From Equation (18), the lifetime throughput of a single battery measured as kilowatt hours is expressed as , the yearly battery throughput measured as kilowatt hours per annum is , and the battery float life (annum) is expressed as . The HOMER software used Equation (20) to calculate the autonomy—the number of days over which a fully charged battery can supply the fully loaded BS before running out of power without any input from any other power sources from the HPS [16,30]:
where stands for the total number of batteries within the battery pack. A single battery’s nominal voltage is represented by . The nominal capacity of an individual battery within a battery pack is represented by , and the daily average load of the BS is represented by .
The battery capacity is calculated using Equation (21) according to [26]:
where the battery capacity is represented by C (Ah), is the autonomy backup day, DoD is the depth of discharge (80%), is the coefficient of the battery (1.14), P is the capacity of the total DC power load, t is the working time per day of the load (24 h), and the voltage of the battery is represented by .
2.2.5. Charge Controller and Converter Models
The aim of the charge controller is to prevent overcharging of the battery system. It also serves as a battery management unit. It is expressed mathematically by Equations (22) and (23):
where is the hourly energy output from the charge controller (kWh), is the hourly energy input to the charge controller (kWh), is the efficiency of the charge controller, is the hourly energy output from the rectifier (kWh), and is the amount of surplus energy from DC sources (kWh).
Just as for the controller, a converter that holds both a rectifier and inverter is necessary. The advantage of adding a rectifier is to convert the AC power from the grid to DC power of a constant voltage. This grid will power the BS while also charging the power bank, that is, the battery bank. The mathematical model for this converter is given below:
where
Therefore, at any time t,
where is the hourly energy output from the rectifier (kWh), is the hourly energy input to the rectifier (kWh), is the efficiency of the rectifier, is the excess energy from AC sources (kWh), and is the hourly energy supplied by the grid.
2.3. Cost Modeling
In HOMER software, the total net present cost (NPC) of a system is the present value of all the costs the system incurs over its lifetime minus the present value of all the revenue it earns over its lifetime. The NPC includes capital costs, replacement costs, operations and maintenance (O&M) costs, fuel costs, emission penalties, and the costs of buying power from the grid. Thus, the NPC can be mathematically expressed [42] using Equation (27):
The total annualized cost (TAC) is the annualized value of the total NPC and the capital recovery factor (CRF) and is expressed by [42] using Equation (28):
In Equation (28), i is the annual real interest rate, and n is the project lifetime. According to HOMER, all prices increase directly at the same rate, while the nominal interest rate is used in place of the annual real interest [16]. Other costs include the discount factor , which is used to calculate the present value of a cash flow that occurs in any year during the project’s lifetime [30,42]:
The salvage cost is the power system components’ value remaining at the end of the completion of a particular project’s lifetime. HOMER calculates the salvage cost using Equation (22) [30]:
In Equation (30), rep is the replacement cost of the component, rem is the remaining lifetime of the component, and comp is the lifetime of the component. The operating cost is the annualized value of all costs and revenues other than initial capital costs. HOMER uses Equation (31) to calculate the operating cost:
where is the total annualized cost, and is the total capital cost. The levelized cost of energy (LCOE) is the average cost per kilowatt hour of useful electrical energy produced by the system. HOMER models this using Equation (32):
where the electricity generation per annum is , is the fuel expenditure per annum, is the investment expenditure per annum, is the O&M expenditure per year, and r is the discount rate per annum. The PV system life was taken as 25 years at a discount rate of 6%, and the system life rating was 10 years.
2.4. Reliability
The reliability of the HPS is an important factor in this design. Because of the stochastic process of power generation by the solar PV module, there is a need for constant time to check the HPS simulation’s components and the mobile cellular BS to determine the overall reliability of this system. Thus, the LOLP of this HPS is calculated using Equation (33) [31,43,44]:
Equation (33) indicates that the LOLP is a function of unmet load demand. Furthermore, a high LOLP value indicates an unreliable system, and the sum of the LOLP and availability must equal 100%.
3. Methodology
The aim of this section is to give the site description, the data modeling, the BS load profile parameters, and the architecture layout, as well as the cost and features of components used during the simulation. It is important to have these data to generate the power needed at the lowest cost of operation.
3.1. Site Description, Solar Resources, and Clearance Index
Statistical modeling was carried out on solar irradiation data collected from two weather stations within Gauteng province, that is, Johannesburg and Pretoria. These were analyzed for the use of the BS located in Soshanguve. Soshanguve is a township located about 45 km north of Pretoria under Gauteng province, South Africa. It lies between a latitude and longitude of 25.5226° S and 28.1006° E, respectively. Figure 4 shows the map of Soshanguve.
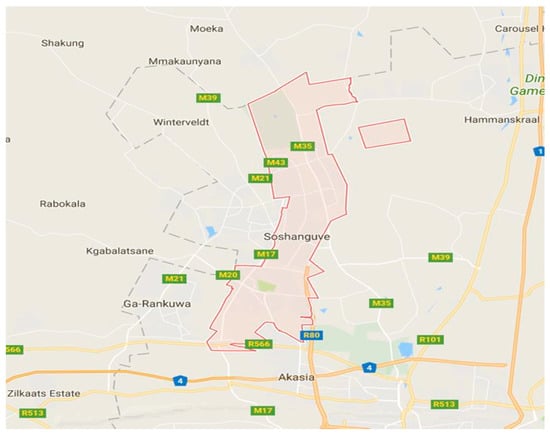
Figure 4.
Map of Soshanguve.
The average monthly solar data resources over the period of 10 years considered are shown in Figure 5.
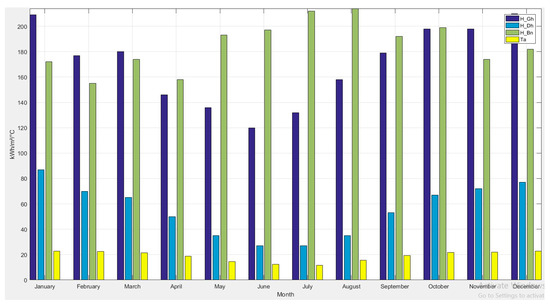
Figure 5.
Average monthly solar data of Pretoria, South Africa.
The average monthly solar radiation data used in this work is presented in Figure 5 and Figure 6. Furthermore, Figure 6 shows the average daily solar radiation for the town of Soshanguve to be about 5.4645 kWh/m2, while the average daily clearness index calculated was 0.605 using Equation (34):
where is the average monthly radiation on the horizontal surface of the earth , and is the extraterrestrial horizontal radiation on a horizontal surface at the top of the earth’s atmosphere [26]. The solar intensity of solar radiation at the top of the earth’s atmosphere is given by
where
and n is the day of the year, from 1 to 365.
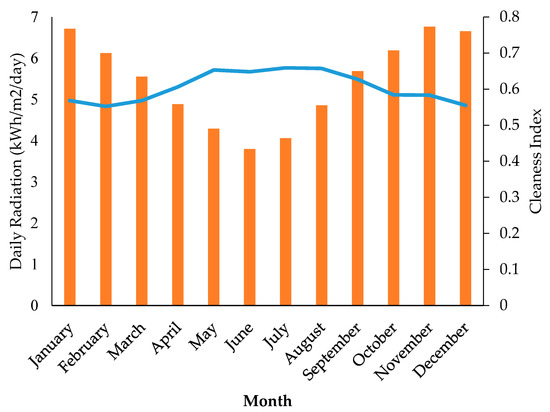
Figure 6.
Average monthly daily global horizontal irradiation index (GHI) and clearness index.
Both the clearness index and daily radiation values further confirmed that this site is suitable to produce sufficient solar energy, that is, when these values were compared to other locations such as South Korea, with an average monthly radiation of 4.01 kWh/m2/day and a clearness index of 0.504, which are currently using solar PV-powered BSs [23]. These values and a comprehensive pre-feasibility study were important for efficient and reliable designing of the HPS. In addition, for a solar energy harvesting form of renewable energy to power an off-grid BS, meteorological data are critical for efficient sizing.
Figure 6 shows the graphical illustration of the average monthly solar resources profile used in this study. The average monthly daily radiation is represented with a bar chart in orange, while the blue line represents the average monthly daily clearance index. The highest average daily radiation of 6.763 kWh/m2/day was experienced in November, while the lowest was in June, with radiation of 3.796 kWh/m2/day. The monthly variation was due to changes in weather over seasons. These values assisted in proper designing, sizing, and forecasting, thus reducing any chance of downtime as a result of a power outage. This means the designed system will be able to supply the energy requirement of the BS.
3.2. Base Station Load Profile
The efficiency of a solar-powered mobile cellular BS principally depends on the 24 h daily load profile of that BS. Hence, the sizing, designing, and reliability, as well as the modeling of the HPS, critically depend on the BS load. Therefore, the 24 h daily electrical load or power consumption of a mobile cellular BS situated on this site in Soshanguve was obtained using Equation (1) and was thus used in the modeling. Figure 7 shows the daily load consumption profile for the BS over the period of 24 h. Figure 8 shows the average seasonal load consumption for this mobile cellular BS per year. For this calculation, HOMER used the 24 h power consumption load profile over a period of 365 days to safeguard accuracy in the analysis using Equations (1) and (2).
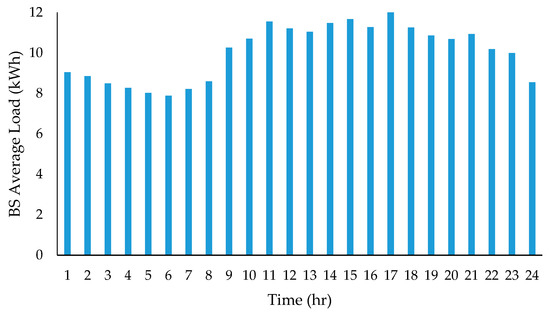
Figure 7.
Average daily 24 h base station (BS) load consumption profile.
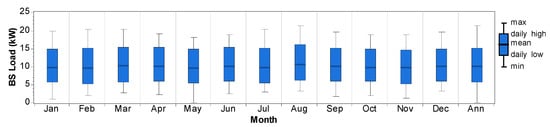
Figure 8.
Base station (BS) average seasonal load profile.
3.3. System Configuration and Simulation
The aim of this section is to provide the architecture layout of the HPS as well as the parameters of the components used in the simulation.
3.3.1. Standalone Solar PV BS Configuration
Through HOMER software, the standalone solar PV and HPS were designed, modeled, and simulated for the mobile cellular BS in this study, using an average daily solar radiation value of 5.4645 kWh/m2 and a daily clearance index of 0.605 as a benchmark. Figure 1 shows the schematic configuration of this HPS arrangement that comprises a mobile cellular BS, solar PV modules, and a battery pack. Figure 2 shows the summary of the energy control algorithm flowchart for this simulation. The function of this power source control algorithm is to work out, prioritize, and select the available source from the solar PV, the battery system, and the backup gen-set HPS. In this configuration, there will be no downtime in the operation of the BS. Fuzzy logic control in Matlab/Simulink was also used in implementing the power source management algorithm flowchart shown in Figure 2. Figure 9 shows the designed model in Simulink, while the fuzzy logic control implementation is shown by the power source management arrangement in Figure 10. Both the HOMER and Matlab/Simulink designs and simulation analyses revealed that the PV array approximated rating needed is 76 kW using Equation (4) and that the number of battery units needed is 208 using Equation (5). The output of the PV module varied on the basis of both input ambient and solar irradiation. The mathematical modeling of this PV module was performed by modeling Equation (5) to Equation (12) in Matlab/Simulink. The fuzzy logic controller toolbox was used in this research to validate how this design can reliably satisfy the system’s load requirements at the supply side. This was done at the same time as ensuring no downtime during the working conditions. The advantage of using the fuzzy logic controller is to overcome the nonlinearity and the associated parameter variation of the components included in this HPS, therefore leading to a better system response under both transient and steady-state conditions [45,46]. Therefore, 220 scenarios were simulated using HOMER software as shown in Figure 11; the results obtained showed the best HPS configuration that is the most suitable for this standalone solar PV-powered mobile cellular BS in terms of energy production, environmental benefits, and lowest cost. The cost implications and the technical specifications of the components used in the simulation for the standalone solar PV BS model in HOMER are given in Table 1. The costs were mathematically modeled using Equations (27)–(32).
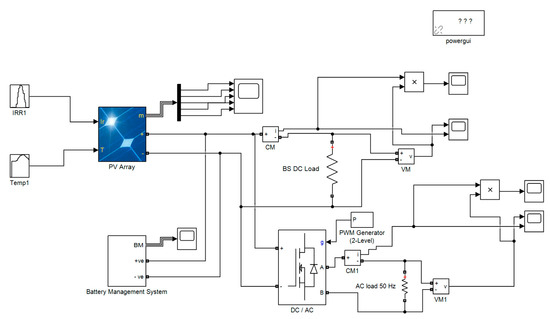
Figure 9.
Designed hybrid power system (HPS) management in Matlab/Simulink.
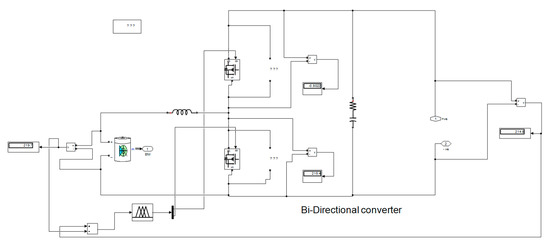
Figure 10.
Fuzzy logic controlled power source management in Matlab/Simulink.
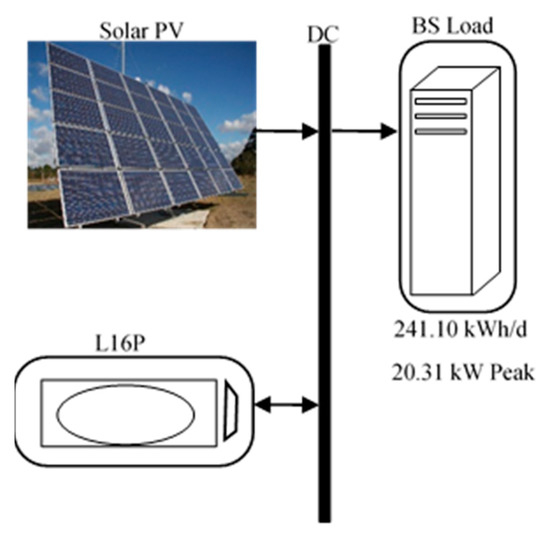
Figure 11.
Schematic diagram of a standalone solar photovoltaic (PV)-powered mobile cellular base station (BS).

Table 1.
Cost and energy production of the solar photovoltaic (PV) hybrid power system (HPS) components.
Figure 11 shows the schematic diagram of a standalone solar PV HPS powered mobile cellular BS designed using HOMER software tool. For this standalone solar PV power source simulation, a generic flat-plate PV module of 75.6 kW capacity rating was used on the basis of Equation (4). Furthermore, the number of modules in series and parallel was achieved by dividing the designed system voltage by the nominal module voltage under standard test conditions [47]. The connection of this HPS, with 8 modules in series and 53 modules in parallel, was based on the model in [47]. Table 2 shows the technical specification of the generic flat-plate solar PV module used in this model. The total yearly energy contribution of this PV array is 146,847 kWh, obtained using Equation (4).
Table 2.
Technical criteria of generic flat-plate solar photovoltaic (PV) module.
The second item for this standalone model is the energy storage device known as a battery. The Trojan L16P battery model, which was designed by company Trojan, was used in this design. It has 26 parallel strings connected to a 48 V bus voltage. The nominal rated voltage of the Trojan L16P battery is 6 V; hence a 48 V DC busbar connected in series was used. Furthermore, with 208 units of batteries operating at a nominal voltage of 6 V, its annual energy production is 50,526 kWh, obtained using Equation (21). From Equation (20), the battery can supply the BS load independently for 47.4 h, which is approximately 2 days of autonomy. Other technical parameters are summarized in Table 3, obtained using the mathematical models from Equations (13)–(21). In addition to the cost benefits, this standalone arrangement produces no GHG emissions. The expected life of this battery arrangement is approximately 7.07 years, calculated using Equation (19).
Table 3.
Technical criteria for Trojan L16P battery.
3.3.2. Diesel Gen-Set HPS Architecture and Technical Criteria
As well as the standalone solar PV, a hybrid possibility with a diesel gen-set was considered. The schematic diagram is given in Figure 12 using the same BS load and solar resources. The cost and parameters of the components used for this arrangement are given in Table 4. Likewise, from the simulation carried out using HOMER software, the best arrangement in terms of the components’ parameters and cost efficiency was chosen from the many scenarios created.
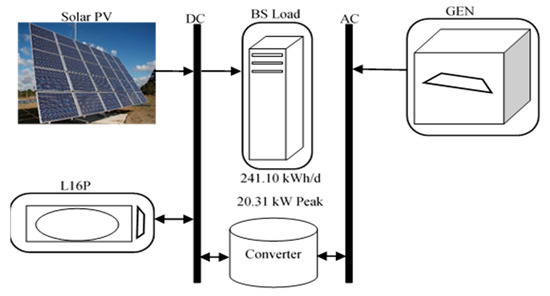
Figure 12.
Schematic diagram of hybrid power system (HPS) with diesel generating set (GenSet)) for a base station (BS).
Table 4.
The cost and energy production of the diesel generating set (gen-set) hybrid power system (HPS) components.
For this gen-set of 25 kW, Table 5 summarizes the overall fuel consumption and its features.
Table 5.
Autosize generating set (gen-set) diesel consumption and technical criteria.
The solar PV used in this HPS was a generic flat-plate solar PV module. It has a rated capacity of 56.4 kW, and the total energy production is 109,498 kWh/year, obtained using Equation (4). Other technical parameters are summarized in Table 6.
Table 6.
Features of generic flat-plate solar photovoltaic (PV) and technical criteria.
The system converter used in this arrangement with its capacity and price is given in Table 4. The converter contains both an inverter and a rectifier with capacities of 11.2 and 10.7 kW, respectively. The annual total electric energy production was obtained using Equations (23)–(26) as 0.317 kW. Other parameters are summarized in Table 7.
Table 7.
Capacity and technical criteria of converter.
The energy storage used in this simulation was a Trojan L16P battery. With a nominal voltage of 6 V, connected over a 48 V busbar, a total number of 144 batteries were used in this design. Using Equation (21), the annual electrical energy production is 49,300 kWh. The battery has an autonomy of 32.8 h over which it can supply the BS load independently, according to Equation (20). Table 8 summarizes the capacity and characteristics of the battery.
Table 8.
Capacity and technical criteria of Trojan L16P.
4. Results and Discussion
This section discusses the results of the simulation from the architectural layout and sizing of the components used in this design in Section 3.
Figure 13 shows the characteristics of the PV module in P–V curves simulated in Matlab/Simulink. The model was simulated under the average hourly ambient temperature and solar irradiation of the BS site’s location as inputs. The results showed an increase in PV energy output as the solar irradiance increased, depending on the hour of the day. Therefore, both the voltage and the current drawn from the PV modules increased as the solar irradiance increased, but decreased when there was an increase in ambient temperature and vice versa. Therefore, there was a decrease in the output power as the ambient temperature increased and solar irradiance decreased. Figure 14 also shows a reduction in both the voltage and current output of the PV module due to an increase in input ambient temperature.
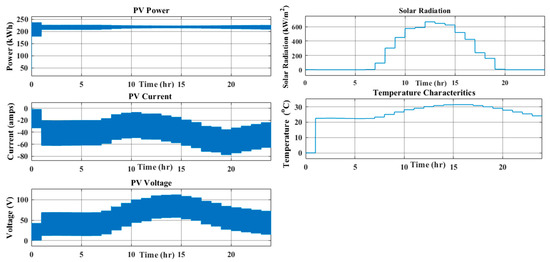
Figure 13.
The average hourly photovoltaic (PV) array I–V characteristics.
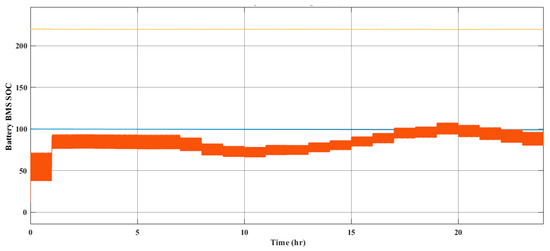
Figure 14.
Average hourly battery management state of charge (SOC).
Figure 14 shows the battery management fuzzy logic controller implemented in the model shown in Figure 10. It depends on the battery’s SOC. This allows the battery not to discharge below 50% and not to overcharge above 100%, depending on the average daily hourly solar irradiance and the load of the mobile cellular BS.
4.1. Energy Production Analysis
Figure 15 shows a graph of the average monthly time series load consumption of the standalone BS used. It shows an annual load consumption of 87,929 kWh using Equation (1). Using the average daily solar radiation of 5.465 kWh/m2 and all the parameters provided in Section 3.3.1, Figure 16 reveals the energy production by the solar PV to supply the daily load consumption of the BS with the result displayed in Figure 15. The result shows an annual total energy production of 146,847 kWh/year using Equation (4) for the generic flat-plate PV array operating at 4384 h/year in a standalone arrangement and of 109,498 kWh for the HPS arrangement using HOMER. With the BS load of 87,929 kWh/year obtained using Equations (1) and (2), there will be excess electricity of about 47,756 kWh/year. This excess energy will be used in case of an increase in load consumption, while the remaining energy will be stored in the battery for future usage. Figure 16 shows the monthly electric energy production of the solar PV module. Figure 16 further confirms the possibility of using the solar PV to achieve 100% renewable energy penetration. Consequently, the quantity of GHGs produced for this standalone solar PV is zero, thus making it ideal for the elimination of GHG emissions as compared to the exclusive use of the diesel gen-set or the HPS of the PV/battery/gen-set configuration. Using Equation (33), the calculated LOLP is 0.286% per year on average for an unmet load demand of 25.2 kWh/year. Thus, this system has an availability of 99.714% per year. Figure 17 shows the average monthly unmet BS’s load demand. Figure 18 shows the average monthly percentage of SOC of the batteries.
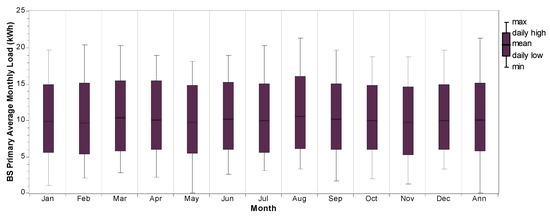
Figure 15.
Time series average base station (BS) monthly load consumption.
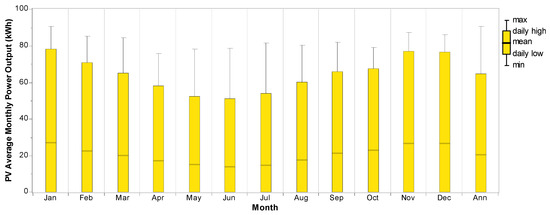
Figure 16.
Average monthly electric production by the photovoltaic (PV) module.
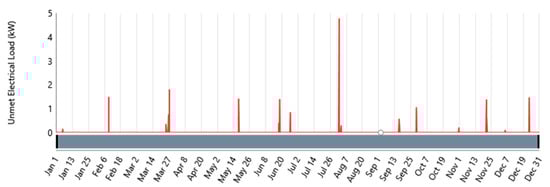
Figure 17.
Average monthly unmet base station (BS) load.
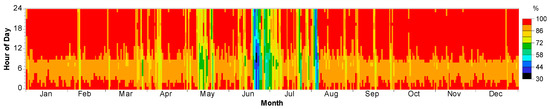
Figure 18.
Average monthly percentage of state of charge (SOC) of the batteries.
The Trojan L16P batteries used gave an annual throughput of 50,526 kWh/year, with an energy input of 56,355 kWh/year, an output of 45,192 kWh/year, and losses of 11,284 kWh/year due to aging. Figure 19 shows the data map define as DMap of the energy content of the batteries in a time series of average hourly values of the PV array power output with SOC over a period of 12 months for the solar-powered mobile cellular BS. The lowest percentage of charge is experienced in the months of March and June, while the highest is in the months of January and November, with daily GHIs of 6.716 and 6.763 kWh/m2/day, respectively, as displayed in Figure 20. Figure 20 further reveals that the battery bank is at its average maximum for 45% of the year and at its minimum for less than 1% of the year.
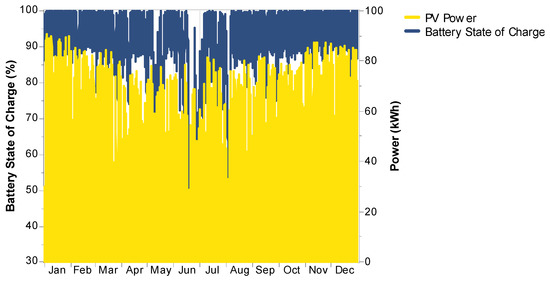
Figure 19.
Trojan L16P average monthly energy content in time series.
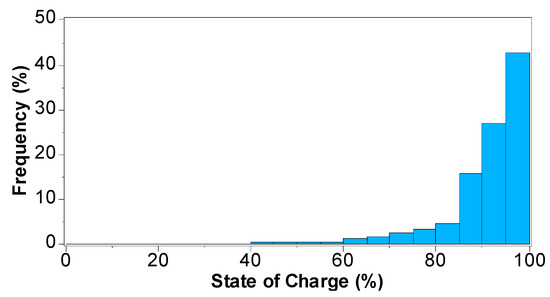
Figure 20.
The average yearly frequency for battery state of charge (SOC).
For the HPS with the gen-set in Section 3.3.2, the total energy produced is 112,579 kWh/year. From Figure 21, the gen-set can support the BS when there is low production from the PV because of a low GHI, particularly in the months of March and June. However, this arrangement emits 3061.235 kg/year of GHGs. The breakdown of the GHG emissions is summarized in Table 9.
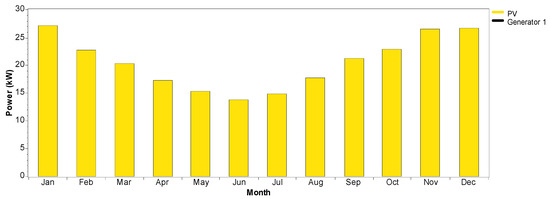
Figure 21.
Average monthly electrical energy contribution by HPS.
Table 9.
Generating set (gen-set) greenhouse gas (GHG) emissions.
4.2. Economic Analysis
Using Equations (27)–(32), the economic analysis in terms of the NPC and TAC of each component are presented in Table 10 and Table 11 for the HPS of the standalone solar PV HPS and the HPS using a gen-set, respectively. From Table 10, the HPS of the solar PV system has an initial capital of $138,025, replacement cost of $88,043.88, O&M cost of $36,665.66, salvage cost of 6922.51, operating cost of $9111, LCOE of $0.225, and NPC of $255,812. Out of the total NPC of $255,812, the battery system alone costs 66.61%. However, the LCOE will continue to decrease as the initial capital of the system decreases [48,49].
Table 10.
Cost of solar photovoltaic (PV) hybrid power system (HPS) components.
Table 11.
Cost of generating set (gen-set) hybrid power system (HPS) components.
From Table 11, the initial capital cost of the diesel gen-set HPS is $115,460. This is less compared to the solar PV system; however, it produces emissions of 3061.235 kg/year of GHGs. Its operating cost is $10,273, its replacement cost is $90,218.94, its O&M cost is $29,338, its salvage cost is $1652.86, its LCOE is $0.218, its fuel cost is $14,896.06, and its NPC is $248,260.
Comparing these results to the use of a gen-set alone, as shown in Table 12, the HPS is more economically viable and environmentally friendly, as it will eliminate 90,295 kg of GHGs per year. This result can be used as a feasibility guide in planning the energy production. Furthermore, aside from the initial capital cost, the solar PV HPS performed better. Thus, the solar PV HPS demonstrates viable performance to power the mobile cellular BS located at this site.
Table 12.
Cost comparison and greenhouse gas (GHG) emissions.
5. Conclusions
This research work examined the cost, technical, and environmental benefits that can be derived from the use of renewable energy sources to power a selected mobile cellular BS site in the Soshanguve rural area of South Africa. The simulation used the solar resources of this location collected from NASA and modeled statistically to work out the technical feasibility of using solar energy as the primary energy source, without power shortage, at this mobile cellular BS.
The statistical modeling done using the solar radiation resource exposure character pattern of Pretoria, South Africa revealed an average annual daily solar radiation of 5.4645 Wh/m2/d and a 0.605 clearness index. The simulation and the design were done using HOMER software and Matlab/Simulink. The simulation finding showed that the HPS of the solar PV/battery combination has a total NPC, LCOE, and operating cost of $255,812, $0.23, and $9111, respectively, using clean energy. This is as against the conventional HPS of a diesel generator, which has a total NPC, LCOE, and operating cost of $248,260, $0.22, and $10,273 respectively, but produces 3061.235 kg/year of GHG emissions, and against conventional BSs powered with gen-set batteries, with a total NPC, LCOE, and operating cost of $633,633, $0.559, and $47,624 respectively, and GHG emissions of 90,295.9 kg/year. It can be concluded that the architecture of standalone solar PVs is more economical and environmentally friendly, with zero emissions of GHGs, compared to other layouts such as the diesel gen-set alone or the HPS with a gen-set to power the BS shown in Section 4. The cost comparison summary is given in Table 10 over a period of 10 years. The result clearly indicates that a superior environmental friendliness and technical and cost effectiveness are achievable through the use of renewable energy sources. Although the use of a gen-set alone has the lowest initial capital, its cost of operation is huge compared to the other HPSs discussed. Furthermore, its high emissions of GHGs cannot be taken lightly; thus the standalone renewable model gave a better option in terms of cost and emissions of GHGs.
Because of the lack of funding, this present study was solely based on simulation with HOMER. Future study can also integrate and compare the results of this paper with experimental results. In order to explore the techno-economic and environmental feasibility of other renewable energy sources, it will be interesting to carry out more research on the integration of wind and biomass into this present model. This is likely to reduce the overall OPEX of the present model. Furthermore, decision-making analysis tools can be applied to identify alternatives for the optimal system design.
Author Contributions
Conceptualization, S.P.D.C., B.A.A. and T.O.O.; Methodology, B.A.A.; Software, B.A.A.; Validation, B.A.A.; Formal Analysis, B.A.A.; Investigation, B.A.A.; Resources, B.A.A.; Data Curation, B.A.A.; Writing-Original Draft Preparation, B.A.A.; Writing-Review & Editing, B.A.A., T.O.O., A.M.A.-M., and S.P.D.C.; Visualization, B.A.A., T.O.O., A.M.A.-M., and S.P.D.C.; Supervision, S.P.D.C., T.O.O., and A.M.A.-M.; Project Administration, S.P.D.C., T.O.O., A.M.A.-M., B.A.A.; Funding Acquisition, A.M.A.-M., T.O.O. and S.P.D.C.
Funding
This research was funded by Tshwane University of Technology and Council for Scientific and Industrial Research grant number M824 and SWP.
Acknowledgments
The authors acknowledge research support received from the Tshwane University of Technology, Pretoria and the Council for Scientific and Industrial Research (CSIR), Pretoria, South Africa.
Conflicts of Interest
The authors declare no conflict of interest.
References
- Cisco. Visual Networking Index Forecast Projects Nearly 11-Fold Increase in Global Mobile Data Traffic from 2013 to 2018; Cisco Public: San Francisco, CA, USA, 2014. [Google Scholar]
- Bhargava, V.K.; Leon-Garcia, A. Green cellular networks: A survey, some research issues and challenges. In Proceedings of the 2012 26th Biennial Symposium on Communications (QBSC), Kingston, ON, Canada, 28–29 May 2012; pp. 1–2. [Google Scholar]
- Kusakana, K.; Vermaak, H.J. Hybrid renewable power systems for mobile telephony base stations in developing countries. Renew. Energy 2013, 51, 419–4253. [Google Scholar] [CrossRef]
- Meo, M.; le Rouzic, E.; Cuevas, R.; Guerrero, C. Research challenges on energy-efficient networking design. Comput. Commun. 2014, 50, 187–195. [Google Scholar] [CrossRef]
- Lambert, S.; van Heddeghem, W.; Vereecken, W.; Lannoo, B.; Colle, D.; Pickavet, M. Worldwide electricity consumption of communication networks. Opt. Express 2012, 20, B513–B524. [Google Scholar] [CrossRef] [PubMed]
- Chamola, V.; Sikdar, B. Solar powered cellular base stations: Current scenario, issues and proposed solutions. IEEE Commun. Mag. 2016, 54, 108–114. [Google Scholar] [CrossRef]
- Aris, A.; Shabani, B. Sustainable Power Supply Solutions for Off-Grid Base Stations. Energies 2015, 8, 10904–10941. [Google Scholar] [CrossRef]
- Fehske, A.; Fettweis, G.; Malmodin, J.; Biczok, G. The global footprint of mobile communications: The ecological and economic perspective. IEEE Commun. Mag. 2011, 49, 8. [Google Scholar] [CrossRef]
- Webb, M. SMART 2020: Enabling the Low Carbon Economy in the Information Age; The Climate Group: London, UK, 2008; Volume 1, p. 1. [Google Scholar]
- Olwal, T.O.; Djouani, K.; Kurien, A.M. A survey of resource management toward 5G radio access networks. IEEE Commun. Surv. Tutor. 2016, 18, 1656–1686. [Google Scholar] [CrossRef]
- Alsharif, M.; Kim, J. Optimal Solar Power System for Remote Telecommunication Base Stations: A Case Study Based on the Characteristics of South Korea’s Solar Radiation Exposure. Sustainability 2016, 8, 942. [Google Scholar] [CrossRef]
- Bae, S. Economic operation scheme of a green base station. In Proceedings of the International Conference on Information, System and Convergence Applications, Dubai, UAE, 25 September 2015; pp. 1–2. [Google Scholar]
- Zhang, H.; Jiang, C.; Mao, X.; Chen, H.-H. Interference-limited resource optimization in cognitive femtocells with fairness and imperfect spectrum sensing. IEEE Trans. Veh. Technol. 2016, 65, 1761–1771. [Google Scholar] [CrossRef]
- Zhang, H.; Jiang, C.; Beaulieu, N.C.; Chu, X.; Wang, X.; Quek, T.Q. Resource allocation for cognitive small cell networks: A cooperative bargaining game theoretic approach. IEEE Trans. Wirel. Commun. 2015, 14, 3481–3493. [Google Scholar] [CrossRef]
- Okundamiya, M.S.; Emagbetere, J.O.; Ogujor, E.A. Assessment of renewable energy technology and a case of sustainable energy in mobile telecommunication sector. Sci. World J. 2014, 2014. [Google Scholar] [CrossRef] [PubMed]
- Alsharif, M.H. Techno-Economic Evaluation of a Stand-Alone Power System Based on Solar Power/Batteries for Global System for Mobile Communications Base Stations. Energies 2017, 10, 392. [Google Scholar] [CrossRef]
- Alsharif, M.H.; Nordin, R.; Ismail, M. Energy optimisation of hybrid off-grid system for remote telecommunication base station deployment in Malaysia. EURASIP J. Wirel. Commun. Netw. 2015, 1, 64. [Google Scholar] [CrossRef]
- Shezan, S.A.; Julai, S.; Kibria, M.A.; Ullah, K.R.; Saidur, R.; Chong, W.T.; Akikur, R.K. Performance analysis of an off-grid wind-PV (photovoltaic)-diesel-battery hybrid energy system feasible for remote areas. J. Clean. Prod. 2016, 125, 121–132. [Google Scholar] [CrossRef]
- Diamantoulakis, P.D.; Karagiannidis, G.K. On the design of an optimal hybrid energy system for base transceiver stations. J. Green Eng. 2013, 3, 127–146. [Google Scholar]
- Zordan, D.; Miozzo, M.; Dini, P.; Rossi, M. When telecommunications networks meet energy grids: Cellular networks with energy harvesting and trading capabilities. IEEE Commun. Mag. 2015, 53, 117–123. [Google Scholar] [CrossRef]
- Babatunde, O.; Emezirinwune, M.; Denwigwel, H.; Akin-Adeniyi, J. Hybrid Power System for Off-Grid Communities: Techno-Economic and Energy Mix Analysis. In Proceedings of the 2017 IEEE 3rd International Conference on Electro-Technology for National Development (NIGERCON), Owerri, Nigeria, 7–10 November 2017; pp. 946–952. [Google Scholar]
- Akinbulire, T.O.; Oluseyi, P.O.; Babatunde, O.M. Techno-economic and environmental evaluation of demand side management techniques for rural electrification in Ibadan, Nigeria. Int. J. Energy Environ. Eng. 2014, 5, 375–385. [Google Scholar] [CrossRef]
- Alsharif, M.H. Optimization design and economic analysis of energy management strategy based on photovoltaic/energy storage for heterogeneous cellular networks using the HOMER model. Sol. Energy 2017, 147, 133–150. [Google Scholar] [CrossRef]
- Auer, G.; Blume, O. Earth project d2. 3-energy efficiency analysis of the reference systems, areas of improvements and target breakdown. EARTH FP7 2011, 3, 66–78. [Google Scholar]
- Aderemi, B.A.; Chowdhury, S.D.; Olwal, T.O.; Abu-Mahfouz, A.M. Solar PV powered mobile cellular base station: Models and use cases in South Africa. In Proceedings of the 2017 IEEE AFRICON, Cape Town, South Africa, 18–20 September 2017; pp. 1125–1130. [Google Scholar]
- Oviroh, P.O.; Jen, T.-C. The Energy Cost Analysis of Hybrid Systems and Diesel Generators in Powering Selected Base Transceiver Station Locations in Nigeria. Energies 2018, 11, 687. [Google Scholar] [CrossRef]
- Chamola, V.; Sikdar, B. Resource provisioning and dimensioning for solar powered cellular base stations. In Proceedings of the 2014 IEEE Global Communications Conference, Austin, TX, USA, 8–12 December 2014; pp. 2498–2503. [Google Scholar]
- Chamola, V.; Sikdar, B. Power Outage Estimation and Resource Dimensioning for Solar Powered Cellular Base Stations. IEEE Trans. Commun. 2016, 64, 5278–5289. [Google Scholar] [CrossRef]
- Mutlu, H.; Alanyali, M.; Starobinski, D. Spot pricing of secondary spectrum access in wireless cellular networks. IEEE/ACM Trans. Netw. 2009, 17, 1794–1804. [Google Scholar] [CrossRef]
- Lambert, T.; Gilman, P.; Lilienthal, P. Micropower system modeling with HOMER. Integr. Altern. Sources Energy 2006, 379–418. [Google Scholar] [CrossRef]
- Babatunde, O.; Akinyele, D.; Akinbulire, T.; Oluseyi, P. Evaluation of a grid-independent solar photovoltaic system for primary health centres (PHCs) in developing countries. Renew. Energy Focus 2018, 24, 16–27. [Google Scholar] [CrossRef]
- Chamola, V.; Sikdar, B. Outage estimation for solar powered cellular base stations. In Proceedings of the 2015 IEEE International Conference on Communications (ICC), London, UK, 8–12 June 2015; pp. 172–177. [Google Scholar]
- Das, N.; Islam, S. Design and analysis of nano-structured gratings for conversion efficiency improvement in gaas solar cells. Energies 2016, 9, 690. [Google Scholar] [CrossRef]
- Masouleh, F.F.; Das, N.; Rozati, S.M. Nano-structured gratings for improved light absorption efficiency in solar cells. Energies 2016, 9, 756. [Google Scholar] [CrossRef]
- Akinyele, D.; Belikov, J.; Levron, Y. Challenges of Microgrids in Remote Communities: A STEEP Model Application. Energies 2018, 11, 432. [Google Scholar] [CrossRef]
- Akinyele, D.; Belikov, J.; Levron, Y. Battery Storage Technologies for Electrical Applications: Impact in Stand-Alone Photovoltaic Systems. Energies 2017, 10, 1760. [Google Scholar] [CrossRef]
- Saeed, S.; Shezan, S.; Arbab, M.; Rana, S. Battery monitoring system for the smart grid applications. In Proceedings of the Universities Power Engineering Conference (AUPEC), 2017 Australasian, Melbourne, Australia, 19–22 November 2017; pp. 1–5. [Google Scholar]
- Okundamiya, M.S.; Emagbetere, J.O.; Ogujor, E.A. Techno-Economic Analysis of a Grid-Connected Hybrid Energy System for Developing Regions. Iranica J. Energy Environ. 2015, 6, 243–254. [Google Scholar]
- Sopian, K.; Zaharim, A.; Ali, Y.; Nopiah, Z.M.; Razak, J.A.; Muhammad, N.S. Optimal operational strategy for hybrid renewable energy system using genetic algorithms. WSEAS Trans. Math. 2008, 7, 130–140. [Google Scholar]
- Salmani, A.; Sadeghzadeh, S.; Naseh, M. Optimization and sensitivity analysis of a hybrid system in Kish_Iran. Int. J. Emerg. Technol. Adv. Eng. 2014, 4, 349–355. [Google Scholar]
- Abdolrahimi, H.; Karegar, H.K. Optimization and Sensitivity Analysis of a Hybrid System for a Reliable Load Supply in Kish_Iran. Int. J. Adv. Renew. Energy Res. 2012, 1. Available online: https://www.researchgate.net/publication/267845730_Optimization_and_Sensitivity_Analysis_of_a_Hybrid_System_for_a_Reliable_Load_Supply_in_KISH_IRAN (accessed on 20 May 2018).
- Chauhan, A.; Saini, R. A review on integrated renewable energy system based power generation for stand-alone applications: Configurations, storage options, sizing methodologies and control. Renew. Sustain. Energy Rev. 2014, 38, 99–120. [Google Scholar] [CrossRef]
- LLC, H.E. Hybrid Optimization Model for Electric Renewables. ed: Retrieved 04/20/2012. 2009. Available online: http://www.homerenergy.com (accessed on 27 April 2018).
- Bubenzer, A.; Luther, J. Photovoltaics Guidebook for Decision-Makers: Technological Status and Potential Role in Energy Economy; Springer Science & Business Media: Berlin, Germany, 2002. [Google Scholar]
- Nafeh, E.-S.A. Fuzzy logic operation control for PV-diesel-battery hybrid energy system. Open Renew. Energy J. 2009, 2, 70–78. [Google Scholar] [CrossRef]
- Shezan, A.; Khan, N.H.; Anowar, T.; Kabir, A. Fuzzy Logic Implementation with MATLAB for Solar-Wind-Battery-Diesel Hybrid Energy System. Imp. J. Interdiscip. Res. 2016, 2. Available online: https://www.researchgate.net/publication/299872519_Fuzzy_Logic_Implementation_with_MATLAB_for_Solar-Wind-Battery-Diesel_Hybrid_Energy_System (accessed on 21 May 2018).
- Nwabuokei, F.I.; Awili, C.P.N.; Ikuebebe, B.C. Design of A Stand-Alone Photovoltaic Power System: Case Study of A Residence in Ogwashi-Ukwu, Delta State. INT J. 2014, 7, 1–17. [Google Scholar]
- Shezan, S.; Lai, C.Y. Optimization of hybrid wind-diesel-battery energy system for remote areas of Malaysia. In Proceedings of the 2017 Australasian Universities Power Engineering Conference (AUPEC), Melbourne, Australia, 19–22 November 2017; pp. 1–6. [Google Scholar]
- Chowdhury, S.; Chowdhury, S.P.; Crossley, P. Microgrids and Active Distribution Networks; The Institution of Engineering and Technology: London, UK, 2009; Volume 1, pp. 20–37. [Google Scholar]
© 2018 by the authors. Licensee MDPI, Basel, Switzerland. This article is an open access article distributed under the terms and conditions of the Creative Commons Attribution (CC BY) license (http://creativecommons.org/licenses/by/4.0/).