The Optimization of Hybrid Power Systems with Renewable Energy and Hydrogen Generation


Department of Mechanical Engineering, National Taiwan University, Taipei 10617, Taiwan
*
Author to whom correspondence should be addressed.
Energies 2018, 11(8), 1948; https://doi.org/10.3390/en11081948
Submission received: 26 June 2018
/
Revised: 22 July 2018
/
Accepted: 23 July 2018
/
Published: 26 July 2018
(This article belongs to the Special Issue Short-Term Load Forecasting by Artificial Intelligent Technologies)
Abstract
:This paper discusses the optimization of hybrid power systems, which consist of solar cells, wind turbines, fuel cells, hydrogen electrolysis, chemical hydrogen generation, and batteries. Because hybrid power systems have multiple energy sources and utilize different types of storage, we first developed a general hybrid power model using the Matlab/SimPowerSystemTM, and then tuned model parameters based on the experimental results. This model was subsequently applied to predict the responses of four different hybrid power systems for three typical loads, without conducting individual experiments. Furthermore, cost and reliability indexes were defined to evaluate system performance and to derive optimal system layouts. Finally, the impacts of hydrogen costs on system optimization was discussed. In the future, the developed method could be applied to design customized hybrid power systems.
1. Introduction
The development of alternative energy, such as solar, wind, geothermal, hydropower, ocean power, and hydrogen, has attracted much research attention because of the energy crisis and environmental pollution problems. Among these, solar, wind, and hydrogen are promising alternative energies. Solar cells and wind turbines (WTs) convert solar irradiation and wind power, respectively, into electrical power. Hydrogen energy can be converted into electricity via an electrochemical reaction of fuel cells. Each type of energy source has various strengths and weaknesses. For example, solar and wind energy are pollution free and relatively cheap to produce but lack stability because of their dependence on weather conditions. In contrast, hydrogen energy with fuel cells guarantees stable power supplies but is expensive at present. Therefore, hybrid systems that utilize multiple energy sources and storage methods are the best option for reducing system costs and increasing system reliability. Previously, in an Iranian study, Maleki and Askarzadeh [1] designed a hybrid power system containing photovoltaic (PV) arrays, a WT, a diesel generator, and a secondary battery. They showed that systems consisting of a WT, diesel generator, and a secondary battery satisfied the load demand at the lowest cost. Based on an analysis of weather data in Turkey, Devrim and Bilir [2] concluded that wind energy could compensate for solar (PV) energy in winter. Therefore, a hybrid system with a WT can achieve better performance than one without a WT. Martinez-Lucas et al. [3] studied the performance of a system based on WTs and pump storage hydropower on El Hierro Island in the Canary archipelago. This hybrid wind–hydropower plant showed improvements in system performance to different wind speeds and power demands.
The most important issues when designing hybrid power systems are the selection of the system components and the component sizes, according to load demands. Wang and Chen [4] considered a hybrid system consisting of PV arrays, a proton-exchange membrane fuel cell (PEMFC), and an Lithium iron (Li-Fe) battery. They showed that the integration of the PEMFC improved system reliability, and that tuning the PV and battery units greatly reduced the system cost. The present paper extends these ideas and discusses the impacts of WTs and a hydrogen electrolyzer on system performance.
A WT converts wind power into electricity. Many factors, such as wind speed, air density, the rotor swept area, and the power coefficient of the motor, affect the amount of power extracted from WTs. For example, Bonfiglio et al. [5] modeled WTs equipped with direct-drive permanent magnet synchronous generators. They used the model to examine the influences of active power loss on the effectiveness of wind generator control and applied Digsilent Power Factory to verify the results. Pedra et al. [6] built fixed-speed induction generator models using PSpice and PSCAD-EMTDC codes They compared single-cage and double-cage models, and showed that the latter was more suitable for fixed-speed WT simulation. Lee et al. [7] assessed large-scale application of solar and wind power in 143 urban areas. The proposed system was shown to lead to a balance of the building energy consumption. Maouedja et al. [8] constructed a small hybrid system in Adrar, Algeria, and concluded that wind energy can compliment solar energy. Al Ghaithi et al. [9] analyzed a hybrid energy system in Masirah Island in Oman. The simulation results showed that a hybrid system composed of PV, a WT, and an existing diesel power system is the most economically viable, and can significantly improve voltage profiles. Devrim and Bilir [2] also found that a hybrid system with a WT can perform better than one without a WT in Ankara, Turkey. However, Chen and Wang [10] reached the opposite conclusion in their analysis of a green building in Miao-Li county of Taiwan equipped with a hybrid power system consisting of PV arrays, a WT, a PEMFC, a hydrogen electrolyzer, and battery sets. They found that wind and solar energy had similar profiles, and concluded that a WT was unsuitable because it increased the cost of the system but did not significantly compensate the renewable energy of the PV array. Therefore, the inclusion of WTs in a hybrid system should depend on local weather conditions.
Hydrogen electrolyzation is a new method of energy storage, where redundant energy is used to produce hydrogen that can then be utilized by PEMFCs to produce electricity when the power supply is insufficient. For example, Chennouf et al. [11] utilized solar energy to produce hydrogen in Algeria. They demonstrated that hydrogen conversion efficiency was best under low voltage and high temperature conditions. Tribioli et al. [12] analyzed an off-grid hybrid power system with two energy storage methods: a lead-acid battery and reversible operation of a PEMFC. They combined the system with a diesel engine and showed that the consumption of fossil fuels can be greatly reduced by integrating a suitable renewable power plant to match the loads. Cozzolino et al. [13] applied the model to analyze a particular case: the TUNeIT (Tunisia and Italy) Project. The simulation demonstrated an almost self-sustaining renewable power plant that consisted of 1 MW WT, 1.1 MW PV, a 72 kWh battery, a 300 kW fuel cell, a 300 kW diesel engine to cope with power demand at a cost of 0.522 €/kWh. Aouali et al. [14] built a PV array and hydrogen electrolyzer model based on dynamic equations. They conducted small-scale experiments and showed that the experimental responses fitted the model responses. Rahimi et al. [15] analyzed the economic benefits of utilizing wind energy in hydrogen electrolysis in Manjil and Binaloud, Iran. They showed that a stand-alone application was more expensive than an on-grid one because the former required larger WTs. Bianchi et al. [16] analyzed a hybrid system that utilized two storage methods: a solar battery system and a solar battery–hydrogen electrolyzer fuel cell system. They found that the conversion efficiency of stored energy was about 90% with the use of battery, and about 20% with the electrolyzer and PEMFC. Bocklisch et al. [17] proposed a multistorage hybrid system that combined short-term storage by batteries and long-term storage by hydrogen. They converted excessive PV energy in summer into hydrogen and hydrogen into electricity and heat in winter. The power exchanged with the public grid was smaller and more predictable compared with that of a conventional PV battery–hybrid system. As weather conditions have a major influence on the performance of hybrid power systems, climate data must be incorporated into the design of any hybrid system. For instance, Ikhsan et al. [18] collected weather data to estimate the energy flow into hybrid systems and to resize the system components. Their results demonstrated an improvement in system costs after size adjustment. Chen and Wang [10] included irradiation and wind data in a hybrid system model to optimize system costs and reliability. The present paper will also utilize historic weather data and load conditions when analyzing the impacts of system configurations.
The paper is arranged as follows: Section 2 introduces a general hybrid power system that consists of solar cells, WTs, a fuel cell, hydrogen electrolysis, chemical hydrogen generation, and batteries. We extend a previous hybrid power model [4] by adding WT and hydrogen electrozation modules. Then, system cost and reliability functions are defined to evaluate system performance. Based on this general hybrid power model, we apply three standard load conditions (laboratory, office, and house) to four specified hybrid power systems to estimate the impact of system configuration on performance. Section 3 discusses the optimization of the four hybrid power models and shows that both system cost and reliability can be improved by tuning the system component sizes. Based on the results, the solar battery system is preferable because of high hydrogen costs at present. We also predict the system costs at which hydrogen energy could become feasible. Last, conclusions are drawn in Section 4.
2. Results
This section builds a general hybrid power model that consists of a PV array, a WT, a PEMFC, hydrogen electrolysis, chemical hydrogen generation, and batteries. We applied a Matlab/SimPowerSystem (r2014a, MathWorks, Inc., Natick, MA, USA) model to predict the performance of four different hybrid power systems under three typical loads. Furthermore, cost and reliability indexes were defined to quantify performance measures of the hybrid systems.
2.1. Hybrid Power Systems
Figure 1a shows a general hybrid power system, which consists of a 3 kW PEMFC, a chemical hydrogen production system with sodium borohydride (NaBH4), a 410 W hydrogen electrolyzer, 1.32 kW PV arrays, a 0.2 kW WT, a 15 Ah Li-Fe battery set, and power electronic devices. The system specifications are illustrated in Table 1 [19,20,21,22,23,24,25]. The system has three energy sources (solar, wind, and a PEMFC) and two energy storage methods (battery and hydrogen electrolysis).
Regarding energy sources, solar power is connected directly to a DC bus. Wind power is transferred by a controller and connects to the DC bus. As both solar power and wind power are significantly influenced by the weather, a PEMFC is used to provide reliable energy when necessary. The PEMFC can transform hydrogen energy to electricity and can provide continuous power as long as the hydrogen supply is sufficient. Two hydrogen supply methods are considered: the chemical reaction of NaBH4 and hydrogen electrolysis. The former can provide power with high-energy density using an auto-batching system developed previously [25,26]; the latter can be regarded as energy storage, because redundant renewable energy can be stored in the form of hydrogen [24].
For energy storage, a Li-Fe battery is used for short-term electricity storage [17] because the battery has high efficiency (about 90%), and can absorb power surges when the load changes rapidly. Hydrogen electrolysis is used for long-term storage, considering the self-discharging problems of batteries. A benefit of the electrolysis process is that it does not produce contaminants. However, the energy conversion efficiency is much lower than of the battery [16].
We developed the general hybrid power model using the Matlab/SimPowerSystem, as shown in Figure 1b, and analyzed the impacts of different energy sources and storage methods on the system. In a previous study [4], a SimPowerSystem model was built to include a PEMFC, an Li-Fe battery set, PV arrays, and a chemical hydrogen production system. The model parameters were tuned based on experimental data to enable the simulation model to predict the responses/behavior of the experimental system under various conditions. Currently, PEMFC, PV arrays, chemical hydrogen production, and battery sets are operated as follows [4,17,25,26]:
- The PEMFC is switched on to provide a default current of 20 A with the highest energy efficiency [20] when the battery state-of-charge (SOC) is 30%. If the SOC continuously decreases to 25%, the PEMFC current output is increased by up to 50 A, according to load, until the SOC is 35%, where the PEMFC is set to provide a default current of 20 A. The PEMFC is switched off when the battery SOC is 40%.
- The chemical hydrogen generation is switched on when the pressure of the hydrogen storage tank decreases to 3 bar [25,26]. Currently, hydrogen is generated from a NaBH4 solution by a previously developed auto-batch process, with a maximum generation rate of 93.8 standard liters per min (SLPM) [25]. This can sustain the operation of a 3 kW PEMFC [25].
- The battery regulates the power supply and load demands as follows: it is charged (discharged) when the supply is greater (lower) than the demand. To avoid overcharging, battery charging is stopped when its SOC reaches 98%.
In this paper, we extend the previously developed model [4] by adding wind power and hydrogen electrolysis modules.
2.2. The Wind Power Model
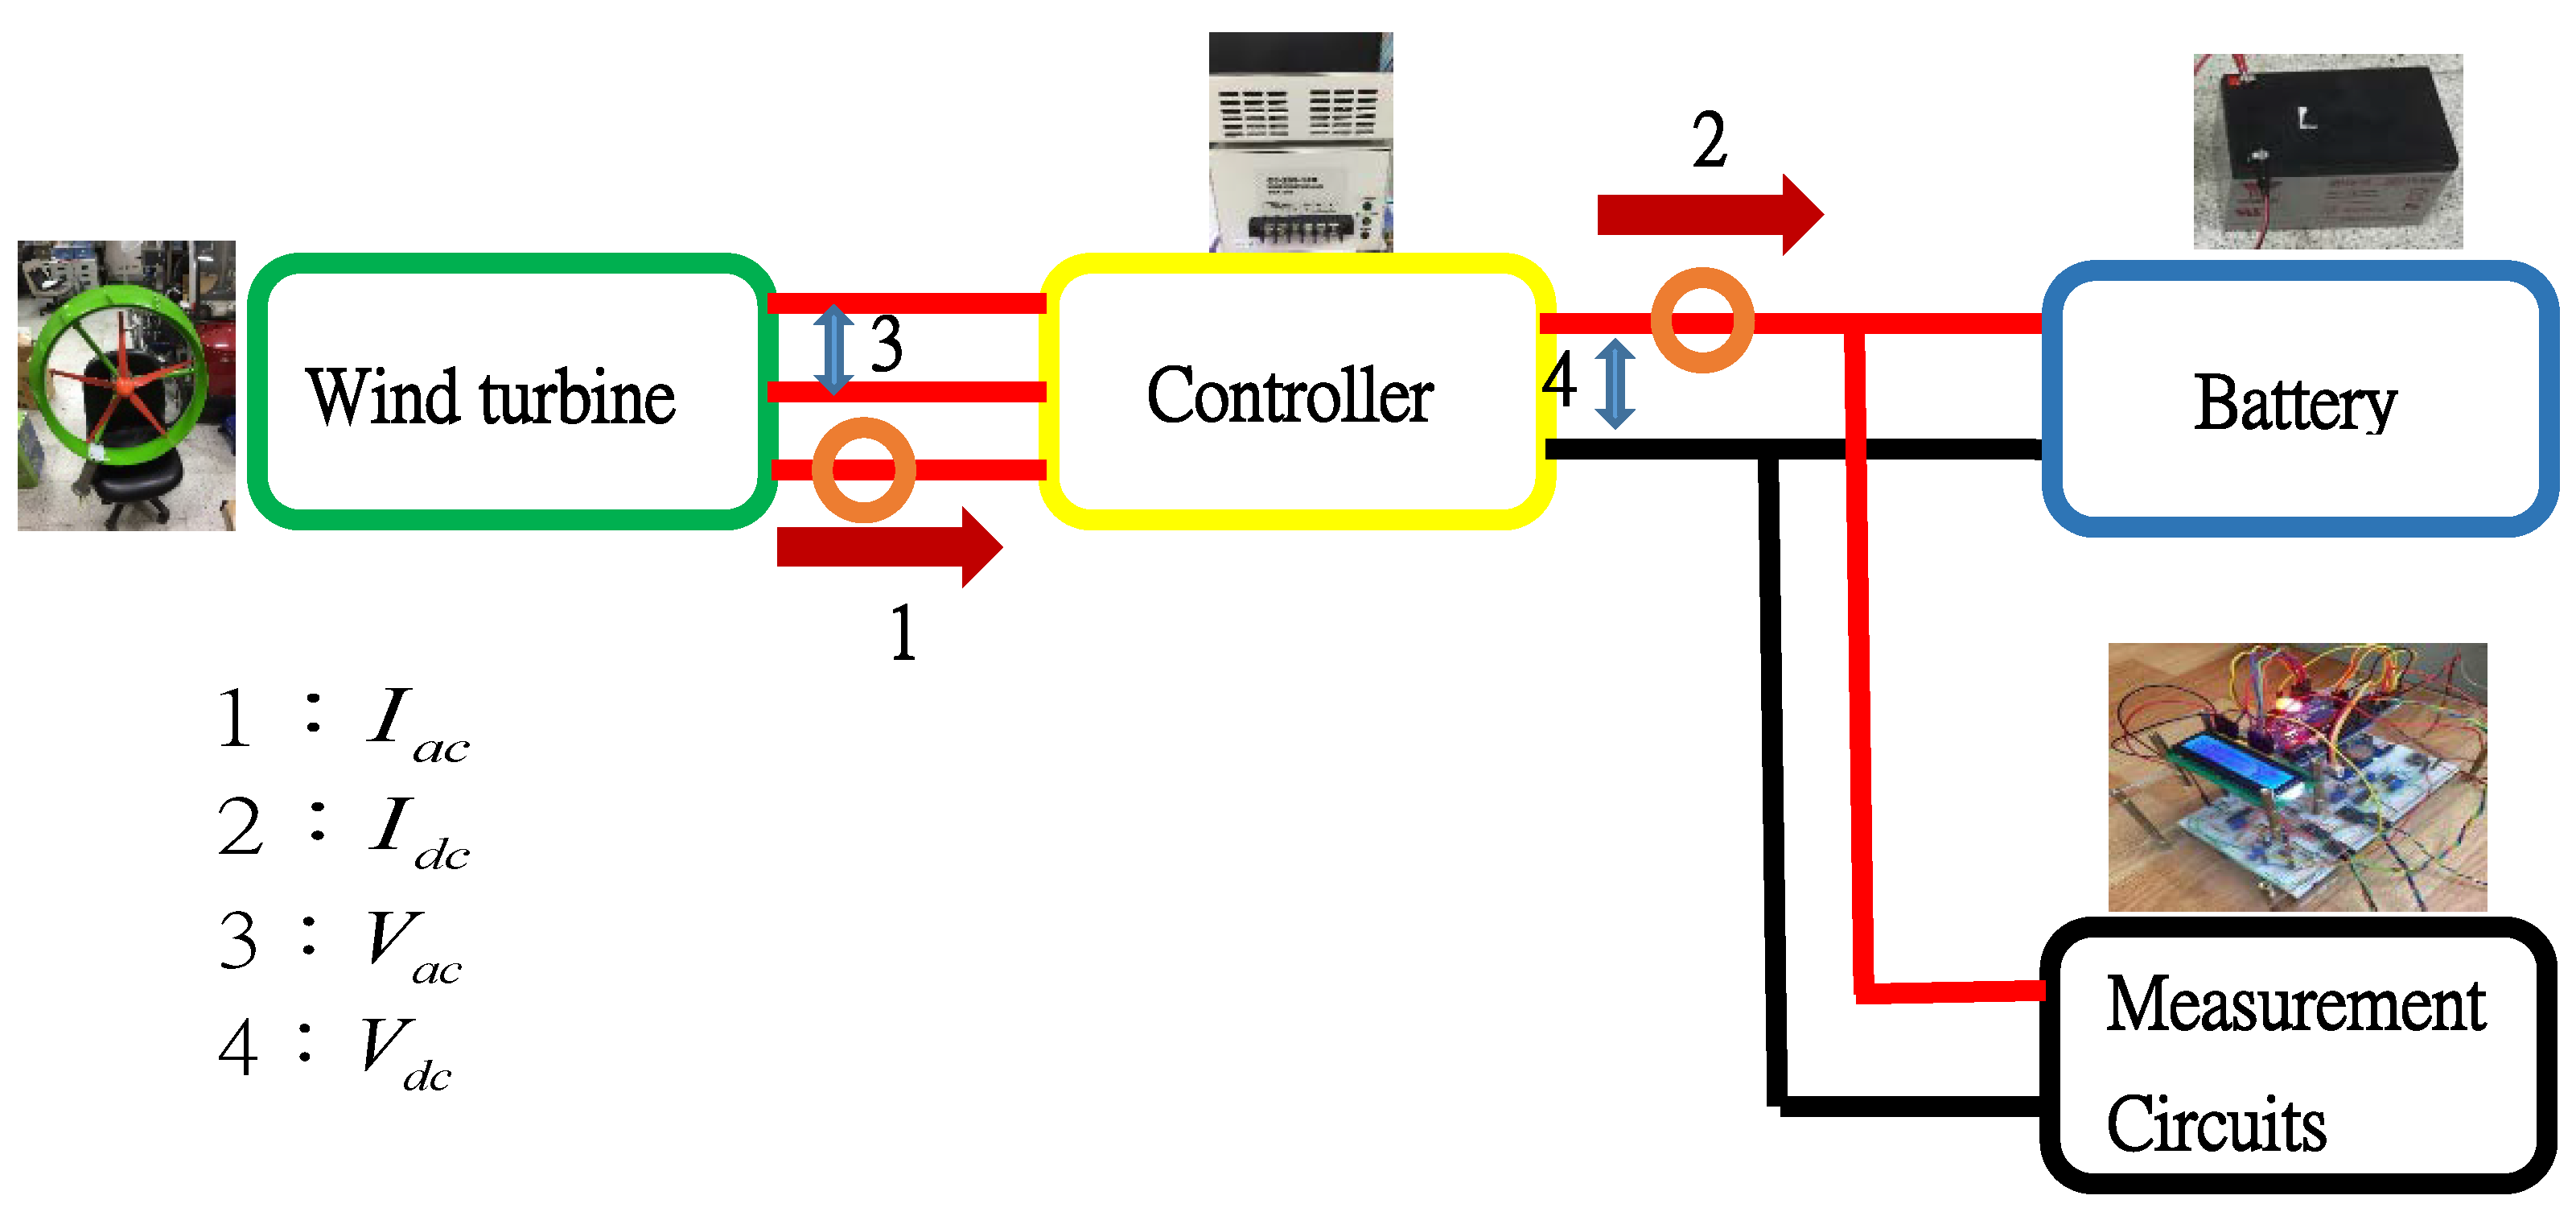
The WT used in this paper was a commercial product, JPS-200, which is equipped with a permanent magnet synchronous generator that has a rating power of 200 W [21]. A wind power system and a theoretical model are developed to estimate wind power from wind speed based on experimental responses. The experiments were conducted using an industrial fan, which had a maximum wind speed of about 10 m/s. The wind power system structure is shown in Figure 2. We measured the AC current and voltage from a wind turbine and recorded the DC current and voltage from a wind controller.
The WT was tested under steady wind and varying wind conditions. The time responses are shown in Figure 3a, where the responses change slowly with steady wind, but quickly with varying wind. From the comparison of the wind speed and AC power, as illustrated in Figure 3b, the wind power can be theoretically described using the following equation:
where represent the power and speed, respectively, of the wind. The experimental results show that the wind power can be predicted from the wind speed with maximum root mean square errors of 7.64 W and 17.32 W for steady and varying wind, respectively. The WT reached its maximum theoretical power of 200 W when the wind speed was greater than 12 m/s. We set the battery voltage at 12 V. The energy conversion relationship between AC and DC wind power is shown in Figure 3c, where the charging operation is divided into three zones according to the wind turbine voltage : (1) no charging (when ), where the wind controller does not charge the battery; (2) linear charging (when ), where the DC charging voltage increases linearly; and (3) stable charging (when ), where the DC charging voltage is 14.3 V. The conversion of AC and DC power can be described as follows:
as illustrated in Figure 3c. Therefore, given wind speed data, the wind turbine DC power can be calculated by (1) and (2). Equations (1) and (2) can be applied to build the wind power module in Figure 2 for the simulation and optimization analyses.
2.3. The Hydrogen Electrolysis Model
The hydrogen electrolyzer transfers redundant energy, i.e., the extra-renewable energy when the battery SOC is near 100%, into hydrogen when the power supply is greater than the load. The stored hydrogen is then converted into electricity by a PEMFC when the load demand exceeds the power supply. Therefore, a theoretical model can be built to estimate hydrogen production based on redundant renewable energy. A hydrogen electrolyzer utilizes this redundant energy to produce hydrogen. The hydrogen electrolyzation system is shown in Figure 4. It consists of a commercial hydrogen electrolyzer, HGL-1000U, with a rating energy consumption of 400 W and hydrogen production of 1 L/min [24]. The electrolyzer has four operation modes: warm up, production, standby, and shut down. We developed a hydrogen electrolysis model using the Matlab/SimPowerSystemTM and applied the following management strategies (see Figure 4b):
- Warm up: The extra-renewable energy is regarded as redundant energy when the battery SOC is greater than an upper limit of 95%.
- Production: The electrolyzer is switched on after 10 min, when the integrated redundant renewable energy increases. represent the power sources from the renewable energy and power consumption of the loads, respectively.
- Standby: The electrolyzer is switched off when the hydrogen tank is full (reaches the high-pressure limit).
- Shut down: The hydrogen electrolyzer is switched off when the battery SOC falls to the lower limit of 85%.
To avoid frequent switching, the electrolyzer is allowed to produce hydrogen when the battery SOC is between 85% and 95%.
A 3 L hydrogen cylinder was used to conduct the electrolyzation experiments. The results are shown in Figure 5, where the initial and final pressures of the cylinder are 8.6 bar and 10 bar, respectively. As a check valve is installed at the hydrogen outlet, hydrogen is produced only when the electrolyzer pressure exceeds the cylinder pressure, with a production rate of about 1.14 SLPM by consuming about 413 W. The hydrogen is purged every 350 s to prevent water flooding that could disturb the electrochemical reactions. The output hydrogen energy can be calculated using the following equation:
The total enthalpy change of a reaction at 1 atm, 25 °C, referred to as the standard state, is the low heat value of hydrogen, which is equivalent to (or ). Therefore, the hydrogen production efficiency can be defined as follows:
where and represent the ratio of input electric energy and the output hydrogen energy, respectively, and is the produced hydrogen. For example, in one experiment, the input electric energy was = 0.0372 kWh, and the output hydrogen volume was = 6.233 L. The standard molecular weight and density of hydrogen was 2.0158 g/mole and 0.08228 g/L, respectively. Therefore, the output hydrogen energy can be calculated as follows:
Hence, the hydrogen production efficiency was:
The hydrogen production efficiencies in all the experiments were about 45%. Based on the experimental results, the hydrogen production rate was set as follows to convert renewable energy to hydrogen storage:
As the electrolyzer consumes an average power of 410 W during the production period, the hydrogen electrolyzer module was set to produce hydrogen at a rate of 1.14 L/min by consuming redundant renewable energy at a constant power of 410 W.
2.4. Performance Indexes Hybrid Power Models
The hybrid power model of Figure 1 was applied to predict the system responses under different operation conditions based on the following management strategies (see Figure 6):
- To avoid wasting renewable energy, the wind and solar power subsystems are operated as follows: when the battery SOC is greater than 98% and the input renewable power, including solar and wind power, is greater than the load, redundant renewable energy is dumped. Solar energy is reduced first because it is much more abundant than wind energy. When the battery SOC is less than 95%, all renewable energy is supplied to the system.
- The PEMFC system is switched on when the battery SOC reaches a low bound of 30%. The PEMFC is then switched off when the battery SOC rises to a high limit of 40%. The PEMFC is controlled to provide a default current load of 20 A with the highest energy efficiency, and it is set to provide a load up to 50 A when the battery SOC continuously drops to 25% [20].
- The chemical hydrogen generator system is switched on if the storage hydrogen level is lower than a safety limit [25,26]. We designed a batch procedure with suitable production rates to satisfy the system requirements. Each batch consumes 60 g of NaBH4 and produces about 150 L of hydrogen [25]. Thus, the PEMFC can be continuously operated.
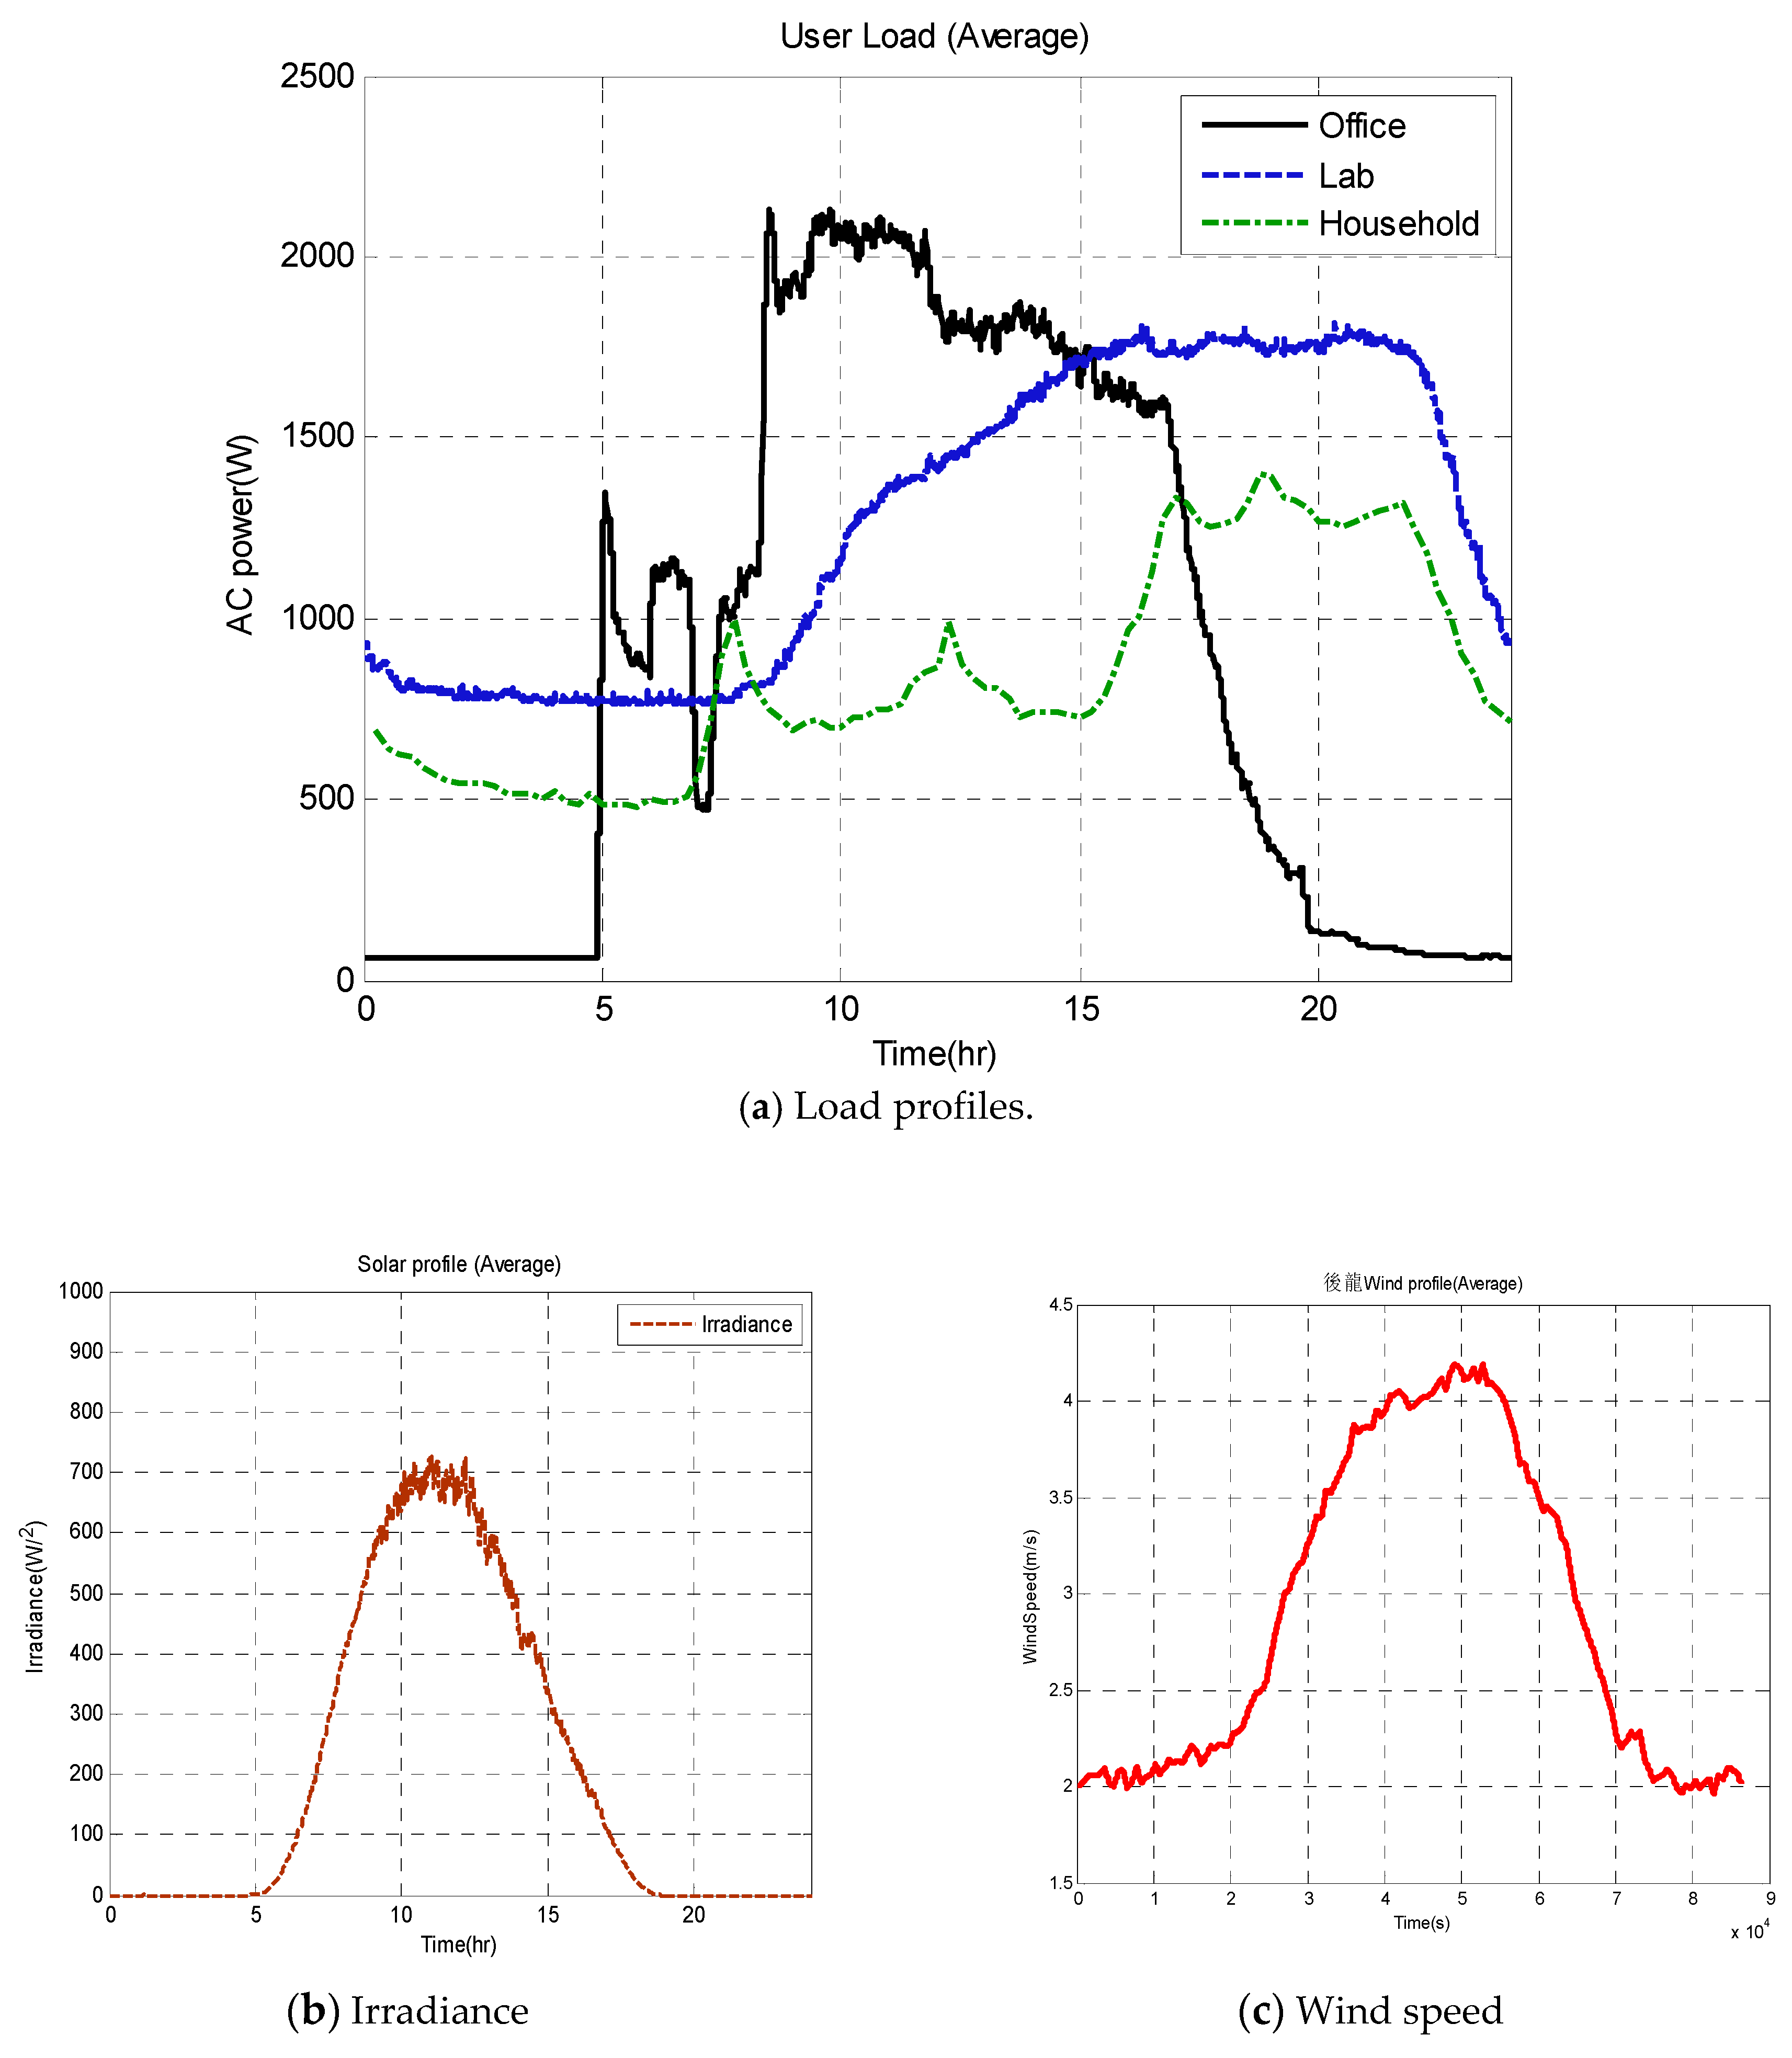
Hydrogen fuel can be obtained from two sources for PEMFC operation: chemical production and electrolysis. As the costs of different energy sources and storage are not the same, we utilized standard load profiles, irradiance, and wind data, as shown in Figure 7, for the simulation and optimization analyses.
The system responses can be applied to evaluate the system cost and reliability under different conditions.
The system cost was defined as follows [4]:
where and were the initial and operation costs, respectively, of the hybrid power system. In Equation (5), b, s, and w represent the numbers of the battery, PV array, and WT in units of 30 Ah, 660 W, and 200 W, respectively. For example, (b, s, w) = (1, 2, 3) means that the system was equipped with one 30 Ah battery set, two 660 W PV arrays, and three 200 W WTs.
The initial cost consists of several system components, as follows:
where k = PEMFC, DC, solar, WT, HE, CHG, and batt for the PEMFC, power electric devices, PV arrays, wind turbine, hydrogen electrolyzer, chemical hydrogen generator, and battery set, respectively. Similarly, the operation cost includes two parts:
where l = NaBH4, WT, and solar for chemical hydrogen, WT maintenance, and PV maintenance, respectively.
The costs and can be calculated by the following equations:
in which is the component price per unit, and is the component units. CRF represents the capital recovery factor and is defined as follows [10]:
where is the inflation rate, and is the component life. The component life and cost are listed in Table 2. The inflation rate was set as 1.26% by referring to the average annual change of consumer price index of Taiwan [4].
The system reliability is defined as the loss of power supply probability (LPSP), as follows [4]:
in which the numerator is the total loss of power supply during time interval T, and the denominator represents the required load demand during time interval T. The system is more reliable with a smaller LPSP.
2.5. Optimization of Four Hybrid Power Models
Based on the general hybrid power model, as shown in Figure 1, we considered the following four hybrid power systems with different combinations of energy sources and storage:
- Solar_Wind (SW) system: The system contains two energy sources (a solar panel and WT) and one energy storage method (Li-Fe battery).
- Solar_Wind_PEM_HE (SWPH) system: The system contains three energy sources (a solar panel, WT, and PEMFC) and two energy storage methods (a Li-Fe battery and a hydrogen electrolyzer).
- Solar_Wind_PEM_CHG (SWPC) system: The system contains three energy sources (a solar panel, WT, and PEMFC) with a chemical hydrogen generator and one energy storage methods (an Li-Fe battery).
- Solar_Wind_PEM_HE_CHG (SWPHC) system: The system contains three energy sources (a solar panel, WT, and PEMFC) with a chemical hydrogen generator and two energy storage methods (an Li-Fe battery and a hydrogen electrolyzer).
The corresponding SimPowerSystem models are illustrated in Figure 8.
Three standard load conditions, as shown in Figure 7a, were applied to the four hybrid power models to predict systems responses. Then, we used Equations (5)–(11) to evaluate system cost and reliability using different component sizes. The resulting reference plots are shown in Figure 9, where the number of WTs was set to zero, because using a WT tended to increase the system costs. The optimal system costs of the four hybrid power systems are illustrated in Table 3.
3. Discussion
The analyses of the four hybrid power systems showed that system cost and reliability can be greatly improved by optimizing system sizes. For example, Figure 10 shows the reference plot of applying the SWPHC model to the laboratory load. If we use 10 units of battery (300 Ah), 10 units of solar (6.6 kW), and no WT, the system cost is estimated as NT$3208/day (or NT$106.17/kWh) with a possible power cut (LPSP = 0.33%). Based on Figure 10, the optimal system setting should be 61 units of battery (1830 Ah), 18 units of solar (11.88 kW), and no WT. Using these settings, the system cost is reduced to NT$1,685/day (or NT$55.6/kWh), and system reliability is improved to 100% (LPSP = 0).
The comparison of the four different hybrid power configurations shows that currently the SW system can achieve the cheapest system cost. For example, the daily cost for the office load is NT$865 using the SW system, but NT$963, 1,148, and 1,241 using the SWPC, SWPH, and SWPCH systems, respectively. However, the reliability (LPSP = 0) of the three systems is greater than the SW system (see Figure 9) (i.e., the reliability of the systems improved because the PEMFC can provide reliable energy when necessary). Under current conditions, the cost ranking is SW > SWPC > SWPH > SWPCH for all loads for the following reasons: (1) The cost of hydrogen is high at present; (2) energy storage efficiency by hydrogen electrolyzation is much lower than by Li-Fe batteries; (3) the extra hardware, such as the PEMFC and hydrogen electrolyzer, significantly increase systems costs.
The cost and energy distribution of applying the optimal SWPCH system to the laboratory load are shown in Table 4. First, due to system optimization, the PEMFC and Sodium borohydride tends not to be used, because the fuel cost is high (NT$28 per batch to produce 150 L of H2, see Table 2). Therefore, the corresponding equipment (hydrogen electrolyzer, PEMFC, and chemical hydrogen production) can be saved to reduce the system cost by 13.39%. Second, the battery cost accounts for nearly 73% of the total system costs, whereas the PV panels to store the solar power constitute only 11.21% of the system cost. Thus, system optimization tends to use solar energy, although the system is equipped with three energy sources. Third, the system stores 4.62% energy as hydrogen; this was not used to produce electricity during the 61-day analyses because batteries are better for short-term storage. We further compare the cost and energy distribution of the twelve cases (four systems for three load conditions). For all four systems, the office load reaches the highest solar cost but the lowest battery cost, because the working hours are similar to the irradiation curve (see Figure 7). Contrarily, the lab load reaches the highest battery cost for the same reason (the working hours are different from the irradiation curve), so more batteries needs to be used for energy storage.
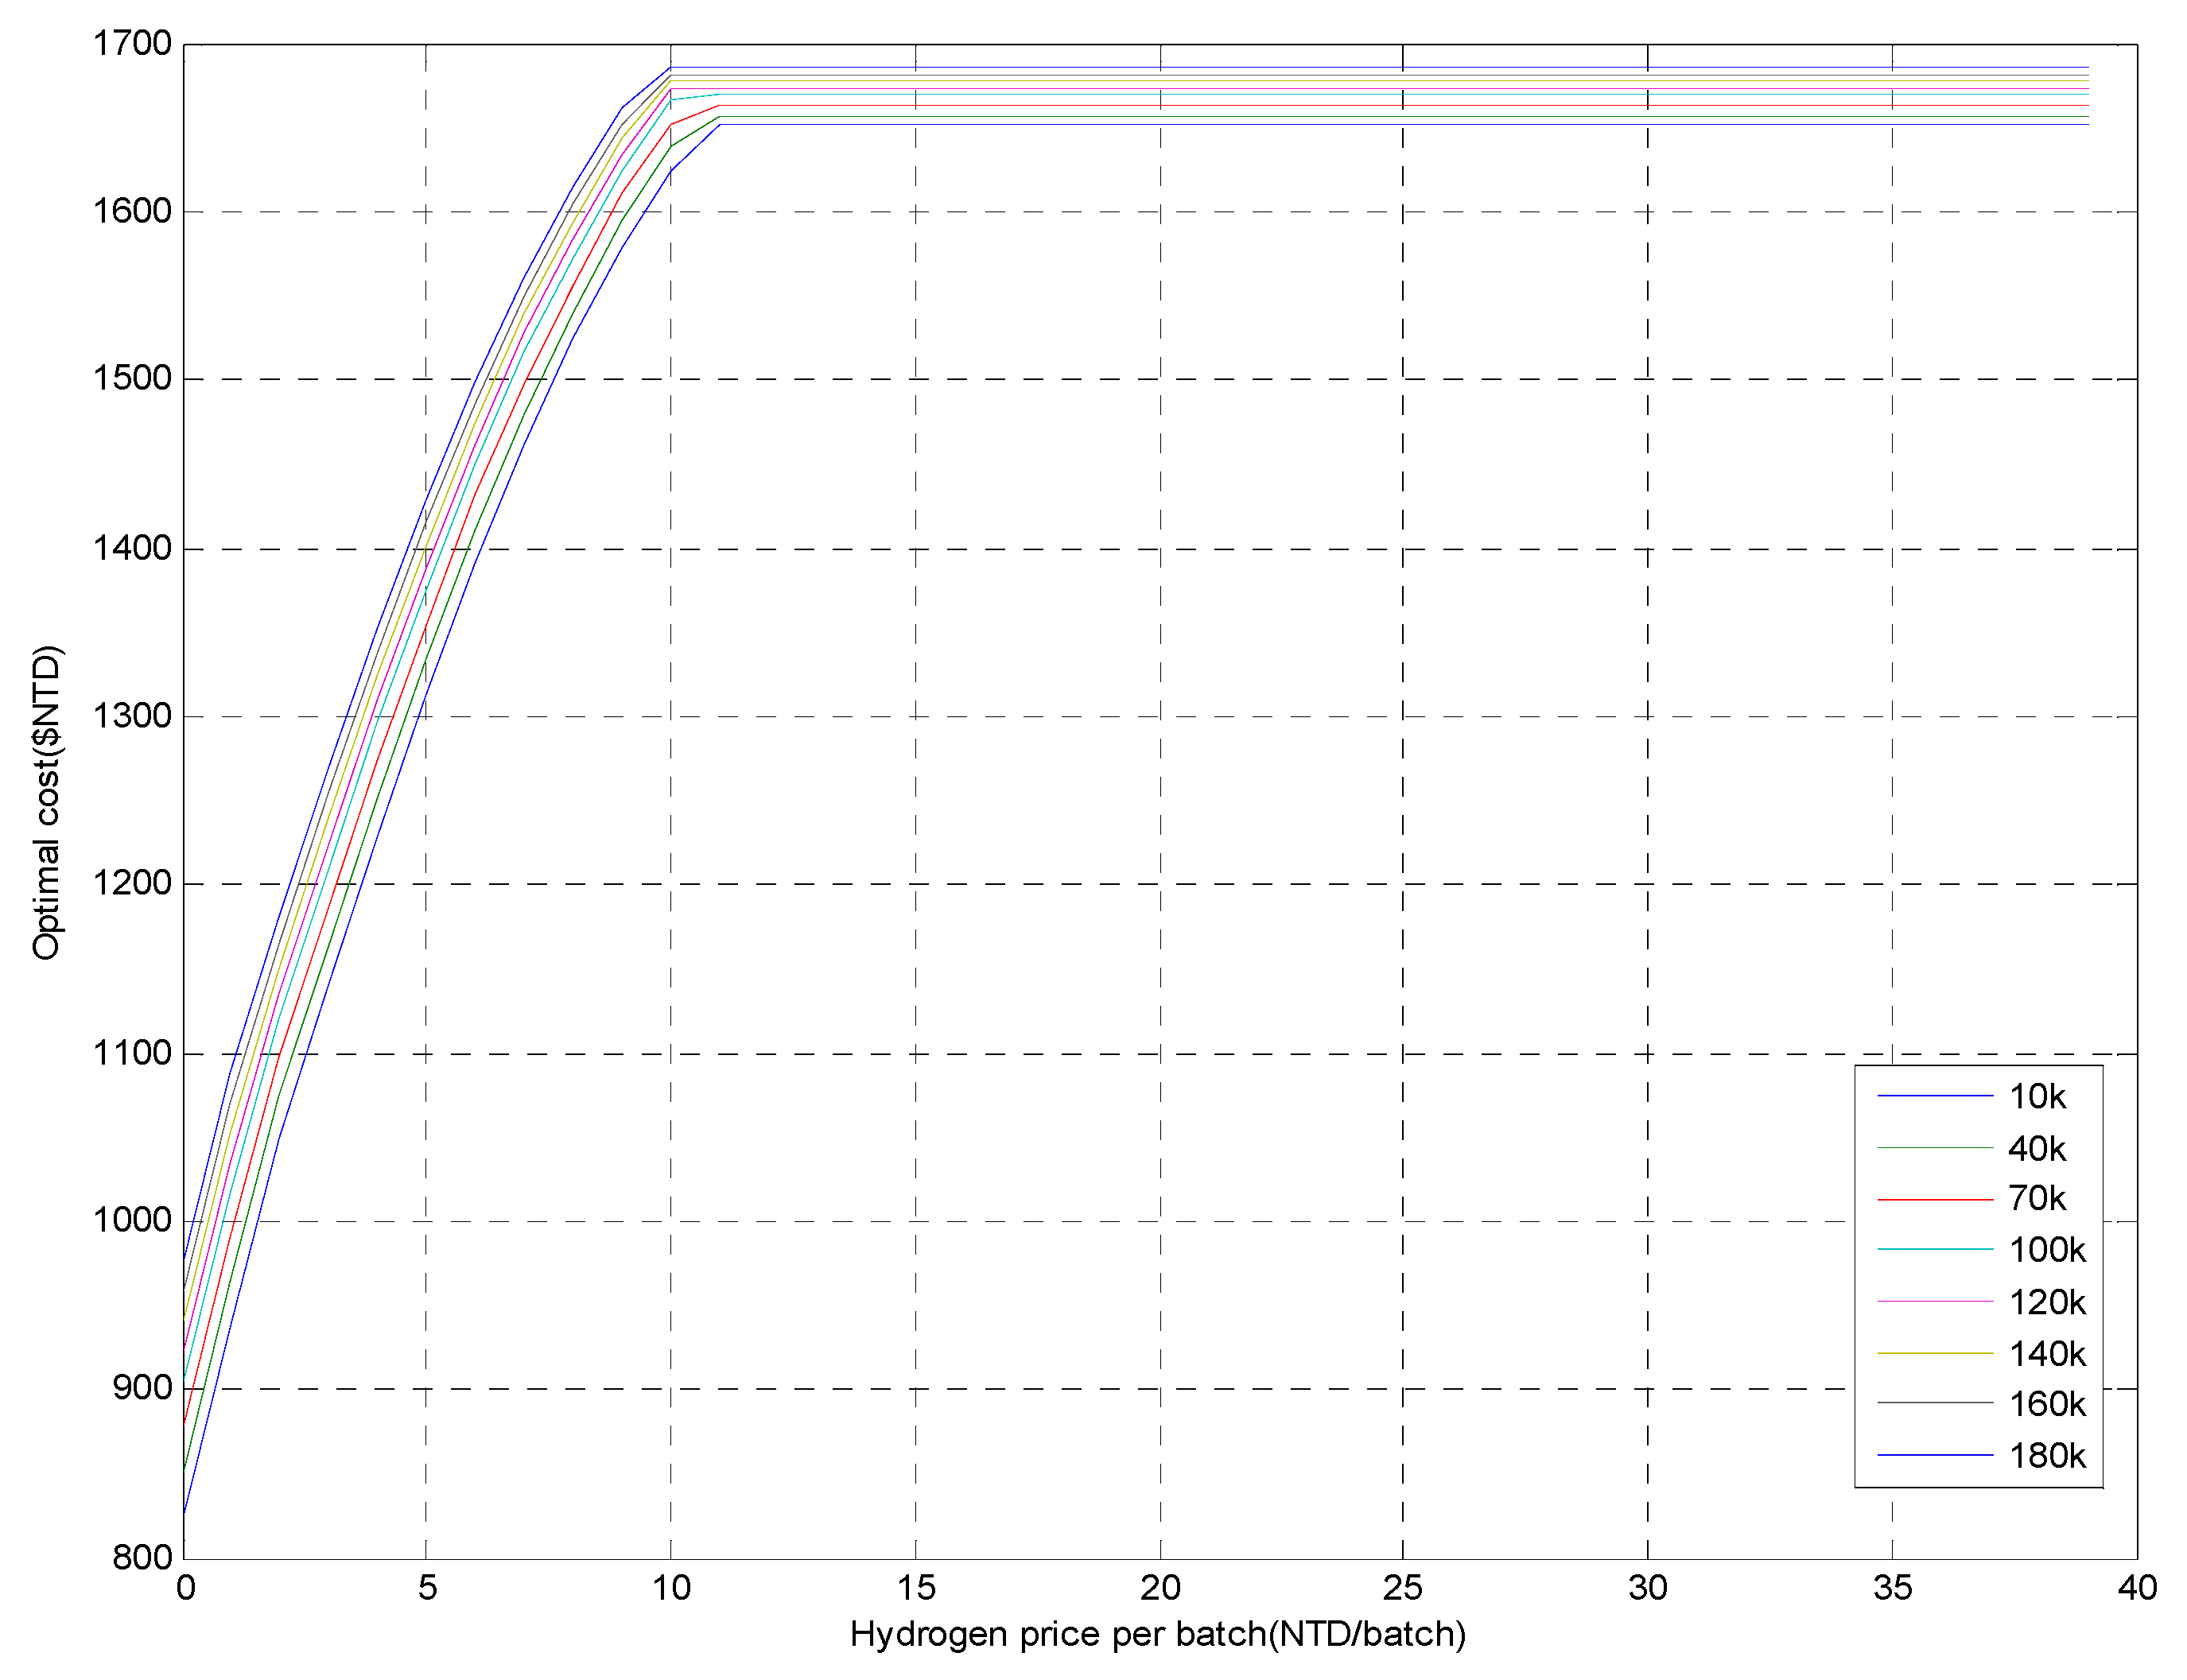
The optimization of the hybrid systems demonstrates a preference for using the solar battery system because of the high cost of hydrogen production. Therefore, we investigated the impacts of hydrogen prices on the total system costs. Figure 11 shows the results of applying the SWPCH system to the laboratory load. First, the system costs begin to decrease when the hydrogen cost falls to about NT$10 per batch (60 g of NaBH4 to produce about 150 L of hydrogen). When the cost of hydrogen declines from NT$28 to NT$9 (NT$1) per batch, the system cost drops from NT$1685 to NT$1662 (NT$1088) per day. Second, the energy supply ratio by the PEMFC increases to 19.6% (59.5%) when the hydrogen price is NT$9 or NT$1 per batch. Under this scenario, the system tends to use more hydrogen energy, as the cost is competitive with that of other renewable energies. Last, the stack price has little influence on the system cost because it is considered in the initial cost (from 10 k to 180 k). For example, when the hydrogen price is greater than NT$11/batch and the PEMFC stack cost drops from NT$180 k to NT$90 k, the system cost drops from NT$1685 to NT$1667 per day. When the hydrogen cost is NT$9 (NT$1) per batch and the PEMFC stack price drops from NT$180 k to NT$90 k, the system cost drops from NT$1662 (NT$1088) to NT$1615 (NT$999) per day.
4. Conclusions
This paper demonstrated the optimization of hybrid power systems. We developed a general hybrid power model that consisted of solar cells, a WT, a fuel cell, hydrogen electrolysis, chemical hydrogen generation, and batteries. The model parameters are tuned based on experimental data, so that system responses under different operation conditions can be predicted without conducting individual experiments. Then, the performance of four hybrid systems under three typical loads was evaluated by calculating system costs and reliability. The results showed that the costs and reliability of all the systems were effectively improved by optimizing the system sizes. The hybrid system with the solar panels and battery sets achieved the lowest costs, as wind and hydrogen energy are relatively expensive at present. Last, the impacts of stack and hydrogen prices on system costs was analyzed. The results indicated that hydrogen prices had a more substantial influence than the stack price on system costs, and that hydrogen energy would be competitive when its price fell to about one-third of the current price. In future research, the impact of cost of other components, such as the PV and WT, can be analyzed in a similar way.
Author Contributions
Conceptualization, F.-C.W.; Methodology, F.-C.W. and Y.-S.H.; Software, Y.-S.H.; Validation, F.-C.W., Y.-S.H. and Y.-Z.Y.; Formal Analysis, F.-C.W. and Y.-S.H.; Investigation, F.-C.W. and Y.-S.H.; Resources, F.-C.W. and Y.-S.H.; Data Curation, F.-C.W., Y.-S.H., and Y.-Z.Y.; Writing-Original Draft Preparation, Y.-S.H.; Writing-Review and Editing, F.-C.W.; Visualization, F.-C.W., Y.-S.H., Y.-Z.Y.; Supervision, F.-C.W.; Project Administration, F.-C.W.; Funding Acquisition, F.-C.W.
Funding
This research was funded by the Ministry of Science and Technology, R.O.C., in Taiwan under Grands MOST 105-2622-E-002-029 -CC3, MOST 106-2622-E-002-028 -CC3, and MOST 106-2221-E-002-165-. This research was also supported in part by the Ministry of Science and Technology of Taiwan (MOST 107-2634-F-002-018), National Taiwan University, Center for Artificial Intelligence & Advanced Robotics. The authors would like to thank M-FieldTM for their collaboration and technical supports.
Acknowledgments
This work was financially supported in part by the Ministry of Science and Technology, R.O.C., in Taiwan under Grands MOST 104-2622-E-002-023 -CC3, MOST 104-2221-E-002-086-, and MOST 105-2622-E-002-029 -CC3. The authors would like to thank M-FieldTM for their collaboration and technical supports.
Conflicts of Interest
The authors declare no conflict of interest.
References
- Maleki, A.; Askarzadeh, A. Optimal sizing of a PV/wind/diesel system with battery storage for electrification to an off-grid remote region: A case study of Rafsanjan, Iran. Sustain. Energy Technol. Assess. 2014, 7, 147–153. [Google Scholar] [CrossRef]
- Devrim, Y.; Bilir, L. Performance investigation of a wind turbine–solar photovoltaic panels–fuel cell hybrid system installed at İncek region–Ankara, Turkey. Energy Convers. Manag. 2016, 126, 759–766. [Google Scholar] [CrossRef]
- Martinez-Lucas, G.; Sarasua, J.I.; Sanchez-Fernandez, J.A. Frequency Regulation of a Hybrid Wind-Hydro Power Plant in an Isolated Power System. Energies 2018, 11, 239. [Google Scholar] [CrossRef]
- Wang, F.C.; Chen, H.C. The development and optimization of customized hybrid power systems. Int. J. Hydrogen Energy 2016, 41, 12261–12272. [Google Scholar] [CrossRef]
- Bonfiglio, A.; Delfino, F.; Invernizzi, M.; Procopio, R. Modeling and Maximum Power Point Tracking Control of Wind Generating Units Equipped with Permanent Magnet Synchronous Generators in Presence of Losses. Energies 2017, 10, 102. [Google Scholar] [CrossRef]
- Pedra, J.; Corcoles, F.; Monjo, L.; Bogarra, S.; Rolan, A. On Fixed-Speed WT Generator Modeling for Rotor Speed Stability Studies. IEEE Trans. Power Syst. 2012, 27, 397–406. [Google Scholar] [CrossRef]
- Lee, J.; Park, J.; Jung, H.J.; Park, J. Renewable Energy Potential by the Application of a Building Integrated Photovoltaic and Wind Turbine System in Global Urban Areas. Energies 2017, 10, 2158. [Google Scholar] [CrossRef]
- Maouedja, R.; Mammeri, A.; Draou, M.D.; Benyoucef, B. Performance evaluation of hybrid Photovoltaic-Wind power systems. Energy Procedia 2014, 50, 797–807. [Google Scholar] [CrossRef]
- Al Ghaithi, H.M.; Fotis, G.P.; Vita, V. Techno-economic assessment of hybrid energy off-grid system—A case study for Masirah island in Oman. Int. J. Power Energy Res. 2017, 1, 103–116. [Google Scholar] [CrossRef]
- Chen, P.J.; Wang, F.C. Design optimization for the hybrid power system of a green building. Int. J. Hydrogen Energy 2018, 43, 2381–2393. [Google Scholar] [CrossRef]
- Chennouf, N.; Settou, N.; Negrou, B.; Bouziane, K.; Dokkar, B. Experimental Study of Solar Hydrogen Production Performance by Water Electrolysis in the South of Algeria. Energy Procedia 2012, 18, 1280–1288. [Google Scholar] [CrossRef]
- Tribioli, L.; Cozzolino, R.; Evangelisti, L.; Bella, G. Energy management of an off-grid hybrid power plant with multiple energy storage systems. Energies 2016, 9, 661. [Google Scholar] [CrossRef]
- Cozzolino, R.; Tribioli, L.; Bella, G. Power management of a hybrid renewable system for artificial islands: A case study. Energy 2016, 106, 774–789. [Google Scholar] [CrossRef]
- Aouali, F.Z.; Becherif, M.; Tabanjat, A.; Emziane, M.; Mohammedi, K.; Krehi, S.; Khellaf, A. Modelling and experimental analysis of a PEM electrolyser powered by a solar photovoltaic panel. Energy Procedia 2014, 62, 714–722. [Google Scholar] [CrossRef]
- Rahimi, S.; Meratizaman, M.; Monadizadeh, S.; Amidpour, M. Techno-economic analysis of wind turbine–pem (polymer electrolyte membrane) fuel cell hybrid system in standalone area. Energy 2014, 67, 381–396. [Google Scholar] [CrossRef]
- Bianchi, M.; Branchini, L.; De Pascale, A.; Melino, F. Storage solutions for renewable production in household sector. Energy Procedia 2014, 61, 242–245. [Google Scholar] [CrossRef]
- Bocklisch, T.; Böttiger, M.; Paulitschke, M. Multi-storage hybrid system approach and experimental investigations. Energy Procedia 2014, 46, 186–193. [Google Scholar] [CrossRef]
- Ikhsan, M.; Purwadi, A.; Hariyanto, N.; Heryana, N.; Haroen, Y. Study of renewable energy sources capacity and loading using data logger for sizing of solar-wind hybrid power system. Procedia Technol. 2013, 11, 1048–1053. [Google Scholar] [CrossRef]
- Wang, F.C.; Kuo, P.C. Control design and power management of a stationary PEMFC hybrid power system. Int. J. Hydrogen Energy 2013, 38, 5845–5856. [Google Scholar] [CrossRef]
- Guo, Y.F.; Chen, H.C.; Wang, F.C. The development of a hybrid PEMFC power system. Int. J. Hydrogen Energy 2015, 40, 4630–4640. [Google Scholar] [CrossRef]
- Jetpro Technology, INC. Available online: http://www.jetprotech.com.tw/products/jps200.htm (accessed on 25 June 2018).
- A123 System. Available online: http://www.a123systems.com (accessed on 25 June 2018).
- M-Field Energy Ltd.: Power Converter. Available online: http://www.m-field.com.tw/product_converter.php (accessed on 25 June 2018).
- M-Field Energy Ltd.: Hydrogen Generator. Available online: http://www.general-optics.com/fuelcells/Fu_pdfs/English/HGL3610_EN.pdf (accessed on 25 June 2018).
- Li, S.C.; Wang, F.C. The development of a sodium borohydride hydrogen generation system for proton exchange membrane fuel cell. Int. J. Hydrogen Energy 2016, 41, 3038–3051. [Google Scholar] [CrossRef]
- Wang, F.C.; Fang, W.H. The Development of a PEMFC Hybrid Power Electric Vehicle with Automatic Sodium Borohydride Hydrogen Generation. Int. J. Hydrogen Energy 2017, 42, 10376–10389. [Google Scholar] [CrossRef]
Figure 1.
The general hybrid power system.


Figure 2.
Measurement of the wind power.

Figure 3.
Experimental responses of the wind turbine.

Figure 4.
The hydrogen electrolyzation system.

Figure 5.
Experimental responses of the hydrogen electrolysis system.

Figure 6.
Flow charts of the power management.

Figure 7.
Daily average data.

Figure 8.
The four hybrid power models.

Figure 9.
Reference plots of four hybrid power models.

Figure 10.
The reference plot of applying SWPHC to lab load.

Figure 11.
The influence of hydrogen prices on system costs.


| Component | Type | Specification |
|---|---|---|
| PEMFC Module | M-FieldTM LPH8020 | See Reference [19] |
| Solar Module [20] | ASEC-220G6S | Maximum Power: 220 W Open Circuit Voltage: 33.86 V Short Circuit Current: 8.61 A |
| Wind Turbine [21] | JPS-200 | Rated Power: 200 W Voltage Output: DC 12 V Rotor Diameter: 0.68 m |
| LiFePO4 Battery [22] | NA | Nominal Voltage: 52.8 V Nominal Capacity: 23 Ah |
| DC/DC Converter [23] | M-FieldTM S/N:00051 | Input Voltage: DC 44–85 V Output Voltage: DC 42–57 V Maximum Power: 3 kW |
| DC/AC Inverter [20] | MWTM TS-3000-148 | Input Voltage: DC 42–60 V Output Voltage: AC 110 V Maximum Power: 4.5 kW |
| PEM Electrolyzer [24] | HGL-1000U | Gas Flow Rate: 1000 mL/min Power Consumption: <430 W Input Voltage: AC 100–240 V |
| Chemical Hydrogen Generation Module [25] | NA | Input Voltage: DC 24V Output: See Reference [25] |
Table 2.
Simulation parameters.
| Component | Lifetime | Price ($NT) |
|---|---|---|
| Hybrid system | 15 (year) | NA |
| Fuel cell (3 kW) | 8000 (h) | 180,000 |
| Power electronic devices (3 kW) | 15 (year) | 50,000 |
| PV array (0.66 kW) | 15 (year) | 45,840 |
| Wind turbine (0.2 kW) | 15 (year) | 19,333 |
| Hydrogen electrolyzer (410 W) | 8000 (h) | 320,000 |
| Chemical hydrogen generator | 10 (year) | 320,000 |
| NaBH4 (60 g/Batch, 150 L ) | NA | 28 |
Table 3.
Optimal system costs.
| Daily Energy Consumption (kWh) | Lab | Office | House |
|---|---|---|---|
| 30.318 | 21.885 | 19.933 | |
| System Cost Per Day | - | - | - |
| SW | 1399 | 865 | 1064 |
| SWPH | 1591 | 1148 | 1246 |
| SWPC | 1529 | 963 | 1194 |
| SWPHC | 1685 | 1241 | 1340 |
| System Cost Per kWh | - | - | - |
| SW | 46.144 | 39.525 | 53.379 |
| SWPH | 52.477 | 52.456 | 62.509 |
| SWPC | 50.432 | 44.003 | 59.901 |
| SWPHC | 55.578 | 56.706 | 67.225 |
Table 4.
The distribution of cost, energy sources, and loads.
| SWPCH System to the Lab Load with (b, s, w) = (61, 18, 0) | |
|---|---|
| 1. Cost Distribution (%) | |
| Li-Fe Battery | 72.98% ($1229) |
| power electric devices | 2.39% ($40) |
| WT | 0% ($0) |
| Solar panels | 9.87% ($166) |
| WT maintenance | 0% ($0) |
| Solar maintenance | 1.34% ($22) |
| Hydrogen electrolyzer | 5.68% ($95) |
| PEMFC | 2.15% ($36) |
| Chemical hydrogen production | 5.56% ($93) |
| Sodium borohydride (NaBH4) | 0% ($0) |
| 2. Energy Supply Distribution (%) | |
| Wind | 0% |
| PEMFC | 0% |
| Solar | 99.32% |
| battery | 0.679% |
| 3. Load Distribution (%) | |
| Lab load | 95.38% |
| Hydrogen electrolyzer | 4.62% |
© 2018 by the authors. Licensee MDPI, Basel, Switzerland. This article is an open access article distributed under the terms and conditions of the Creative Commons Attribution (CC BY) license (http://creativecommons.org/licenses/by/4.0/).
Share and Cite
MDPI and ACS Style
Wang, F.-C.; Hsiao, Y.-S.; Yang, Y.-Z. The Optimization of Hybrid Power Systems with Renewable Energy and Hydrogen Generation. Energies 2018, 11, 1948. https://doi.org/10.3390/en11081948
AMA Style
Wang F-C, Hsiao Y-S, Yang Y-Z. The Optimization of Hybrid Power Systems with Renewable Energy and Hydrogen Generation. Energies. 2018; 11(8):1948. https://doi.org/10.3390/en11081948
Chicago/Turabian StyleWang, Fu-Cheng, Yi-Shao Hsiao, and Yi-Zhe Yang. 2018. "The Optimization of Hybrid Power Systems with Renewable Energy and Hydrogen Generation" Energies 11, no. 8: 1948. https://doi.org/10.3390/en11081948
Note that from the first issue of 2016, this journal uses article numbers instead of page numbers. See further details here.