Real-World Fuel Consumption, Fuel Cost and Exhaust Emissions of Different Bus Powertrain Technologies

1
Faculty of Mechanical Engineering, University of Ljubljana, Aškerčeva 6, SI-1000 Ljubljana, Slovenia
2
Department for Inorganic Chemistry and Technology, Jozef Stefan Institute, Jamova 39, SI-1000 Ljubljana, Slovenia
*
Author to whom correspondence should be addressed.
Energies 2018, 11(8), 2160; https://doi.org/10.3390/en11082160
Submission received: 17 July 2018
/
Revised: 11 August 2018
/
Accepted: 15 August 2018
/
Published: 18 August 2018
(This article belongs to the Special Issue Recent Advances in Internal Combustion Engines Operation and Emissions)
Abstract
:Air quality in urban areas is strongly influenced by exhaust emitted by the public transport fleet. The aim of this study was to analyze benefits in the fuel consumption, fuel costs and exhaust emissions when replacing baseline diesel fueled EURO III city buses by the compressed natural gas (CNG)-fueled EURO V buses and by hydraulic series hybrid diesel-fueled EURO V buses. Real-world measurements were performed on the regular bus route to access realistic energy consumption and exhaust emissions. Instantaneous gaseous emission (CO2, CO, NOx and THC) were measured together with the instantaneous PM10 mass emission. Innovativeness of the presented approach thus arises from the systematic comparison of different powertrain technologies under real-world drive cycles and measuring time traces of not only gaseous but also of PM10 mass emissions. Furthermore, lumped cycle averaged emissions are interpreted and explained by typical powertrain performance parameters and exhaust emission time traces. Cumulative results indicate that application of the CNG fueled buses does not necessary reduce CO2 emissions compared to diesel-fueled buses whereas reduction in fuel costs is evident. Additionally, it is shown that hybrid operation of the hydraulic series hybrid diesel-fueled bus resulted in higher fuel consumption due to poorly optimized hybrid topology and control strategy. Furthermore, analyses of the time traces point out inadequate lambda control of CNG-fueled buses and nucleation mode-based particle number emissions during deceleration.
1. Introduction
Road transport vehicles are still mainly powered by internal-combustion engines, which generally use fossil fuels and consequently emit CO2, which is an important driver of climate change. Huge efforts were invested to reach five main climate change agreements: the United Nations Framework Convention on Climate Change, 1992; the Kyoto Protocol, 1998; the Copenhagen Accord, 2009; the Doha Amendment, 2012; the Paris Agreement, 2015. These agreements have been implemented by introducing green policies and actions in the transport sector, since transport is one of the major greenhouse gases emitters. Fulton et al. [1] point out that more analyses are to be performed to better understand impacts of current green policies and plans on CO2 emissions.
In addition, as the majority of the public transport users are concentrated in cities, the harmful exhaust emissions of local buses have a considerable impact on human health. According to the Slovenian Environment Agency report [2], being in line with similar reports of other agencies, the impact of PM10 particles on health depends on their concentration and on the time of exposure. It is also reported that long-term exposure to lower concentrations of PM10 has much greater impact than shorter exposures to high concentrations [2]. Published report of Slovenian Environment Agency reveals that at the Ljubljana city center measuring site the allowed average daily concentration was exceeded 66 times in the 2016 and that its maximum values are way over 35 times allowance limit [3]. The average annual concentration of PM10 in the same year reached the allowed limit for average annual concentration (40 µg/m3), and the value has not decreased within the last four years [3].
The city of Ljubljana participated—as the project coordinator—in the FP7 CIVITAS ELAN program, which is a European-funded initiative with the aim to support cities to introduce ambitious transport measures and policies towards clean, sustainable mobility solutions ensuring healthy living environment and accessibility for all citizens [4]. Many measures were introduced within the program to achieve the above-mentioned goals: purchase of five hydraulic hybrid buses with diesel-fueled CI engines that meet EURO V emission standard, opening of the first CNG filling station in Slovenia to supply fuel to 20 new CNG-powered buses, and the prospect of the introduction of more new buses to improve the public transport operation fleet impact on the city air quality. Introduction of a CNG fuel goes hand in hand with European union policy, which supports diversification of the energy supply [5,6] and aims to reduce the risk of the increasing dependence on imports, volatility in fuel prices and climate changes.
To obtain detailed emission data during real use cases in the city of Ljubljana, buses from the pool of the Ljubljana Public Transport Company that feature different powertrain technologies were assessed during their daily use. Series of Portable Emissions Measurement System (PEMS) measurements were performed to compare the impact of the powertrain technology on the real-world fuel consumption, fuel cost and exhaust gases emissions. A reference, conventional bus with diesel-fueled CI engine that meets EURO III emission standard and represents the average fleet condition was tested, and the results are systematically compared to the results obtained with the two newly introduced buses featuring different powertrain technology: a hydraulic series hybrid bus and a CNG-powered bus.
This paper thus focuses on exhaust gas emission measurements of not only gaseous but also of PM10 mass emissions in the real-world traffic on regular, representative bus route in Ljubljana, since real-world exhaust gas emissions can substantially differ from those obtained by the homologation test cycles [7,8]. Even though numerous efforts were already made to determine driving cycles that better represent real-world traffic conditions, e.g., [9,10,11], it is important to assess the effect of different powertrain technologies and real-world city driving cycles on exhaust emissions to adapt and optimize powertrain technology to typical city use. Collected data in real-world traffic are also crucial for the quality validation of the road vehicle emission models [12].
Time traces of several powertrain parameters (bus velocity, engine speed) as well as exhaust gas gaseous (CO2, CO, THC, NOx) and PM10 mass emissions were logged during the tests. The innovativeness of the presented approach arises from the systematic comparison of different powertrain technologies under real-world operation and measuring time traces of not only gaseous but also of PM10 mass emissions. During these tests particle number of the CNG-powered bus was, to the best of our knowledge, for the first time indirectly related to different regimes of engine transient operation. Cumulative exhaust gas emissions and fuel consumption were further calculated and are presented in the paper. Those results, as well as instantaneous emissions, are thoroughly analyzed and discussed with carefully chosen typical 300-s. segments of the bus operation, and compared to the results of other authors. Mechanisms that affect cumulative and instantaneous exhaust emissions are explained on the basis of measured powertrain parameters and of the in-cylinder thermodynamic and combustion parameters to ensure deeper understanding of the causal chain that contributes to better understanding of the underlying phenomena. Additionally, sensibility of hydraulic series hybrid bus fuel consumption on control strategy and powertrain topology is addressed.
This paper is constituted of five sections. The second section presents thorough literature review of the research topic. The third section addresses the methodology describing the tested buses topology and characteristics, measurement equipment specification and installation details as well as test-route characteristics. In the fourth section, cumulative emission results and fuel costs are presented, followed by powertrain parameters and typical emission time traces in the following two subsections, in which causal chain is discussed. The fifth section summarizes our main conclusions.
2. Literature Review
Although there is a prevailing opinion, also confirmed by traffic and emission simulations, that substitution of the conventional diesel-powered buses with CNG-powered buses [13] or hybrid buses cuts greenhouse gases emissions, fuel costs, PM10 and NOx emissions, laboratory and real-world emission test do not always support this statement, as discernable from subsequent analysis of selected publications.
An extensive national program on bus emissions was carried out in Finland where three diesel and four CNG buses were tested on the chassis dyno according to Braunschweig and Orange county duty cycle [14]. A EURO III diesel bus with no aftertreatment system emitted approximately 1150 g/km of CO2, whereas four turbocharged CNG-powered buses with three-way catalytic converter (TWC) emitted from 1077 to 1518 g/km of CO2 [14]. Moreover, the CNG bus with stoichiometric combustion had lower CO2 emissions compared to the CNG bus with lean-burn and lean-mix combustion system; at lower loads and engine speeds, the lean-mix engine operates with stoichiometric mixtures while at higher loads and speeds it operates with lean mixture to reduce engine thermal load [14]. Although lean-burn operation is considered to be more fuel efficient, in the analyzed case the stoichiometric combustion engine featuring a newer design and downsized engine resulted in better fuel efficiency. PM10 mass emissions of a CNG bus with stoichiometric combustion were two orders of magnitude lower compared to EURO III diesel bus with no aftertreatment, but particle number was just one order of magnitude lower [14]. Nucleation mode particle emission of CNG fueled spark ignition (SI) engines which originates in the engine oil is pointed out as a potential source [14]. CO emission of the CNG bus with stoichiometric combustion engine was roughly twice as high compared with the baseline EURO III diesel bus [14]. As expected, a similar trend is observed with THC emissions. The EURO III diesel bus emitted approximately 8 g/km NOx, whereas NOx emissions of the CNG buses with stoichiometric combustion engine were approximately four times lower [14].
Jayaratne et al. [15] tested several diesel- and CNG-powered buses in four steady engine load points, and CNG buses were demonstrated to produce 20–30% lower CO2 emissions. Similar NOx emissions were further reported on diesel and CNG buses. On the other hand, PM10 mass emissions of CNG buses were at least two orders of magnitude lower than those of the diesel buses [15]. However, CNG buses are characterized by approximately 10 times smaller average particle diameters (10 nm vs. 100 nm) and thus particle number of diesel and CNG buses was comparable at full load and lower for CNG buses at part loads [15].
Regulated and unregulated toxic emissions of EURO II bus engines fueled by CNG, diesel and diesel fuel with 20% biodiesel (on volume basis) were measured in the steady-state European 13 mode cycle, ECE R49 [16]. 30 times lower PM10 mass emissions and a very high 98% reduction of NOx was measured on buses with SI engines fueled by CNG with respect to buses with compression ignition (CI) engines fueled by diesel fuel. The THC emissions were also lower for 67% [16]. No significant differences were observed for CO emissions [16].
Hallquist et al. [17] analyzed emissions of particle mass and particle number as well as gaseous emissions for 35 diesel and CNG (EURO III, IV and V) buses by measuring the concentration change in the diluted exhaust plume compared to the concentrations before the passage and relative to the change in CO2 concentration. Two tests were performed: (1) acceleration from standstill to about 20 km/h, and (2) driving with a constant velocity of about 20 km/h. In the acceleration test CNG bus emitted lower mass rate of PM10, but on the other hand particle number was approximately 5 times higher [17]. Average NOx emissions were higher for the CNG buses compared to diesel buses. It was also reported that scatter of NOx emissions of the CNG buses was high, as it mainly correlates with the variability in vehicle maintenance and variation in the composition of the CNG fuel [17]. THC emissions were under detection limit of the applied measurement equipment for all buses and CO emissions were over detection limit only for six buses [17].
In addition to emissions of a single vehicle, it is also important to optimize fleet emissions in the service industry of transportation and logistics service providers and energy-efficient supply chain management [18,19], where it is also important to consider special purpose vehicles, e.g., vehicles in food cold chain [20]. When green policies with the goal to lower fleet emissions are to be implemented, it is important for the logistics service providers that green policies must be also financially beneficial [21].
3. Methodology
3.1. Tested Buses
A diesel-fueled bus that complies with EURO III emission standard with CI engine and automatic transmission (Acronym DE3) was selected for the tests as a reference vehicle as a vehicle representing the average fleet where average age of a bus is rather high (approximately 10 years). A hydraulic hybrid bus powered with a diesel-fueled CI engine (Acronym DE5) and a bus with CNG fueled SI engine (Acronym CNGE5) were compared to this reference bus. Both later buses comply with the EURO V emission standard. Main characteristics of the buses are shown in Table 1.
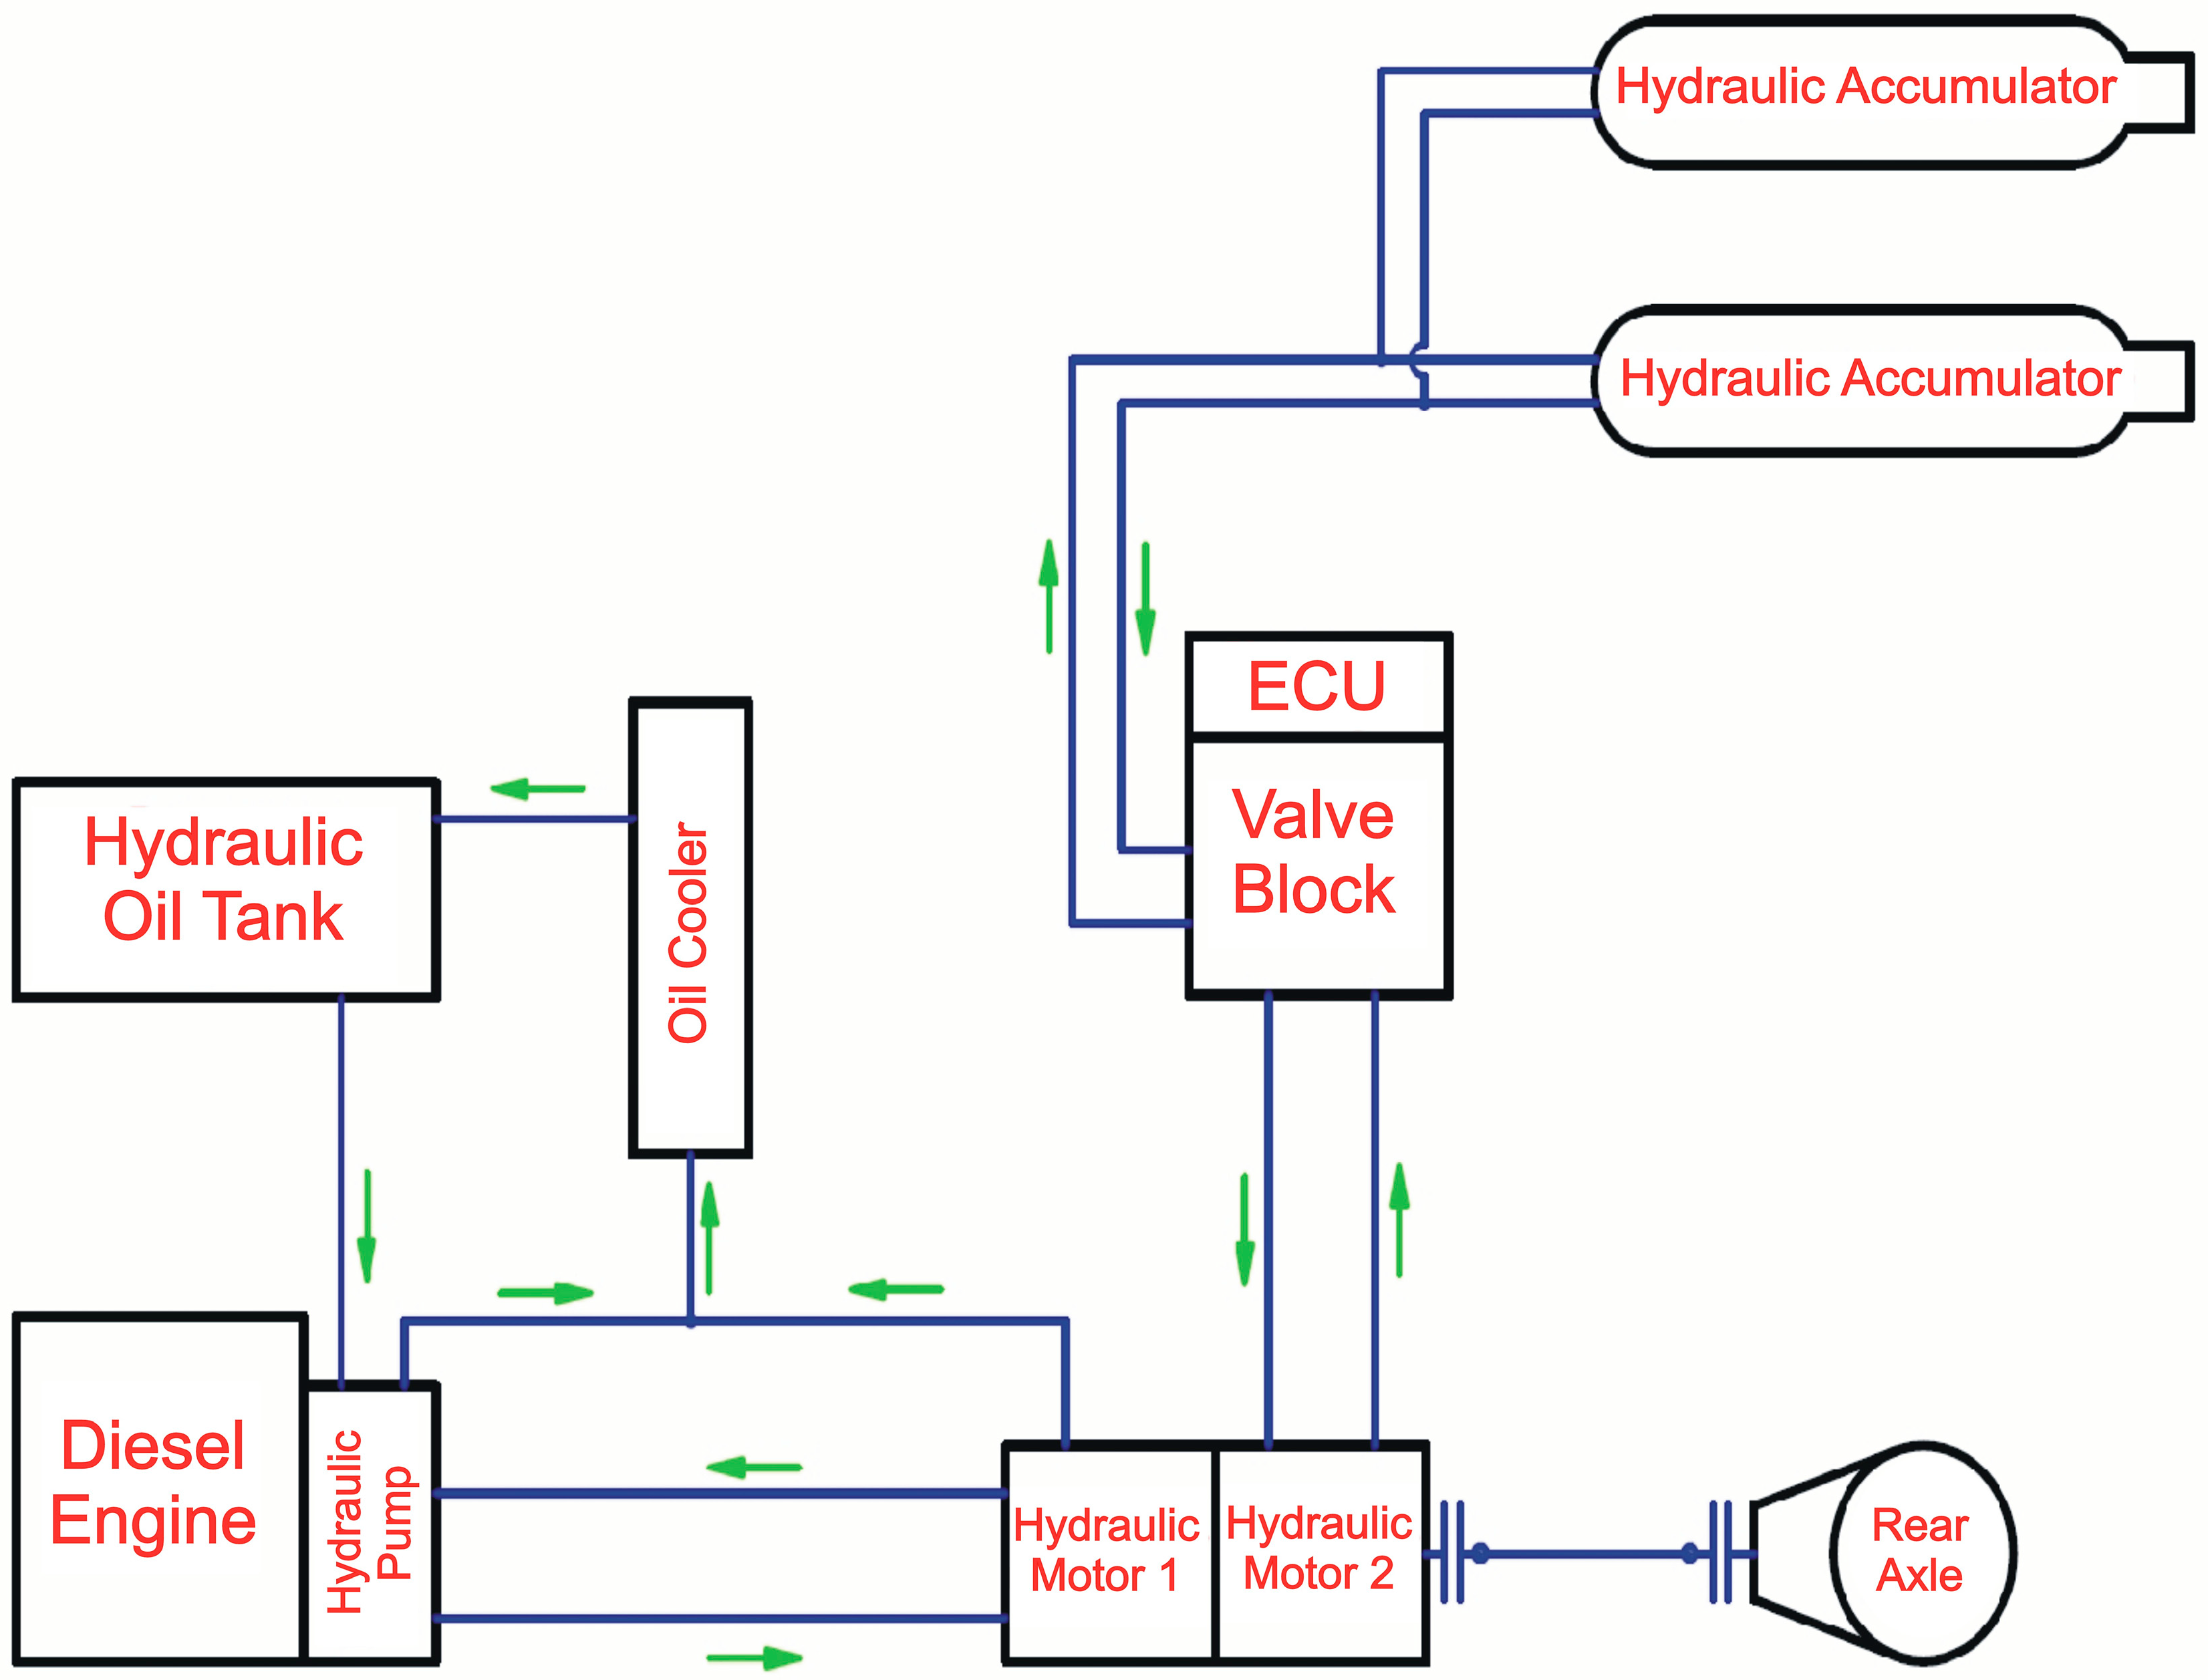
DE5 bus powertrain topology is presented in Figure 1. Diesel-fueled CI engine coupled with a hydraulic pump is in serial connection to Hydraulic Motor 1. Hydraulic Motor 2 is connected through valve block controlled by electronic control unit (ECU) to two hydraulic accumulators, and is also able to power the bus if there is enough energy stored in the accumulators. Hydraulic accumulators are pressurized during regenerative braking sequence when Hydraulic Motor 2 is used as a hydraulic pump or when Hydraulic Motor 1 (besides the bus) also powers Hydraulic Motor 2 in pumping mode.
Both diesel-fueled buses are powered by the FAME-free diesel fuel that otherwise complies with EN590 standard. CNG fuel used consisted of 98% methane, 0.8% ethane, 0.8% nitrogen, 0.25% propane, 0.13% butane and 0.02% of other gases.
3.2. Measurement Equipment
PEMS was used to monitor exhaust gas emissions. HORIBA OBS-2200 on-board emission system was applied to measure CO2, H2O, CO, THC and NOx emissions. CO2, H2O, and CO concentrations were measured with the Heated Non-Dispersive Infrared sensor, THC were measured with the Flame Ionization Detection sensor and NOx emissions were measured with the Chemi-Luminescence Detection sensor. The applied measurement system also enabled measurement of the standard volume flow of the exhaust gases (Figure 2), current position, actual velocity of the vehicle (Global Positioning System—GPS) and ambient conditions.
HORIBA [22] reports ±2.5% of full-scale accuracy for all measured gases. Full-scale range was selected according to the expected highest concentration of each individual measured gas component based on previous experiences. Definition and test procedure for linearity, accuracy, noise and repeatability are conformed to EPA CFR 1065.602 [22].
The HORIBA OBS-2000TRPM—On-Board Transient Response Particulate Measurement Unit—is designed to span calibrate the real time PM10 mass analyzer with filter gravimetric method [23]. The sample is first proportionally diluted with air filtered by high efficiency particulate absorber and led through a short heated tunnel and a heated line where it is well mixed and thermally stabilized to 47 °C. It is then split with a reduced flow (typically 2.5 dm3/min) sent to the Diffusion Charge Sensor (DCS) for real-time analysis, while the rest of the diluted sample (30 dm3/min) passes through either an analytical filter or a bypass filter depending on the mode of operation. The mass of PM10 collected on the analytical filter is then used to calibrate the DCS signal to a traceable mass standard.
The sample (raw or probe) flow is not directly measured during the operation but is the difference between the measured and controlled total flow and the measured and controlled dilution flow. In standard operation, the total flow is set to 30 dm3/min. The dilution flow is controlled to maintain either constant dilution flow or proportional flow to the supplied exhaust flow signal. The second option was used during the tests. Both diluted exhaust samples to the filter and to the DCS belong to the same sample stream.
HORIBA OBS-2000TRPM is compliant with EPA CFR Part 1065 [23]. Proportional dilution control complies with ISO-16183. The device was selected by the EU PEMS program as the reference particulate matter mass measurement principle and is used for EURO VI In-Service Conformity tests and other real-world emissions studies and general vehicle development [24]. To minimize the measuring uncertainties, it is very important to set the dilution ratio for each of the tested buses to such values that the particles mass gathered on the filter is in the range recommended by equipment manufacturer and particle concentration in the diluted flow in the best measuring range of DCS.
Vehicle dynamics were measured by the Race Technology DL2 system, which combines results obtained from the two-axis accelerometer and a 20 Hz GPS antenna to measure vehicle position and velocity with very high accuracy.
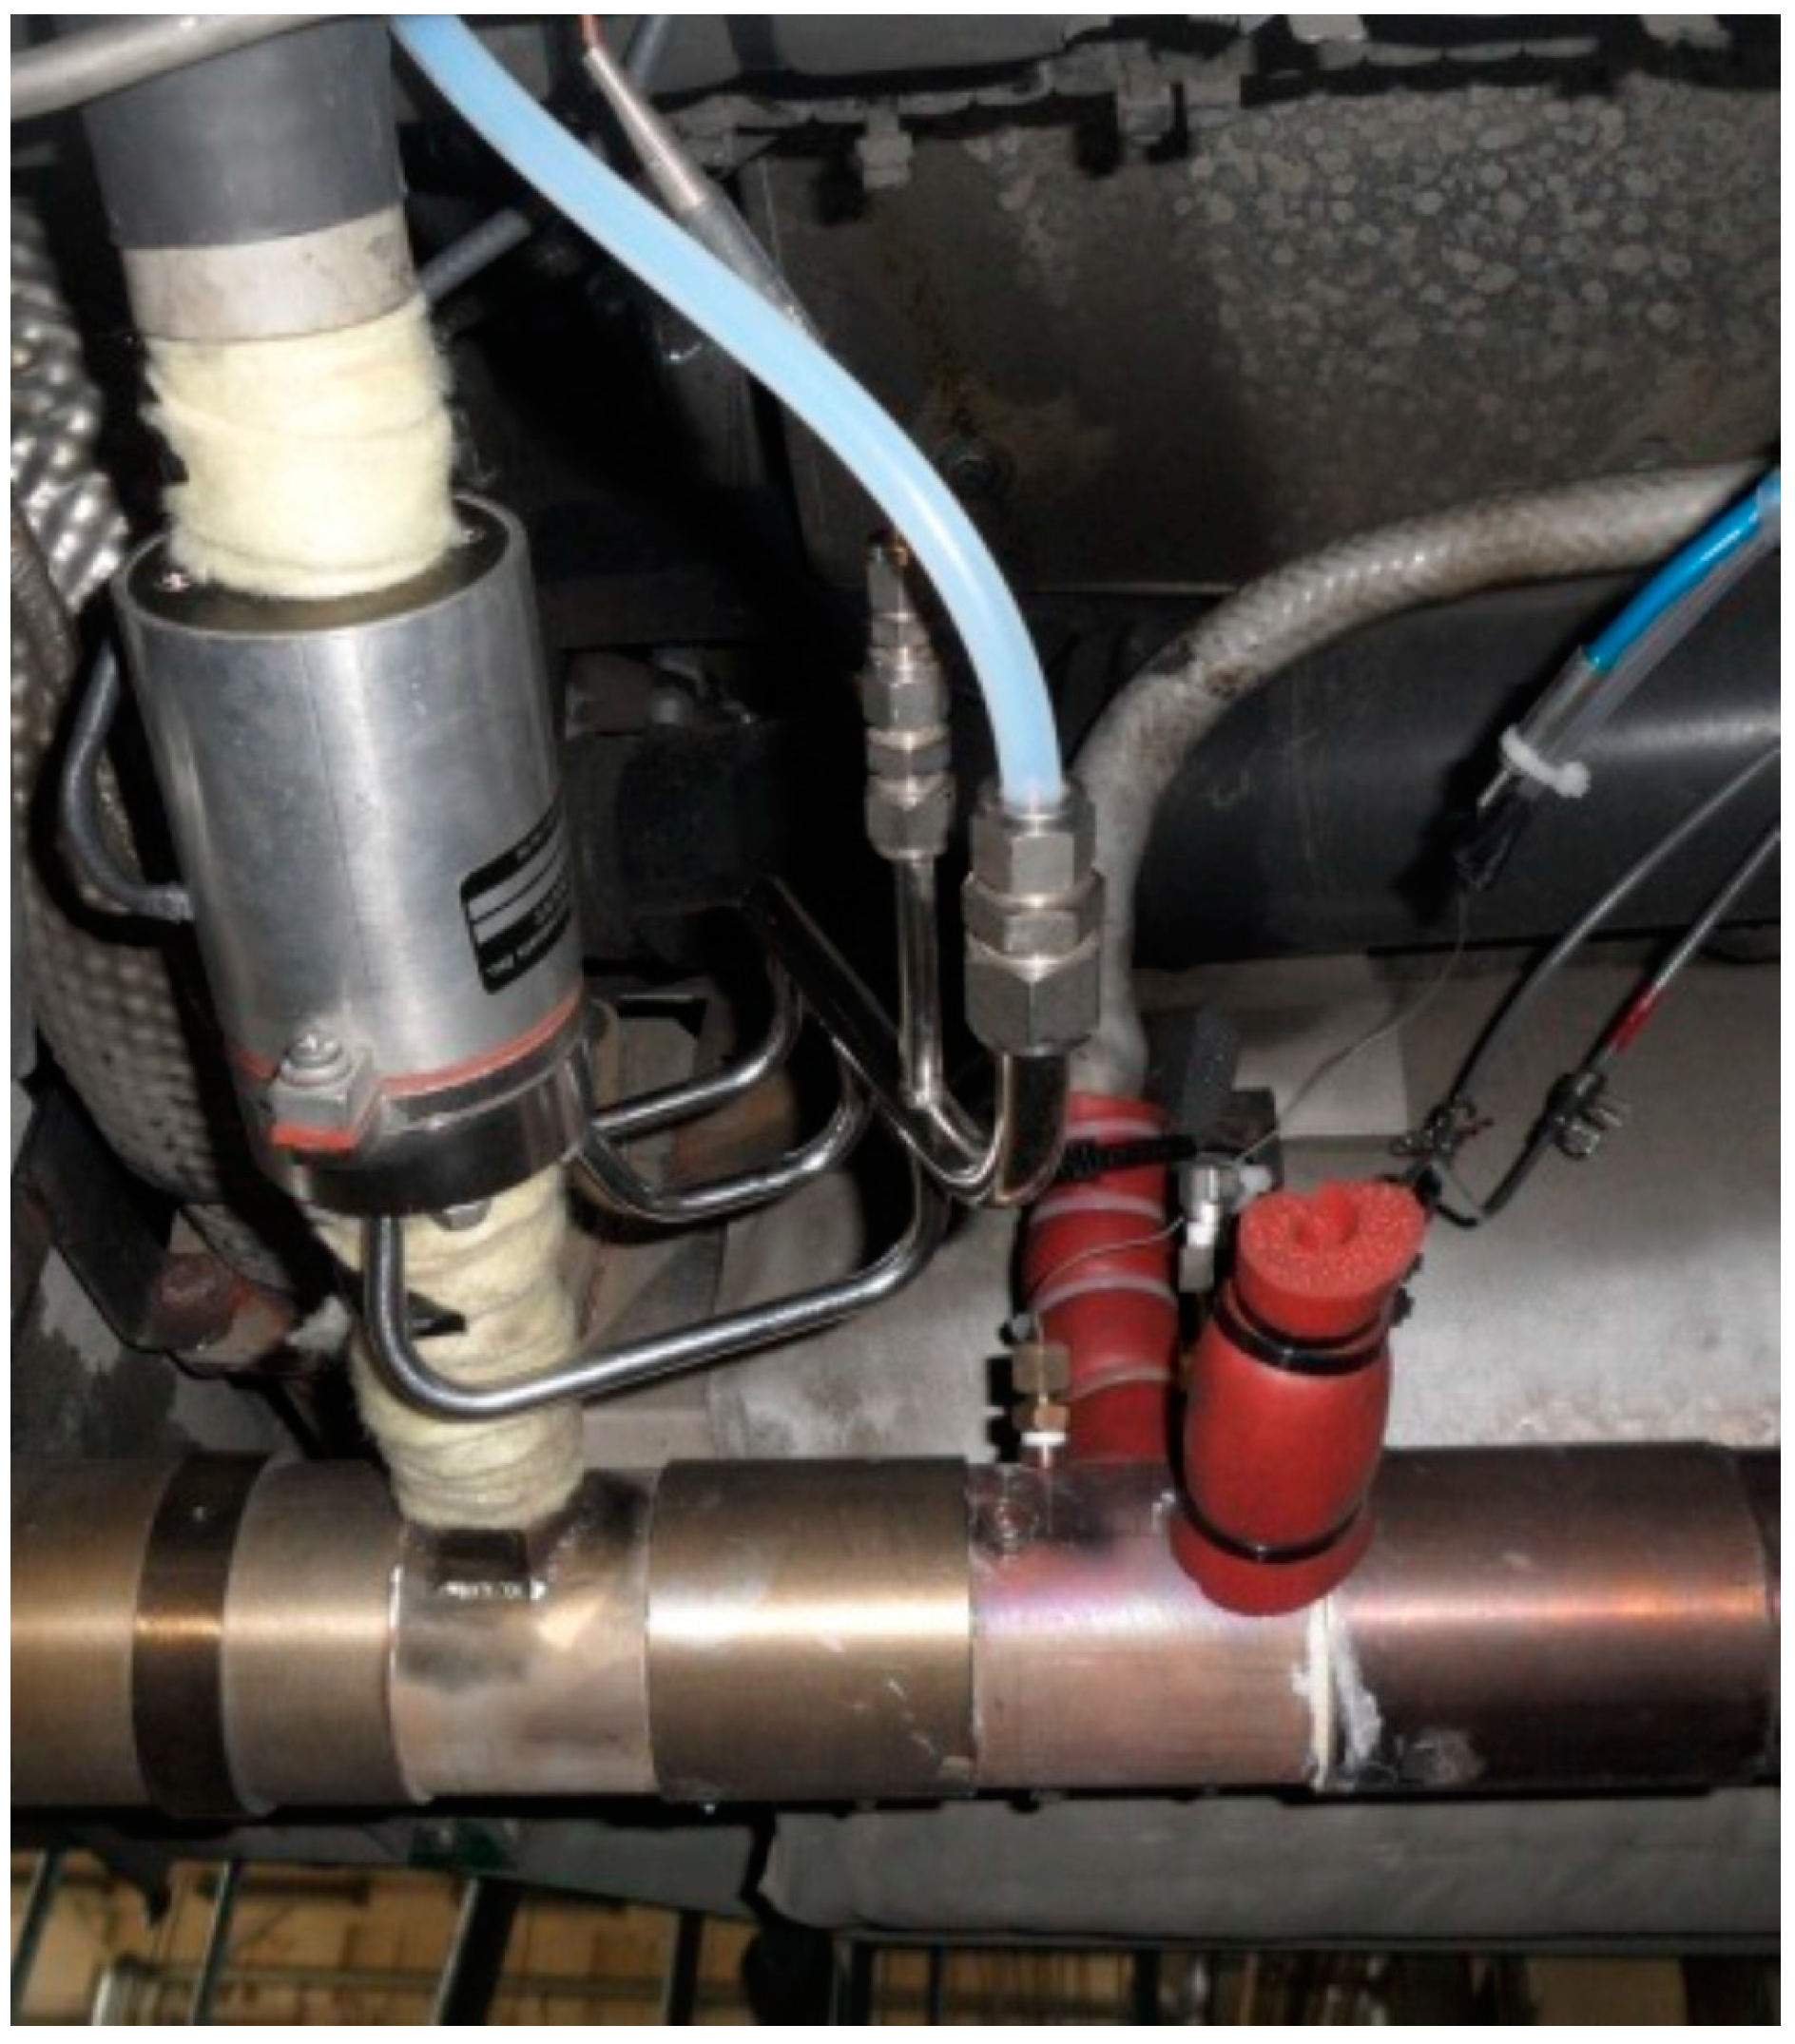
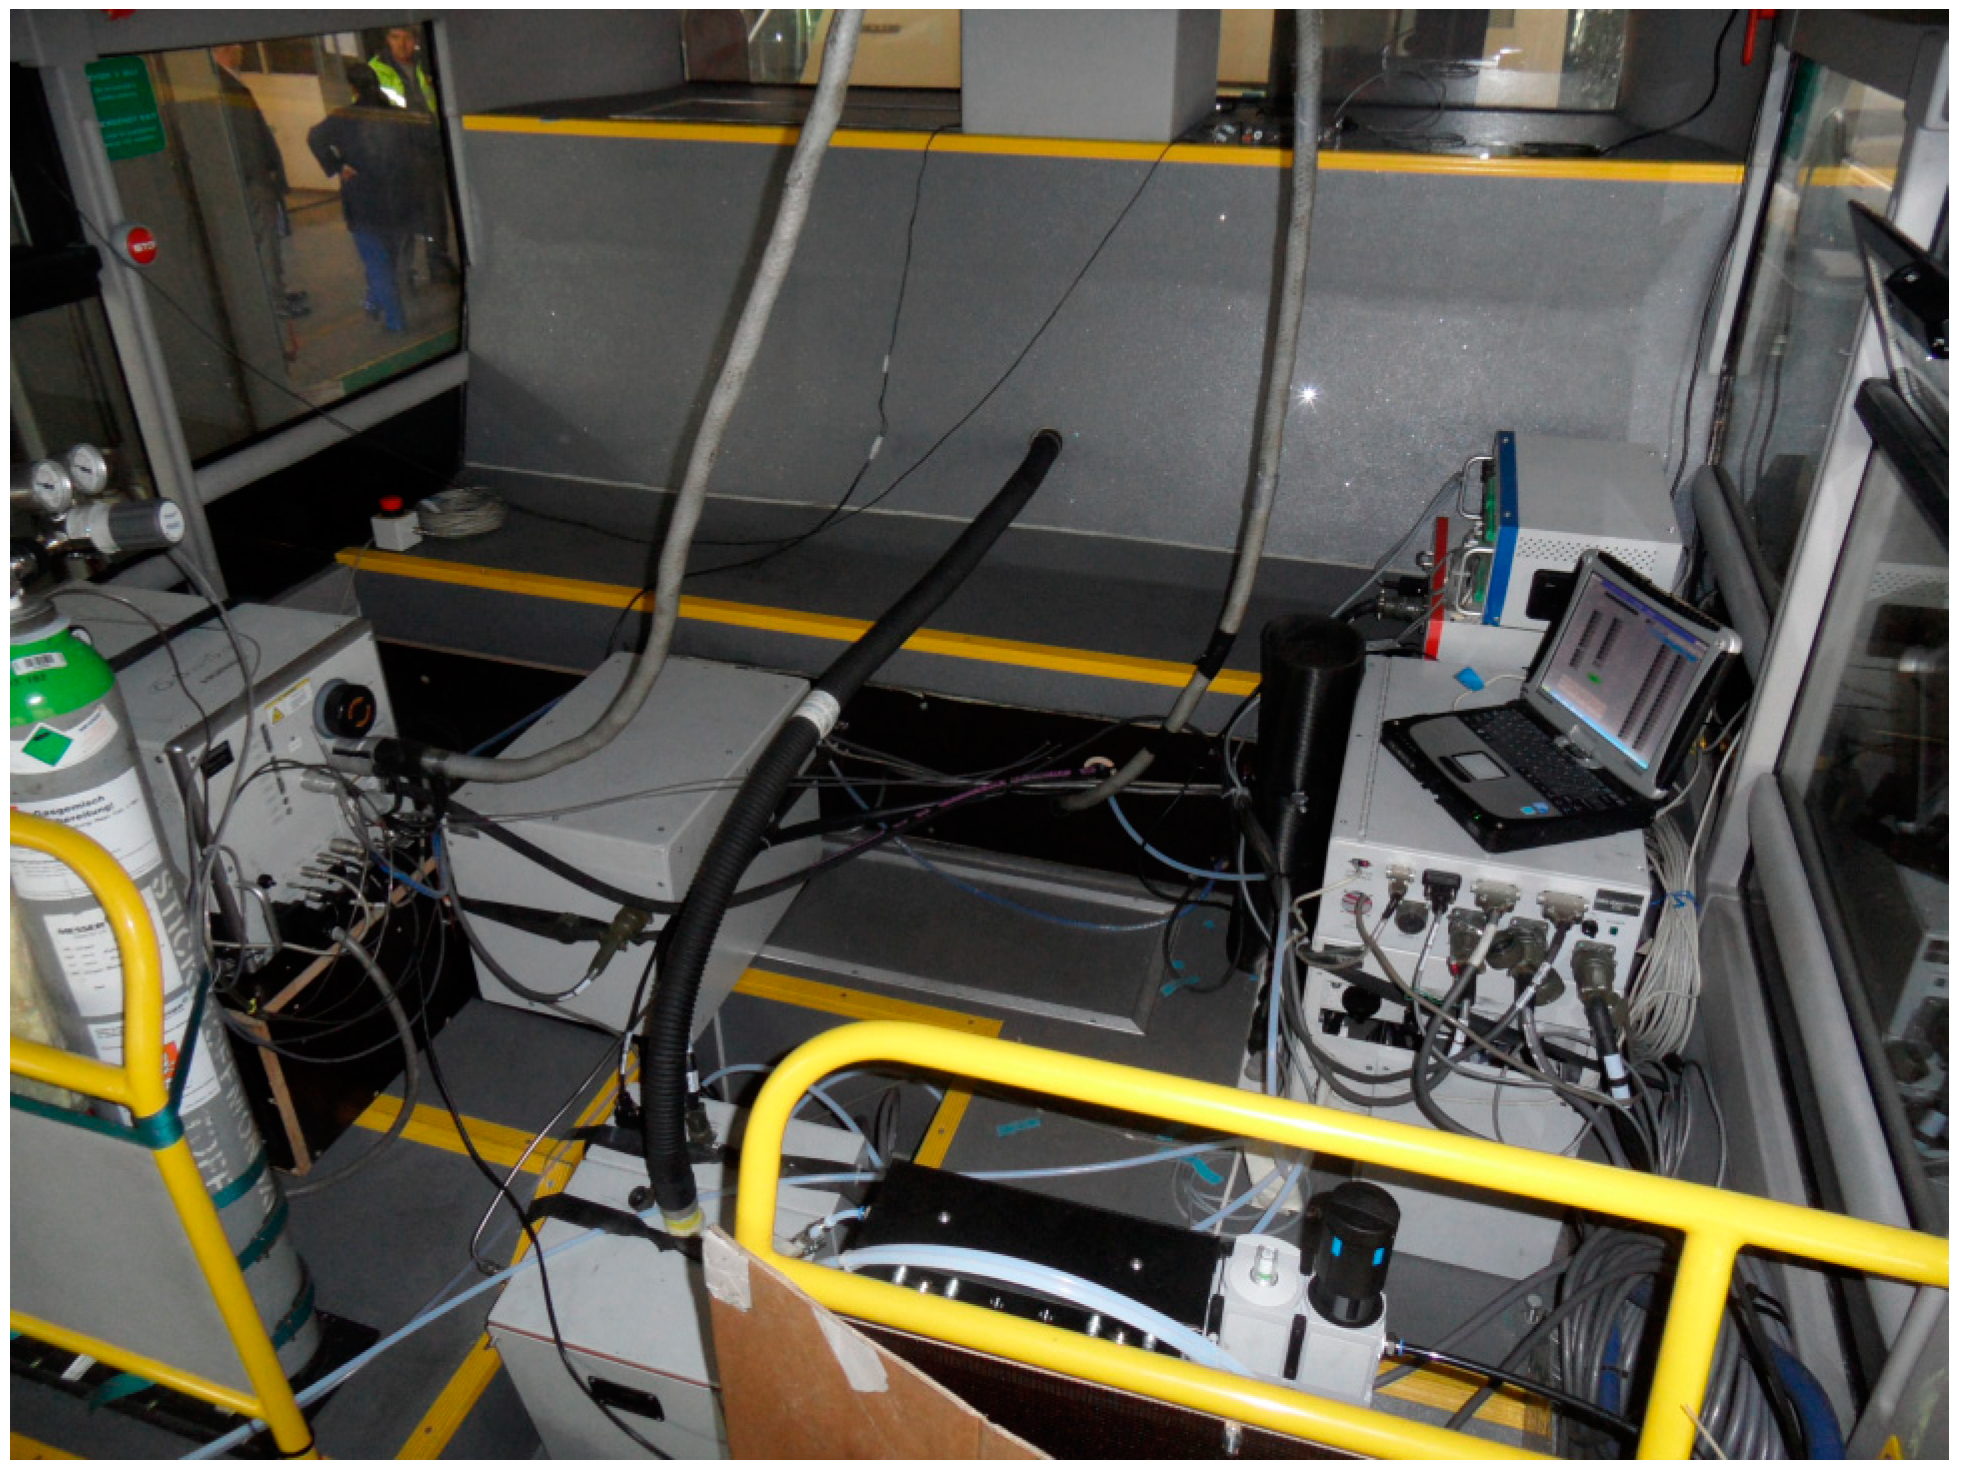
The measurement equipment was installed on the buses with all supporting systems (electrical generator, filters, etc.) (see Figure 3). Special care was devoted to proper installation of the exhaust gas volume flow meter and the sampling probes (Figure 2) to assure accurate, gas tight volume flow measurement with several diameters straight pipe in front and behind the exhaust flow meter.
Measured results were post-processed and thoroughly analyzed to get good insight into the typical operation of the tested buses and characteristic exhaust gases emission. Based on the described analyses, results that represent typical observed phenomena were carefully selected and are presented in the next section together with the cumulative results.
3.3. Test Route
Route (city line) No. 2 was chosen as the representative test route since it is typically flat and can be considered as a common route-type among Ljubljana bus routes where uphill or downhill sections are short and rare. It starts in a Ljubljana suburb—where the number of passengers is lower and higher average velocities are achieved—and leads through the city center—where the bus is usually full of passengers and low average velocities are to be expected—and ends again in a Ljubljana suburb. The overall route length amounts to 12.65 km.
Four consecutive measurements were performed on the DE3 and on the CNGE5 bus, two in each driving direction. The DE5 bus also offers the possibility to turn the hybrid mode and the power limiter on or off. Four different operational modes are therefore possible. Four measurements, two in each driving direction, were performed for each mode.
Velocity and acceleration time traces of the buses were obtained by processing the data of the vehicle dynamics measurement during real-world operation with passengers on-board. A typical 300 s. segment of Ljubljana city bus velocity time trace is presented on Figure 4 (measured on CNGE5).
It can be seen in Figure 4 that top velocity of city buses is limited to 50 km/h. Frequent accelerations and decelerations can also be observed. Similar velocity time traces can be observed also with DE3 and DE5 buses since velocity time traces are more influenced by the traffic conditions than by the vehicle powertrain technology.
Previous analyses indicated that the average number of passengers on board was 23. Therefore, 1725 kg of substitutive mass was loaded on the buses during the exhaust emission tests, 75 kg for each passenger, since the sheer volume and noise caused by the measuring equipment prevented tests with passengers on board. To ensure a realistic test, the driver stopped at each bus stop for a time of 15 s to mimic the real-world operation during PEMS measurements.
4. Results
Cumulative results will be presented in the first subsection, whereas deeper understanding of the causal chain that contributes to better understanding of the underlying phenomena is explained in the two next subsections using typical powertrain parameters and exhaust gas emission time traces.
4.1. Cumulative Test Results
Average fuel consumption of the tested buses is presented in Table 2. Fuel consumption of the CNGE5 bus is the highest due to the lowest thermal efficiency of the SI homogeneous charge combustion engine. The SI engine features lower thermal efficiency than the CI non-homogeneous charge combustion engine mainly due to the lower compression ratio and the throttled operation at part loads being inherent to conventional SI engines. As can be seen from the velocity time trace (Figure 4), the bus is at a standstill for approximately 25% of the time, resulting in rising pumping loses during gas exchange of the throttled SI engine during idling. When comparing fuel consumption and energy consumption, it is important to consider that gravimetric lower heating value of CNG is approximately 20% higher compared to that of the diesel fuel (see Table 2, Energy Consumption column). However, at the time of writing this paper, higher fuel and energy consumption is economically offset by lower CNG prices, as can be seen in Table 2 in the Specific Fuel Cost column.
Fuel consumption of the DE5 bus was lower compared to the DE3 and CNGE5 buses but it also has to be noted that the DE5 bus has smaller frontal area and lower mass (see Table 1) that lowers the bus power demand. It can also be seen in the table that the power limiter setting that actually limits the engine speed has a positive effect on the fuel consumption due to consequently lower engine friction losses and higher engine loads where engine efficiency is higher (please refer to Figure 5 and Figure 6). However, with the power limiter turned off, fuel consumption can be higher as it enables more intense accelerations. This also results in increased average bus velocity and consequently aerodynamic drag.
Surprising results were obtained on the DE5 bus when hybrid mode was turned on. To the best of our knowledge, this is the first time with real-world measurements that a hybrid powertrain of a production model bus has been shown to have a negative effect on fuel consumption. In general, as also reported by de Olivera et al. [25] series hydraulic hybrid powertrains offer the potential to lower fuel consumption. However, to achieve this goal it is of crucial importance to optimize topology, power ratios of components and control strategies of hybrid powertrains as reported in References [26,27].
In addition, it is discernable from Table 3 that CO2 emissions of the CNGE5 and DE3 bus are comparable, since the effect of more favorable hydrogen-to-carbon ratio of natural gas that offers potential to lower CO2 footprint was compensated by lower engine efficiency. The DE5 bus has on average approximately 10% lower CO2 footprint compared to the CNGE5 and DE3 buses due to its smaller frontal area and lower mass.
Compared to results published by Nylund et al. [14] where diesel and CNG buses were tested on chassis dyno according to Braunschweig and Orange county duty cycle, measured real-world CO2 emissions of the DE3 bus from the present study are approximately 100 g/km higher compared to Euro III diesel bus without any aftertreatment system presented in Reference [14]. Approximately 150 g/km lower CO2 emission was measured by Reference [14] on a CNG-powered bus with stoichiometric combustion compared to results of a CNG5 bus. Discrepancies can be explained with different dynamics of real-world tests compared to both test cycles, where idling periods in the real world were more frequent and longer, and thus had a greater effect on the efficiency of the stoichiometric SI engine of the DE5 bus. Similar discrepancies can also be observed if we compare CO2 cumulative emission results from the present study and the findings of Reference [15], where several diesel- and CNG-powered buses were tested at four steady engine loads on chassis dyno and demonstrated 20% to 30% higher CO2 emissions of diesel EURO III compared to CNG EURO III buses. This confirms the necessity of real-world measurements since different cities submit buses to different load cycles due to their traffic condition and geographical characteristics.
Average specific mass emissions of CO and THC are presented in Table 3 for all observed bus configurations. It is shown that the more advanced and modern DE5 bus engine demonstrates the lowest CO and THC mass specific emissions. Selection of the operating mode of the hybrid powertrain of the DE5 bus did not influence significantly the results of the CO emissions. Slightly increased CO emissions can be observed in non-hybrid mode with power limiter turned off. CO emissions of the DE3 bus and the CNGE5 bus reached approximately double values in comparison to the DE5 bus. Levels of the corresponding THC emission readings on the DE5 bus were in the range of the measurement uncertainty of the applied analyzer and are therefore not shown here. The DE3 bus emits approximately only half of the THC emissions of the CNGE5 bus.
Table 4 further indicates that the CNGE5 bus features 10 times lower NOx emissions compared to DE5 despite the fact of DE5 being equipped with SCR. Due to higher loads during hybrid operation of the DE5 bus compared to non-hybrid operation, a tendency towards higher NOx emissions can be observed in the hybrid operation. The DE3 bus emits approximately 30 times more NOx than the CNGE5 bus.
As expected, the highest PM10 emissions were measured on the DE3 bus, while the DE5 bus features 15–25 times lower PM10 emissions despite the absence of the Diesel Particle Filter (DPF). Very small PM10 emissions were measured on the CNGE5 bus. Since average particles from SI engines are an order of magnitude smaller compared to particles from CI engines and their mass per particle number is consequently also smaller, special care was devoted to the analysis of the PM10 time trace of CNG bus to detect possible bursts of particle number emission, which is thoroughly analyzed in Section 4.4. To the best of our knowledge, these are first real-world PM10 published results for buses with SI and CI engines driving the same route and will be additionally analyzed on the basis of measured time traces in Section 4.3.5.
4.2. Powertrain Parameters
Time traces of engine speed and cyclic fuel delivery are analyzed in this section to reveal the typical engine operations of the different powertrain topologies and to support the analyses of the exhaust emission time traces. The time traces segments that are presented here were carefully chosen and represent 300 s. segments of comparable operation of each individual analyzed bus. The same time segments will be applied in the next section, where exhaust gas emissions time traces will be presented and analyzed.
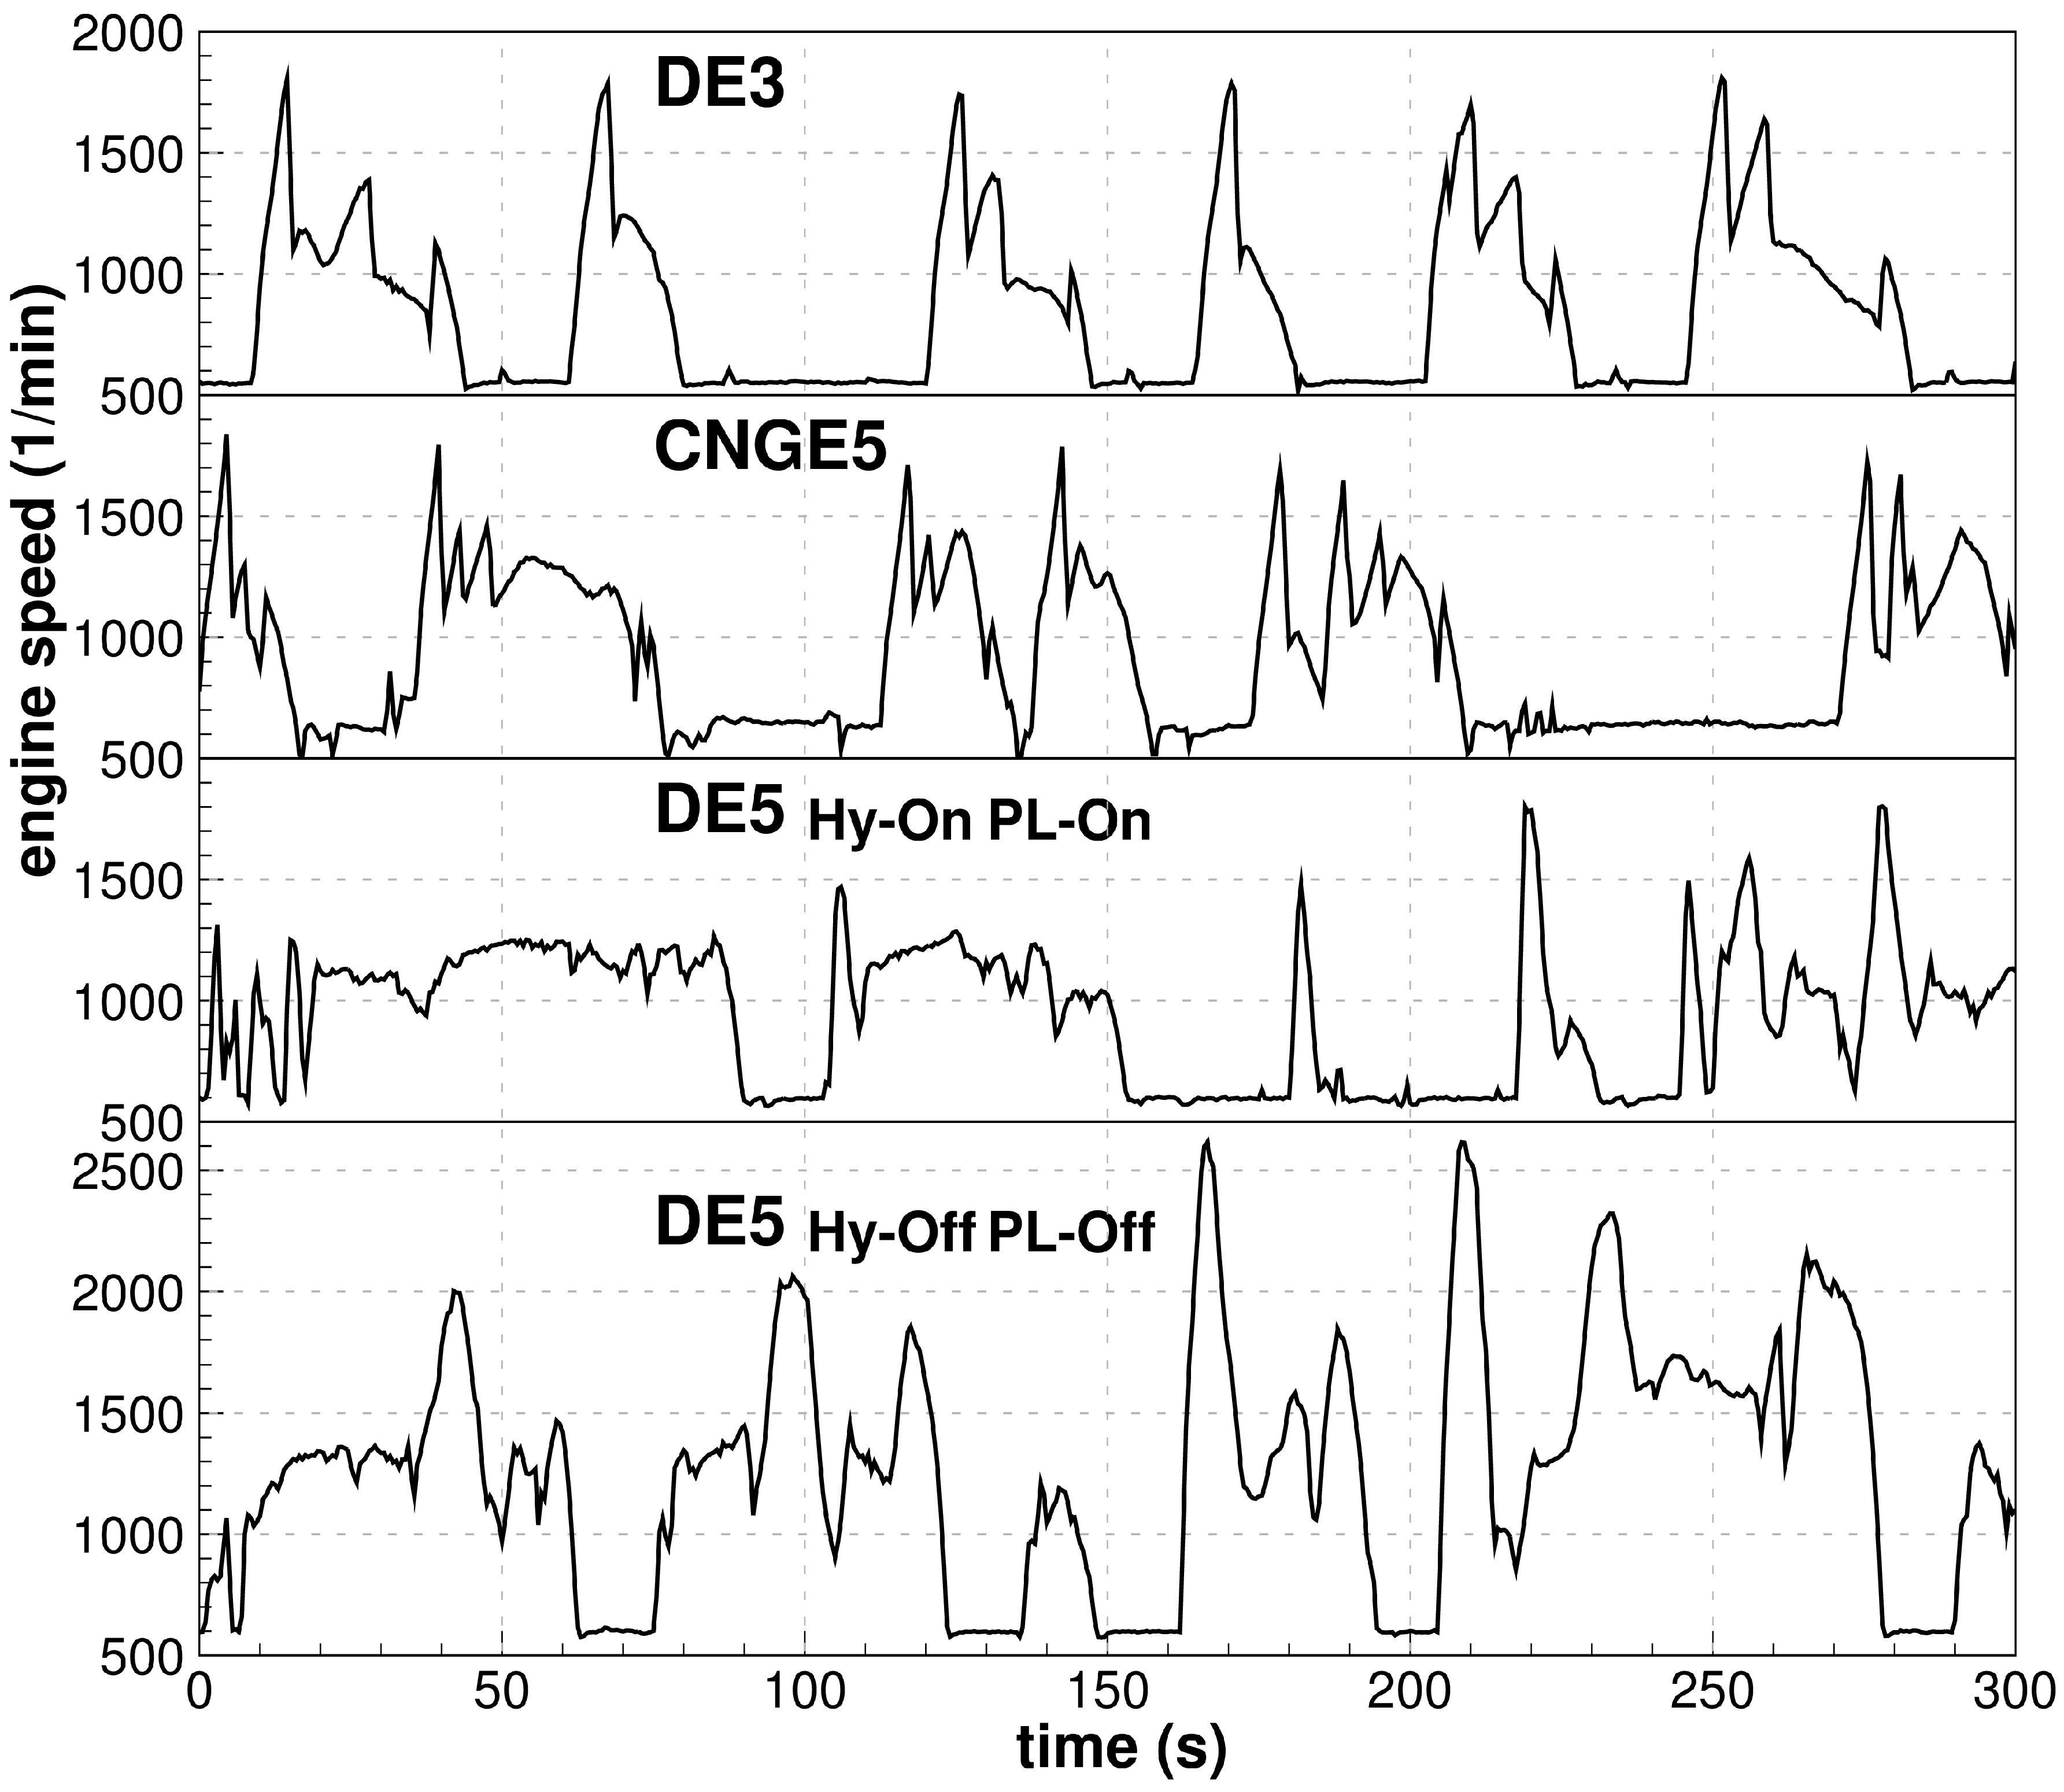
Engine speed traces versus time are presented in Figure 5, which reveals typical engine speed traces for buses with conventional automatic gearboxes for the DE3 and CNGE5 bus. Both engine speed traces are namely characterized by fast gradients of engine speed indicating gear shift sequences, while maximum engine speeds are in the same range for both buses.
The DE5 bus incorporates series hydraulic hybrid powertrain, which allows for significant variation of the engine operating regime conditioned by enabling or disabling hybrid mode (Figure 5). When the hybrid mode and power limiter are turned on, engine speed traces differ substantially from those of the DE3 and CNGE5 buses, and engine speed is limited to approximately 1800 min−1 to omit engine operating points with high mechanical losses and to run the engine in the area of higher effective engine efficiency. Furthermore, segments of longer operation at elevated engine speed can be observed in this operating regime due to the presence of hydraulic accumulators where excess energy delivered by CI engine operating at higher efficiency is stored. Engine speed trace with power limiter turned off in non-hybrid mode (Figure 5) is again an example of the engine speed trace that is qualitatively comparable to that of conventional powertrains, since in a non-hybrid mode the DE5 operates as a series hydraulic powertrain with engine speeds up to 2500 min−1.
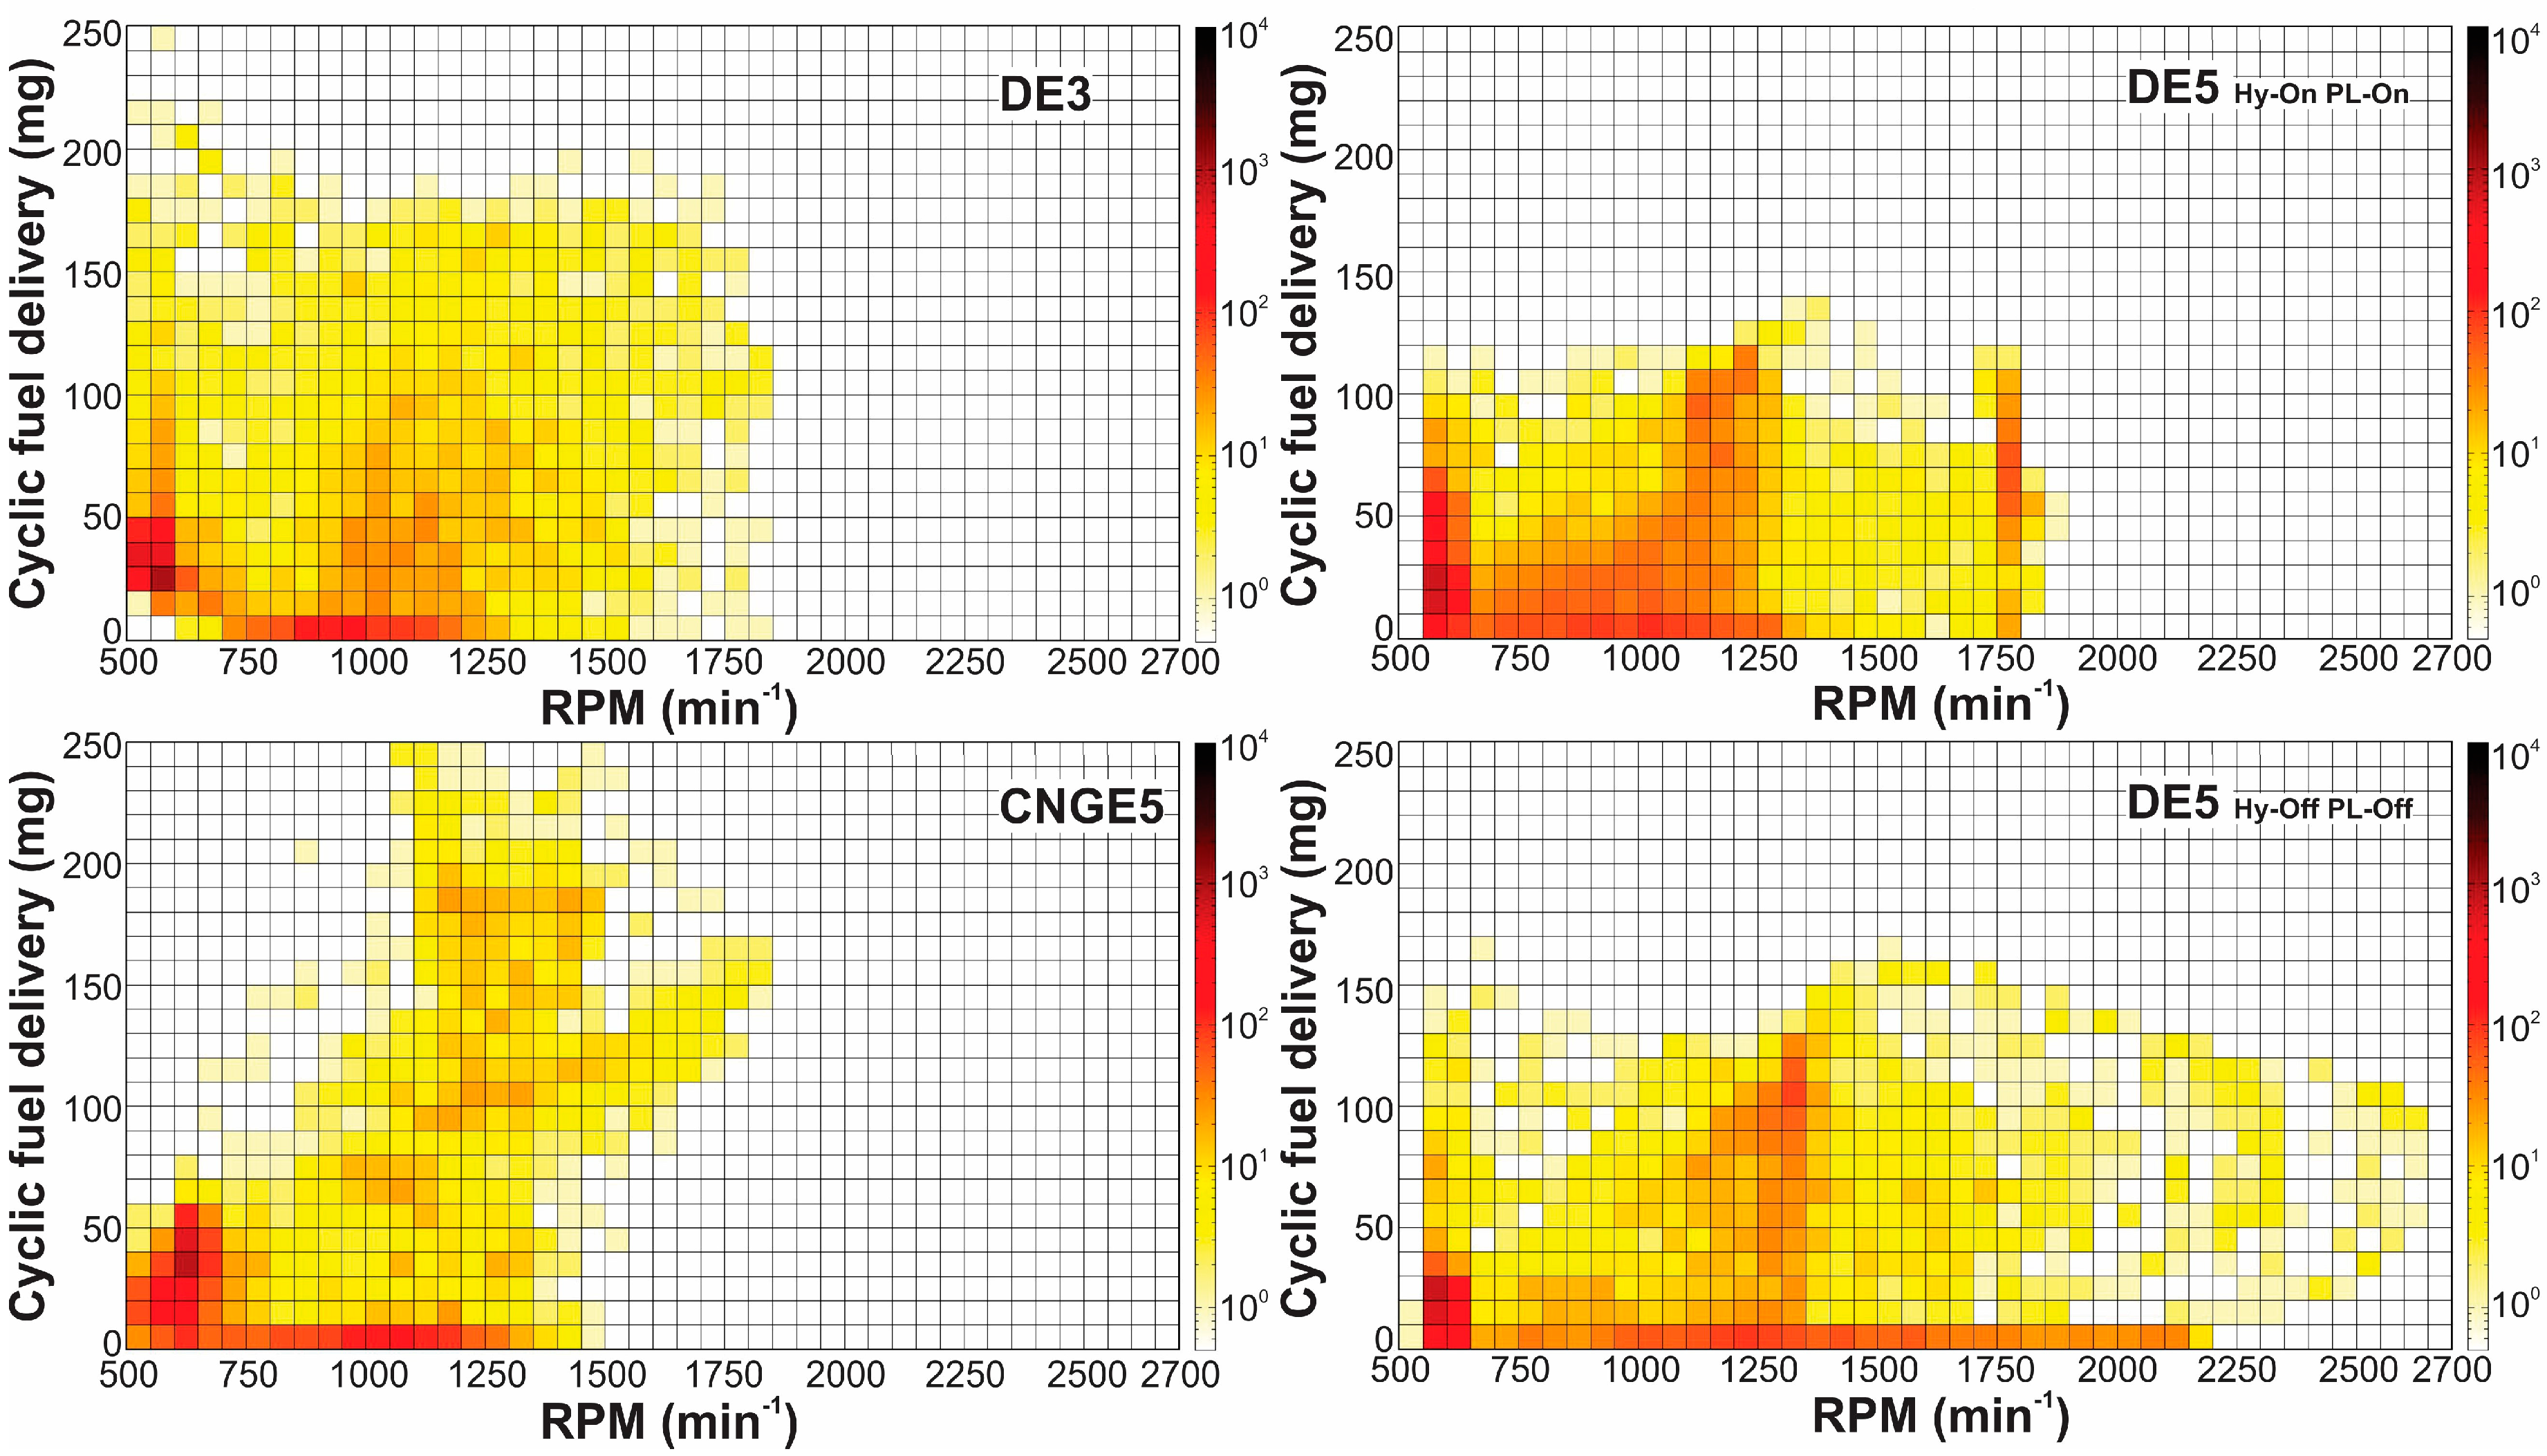
Figure 6 represents cyclic fuel delivery versus engine speed of the DE3, DE5 and CNGE5 buses. Instantaneous fuel consumption was calculated by the use of the carbon-balance method [22]. Figures were produced in such a way that every half a second, current measured value was appointed to a corresponding operating rectangle. Number of points in the rectangle and thus frequency of engine operation in this particular point is presented with a suitable color (see logarithmic color gradient legend on the diagram). Diagrams always comprise the data of one complete test run.
It can be observed from Figure 6 that the DE3 bus diesel-fueled CI engine is operating mostly in the range between 900 min−1 and 1500 min−1 and cyclic fuel deliveries up to 180 mg. Higher loads are also present at lower engine speeds, which is favorable for lowering fuel consumption and which is made possible due to optimized gearbox shifting strategy.
As expected, the cyclic fuel delivery vs engine speed diagram (Figure 6) for the CNGE5 bus differs from those obtained with diesel-fueled CI engine buses. Lower maximum torque curve at lower engine speeds of SI engine compared to CI engine prevents automatic transmission control strategies that would enable engine operation at higher loads and lower engine speeds being favorable for lower engine mechanical losses and better fuel economy. Engine speed and load of the CNGE5 engine thus simultaneously follow the requested power demand.
It can be seen from Figure 6 that most of the engine operation of the DE5 bus operating in hybrid mode with power limiter on was concentrated between 600 min−1 and around 1350 min−1, and that the limiting engine speed 1800 min−1 was hardly ever exceeded. The hybrid controller tends to operate the engine more frequently at lower speeds and higher loads due to the favorable engine efficiency. Such an effective operation is made possible due to the availability of the second hydraulic hybrid power source (see Figure 1), high pressure hydraulic accumulators that are energized in parallel. However, in practice suboptimal designed topology, component sizing, control strategies and inadequate component efficiency of hybrid powertrain results in higher fuel consumption (Table 2) despite frequent operation in high efficiency area of the engine. Turning the power limiter off (Figure 6) results in lower loads and higher engine speeds operation that increases overall fuel consumption.
4.3. Exhaust Gas Emissions Time Traces
Time traces of exhaust gas emissions measured during the same time intervals presented in the previous section (Figure 5) are presented in this section to provide more comprehensive insight into cumulative results. Time traces must be analyzed cautiously, since cumulative emissions depend on emitted concentration of pollutants as well as total exhaust flow. Therefore, pollutants mass emissions do not necessarily correlate with exhaust emission concentration. This is prominent especially at low loads with SI and CI engines where exhaust flows are typically different.
4.3.1. Carbon Dioxide (CO2)
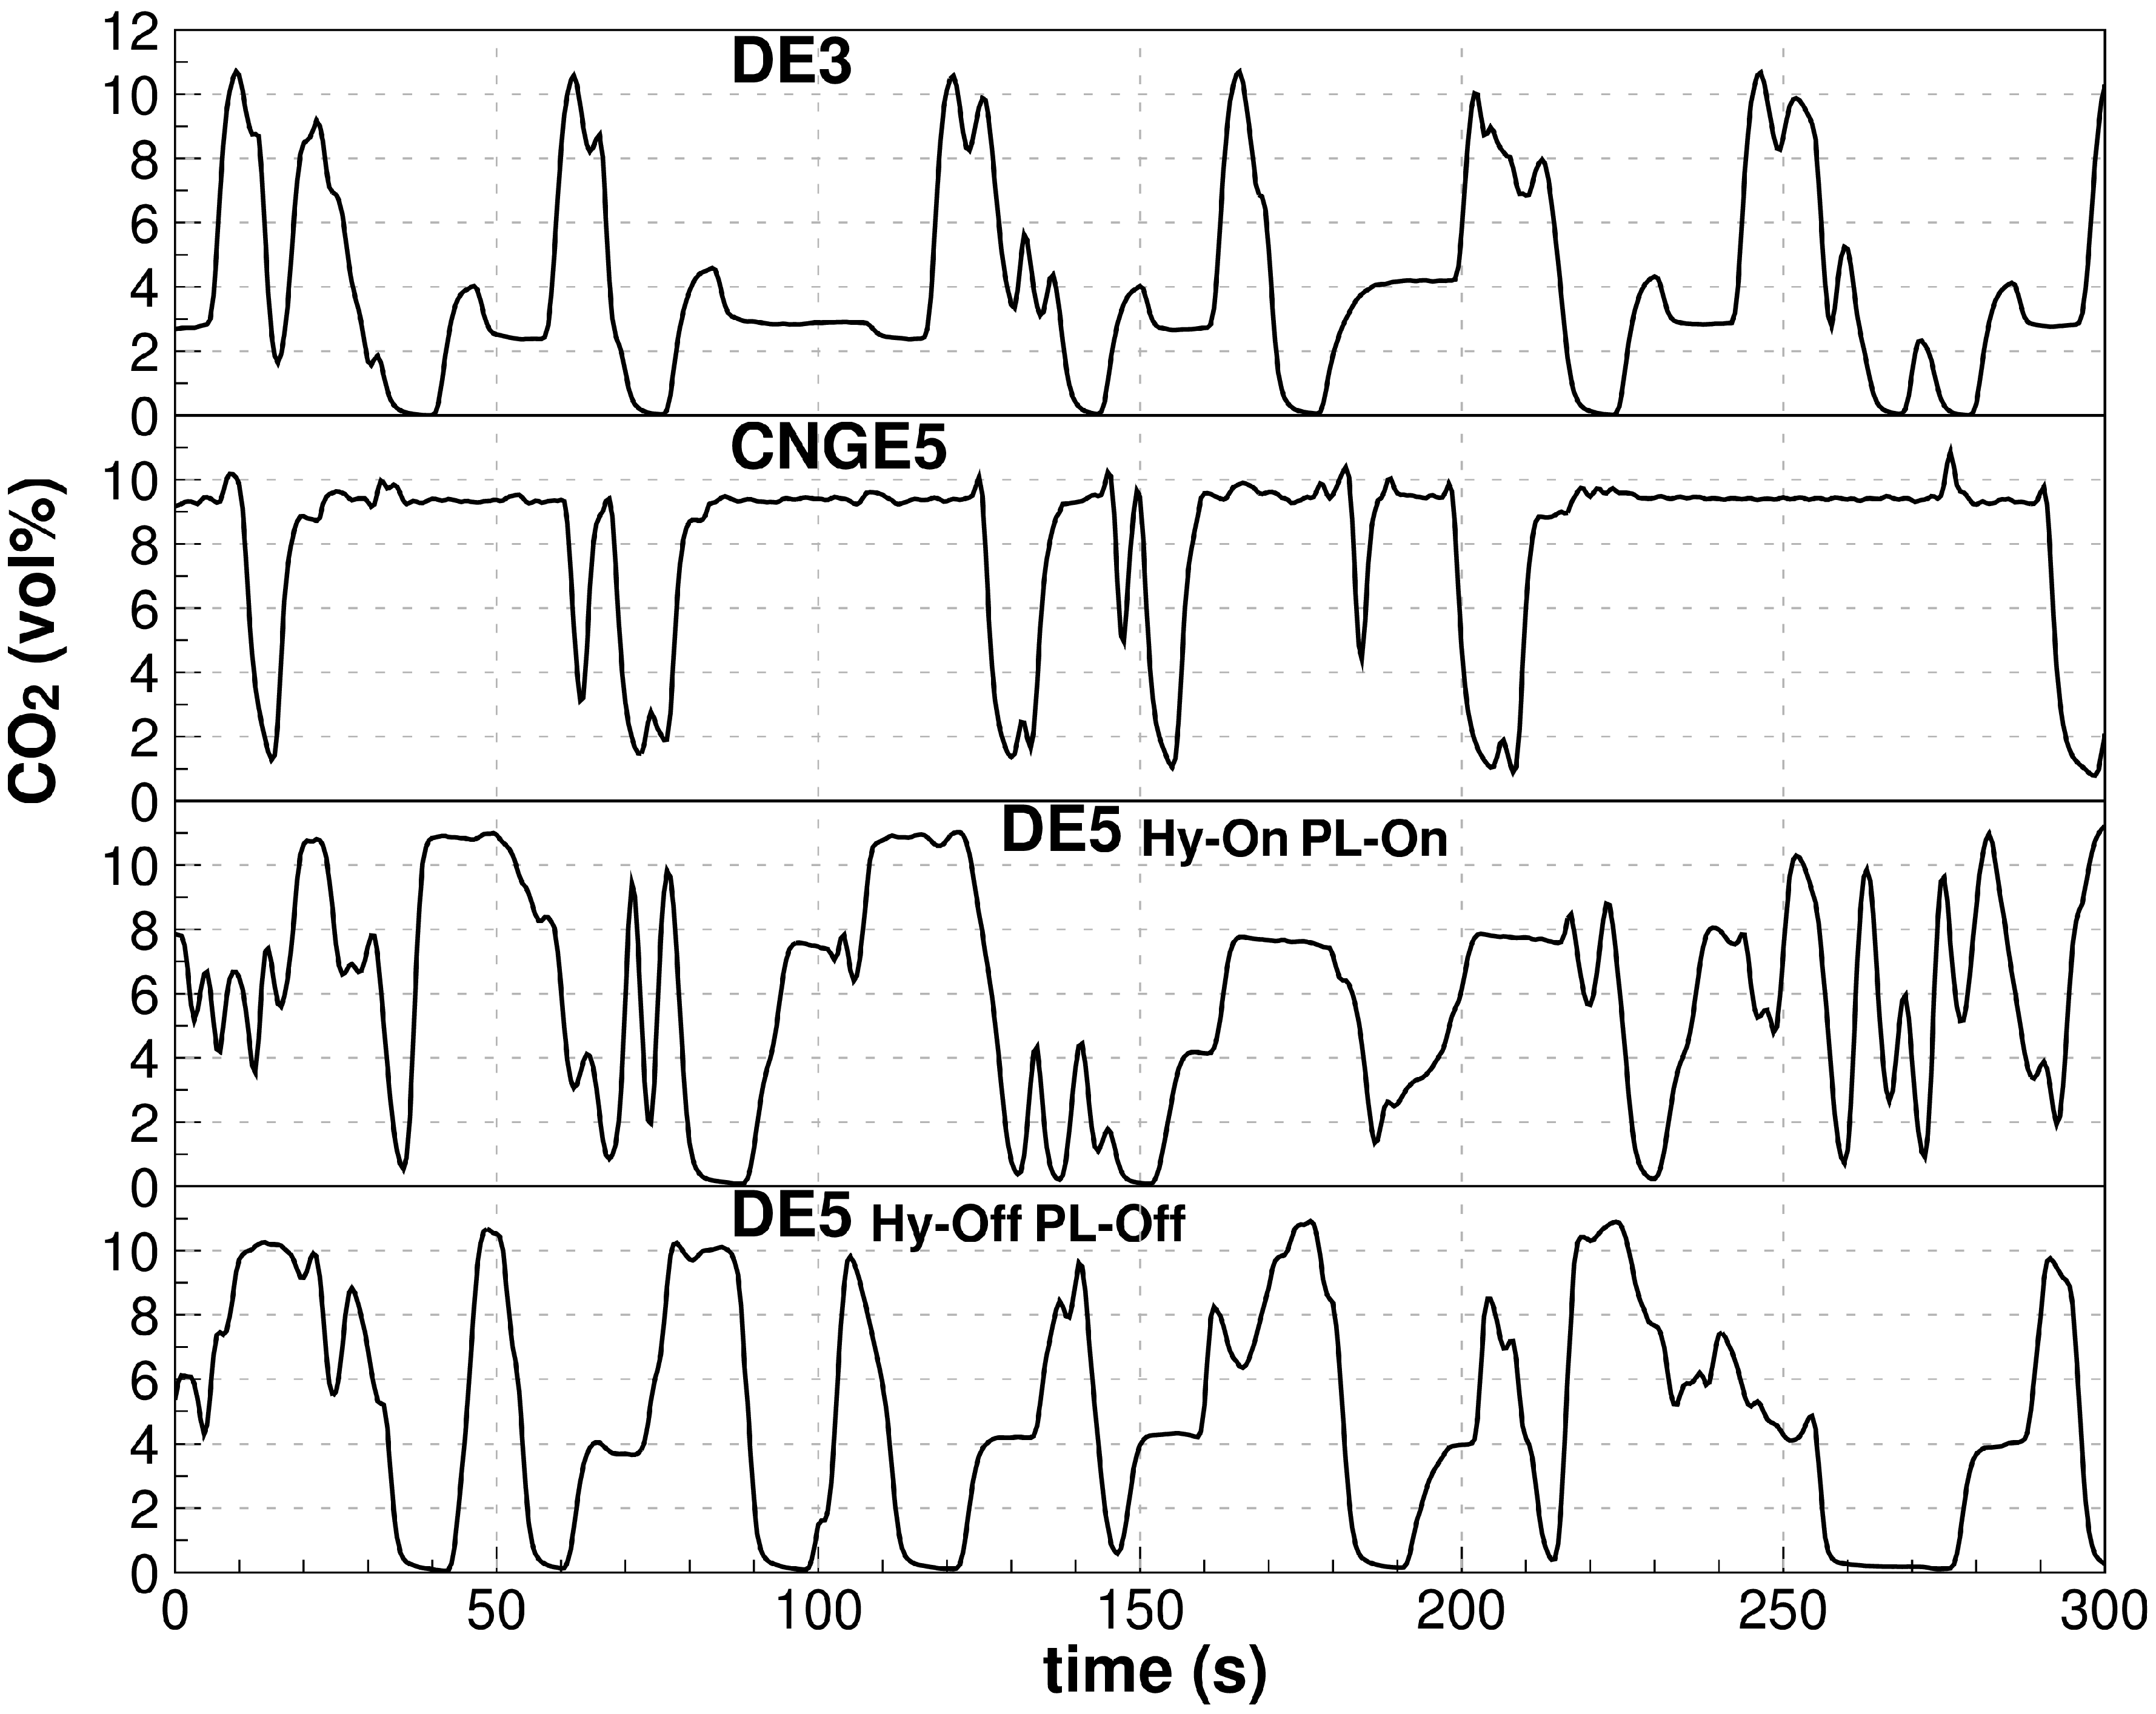
Typical CO2 time trace for the DE3 bus with CI engine is presented in Figure 7. CO2 concentration spans between 3 and 11 vol% which corresponds to idling and high engine load respectively and which further corresponds to high and low lambda value in these operating modes. CO2 concentration drops to zero only in the case of full deceleration, when the fuel is cut off, e.g., between 60 s and 70 s.
CO2 emissions traces are shown for non-hybrid operation with power limiter turned off for DE5 bus with CI engine (Figure 7). Here, similar trends to a conventional DE3 bus with CI engine can be observed with the DE5 bus, which operates as series hydraulic powertrain. Thus, the CO2 concentration is spanned between 4 vol% at idling and 11 vol% at high-load conditions. Zero CO2 emissions can be again observed only during full decelerations, e.g., between 50 s and 60 s. CO2 traces of the DE5 bus in hybrid mode with power limiter turned on are also shown in Figure 7. It is discernible from the figure that in this case the engine is operating at higher loads for longer time periods to provide the power for hydraulic energy accumulation. That results in longer intervals of increased CO2 concentrations, e.g., between 160 s and 180 s or 200 s and 220 s, which are linked to higher loads, yielding also higher effective engine efficiency. The engine almost never operates in idling mode.
CO2 trace from the CNGE5 bus (Figure 7) is, on the other hand, typical for SI engines that run with stoichiometric homogeneous charge with approximately 9.5 vol% CO2. During decelerations the fuel is cut off and the corresponding CO2 concentration drops towards 0.
4.3.2. Carbon Oxide (CO)
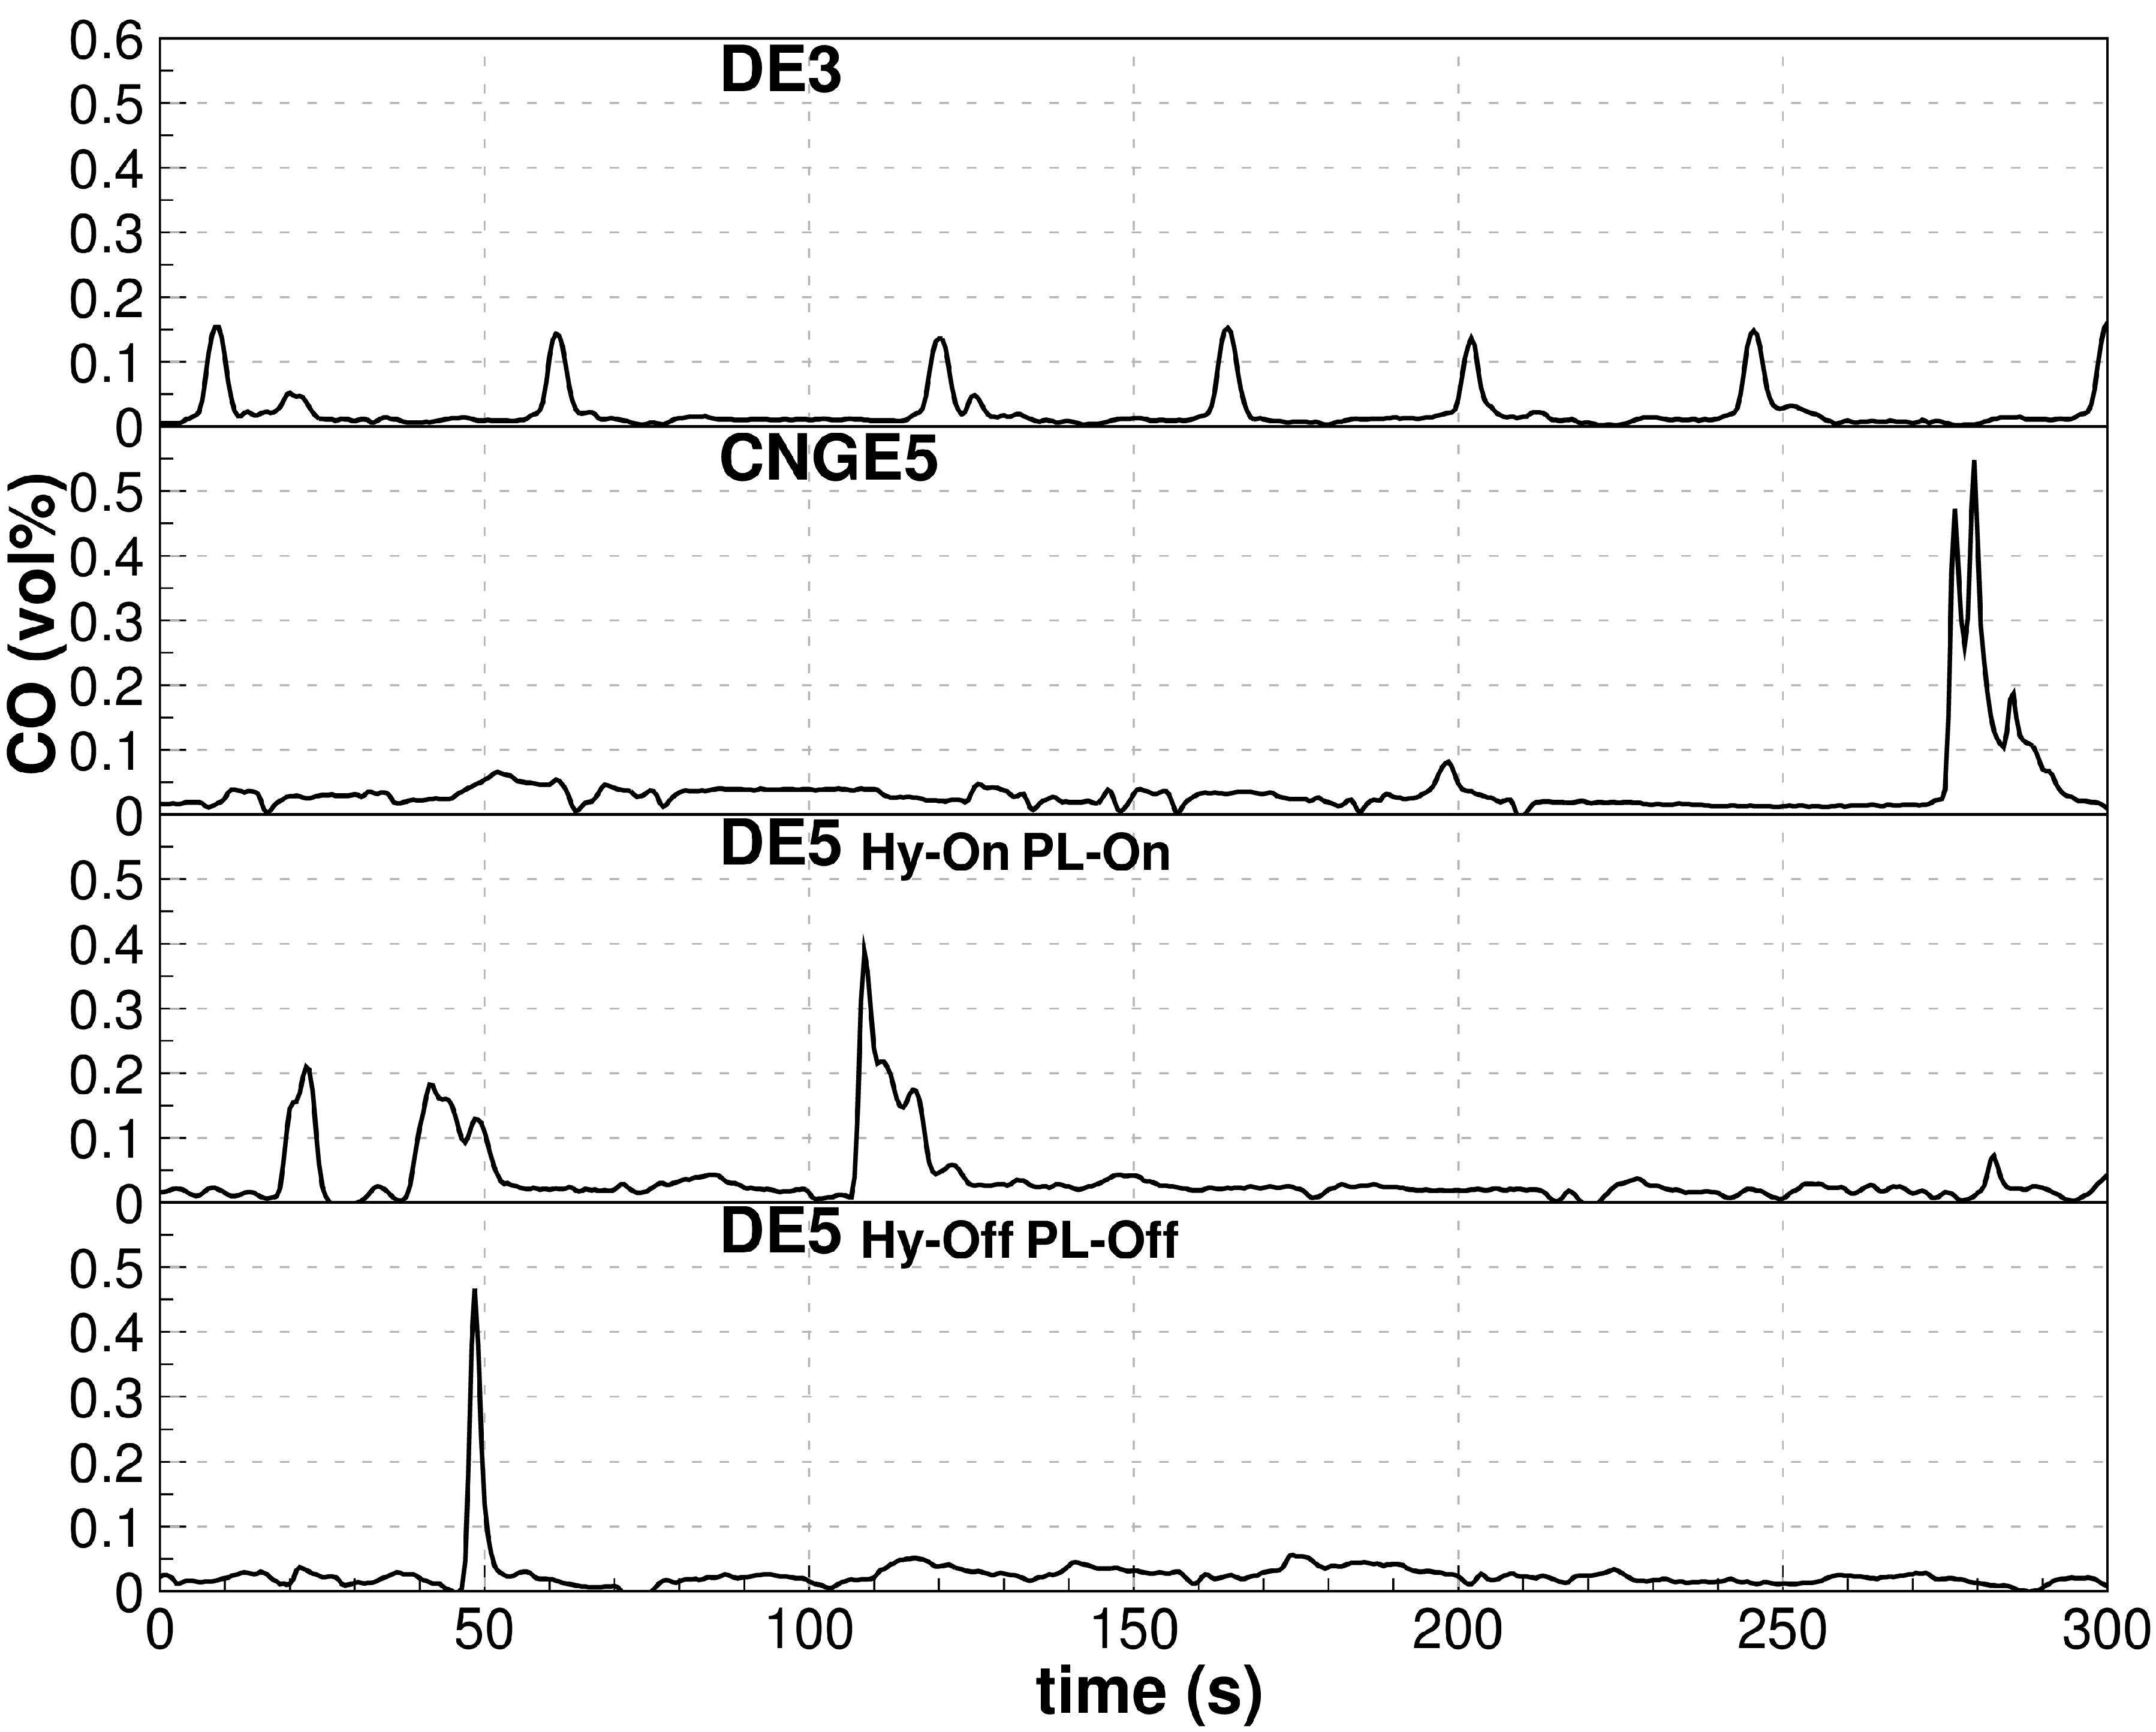
The differences between buses can be observed when time traces of CO emissions in Figure 8 are analyzed. It is discernable that CO emissions of the DE3 bus are elevated during accelerations (e.g., between 60 s and 70 s) due to turbo lag and temporarily lower lambda value but CO emissions seldom exceed 0.15 vol%. However, reoccurring peaks of CO concentrations and lack of any exhaust gas aftertreatment systems result in relatively high cumulative emissions (see Table 3).
Even higher CO emission levels can be observed with the CNGE5 bus (Figure 8) where large peaks up to 0.6 vol% of CO concentration are observed in some acceleration periods (e.g., between 270 s and 290 s). These peaks reveal the importance of adequate lambda control, as these CO peaks most likely coincide with rich engine operation. The pressure regulator for the natural gas supply is designed in a way to deliver the gas at constant pressure difference between regulator gas outlet and intake manifold pressure, and thus CO peaks can be attributed to fast transient regimes when the pressure regulator is not capable of maintaining constant pressure difference during rapid increase of intake manifold pressure and enters rich air fuel operation. This conclusion is also in line with the known fact that accurate injection quantity is harder to achieve with gaseous fuels due to their higher compressibility compared to liquid fuels. Consequently, average CO concentration level of the CNGE5 bus is higher during normal operation compared to the DE3 bus. Both contributions lead to the highest cumulative CO emissions of the CNGE5 bus among compared buses and driving modes.
Lower cumulative CO emissions were detected during hybrid operation of the DE5 bus (Figure 8). However, CO time trace reveals frequent increases of the CO concentration, which can be attributed to longer periods of operation with high loads and consequently with lower lambda values (e.g., between 100 s and 120 s). This statement can be confirmed by additionally observing Figure 5 and Figure 7 where it is discernable that high engine speed operating segments that coincide with the highest CO2 concentrations also yield high CO concentrations. The occurrence of CO concentration peaks is lower in non-hybrid mode operation of the DE5 bus (Figure 8). This is in line with lower required loads and consequent higher lambda values of the CI engine of the DE5 bus operating in the non-hybrid mode. Despite this fact, the average level of CO concentrations is lower in hybrid mode due to engaged power limiter resulting in lower engine powers and thus lower exhaust gas flows (Table 3).
If the CO emission results of the present study are compared to the results published by Reference [14], three times lower cumulative CO emissions of comparable diesel EURO III bus, compared to DE3 bus CO emissions, were reported. Additionally, 1.5 times lower CO emissions were measured from the CNG EURO III bus equipped with TWC compared to the CNGE5 bus [14]. At least some of the discrepancy can be explained by higher power demand in real-world conditions compared to two duty cycles driven on chassis dyno that provided almost identical results [14].
4.3.3. Total Hydrocarbons (THC)
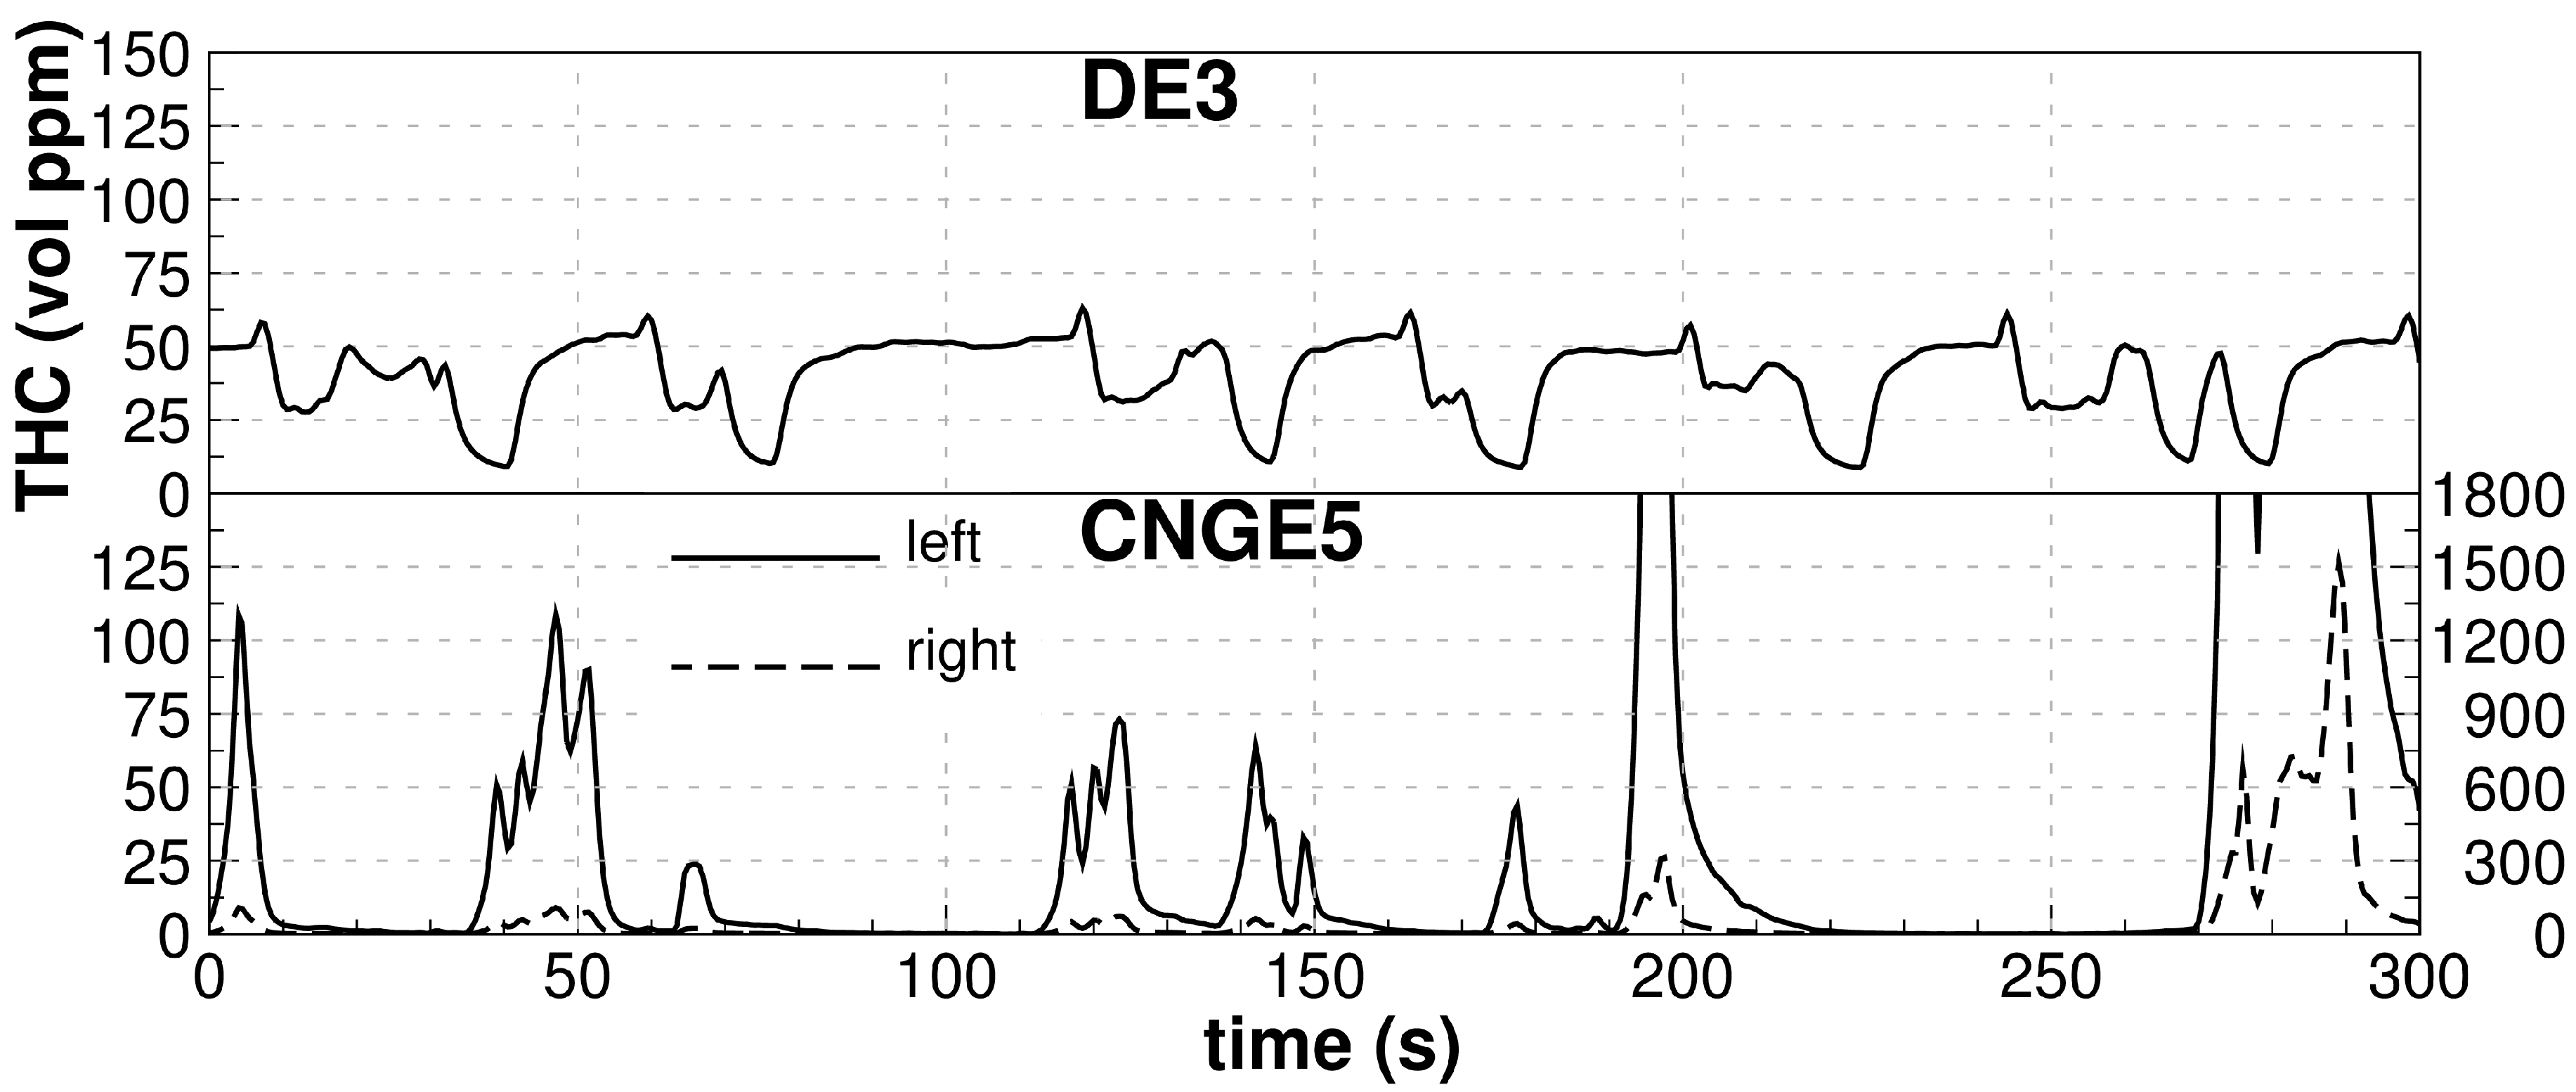
The CI engine of the DE3 bus emits cumulatively approximately only half of the THC emitted by the SI engine of the CNGE5 bus (Table 3). This is to some extent surprising, since allowed THC limit for the M3 class diesel-powered EURO III vehicles is approximately four times higher than for the M3 class natural-gas powered EURO V vehicles. Figure 9 presents THC emission time traces for the DE3 and CNGE5 buses. Due to very low THC emissions of the DE5 bus, the THC emission time traces are not presented, as already explained in Section 4.1. THC emissions for DE3 lie below 60 vol ppm and drop towards zero during fuel cut-off periods.
Figure 9 presents THC time traces for the CNGE5 bus on two scales. It can be seen that THC emissions reach values up to 1500 vol ppm during acceleration (between 270 s and 300 s), which also coincides with high CO emission periods (Figure 8). This is again (see Section 4.3.2.) associated with rich in-cylinder air fuel mixture and inadequate lambda control during some transient engine operation, since extreme increase of CO and THC emissions is not typical for all accelerations (see Figure 4 and Figure 5) and is, to the best of our knowledge, the first time this has been shown for real-world operation of a CNG-powered bus. Furthermore, tailpipe out emissions are not much lower than the engine-out emissions in these operating modes as their conversion in the TWC is very low due to lack of oxygen in the combustion products of the rich air fuel mixture. During idling and deceleration THC emissions of the CNGE5 bus are far below average DE3 bus emissions. Compared to findings in this study, twofold higher THC emissions were reported for the CNG-powered bus with comparable engine technology driven on chassis dyno [14]. Almost identical THC emissions were reported for the comparable diesel-powered EURO III bus [14].
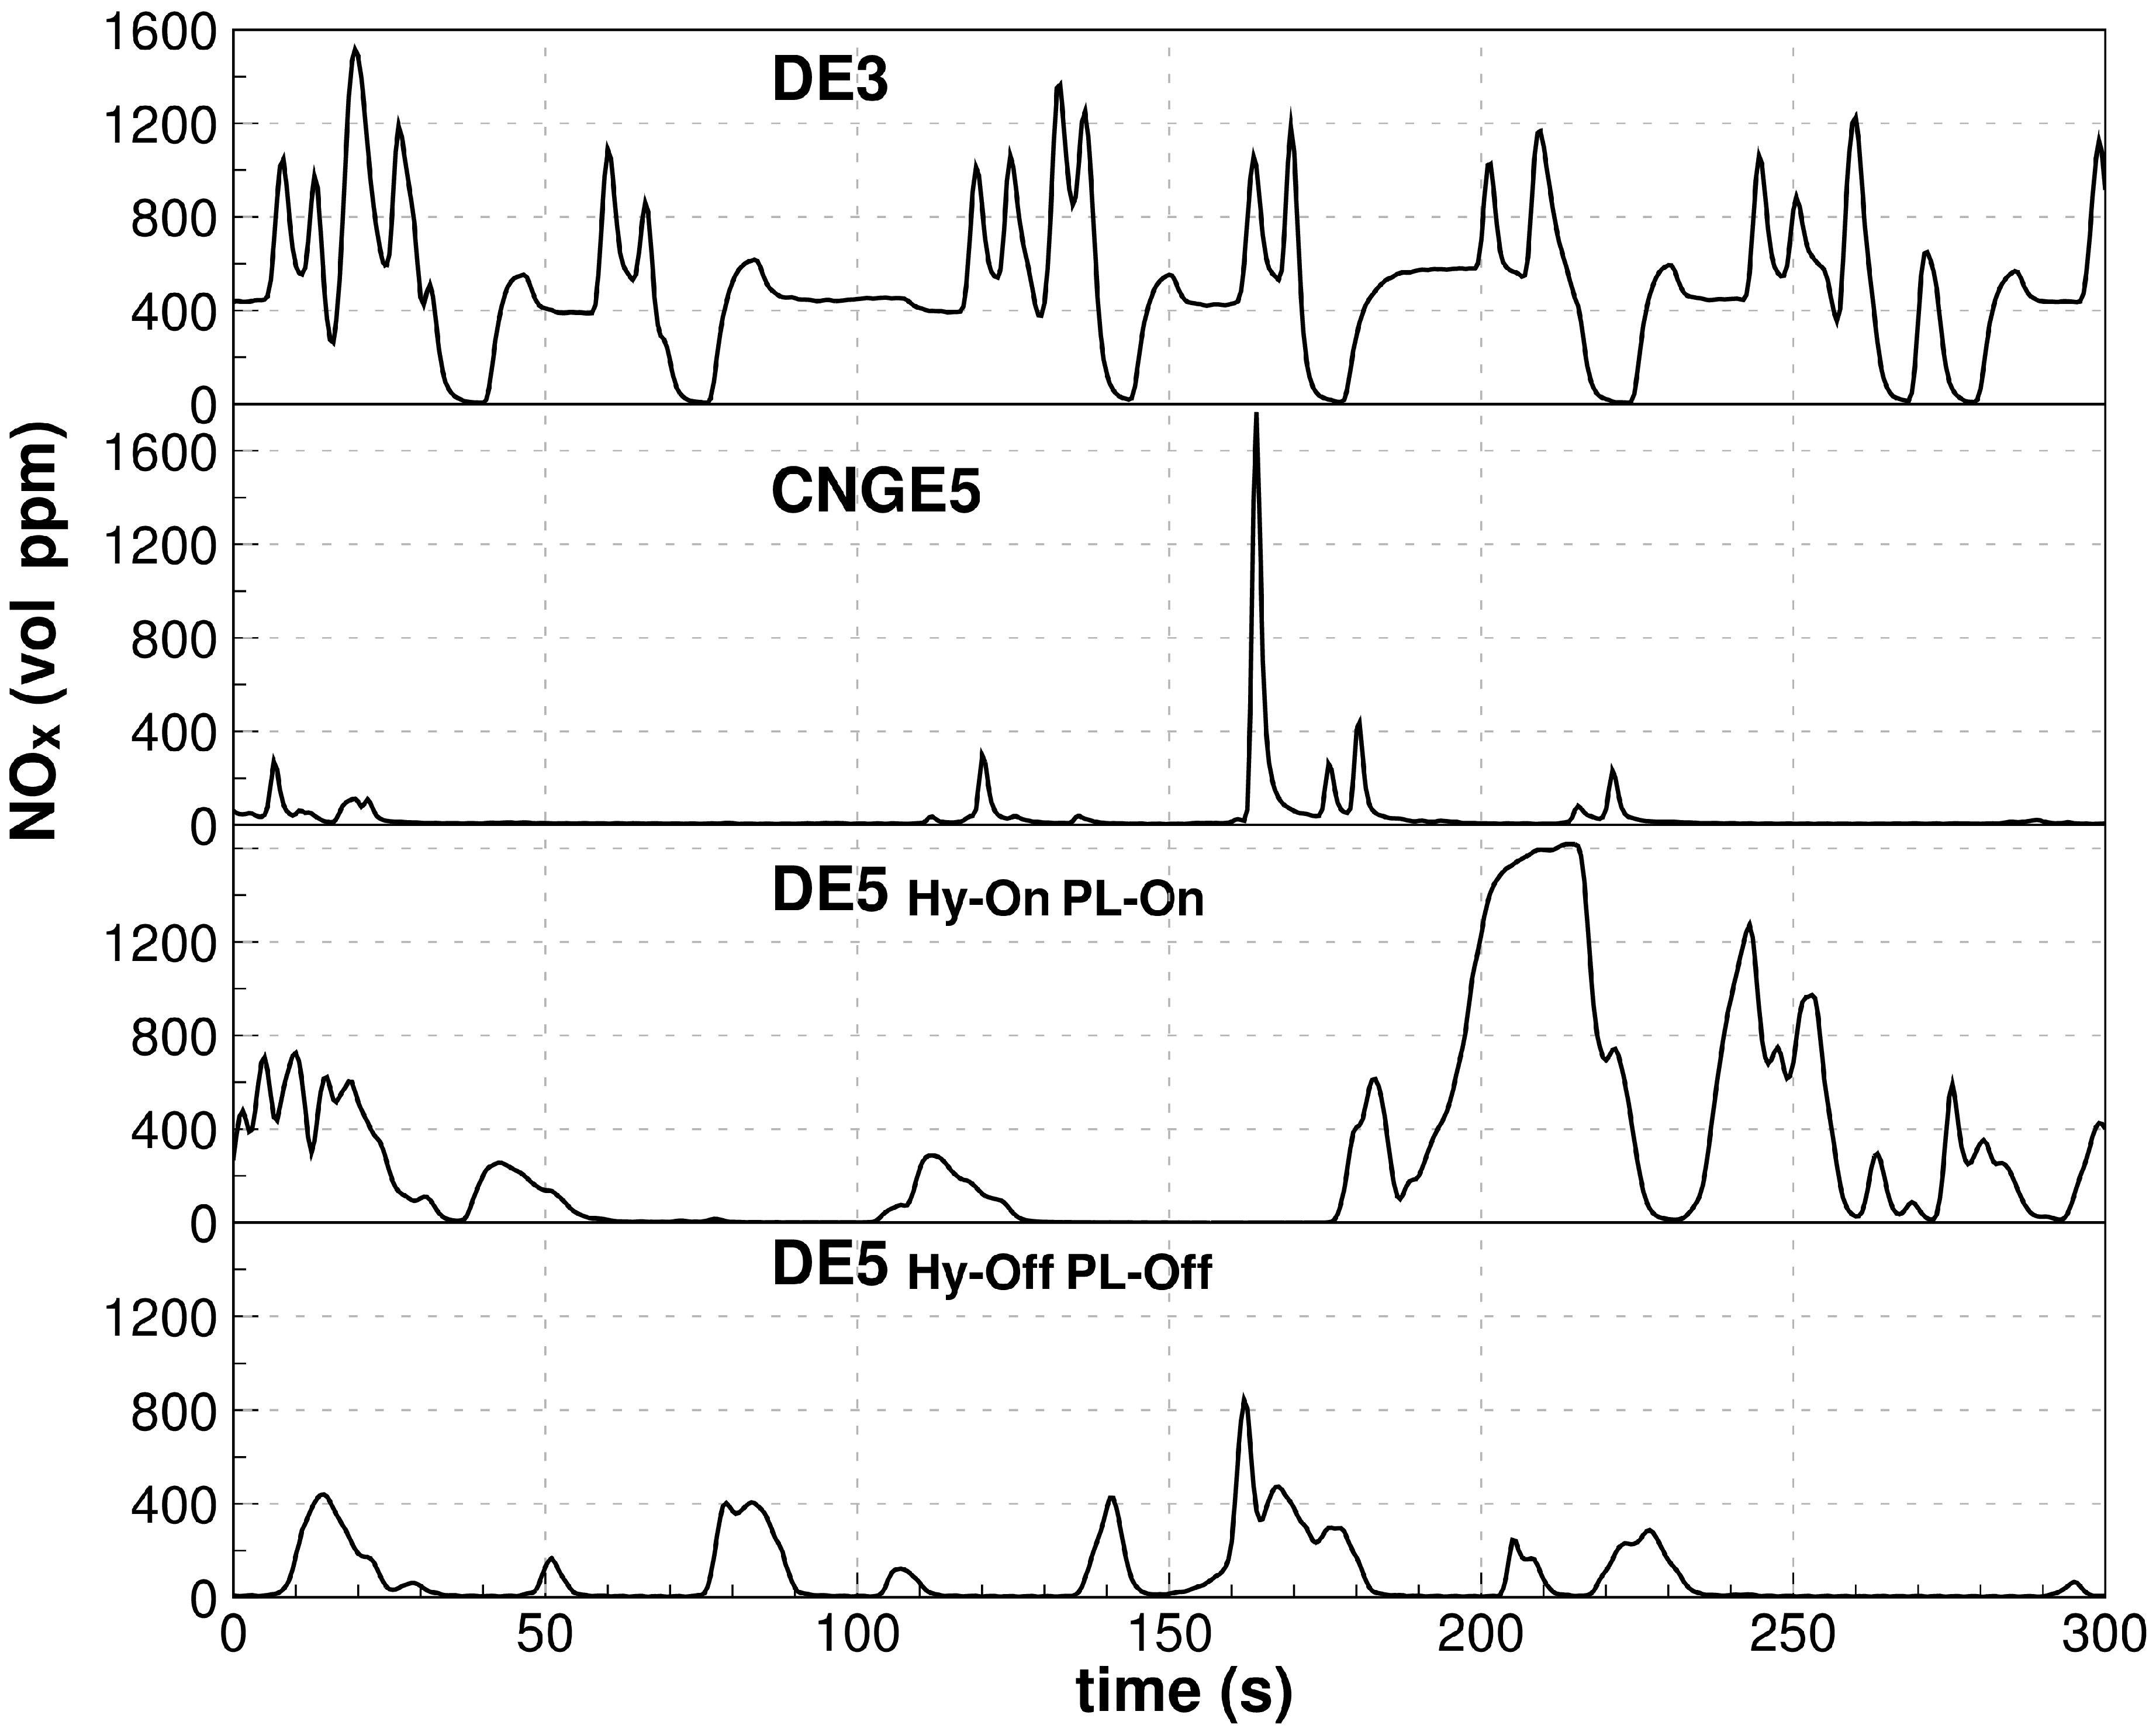
4.3.4. Nitrogen Oxides (NOx)
Figure 10 presents NOx concentration time trace of the analyzed buses. Approximately 400 vol ppm of NOx are emitted during idling of the DE3 bus, thus contributing a non-negligible share of the total cumulative emissions. Furthermore, engine-out NOx emissions are not further reduced in the DE3 bus due to missing NOx aftertreatment device, which is present only in the DE5 bus (SCR) and the CNGE5 bus (TWC). Considerable increases of the NOx concentration are typical for higher engine loads during the bus accelerations (e.g., between 120 s and 140 s) where higher power demand results in higher in-cylinder temperatures, which again correlates well with increasing engine speed and CO2 concentrations (see Figure 5 and Figure 7). Maximum concentration of NOx amounts to 1600 vol ppm in the DE3 bus.
It is discernable from Figure 10 that expectedly higher NOx concentrations are characteristic while operating the DE5 engine at higher loads in hybrid mode. Maximum values of NOx concentrations of the DE5 bus are comparable with DE3 bus (e.g., between 200 s and 220 s) indicating that SCR system is not designed in a way to ensure high NOx conversion rates at high engine powers, which can be linked to the fact that the DE5 bus is constructed on modified truck chassis that was originally not designed for city bus use. Moreover, relatively low average temperatures of exhaust gases yielding low temperature of exhaust aftertreatment devices of the DE5 bus that result from long idling times (see Figure 4) being inherent to city bus operation additionally lower conversion efficiency at shorter high-load periods. In contrast, almost zero NOx emission can be observed during idling of the DE5 bus (equipped with EGR+SCR) that feature distinctly lower NOx emissions compared to the DE3 bus (equipped with EGR) (see Table 4).
When analyzing NOx emissions of the CNGE5 bus, it can be concluded that most of the time TWC yields very high NOx conversion efficiency. Very short intervals of high NOx concentrations (e.g., between 160 s and 170 s) are typical only for the first part of the bus accelerations and can be attributed to short periods of lean mixture combustion, which is also confirmed with low CO values (Figure 8). However, these short-lasting peaks do not significantly increase the cumulative mass emission of the CNGE5 bus.
Figure 10 also indicates that the highest NOx concentrations are similar for all three buses. Their distributions and durations, on the other hand, are different. Resultantly, cumulative NOx emissions of the CNGE5 bus are 10 times lower compared to NOx emissions of the DE5 bus as can be seen from Table 4, since occurrence of high concentrations is less frequent with the CNGE5 bus, as explained in the previous paragraph, and also due to lower exhaust mass flow inherent to engines with stoichiometric combustion.
Presented cumulative NOx emissions results are in line with findings presented in Reference [16], as well as when the emission results are compared quantitatively. Unlike findings presented in this study, no significant differences between the NOx emission rate between buses operating on the two analyzed types of fuel at four steady engine loads were observed. However, it has to be noted that some of the tested CNG-powered buses were equipped with only a two-way catalyst, and emission rates varied widely with CNG buses [15]. Hallquist et al. [17] reported even higher NOx emissions with CNG buses, where big scatter of the results was observed. According to References [28,29], THC and NOx conversion efficiency of a TWC converter tends to degrade fast when CNG is used as a fuel. This can be recognized as an important factor for elevated NOx emission results reported by References [15,17], where the latter authors suggested that variability of maintenance and variation of CNG quality between buses could be the cause for higher NOx emissions with big scatter.
4.3.5. Particle Mass (PM10)
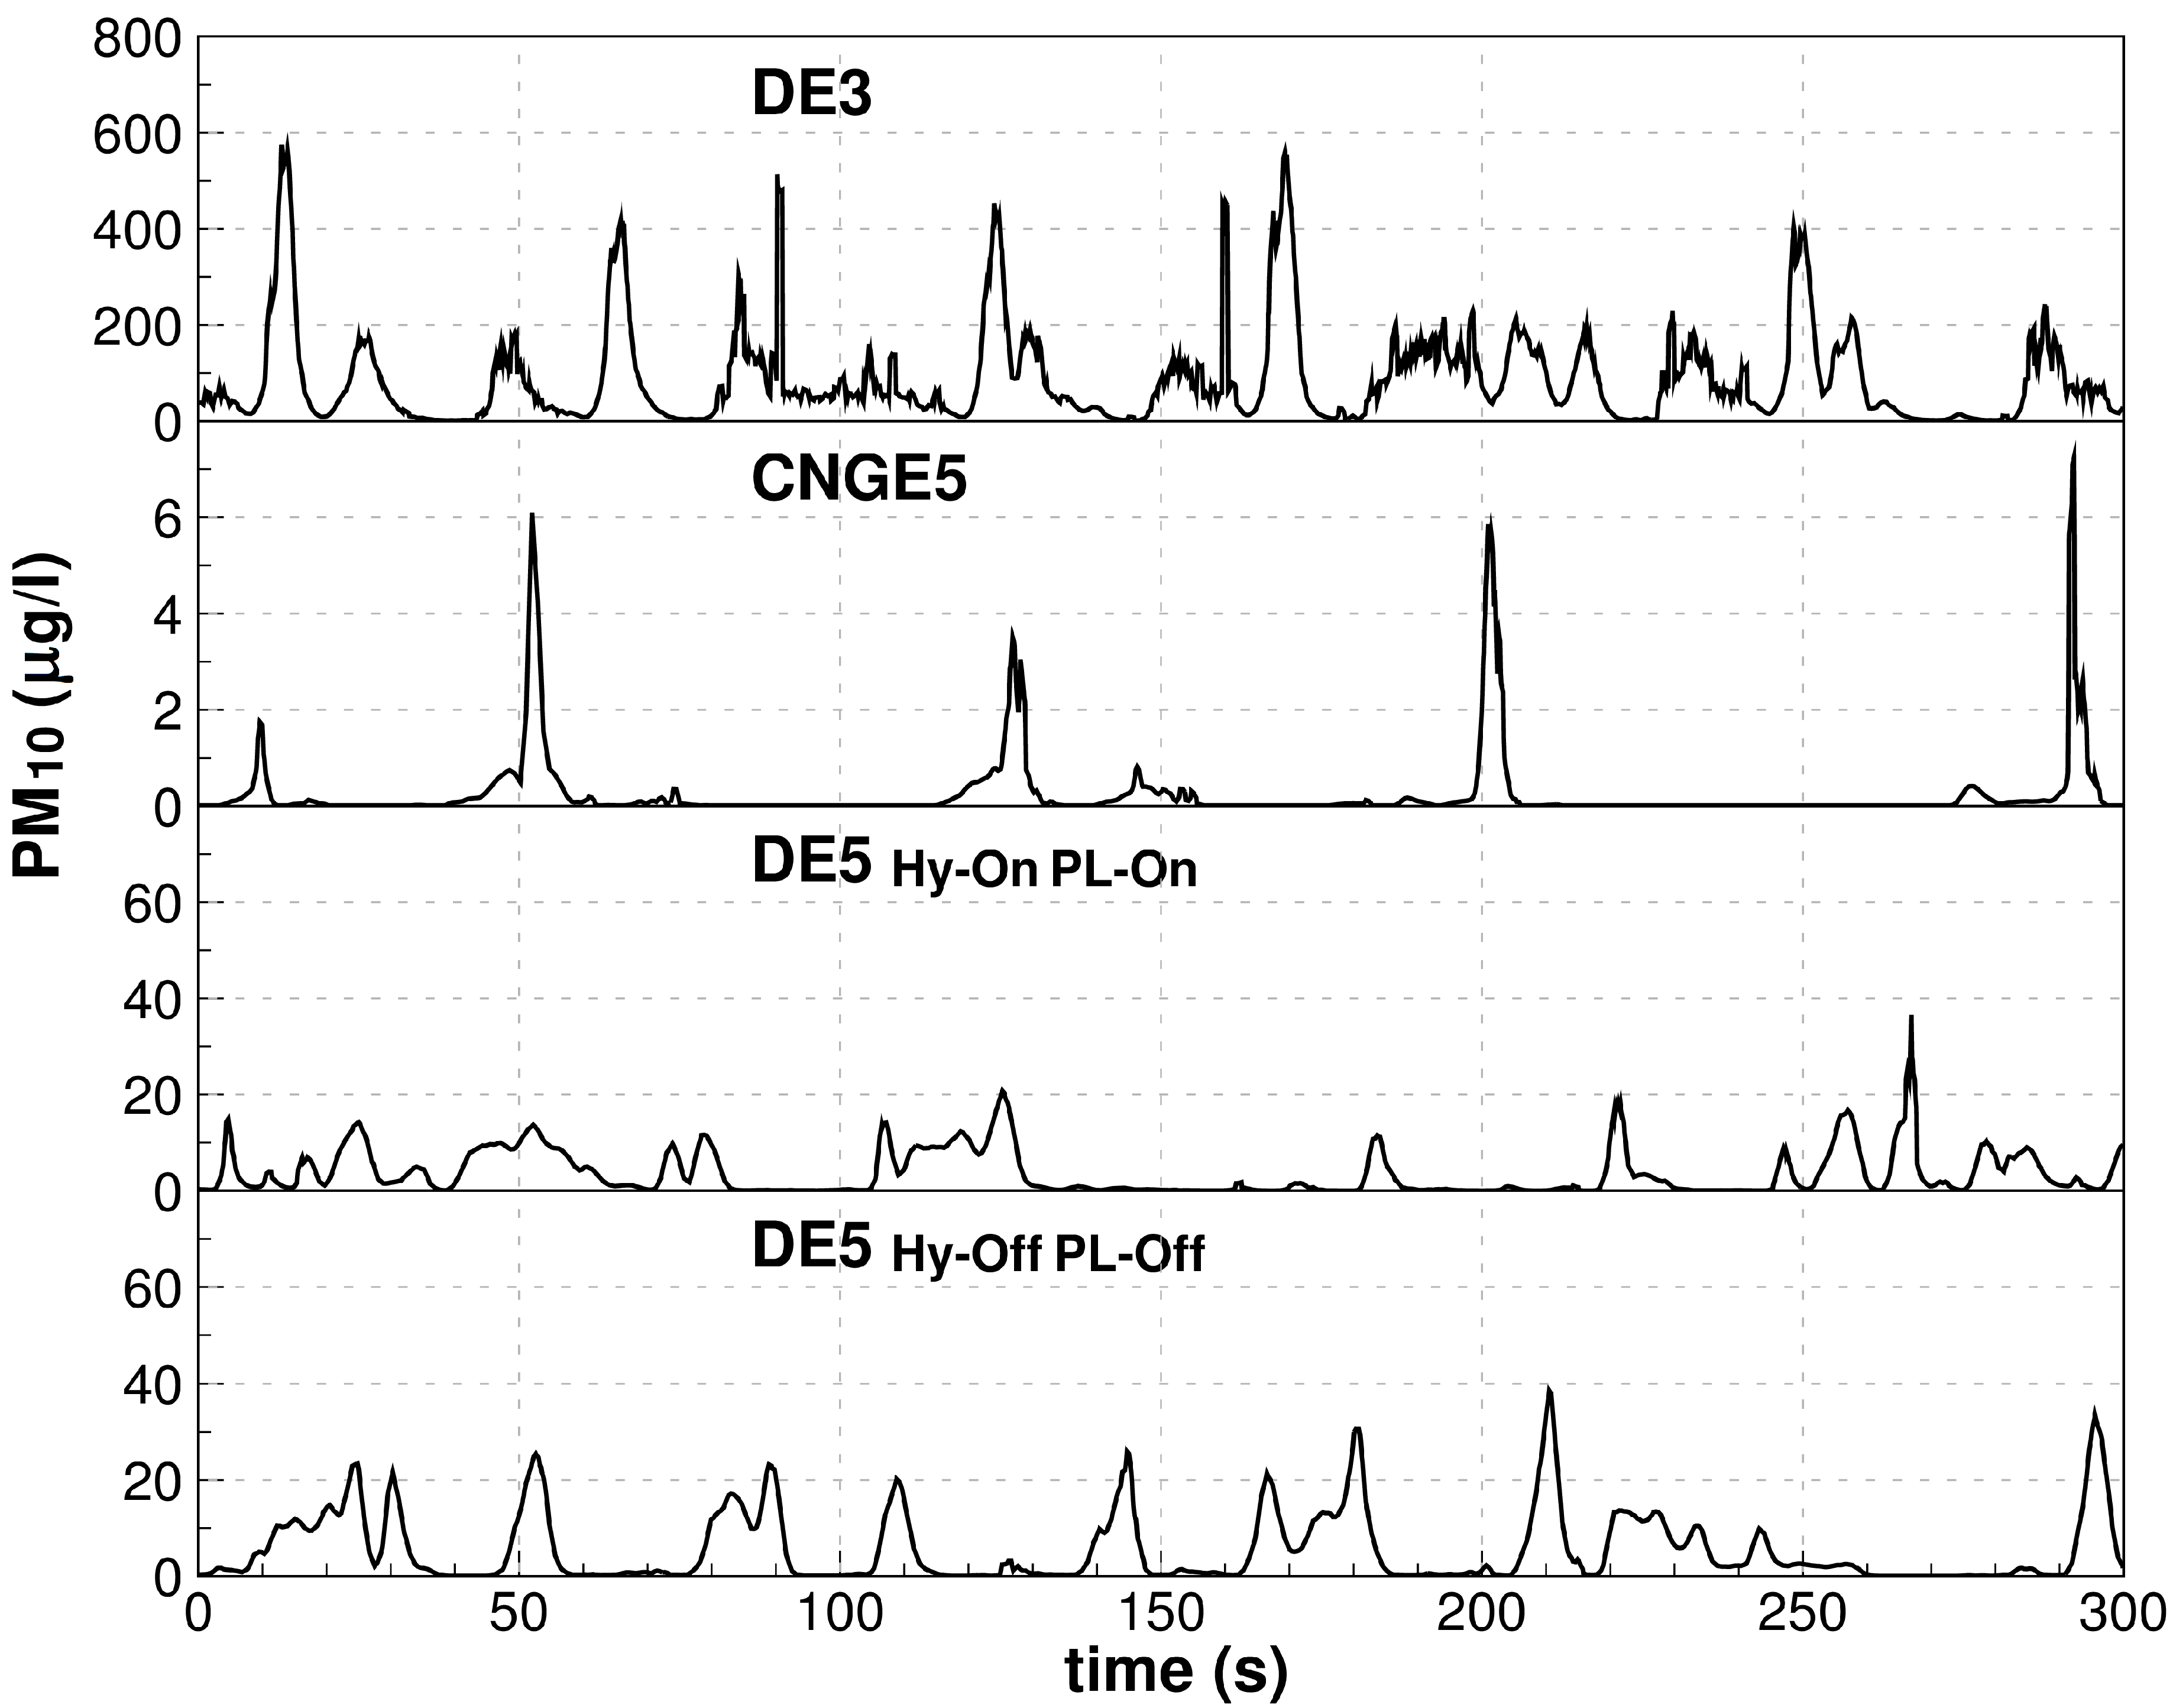
The most pronounced difference in the emitted pollutants between the three observed buses is, as expected, observed for PM10 mass emission rates. The CI engine of the DE3 bus emits up to 500 μg/L PM10 as can be seen from Figure 11 (e.g., between 10 s and 20 s). The highest values correspond to transient operation of the engine during load increase from idling to the highest engine loads (see Figure 5 and Figure 7). During this period, increased power demand and turbo lag result in lower lambda value that creates favorable conditions for the formation of particles.
Due to well-known PM10-NOx trade-off, SCR installed on the DE5 bus allows for shift towards higher engine-out NOx emissions and thus towards higher in-cylinder combustion temperatures being favorable for lower PM10 generation (see Figure 11). In non-hybrid operation and power limiter turned off, the engine operates more often at lower lambda values (see Figure 7), which can be related to frequent large variations of engine speed (see Figure 5) resulting in more pronounced turbo lagging and thus higher cumulative PM10 emissions. As can be seen from Table 4, turning on the power limiter—which limits the engine speed—has positive effect on PM10 emissions whereas operation in hybrid or non-hybrid mode does not affect cumulative PM10 emissions. Maximum values for the DE5 bus instantaneous PM10 emissions are approximately 10 to 20 times lower compared to those obtained with the DE3 bus for both operational modes (see Figure 11).
Very low, almost negligible, PM10 mass emissions in the exhaust gases of the CNGE5 bus are characteristic for the spark ignited combustion of the homogeneous charge, and are presented in Figure 11. This engine does not feature rich air fuel zones that are typical for non-homogeneous combustion and which are, in combination with appropriate temperature interval, cause for soot formation. On the other hand, an order of magnitude smaller nucleation mode particles form in the CNGE5 bus engine with homogeneous charge combustion that, due to their small size, do not contribute much to PM10 mass emission. However, the particle number emission can be at the same time high and will be addressed in the next section.
In comparative studies, CNG fueled SI engine buses tested on chassis dyno [14,15], and CNG fueled SI bus engines tested on engine dyno [16], also produced order of magnitude smaller PM10 emissions than diesel-fueled CI engine buses and diesel-fueled CI bus engines, whereas reported difference is smaller compared to the real-world results presented in the study reported in this paper. On the other hand, PM10 results presented in this study are aligned in terms of PM10 emission relations between analyzed fuels and emission standards with the results presented in the study where buses were tested by measuring curbside emissions [17]. Another study reports that measurements of six heavy-duty diesel-powered vehicles, all equipped with diesel particle filter, and one heavy-duty CNG-powered vehicle with TWC showed that PM10 emissions of both types of vehicles are on the same level [30]. The advantage of lower PM10 emission of CNG-powered vehicles compared to EURO III and EURO V diesel vehicles becomes therefore less relevant with purchases of new vehicles since EURO VI heavy-duty diesel-powered vehicles are mostly equipped with DPF.
4.4. Detailed Analysis of Particle Emissions from CNGE5 Bus
As already pointed out in the previous section, PM10 emissions for the CNGE5 bus are negligible. Nevertheless, peaks of increased PM10 emission (Figure 11) can be observed and can be contributed to deceleration mode where fuel is cut off and combustion is temporally stopped as can be seen from Figure 7 (e.g., between 200 s and 210 s and 290 s and 300 s), where CO2 values are dropping towards zero. To the best of our knowledge, this observation has not been previously reported.
This observation opens an important issue. With the throttle valve almost shut at fuel cut off on the CNGE5 bus and the consequent low intake manifold pressure, favorable conditions are established for lubricant oil to be pumped from valve guides to the intake manifold [14] and from engine sump to the cylinder passing the piston rings. Particles are formed through gas-to-particle conversion mostly from lubricant oil. Such particles are nucleation mode particles that are typically defined in the 1–30 nm range [31]. Compared to diesel-fueled CI engine particles that are usually an order of magnitude larger (range from 70–90 nm), smaller particles of the CNG SI engine do not contribute much to particle mass emissions. However, particle number emission is nevertheless high. It has been already reported that during bus acceleration, the number of particles emitted from CNG fueled SI engine was observed to be an order of magnitude higher compared to diesel-fueled CI engines without DPF [17]. This study additionally reasons that emphasis should be also devoted on particle number during deceleration. This finding is in line with findings presented in Reference [32], where the author points out that under low load and motoring engine operation, hydrocarbons originating from engine oil prove to be the main contributor to particle emissions. The effect of very small particles (10 nm) that can, due to their non-solid nature, penetrate and dissolve in blood through the lungs is not yet clear from a health point of view [14].
5. Conclusions
Global climate change caused by anthropogenic air pollution has led to ambitious agreements (the most recent one adopted in Paris, 2015) to cut greenhouse gases emissions, especially CO2. Additionally, in cities exhaust emissions of public transport bus fleets influence air quality locally. New powertrain technologies are available that offer the potential to reduce harmful emissions and operational costs. Evaluation of those technologies in real-world operation is of crucial importance when city authorities are pursuing maximum benefit cost ratio.
Instantaneous gaseous and PM10 mass emissions as well as several powertrain parameters of three different buses applying different emission standards and fuels were measured in real-world conditions: conventional EURO III diesel bus, CNG-powered EURO V bus and diesel-powered hydraulic series hybrid EURO V bus. Results were analyzed and mechanisms that affect formation of harmful exhaust emissions explained based on powertrain parameters and deeper understanding of the in-cylinder thermodynamic and combustion processes.
Results indicate that the CNG-powered bus features lower efficiency of the SI engine compared to diesel-powered buses, resulting in comparable CO2 emissions. Higher energy demand of CNG buses is economically offset by lower fuel price resulting, in the case of Slovenia, in the lowest fuel cost.
As expected, the CNG-powered bus proved to have the lowest PM10 and NOx emissions. Measured PM10 mass and NOx emissions of the EURO V CNG bus were an order of magnitude lower compared to the emissions of the EURO V diesel bus. Results indicate that the introduction of CNG-powered buses as a replacement for the existing older diesel-powered buses could considerably contribute to lower PM10 mass emissions and NOx pollution in urban areas. This is especially true for NOx pollution in urban areas, since the majority of EURO VI diesel-powered heavy-duty vehicles are equipped with DPF, which has proven to be an efficient PM10 emission reducer. It was innovatively shown in real-world conditions that increased PM10 mass emissions that take place during decelerations of CNG-powered bus raise some concerns on nucleation mode generated particles, which might—despite their low mass—feature very high number of particles.
Additionally, occasional inadequate lambda control of the CNG bus during transient regimes results in instantaneous, local rises of THC and CO emissions and consequently cumulative emissions are the highest amongst the buses compared here.
It is also discernible from the results that application of hybrid bus technology does not necessarily lead to improved fuel economy of a city bus since it is, to the best of our knowledge, shown for the first time that real-world operation of the series hybrid bus features increased fuel consumption when operated in the hybrid mode. Optimization of hybrid powertrain topology and fine tuning to real-world routes is thus of crucial importance to approach optimal fuel consumption of the hybrid powertrains.
Comparison of NOx and PM10 mass emissions of both EURO V and the EURO III diesel buses shows that a substantial reduction in real-world emissions was achieved applying new, tightened emission standards.
Based on these findings, it can be concluded that, as the average age of the bus fleet in Ljubljana is rather high, any purchases of new buses would contribute to lower harmful exhaust gas emissions. This conclusion is valid for both diesel- and CNG SI engine-powered buses, whereas a decision on diesel or CNG SI engine technology requires detailed multi-objective consideration taking into account actual exhaust aftertreatment layout and control, load-cycle characteristics, gaseous emissions and the trade-off between particle mass and number. The results of this study are a valuable support towards this decision-making process.
Future research work should focus on the influence of different bus routes on the results as well as seasonal variations of ambient and road conditions. Degradation of the exhaust aftertreatment systems with time should also be monitored, since buses use different aftertreatment systems that are subjected to different aging processes.
Author Contributions
S.R.O., T.S. and R.V. conceived, designed and performed the experiments. .R.O., T.S., R.V., M.G. and T.K. analyzed the data and provided their expertise for data evaluation. S.R.O. wrote the paper. T.K., T.S. and M.G. checked and edited the manuscript.
Acknowledgments
This research was funded by EU CIVITAS programme: CIVITAS ELAN; Mobilising citizens for vital cities; grant number TREN/FP7TR/218954/«ELAN«. One of the project goals was to assess different bus powertrain technologies through PEMS campaign.
Conflicts of Interest
The founding sponsors had no role in the design of the study; in the collection, analyses, or interpretation of data; in the writing of the manuscript, and in the decision to publish the results.
References
- Fulton, L.; Mejia, A.; Arioli, M.; Dematera, K.; Lah, O. Climate Change Mitigation Pathways for Southeast Asia: CO2 Emissions Reduction Policies for the Energy and Transport Sectors. Sustainability 2017, 9, 1160. [Google Scholar] [CrossRef]
- Air Quality in Slovenia in 2011. Available online: http://www.arso.gov.si/zrak/kakovost%20zraka/poro%C4%8Dila%20in%20publikacije/KAKOVOST_ZRAKA%202011.pdf (accessed on 31 January 2018).
- Air Quality in Slovenia in 2016. Available online: http://www.arso.gov.si/zrak/kakovost%20zraka/poro%C4%8Dila%20in%20publikacije/Porocilo_2016.pdf (accessed on 31 January 2018).
- CIVITAS Elan. Mobilizing Citizens for Vital Cities—Introductory Brochure. Ljubljana, Brno, Gent, Porto, Zagreb. 2009. Available online: http://civitas.eu/sites/default/files/e-civitas-elan20brochure.pdf (accessed on 31 January 2018).
- Directive 2014/94/EU of the European Parliament and of the Council of 22 October 2014 on the Deployment of Alternative Fuels Infrastructure. Available online: https://eur-lex.europa.eu/legal-content/EN/TXT/PDF/?uri=CELEX:32014L0094&from=EN (accessed on 31 January 2018).
- Dassisti, M.; Carnimeo, L. Net modelling of energy mix among European Countries: A proposal for ruling new scenarios. Energy 2012, 39, 100–111. [Google Scholar] [CrossRef]
- Erlandsson, L.; Almén, J.; Johansson, H. Measurement of emissions from heavy duty vehicles meeting Euro IV/V emission levels by using on-board measurement in real life operation. In Proceedings of the 16th International Symposium Transport and Air Pollution, Graz, Austria, 16–17 June 2008. [Google Scholar]
- Tiezhu, L.; Xudong, C.; Zhenxing, Y. Comparison of fine particles emissions of light—Duty gasoline vehicles from chassis dynamometer tests and on-road measurements. Atmos. Environ. 2013, 68, 82–91. [Google Scholar]
- Achour, H.; Carton, J.G.; Olabi, A.G. Estimating vehicle emissions from road transport, case study: Dublin City. Appl. Energy 2011, 88, 1957–1964. [Google Scholar] [CrossRef] [Green Version]
- Swedish In-Service Testing Program On Emissions from Heavy-Duty Vehicles, Report for the Swedish Transport Agency, Certification & Regulation Compliance. AVL MTC AB: Haninge, Sweden, 2011. Available online: https://www.transportstyrelsen.se/globalassets/global/vag/miljo/hallbarhetsprovning-hdv-2011.pdf (accessed on 31 January 2018).
- He, H.; Guo, J.; Zhou, N.; Sun, C.; Peng, J. Freeway Driving Cycle Construction Based on Real-Time Traffic Information and Global Optimal Energy Management for Plug-In Hybrid Electric Vehicles. Energies 2017, 10, 1796. [Google Scholar] [CrossRef]
- Smit, R.; Ntziachristos, L.; Boulter, P. Validation of road vehicle and traffic emission models—A review and meta-analysis. Atmos. Environ. 2010, 44, 2943–2953. [Google Scholar] [CrossRef]
- Alam, A.; Hatzopoulou, M. Investigating the isolated and combined effects of congestion, roadway grade, passenger load, and alternative fuels on transit bus emissions. Transp. Res. D 2014, 29, 12–21. [Google Scholar] [CrossRef]
- Nylund, N.O.; Erkkilä, K.K.; Lappi, M.; Ikonen, M. Transit Bus Emission Study: Comparison of Emissions from Diesel and Natural Gas Buses. Research report PRO3/P5150/04. 2004. Available online: https://www.cti2000.it/Bionett/BioG-2004-001%20Transit%20Bus%20Emission%20Study.pdf (accessed on 31 January 2018).
- Jayaratne, E.R.; Ristovski, Z.D.; Meyer, N.; Morawska, L. Particle and gaseous emissions from compressed natural gas and ultralow sulphur diesel-fuelled buses at four steady engine loads. Sci. Total Environ. 2009, 407, 2845–2852. [Google Scholar] [CrossRef] [PubMed] [Green Version]
- Turrio-Baldassarri, L.; Battistelli, C.L.; Conti, L.; Crebelli, R.; De Berardis, B.; Iamiceli, A.L.; Gambino, M.; Iannaccone, S. Evaluation of emission toxicity of urban bus engines: Compressed natural gas and comparison with liquid fuels. Sci. Total Environ. 2006, 355, 64–77. [Google Scholar] [CrossRef] [PubMed]
- Hallquist, Å.M.; Jerksjö, M.; Fallgren, H.; Westerlund, J.; Sjödin, Å. Particle and gaseous emissions from individual diesel and CNG buses. Atmos. Chem. Phys. 2013, 13, 5337–5350. [Google Scholar] [CrossRef] [Green Version]
- Centobelli, P.; Cerchione, R.; Esposito, E. Environmental sustainability in the service industry of transportation and logistics service providers: Systematic literature review and research directions. Transp. Res. D 2017, 53, 454–470. [Google Scholar] [CrossRef]
- Centobelli, P.; Cerchione, R.; Esposito, E. Environmental Sustainability and Energy-Efficient Supply Chain Management: A Review of Research Trends and Proposed Guidelines. Energies 2018, 11, 275. [Google Scholar] [CrossRef]
- Shasi; Cerchione, R.; Singh, R.; Centobelli, P.; Shabani, A. Food cold chain management From a structured literature review to a conceptual framework and research agenda. Int. J. Logist. Manag. 2018, 29, 792–821. [Google Scholar]
- Nilsson, F.R.; Sternberg, H.; Klass-Wissing, T. Who controls transport emissions and who cares? Investigating the monitoring of environmental sustainability from a logistics service provider’s perspective. Int. J. Phys. Distrib. Logist. Manag. 2017, 28, 798–820. [Google Scholar] [CrossRef]
- Horiba. On Board Emission Measurement System OBS-2200, Instruction Manual; Horiba: Kyoto, Japan, 2007. [Google Scholar]
- Horiba. Horiba OBS-2000TRPM Product Specification: (HAD); Version 1.0; Horiba: Kyoto, Japan, 2010. [Google Scholar]
- Horiba Contract Testing Services. Your Product-Proving Partners. Available online: http://www.horiba.com/fileadmin/uploads/Automotive/Documents/e-contract_testing.pdf (accessed on 31 July 2018).
- de Oliveira, L.A.; D’Agosto, M.A.; Fernandes, V.A.; de Oliveira, C.M. A financial and environmental evaluation for the introduction of diesel-hydraulic hybrid-drive system in urban waste collection. Transp. Res. D 2014, 31, 100–109. [Google Scholar] [CrossRef]
- Katrasnik, T.; Trenc, F.; Rodman Opresnik, S. Analysis of energy conversion efficiency in parallel and series hybrid powertrains. IEEE Inform. Sci. Technol. 2007, 56, 3649–3659. [Google Scholar] [CrossRef]
- Katrasnik, K. Analytical framework for analyzing the energy conversion efficiency of different hybrid electric vehicle topologies. Energy Convers. Manag. 2009, 50, 1924–1938. [Google Scholar] [CrossRef]
- Winkler, A.; Dimopoulos, P.; Hauert, R.; Bach, C.; Aguirre, M. Catalytic activity and aging phenomena of three-way catalysts in a compressed natural gas/gasoline powered passenger car. Appl. Catal. B 2008, 84, 162–169. [Google Scholar] [CrossRef]
- Opresnik, S.R.; Seljak, T.; Bizjan, F.; Katrasnik, T. Exhaust emissions and fuel consumption of a triple-fuel spark-ignition engine powered passenger car. Transp. Res. D 2012, 17, 221–227. [Google Scholar] [CrossRef]
- Quiros, D.C.; Thiruvengadam, A.; Pradhan, S.; Besch, M.; Thiruvengadam, P.; Demirgok, B.; Carder, D.; Oshinuga, A.; Huai, T.; Hu, S. Real-World Emissions from Modern Heavy-Duty Diesel, Natural Gas, and Hybrid Diesel Trucks Operating Along Major California Freight Corridors. Emiss. Control sci. Technol. 2016, 2, 156–172. [Google Scholar] [CrossRef]
- Kumar, P.; Robins, A.; Vardoulakis, S.; Rex, B. A review of the characteristics of nanoparticles in the urban atmosphere and the prospects for developing regulatory controls. Atmos. Environ. 2010, 44, 5035–5052. [Google Scholar] [CrossRef] [Green Version]
- Tornehed, P. Particulate Emissions Associated with Diesel Engine Oil Consumption. Ph.D. Thesis, Department of Machine Design, Royal Institute of Technology, Stockholm, Sweden, 2010. [Google Scholar]
Figure 1.
Hydraulic hybrid topology of the DE5 bus.

Figure 2.
Installation of the volumetric flow meter and PM10 probe on the exhaust system of the CNGE5 bus.
Figure 2.
Installation of the volumetric flow meter and PM10 probe on the exhaust system of the CNGE5 bus.

Figure 3.
Installed Portable Emissions Measurement System (PEMS) for gas and PM10 measurements on the DE5 bus.
Figure 3.
Installed Portable Emissions Measurement System (PEMS) for gas and PM10 measurements on the DE5 bus.

Figure 4.
Typical time segment of the velocity time trace recorded with CNGE5 bus.

Figure 5.
Engine speed vs time measured on the DE3 bus, CNGE5 bus, DE5 bus in hybrid mode with power limiter on and in non-hybrid mode with power limiter off.
Figure 5.
Engine speed vs time measured on the DE3 bus, CNGE5 bus, DE5 bus in hybrid mode with power limiter on and in non-hybrid mode with power limiter off.

Figure 6.
Cyclic fuel delivery of the DE3 bus, CNGE5 bus, DE5 bus in hybrid mode with power limiter on and in non-hybrid mode with power limiter off.
Figure 6.
Cyclic fuel delivery of the DE3 bus, CNGE5 bus, DE5 bus in hybrid mode with power limiter on and in non-hybrid mode with power limiter off.

Figure 7.
CO2 concentration vs time measured of the DE3 bus, CNGE5 bus, and DE5 bus in hybrid mode with power limiter on and in non-hybrid mode with power limiter off.
Figure 7.
CO2 concentration vs time measured of the DE3 bus, CNGE5 bus, and DE5 bus in hybrid mode with power limiter on and in non-hybrid mode with power limiter off.

Figure 8.
CO concentration vs time measured of the DE3 bus, CNGE5 bus, and DE5 bus in hybrid mode with power limiter on and in non-hybrid mode with power limiter off.
Figure 8.
CO concentration vs time measured of the DE3 bus, CNGE5 bus, and DE5 bus in hybrid mode with power limiter on and in non-hybrid mode with power limiter off.

Figure 9.
THC concentration vs time measured of the DE3 bus and CNGE5 bus.

Figure 10.
NOx vs time measured of the DE3 bus, CNGE5 bus, and DE5 bus in hybrid mode with power limiter on and in non-hybrid mode with power limiter off.
Figure 10.
NOx vs time measured of the DE3 bus, CNGE5 bus, and DE5 bus in hybrid mode with power limiter on and in non-hybrid mode with power limiter off.

Figure 11.
PM10 mass emission vs time measured of the DE3 bus, CNGE5 bus, and DE5 bus in hybrid mode with power limiter on and in non-hybrid mode with power limiter off.
Figure 11.
PM10 mass emission vs time measured of the DE3 bus, CNGE5 bus, and DE5 bus in hybrid mode with power limiter on and in non-hybrid mode with power limiter off.


Table 1.
Main characteristics of the tested buses.
| Bus | Reference | Hydraulic Hybrid | CNG Fueled |
|---|---|---|---|
| Acronym | DE3 | DE5 | CNGE5 |
| Engine | CI engine, Turbo Intercooled, Direct Injected | CI engine, Turbo Intercooled, Direct Injected | SI engine, Turbo Intercooled |
| Swept volume | 6871 cm3 | 4801 cm3 | 7790 cm3 |
| No. of cylinders | 6 | 4 | 6 |
| Compression ratio | 18.0:1 | 18.0:1 | 11.5:1 |
| Max. power | 162 kW | 160 kW | 213 kW |
| Max. torque | 850 Nm | 810 Nm | 1100 Nm |
| Emission standard | EURO III | EURO V | EURO V |
| Power transmission | conventional automatic VOITH Diwa.3 851.3 E | series hydraulic hybrid | conventional automatic VOITH Diwa.5 854.5 |
| Fuel | diesel | diesel | CNG |
| Exhaust aftertreatment | Exhaust Gas Recirculation (EGR) | EGR + Diesel Oxidation Catalyst + Selective Catalytic Reduction (SCR) | TWC |
| No. of seats | 30 + 1 | 21 + 1 | 25 + 1 |
| Total no. of passengers | 91 | 60 | 85 |
| Mass of the bus on the test | 13,300 kg | 10,000 kg | 13,675 kg |
| Max. allowed gross weight | 18,000 kg | 11,200 kg | 18,000 kg |
Table 2.
Average fuel consumption, CO2 emissions and fuel cost.
| Bus | Hybrid Mode | Power Limiter | Fuel Consum. | Energy Consum. | CO2 Emission | Specific Fuel Cost 1 |
|---|---|---|---|---|---|---|
| g/km | J/km | g/km | €/km | |||
| DE3 | / | / | 397.2 | 17.08 | 1249 | 0.603 |
| DE5 | OFF | OFF | 362.1 | 15.57 | 1141 | 0.549 |
| ON | ON | 357.6 | 15.38 | 1127 | 0.543 | |
| ON | OFF | 371.4 | 15.97 | 1171 | 0.564 | |
| OFF | ON | 343.8 | 14.78 | 1084 | 0.522 | |
| CNGE5 | / | / | 448.6 | 22.22 | 1224 | 0.426 |
1 on 30th of January 2018, in Slovenia.
Table 3.
Average CO and THC specific mass emissions for observed buses.
| Bus | Hybrid Mode | Power Limiter | CO Emission | THC Emission |
|---|---|---|---|---|
| g/km | g/km | |||
| DE3 | / | / | 3.38 | 0.27 |
| DE5 | OFF | OFF | 2.35 | / |
| ON | ON | 1.87 | / | |
| ON | OFF | 1.71 | / | |
| OFF | ON | 1.80 | / | |
| CNGE5 | / | / | 3.71 | 0.47 |
Table 4.
Average NOx and PM10 specific mass emissions for observed buses.
| Bus | Hybrid Mode | Power Limiter | NOx Emission g/km | PM10 Emission g/km |
|---|---|---|---|---|
| DE3 | / | / | 16.11 | 1.26 |
| DE5 | OFF | OFF | 5.82 | 0.08 |
| ON | ON | 6.98 | 0.05 | |
| ON | OFF | 5.61 | 0.08 | |
| OFF | ON | 4.59 | 0.05 | |
| CNGE5 | / | / | 0.51 | 0.003 |
© 2018 by the authors. Licensee MDPI, Basel, Switzerland. This article is an open access article distributed under the terms and conditions of the Creative Commons Attribution (CC BY) license (http://creativecommons.org/licenses/by/4.0/).
Share and Cite
MDPI and ACS Style
Rodman Oprešnik, S.; Seljak, T.; Vihar, R.; Gerbec, M.; Katrašnik, T. Real-World Fuel Consumption, Fuel Cost and Exhaust Emissions of Different Bus Powertrain Technologies. Energies 2018, 11, 2160. https://doi.org/10.3390/en11082160
AMA Style
Rodman Oprešnik S, Seljak T, Vihar R, Gerbec M, Katrašnik T. Real-World Fuel Consumption, Fuel Cost and Exhaust Emissions of Different Bus Powertrain Technologies. Energies. 2018; 11(8):2160. https://doi.org/10.3390/en11082160
Chicago/Turabian StyleRodman Oprešnik, Samuel, Tine Seljak, Rok Vihar, Marko Gerbec, and Tomaž Katrašnik. 2018. "Real-World Fuel Consumption, Fuel Cost and Exhaust Emissions of Different Bus Powertrain Technologies" Energies 11, no. 8: 2160. https://doi.org/10.3390/en11082160
Note that from the first issue of 2016, this journal uses article numbers instead of page numbers. See further details here.