The Impacts of High V2G Participation in a 100% Renewable Åland Energy System


1
School of Energy Systems, Lappeenranta University of Technology, 53850 Lappeenranta, Finland
2
Faculty of Science and Engineering, Åbo Akademi, 20500 Turku, Finland
*
Author to whom correspondence should be addressed.
Energies 2018, 11(9), 2206; https://doi.org/10.3390/en11092206
Submission received: 27 July 2018
/
Revised: 13 August 2018
/
Accepted: 22 August 2018
/
Published: 23 August 2018
(This article belongs to the Special Issue 100% Renewable Energy Transition: Pathways and Implementation)
Abstract
:A 100% renewable energy (RE) scenario featuring high participation in vehicle-to-grid (V2G) services was developed for the Åland islands for 2030 using the EnergyPLAN modelling tool. Hourly data was analysed to determine the roles of various energy storage solutions, notably V2G connections that extended into electric boat batteries. Two weeks of interest (max/min RE) generation were studied in detail to determine the roles of energy storage solutions. Participation in V2G connections facilitated high shares of variable RE on a daily and weekly basis. In a Sustainable Mobility scenario, high participation in V2G (2750 MWhe) resulted in less gas storage (1200 MWhth), electrolyser capacity (6.1 MWe), methanation capacity (3.9 MWhgas), and offshore wind power capacity (55 MWe) than other scenarios that featured lower V2G participation. Consequently, total annualised costs were lower (225 M€/a). The influence of V2G connections on seasonal storage is an interesting result for a relatively cold, northern geographic area. A key point is that stored electricity need not only be considered as storage for future use by the grid, but V2G batteries can provide a buffer between generation of intermittent RE and its end-use. Direct consumption of intermittent RE further reduces the need for storage and generation capacities.
1. Introduction
Driven by efforts to eliminate dependency on imported fossil fuels and increase overall sustainability, island nations and regions of archipelago may encounter higher shares of renewable energy in their energy systems much faster than their continental counterparts. In doing so, these regions will be the first to determine optimal levels of various energy storage solutions needed as higher shares of intermittent renewable energy (RE) resources are assimilated [1]. Furthermore, island groups represent interesting case studies of transitions as their energy systems are relatively compact, homogeneous, and less complex. For these reasons, such regions may offer potential blueprints or test-beds for energy system transitions toward sustainability that will happen on a wider scale in the future [2].
In order to encourage a transition away from fossil fuels and toward sustainability on the Aegean Archipelago Islands, Kadellis et al. [3] suggest that island energy systems based on RE and appropriate Energy Storage Solutions (ESS) can aid in achieving both environmental goals and result in financial advantages. Further, Hlusiak et al. [4] highlight how utilising the storage potential of battery electric vehicles (BEV) can contribute to island grid stability while not imposing significant restrictions on electric vehicle range. The potential coupling of RE generation and electrified mobility, therefore, seems promising.
Over the past two decades, there has been considerable research interest in the idea that electrified vehicles could offer benefits to both the transport and power sectors when a sector coupling is achieved [5,6]. In essence, the concept of vehicle-to-grid (V2G) involves the bidirectional flow of electricity between power grids and various forms of transport in a manner that is mutually beneficial. It includes the idea that electrified forms of transport will have batteries that can offer flexibility to energy systems, thereby improving efficiency and profitability of power grids, enabling higher shares of renewable energy, reducing greenhouse gas (GHG) emissions for the transport sector, and offering potential income for vehicle owners [6]. This flexibility will come in the form of so-called smart charging or enabling vehicles to charge when electricity is abundant or when demands are otherwise low and from discharging batteries back to the grid at times when demand exceeds supply. This flexibility becomes more relevant in energy systems that feature high shares of variable renewable energy, such as solar photovoltaics (PV) and wind turbines. Zhang et al. [7] show how smart charging of BEVs can positively affect power systems through valley-filling and peak shaving of load profiles. Further, several studies have demonstrated how broader use of electric vehicles can be an effective means of managing variable renewable energy resources [8,9]. Further, smart charging need not place unnecessary burdens on power systems if properly managed [10,11], and the lifetimes of lithium-ion vehicle batteries could be extended through optimal V2G strategies [12].
The Åland Islands are an archipelago situated in the Gulf of Bothnia of the Baltic Sea between Finland and Sweden. Åland is composed of 6757 islands, 60 of which are populated by 28,916 inhabitants [13]. Åland is an autonomous region of Finland yet also has strong trade, cultural, and linguistic ties with Sweden. Currently, the Government of Åland aims to identify actions that can be taken to achieve sustainable growth goals by 2051 [14]. These goals are defined by sustainability principles outlined within a Framework for Strategic Sustainable Development [15]. In turn, the Åland Smart Energy Platform has emerged as a group dedicated to envisioning and demonstrating how a fully sustainable energy system could be developed for the region, one that enables the delivery of reliable, cost competitive, and quality energy services to end users which are free of fossil fuels [16].
Previous work for the whole of Finland suggested that a combination of 100% RE and an appropriate mix of energy storage solutions (ESS) could provide the basis of a sustainable and affordable energy system for the entire country by 2050 [17]. In addition, Child and Breyer [18] showed how storage technologies could play support high shares of solar PV and wind power at high northern latitudes. However, as the geography and energy system of Åland represent unique contexts within the Finnish system, a more specific and local analysis was required. In addition, following the idea that energy system transition towards high shares of renewables could be achieved on islands and regions of archipelago sooner than continents, an accelerated timeframe for Åland was needed for investigation. The transition towards a sustainable island energy system will require a variety of complementary energy generation and storage solutions. Past research [19] indicates that electricity storage will be required after 50% of electricity is generated from variable RE, and that seasonal storage will be required after that level exceeds 80% [20,21]. Currently, a variety of flexibility measures are available which support high levels of variable RE [22].
For these reasons, several sustainable energy scenarios were investigated for Åland [23]. In total, six scenarios were developed and compared to a Business as Usual scenario for the year 2030. The Sustainable Mobility—High Electrification (2030 SM El) scenario emerged as a highly cost-competitive option for Åland. This scenario featured a highly electrified transport sector, which included both land and water-based forms of mobility. Cost savings were observed as high capacities of BEV battery storage and V2G connections resulted in lower requirements of seasonal storage, synthetic fuel production, and offshore wind installed capacity. As reported in [23], the effect of high V2G participation resulting in less need for a form of seasonal storage, in this case Power-to-Gas (PtG), has never before been reported, and represents a novelty that merits further investigation. Another novelty of the scenario is that it extended V2G participation beyond automobiles and featured the use of batteries of electrified watercraft. The significance of such batteries is that they often stay unused for transport purposes during much of the winter season, offering a source of flexibility not previously considered.
The purpose of this current study is to explain the roles of ESS in more detail in the Åland context. Included in this analysis are gas storage, PtG technologies, Thermal Energy Storage (TES), stationary batteries, and V2G connections. Several key questions will be answered to aid in determining the significance of ESS in this future energy system.
- To what extent are wind and solar PV power used directly?
- How much do storage technologies contribute to annual energy demand?
- What is the amount of stored energy arising from V2G connections?
- What is the amount of stored energy arising from TES?
- What is the amount of stored energy arising from gas storage?
2. Materials and Methods
The EnergyPLAN tool is an advanced energy system analysis computer model [24], and was employed to simulate a 100% RE scenario with a highly electrified mobility sector for Åland in 2030. The chosen scenario was one of nine developed in the study by Child et al. [23], and was chosen because it was the most cost competitive of the scenarios studied. A full description of the tool used, scenario parameters, and the main inputs to EnergyPLAN for the 2030 SM El scenario can be found in [23] as well as in its detailed supplementary materials. A summary table of main inputs is provided in Table 1. In addition, an annual energy flow diagram is provided in Figure 1.
The EnergyPLAN modelling tool was designed at Aalborg University in 1999 and has seen continued development since that time. Version 12.4 was used for this study and was the most recent version available at the moment the study began. The model has been formally described as a simulation model, which compares options or scenarios that can differ between key input parameters, such as costs, emission factors, energy generation technologies, storage options, and many others [25]. The model has typically been used to simulate national energy systems but can also be used for smaller regions. Simulation models differ in nature to optimisation models, which generally establish an optimal strategy based purely on quantitative analyses according to one criteria. Instead, simulation models allow several criteria to be compared through the creation of unique scenarios [25]. The strengths and weaknesses of scenarios can then be compared and discussed. A comparative discussion and overview of the many modelling tools available can be found in [26].
As stated above, this current study examines one scenario in greater detail to determine the roles of various forms of ESS, and to elaborate on the finding in [23] that V2G participation could not only aid in enabling higher shares of RE but could preclude the need for other forms of storage, most notably seasonal energy storage. The 2030 SM El scenario under analysis featured a special focus on the mobility sector, whereby electrification of passenger vehicles was assumed to reach 100%. In addition, an extra 350 MWhe of V2G battery capacity was added to represent a capacity of marine transport batteries. This value was deemed sufficient to represent the more than 7000 marine watercraft, from recreational boats to large Roro vessels and ferries, that are found in Åland [13] and the level of electrification that might be possible. However, complete electrification of transport was not assumed. For this reason, 31 GWh of biodiesel and 9 GWh of synthetic diesel were produced to satisfy the remaining transport demand. In this scenario, it was also assumed that V2G and flexible charging participation would be limited to 75% of vehicles, with the remainder of electric vehicles being charged during the evening hours.
From the EnergyPLAN outputs, data was collected and processed to show the workings of the energy system components in hourly resolution. EnergyPLAN provides hourly resolved output data related to demand, production, and storage of electricity, district heat and grid gas (or PtG methane). This data is organized from the first hour of a calendar year beginning 1 January, to the 8784th h of the year on 31 December. EnergyPLAN assumes that all years are leap years, which therefore include values for 29 February. This explains the divergence from a standard year of 8760 h. The annual graphics showed two periods of interest and illustrated in greater detail how various forms of energy were generated, how energy was stored, and how it was ultimately consumed. Although hourly results of combustion/boiler-based home heating are not available from EnergyPLAN, the three categories of electricity use, district heating and grid gas were used to provide an overview of energy supply, consumption, and storage to enable an interpretation of results. It was deemed interesting to see how the energy system would function at times of both high and low variable renewable energy generation, characterised by the sum of solar PV, onshore wind and offshore wind. These moments could be times of high inflow of energy to and outflow of energy from storage, respectively.
Periods of study were chosen as the weeks surrounding these moments of interest, with the moments of interest close to the midway point of the study periods. At the same time, the starts of the study periods were maintained as the first hour of the calendar day and week (Sunday 00:00–01:00) and the final hour of the study periods as the final hour of a calendar day (Saturday 23:00–00:00). The two weeks chosen for analysis are 26 March–1 April (Hours 2107–2185), and November 19–25 (Hours 7776–7944). Afterward, results were further processed and analyzed.
To explore a broader context, several the hourly profiles were examined for the duration of year. These included annual electricity supply and consumption by category as well as the state of charge of electric, DH, and gas storage. Hourly end-user demand data for Åland were based on real values from 2014 obtained from Kraftnät Åland, the Åland transmission system operator. A district heat demand and wind energy generation profiles were provided by a local energy company (Mariehamns Energi). Each profile was based on real data from 2014. Solar PV production data was derived from 2005 data originating from [27,28], as suitable, real production data was not available for 2014. All original data is available in [23].
To calculate the various contributions of ESS options employed in this study, total energy demand was calculated based on electric and thermal energy end-user consumption, which represent to EnergyPLAN inputs. In total, 797 GWh of energy was consumed for the year, represented by 422 GWh of electricty and 375 GWh of heat. A number of annual and hourly outputs from EnergyPLAN were available, including discharge values from V2G, stationary battery, and thermal energy storage. At the same time, values for the annual electricity and heat that came from stored gas were calculated using the equations listed in [18].
The direct usage of solar PV and wind energy was calculated as the sum of the categories of supply (onshore wind + offshore wind + solar PV) divided by the sum of electricity supply from all sources. To calculate the amount of wind and solar PV power that was consumed directly, this ratio was multiplied by the level of total electricity. The ratio was also multiplied by the sum of power going to electricity storage (V2G batteries + stationary batteries + PtG electrolysers) to calculate the amount of wind and solar being transferred to storage. The share of directly consumed solar PV and wind energy is the ratio of solar PV and wind energy which was directly consumed to the consumption of total electricity by all sources. These calculations were made for all hours and then added to determine annual totals. Further compilation, tabulation and analysis of the results were performed.
3. Results
Annual results are shown in Figure 2, Figure 3, Figure 4, Figure 5 and Figure 6 for electricity supply, electricity demand, electricity storage, thermal storage and grid gas storage in the energy system. Calculation results are shown in Figure 7 and Table 2. Hourly results are compiled for the two study periods in Figure 8, Figure 9, Figure 10, Figure 11, Figure 12 and Figure 13 for the electricity, district heating and gas components of the energy scenario.
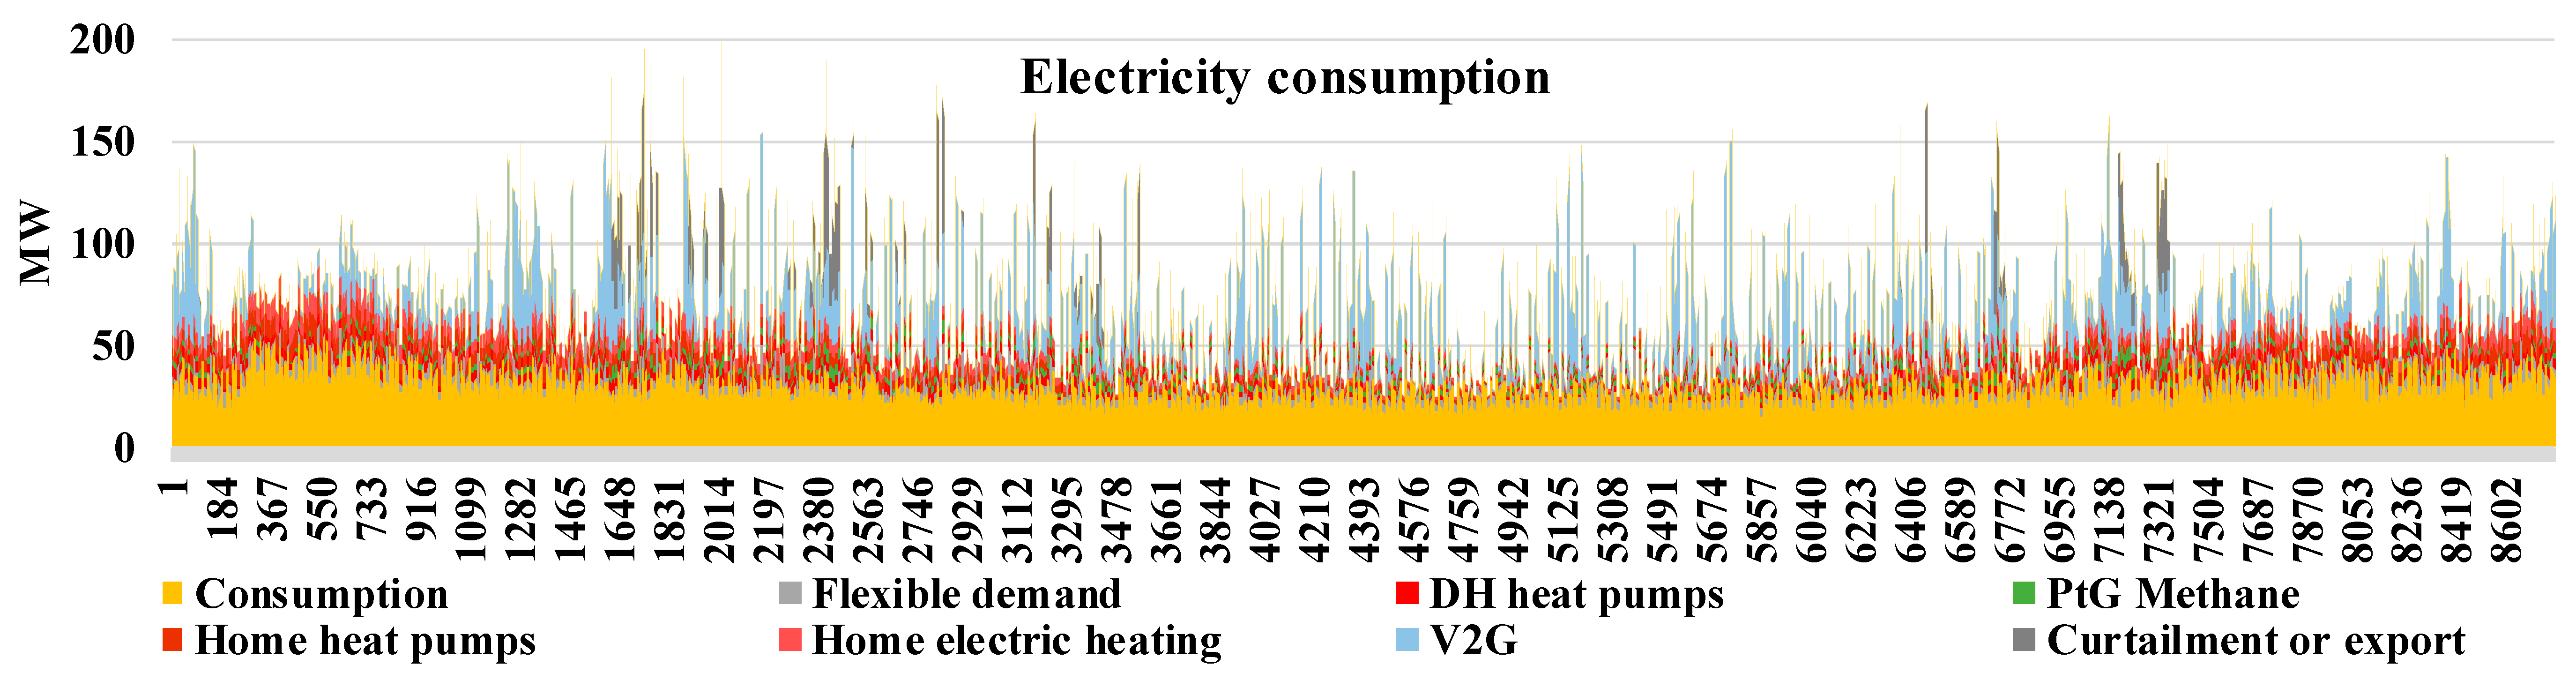
Electricity consumption and supply are shown in Figure 2 and Figure 3. Generation from solar PV is more concentrated during the late spring to early autumn months and is seen to be variable at an hourly resolution. Wind energy, especially offshore wind, is less variable, and shows more concentration during the period of late autumn to early spring. This represents a somewhat natural seasonal complement of the two resources, which reduces the variability of RE in more general terms. At the same time, Combined Heat and Power (CHP) plants are available to maintain the balance between supply and consumption. The balancing offered by V2G and flexible demands also contributes to system stability through peak shaving and valley-filling during times of extreme highs and lows. Some curtailment of wind and solar is necessary when generation from RE is highest, but this is limited to less than 3.5% of total generation.
Figure 4, Figure 5 and Figure 6 demonstrate the nature of different types of storage. In general, storage of gas and thermal energy appears to follow a typical pattern of charging during the period of late spring to autumn as excess electricity predominantly from solar PV is converted to other energy carriers that can be utilised during the colder months of the year when demands for energy are higher. In addition, it is seen that electric vehicle batteries generally show daily and multi-day charging and discharging cycles. However, there is a longer period during the winter months (roughly hours 400–1200, corresponding to late January to mid-February) when the use of batteries is significant, and they are a major source of power in the system. At the same time, thermal and gas storage levels are at annual low levels, suggesting that the large capacity of V2G batteries also have a role as a storage technology that can contribute to balancing over a longer time period. This is also supported by the observation in [23] that lower overall capacities of PtG technologies were needed compared to other scenarios. Discharge of V2G batteries totals 78 GWh and represents 17% of annual electricity generation.
Table 2 and Figure 7 indicate that there is relatively high direct usage of electricity from solar PV and wind, approximately 67% of total production. Approximately 29%, or 115 GWh goes to electric storage, which can be in the form of batteries or PtG. It appears, however, that the majority of this excess goes to battery storage, as the output of V2G batteries to the grid is 78 GWhe and the output of gas storage is relatively small (4 GWhgas). Further, this stored gas is used only for the production of liquid synthetic transport fuels and is not converted back to electricity for use in the grid. This also suggests that electric storage plays a more dominant role in the energy system.
In total, 139.82 TWh of electricity went from the grid to charge V2G batteries, and 78.12 TWh was discharged back to the grid (56%). Mobility demand for those V2G vehicles represented 50.54 GWh, or 36% of the total electricity charge, leaving losses due to charging and discharging at approximately 8%. This suggests that the utility of V2G batteries could be greater for the power sector than for the mobility sector.
4. Discussion
Variable RE in the form of solar PV and wind power contribute 60% to final electricity consumption and represent 53% of the total electricity generation. Importantly, this generation is seen to be highly variable throughout the year. Moreover, it is sometimes concentrated during daytime, creating a need for both short and long-term storage. In total about 67% of variable RE is directly utilized, with the remainder going to storage (28%) and a much smaller amount to curtailment (5%). Electric storage discharge totalled 78 GWhe, or 17% of end-user consumption. V2G batteries have a very strong role in the energy system and provided 100% of electric storage. Extending V2G storage to a greater range of transport types, in particular the more than 7000 personal watercraft in Åland, appears to be of great benefit to the energy system. At the same time, the EnergyPLAN modelling tool was not fully able to harness all the flexibility that could be offered by boats. One limitation of the model is that it could not distinguish between vehicles and boats in terms of their electricity demands nor their variable seasonal availability. Indeed, a large portion of personal watercraft would be completely idle during winter months and their batteries could offer greater storage than was represented by EnergyPLAN. Likewise, demands for electricity during summer months could be noticeably higher than what has been represented. Further study is needed to determine the full range of benefits and operational challenges related to extending V2G services to such a high number of vehicles and other devices. Such devices could include other aquatic craft that are fully or partially electrified such as ferries, fishing vessels and larger ships. A wide range of support vehicles may also be possible to include such as forklifts, tractors, forestry machines and golf carts. In addition, there may be a role for stationary batteries in reality that was not supported by this analysis.
The results of this study suggest that V2G batteries may serve a greater role in the power sector than even in the mobility sector, as 56% of the electricity that flowed into the V2G batteries eventually went back to the grid, while only 36% was used for mobility demand. This effect is enabled by the relatively large size of batteries that may be demanded in the future in order to ensure sufficient range of driving. The largest available battery is currently found in the Tesla Model S, at 100 kWh [29]. The average battery sizes for 2030 assumed for this study were more conservative, at 75 kWh for road vehicles and 50 kWh for watercraft. Larger average battery sizes may offer greater flexibility to the energy system than is assumed here.
At the same time, it must be remembered that vehicles and watercraft are items of personal ownership, and utilisation of their batteries is subject to the desires of their owners. It is one thing to conclude that there is technical feasibility and economic benefit to the utilisation of V2G batteries for the benefit of the energy system. It is quite another to assume that this would be a desirable outcome for battery owners. Some form of motivation must be considered. Kiviluoma [30] cautions that the marginal benefits for plug-in hybrid electric vehicle owners would decrease with higher participation in V2G services. In essence, a larger number of participants would be sharing limited benefits as there are finite demands for power system reserves and system flexibility.
There are several studies that suggest that V2G participation can be of benefit to both vehicle owners and save costs in the power system. First, V2G can reduce transmission system losses and the overall costs of grid operation [31]. Second, both vehicle owners and grid operators were reported to be able to reduce costs through optimised vehicle charging [7]. Third, Zakariazadeh et al. [9] suggest that effective scheduling of charging and discharging of EVs can result in mutual benefits for vehicle owners, distribution system operators and the service providers or aggregator elements that may bring them together.
These observations are also summarised in a review by Sovacool et al. [6]. However, the authors point out that the social dimension of V2G is greatly overlooked in scientific studies. They conclude that meaningful sociotechnical advantages and disadvantages to V2G systems remain unexplored. Designing V2G systems based purely on technical and economic feasibility would be premature without addressing obvious research gaps related to overall environmental performance, financing and business models, user behaviour, use of natural resource, visions and narratives, concerns about social justice, gender norms, and urban resilience.
PtG technology has only a limited role in the 2030 SM El scenario analysed. The only purpose of PtG had been in the production of synthetic transport fuels, which EnergyPLAN generates in a Power-to-Gas-to-Liquid sequence. Gas storage arising from PtG amounts to 4 GWhgas, or 31% of annual gas usage. On a daily and weekly level, PtG technology provides a buffer between high levels of variable RE generation and the creation of synthetic fuels for transport. This result is interesting when considering that PtG played a very important seasonal storage role in an analysis of Finland as a whole [17,18]. The contrasting result appears partially due to the less variable wind conditions in the Åland archipelago, but also due to extensive V2G storage. In this regard, this study may be the first to show that while V2G services provide rather short-term storage on a daily and multi-day level, extending these services may greatly result in less need for seasonal storage. In this scenario, lack of seasonal storage is represented by no need for synthetic gas for electricity or heat production. At the same time, other scenarios from a broader study [23] emphasise the structural findings obtained here. These scenarios also showed little need for seasonal storage in the form of PtG outside of liquid fuel production. In fact, PtG seasonal storage was only needed in the two scenarios that featured Åland in complete island mode, and exports of energy carriers were not allowed by scenario design.
Thermal energy storage in Åland appears to have a less significant role when annual numbers are considered. Thermal storage discharge totalled 7 GWhth, representing just 2% of end-user heat demand. At the same time, this role would be expected to be more significant during colder months and in more urban areas. Thermal storage is relatively inexpensive and complements the extensive use of heat pumps seen in the 2030 SM El scenario. Having sufficient thermal storage allows excess variable RE power generation to be utilized by heat pumps at a much greater extent.
The variability of RE energy generation in Åland seems manageable by the storage technologies employed in this study. In all, 89 GWh of electricity and heat are discharged from storage, totalling 11% of end-user consumption.
5. Conclusions
Developing a fully sustainable scenario for any region merits proper consideration of the appropriate mix of these measures for each context. In this work, the right mix of technologies for Åland was influenced by high levels of direct consumption of variable RE and expanded use of V2G storage on Åland. In turn, the energy system required lower installed capacities of offshore wind generation, and the need for both PtG and seasonal storage of gas was eliminated. To this end, V2G services seem to offer a key flexibility for future energy systems, provided that charging and discharging is optimised. Expanding such services to a wider range of electrified transportation modes (boats, bikes, motorcycles, etc.) appears to be an interesting area of future research that merits considerable attention. Such attention could even be directed toward other types of commercial vehicles, such as electrified carts, forklifts, forestry machines, etc. Variable RE and ESS can play significant roles in a fully sustainable future energy system for Åland. V2G services should therefore be investigated as a significant electricity storage option for islands and regions of archipelago. However, the social dimensions of V2G systems need further research to determine a further range of advantages and disadvantages to society.
Author Contributions
A.N. conceived and designed the simulations for the Åland energy system under the supervision of M.C. and C.B.; M.C. performed the numerical analysis of hourly energy system data; C.B. and M.C. were involved in further interpretation of the data; M.C. wrote the paper under the supervision of C.B.
Funding
The authors gratefully acknowledge the public financing of Tekes, the Finnish Funding Agency for Innovation, for the ‘Neo-Carbon Energy’ project under the number 40101/14.
Conflicts of Interest
The authors declare no conflict of interest.
Abbreviations
| BEV | battery electric vehicle |
| CHP | combined heat and power |
| DH | district heating |
| ESS | energy storage solution |
| GHG | greenhouse gas |
| GWh | gigawatt hour |
| M | million |
| MW | megawatt |
| MWh | megawatt hour |
| RE | renewable energy |
| PV | photovoltaics |
| PtG | Power-to-gas |
| TES | thermal energy storage |
| V2G | vehicle-to-grid |
| e | electric units |
| th | thermal units |
| gas | gas units |
References
- Franzen, E.; Strauch, N.; Triebel, C.; Bosch, E.; Richards, B. Switching off the generator: Technical and economic approach for storage based renewable energy systems for islands. WIT Trans. Ecol. Environ. 2013, 176, 3–13. [Google Scholar]
- Blechinger, P.; Cader, C.; Bertheau, P.; Huyskens, H.; Seguin, R.; Breyer, C. Global analysis of the techno-economic potential of renewable energy hybrid systems on small islands. Energy Policy 2016, 98, 674–687. [Google Scholar] [CrossRef]
- Kaldellis, J.K.; Zafirakis, D.; Kavadias, K. Techno-economic comparison of energy storage systems for island autonomous electrical networks. Renew. Sustain. Energy Rev. 2009, 13, 378–392. [Google Scholar] [CrossRef]
- Hlusiak, M.; Arnhold, O.; Breyer, C. Optimising a Renewables Based Island Grid and Integrating a Battery Electric Vehicles Concept on the example of Graciosa Island, Azores Archipelago. In Proceedings of the 6th European Conference on PV-Hybrids and Mini-Grids, Chambery, France, 26–27 April 2012. [Google Scholar]
- Sovacool, B.; Axsen, J.; Kempton, W. Tempering the Promise of Electric Mobility? A Sociotechnical Review and Research Agenda for Vehicle-Grid-Integration (VGI) and Vehicle-to-Grid (V2G). Annu. Rev. Environ. Resour. 2017, 42, 16.1–16.30. [Google Scholar] [CrossRef]
- Sovacool, B.K.; Noel, L.; Axsen, J.; Kempton, W. The neglected social dimensions to a vehicle-to-grid (V2G) transition: A critical and systematic review. Environ. Res. Lett. 2018, 13, 013001. [Google Scholar] [CrossRef] [Green Version]
- Zhang, K.; Xu, L.; Ouyang, M.; Wang, H.; Lu, L.; Li, J.; Li, Z. Optimal decentralized valley-filling charging strategy for electric vehicles. Energy Convers. Manag. 2014, 78, 537–550. [Google Scholar] [CrossRef]
- Morais, H.; Sousa, T.; Vale, Z.; Faria, P. Evaluation of the electric vehicle impact in the power demand curve in a smart grid environment. Energy Convers. Manag. 2014, 82, 268–282. [Google Scholar] [CrossRef] [Green Version]
- Zakariazadeh, A.; Jadid, S.; Siano, P. Integrated operation of electric vehicles and renewable generation in a smart distribution system. Energy Convers. Manag. 2015, 89, 99–110. [Google Scholar] [CrossRef]
- Lassila, J.; Koivuranta, K. Network effects of electric vehicles—Case from Nordic country. In Proceedings of the CIRED 21st International Conference on Electricity Distribution, Frankfurt, Germany, 6–9 June 2011. [Google Scholar]
- Lassila, J.; Tikka, V.; Haakana, J.; Partanen, J. Electric cars as part of electricity distribution—Who pays, who benefits? IET Electr. Syst. Transp. 2012, 2, 186–194. [Google Scholar] [CrossRef]
- Uddin, K.; Jackson, T.; Widanage, W.D.; Chouchelamane, G.; Jennings, P.A.; Marco, J. On the possibility of extending the lifetime of lithium-ion batteries through optimal V2G facilitated by an integrated vehicle and smart-grid system. Energy 2017, 133, 710–722. [Google Scholar] [CrossRef]
- Statistics and Research Åland Statistical Yearbook of Åland 2017. 2017. Available online: https://www.asub.ax/sites/www.asub.ax/files/attachments/page/statistisk_arsbok_for_aland17.pdf (accessed on 7 August 2018).
- Nedergård, A. Utvecklings- och Tillväxtplan för Ett Hållbart Åland 2015–2017. 2015. Available online: http://www.atc.ax/files/utvecklingsplan_an_eng2_1492015_website.pdf (accessed on 2 June 2016).
- Alliance for Strategic Sustainable Development Framework for Strategic Sustainable Development. 2010. Available online: http://www.alliance-ssd.org/framework-for-strategic-sustainable-development-fssd/ (accessed on 8 August 2018).
- Ålands Teknologi- och Energicentrum The World’s Most Advanced Flexible Energy System of the Future—Case Åland. 2015. Available online: http://www.atc.ax/files/press_release_smart_energy_aland_20150911_eng.pdf (accessed on 8 August 2018).
- Child, M.; Breyer, C. Vision and initial feasibility analysis of a recarbonized Finnish energy system for 2050. Renew. Sustain. Energy Rev. 2016, 66, 517–536. [Google Scholar] [CrossRef]
- Child, M.; Breyer, C. The role of energy storage solutions in a 100% renewable Finnish energy system. Energy Procedia 2016, 99, 25–34. [Google Scholar] [CrossRef]
- Sterner, M.; Thema, M.; Eckert, F.; Moser, A.; Schäfer, A.; Drees, T. Stromspeicher in der Energiewende; Agora Energiewende: Berlin, Germany, 2014. [Google Scholar]
- Bogdanov, D.; Breyer, C. The Role of Solar Energy towards 100% Renewable Power Supply for Israel: Integrating Solar PV, Wind Energy, CSP and Storages. In Proceedings of the 19th Sede Boqer Symposium on Solar Electricity Production, Sede Boqer, Israel, 23–25 February 2015. [Google Scholar]
- Weitemeyer, S.; Kleinhans, D.; Vogt, T.; Agert, C. Integration of Renewable Energy Sources in future power systems: The role of storage. Renew. Energy 2015, 75, 14–20. [Google Scholar] [CrossRef] [Green Version]
- Lund, P.D.; Lindgren, J.; Mikkola, J.; Salpakari, J. Review of energy system flexibility measures to enable high levels of variable renewable electricity. Renew. Sustain. Energy Rev. 2015, 45, 785–807. [Google Scholar] [CrossRef] [Green Version]
- Child, M.; Nordling, A.; Breyer, C. Scenarios for a sustainable energy sytem in the Åland Islands in 2030. Energy Convers. Manag. 2017, 137, 49–60. [Google Scholar] [CrossRef]
- Lund, H.; EnergyPLAN. Advanced Energy System Analysis Computer Model. 2015. Available online: http://www.energyplan.eu/ (accessed on 8 August 2018).
- Lund, H.; Arler, F.; Østergaard, P.A.; Hvelplund, F.; Connolly, D.; Mathiesen, B.V.; Karnøe, P. Simulation versus optimisation: Theoretical positions in energy system modelling. Energies 2017, 10, 840. [Google Scholar] [CrossRef]
- Connolly, D.; Lund, H.; Mathiesen, B.V.; Leahy, M. A review of computer tools for analysing the integration of renewable energy into various energy systems. Appl. Energy 2010, 87, 1059–1082. [Google Scholar] [CrossRef]
- Stackhouse, P. Surface Meteorology and Solar Energy (SSE). Release 6.0. Available online: https://eosweb.larc.nasa.gov/sse/ (accessed on 17 November 2014).
- Stetter, D. Enhancement of the REMix Energy System Model: Global Renewable Energy Potentials, Optimized Power Plant Siting and Scenario Validation. Ph.D. Thesis, Institue of Thermodynamics and Thermal Engineering, University of Stuttgart, Stuttgart, Germany, 2012. [Google Scholar]
- Golson, J. Tesla’s new 100kWh battery makes Ludicrous Mode even more ludicrous. Verge. 2016. Available online: http://www.theverge.com/2016/8/23/12611466/tesla-battery-upgrade-p100d-model-s-x-ludicrous (accessed on 8 August 2018).
- Kiviluoma, J. Managing Wind Power Variability and Uncertainty Through Increased Power System Flexibility. Ph.D. Thesis, School of Science, Aalto University, Espoo, Finland, 2013. [Google Scholar]
- Panwar, L.K.; Reddy, K.S.; Kumar, R.; Panigrahi, B.K.; Vyas, S. Strategic Energy Management (SEM) in a micro grid with modern grid interactive electric vehicle. Energy Convers. Manag. 2015, 106, 41–52. [Google Scholar] [CrossRef]
Figure 1.
Simplified annual energy flows (in GWh) for the 2030 SM El scenario. Data source: [23].
Figure 1.
Simplified annual energy flows (in GWh) for the 2030 SM El scenario. Data source: [23].

Figure 2.
Annual hourly power demand by category (MWe). Flexible demand and electric vehicle charging enables a reduction in high peaks of electricity demand and fills valleys in demand during midday and night hours. Total curtailment of electricity is less than 3.5%.
Figure 2.
Annual hourly power demand by category (MWe). Flexible demand and electric vehicle charging enables a reduction in high peaks of electricity demand and fills valleys in demand during midday and night hours. Total curtailment of electricity is less than 3.5%.

Figure 3.
Annual hourly power supply by category (MWe). A seasonal complement can be observed between solar PV and CHP electricity production. Solar PV is also seasonally complemented by wind power to a lesser extent.
Figure 3.
Annual hourly power supply by category (MWe). A seasonal complement can be observed between solar PV and CHP electricity production. Solar PV is also seasonally complemented by wind power to a lesser extent.

Figure 4.
Hourly electric storage levels (MWhe) for the year. Maximum storage capacity is 2750 MWhe. V2G batteries had a significant role in the energy system, providing flexibility on a daily and multi-day level. High capacities of V2G led to reduced need for seasonal gas storage.
Figure 4.
Hourly electric storage levels (MWhe) for the year. Maximum storage capacity is 2750 MWhe. V2G batteries had a significant role in the energy system, providing flexibility on a daily and multi-day level. High capacities of V2G led to reduced need for seasonal gas storage.

Figure 5.
Hourly thermal storage levels (MWhth) for the year. Maximum storage capacity is 1100 MWhth. Thermal storage has a strong coupling with heat pump use in the district heating system, thereby allowing excess electricity to be stored as heat in long-term storage.
Figure 5.
Hourly thermal storage levels (MWhth) for the year. Maximum storage capacity is 1100 MWhth. Thermal storage has a strong coupling with heat pump use in the district heating system, thereby allowing excess electricity to be stored as heat in long-term storage.

Figure 6.
Hourly grid gas storage levels (MWhgas) for the year. Maximum storage capacity is 1200 MWhgas. High levels of gas storage appear to be associated with higher generation of wind power. Gas storage becomes lower during the summer months when solar PV generation is at its maximum.
Figure 6.
Hourly grid gas storage levels (MWhgas) for the year. Maximum storage capacity is 1200 MWhgas. High levels of gas storage appear to be associated with higher generation of wind power. Gas storage becomes lower during the summer months when solar PV generation is at its maximum.

Figure 7.
Amount of solar PV, onshore wind and offshore wind that is directly consumed (%). Values are in the range of 0–85% with a mean of 73%. As a result of high direct utilization of RE and extensive use of V2G storage, there was noticeably less need for gas and thermal storage.
Figure 7.
Amount of solar PV, onshore wind and offshore wind that is directly consumed (%). Values are in the range of 0–85% with a mean of 73%. As a result of high direct utilization of RE and extensive use of V2G storage, there was noticeably less need for gas and thermal storage.

Figure 8.
Electricity supply (Top), consumption (Centre), and storage (Bottom) for the first study period: 26 March–1 April. The beginning of the week shows the highest amount of variable RE generation. As storage options reached their capacities, some curtailment was needed. Daily cycles of charging and discharging of V2G storage are apparent over the week. These cycles are somewhat more prominent during days of lower wind generation. V2G charging is highly associated with solar PV generation throughout the week, creating a buffer between RE generation and end-use.

Figure 9.
District heat supply (Top), consumption (Centre), and storage (Bottom) for the first study period: 26 March–1 April. Heat pump use is maximized during times of high variable RE generation. CHP plant production satisfies needs for both electricity and heat during evening hours. Utilisation of storage is minimal. Total thermal storage capacity is 1100 MWhth. Thermal storage levels are relatively low at the end of the winter months.

Figure 10.
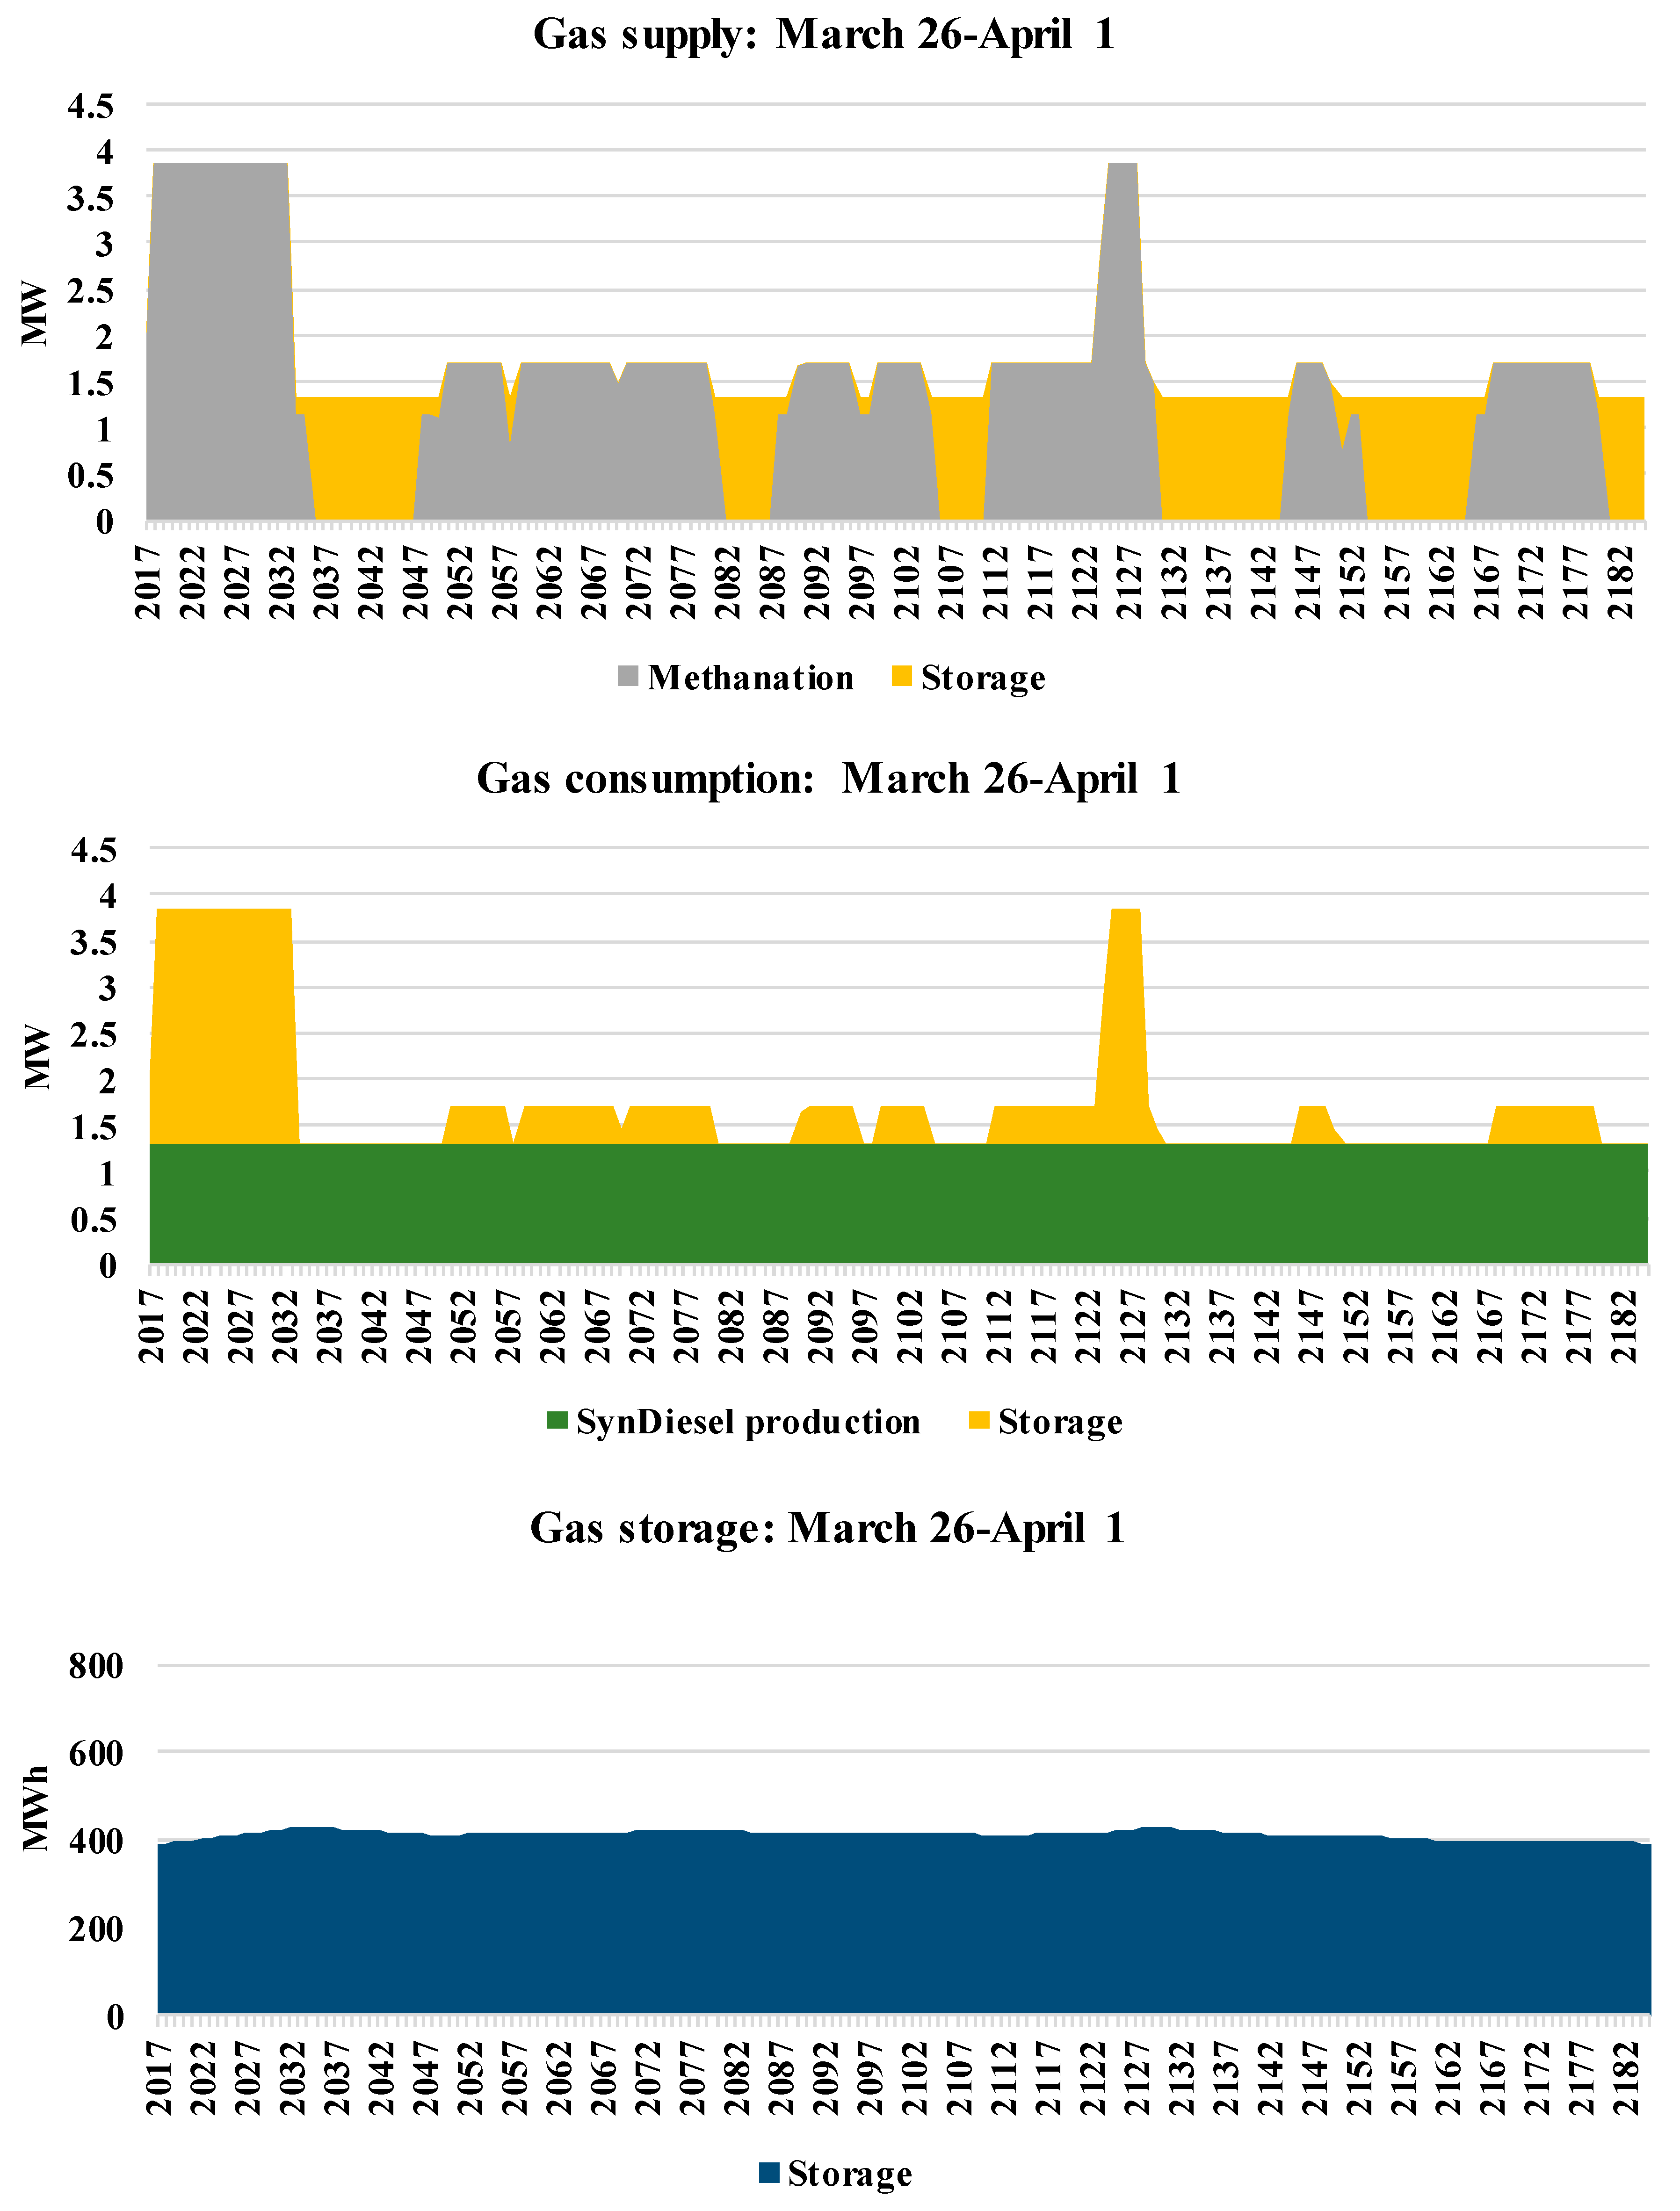
Gas supply (Top), consumption (Centre) and storage (Bottom) for the first study period: 26 March–1 April. Methanation occurs during periods of high variable RE generation and seems somewhat more associated with periods of high wind. Produced methane is stored for later use in synthetic liquid fuel production for the mobility sector only and was not needed for power or heat generation. Seasonal gas storage for these sectors was not needed in a system with high levels of V2G and thermal storage, which led to reduced system costs.
Figure 10.
Gas supply (Top), consumption (Centre) and storage (Bottom) for the first study period: 26 March–1 April. Methanation occurs during periods of high variable RE generation and seems somewhat more associated with periods of high wind. Produced methane is stored for later use in synthetic liquid fuel production for the mobility sector only and was not needed for power or heat generation. Seasonal gas storage for these sectors was not needed in a system with high levels of V2G and thermal storage, which led to reduced system costs.

Figure 11.
Electricity supply (Top), consumption (Centre), and storage (Bottom) for the second study period: 19–25 November. The end of the week showed the lowest levels of variable RE generation during the year and was the most challenging period for the energy system. However, use of electric storage, thermal power plants, and a small amount of imported electricity was sufficient to satisfy demand. V2G batteries experienced net discharge over the week but still maintained more than 25% capacity.

Figure 12.
District heat supply (Top), consumption (Centre), and storage (Bottom) for the second study period: 19–25 November. High power requirements toward the end of the week led to oversupply of heat originating from CHP plants. Thermal storage levels increased toward the end of this study period accordingly. Heat pumps use early in the week occurred at times of relatively higher variable RE production.

Figure 13.
Gas supply (Top), consumption (Centre), and storage (Bottom) for the second study period: 19–25 November. Relatively high levels of variable RE generation at the beginning of the week led to high levels of methane production. This ended later in the week as demands for power were high and variable RE generation was at its lowest. Gas needed for synthetic fuel production came from storage, which declined near the end of the week, but was still at more than 75% capacity.


Table 1.
Main input parameters for the 2030 SM El scenario.
| Parameter | Unit | Value | |
|---|---|---|---|
| RE generation capacity | |||
| Wind onshore | MWe | 70 | |
| Wind offshore | MWe | 55 | |
| Solar PV—Rooftop | MWe | 28 | |
| Solar PV—Ground mounted | MWe | 55 | |
| Thermal plant capacity | |||
| Condensing PP | MWe | 10 | |
| CHP | MWe | 20 | |
| DH Boilers | MWth | 15.3 | |
| DH Heat pumps | MWe | 5 | |
| Storage capacities | |||
| Heat storage | MWhth | 1100 | |
| V2G electric storage | MWhe | 2750 | |
| Methane storage | MWhth | 1200 | |
| PtG capacities | |||
| Electrolysis | MWe | 6.1 | |
| Methanation | MWhgas | 3.9 | |
| Annual electricity demand | GWhe | 451.54 | |
| Annual district heating demand | GWhth | 135 | |
| Annual individual heating total | GWhth | 240.05 | |
| Biomass | GWhth | 50.05 | |
| Heat pump | GWhth | 150 | |
| Electricity | GWhth | 40 | |
| Annual fuel for transport | M km | 415 | |
| Biodiesel | GWhth | 30.73 | |
| Synthetic diesel | GWhth | 9.27 | |
| Electricity (Dump charge) | GWhe | 17.8 | |
| Electricity (Smart charge) | GWhe | 51.2 | |
Table 2.
Summary of calculations related to storage discharge and consumption.
| Parameter | Unit | Value |
|---|---|---|
| Consumption of electricity | GWhe | 452 |
| Consumption of heat | GWhth | 375 |
| Consumption of total energy | GWh | 827 |
| Discharge from V2G | GWhe | 78 |
| Electricity from stored gas | GWhe | 0 |
| Heat from stored gas | GWhth | 0 |
| DH storage discharge | GWhth | 7 |
| Direct consumption of Solar PV and wind | GWhe | 273 |
| as% of total solar PV and wind production | 67% | |
| as% of total electricity production | 53% | |
| as% of final electricity consumption | 60% | |
| Solar PV and wind to electric storage | GWhe | 115 |
| as% of total solar PV and wind production | 29% | |
| Solar PV and wind to curtailment | GWhe | 20 |
| as% of total solar PV and wind production | 4% | |
| Total storage discharge | GWh | 85 |
| as% of total consumption | 10% | |
| Electricity storage discharge | GWhe | 78 |
| as% of electricity consumption | 17% | |
| V2G discharge | GWhe | 78 |
| as% of all electricity storage discharge | 100% | |
| Thermal storage discharge | GWhth | 7 |
| as% of heat consumption | 2% | |
| Gas storage discharge | GWhgas | 4 |
| as% of grid gas consumption | 31% |
© 2018 by the authors. Licensee MDPI, Basel, Switzerland. This article is an open access article distributed under the terms and conditions of the Creative Commons Attribution (CC BY) license (http://creativecommons.org/licenses/by/4.0/).
Share and Cite
MDPI and ACS Style
Child, M.; Nordling, A.; Breyer, C. The Impacts of High V2G Participation in a 100% Renewable Åland Energy System. Energies 2018, 11, 2206. https://doi.org/10.3390/en11092206
AMA Style
Child M, Nordling A, Breyer C. The Impacts of High V2G Participation in a 100% Renewable Åland Energy System. Energies. 2018; 11(9):2206. https://doi.org/10.3390/en11092206
Chicago/Turabian StyleChild, Michael, Alexander Nordling, and Christian Breyer. 2018. "The Impacts of High V2G Participation in a 100% Renewable Åland Energy System" Energies 11, no. 9: 2206. https://doi.org/10.3390/en11092206
Note that from the first issue of 2016, this journal uses article numbers instead of page numbers. See further details here.