1. Introduction
The increase in the use of renewable sources (sun, wind, water, etc.) to replace fossil fuels (petroleum, natural gas and coal), for energy production, aims to reduce greenhouse gas emissions and mitigate climate changes. In 2014, the European Union’s production from renewable energy sources has reached 14% of total energy consumption, but this production has to increase much more rapidly in the next few years, if it is expected to reach the target of 20% by 2020 [
1].
The electrical power produced from renewable energy sources (RES), in particular, the sun and wind, is random and intermittent. Moreover, there is no perfect temporal and spatial correspondence between the availability of RES (the sun and wind) electric energy and fossil fuels and end-user energy demand. Owing to these problems, electrical systems may not be able to guarantee the required standard of reliability of the electrical system, which, as is well known, is very high and determined by the levels of adequacy [
2], safety [
3] and resilience [
4] that can be achieved. Therefore, the electrical system with RES plants has to be equipped with a variety of accumulation technologies, which contribute to deliver different types of service (power and voltage regulation) and contribute to satisfying the electric needs with very different time horizons. Specifically, the time horizon varies in the range of a few milliseconds (ultra-capacitors), days and/or months (Power to Fuel technologies, P2F [
5]), by hours (batteries).
One of the possible P2F technologies involves using part of the electric energy surplus within the electrical system, which integrates RES plants, to produce hydrogen through electrolysis. The hydrogen produced can be adequately stored and converted into electric energy through fuel cells at times when the energy demand is high or can fuel “carbon free” and sustainable mobility systems [
6,
7,
8,
9,
10].
In this context, solid oxide electrolytic cells (SOEs) are able to convert steam and/or carbon dioxide and air into gas rich in hydrogen and/or carbon monoxide and oxygen-rich air with no environmental impact and with a lower electric energy consumption produced from RES.
Solid oxide fuel cells (SOFCs) are able to convert hydrogen and/or carbon monoxide and oxygen-rich air [
11,
12] or biofuels produced by biomass gasification and anaerobic digestion [
13,
14] in electric energy with high conversion efficiency. Some research studies were conducted on innovative components’ materials to reduce the SOFCs operating temperature [
15,
16,
17,
18,
19,
20].
In the literature there are not many articles about fuel production through SOE [
21,
22,
23,
24,
25,
26,
27,
28,
29,
30,
31], that represents a new, emerging and promising research field. Mougin et al. [
21], Diethelm et al. [
22], Alenazey et al. [
23], Kotisaari et al. [
24], Chen et al. [
25] carried out experimental tests for detecting the polarization curves, durability tests and thermal cycling tests on different types of SOE stacks, which operate at intermediate temperatures ranging from 600 to 850 °C and are fed by steam and hydrogen mixtures and air (steam electrolysis) and/or steam, hydrogen and carbon dioxide mixtures and air (co-electrolysis of steam and carbon dioxide).
Cinti et al. [
26] conducted experimental tests on an SOE fed by steam at the cathode inlet and fuel instead of air to the anode inlet, verifying a reduction in the electrical energy required to produce a certain amount of hydrogen, until the fuel percentage utilization factor was not less than 100%. García-Camprubí et al. [
27] have developed and have experimentally validated a stationary simulation model of a reversible solid oxide fuel cell fed by steam and hydrogen mixtures for the estimation of its polarization curves, when it operates both as a fuel cell and as an electrolyzer. Gomez and Hotza [
28] analyzed the state of the art of SOFC/SOE and of their main components: anode, cathode and electrolyte, including an analysis of their production technologies. Milewski et al. [
29] analyzed and evaluated the efficiencies of some possible configurations of an integrated SOE/SOFC system fed by water for the accumulation/delivery of electric energy, Peters et al. [
30] studied different configurations and operating conditions of SOE system fed by steam mixtures in order to evaluate different efficiencies of hydrogen production, and Al Zaharani and Dincer [
31] have developed a simulation model of SOE system fed by steam mixtures in order to conduct an energy and exergy analyses of the same system in different operating conditions.
In this article, experimental studies on an SOE short stack (400 Wel) was carried out and this activity was completed and assisted by a numerical modeling activity of the same device. In particular, the authors have experimentally tested the SOE stack, which operated at intermediate temperatures (IT) ranging from 650 to 750 °C and was fed by various gaseous mixtures of steam, carbon dioxide and hydrogen at the cathode inlet and by air at the anode inlet, for the detection of its polarization and electrical power curves.
With respect to the above-cited authors [
21,
22,
23,
24,
25,
26,
27,
28,
29,
30,
31], who did an experimental activity or numerical modeling activity on SOE short stack, the authors of this article completed the experimental activity on SOE 6-cells short stack, operating both in electrolysis mode and co-electrolysis mode, with the numerical simulation activity through a stationary simulation model of the SOE system (stack and furnace), which was ad hoc formulated and implemented in MatLab language and validated with the experimental data which the same authors acquired at the SOE test bench.
The outputs of the SOE stack simulation model are also the trends of thermal power and efficiency of SOE system, in addition to the polarization curves, anode and cathode exhaust gases compositions at varying the supplied current. The operating temperature, which guarantees the highest hydrogen production, was chosen among those experimentally investigated. In addition, the same simulation model is able to estimate the value of the stack current, for which the SOE system operates in thermal equilibrium condition, and it highlights how this current influences both the SOE system efficiency and the degree of purity of the fuel produced.
2. Numerical Simulation Model
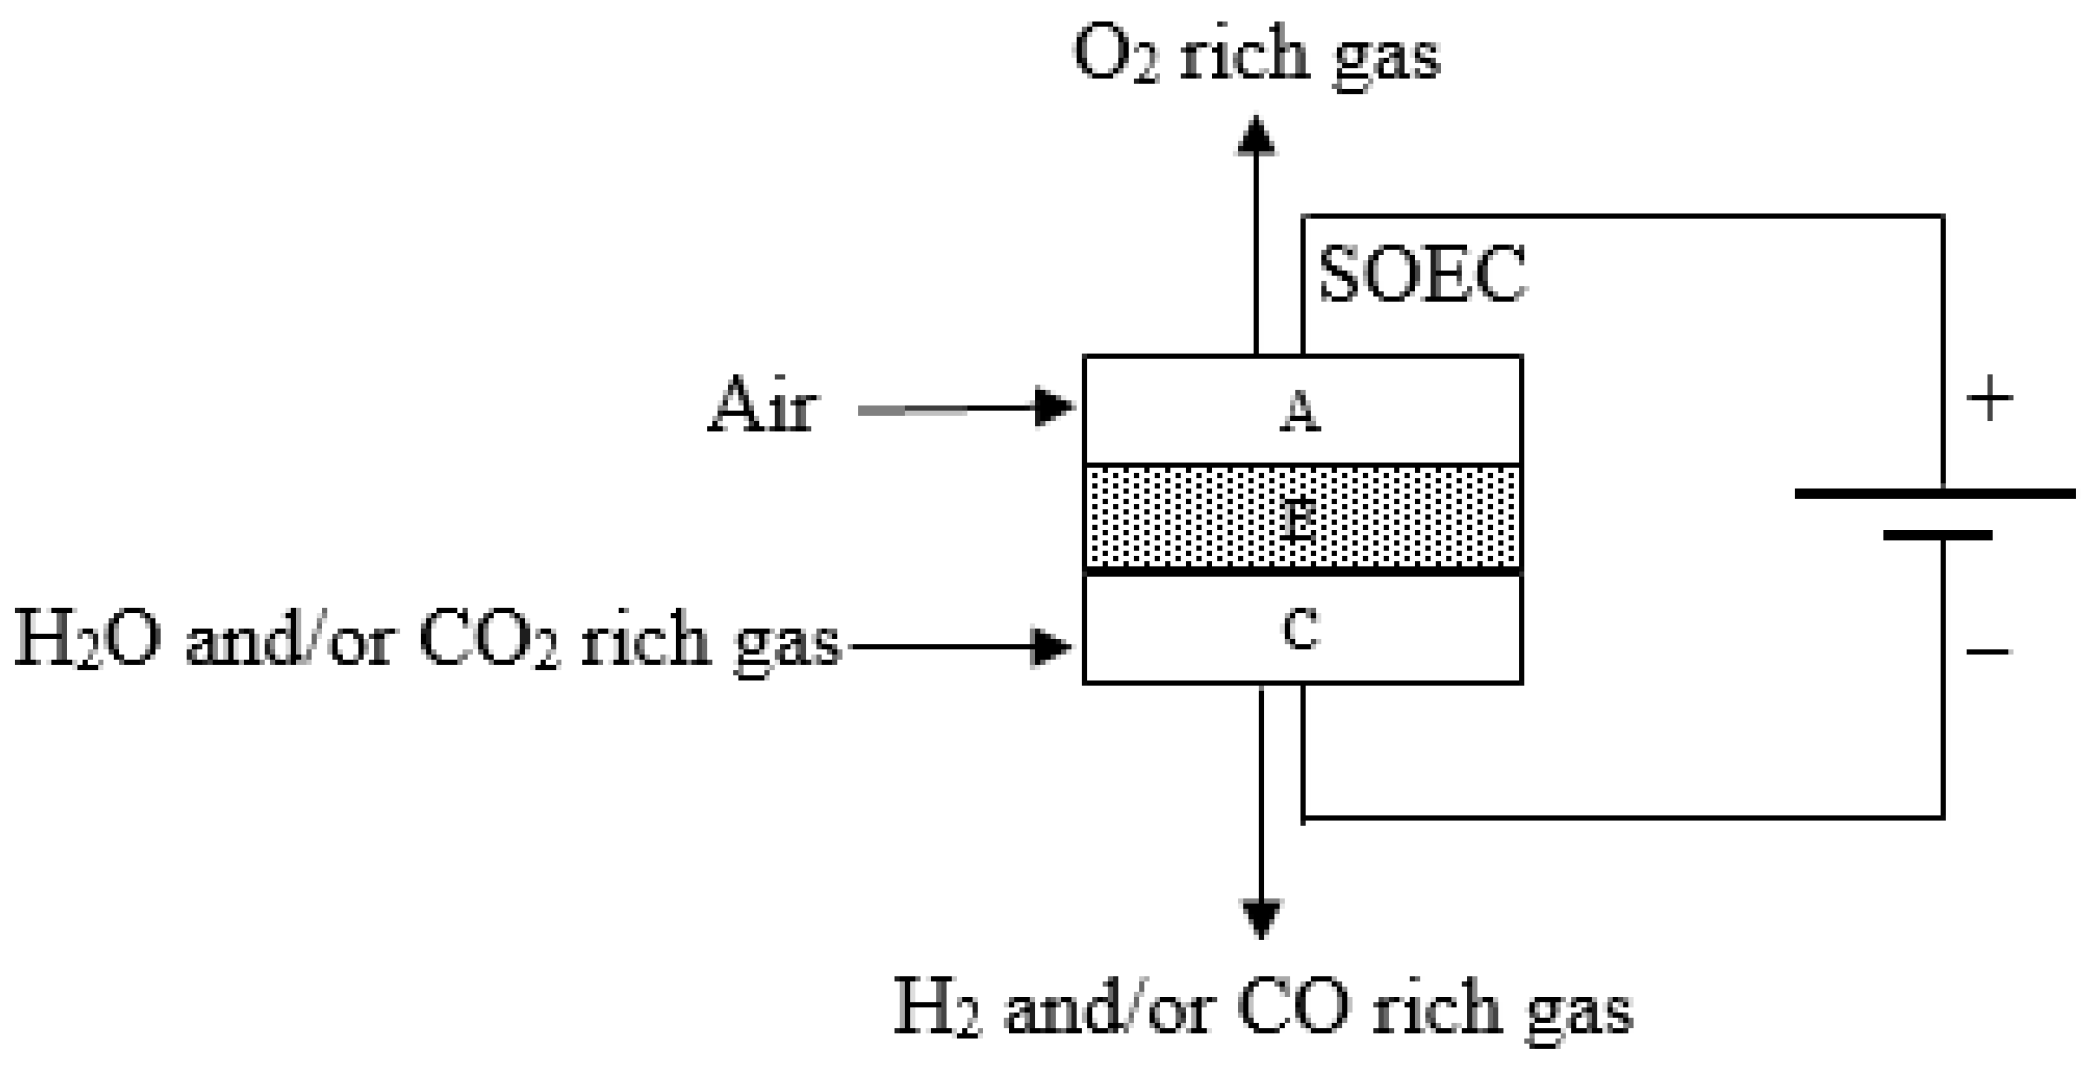
The simplified lay-out of the system with intermediate temperature (IT) solid oxide electrolyzer (SOE) considered is shown in
Figure 1. It comprises an SOE short stack, represented by a single SOE cell, consisting of an anode (A), a cathode (C) and an electrolyte (E), and it is fed by a power supply. In
Figure 1, the power supply is represented as a real continuous voltage generator.
- Chemical reactions:
At the SOE cathode, which is fed by a gaseous mixture rich in steam and/or carbon dioxide, electrochemical reactions (1a) and (1b) take place:
and the reverse water gas shift (RWGS) chemical reaction (1c):
At the anode the electrochemical reaction (2) takes place:
The SOE total chemical reactions producing H
2, CO and O
2 are (3) and (4):
- Electrolyzer:
At the cathode the main Equations are (5a), (5b), (5c) and (5d):
Equation (5a) governs the chemical equilibrium of the RWGS chemical reaction, Equation (5b) defines the conversion degree of the RWGS chemical reaction, Equation (5c) defines the parameter q, which represents the ratio between the molar flows of CO2 and H2O consumed by cathode electrochemical reactions (1a) and (1b), and , while Equation (5d) governs the total electrochemical consumption of CO2 and H2O. In the Equations (5a)–(5d):
is the equilibrium constant of the RWGS chemical reaction (1d), calculated at the SOE average operating temperature, ;
is the molar flow of CO2 converted to CO at the cathode through the RWGS chemical reaction (1c) expressed in mol·s−1;
and are the molar flows of CO2 and H2O consumed by cathode electrochemical reactions (1a) and (1b) expressed in mol·s−1.
, , , are the molar flows of CO2, CO, H2, H2O at the cathode inlet expressed in mol·s−1;
is the RWGS chemical reaction degree.
is the ratio between the CO2 and H2O molar flows electrochemically consumed at the cathode;
, and are respectively the current density and the active area of the electrolytic cell and the Faraday constant expressed in A cm−2, cm2 and C·mol−1.
In this article the authors set the value of q on the basis of their experimental data acquired at the SOE test bench and on the basis of Diethelm et al. experimental observation [
22] that: “the steam splitting is the predominant electrochemical reaction, whereas CO
2 dissociation occurs principally through the reverse water-gas-shift reaction”.
The molar flows of the chemical species in the cathode exhaust gas (H
2O, CO, CO
2, H
2, N
2) are calculated using Equations (5e):
where
is the stoichiometric coefficient of the
ith chemical species in the
jth chemical reaction, which is positive or negative in cases where the same chemical species is respectively a product or reagent in the
jth chemical reaction.
At the anode, the main Equation is (6a):
where
is the molar flow of oxygen produced at the anode expressed in mol·s
−1.
If technical air consisting of O
2 and N
2 is considered as the anode feeding gas (to simplify), the O
2 and N
2 molar flows at the anode outlet,
and
are calculated by Equation (6b):
Energy Analisys of the System
Considering at the cathode inlet a gaseous mixture consisting mainly of steam and carbon dioxide, the real voltage to be applied to the same electrolytic cell,
is calculated by Equation (7):
where
is the Nernst voltage of the electrolytic cell expressed in V;
is the ohmic and contact resistance of the electrolytic cell expressed in cm
2;
is the polarization resistance of the electrolytic cell expressed in cm
2;
and
were calculated considering the experimental data acquired by the authors.
The electrical power required by the SOE stack, consisting of a number,
of electrolytic cells,
is calculated by the Equation (8):
The electric power required by the power supply,
expressed in W is calculated by Equation (9):
where
is the electrical efficiency of the power supply.
The thermal power surplus produced by the stack,
expressed in W is calculated by Equation (10):
where
is the thermal power generated by irreversibility, Ohm and contact overvoltage and polarization phenomena in the stack expressed in W;
is the thermal power absorbed by the RWGS chemical reaction in the stack expressed in W;
are the molar flows of steam and carbon dioxide electrochemically consumed in the stack expressed in mol·s
−1;
and
are the electrolytic cell operating temperature expressed in K and the number of electrolytic cells in the stack;
and
are the molar entropy variations referred to chemical reactions (3) and (4) expressed in J·mol
−1·K
−1;
is the molar flow of carbon dioxide consumed by RWGS chemical reaction in the stack expressed in mol·s
−1;
is the molar enthalpy variation referred to RWGS chemical reaction expressed in J·mol
−1.
The thermal power required to heat the feeding gases at the stack inlet,
expressed in W is calculated by Equation (11):
where
and
are the mass flows of the gas mixtures and of the air at the cathode and anode inlets expressed in kg·s
−1;
and
are the temperatures at the cathode and anode inlets expressed in K;
and
are the constant pressure specific heats of the gas mixtures and of the air at the cathode and anode inlets expressed in J·kg
−1·K
−1.
If the SOE system is in thermal equilibrium, the operating condition (12) must be verified:
where
is the thermal power produced by furnace expressed in W.
This condition expresses the equality of the thermal powers and .
The net production efficiency of the SOE system is calculated through Equation (13):
where
and
are the mass flows of hydrogen and carbon monoxide produced expresses in kg·s
−1;
and
are the lower heating values of hydrogen and carbon monoxide expressed in J kg
−1;
is the total additional thermal power (>0) required by the SOE system (SOE stack and furnace) expressed in W;
is the thermal power required to produce the steam at the stack inlet starting from water at a temperature equal to 25 °C at the SOE system inlet expressed in W;
is the ratio between the electrical and thermal reference efficiencies, which is used to convert the thermal power
in equivalent electrical power.
The values of and are set equal to two reference values, 0.38 (electrical efficiency of a thermoelectric plant) and 0.9 (thermal efficiency of a steam generator).
Since the SOE stack operates at atmospheric pressure the electric power required to compress the feeding gases is neglected.
4. Validation of Numerical Simulation Model
The stack simulation model was formulated and implemented in Matlab language and a calculation code named ‘SOE’ was produced.
The calculation code was used to carry out the electrical characterization of the stack fed by steam mixtures (gaseous mixtures ‘a’, ‘b’ and ‘c’) and air and by the steam-CO
2 mixture (gas mixture ‘d’) and air. The compositions of gas mixtures ‘a’, ‘b’, ‘c’ and ‘d’ are shown in
Table 3. The operating temperature was considered to be at 750 °C, because at this temperature, as stated above, the stack experimentally obtained the highest H
2 production.
The main input data of the calculation code are shown in
Table 4.
The voltage absolute percentage error,
was defined by the Equation (14):
where
and
are the experimental and theoretical voltages for the
data number expressed in V.
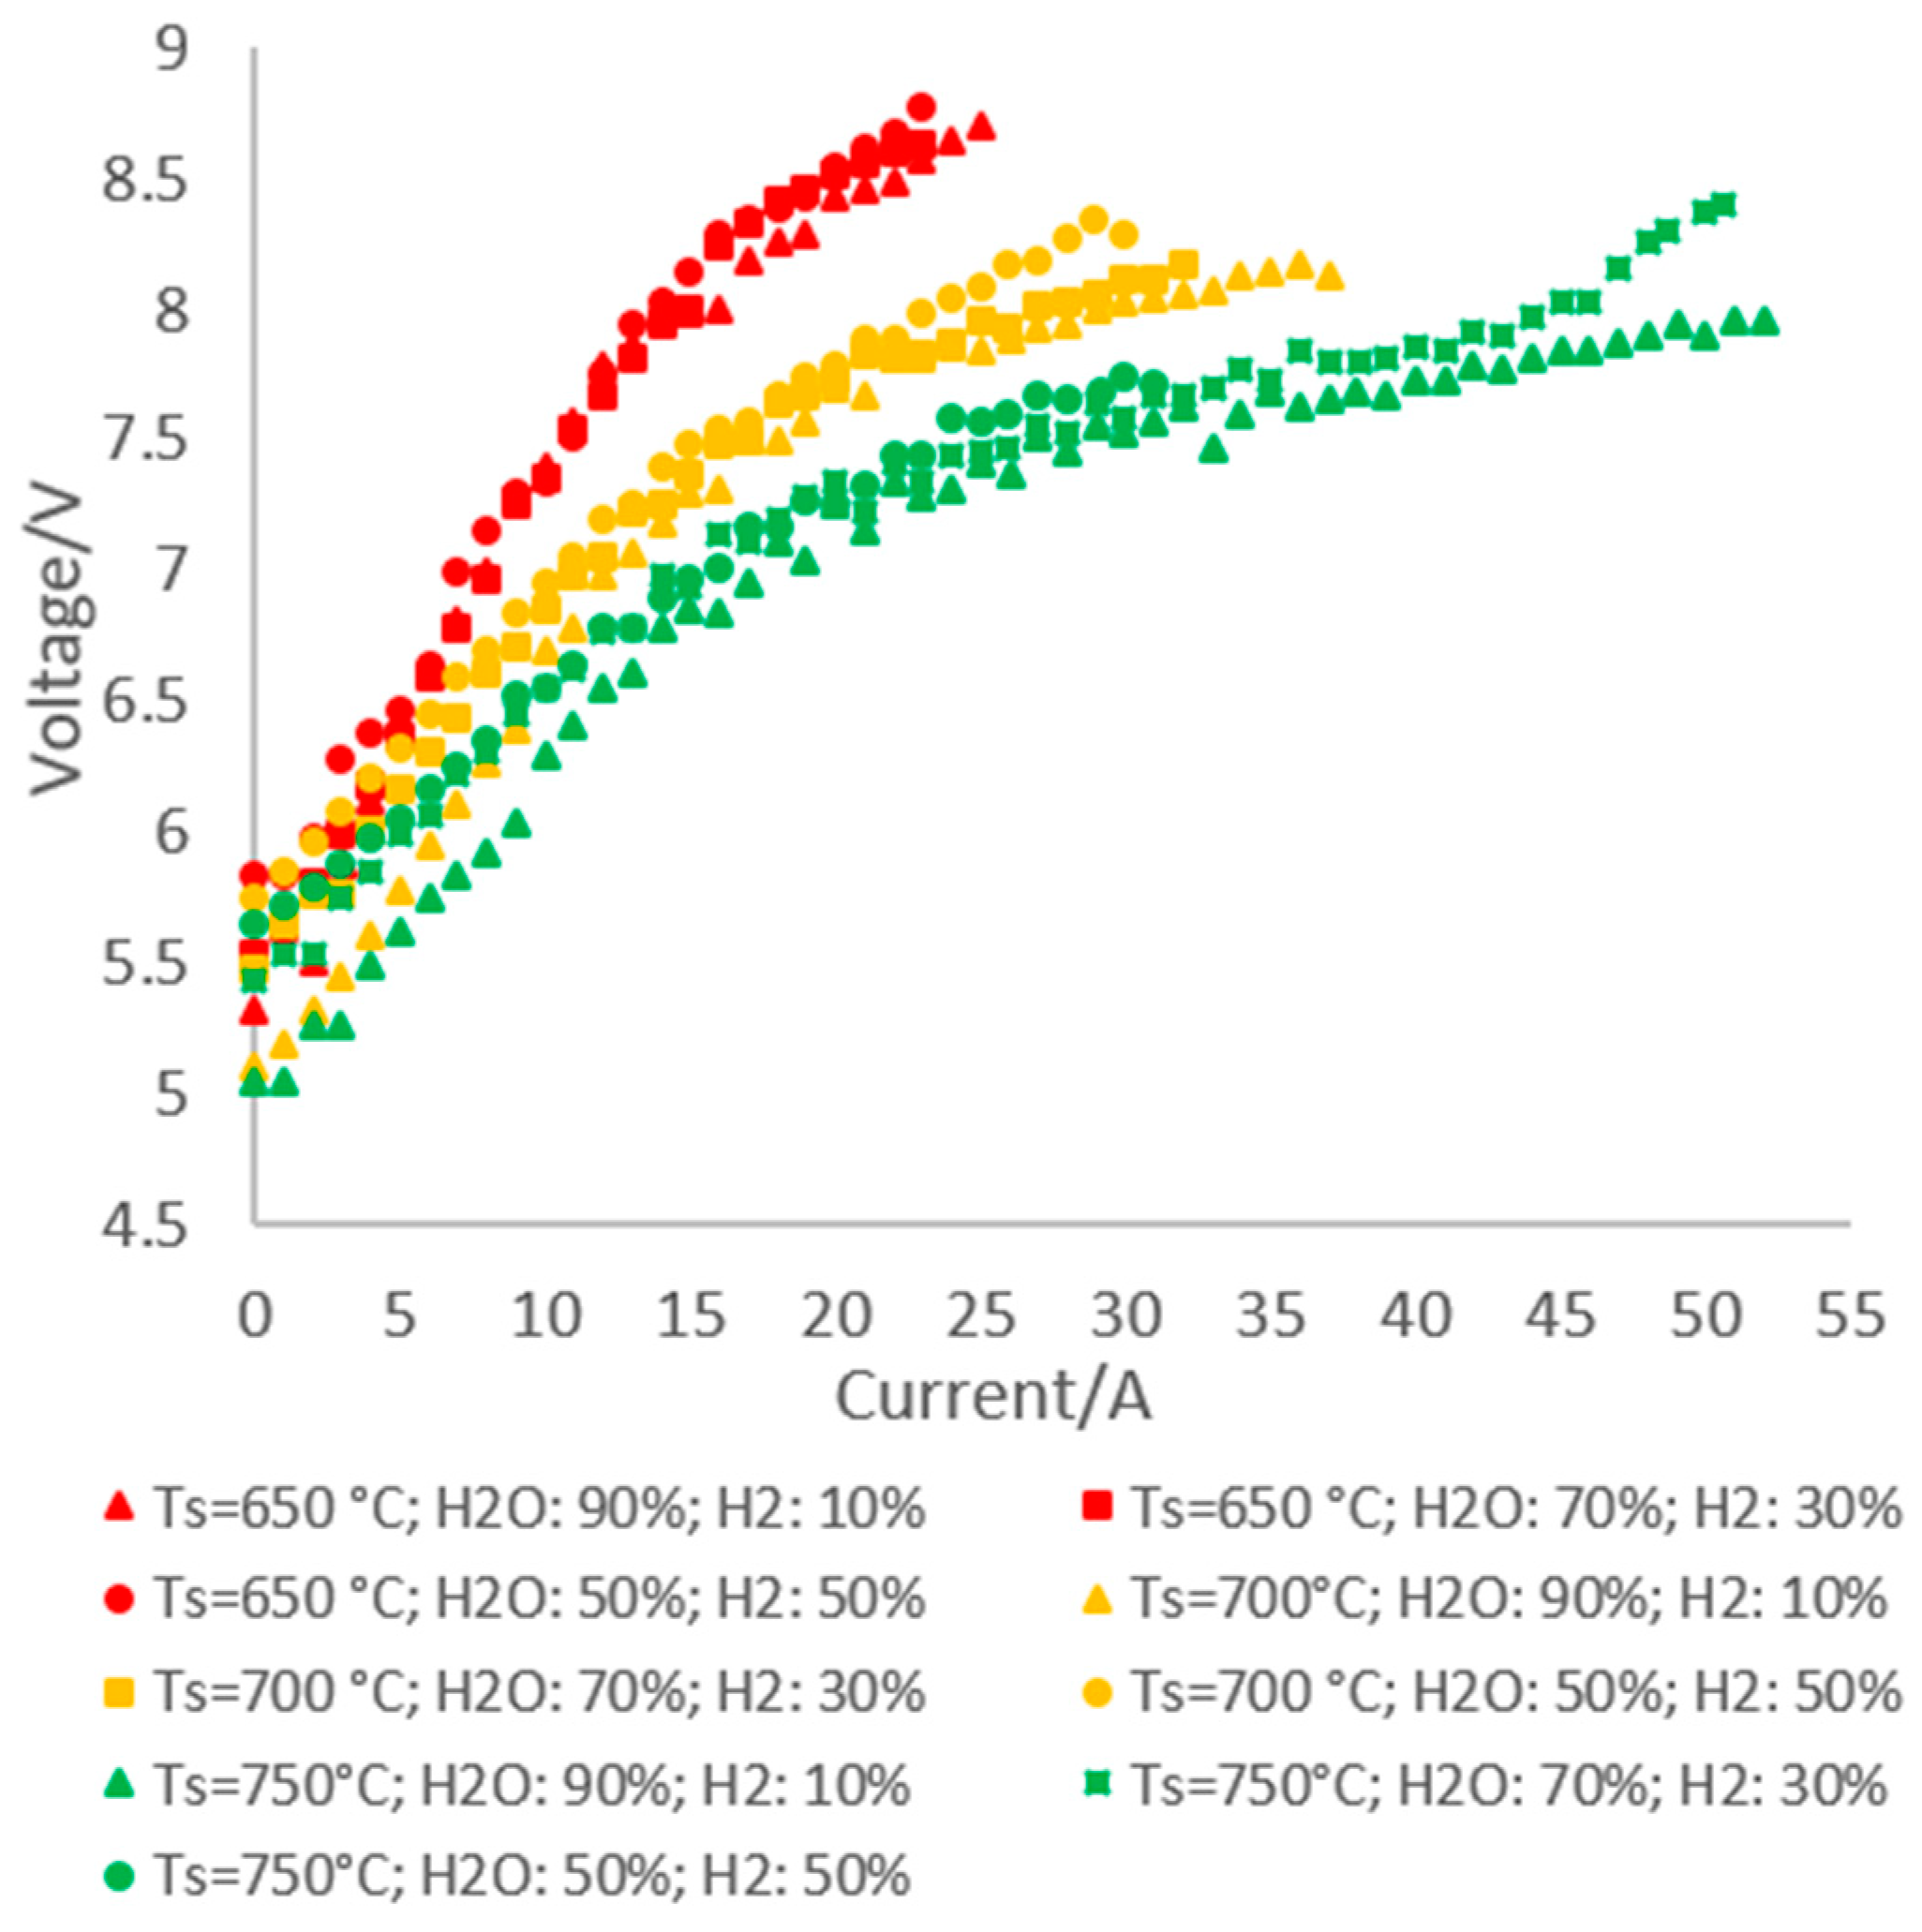
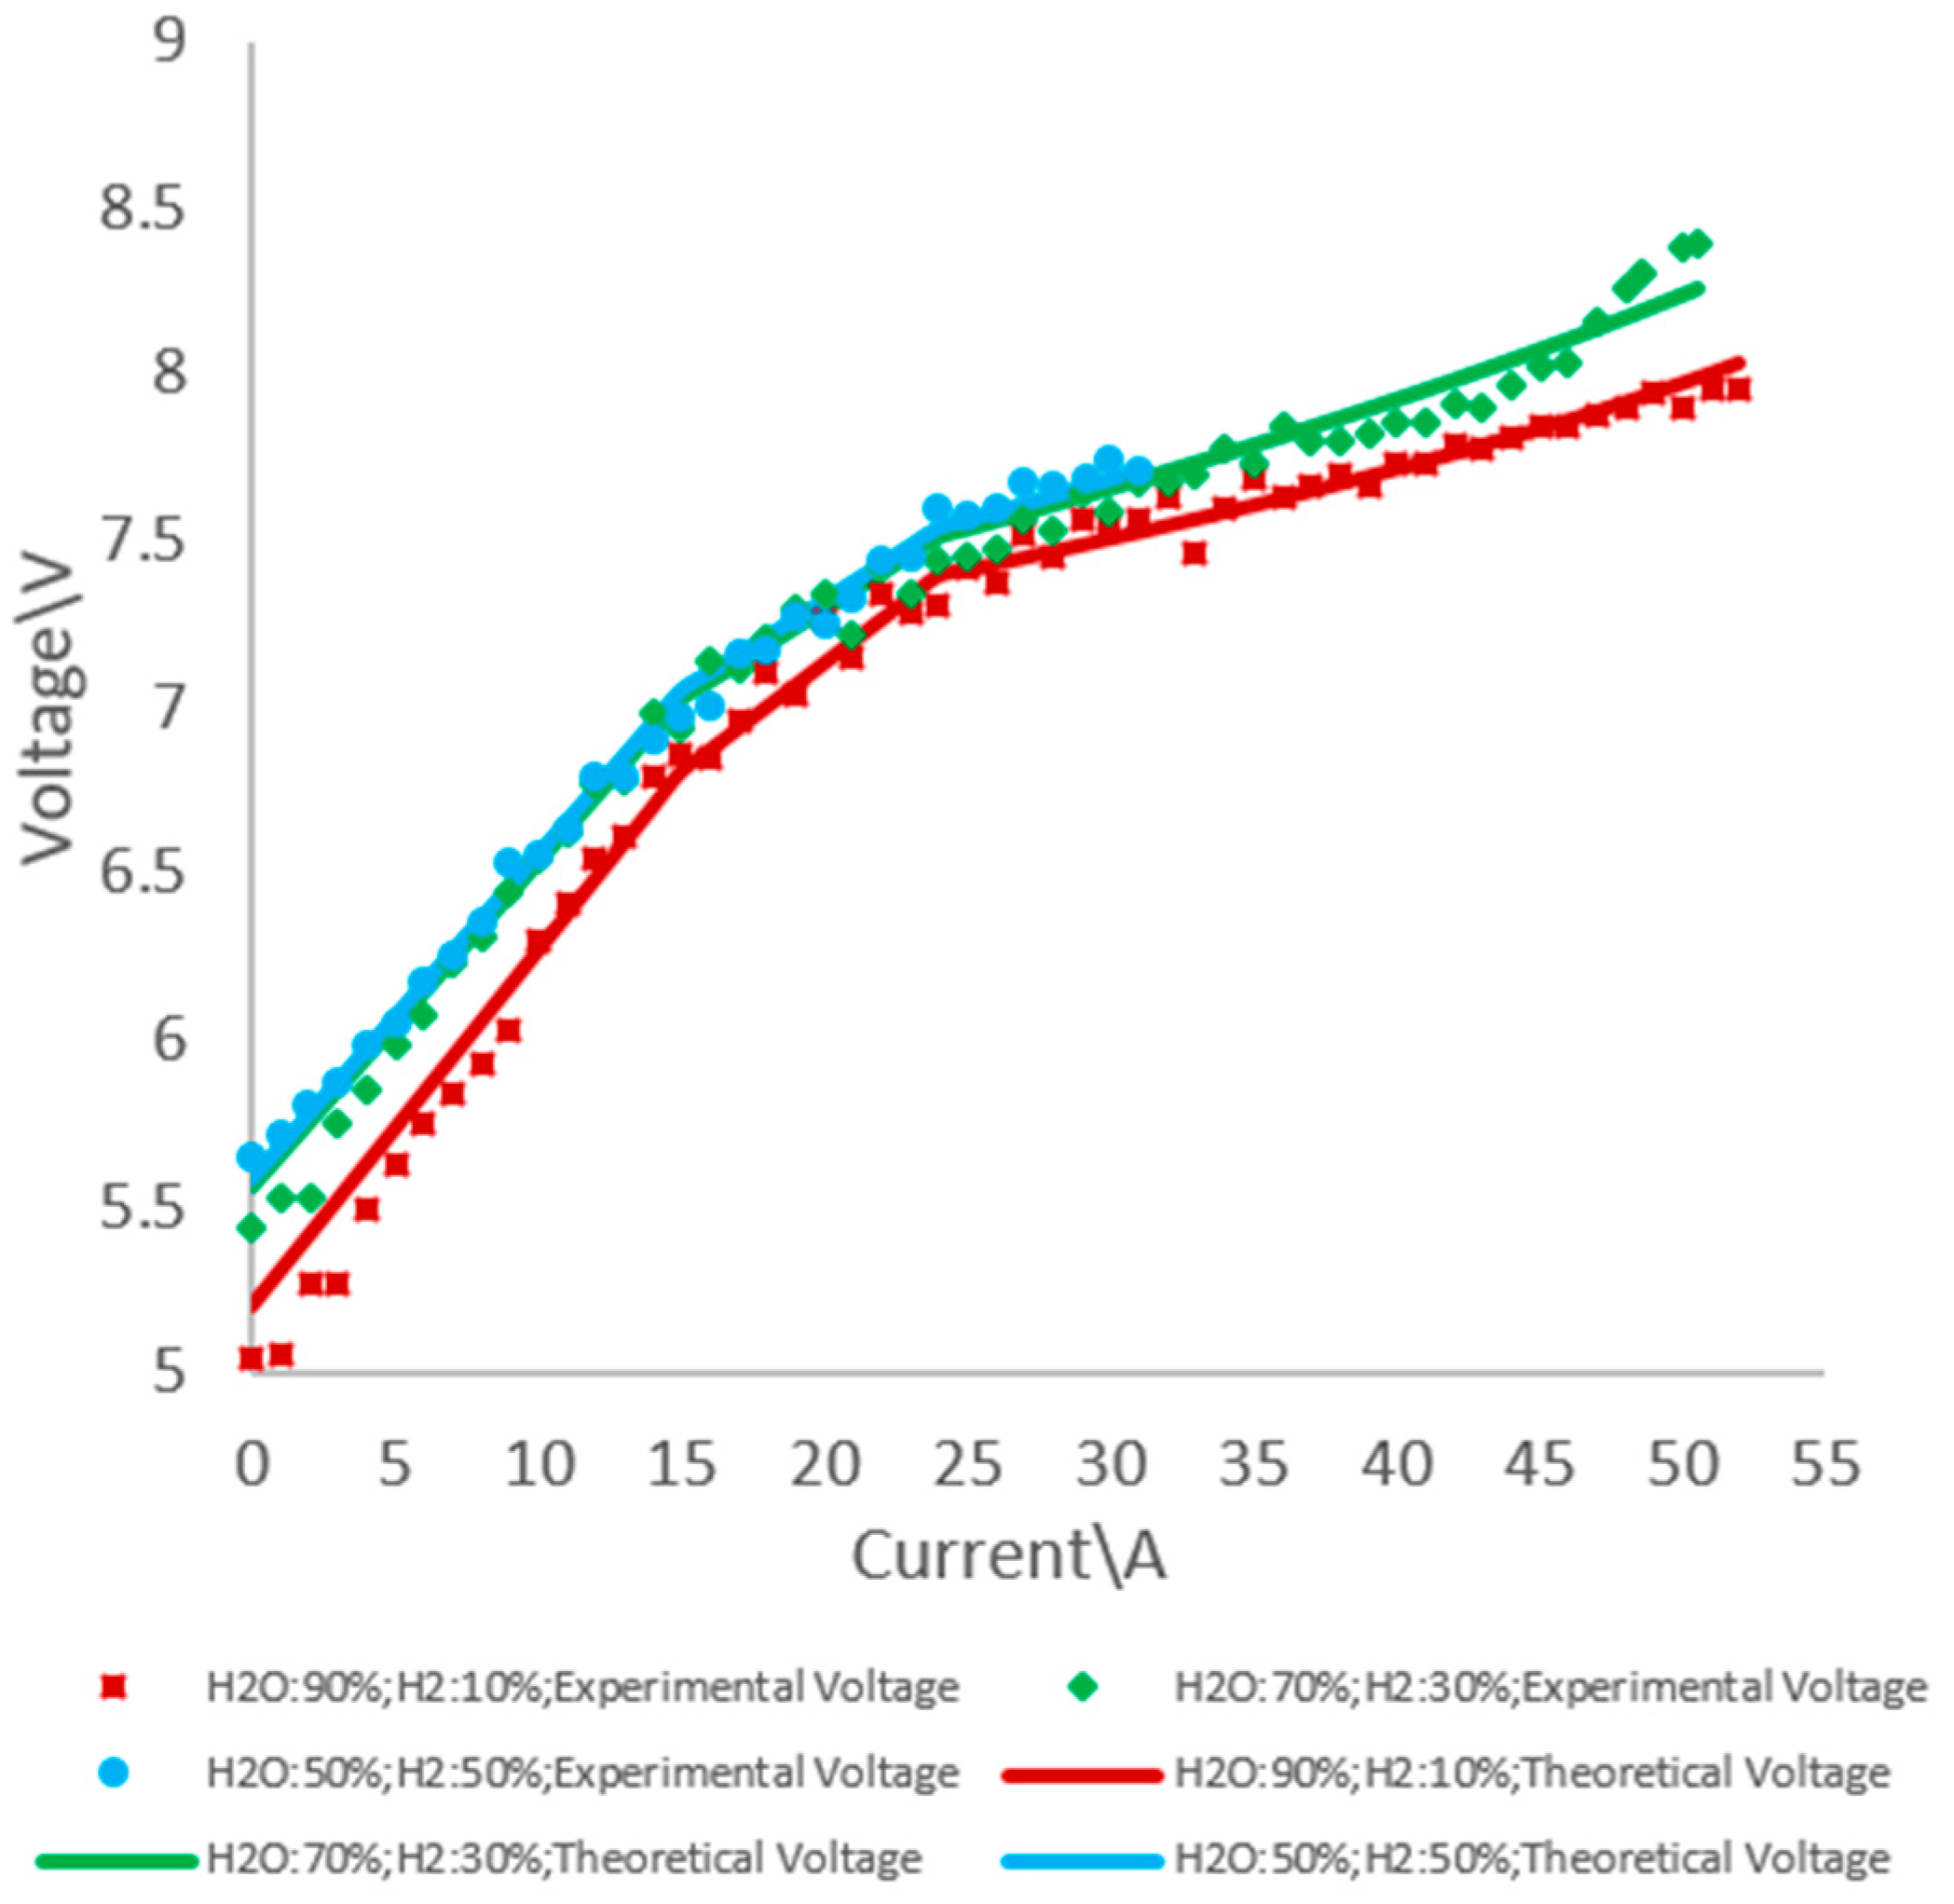
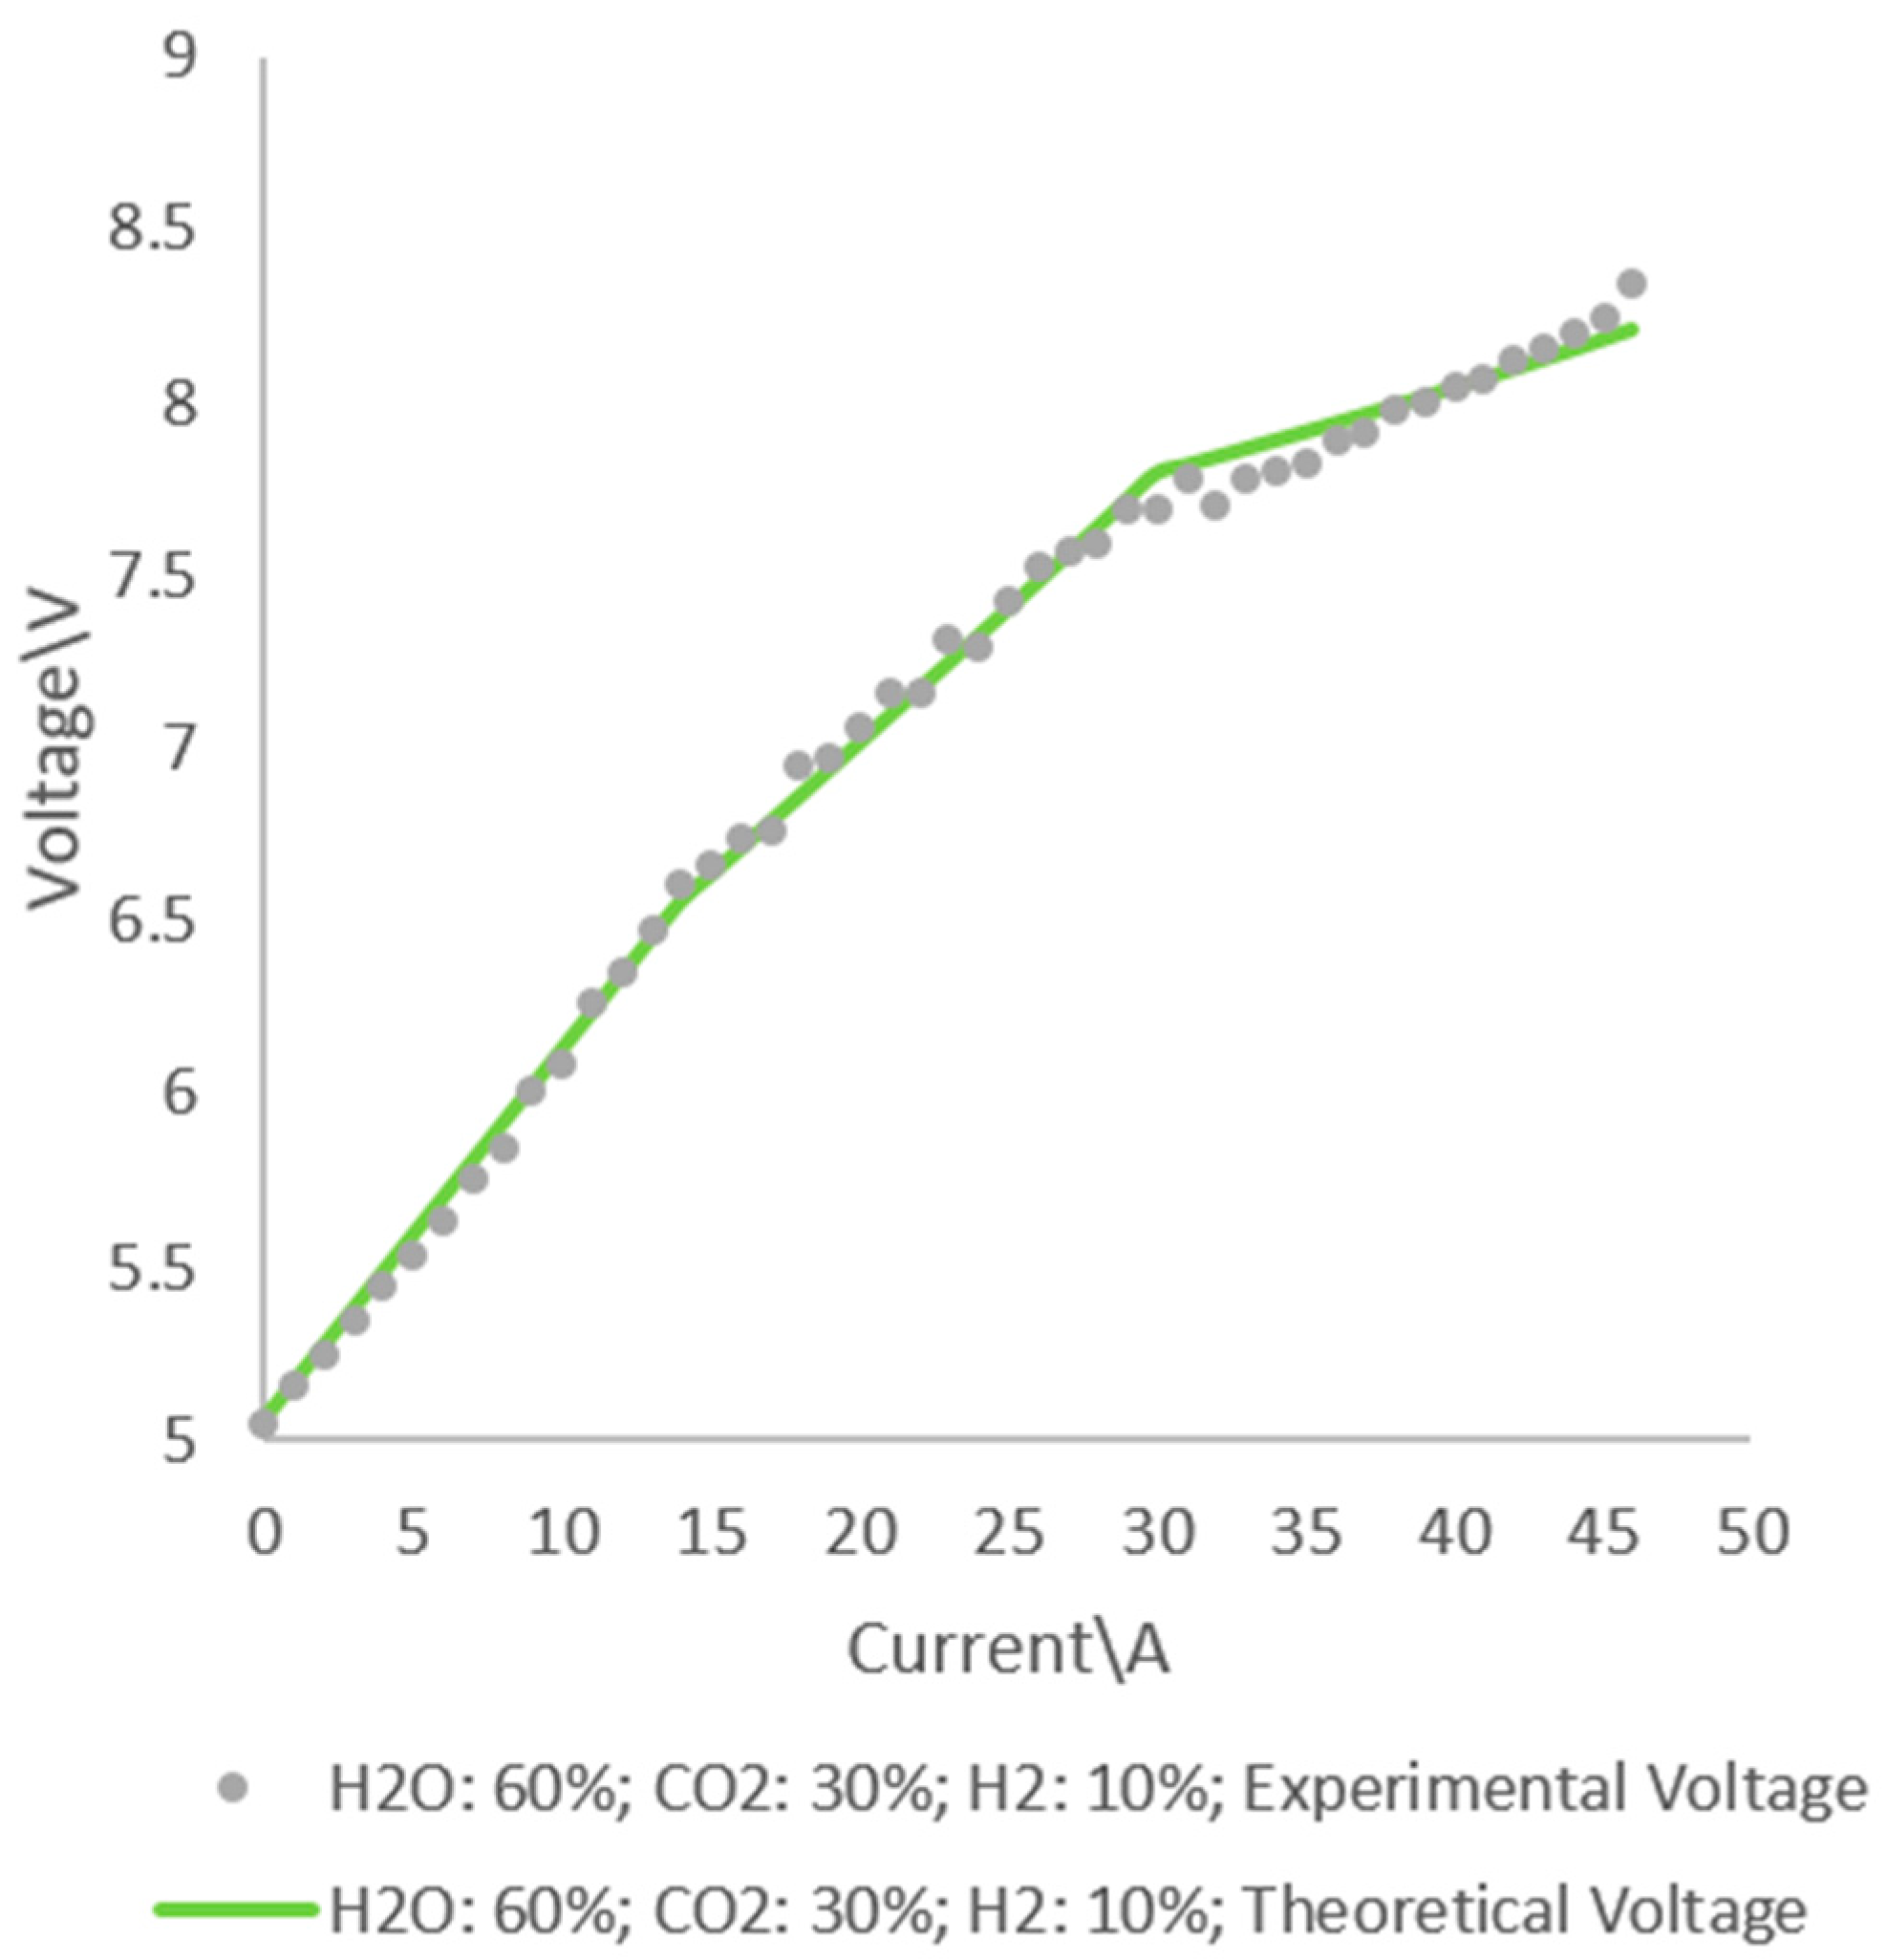
Figure 6 and
Figure 7 show the comparisons of the theoretical polarization curves and the voltage and current experimental data (
Vs-Is) of the stack fed respectively by the steam mixtures and air, and by the steam-CO
2 mixture and air. The absolute percentage errors were found to be respectively 0.99, 0.93, 0.48 and 0.65 for the three steam mixtures and for the steam-CO
2 mixture. These absolute percentage errors are very low in the specific application, therefore, for the gas mixtures considered there was a good agreement between the theoretical polarization curves obtained by SOE calculation code and the experimental (
Vs-Is) data.
5. Numerical Simulations and Results Analysis
The first SOE stack campaign was carried out through the SOE calculation code. In this test campaign, the trends of the total thermal power,
of the net production efficiency,
and of the anode and cathode exhaust gases compositions,
xi,out,a and
xi,out,ca for the stack fed by the three steam mixtures (gaseous mixtures ‘a’, ‘b’ and ‘c’) and air was traced varying the stack current,
.
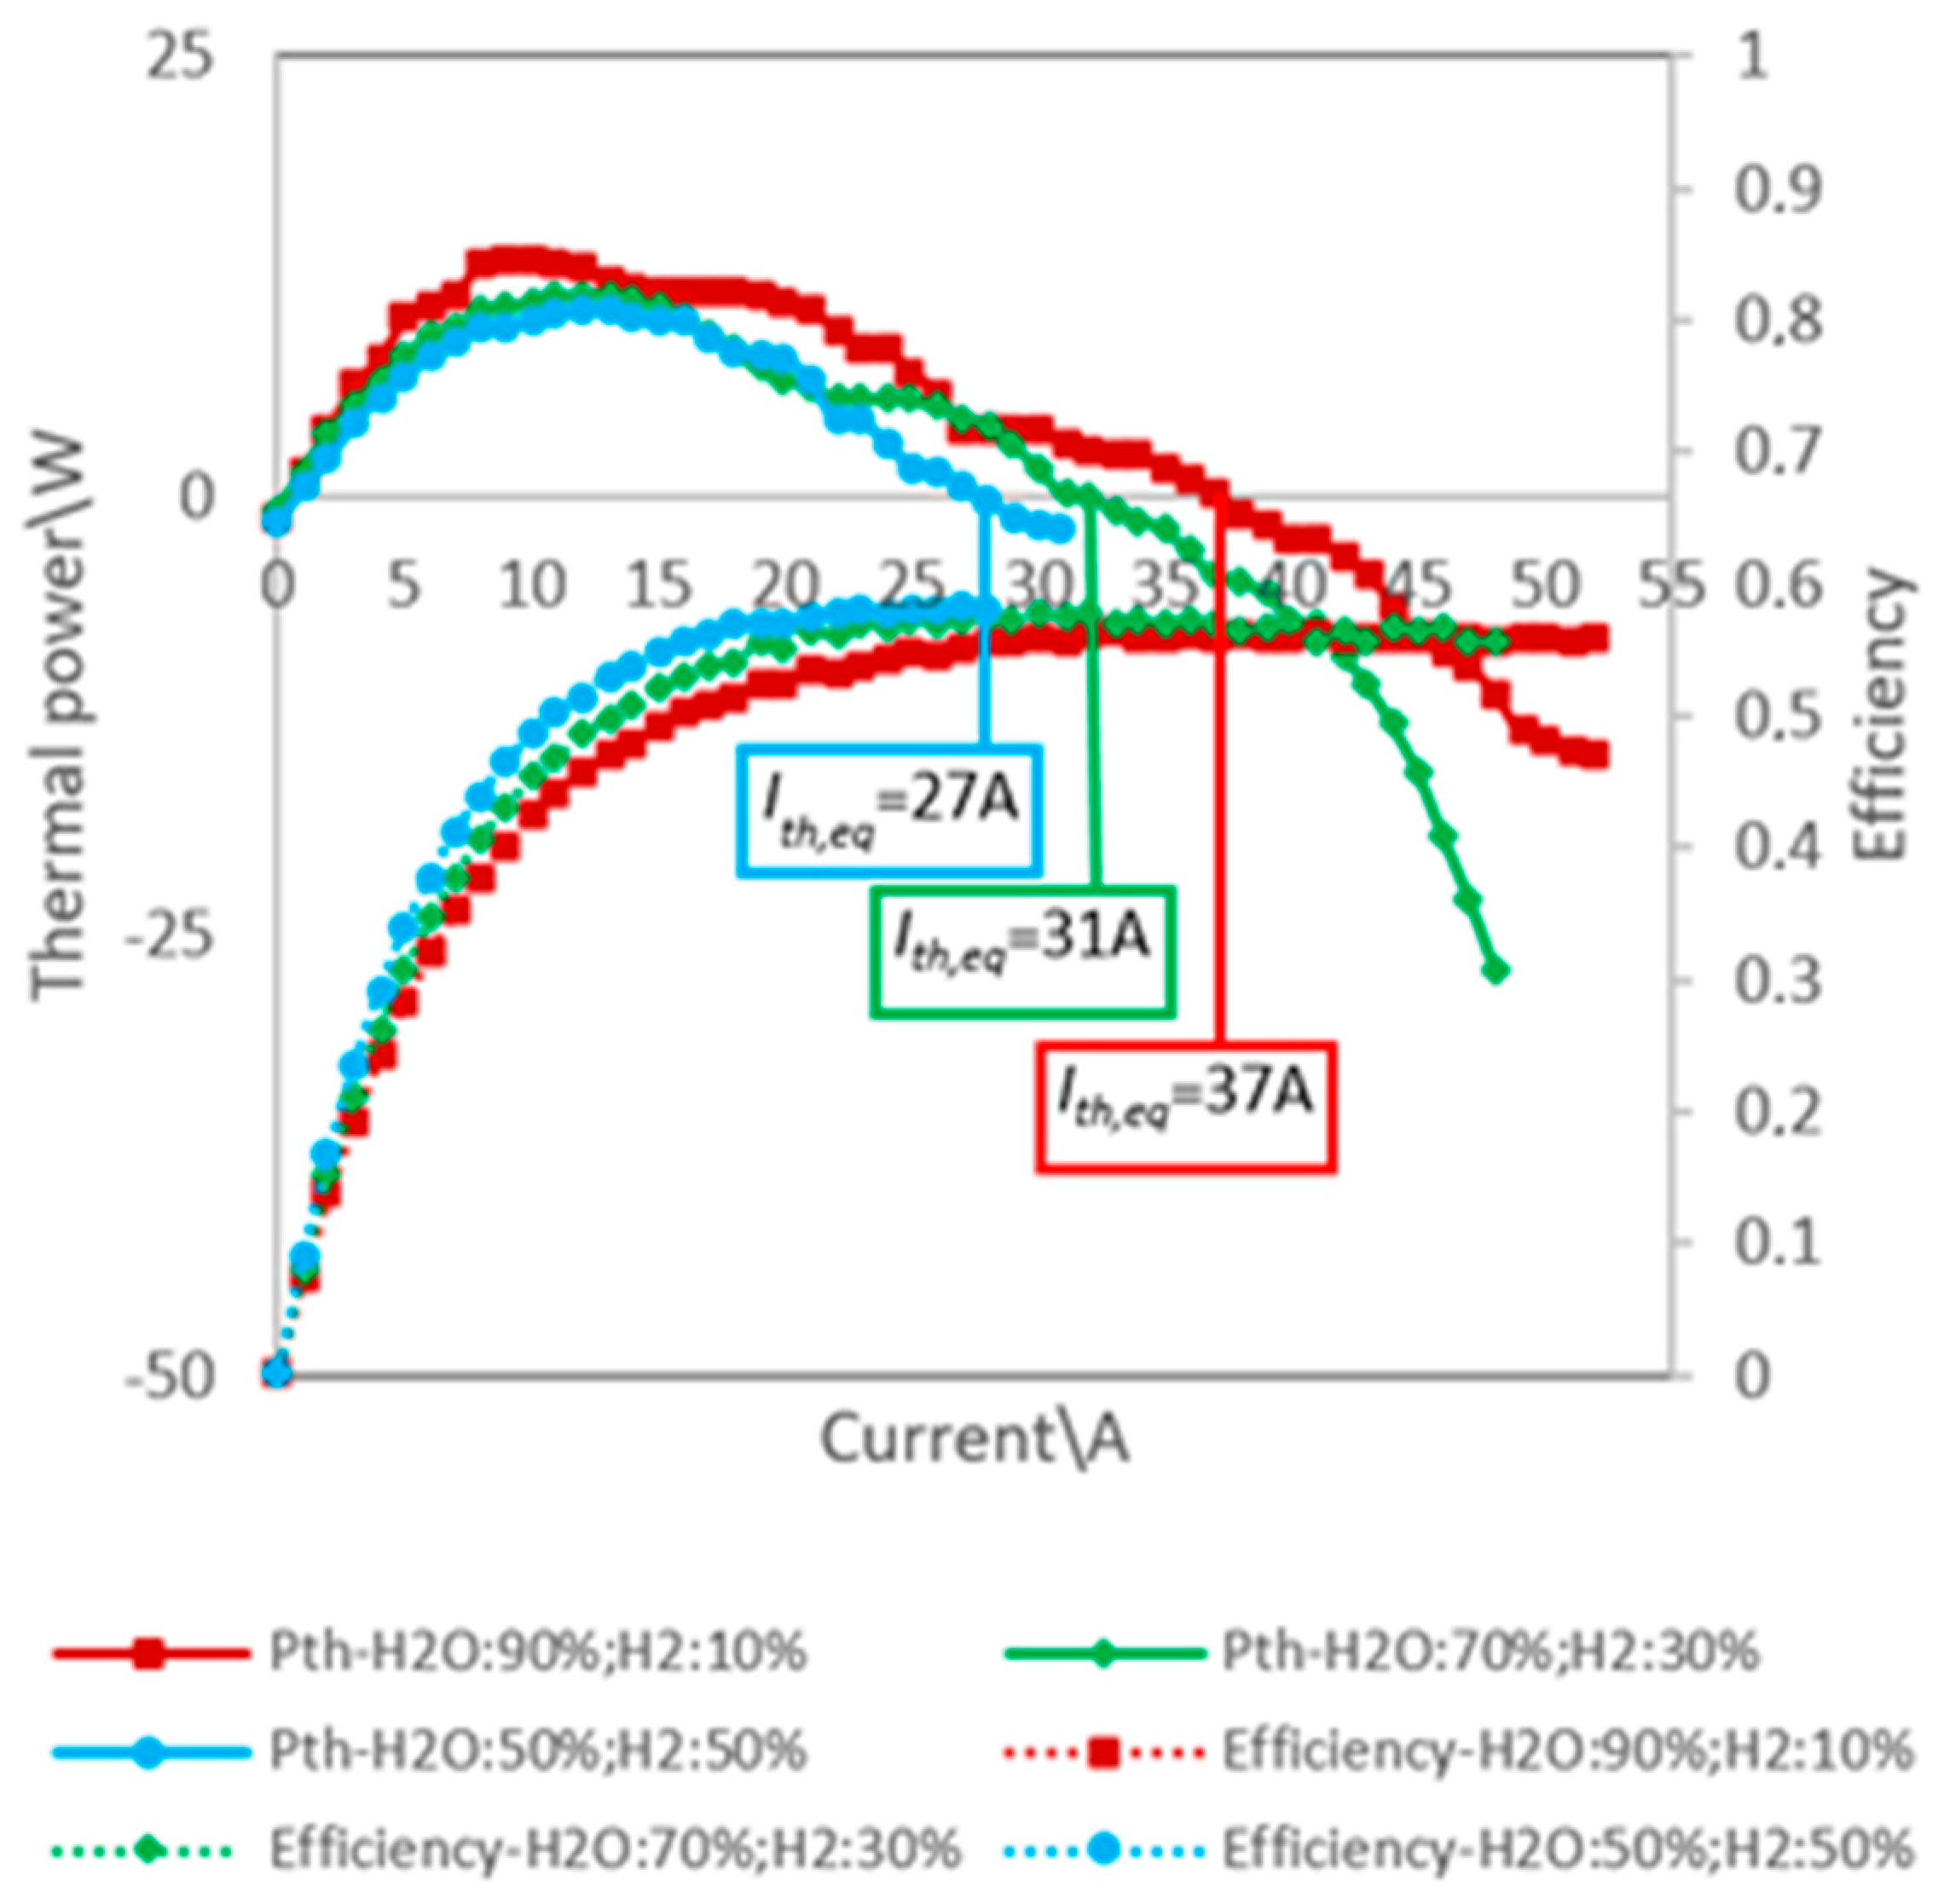
Figure 8 shows the trends of
and
for the stack fed by the three steam mixtures and air at varying
.
For the three steam mixtures the thermal powers produced by the furnace,
are set, so that the SOE system (stack and furnace) operates at the maximum production efficiency in the thermal equilibrium condition.
Figure 8 shows that the SOE system reaches the thermal equilibrium condition at three different operating currents,
Ith,eq of about 37 A, 31 A and 27 A for the three steam mixtures.
When the stack current increases, the additional thermal power required by the SOE system (SOE stack and furnace), first is positive and increases then is positive and decreases until it is zero at the SOE system (stack and furnace) thermal equilibrium current. When stack current is greater than the SOE system thermal equilibrium current, is negative and continue to decrease.
Figure 8 shows that the stack reaches the maximum production efficiency in the SOE system (stack and furnace) thermal equilibrium condition when it is fed by steam mixtures.
The SOE system reaches the maximum value of the net maximum H2 production efficiency equal to about 0.60, when it is fed by the H2 and steam equimolar mixture in (steam mixture ‘c’). When the steam content in the gas mixture at the stack inlet decreases, the thermal power required for the steam pre-heating decreases much more than the electric power absorbed by the stack increases. This increment is due to the increment of polarization overvoltage.
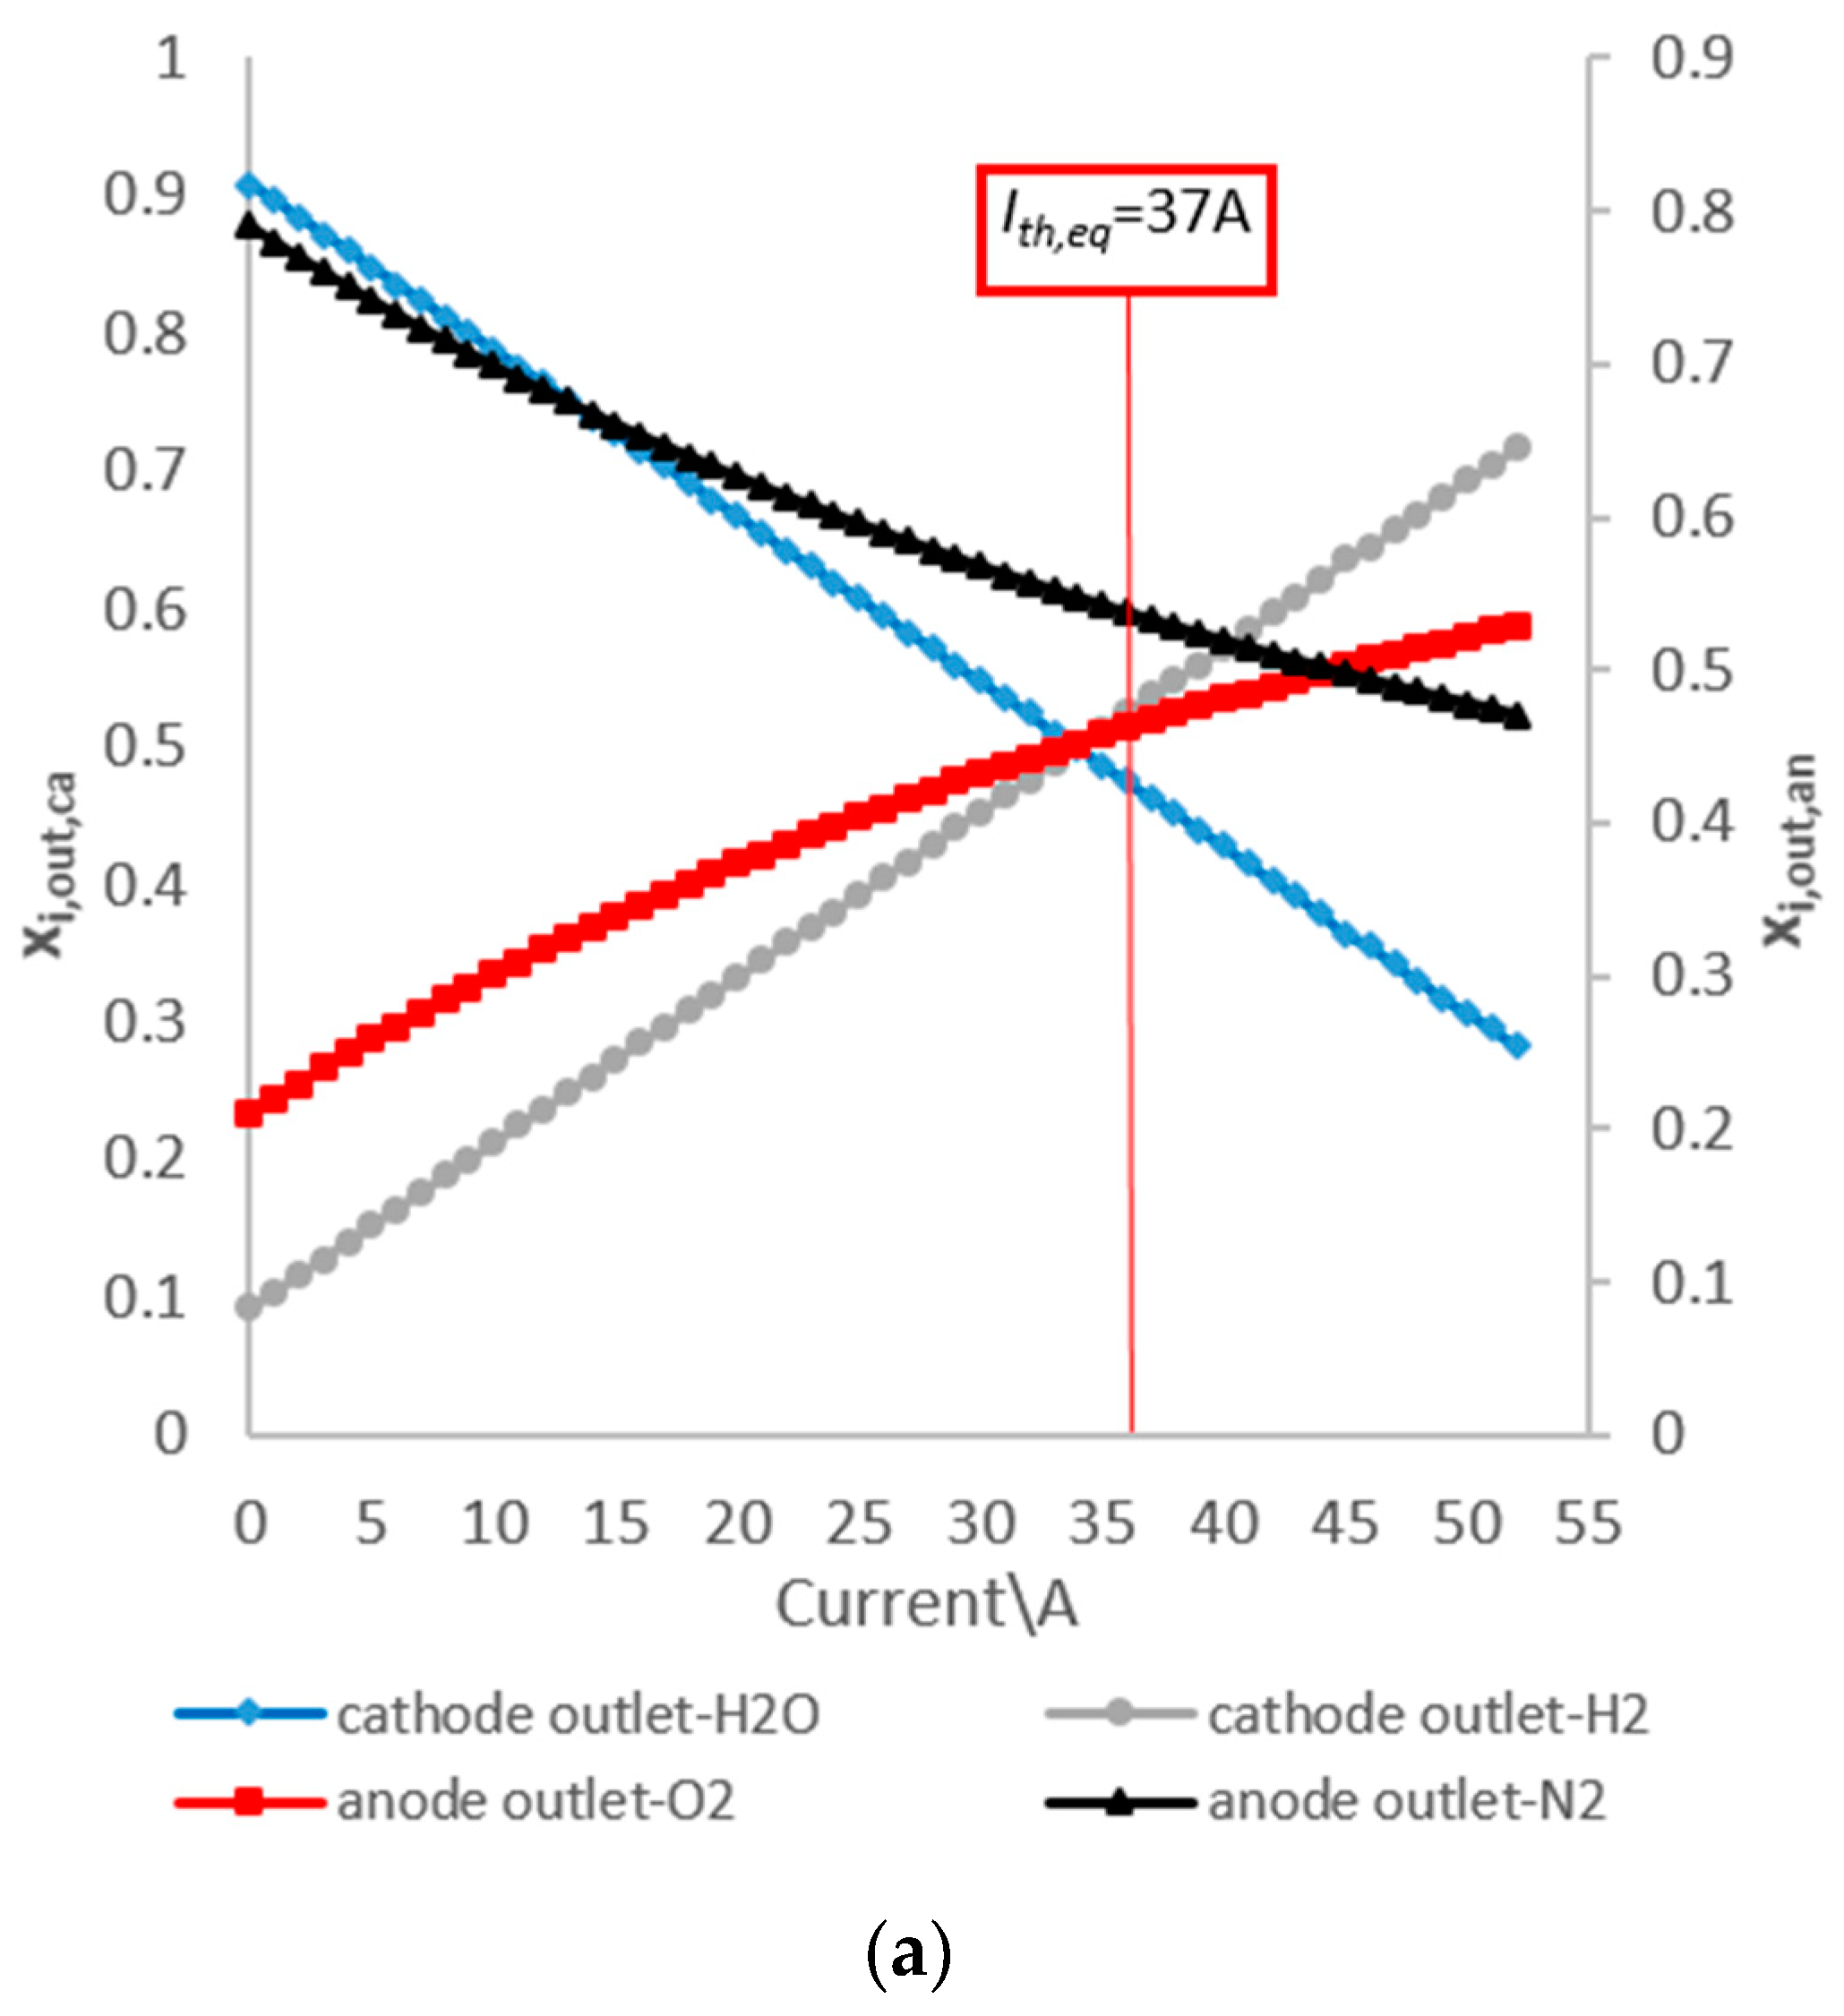
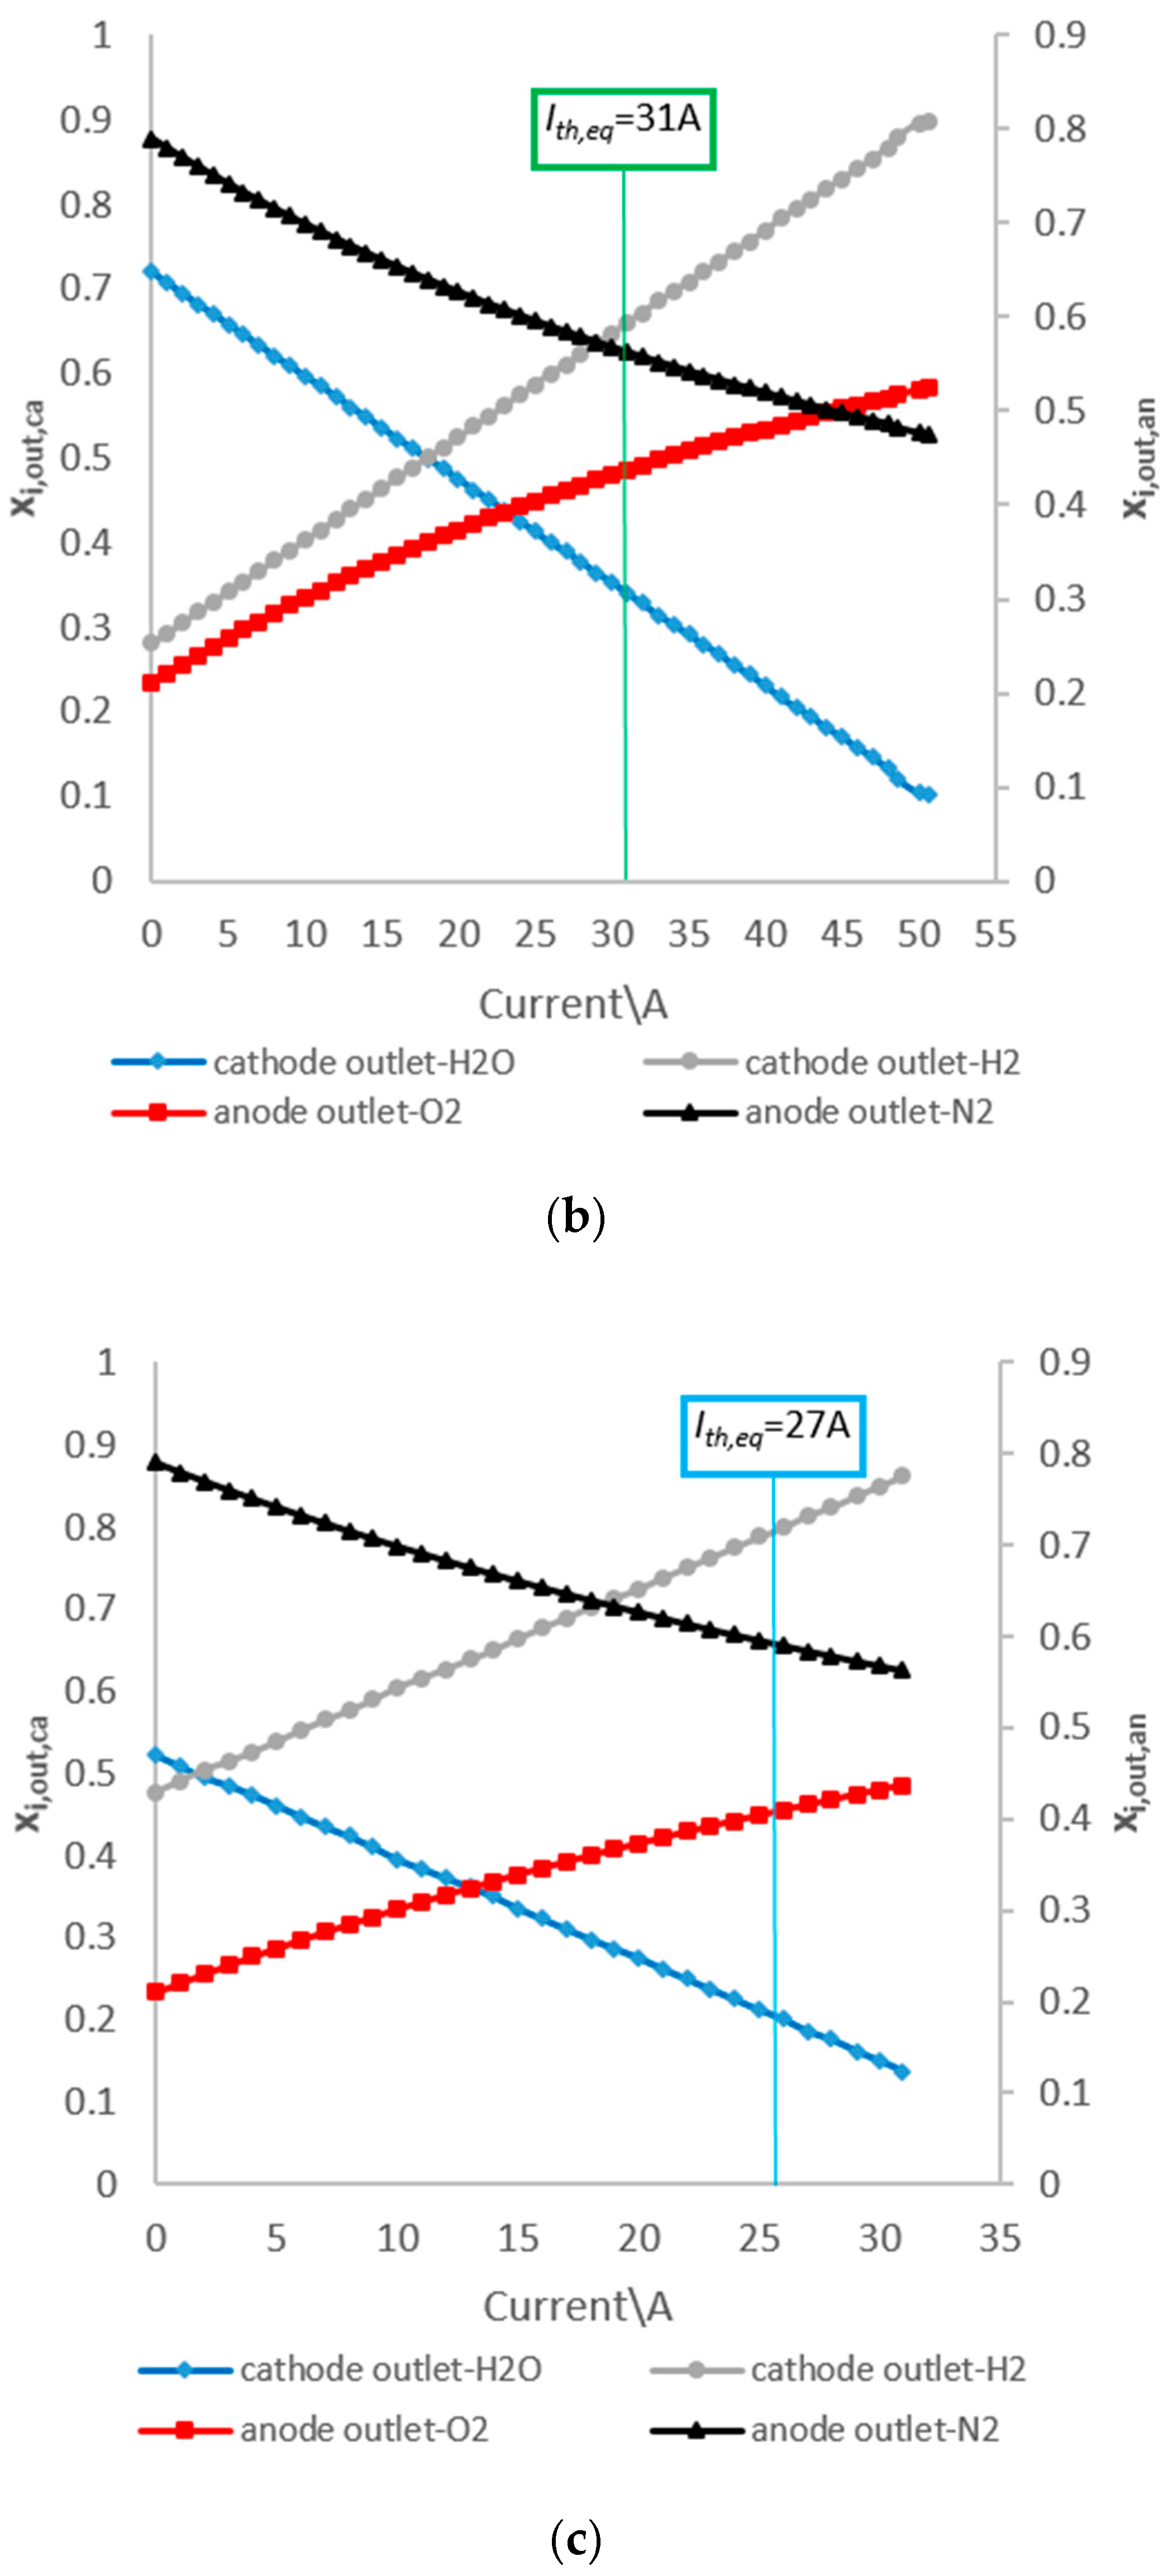
Figure 9 shows the trends of
xi,out,a and
xi,out,ca for the stack fed by the three different steam mixtures and air at varying
with the three respective SOE system thermal equilibrium currents evaluated. The Figure shows that, coherently with the theoretical study of this discipline, in the stack cathode and anode exhaust gas mixtures the H
2 and O
2 contents increase, when the stack current increases, since the quantities of H
2 and O
2 produced by the stack increase. In addition, as was expected, it should be noted that at the SOE system (stack and furnace) thermal equilibrium current, the cathode gas mixture leaving the stack with the highest hydrogen content, of about 80%, is obtained when the stack is fed by the H
2 and steam equimolar mixture (steam mixture ‘c’), since this stack inlet mixture has the highest H
2 amount. Therefore, the value of
Ith,eq (SOE system thermal equilibrium current) influences the purity degree of H
2 and O
2 rich gas mixtures at the stack outlet.
Subsequently, a further test was carried out. In this test, the trends of
,
,
xi,out,a and
xi,out,ca for stack fed by the steam-CO
2 mixture and air at varying
.
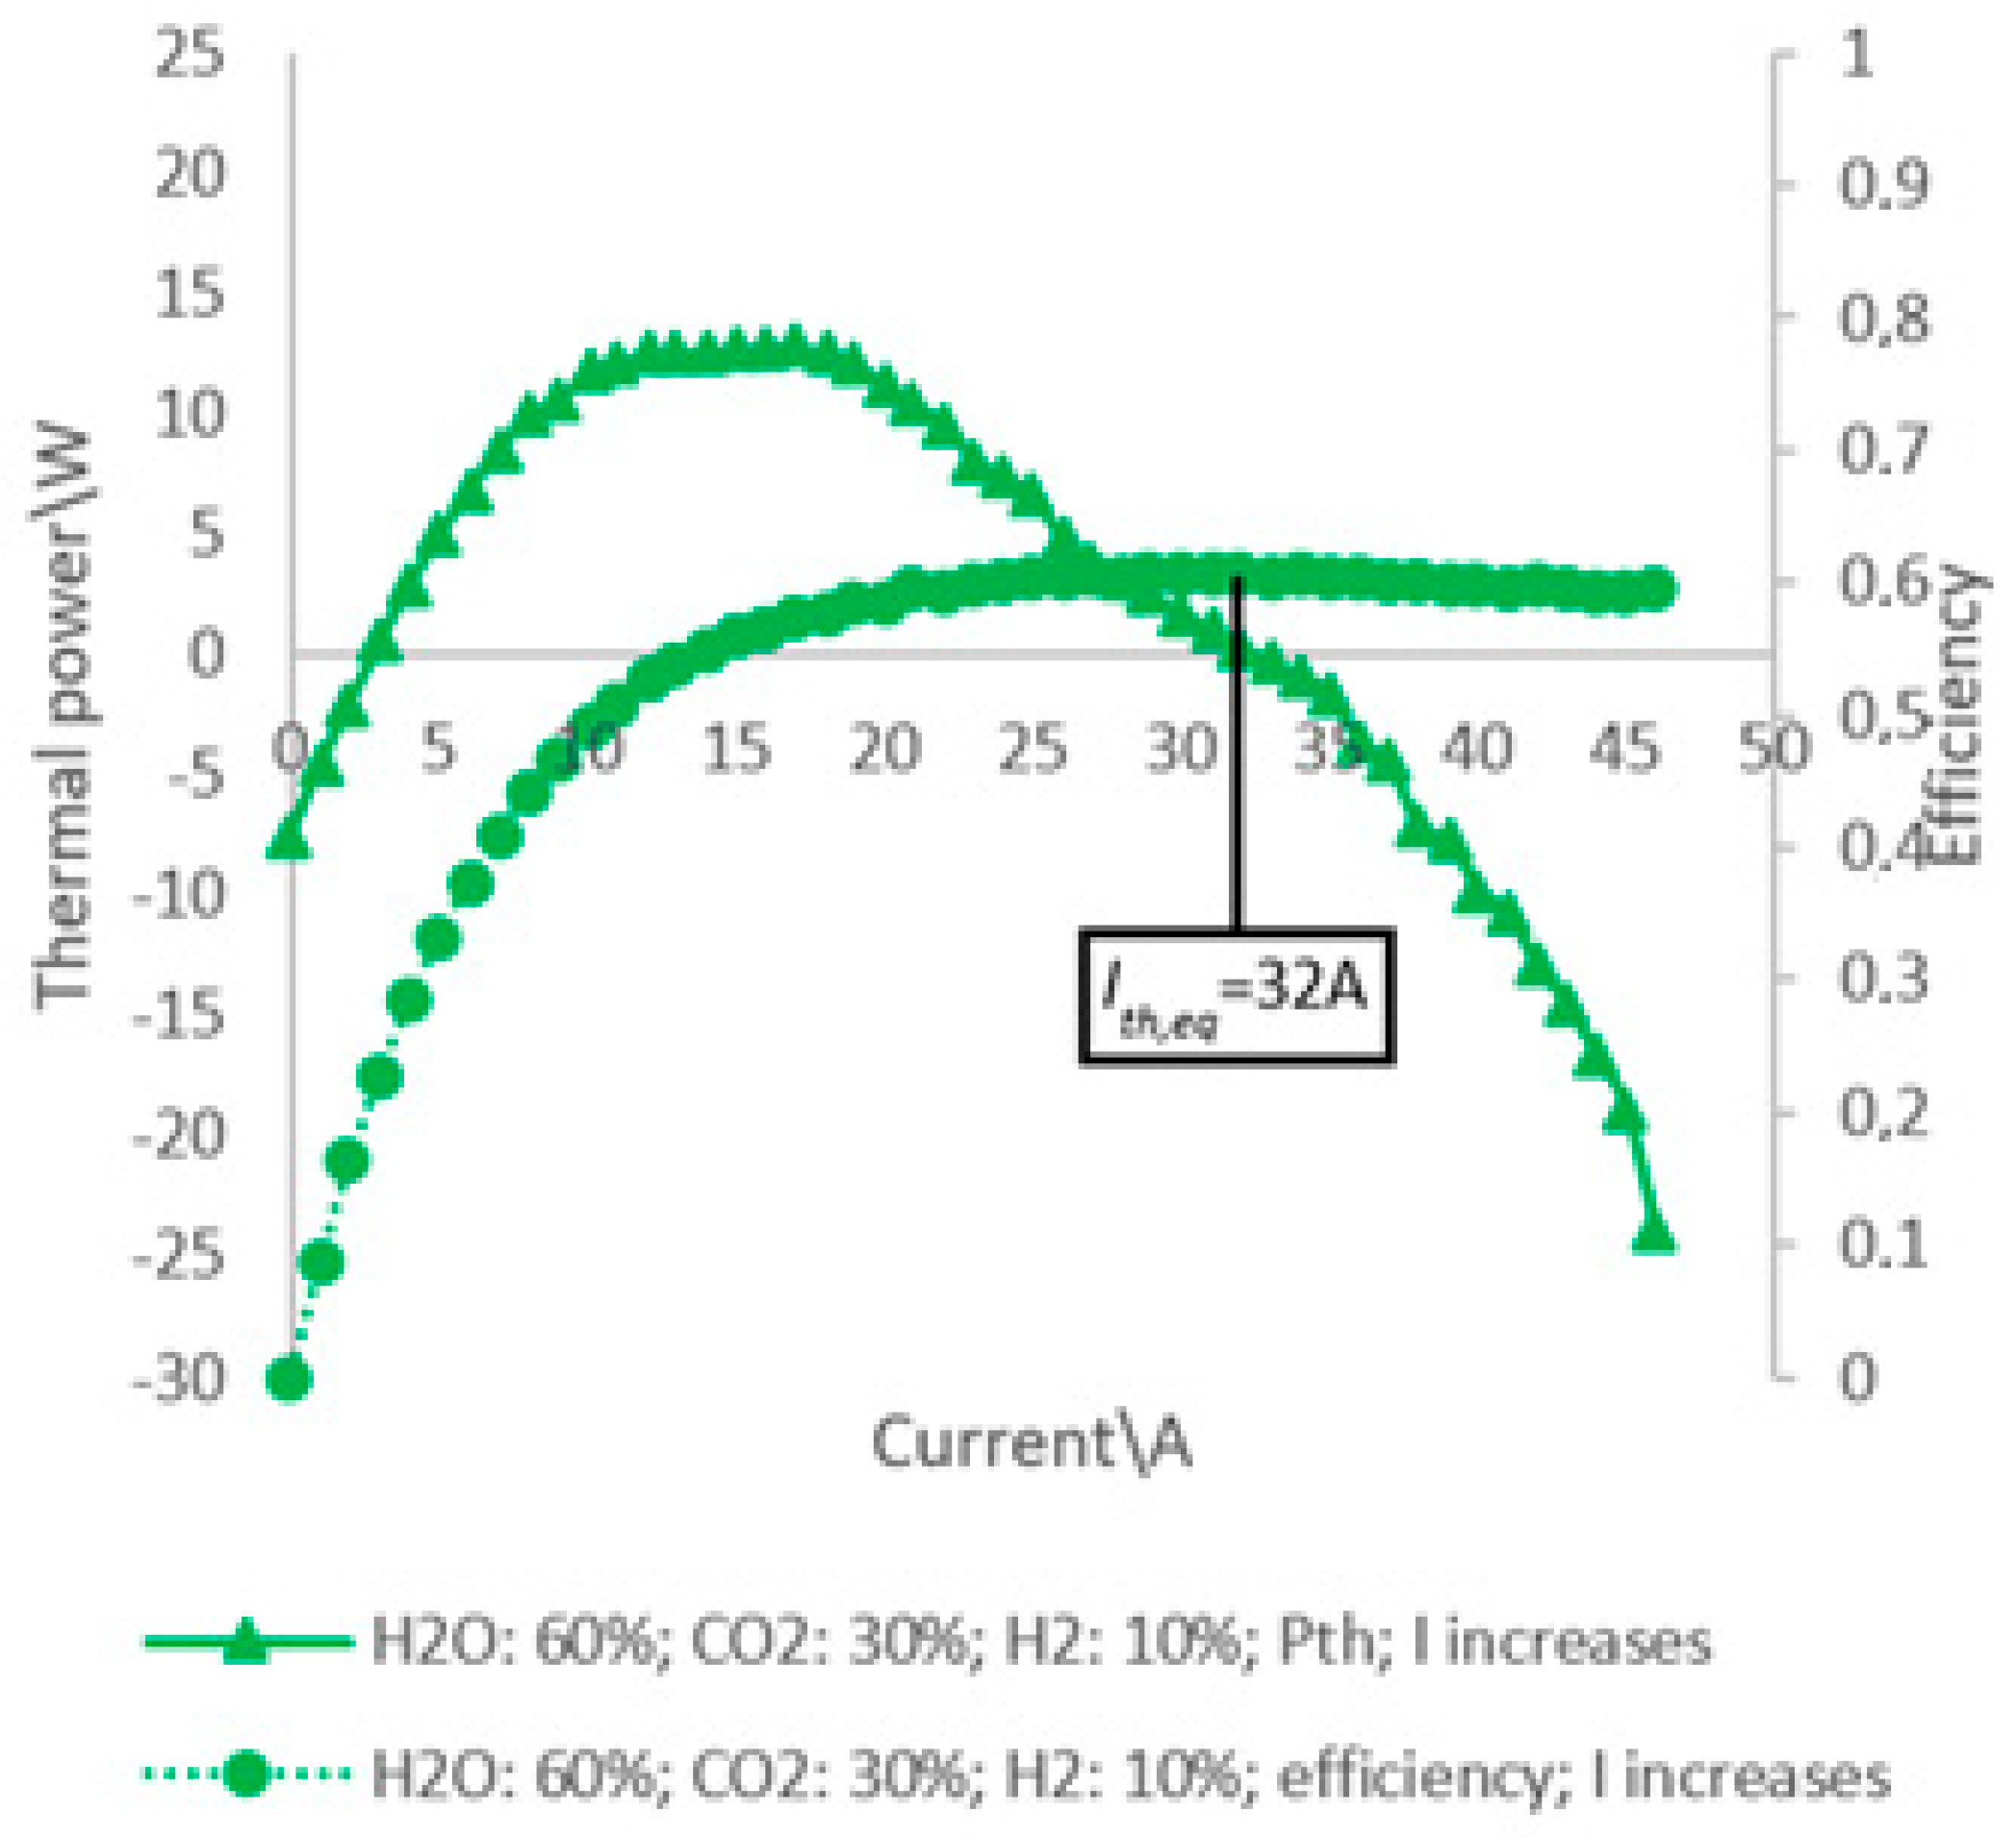
Figure 10 shows the trends of
and
for the stack fed by the steam-CO
2 mixture and air at varying
. The Figure shows that the stack fed by the steam-CO
2 mixture reaches the thermal equilibrium at an operating current,
Ith,eq equal to about 32 A. In this case the thermal power absorbed by the RWGS chemical reaction is added to the thermal power
, which is present up to a current value of 14 A.
Also in this case the thermal power produced by the furnace, is set, so that the SOE system (stack and furnace) operates at the maximum production efficiency in the thermal equilibrium condition. In addition, the SOE system fed by the steam-CO2 mixture achieves a maximum H2 net production efficiency of about 0.60.
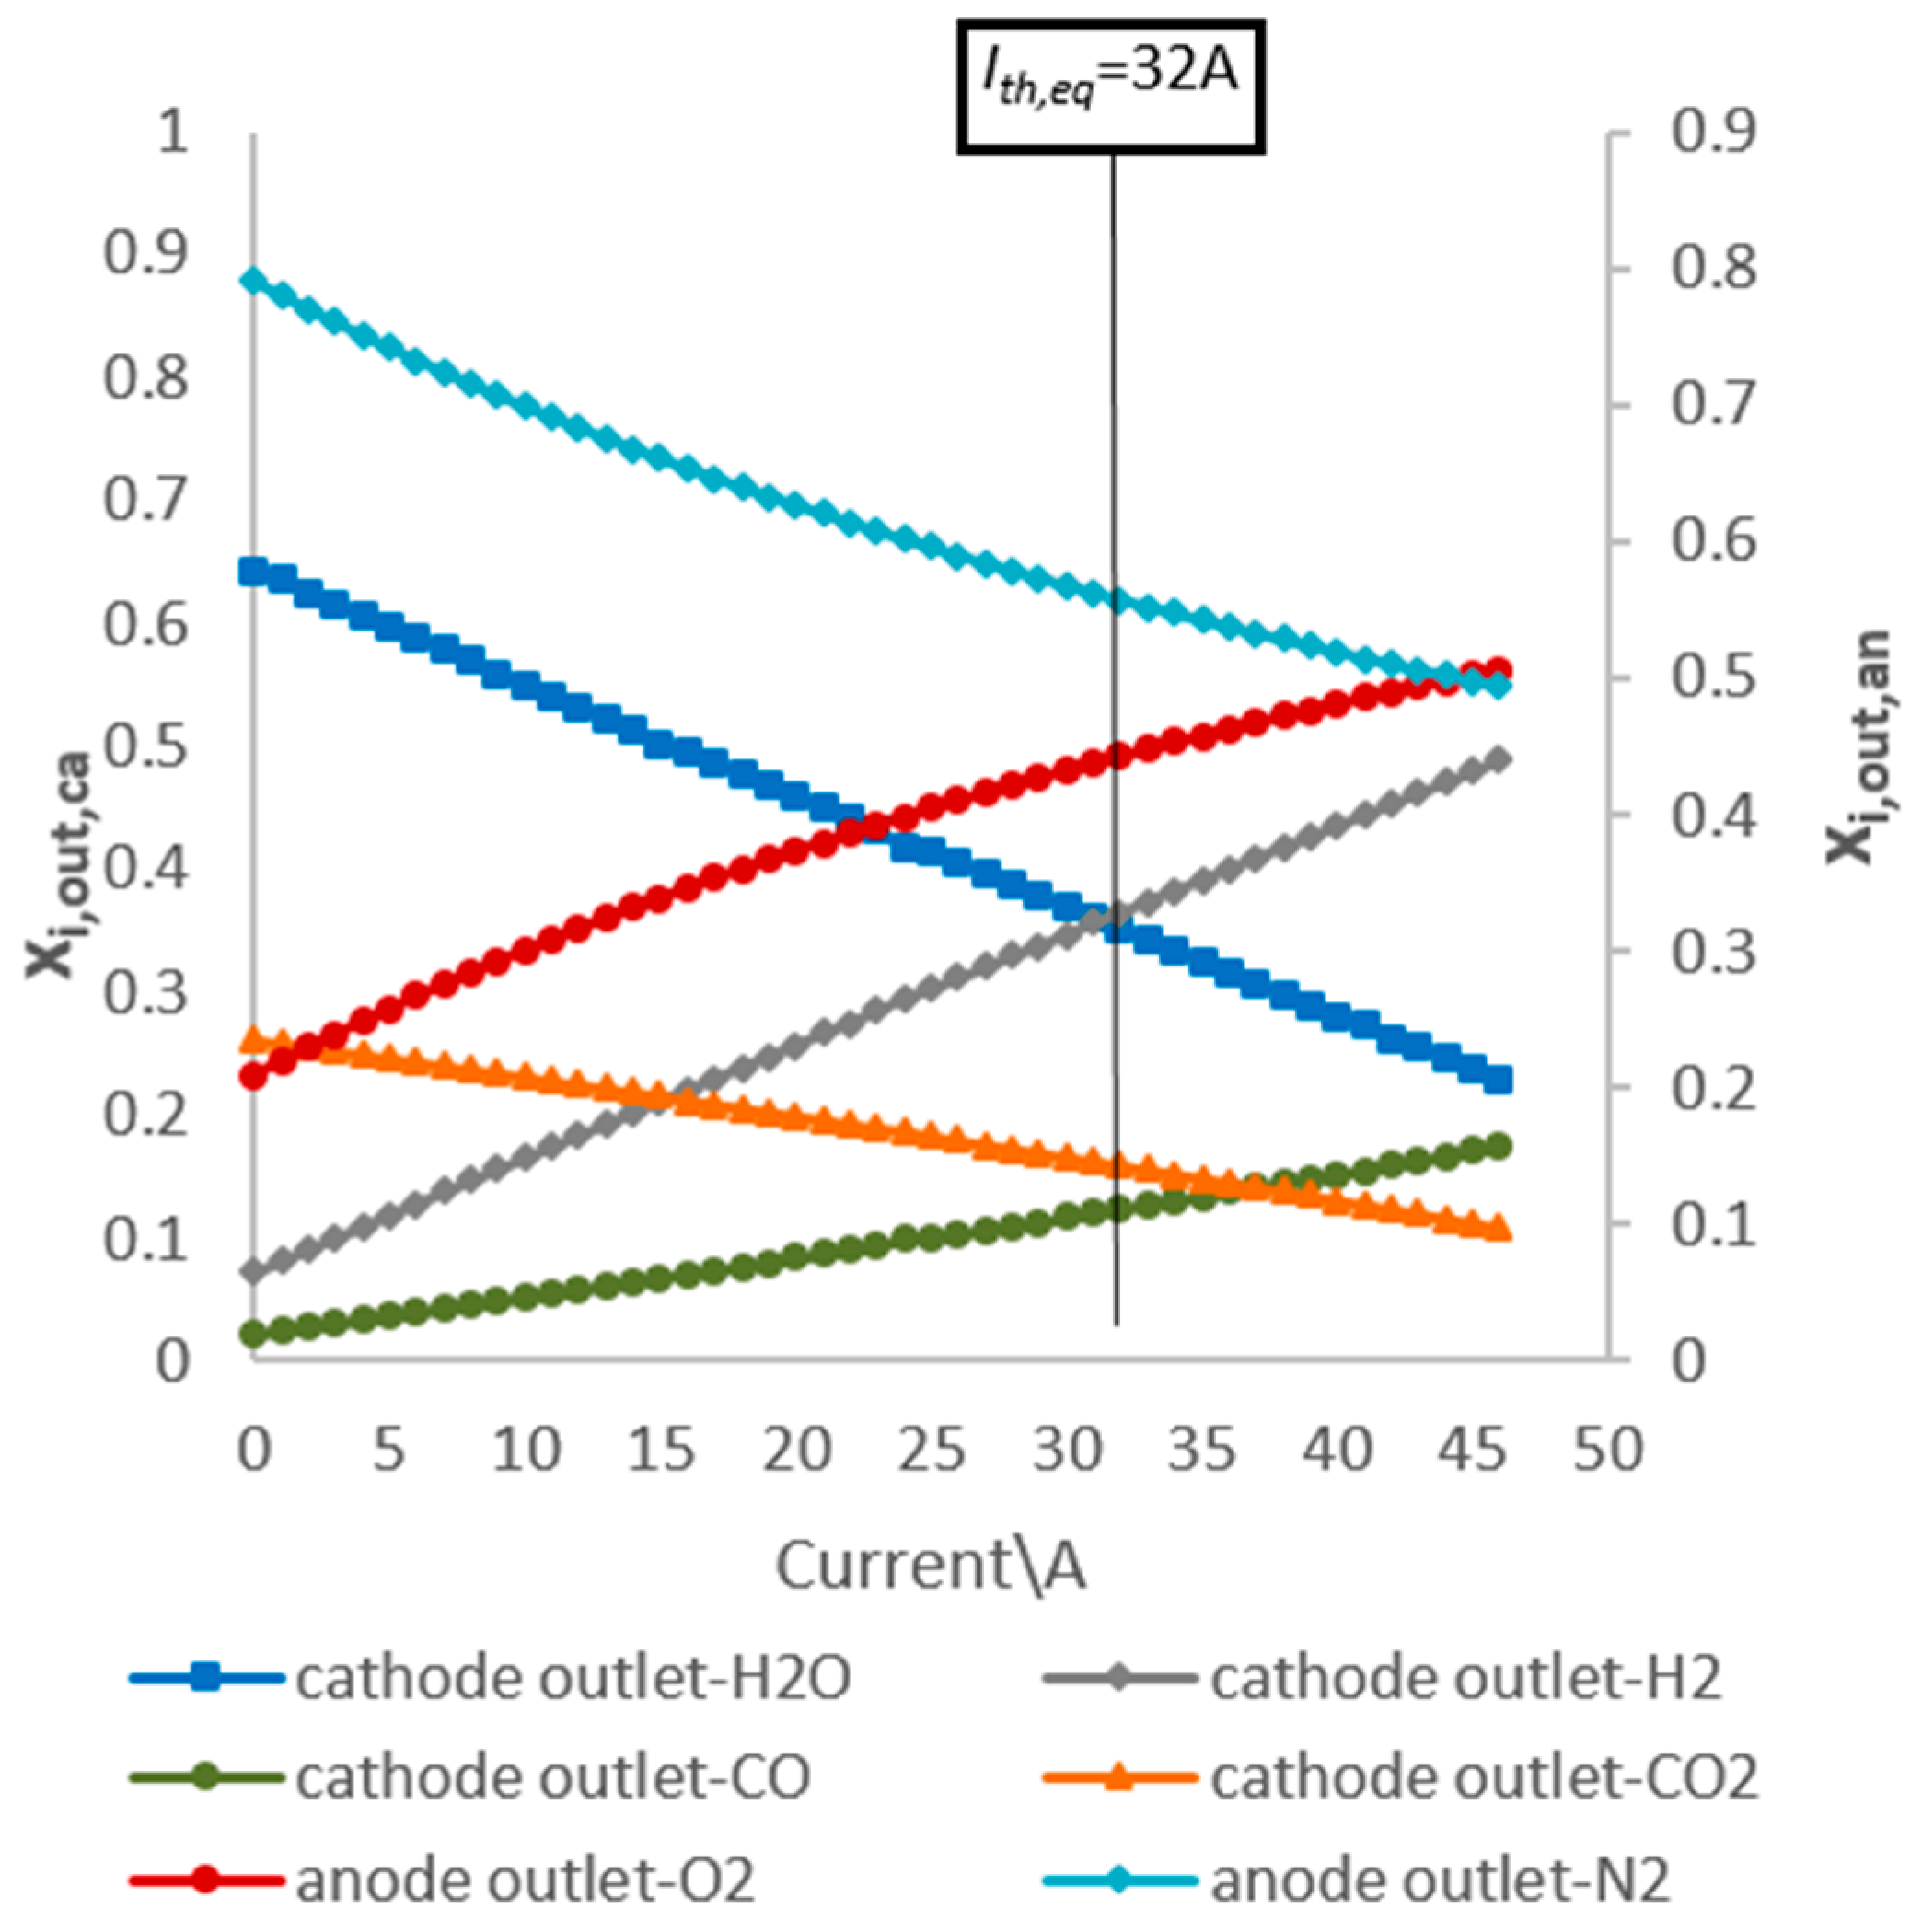
Figure 11 shows the trends of the anode and cathode exhaust gases compositions
xi,out,a and
xi,out,ca, for the stack fed by the steam-CO
2 mixture and air at varying
with the SOE system thermal equilibrium current evaluated. Even in this case
Figure 11 shows that the H
2 and CO contents in the cathode exhaust gases and the O
2 content in the anode exhaust gases at the stack outlet increase, when the operating SOE system current increases since the H
2, CO and O
2 amounts produced by the stack increase. Therefore, even in this case, the value of
Ith,eq influences the purity degree of the gas mixtures rich in H
2 and CO and of the gas mixtures rich in O
2 at the stack outlet. At the SOE system thermal equilibrium current, the cathode gas mixture at the stack outlet has H
2 and CO content equal to 36% and 12%, respectively.
6. Conclusions
An SOE (400 Wel) stack fed by three steam mixtures and air was experimentally tested at three different temperatures (650 °C, 700 °C and 750 °C). At a temperature of 750 °C, the stack produced higher H2 molar flows, resulting the operating temperature with the highest applicative interest. The highest H2 stack production, of 1.62 × 10⁻³ mol·s−1, is obtained when the stack is fed by the highest steam content (90%) mixture. In addition, the same stack fed by a steam-CO2 mixture and air (co-electrolysis) was experimentally tested at temperature of 750 °C. This test showed that the conversion of steam and CO2 into H2 and CO requires more electrical power than the conversion of steam to hydrogen, since the CO production electrochemical reaction is less favored by the H2 production electrochemical reaction.
Simultaneously, a numerical simulation model of the stack in electrolysis and co-electrolysis modalities was formulated and implemented in MatLab language and the calculation code was validated with the data acquired in the experimental tests conducted.
The trends of the additional thermal power, net production efficiency and anode and cathode exhaust gas compositions of the SOE system (SOE stack and furnace) at varying the stack current were plotted. The calculation code also allowed the thermal equilibrium currents of the SOE system in the two operating modalities to be evaluated, which were 37, 31 and 27 A (electrolysis mode for three steam mixtures) and 32A (co-electrolysis mode for a steam-CO2 mixture), respectively.
Both the maximum values of net production efficiencies and the volume percentages of H2 and H2-CO in cathode gases at the stack outlet were evaluated at the SOE system thermal equilibrium currents and they are respectively both about 0.60 for the efficiencies and about 80% and about 36~12% for the volume percentages.
It can be seen how the results obtained through the calculation code have highlighted the influence of the SOE system thermal equilibrium current on the net H2 and CO production efficiency of the same SOE system and on the purity degree of the gases rich in H2 and CO and of the gases rich in O2 at the stack outlet.
Surely the authors intend to produce future developments in both the experimental and numerical modeling activities, conducting further wider ranging investigation on the topic dealt with in this article.


