Article

Macro and Meso Characteristics of In-Situ Oil Shale Pyrolysis Using Superheated Steam

1
College of Mining Engineering, Taiyuan University of Technology, Taiyuan 030024, China
2
Key Laboratory of In-situ Property Improving Mining of Ministry of Education, Taiyuan University of Technology, Taiyuan 030024, China
*
Author to whom correspondence should be addressed.
Energies 2018, 11(9), 2297; https://doi.org/10.3390/en11092297
Submission received: 1 August 2018 / Revised: 29 August 2018 / Accepted: 30 August 2018 / Published: 31 August 2018
(This article belongs to the Special Issue Fluid Flow and Heat Transfer)

Abstract

:
The efficiency of oil shale pyrolysis is directly related to the feasibility of in-situ mining technology. Taiyuan University of Technology (China) proposed the technology of in-situ convective heating of oil shale, which uses superheated steam as the heat carrier to heat the oil shale’s ore-body and transport the pyrolysis products. Based on the simulated experiments of in-situ oil shale pyrolysis using superheated steam, the changes in fracture characteristics, pyrolysis characteristics and mesoscopic characteristics of the oil shale during the pyrolysis have been systematically studied in this work. The Xinjiang oil shale’s pyrolysis temperature ranged within 400–510 °C. When the temperature is 447 °C, the rate of pyrolysis of kerogen is the fastest. During the pyrolysis process, the pressure of superheated steam changes within the range of 0.1–11.1 MPa. With the continuous thermal decomposition, the horizontal stress difference shows a tendency to first increase and then, decrease. The rate of weight loss of oil shale residue at various locations after the pyrolysis is found to be within the range of 0.17–2.31%, which is much lower than the original value of 10.8%, indicating that the pyrolysis is more adequate. Finally, the number of microcracks (<50 µm) in the oil shale after pyrolysis is found to be lie within the range of 25–56 and the average length lies within the range of 53.9636–62.3816 µm. The connectivity of the internal pore groups is satisfactory, while the seepage channel is found to be smooth. These results fully reflect the high efficiency and feasibility of in-situ oil shale pyrolysis using superheated steam.

1. Introduction

As an unconventional oil and gas resource, oil shale is a fine-grained sedimentary rock, which is rich in solid organic matter (kerogen) and has fine bedding [1,2]. Oil shale can generate shale oil through retorting. After shale oil’s hydrocracking, refined oil, such as gasoline, kerosene and diesel oil can be obtained, which is of great significance to alleviate the current oil shortage. The reserves of oil shale resources in China are huge and can be converted into 47.6 billion tons of shale oil [3,4].
At present, most countries around the world use in-situ retorting to exploit oil shale [5,6]. In-situ mining of oil shale only needs to pass the heat-injection well to the ore-body and directly heat the ore-body. After the oil shale ore-body is fully pyrolyzed, the organic matter is also pyrolyzed to generate oil and gas, whereas the hydrocarbon is discharged to ground through production well [7]. According to different forms of heating, the in-situ mining of oil shale can be divided into three classifications, namely heat conduction, convection heating and radiation [8,9]. Furthermore, in-situ conversion process [10] uses high temperature of electrode to heat the ore-body, whereas the heater temperature can reach up to 1000 °C. However, the thermal conductivity of the oil shale is extremely poor, and the heating efficiency is low. Therefore, it takes a long time for the oil shale to reach the effective pyrolysis temperature. Han et al. [11] found that it takes about 10 years or more to reach the initial pyrolysis temperature of oil shale in the area of 400 m2. Kyung et al. [12] simulated the effect of electric heating on the behavior of pyrolysis products and concluded that, after pyrolysis, almost 60% of the shale oil was trapped in mineral matrix because of poor fluidity. Raytheon’s radio frequency/critical flow (RF/CF) technology [13] uses (RF) transmitters to heat the oil shale’s ore-body, and then, extract oil and gas, which is produced from pyrolysis, using supercritical carbon dioxide. Yang et al. [14] proposed an in-situ oil shale recovery method, which combines microwave heating and hydraulic fracturing, and then, simulated the thermal decomposition of oil shale under microwave irradiation. Compared with the conventional heating method, microwave heating requires shorter time, and has lower energy consumption, higher oil production and quality. Radiation produces strong heat penetration and faster heating, though the technology is not yet mature enough [15,16]. The in-situ fracturing and heating technology using nitrogen injection [17,18] uses high-temperature and high-purity nitrogen to pyrolyze the oil shale’s ore-body. Therefore, high-temperature nitrogen can play an important role in the recovery of oil and gas. Allawzi et al. [19,20] found that the solubility of organic matter increased due to the interaction of supercritical carbon dioxide and cosolvent. Zhang et al. [21] studied the changes in shale oil composition and yield after bioleaching the oil shale, and found that, after bioleaching, the yield of shale oil increased by 15.38%, whereas the contents of high molecular weight and low molecular weight hydrocarbons in shale oil also increased.
It can be said that, regardless of the mining technology used, the most important thing is to find a way to maximize the efficiency of pyrolysis, whereas the pyrolysis temperature and the development of pores and fractures directly determine the efficiency of pyrolysis. At present, studies have focused on describing the evolution of pore construction in the pyrolysis of oil shale [22,23,24,25,26]. Geng et al. [27] have systematically analyzed the evolution of pores and the structure of fractures in oil shale under high temperature and high pressure using a combination of X-ray microtomography (μCT) and mercury intrusion porosimetry. It is considered that 300–500 °C is the stage, where the porosity and the number and aperture of fractures increase significantly. Bai et al. [28,29,30] studied the evolution characteristics of pore structure during the pyrolysis of Huadian oil shale at the temperature of 100–800 °C and found that the permeability of oil shale significantly increases within the temperature range of 350–450 °C. Kang et al. [9,31] calculated the percolation probability of true three dimensional (3D) digital CT cores of oil shale specimens under different temperatures. The results showed that, when the porosity is higher than 12%, the connectivity of pore-connected clusters is very good and the connection of seepage channels is smooth, which is favorable for oil and gas production and high temperature fluid injection. Saif et al. [32,33,34] studied the evolution of pores and fractures during pyrolysis of Green River oil shale and found that the critical temperature for a sharp increase in the porosity of oil shale lies within the range of 390–400 °C. After the critical temperature, the porosity of oil shale rapidly increased to 22–25%. Liu et al. [35] analyzed the evolution of pore structure of Fushun oil shale under pressure and temperature conditions and found that the lithostatic pressure would significantly inhibit the development of pores. Pan et al. [36,37] reported that the mineral matters have an insignificant effect on the pyrolysis reactions of kerogen in Jimsar oil shale. Barshefsky et al. [38] reported that the isolated kerogen of Russian oil shale was completely pyrolyzed at 420 °C, while the raw oil shale decomposition was only 65% complete.
In short, many experts and scholars have done a lot of research on the relationship between temperature and pyrolysis characteristics; however, there is little research on the study of pyrolysis characteristics of oil shale under stress constraints. In 2005, the in-situ convection heating of oil shale was put forward by Zhao Yangsheng’s team at the Taiyuan University of Technology, China [39]. The technology used superheated steam as the heat carrier to heat the oil shale ore-body, while the produced oil and gas were transported using steam. During the in-situ mining of oil shale using superheated steam, the internal pores and fractures of oil shale are not only a channel for the migration of steam and kerogen pyrolysis products but also a location for heat exchange and transfer in the rock mass, which is directly related to the efficiency of pyrolysis. In this work, based on the simulated experiments of in-situ oil shale pyrolysis using superheated steam, the cracking and pyrolysis characteristics of oil shale samples are thoroughly studied during the pyrolysis and after the pyrolysis, the evolutionary characteristics of pores and fractures inside the oil shale are carefully discussed. The study provides a necessary prerequisite for the application and commercialization of in-situ oil shale mining technology using superheated steam.

2. Experimental

2.1. Thermogravimetric Experiments

The experimental sample was taken from Jimsar County, Xinjiang, China. The oil shale was crushed and sieved to a particle size of ≤180 μm for pyrolysis experiments. Table 1 summarizes the results of oil shale industrial analysis and low-temperature carbonization.
The pyrolysis weight loss experiment of oil shale was conducted using DTU-2B thermogravimetric analyzer. The device has a temperature measuring accuracy of 0.1 °C and a sensitivity of less than 1 μg. The ground oil shale samples were evenly spread in the crucible. The cooling water was turned on and high-purity nitrogen was slowly passed into the crucible. The temperature was increased from 70 °C to 900 °C at the rate of 3.5 °C/min. The thermogravimetric (TG) and differential thermogravimetric (DTG) curves of the oil shale were obtained using the thermogravimetric experiments. The TG curve reflects the change in sample’s mass with temperature, while the DTG curve reflects the relationship between the rate of change of sample’s mass and the temperature.

2.2. Simulated Experiments for In-Situ Oil Shale Pyrolysis Using Superheated Steam

For the simulated experiments of in-situ oil shale pyrolysis using superheated steam, the process of preparing the samples is shown in Figure 1. Large oil shale samples were cast through concrete, making the fabricated specimen a cube with the dimensions of 300 mm × 300 mm × 300 mm. After the sample was fully dried, a well-shaped diversion trough was ground on the surface of the specimen using the polisher, which facilitates the outflow of oil shale pyrolysis products. Meanwhile, core drilling was carried out in the middle of the specimen. The diameter of the drill hole was 32 mm, whereas the depth was 200 mm. The drill hole was used as the location for the insertion of heat injection tube. The heat injection tube was mainly composed of a lower-end flower tube and an upper-end sleeve tube. The flower tube was used as the channel of oil shale pyrolysis using the superheated steam and the sleeve tube played the role of sealing and insulation.
The vertical stress of 3 MPa and the horizontal stress of 4 MPa (Figure 2) were applied to the specimen using a large-size true triaxial press (Figure 3) to simulate the geo-stress environment where the oil shale was located. The press was mainly composed of test loading frame, axial and lateral hydraulic cylinder loading system, numerically controlled hydraulic instrument and other auxiliary devices. The superheated steam, generated by the steam generator, pyrolyzed the specimen under the condition of stress constraint using the heat injection tube. The numerically controlled hydraulic instrument can monitor the stress characteristics of the specimen in real time during the pyrolysis process.

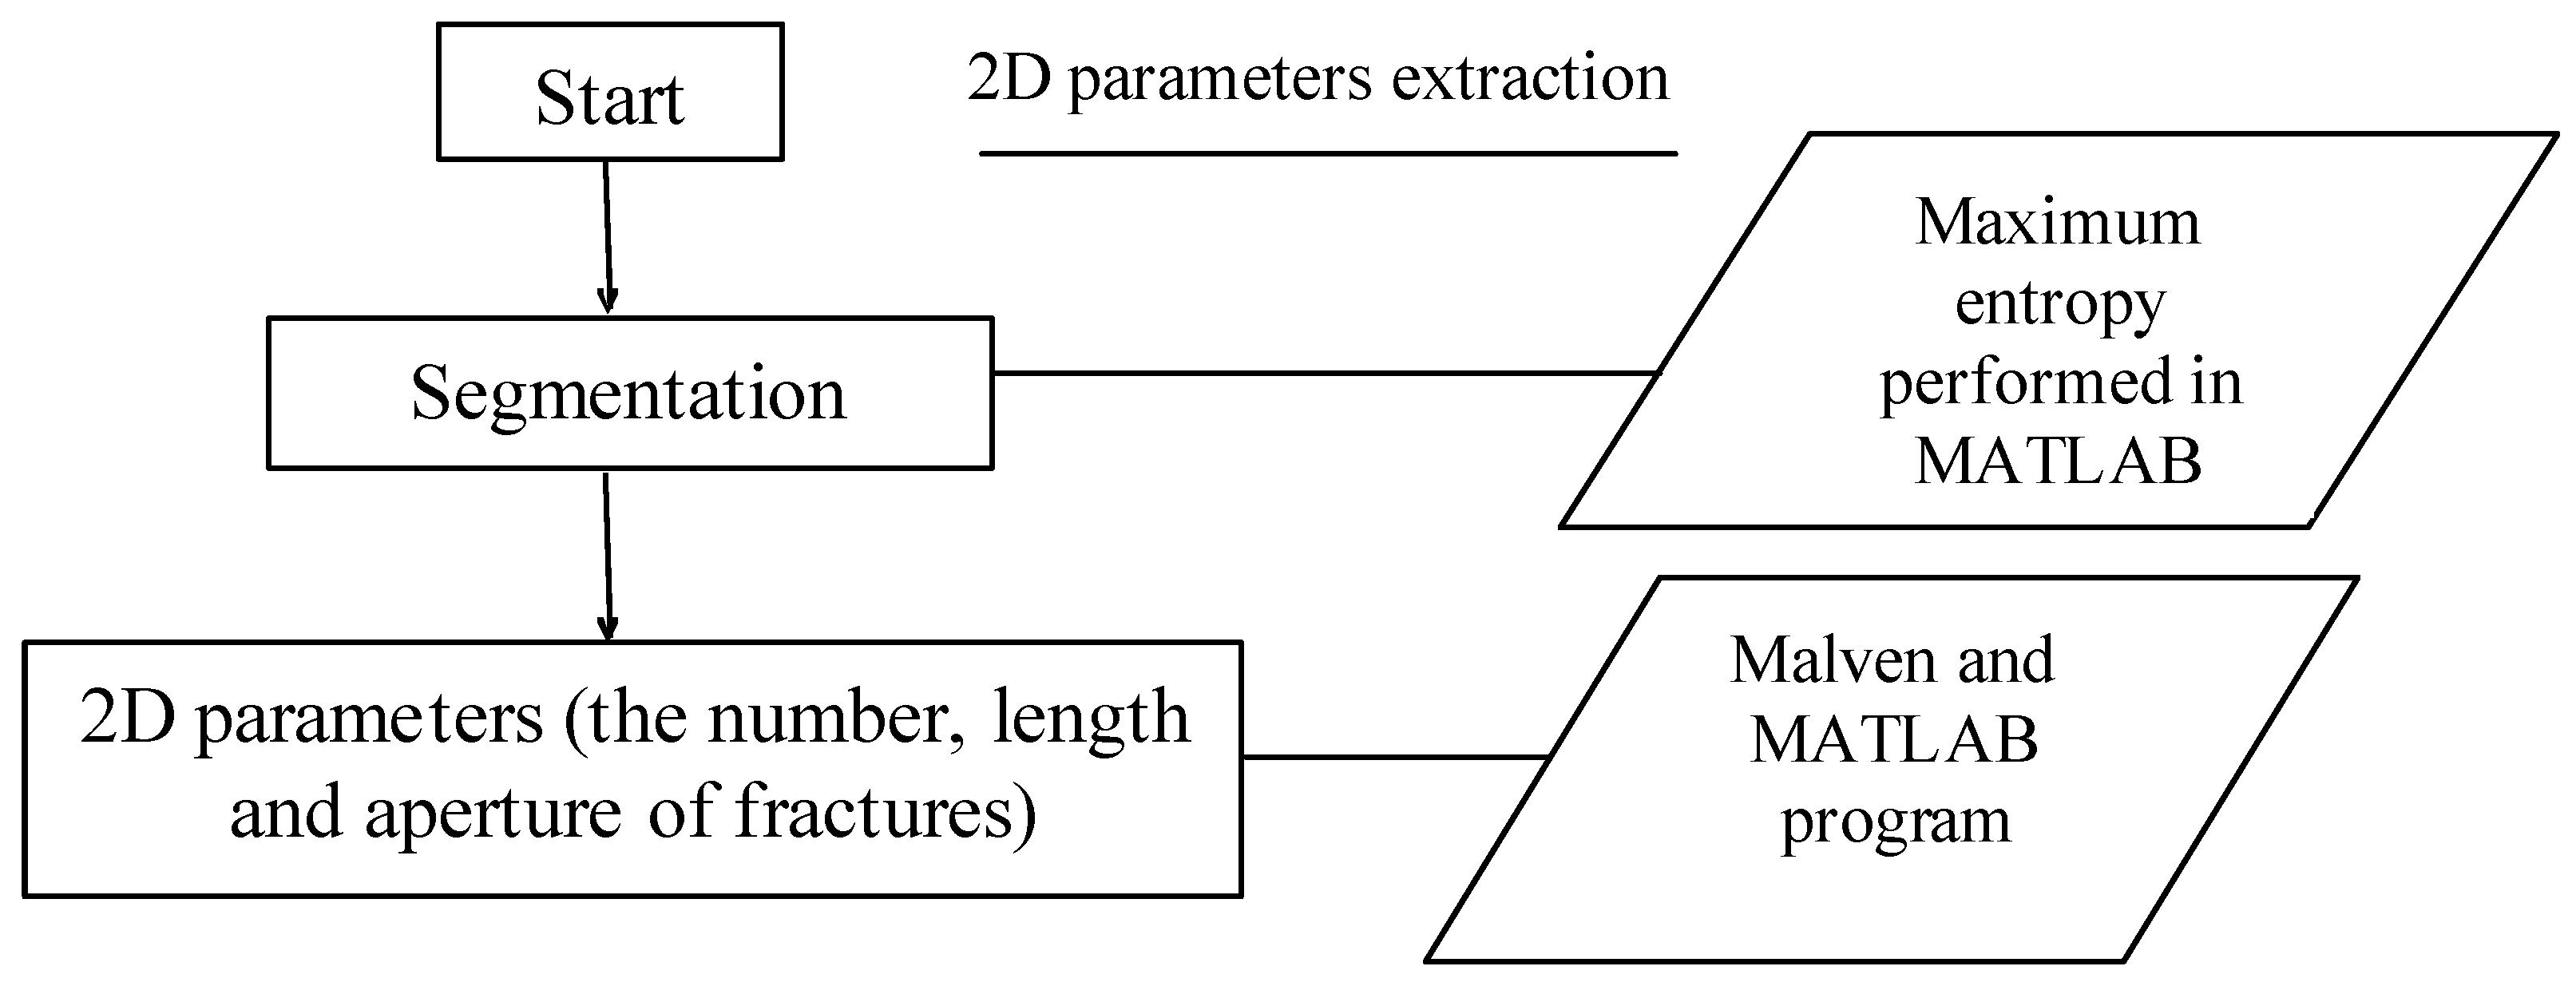
2.3. Micro-CT Scan and the Analysis of Pyrolysis Effect

According to the difference of vertical distance between the outlet of heat injection tube and the pyrolysis oil shale, the oil shale residue was divided into three locations. The thermogravimetric analyses of the oil shale residues at different locations were carried out to analyze the pyrolysis of oil shale. The oil shale residues at different locations were processed into cylindrical samples having the length and diameter of 10 mm and 5 mm, respectively. The internal structure of the oil shale residue was scanned using a µCT225kVFCB high-precision CT analysis system (Figure 4) and the mesoscopic characteristics of the oil shale after pyrolysis were obtained. In this experiment, the scanning voltage was 90 kV and the electric current was 70 µA. The scans were obtained in with 400 frames, the superimposed frame rate was 2 fps and a plane image was generated after the reconstruction. There were 1500 scanned layers and the size of the scanning cell was 2.66 µm × 2.66 µm.

3. Results and Discussion

3.1. Thermogravimetric Analysis of Xinjiang Oil Shale

Figure 5 shows the TG and DTG curves of Xinjiang oil shale obtained using thermogravimetric analysis. As can be seen from Figure 5, the major stage of weight loss of Xinjiang oil shale occurs in a relatively small temperature range of 400–510 °C, while the rate of weight loss reaches 10.8%. During this stage, the pyrolysis of oil shale kerogen is closer to completion and the rate of pyrolysis is faster. The pyrolysis of oil shale is considered to be a process in which oil shale is pyrolyzed into oil, gas and semi-coking products in two steps. Firstly, the oil shale was pyrolyzed into tar, which then, was further pyrolyzed to obtain the final products. When the temperature is 447 °C, the rate of mass loss of oil shale is the highest and the pyrolysis rate of kerogen is the fastest.

3.2. Stress Characteristics of the Specimen during Pyrolysis

In the process of in-situ oil shale pyrolysis using superheated steam, the weak cementing surface inside the oil shale will break under the action of high-temperature and high-pressure steam, due to which, the heat exchange area inside the rock mass increases. The superheated steam will heat the rock mass along the fracture surface. After the decomposition of organic matter, more pores and fractures are formed inside the oil shale and the hydrocarbon generated by the pyrolysis will further widen the pores and fractures in the migration process, which forms a huge seepage channel. At the same time, due to the continuous development of internal fractures inside oil shale and the continuous injection of superheated steam, the cohesive force of the molecular bonds of oil shale is reduced, which reduces the tensile strength of oil shale and makes the oil shale more prone to tensile fracture. The variation in steam pressure with pyrolysis time during the pyrolysis process is shown in Figure 6.
It can be seen from Figure 6 that the superheated steam pressure varies between 0.1–11.1 MPa as the oil shale pyrolysis proceeds. This is due to the reason that the thermal cracking of oil shale is a process of gradual expansion. With the continuous injection of superheated steam, the stress at the tip of the fracture gradually increases. When the stress value reaches the threshold point of crack initiation, the fracture expands. The expansion process is also the process of energy release, which shows the decrease in stress. Once the stress is lower than the threshold point of the crack, the fracture stops expanding. Meanwhile, the stress concentration is produced again in the tip of the fracture and the fracture continues to expand. Therefore, the fracture expansion process inside the oil shale is characterized by the continuous cycle of stress concentration—fracture expansion—stress reduction and stress re-centralization.
The critical state of tensile fracture of oil shale is:
p σ v T 0  
where T0 is the tensile strength of oil shale (MPa), p is the superheated steam pressure (MPa) and συ is the vertical stress (MPa).
When the tensile fracture of the specimen occurs, the fracture direction is perpendicular to the vertical principal stress direction, thereby forming multiple horizontal fractures around the heat injection tube, as shown in Figure 7.
The anisotropy of the oil shale is obvious. In the process of pyrolysis, the thermal expansion coefficient of particles in different positions inside the oil shale is different, which leads to the change in stress state in the horizontal direction.
Figure 8 shows the variation in horizontal stress difference with time during the pyrolysis process.
In Figure 8, the horizontal stress difference is the difference between the horizontal stress in the north-south direction and the horizontal stress in the east-west direction. When the pyrolysis time is within the range of 0–252 min, the horizontal stress difference increases with the increase in pyrolysis time and the maximum horizontal stress difference is found to be 2.95 MPa. During this period of time, the north-south direction is the direction of the maximum principal stress and the fracture will expand perpendicular to the north-south direction. Additionally, the degree of cracking will become more obvious during this time period. This is due to the reason that, in the experiment, the direction of oil shale bedding is perpendicular to the north-south direction, whereas the bedding plane undergoes tensile brittle fractures, which appear to be open perpendicular to the north-south direction, resulting in an increase in the stress in the north-south direction. When the pyrolysis time changes from 256 min to 316 min, the maximum horizontal stress difference is 0.75 MPa. During this time period, the rock mass between the oil shale bedding surface in in-situ condition undergoes shear failure under the action of high-temperature and high-pressure steam, which results in larger horizontal stress in the east-west direction than that in the north-south direction. Under these conditions, the east-west direction is the direction of the maximum principal stress. Overall, the extent of shear failure of rock mass between the bedding planes is lower than that of the brittle fractures of the bedding plane. From the macroscopic point of view, a large number of cracks formed by thermal fracturing and pyrolysis of oil shale will cause the injected heat-carrying fluid to seep into the ore-body from the injection well, which continues to pyrolyze the oil shale and continuously extract oil and gas. Therefore, the results of this study provide a scientific basis and technical support for the implementation of in-situ retorting of oil shale.

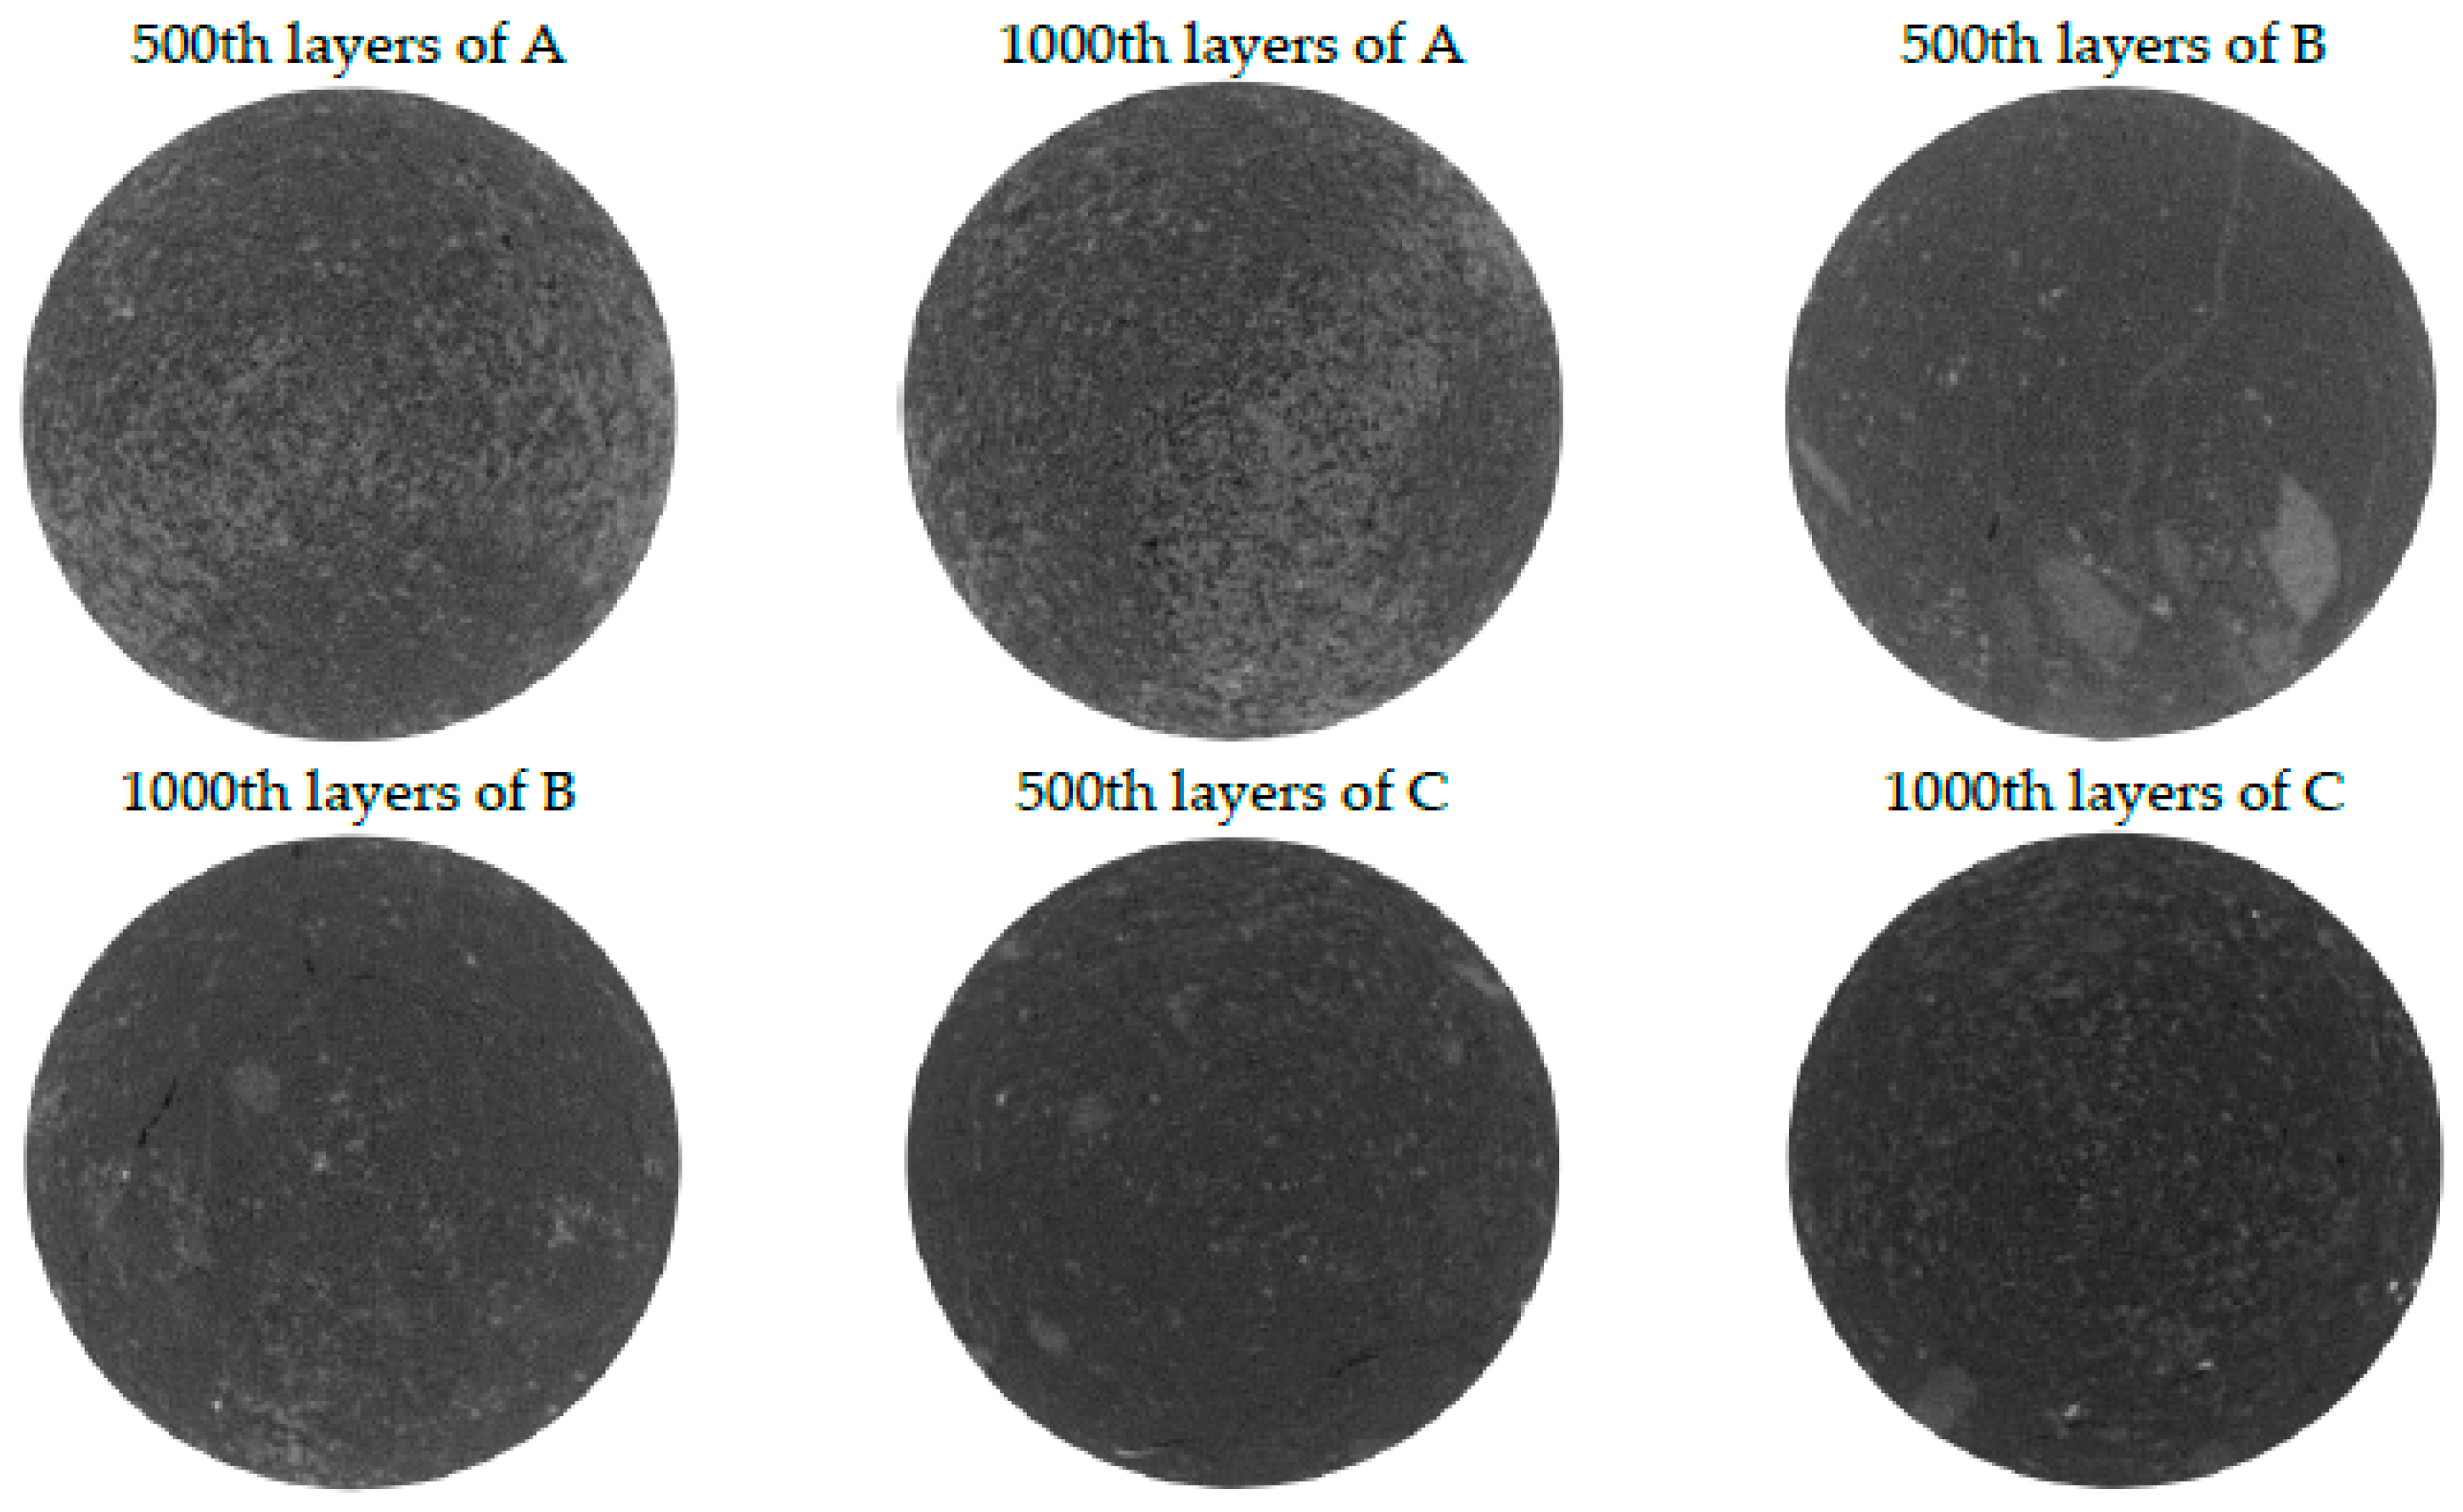
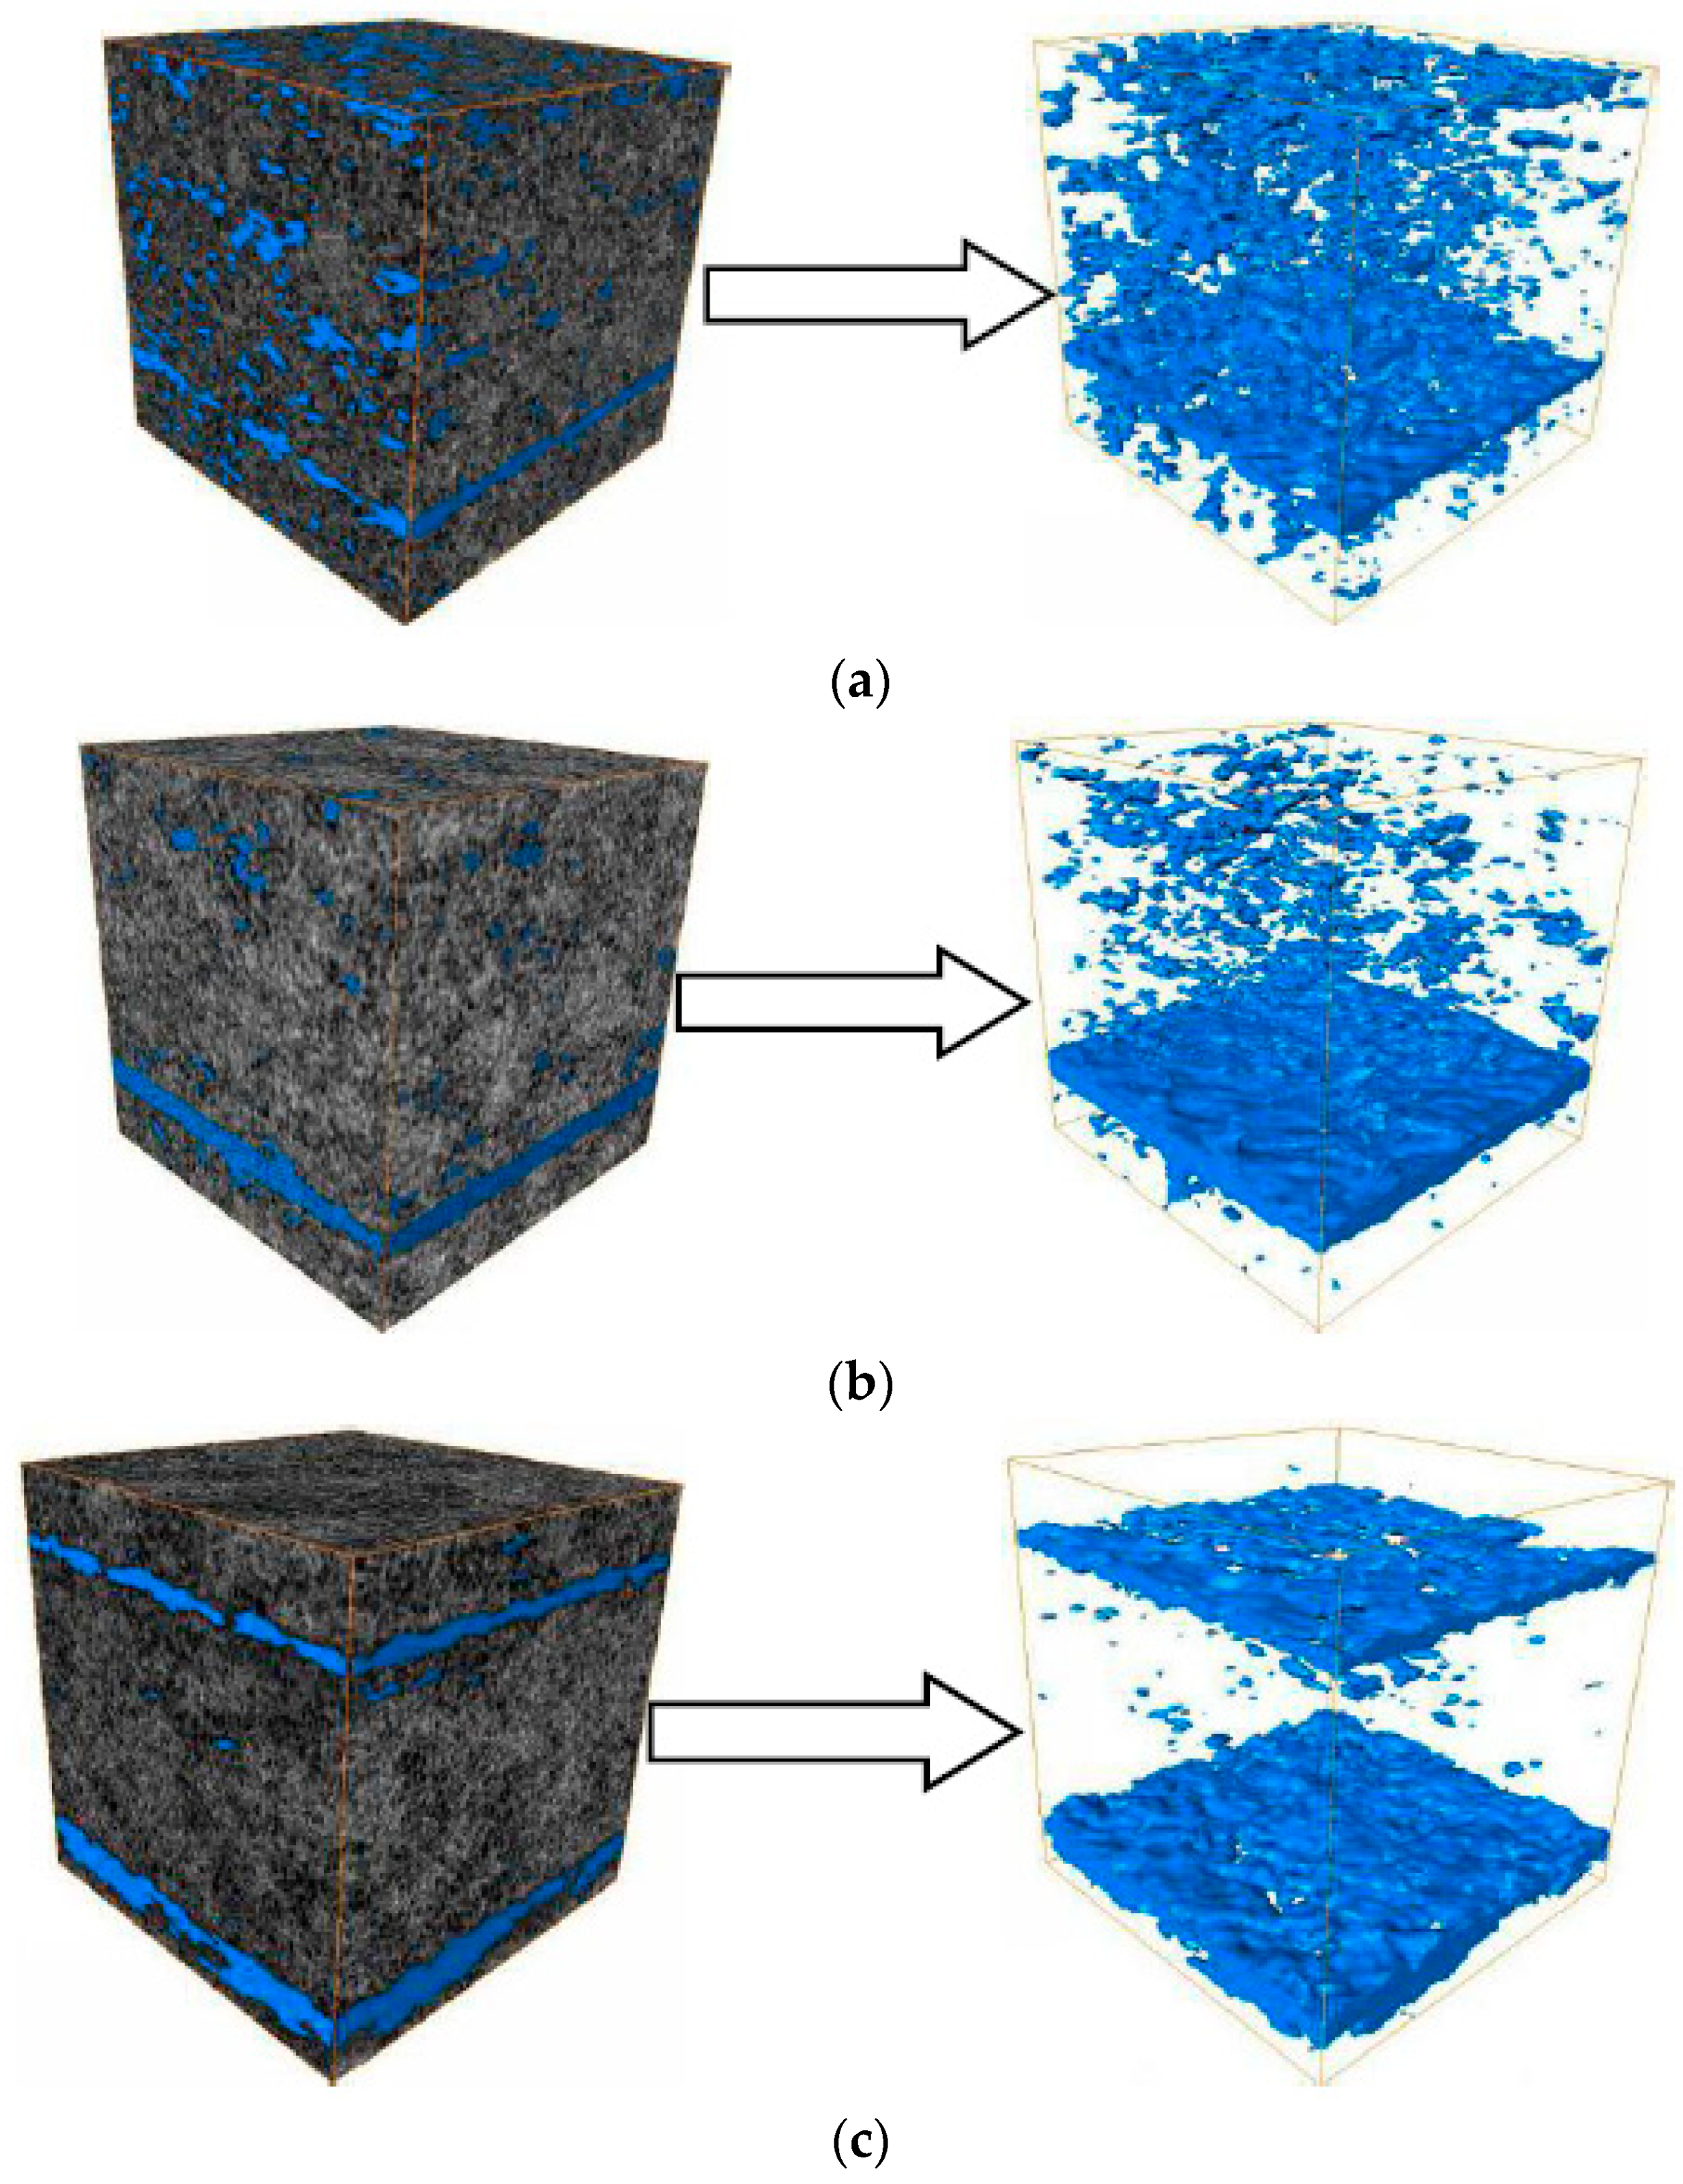
3.3. Microscopic Characteristics of the Specimen after Pyrolysis

The pyrolyzed sample is shown in Figure 9a. The oil shale around the heat injection tube has been broken into many small pieces, indicating that the oil shale has been fully pyrolyzed and its color has changed from yellow brown to black. Figure 9b shows the sampling position of the oil shale after pyrolysis. The distance between Location A and the outlet of the heat injection tube is the smallest, followed by Location B, whereas the distance from Location C to the outlet of the heat injection tube is the largest.
The TG curves of oil shale at different locations after pyrolysis are shown in Figure 10. At the temperature of 510 °C, the rates of weight loss of oil shale at Locations A, B and C are 0.17%, 0.72% and 2.31%, respectively, while that of the original oil shale is 10.8%, indicating that the oil shale at each location has been fully pyrolyzed. At the same time, the pyrolysis effect decreases with the increase in distance from the outlet of the heat injection tube. This is because the process of oil shale pyrolysis using superheated steam is an energy consuming process. Farther from the outlet of the heat injection tube, lower is the temperature and worse is the pyrolysis effect.
Xue et al. [40,41] used thermogravimetry to analyze the oil shale residue, pyrolyzed using low-temperature dry distillation technology and found that the rate of weight loss of oil shale residue was 6.52%.
The thermogravimetric results of oil shale at different locations after pyrolysis show that the rates of weight loss of oil shale at Locations A, B and C are 0.63%, 2.49% and 4.61%, respectively, which are lower than that of the oil shale residue after low-temperature dry distillation. Therefore, it can be said that the method of oil shale pyrolysis using superheated steam can achieve a high degree of pyrolysis of organic matter in oil shale. In order to further study the pyrolysis properties of oil shale and its residue, the Coats-Redfern method [42] was used to analyze the pyrolysis kinetics of oil shale and its residue. The expression of the Coats-Redfern method is given by Equation (2).
I n [ I n ( 1 α   ) T 2 ] = I n A R β E E R 1 T
The equation represents a straight line with as I n A R β E . the intercept and − E R as the slope. The activation energy E can be obtained by fitting the least square method. The activation energy of oil shale and its residue in the main weight loss stage (400–510 °C) is presented in Table 2.
CT scanning technology uses the principle that X-rays have different penetration capabilities for different density materials and therefore, the density is reflected in voxel of different gray levels. In the grayscale image of CT, greater the brightness, higher is the density of the material. As the density of the pores and fractures is the lowest, it appears black in the CT image [43,44]. Figure 11 shows a micro-CT reconstructed image of the internal structure of the 500th and 1000th layers of the cross-sections of oil shale at Locations A, B and C.
In Figure 11, the scattered white areas are the undecomposed minerals during pyrolysis. There are less pores and fractures inside the oil shale. This is because the pores and fractures, formed by the pyrolysis of oil shale under triaxial stress constraint, are constrained in the process of expansion and the fracture surface may be closed. Due to these reasons, the thermal cracking of oil shale under in-situ condition is the result of the combined effect of thermal stress of superheated steam and triaxial stress. In order to visually obtain the distribution of pores and fractures in oil shale after pyrolysis, the CT grayscale images of Figure 11 need to be subjected to “image segmentation” (binarization processing). To conduct segmentation (separate the image into pore and solid phases), 288 the maximum entropy method proposed by Kapur et al [45] was adopted. The Kapur et al [46] 289 method quantitatively considers the gray values of all pixels of an image, and assigns a unique 290 threshold to each image (Figure 12). Because there are a lot of noises in the binary image, the cracks less than 3 voxel are cleared by MATLAB software. Figure 13 shows a micro-CT image of a cross-section of the sample processed using binarization, where the white areas represent the pores and fractures (the length greater than 7.98 µm) and the black areas represent the oil shale matrix.
In order to quantitatively evaluate the development characteristics of pores and fractures of the oil shale after pyrolysis, the number, average length and average aperture of fractures with the length greater than 50 µm are determined. The statistical results are presented in Table 3.
As can be seen from Table 3, the number of fractures in the 500th layer of oil shale at Location C is the lowest (only 25), while the number of fractures of oil shale at Location A is the highest (up to 56). The average length of fractures in oil shale at different locations lies within the range of 53.9636–62.3816 µm. Among them, the average length of fractures in the 1000th layer of oil shale at Location C is the smallest, whereas that at Location B is the largest. The average aperture of fractures in the 500th layer of oil shale at Location C is only 23.4708 µm and is the minimum, whereas that in the 1000th layer of oil shale at Location A is 24.5616 µm and is the largest. The fracture parameters of the 500th and 1000th layers of oil shale at different locations are averaged to obtain the variation characteristics of oil shale fractures, as shown in Figure 14.
In general, as the distance from the outlet of heat injection tube increases, the number of fractures continuously decreases, however the average length and the aperture of the fractures do not change significantly. This is due to the reason that, greater the distance from the outlet of the heat injection tube, lower is the temperature of superheated steam, and worse is the effect of thermal cracking of oil shale, which result in fewer number of fractures. The oil and gas generated by the pyrolysis of oil shale will both extend and expand the formed fractures in the process of migration, thus forming a more developed fracture channel. Furthermore, there will be little change in the length and aperture of fractures inside the oil shale at different locations. Generally speaking, oil shale is an anisotropic and heterogeneous rock, and the effect of thermal expansion of internal particles is different under the action of temperature. During the in-situ pyrolysis, many micron-scale cracks can be formed in oil shale. In this type of cracks, fluids, such as shale oil and shale gas, can migrate freely and obey the law of hydrostatic mechanics.
After CT scanning of the samples, a series of two-dimensional grayscale images are obtained, which can reflect the density distribution of different layers inside the samples. The 700th to 900th layers are selected and imported into the AVIZO 9.0 software. The threshold segmentation of these grayscale images is done through appropriate thresholds and a binary image characterizing fractures inside the oil shale is obtained [47]. Then, all the binary images obtained in the foregoing operation are successively stacked in the vertical direction, so that the reconstruction of the three-dimensional fracture structure can be achieved. In the process of three-dimensional reconstruction, a three-dimensional digital model of 200 × 200 × 200 voxel is obtained. In order to fully reflect the connectivity and distribution of fractures inside the oil shale, the computing load of the computer in the three-dimensional reconstruction is considered. Figure 15 shows a three-dimensional image of the distribution of fractures inside the oil shale at Locations A, B and C (the color of the fracture space is blue, while that of the matrix is gray), whereas the image is an 8-bit undefined grayscale image. The color range is 0–255.
From Figure 15, it can be seen that the distribution of pore and fracture groups inside the oil shale is denser at Location A and the number of pores and fractures is large, which form a large permeate channel, which connects the two relative surfaces. The distribution of oil shale pore and fracture groups at Locations B and C is more scattered in the three-dimensional space and its size and number of oil shale fractures are smaller than that of oil shale at Location A. However, the seepage channel is still formed between the two relative surfaces, which is beneficial to the extraction of oil and gas. In general, the pyrolysis reaction of kerogen occurs obviously and a large number of pores and cracks are formed in the solid skeleton of oil shale, which constitute the entrance and exit channels of pyrolysis fluids and products in the pyrolysis process of oil shale. After pyrolysis using superheated steam, the oil shale can be regarded as a porous medium with high permeability. The results have shown that the in-situ oil shale pyrolysis technology using superheated steam is an efficient and feasible method for oil and gas production from shale oil.

4. Conclusions

The process of oil shale pyrolysis using superheated steam is a multi-field coupling process. The pyrolysis process involves the crack initiation, the decomposition of organic matter and the migration of the products. During the pyrolysis, the temperature distribution inside the oil shale will have serious inhomogeneity, which leads to the different pyrolysis effects of oil shale at different positions. On the basis of simulated experiments of in-situ oil shale pyrolysis using superheated steam, the variations in steam pressure and constrained stress during the pyrolysis are obtained. At the same time, the pyrolysis effect of the oil shale and the evolution of pores and fractures are studied after pyrolysis, which provide a certain level of guidance for the technological design of in-situ oil shale pyrolysis using superheated steam.
With the continuous development of pyrolysis, two forms of rupture occur inside the oil shale. These are the brittle fractures of the bedding plane and the shear failure of the rock mass between the bedding planes. After the pyrolysis, the rate of weight loss of oil shale residue was much lower than that of the original sample, indicating that the pyrolysis of the oil shale was more complete. After the pyrolysis, the pores and fractures inside the oil shale are widely distributed, whereas the oil shale can be regarded as a porous medium with high permeability. The feasibility of in-situ mining of oil shale using superheated steam is verified based upon an efficient pyrolysis process.

Author Contributions

All authors contributed to the research in the paper. Y.Z., D.Y. and L.W. conceived and designed the experiments; X.L. and G.W. performed the experiments; J.Z. analyzed the data; L.W. wrote the paper.

Acknowledgments

This work was supported by the National Natural Science Foundation of China (grant NOs. 11772213, U1261102), the National Youth Science Foundation of China (grant NOs. 51704206).

Conflicts of Interest

The authors declare no conflict of interest.

References

  1. Dyni, J.R. Geology and resources of some world oil-shale deposits. Oil Shale 2003, 20, 193–252. [Google Scholar]
  2. Yu, X.; Luo, Z.; Li, H.; Gan, D. Effect of vibration on the separation efficiency of oil shale in a compound dry separator. Fuel 2018, 214, 242–253. [Google Scholar] [CrossRef]
  3. Hao, Y.; Gao, X.Q.; Xiong, F.S.; Zhang, J.L.; Li, Y.J. Temperature distribution simulation and optimization design of electric heater for in-situ oil shale heating. Oil Shale 2014, 31, 105–120. [Google Scholar] [CrossRef]
  4. Wu, Y.; Lin, C.; Ren, L.; Yan, W.; An, S.; Chen, B. Reconstruction of 3D porous media using multiple-point statistics based on a 3D training image. J. Nat. Gas Sci. Eng. 2018, 51, 129–140. [Google Scholar] [CrossRef]
  5. Rabbani, A.; Baychev, T.G.; Ayatollahi, S.; Jivkov, A.P. Evolution of Pore-Scale Morphology of Oil Shale during Pyrolysis: A Quantitative Analysis. Transp. Porous Media 2017, 4, 1–20. [Google Scholar] [CrossRef]
  6. Eseme, E.; Urai, J.L.; Krooss, B.M.; Littke, R. Review of mechanical properties of oil shales: implications for exploitation and basin modelling. Oil Shale 2007, 24, 159–174. [Google Scholar]
  7. Crawford, P.M.; Killen, J.C. New Challenges and Directions in Oil Shale Development Technologies. Oil Shale A Solut. Liq. Fuel Dilemma 2010, 1032, 21–60. [Google Scholar]
  8. Lin, L.; Lai, D.; Guo, E.; Zhang, C.; Xu, G. Oil shale pyrolysis in indirectly heated fixed bed with metallic plates of heating enhancement. Fuel 2016, 163, 48–55. [Google Scholar] [CrossRef]
  9. Kang, Z.; Yang, D.; Zhao, Y.; Hu, Y. Thermal cracking and corresponding permeability of Fushun oil shale. Oil Shale 2011, 28, 273–283. [Google Scholar] [CrossRef]
  10. Rangel-German, E.R.; Schembre, J.; Sandberg, C.; Kovscek, A.R. Electrical-heating-assisted recovery for heavy oil. J. Petroleum Sci. Eng. 2004, 45, 213–231. [Google Scholar] [CrossRef]
  11. Han, H.; Zhong, N.N.; Huang, C.X.; Liu, Y.; Luo, Q.Y.; Dai, N.; Huang, X.Y. Numerical simulation of in-situ conversion of continental oil shale in Northeast China. Oil Shale 2016, 33, 45–57. [Google Scholar]
  12. Lee, K.J.; Moridis, G.J.; Ehlig-Economides, C.A. Compositional simulation of hydrocarbon recovery from oil shale reservoirs with diverse initial saturations of fluid phases by various thermal processes. Energy Explor. Exploit. 2017, 35, 172–193. [Google Scholar] [CrossRef]
  13. Anonymous. Raytheon Technology Shows Promise in Extracting Oil from Shale. Microw. J. 2006, 49, 40. [Google Scholar]
  14. Yang, Z.; Zhu, J.; Li, X.; Luo, D.; Qi, S.; Jia, M. Experimental Investigation of the Transformation of Oil Shale with Fracturing Fluids under Microwave Heating in the Presence of Nanoparticles. Energy Fuel 2017, 31, 10348–10357. [Google Scholar] [CrossRef]
  15. Gerasimov, G.; Khaskhachikh, V.; Potapov, O. Experimental study of kukersite oil shale pyrolysis by solid heat carrier. Fuel Process. Technol. 2017, 158, 123–129. [Google Scholar] [CrossRef]
  16. Chen, C.; Gao, S.; Sun, Y.; Guo, W.; Li, Q. Research on Underground Dynamic Fluid Pressure Balance in the Process of Oil Shale In-Situ Fracturing-Nitrogen Injection Exploitation. J. Energy Resour. Technol. 2017, 139. [Google Scholar] [CrossRef]
  17. Yang, Y.; Liu, S.C.; Li, Q.; Sun, Y.H. Research on experiment of in-situ pyrolysisof oil shaleand production analysis. J. Chem. Pharm. Res. 2013, 5, 763–767. [Google Scholar]
  18. Yang, Y.; Sun, Y.H.; Li, Q. Experiment and simulation of oil shale pyrolysis. Int. J. Earth Sci. Eng. 2013, 6, 1311–1317. [Google Scholar]
  19. Allawzi, M.; Al-Otoom, A.; Allaboun, H.; Ajlouni, A.; Al Nseirat, F. CO2 supercritical fluid extraction of jordanian oil shale utilizing different co-solvents. Fuel Process. Technol. 2011, 92, 2016–2023. [Google Scholar] [CrossRef]
  20. Lu, J.; Hawthorne, S.; Sorensen, J.; Pekot, L.; Kurz, B.; Smith, S. Advancing CO 2 enhanced oil recovery and storage in unconventional oil play-Experimental studies on Bakken shales. Appl. Energy 2017, 208, 171–183. [Google Scholar]
  21. Zhang, X.Q.; Li, Y.S. Changes in shale oil composition and yield after bioleaching by bacillus mucilaginosus and thiobacillus ferrooxidans. Oil Shale 2017, 34, 146. [Google Scholar] [CrossRef]
  22. Tong, J.; Han, X.; Wang, S.; Jiang, X. Evaluation of Structural Characteristics of Huadian Oil Shale Kerogen Using Direct Techniques (Solid-State13C NMR, XPS, FT-IR, and XRD). Energy Fuel 2011, 25, 4006–4013. [Google Scholar] [CrossRef]
  23. Mao, J.; Fang, X.; Lan, Y.; Schimmelmann, A.; Mastalerz, M.; Xu, L.; Schmidt-Rohr, K. Chemical and nanometer-scale structure of kerogen and its change during thermal maturation investigated by advanced solid-state 13C NMR spectroscopy. Geochim. Cosmochim. Acta 2010, 74, 2110–2127. [Google Scholar] [CrossRef]
  24. Sun, Y.; He, L.; Kang, S.; Guo, W.; Li, Q.; Deng, S. Pore Evolution of Oil Shale during Sub-Critical Water Extraction. Energies 2018, 11, 842. [Google Scholar] [CrossRef]
  25. Modica, C.J.; Lapierre, S.G. Estimation of kerogen porosity in source rocks as a function of thermal transformation: Example from the Mowry Shale in the Powder River Basin of Wyoming. AAPG Bull. 2012, 96, 87–108. [Google Scholar] [CrossRef]
  26. Chen, J.; Xiao, X. Evolution of nanoporosity in organic-rich shales during thermal maturation. Fuel 2014, 129, 173–181. [Google Scholar] [CrossRef] [Green Version]
  27. Geng, Y.; Liang, W.; Liu, J.; Cao, M.; Kang, Z. Evolution of pore and fracture structure of oil shale under high temperature and high pressure. Energy Fuel 2017, 31, 10404–10413. [Google Scholar] [CrossRef]
  28. Bai, F.; Sun, Y.; Liu, Y.; Li, Q.; Guo, M. Thermal and kinetic characteristics of pyrolysis and combustion of three oil shales. Energy Convers. Manag. 2015, 97, 374–381. [Google Scholar] [CrossRef]
  29. Sun, Y.; Bai, F.; Liu, B.; Liu, Y.; Guo, M.; Guo, W. Characterization of the oil shale products derived via topochemical reaction method. Fuel 2014, 115, 338–346. [Google Scholar] [CrossRef]
  30. Bai, F.; Sun, Y.; Liu, Y.; Guo, M. Evaluation of the porous structure of huadian oil shale during pyrolysis using multiple approaches. Fuel 2017, 187, 1–8. [Google Scholar] [CrossRef]
  31. Kang, Z.; Zhao, J.; Yang, D.; Zhao, Y.; Hu, Y. Study of the evolution of micron-scale pore structure in oil shale at different temperatures. Oil Shale 2017, 34, 42–45. [Google Scholar] [CrossRef]
  32. Saif, T.; Lin, Q.; Bijeljic, B.; Blunt, M.J. Microstructural imaging and characterization of oil shale before and after pyrolysis. Fuel 2017, 197, 562–574. [Google Scholar] [CrossRef]
  33. Saif, T.; Lin, Q.; Singh, K.; Bijeljic, B.; Blunt, M.J. Dynamic imaging of oil shale pyrolysis using synchrotron x-ray microtomography. Geophys. Res. Lett. 2016, 43, 6799–6807. [Google Scholar] [CrossRef]
  34. Saif, T.; Lin, Q.; Butcher, A.R.; Bijeljic, B.; Blunt, M.J. Multi-scale multi-dimensional microstructure imaging of oil shale pyrolysis using X-ray micro-tomography, automated ultra-high resolution SEM, MAPS Mineralogy and FIB-SEM. Appl. Energy 2017, 202, 628–647. [Google Scholar] [CrossRef]
  35. Liu, Z.; Yang, D.; Hu, Y.; Zhang, J.; Shao, J.; Song, S. Influence of In Situ Pyrolysis on the Evolution of Pore Structure of Oil Shale. Energies 2018, 11, 755. [Google Scholar] [CrossRef]
  36. Pan, L.; Dai, F.; Huang, J.; Liu, S.; Li, G. Study of the effect of mineral matters on the thermal decomposition of Jimsar oil shale using TG-MS. Thermochim. Acta 2016, 627, 31–38. [Google Scholar] [CrossRef]
  37. Pan, L.; Dai, F.; Huang, J.; Liu, S.; Zhang, F. Investigation of the gas flowdistribution and pressure drop in Xinjiang oil shale retort. Oil Shale 2015, 32, 172–185. [Google Scholar] [CrossRef]
  38. Aboulkas, A.; Harfi, K.E.; Bouadili, A.E. Thermal degradation behaviors of polyethylene and polypropylene. Part I: Pyrolysis kinetics and mechanisms. Energy Convers. Manag. 2010, 51, 1363–1369. [Google Scholar] [CrossRef]
  39. Zhao, Y.S.; Feng, Z.C.; Yang, D. the Method for Mining Oil & Gas from Oil Shale by Convection Heating. China Invent Patent CN200,510,012,473, 20 April 2005. [Google Scholar]
  40. Liu, Y.; Xue, X.; He, Y. Solvent Swelling Behavior of Fushun Pyrolysis and Demineralized Oil Shale. J. Comput. Theor. Nanosci. 2011, 4, 1838–1841. [Google Scholar] [CrossRef]
  41. Li, Y.; Feng, Z.; Xue, X.; He, Y.; Qiao, G. Ecological utilization of oil shale by preparing silica and alumina. J. Chem. Ind. Eng. 2008, 59, 1051–1057. [Google Scholar]
  42. Coats, A.W.; Redfern, J.P. Kinetic parameters from thermogravimetric data. Nature 1964, 201, 68–69. [Google Scholar]
  43. Moine, E.C.; Groune, K.; Hamidi, A.E.; Khachani, M.; Halim, M.; Arsalane, S. Multistep process kinetics of the non-isothermal pyrolysis of Moroccan Rif oil shale. Energy 2016, 115, 931–941. [Google Scholar] [CrossRef]
  44. Zhang, Y.; Lebedev, M.; Al-Yaseri, A.; Yu, H.; Xu, X.; Iglauer, S. Characterization of nanoscale rockmechanical properties and microstructures of a Chinese sub-bituminous coal. J. Nat. Gas Sci. Eng. 2018, 52, 106–116. [Google Scholar] [CrossRef]
  45. Luo, L.F.; Lin, H.; Li, S.C.; Lin, H.; Flu-hler, H.; Otten, W. Quantification of 3-d soil macropore networks in different soil types and land uses using computed tomo- graphy. J. Hydrol. 2010, 393, 53–64. [Google Scholar] [CrossRef]
  46. Kapur, J.N.; Sahoo, P.K.; Wong, A.K.C. A new method for gray-level picture thresholding using the entropy of the histogram. Comput. Vis. Graph. Image Process 1985, 29, 273–285. [Google Scholar] [CrossRef]
  47. Ni, X.; Miao, J.; Lv, R.; Lin, X. Quantitative 3D spatial characterization and flow simulation of coal macropores based on μCT technology. Fuel 2017, 200, 199–207. [Google Scholar] [CrossRef]
Figure 1. The process of specimen preparation: (a) Casting large the oil shale sample with concrete; (b) Drill hole and diversion groove of the processed sample; (c) Structure of the heat injection tube.
Energies 11 02297 g001
Figure 2. Schematic of the applied horizontal stress.
Energies 11 02297 g002
Figure 3. Large-size true three-axes press.
Energies 11 02297 g003
Figure 4. X-ray microtomography experimental system.
Energies 11 02297 g004
Figure 5. Thermogravimetric (TG) and differential thermogravimetric (DTG) curves of Xinjiang oil shale.
Energies 11 02297 g005
Figure 6. Variation in steam pressure with pyrolysis time.
Energies 11 02297 g006
Figure 7. Characteristics of the oil shale fracture after pyrolysis.
Energies 11 02297 g007
Figure 8. Variation in horizontal stress difference with time in pyrolysis process.
Energies 11 02297 g008
Figure 9. Pyrolized sample: (a) Morphology of the oil shale after pyrolysis; (b) Sampling locations.
Energies 11 02297 g009
Figure 10. TG curves of oil shale after pyrolysis.
Energies 11 02297 g010
Figure 11. CT-scan grayscale imaging of oil shale after pyrolysis.
Energies 11 02297 g011
Figure 12. The workflow for processing images from CT scan.
Energies 11 02297 g012
Figure 13. Oil shale CT-scan imaging after the binarization processing.
Energies 11 02297 g013
Figure 14. Variation characteristics of fracture parameters in oil shale.
Energies 11 02297 g014
Figure 15. Distribution characteristics of internal holes and fractures in oil shale: (a) pore and fracture groups of oil shale at location A; (b). pore and fracture groups of oil shale at location B; (c) pore and fracture groups of oil shale at location C.
Energies 11 02297 g015
Table 1. Proximate and Fischer assay analyses of the Xinjiang oil shale.
AnalysisComposition
Proximate analysis (wt %, ad)
Moisture0.56
Ash77.89
Volatile matter17.78
Fixed carbon3.77
Fischer assay analysis (wt %, ad)
Oil yield9.08
Water yield1.50
residue86.48
Gas + loss2.94
Table 2. Analysis of the activation energy of oil shale and its residue.
Activation Energy (kJ/mol)
Temperature Range400 °C–450 °C450 °C–510 °C
Original sample24.80425.396
Sample A10.5826.294
Sample B9.5324.151
Sample C5.9357.177
Table 3. Parameters for the fracture of oil shale after pyrolysis.
Parameters of Fractures NumberAverage Length (µm)Average Aperture (µm)
Sample Number
A500th layers4854.433424.6902
1000th layers6453.275224.4329
B500th layers3059.400521.7064
1000th layers2865.362727.0685
C500th layers2557.511023.8858
1000th layers2550.416223.0557

