Optimal Energy Management of Building Microgrid Networks in Islanded Mode Considering Adjustable Power and Component Outages


1
Department of Electrical Engineering, Incheon National University, 12-1 Songdo-dong, Yeonsu-gu, Incheon 406840, Korea
2
Korea Institute of Energy Research, 152 Gajeong-ro, Yuseong-gu, Daejeon 34129, Korea
*
Authors to whom correspondence should be addressed.
Energies 2018, 11(9), 2351; https://doi.org/10.3390/en11092351
Submission received: 17 August 2018
/
Revised: 3 September 2018
/
Accepted: 5 September 2018
/
Published: 6 September 2018
(This article belongs to the Special Issue Optimisation Models and Methods in Energy Systems)
Abstract
:In this paper, an optimal energy management scheme for islanded building microgrid networks is proposed. The proposed building microgrid network comprises of several inter-connected building microgrids (BMGs) and an external energy supplier. Each BMG has a local combined heat and power (CHP) unit, energy storage, renewables and loads (electric and thermal). The external energy system comprises of an external CHP unit, chillers, electric heat pumps and heat pile line, for thermal energy storage. The BMGs can trade energy with other BMGs of the network and can also trade energy with the external energy supplier. In order to efficiently utilize the components of the BMGs and the network, the concept of adjustable power is adopted in this study. Adjustable power can reduce the operation cost of the network by increasing/decreasing the power of dispatchable units. In addition, the failure/recovery of components in the BMGs and the external system are also considered to analyze the performance of the proposed operation method. In order to optimally utilize the available resources during events, precedence among loads of BMGs and the external energy supplier is considered. Simulation results have proved the applicability of the proposed method for both normal islanded mode and with outage/recovery of equipment during the operation horizon. Finally, sensitivity analysis is carried out to analyze the impact of change in components’ parameters values on the saved cost of the network.
1. Introduction
Microgrids are considered as a practical solution for increasing the service reliability, reducing the emissions and enhancing the energy utilization efficiency. These objectives can be achieved due to the ability of the microgrids to island during events and their capability to sustain the penetration of renewables. In addition, due to the deployment of microgrids in the proximity of consumers, the waste heat generated by distributed generators during generation of electricity can also be utilized [1,2], that is, energy utilization efficiency can be increased. Small-scale combined heat and power (CHP) units are deployed to enhance the dispatchability and efficiency of total energy in the microgrids [3]. In traditional power plants, typically 30% of the fuel’s available energy is converted into usable energy, that is, electricity. Combined cooling, heat and power (CCHP)-based generation units can enhance the utilization of available energy to 75–80% [4]. Therefore, CHP/CCHP-based systems are of particular value for microgrids.
Among various other types of microgrids, building microgrids (BMGs) have gained popularity in the recent years due to large consumption of energy, especially heating and cooling energy [5,6,7]. The energy consumption of commercial and residential buildings is about 40% in the USA and 48% of this energy is used for heating and cooling purposes [5]. Similarly, the heating and cooling energy is about 47% of the net energy in operational buildings in China [6]. In EU also, buildings consume 40% of the energy and 79% of this energy is used for heating and cooling, mainly heating [7]. Therefore, the concept of building microgrids with local generations is emerging. In order to enhance the self-sufficiency of buildings, 10% of renewables-based energy is made an obligation for public buildings in Korea [8]. The self-sufficiency of buildings can be further increased by interconnecting several buildings, especially buildings having different consumption patterns. Therefore, various studies are conducted to evaluate the feasibility of interconnecting heterogeneous occupancy buildings [9,10,11].
In Reference [9], maximum utilization of solar energy is considered by interconnecting heterogeneous occupancy buildings while improving the thermal comfort of the residents. Different demand type prosumer buildings are considered in Reference [10] and seasonal demand variations are considered to optimize the energy management of the network. Similarly, a cooperative network of residential buildings is considered in Reference [11] and fluctuations in renewables and flexibilities in temperature requirement are exploited. The hourly fluctuations of heat and power demands in building microgrids are considered and optimal resources are determined in Reference [12]. A multi-objective operation model for building microgrids is proposed in Reference [13] by considering both operation cost and the comfort of the occupants. A central controller is proposed in Reference [14] for global optimal energy management of cooperative building microgrids with a comprehensive communication network. In addition, various studies on modeling and sizing of CHP/CCHP equipment for cooperative building microgrids [15,16], testbeds for evaluating the performance of energy networks [17] and potentials of CHP/CCHP systems in specific locations (UK [18], China [19], USA [20] and EU [21]) are also available.
Most of the studies available in the literature on a network of interconnected building microgrids [15,16,17] have focused on the grid-connected mode operation. However, the islanded mode operation is more challenging due to limited resources and inability to exchange power with the utility grid. Therefore, both grid-connected and islanded mode operation of building microgrids are considered in Reference [22,23,24]. However, a central energy management system (EMS) is utilized in these studies and failure of equipment is not considered. The central EMS needs an extensive communication infrastructure and may cause single point failure problems, in case of events. Meanwhile, various hierarchical EMSs are suggested in the literature [25,26,27] to overcome the problems of centralized EMSs. Similarly, the islanded mode operation becomes more challenging, if some of the equipment is also out-of-service due to any event. The islanded mode operation becomes more challenging in this case due to the coupling of thermal and electrical energies in the BMGs. The equipment failure is not considered in most of the existing studies in the literature.
In order to overcome the drawbacks of the existing literature, the islanded mode operation of a building microgrid network is considered in this study. This paper is an extension of the authors’ previous work [10], where the grid-connected operation mode was analyzed. Similar to [10], a network of BMGs with an external energy supplier (EES) is considered. The BMGs have local energy sources and they can exchange energy among themselves as well as they can trade energy with the EES. A hierarchical two-level EMS is adopted to carry out the optimization of the proposed BMG network. The building EMSs (BEMSs) are responsible for energy management of the individual BMGs while the community EMS (C-EMS) is responsible for the operation of the entire network. In order to enhance the service reliability and reduce the operation cost, the concept of adjustable power is utilized in this study. Where, adjustable power is the amount of power increased by a BMG having cheaper generation sources to send the excess power to other BMG(s) having expansive generation sources and vice versa. In addition, the impact of equipment failure in the BMGs and the EES on the operation of the BMG network is analyzed. Priorities are defined for local and community loads to ensure the continuity of service to more critical loads during event cases when the available resources are not sufficient to fulfill all the load demands.
2. System Configuration and Operation Strategy of the Proposed CCHP System
2.1. CCHP System Configuration
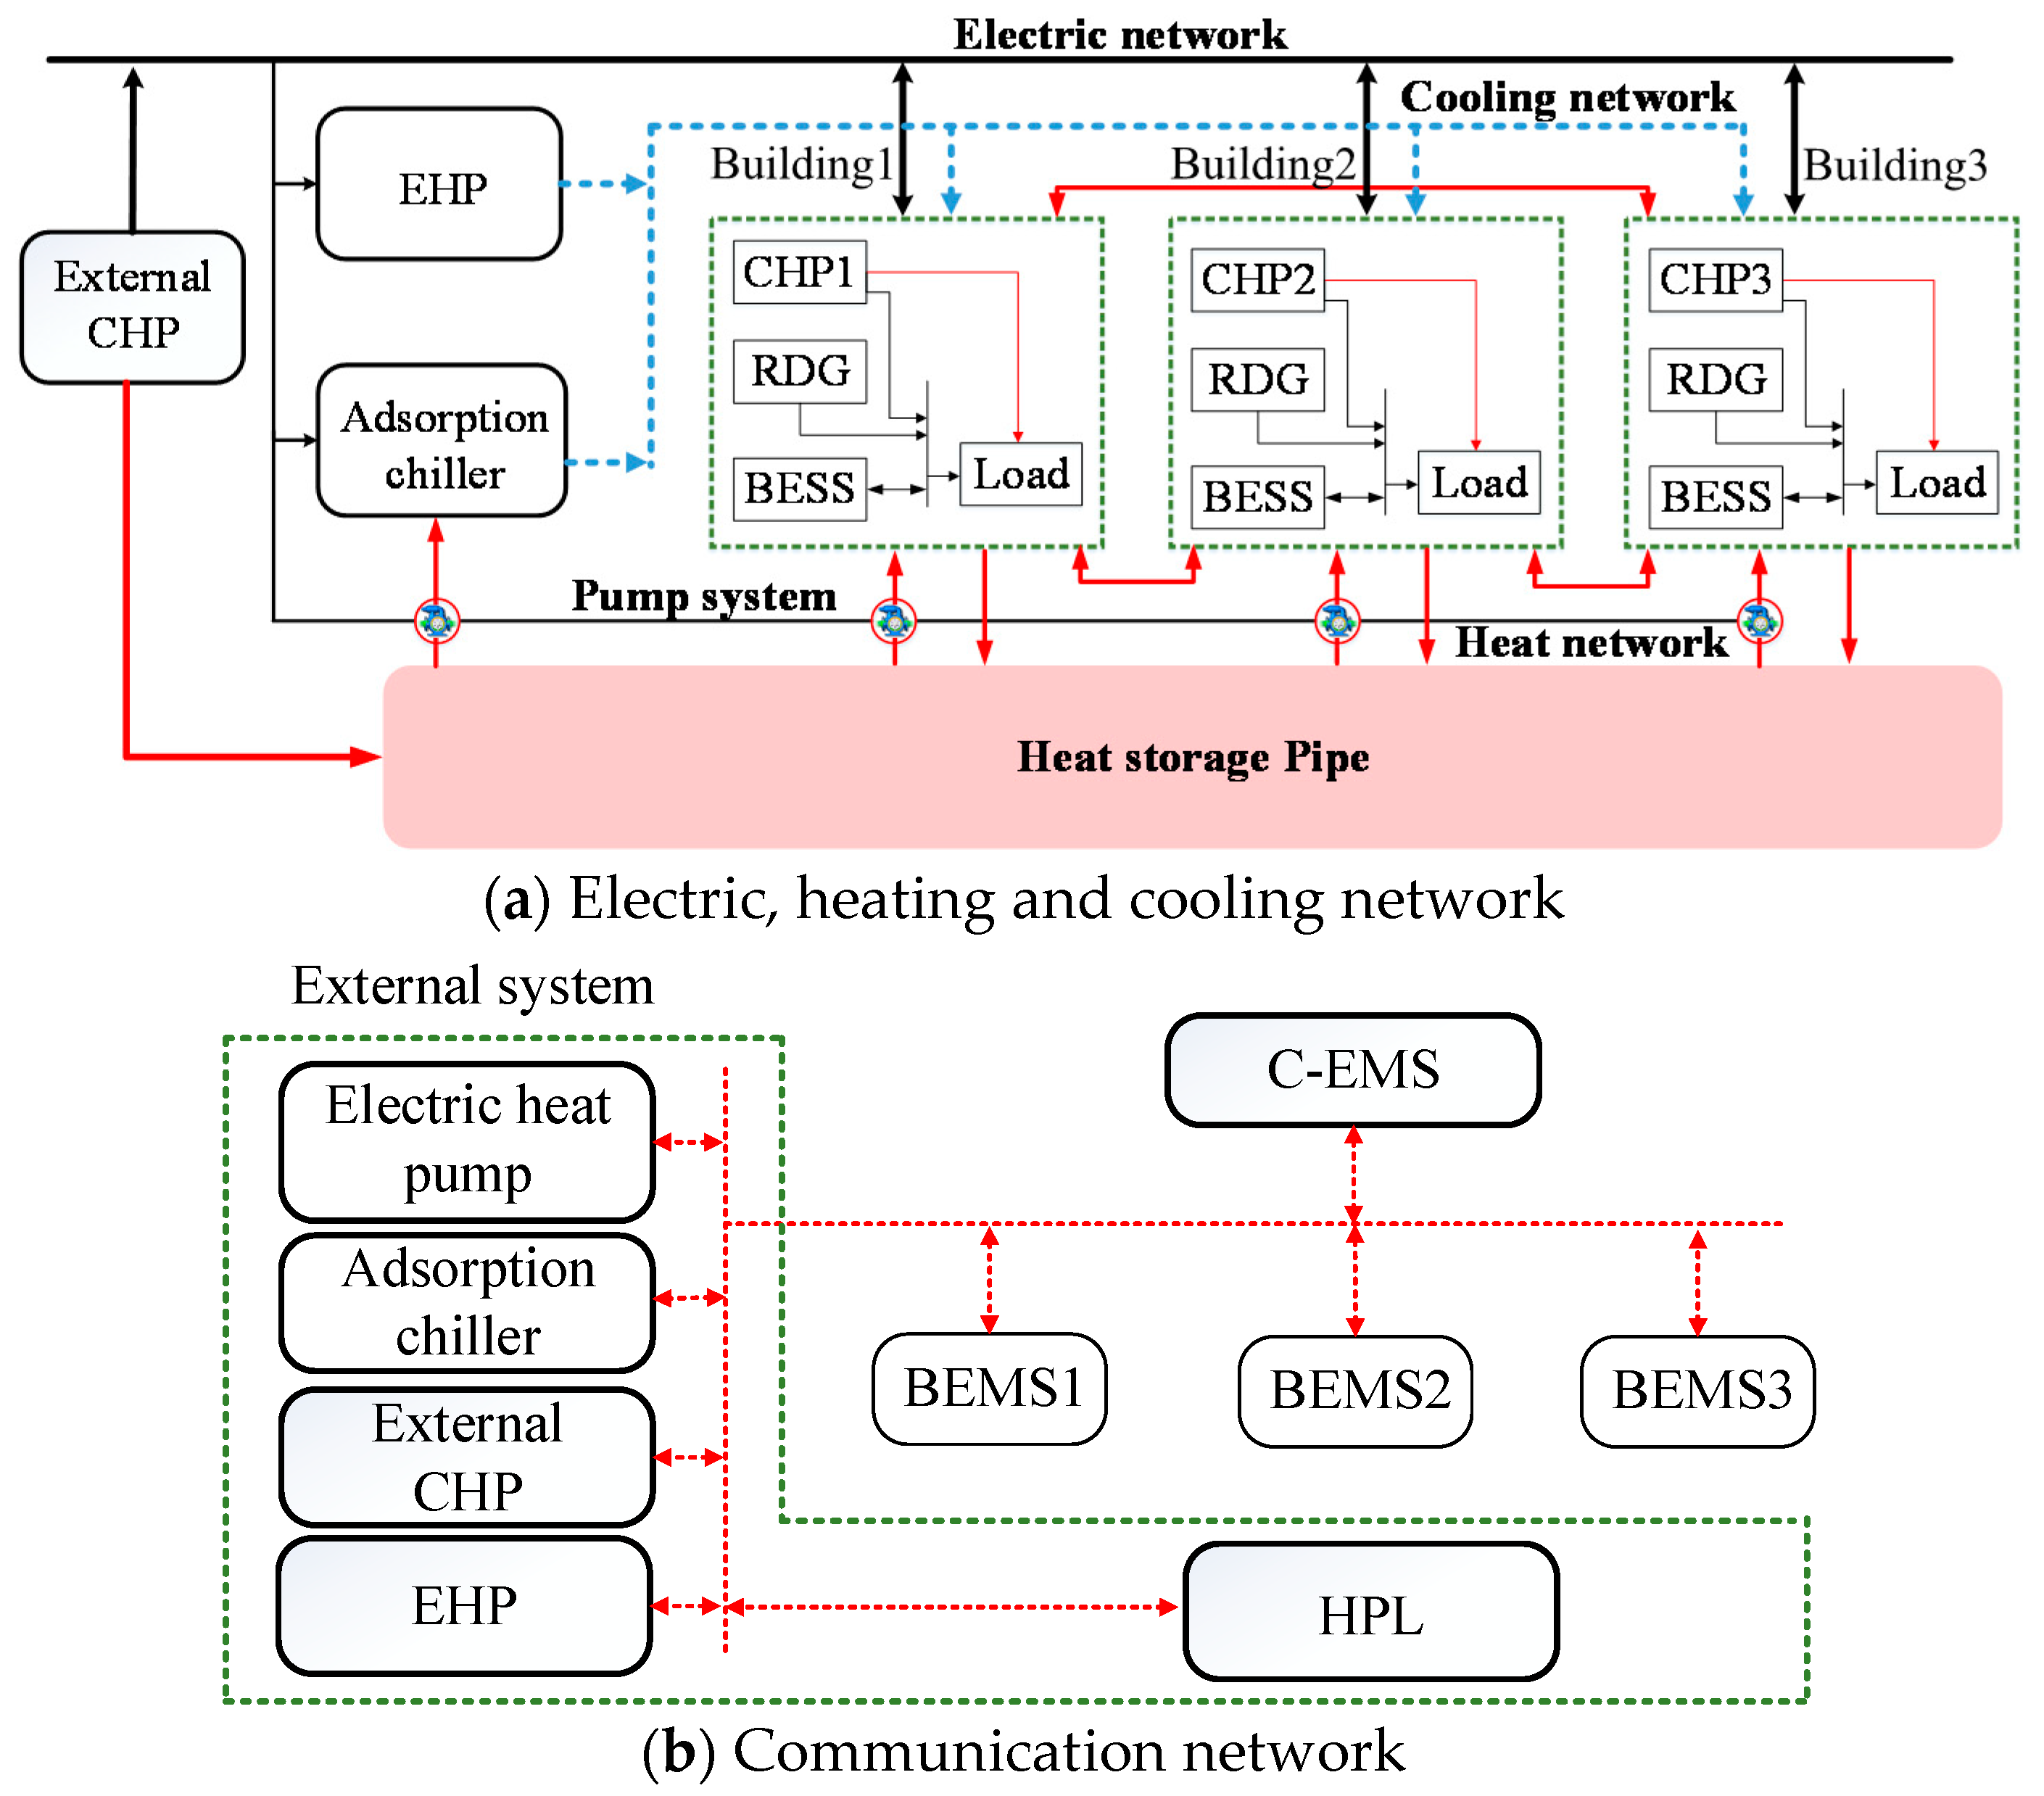
In this paper, the configuration of the CCHP system is based on a pilot system in Korea Institute of Energy Research (KIER), Korea. The configuration of the proposed CCHP system is divided into two main parts, that is, energy networks and communication network, as shown in Figure 1a,b, respectively. The energy networks include electric, heating and cooling networks. In the electric network, the load demand in each building is initially fulfilled by local CHPs, renewable distributed generators (RDGs) and battery energy storage system (BESS). All buildings are interconnected and are also connected with an external system, which comprises of an external CHP (ECHP), electric heat pump (EHP), adsorption chiller (AC), heat pipeline (HPL) system and pump system. The whole system is operated in islanded mode. Therefore, all buildings cannot trade power with the utility grid. However, the BMGs can trade power with other BMGs of the network and can also trade with the EES. Similarly, the BMGs can trade heat energy with other BMGs of the network or with the HPL system. The HPL system plays an important role in heat network for charging/discharging heat energy to/from all the buildings. It also charges heat energy from the ECHP unit and discharges heat energy to AC for generating cooling energy. The BMGs fulfill their cooling load demand by buying cooling energy from the external energy network (EEN). The EEN generates cooling energy by utilizing EHP and/or AC units. In order to operate the CCHP system, the energy balance is maintained during all the operation intervals for electric, heating and cooling energies.
The communication network is shown in detail in Figure 1b. The communication network is designed as a hierarchical EMS, which includes three BEMSs and a C-EMS. The BEMSs are responsible for the optimal operation of all local resources in their respective buildings. The C-EMS gathers the information from all BEMSs and all components in the EES for optimal operation of the whole system. The detailed operation strategy of the CCHP system is presented in the next section for both normal and emergency operation modes. Throughout the paper, normal operation refers to islanded mode operation and emergency operation refers to operation with the outage of any equipment in the system.
2.2. Operation Strategy for CCHP System
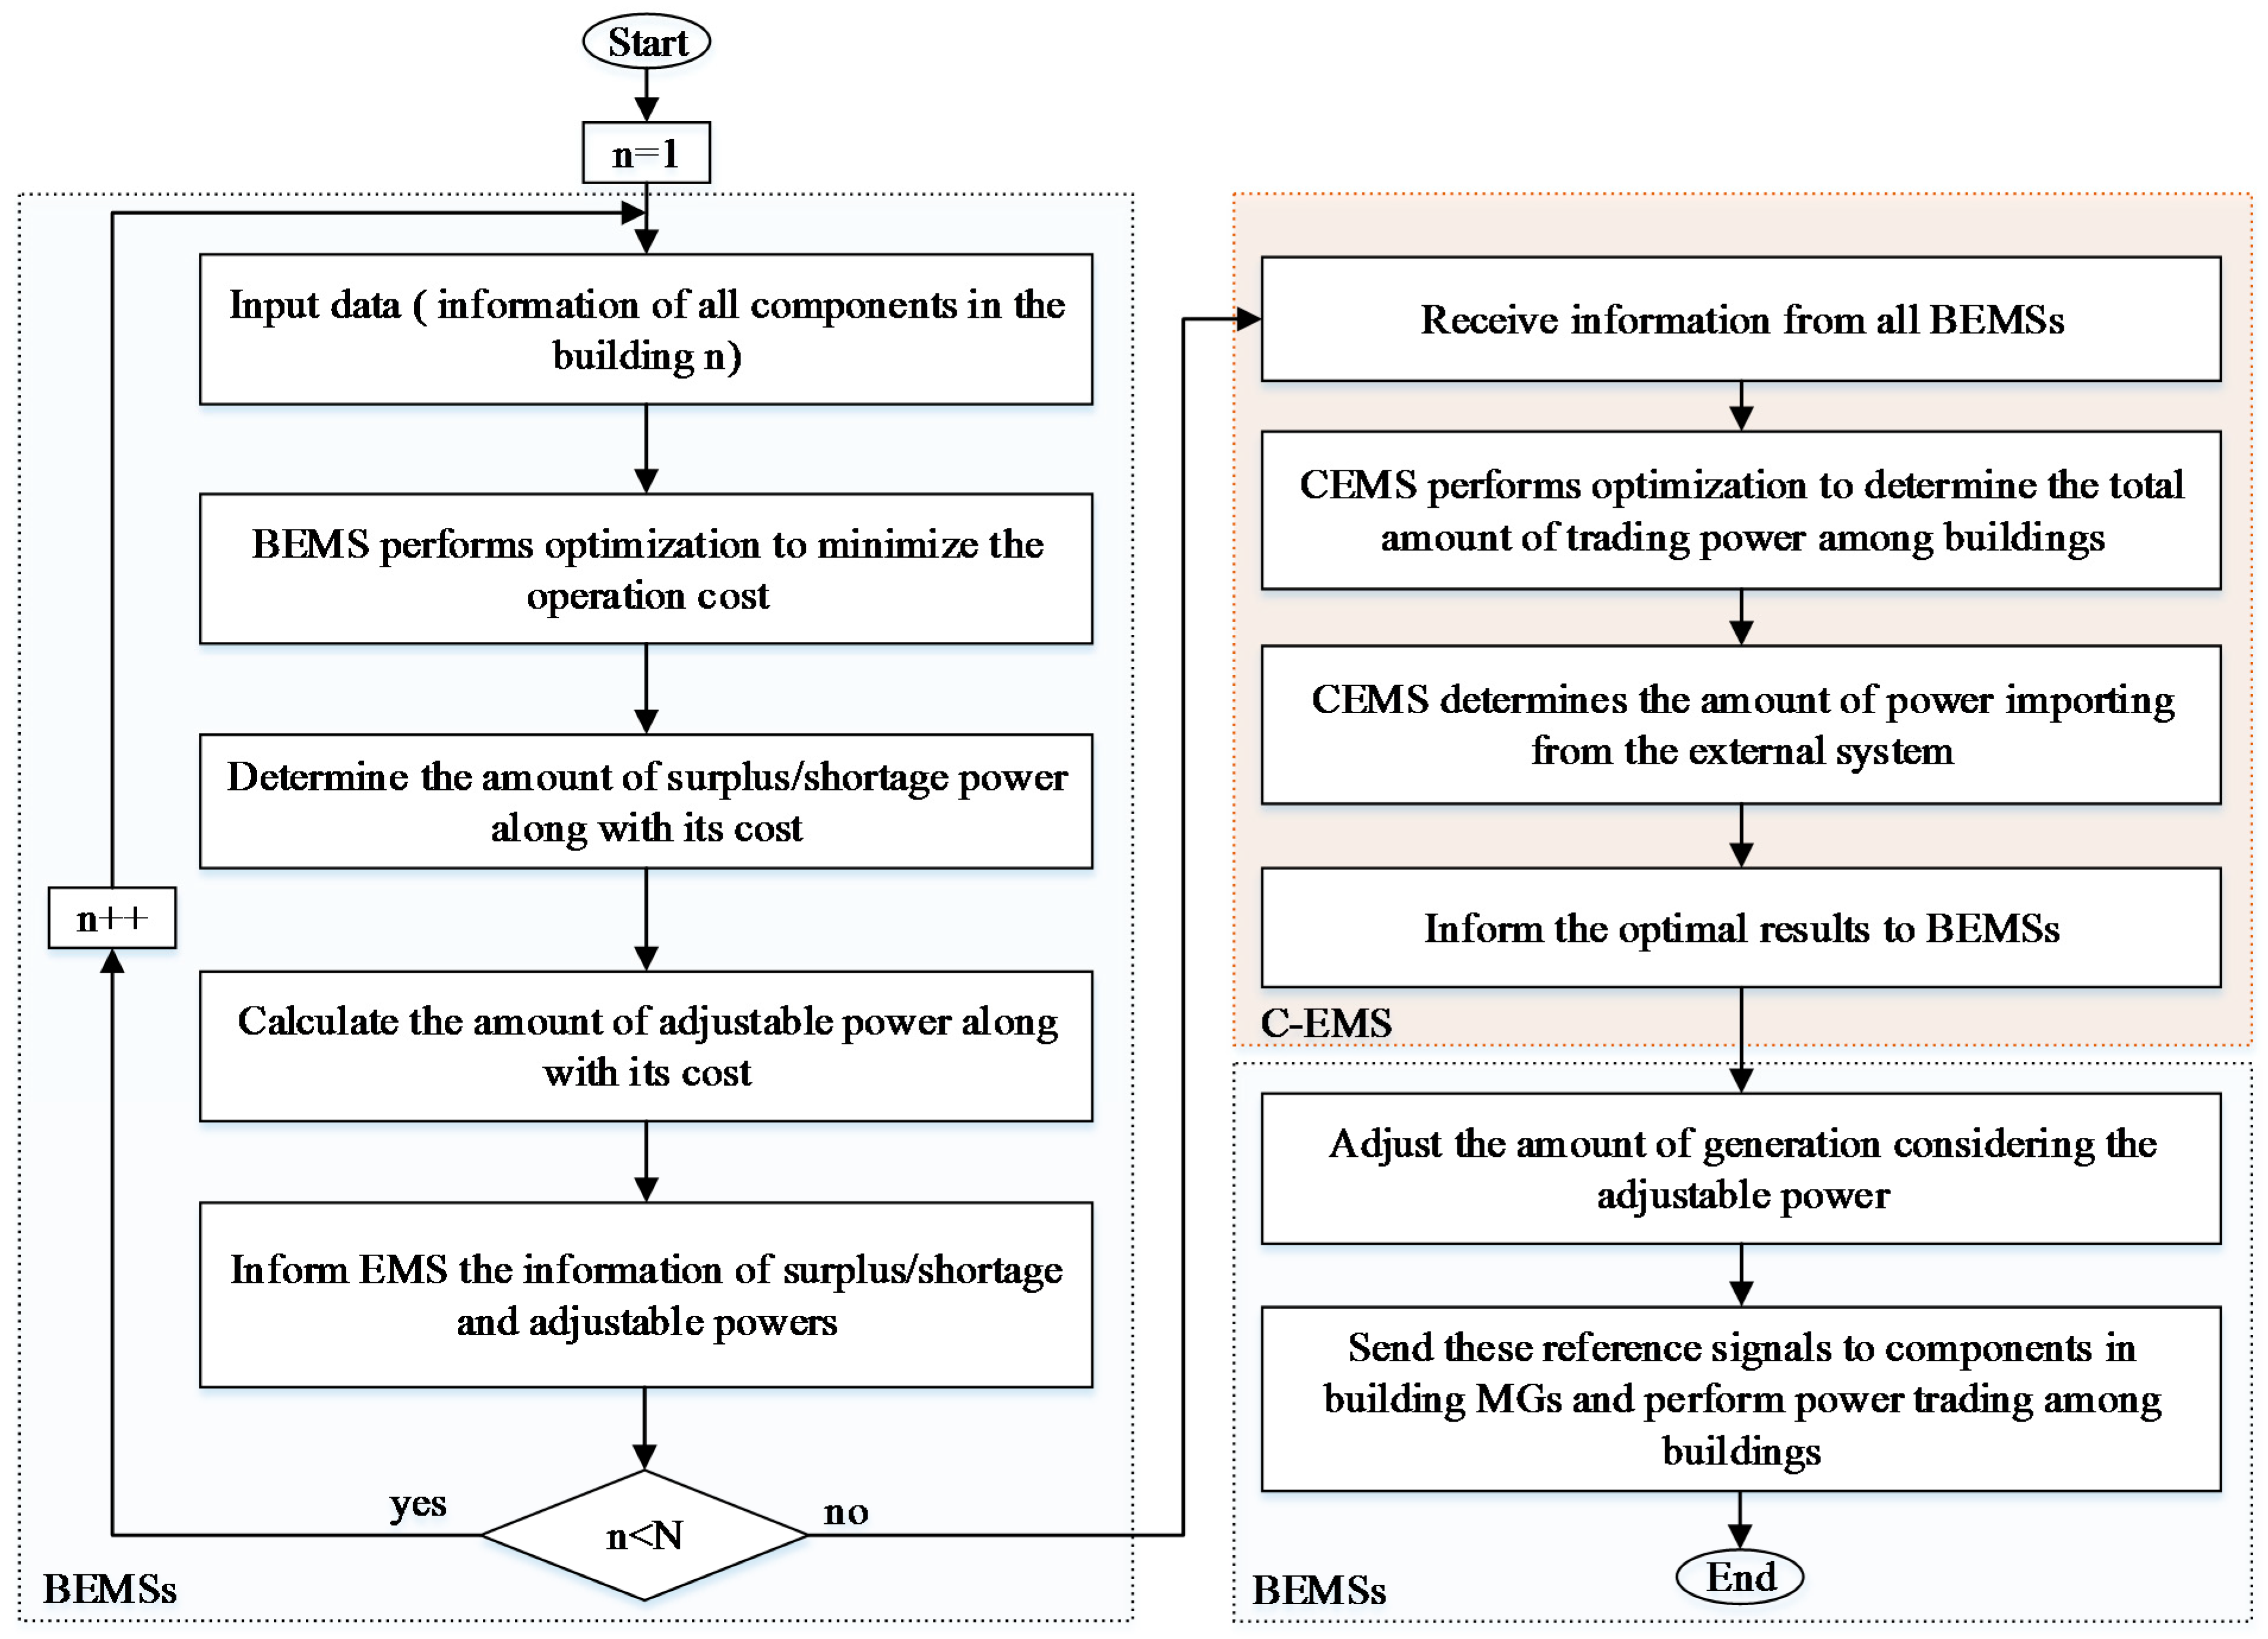
Figure 2 presents the operation strategy of the proposed CCHP system in normal operation mode. Firstly, each BEMS gathers the information of all components in the building as an input and performs optimization to minimize the operation cost of the building. After performing the optimization, the amount of surplus/shortage energy and the output power of CHP units are determined. Based on the output power of CHP units, the bounds of the adjustable power of these CHP units are calculated. The information of surplus/shortage energy and the adjustable power are informed to the C-EMS. After receiving all the information from BEMSs and the components in the external system, the C-EMS performs central optimization. In this step, the amount of adjustable power, amount of energy trading among buildings and the amount of energy trading with the EES are determined. The optimal results are informed to the external system and all the BEMSs. Each BEMS reschedules the operation of all its component in the building. The output power of the CHP units is updated based on the amount of adjusted power. The detailed amount of power trading among buildings and the external system are also determined. Finally, the total operation cost of the building is determined and the BEMS sends the final operation schedules to all the components for implementation. The flowchart in Figure 2 shows the step-by-step optimization for day-ahead scheduling of the CCHP system. However, several events might occur in the CCHP system during the operation period, which could affect the operation of the CCHP system.
The operation of the CCHP system in an emergency case is presented in Figure 3. By using the proposed strategy, whenever an event occurs, the event location and event time are detected by the energy management system. The operation of the CCHP system is rescheduled based on the event location. If the event is inside the building, the BEMS reschedules the operation of all components from the event time to the end of the day and informs the C-EMS with the updated information. Similarly, the C-EMS reschedules the operation of the whole system based on the updated information. On the other hands, if the event is in the external system, the C-EMS detects the event and reschedules the system and informs the updated information to all BEMSs for rescheduling.
Figure 4 shows the rescheduling horizon for the CCHP system in case of events. The scheduling horizon for normal mode is 24 h (T) and operation is based on the day-ahead model. However, in case of an event at time h, the BEMSs and the C-EMS will switch their operation mode to emergency mode. The scheduling horizon of the emergency mode is from the event time t = h to the end of the scheduling horizon (T). Besides, if the system has any storage system, the SOC also need to be updated for the rescheduling operation. In this way, the operation of the system can be updated based on the event occurrence time.
3. Mathematical Model of CCHP System
In this section, a mixed integer linear program (MILP)-based three-step optimization model is presented for minimizing the operation cost of the entire CCHP system. In the first step, each BEMS optimizes the operation of all components inside the building. The surplus/shortage and the bounds of adjustable amount are proposed to the C-EMS. The C-EMS gathers all information from BEMSs as well as from the components of the EES and performs optimization for the whole system. Then the total amount of power sharing among buildings and with the external system is determined in this step. The results from C-EMS are informed to all buildings for rescheduling. In the third step, each BEMS reschedules its local resources considering the amount of adjustable power, power-sharing with other buildings and updates its operation cost. The detailed formulation is presented in the following sections.
3.1. Step 1: Local Optimization by BEMSs
In this step, each BEMS optimizes the operation of all components in each building for the islanded mode. The objective function is to minimize the operation cost of the building, as shown in Equation (1). The first term of Equation (1) represents the operation, start-up and shut-down costs of each CHP in the building. The second term represents the penalty based on the amount of shortage of power in the building. The third term shows the cost of trading heat energy with the external system. The last term shows the cost of buying cooling energy from the external system.
The objective Equation (1) is constrained by Equations (2)–(16). The upper and lower bounds of each CHP unit are given by Equation (2). Based on the on-off status of each CHP, the start-up and shut-down statuses are determined, as shown in Equations (3) and (4), respectively. The heat energy output of CHP is determined using the power-to-heat ratio, as given by Equation (5).
In each building, the energy balance between the supply and the demand is maintained during each operation interval. Equation (6) shows the power balance in a building. The power supply from RDG, CHPs and BESS should be equal to the power demand. The surplus/shortage power is traded either with the external system or with other buildings. Similarly, the heating and cooling energy balance are given by Equations (7) and (8), respectively. Due to the absence of cooling sources in individual buildings, the cooling demand is fulfilled by importing the cooling energy from the EES.
In the islanded mode, in order to reduce the load shedding amount, BESSs are used to shift the surplus power from off-peak load intervals to peak load intervals. The constraints for operation of BESS are shown in Equations (9)–(12). The bounds of charging and discharging power are determined in each interval based on the state of charge (SOC) of BESS at the end of the previous interval, as given by Equations (9) and (10), respectively. After performing charging/discharging, SOC of BESS is updated based on the amount of power charged/discharged and is carried to the next interval, as shown in Equation (11). The SOC of BESS is maintained within its capacity limits, as shown in Equation (12).
After performing the optimization, the bounds of increasable and decreaseable electric/heat energy (i.e., adjustable bounds) are determined for each CHP unit based on its generated power by Equations (13) and (14), respectively. Finally, the amount of surplus, shortage and adjustable bounds are informed to the C-EMS for the second step of optimization.
3.2. Step2: Optimization for the Whole System with C-EMS
In step 2, the objective function aims to minimize the operation cost of the whole system, as shown in Equation (17). The first line of Equation (17) represents the operation cost of the ECHP unit considering start-up/shut-down costs and the cost of adjusting the output power of CHP units in the buildings. The second line of Equation (17) represents the total cost for importing power from the buildings and the profit gained by selling electric power from ECHP to the buildings. The third line of Equation (17) represents the cost for trading heat energy among buildings and with the heat pipeline system. The last term of Equation (17) represents the profit gained by selling the cooling energy to buildings to fulfill their cooling demands.
The objective function in this step is also constrained by several constraints, as given by Equations (18)–(34). The operation bounds of ECHP, the start-up status and shut-down status are determined based on the on-off mode of ECHP, as shown in Equations (18)–(20), respectively. The heat output of the ECHP is determined by Equation (21) based on its power output and power-to-heat ratio. The amount of heat generated by the ECHP is firstly charged to the HPL system and is only wasted if the HPL is fully charged, as shown in Equation (22).
The power generated by ECHP can be used for EHP, AC and pump system or can be sold to the buildings, as given by Equation (23). The constraints related to the cooling energy balance are given by Equations (24) and (25). The EHP and AC are utilized for generating cooling energy and the cooling energy is sold to the buildings for fulfilling their cooling demands. The generation bounds of EHP and AC are presented by Equations (26) and (27), respectively. The total electric power utilized for EHP, AC and pump system is given by Equations (28)–(30). The power can either be received from ECHP or can be bought from other buildings.
The electric and heat energy balance between the internal system (i.e., buildings) and the external system (EES) is presented in Equations (31) and (32) considering the amount of adjustable power. The amount of adjusted heat energy is calculated based on the amount of adjusted power, as shown in Equations (33) and (34).
The HPL system is used for storing the excess of heat energy. The surplus heat energy can either come from the buildings or from the ECHP in the EES. The heat energy in the HPL system is utilized for operating AC to generate cooling energy or to sell to other buildings having shortage of heat energy. The constraints related to the operation of the HPL system are shown in Equations (35)–(38). The bounds for charging and discharging heat energy to/from the HPL are determined based on the SOC of HPL system at the previous interval, as shown in Equations (35) and (36), respectively. The SOC of the HPL system is updated by Equation (37) based on the charging/discharging amount and losses. The operation bounds of HPL system are given by Equation (38).
3.3. Step 3: Rescheduling by BEMSs
In this step, BEMS reschedules the operation of all components in each building considering the information from the C-EMS. BEMSs update the output power of CHP units as well as the amount of energy trading with other BMGs and the EES. During peak load intervals, the load shedding could be performed for maintaining the power balance in the system. Finally, the operation cost of each building is also updated based on the real output of CHP units and the amount of energy traded with other buildings or the EES, as shown in Equation (39).
Similarly, the operation bounds of CHP units are presented by Equation (40). The energy balance for electric and heat energies are shown in Equations (41) and (42), respectively, considering the amount of adjusted power and the energy traded within the CCHP system. Additionally, the objective Equation (39) is also constrained by Equations (3)–(5) and (8)–(12).
4. Numerical Results
4.1. Input Data
The test CCHP system is comprised of three buildings and an external system and it is operated in islanded mode, as shown in Figure 1. The analysis is conducted for a 24-h scheduling horizon with 1 h time intervals [8,9]. All numerical simulations are coded in Visual Studio 2010 and are solved using the MILP solver CPLEX (12.6) [28]. The load (electric, thermal and cooling) profiles of all the three BEMSs during a weekday are shown in Figure 5a–c, respectively. Figure 5d shows the output of RDGs in all the BMGs. Similarly, Figure 6a–d show the electric, thermal, cooling profiles and the output of RDGs in all the BMGs for a weekend day, respectively. The information of CDG units in BMGs and EES are tabulated in Table 1. Power-to-heat ratio of CHPs is varied under different load-ability to better utilize the heat and power. However, frequent change in power-to-heat ration can adversely affect the lifetime of the CHP equipment. Therefore, the power-to-heat ratio of CHPs is varied for different seasons of the years, not on daily basis [29]. Due to the above-mentioned problems, the power-to-heat ratio is kept same in this study. Finally, the information of BESSs and HPL is tabulated in Table 2.
4.2. Operation of the CCHP System in Normal Operation
This section presents the normal operation of the CCHP system in islanded mode. The numerical results show the operation of the whole system during a weekday. In the first step, BEMSs optimize the operation of all component inside the buildings and inform the optimal results to the C-EMS. The operation of local resources depends on the operation cost of each CHP unit, power-to-heat ratio and the load profiles. In building 1, due to the lower operation cost of CHP, it always generates maximum power. The amount of shortage electric and heat energies are zeros during all the operation intervals. The surplus of electric/heat energy is traded with other buildings and/or the external system, as shown in Figure 7a. The operation cost of CHP in building 2 is higher along with a lower power-to-heat ratio. Therefore, there is no surplus of electric or heat energies. The CHP unit is only set to fulfill the local electric load, the amount of heat shortage is fulfilled by receiving heat from the HPL system and other buildings, as shown in Figure 7b. Similarly, in building 3, the CHP unit is also set to fulfill the local electric load as shown in Figure 7c. However, during peak load intervals (8, 17–14), the local sources cannot fulfill all the load. The information about shortage of power and surplus of heat is sent to the C-EMS. Due to the absence of local cooling sources, all the cooling load information is sent to the C-EMS as the amount of cooling shortage. The information on the surplus/shortage energies in each building is summarized in Figure 7.
After performing optimization by BEMSs, the output power of CHP units is determined in all the buildings. The bounds of adjustable power for electric and heat energies can be calculated by using Equations (13)–(16). Finally, BEMSs combine all information of surplus/shortage and adjustable energies and inform to the C-EMS.
The C-EMS gathers all information from BEMSs and performs optimization for minimizing the operation cost of the whole system. The operation of all components in the external system is summarized in Figure 8. The operation cost of ECHP is low, therefore, it is always set to generate maximum output power. The power is sent to all equipment in the external system, that is, AC, pumps and EHP. The surplus power is sold to the buildings, as shown in Figure 8a. However, if EHP requires a large amount of power, the external system also imports power from the buildings (interval 17), as shown in Figure 8b. Figure 8c shows that the output of AC and EHP is utilized to fulfill the cooling load demand of the BMGs. Figure 8d shows the amount of heat trading in the whole system. The main heat energy source for HPL is the ECHP. Whenever the ECHP is operated, the heat energy is charged to the HPL system. The HPL also receives heat energy from buildings (intervals 17–20). The HPL discharges heat energy to AC for generating cooling energy, which is used for fulfilling the cooling load of the buildings. Similarly, HPL can be discharged to feed the heating load demand of buildings having shortage of heat energy, that is, intervals 5–13, 16 and 17.
Figure 9 shows the amount of adjusted power in each building, the amount of power traded with the external system and the amount of heat energy traded among BMGs. It can be observed from Figure 9a that the CHP units having high operation cost decrease their output power for reducing the operation cost. The shortage of electric and heat energies due to reduction in the amount of power of the CHP unit is imported from other buildings and/or the external system. For instance, at interval 1, CHP unit in building 2 decreases 740 kWh as shown in Figure 9a. The amount of decreased power is fulfilled by importing the cheaper power from building 1 (250 kWh) and the external system (490 kWh), as shown at interval 1 in Figure 9b. The amount of traded heat energy is depicted in Figure 9c. The surplus of heat energies from building 1 and 3 are sent to building 2 to reduce the amount of heat trading with the HPL system.
Finally, in order to analyze the impact of the adjustable power on the operation cost of the whole system, a comparison between two cases is considered for both a weekday and a weekend day. The first case considers the proposed method considering the adjustable power while the second case is without the adjustable power. It can be observed from Table 3 that by using the proposed method with the adjustable power, the operation cost of the system has reduced by 6.38% and 4.79% for a weekday and a weekend day, respectively, that is, cost savings. This reduction was due to decrease in the generation of CHP units having higher operation cost while increasing the output of CHPs in other BMGs having lower generation cost to fulfill the energy demand of the network. In a weekend day, the load demand is usually increased for residential buildings (building 2) and shopping malls (building 3) as compared to a weekday. However, the load demand in hospital building (building 1) changes randomly depending on the number of patients present in that particular day. During weekend day, the local generator in each building generated more power to fulfil all the local load demand. Therefore, the amount of surplus or adjustable power is decreased, which results in decreased power sharing among the BMGs of the network. As a result, the saved cost on a weekend day is lower than a weekday, as shown in Table 3.
4.3. Operation of the CCHP System during Events
The energy management systems, that is, BEMSs and C-EMS are designed to operate the CCHP system in both normal and emergency modes. Whenever any event occurs in the system, the system detects the event along with the occurrence time of the event and reschedules the operation of the whole system. In this study case, three event cases are analyzed in the CCHP system.
In the first event, the CHP unit in building 2 is out of service at interval 6. In the second event, the CHP unit in building 2 is recovered at interval 13. In the third event, the ECHP is out of service at interval 20. The detailed analysis of each event case is presented in the following section.
4.3.1. CHP Unit in Building 2 is Out of Service at Interval 6 and Recovered at Interval 13
In the first event, the BEMS of building 2 reschedules the operation schedule of all components in the building from event time (interval 6) to the end of the day (interval 24) considering fault in the CHP unit. The shortage of electric, heating and cooling energies are updated for building 2 as shown in Figure 10a. After receiving the updated information from BEMSs, C-EMS reschedules the operation of the whole system with the updated information. In this case, the surplus of electric and heat energies from other buildings are sent to building 2 for fulfilling the shortage power and reducing the amount of load shedding. For instance, at interval 6, the amount of shortage of power in building 2 is 850 kWh as shown in Figure 10c. However, the total surplus available from building 1 and imported power from the external system is 750 kWh. In this case, the building 3 can increase its generation amount by 100 kWh and send to building 2 for fulfilling the load as shown in Figure 10b. However, during peak load intervals (12–18, 20, 22, 24), the amount of shortage of power is very high. The load shedding is inevitable to maintain the power balance in the system, as shown in Figure 10c.
At interval 13, the CHP unit is recovered from the fault. In the same way, BEMS of building 2 reschedules the operation of all the components considering the recovered component from interval 13 to interval 24. Figure 11a shows the surplus/shortage power information in building 2 after rescheduling. It can be observed that the shortage of electric energy is reduced to zero due to the recovery of CDG in BMG2. Similarly, the shortage of heat energy is also significantly reduced for the same reason. The updated information with the bounds of adjustable power is informed to the C-EMS for rescheduling the CCHP system. After rescheduling by C-EMS, it can be observed from Figure 11b that the amount of surplus power from the building 1 and the amount of importing power from the ESS are used for decreasing the output power of the expensive CGD unit (CDG2). The load shedding in building 2 and 3 are also recovered as shown in Figure 11c. From interval 13, the operation of the system is recovered and it operates similar to the normal operation mode, as shown in the previous section.
4.3.2. ECHP Unit is Out of Service at Interval 20
In this case, the event is detected by C-EMS. Therefore, BEMSs are not required to reschedule at the first step. C-EMS reschedules the operation of the whole system. Due to the failure of ECHP, the external system imports power from the buildings to fulfill all the loads. The external loads are more important loads, that is, EHP, AC and pump system, due to their role in maintaining the service availability for the whole network. The interruption of service to such loads could have a significant effect on the operation of the whole system. For example, if the pump system is stopped, all the buildings and AC cannot trade heat energy from HPL system. Similarly, if the EHP or AC is interrupted, it could make a large amount of cooling load shedding in the whole system. Therefore, in this event, the buildings should provide the power to fulfill the all load demand of the EES. It can be observed from Figure 12a that the amount of buying power is enough for fulfilling all the load demands of the EES. In order to fulfill the loads in the external system, the local CHP units in the buildings increase the output power and send to the external system, as shown in Figure 12b. During intervals 20 and 22, the power supply is not enough for all the load in buildings. The power is sent to the high priority loads in the external system and the load shedding is performed in the buildings for maintaining power balance, as shown in Figure 12c.
4.3.3. Sensitivity Analysis
In this section, sensitivity analysis of different parameter values, that is, the operation cost of CHPs, the operation cost of ECHP, the initial value of BESSs and the initial value of HPL is presented to show the effect on the saving cost for a weekday. In order to analyze the effect of each parameter, the value of each parameter is varied by ±1%, ±2%, ±3%, ±4% and ±5%, individually while keeping the value of other parameters same.
In normal operation, the ECHP usually operates at maximum output power due to the cheaper operation cost, as shown in the previous sections. The surplus power from ECHP is sold to other buildings for reducing the output power of the expensive CHPs. Figure 13a,b shows the effect of the change in operation cost of CHPs in BMGs and ECHP on the saved cost, respectively. It can be observed that both the change in the operation cost of CHPs and ECHP have a significant effect on the saved cost. If the operation cost of CHPs is increased, the saved cost is increased because the buildings can receive power from ECHP and reduce more expensive CHPs in this case, as shown in Figure 13a. On the other hand, the increase in the operation cost of ECHP leads to the reduction of the saved cost because the surplus power from ECHP is sold to other building with a higher price, as shown in Figure 13b. The change in the initial value of BESSs and HPL have a minute effect on the saved cost. The change in initial values of BESSs have lesser impact on the saving cost a as compared to the change in operation cost of the CHPs. In addition, if the initial values of BESSs are increased, the output power of CHPs is slightly reduced during some intervals and the saved cost is also slightly increased, as shown in Figure 13c. Similarly, the initial value of HPL also have a lower effect on the saved cost. However, the capacity and the initial value of HPL is much higher than the BESSs. Thus, it has a more prominent effect on the saved cost as compared to the BESSs, as shown in Figure 13d.
5. Conclusions
An optimal energy management system for a building microgrid network in islanded mode is proposed in this study. The building microgrid network comprises of three buildings and an external energy supplier, which comprises of ECHP, EHP, chiller and HPL. The BMGs can trade energy among themselves as well as with the external energy network. In order to better utilize the resources of the network, the concept of adjustable power is adopted in this study. By using the proposed adjustable power, the operation cost has been reduced by 6.4% and 4.79%, respectively for a weekday and a weekend day in the tested network. The proposed adjustable power method can reduce the operation cost in normal operation and can reduce the load-shedding amount during outage events. In addition, the outage of equipment in the BMGs and the external energy supplier is also considered to analyze the performance of the proposed operation method. During outage events, power is increased by healthy BMGs and energy is shared with the on-emergency BMGs to minimize the load-shedding amount. Higher precedence is given to the loads responsible for continuing the service to the whole network, community-level resources in the external energy supplier over loads of individual BMGs. Simulation results have proved that the proposed method can optimally reschedule the available resources of the network upon outage/recovery of system components. The component values are changed by ±5% and a maximum of 6.74% saved cost is achieved for −5% reduction in the operation cost of the ECHP.
Author Contributions
V.-H.B. has designed the experiments and wrote the paper partially; A.H. conceived the idea and partially wrote the paper; H.-M.K. revised and analyzed the results; Y.-H.I. has revised the paper and helped in the idea finalization.
Funding
This work was supported by In-house Research and Development Program of the Korea Institute of Energy Research (KIER) (B8-2412).
Acknowledgments
This work was supported by In-house Research and Development Program of the Korea Institute of Energy Research (KIER) (B8-2412).
Conflicts of Interest
The authors declare no conflict of interest.
Nomenclature
| Sets | |
| N | Set of buildings |
| T | Set of time intervals in the scheduling horizon. |
| I | Set of CHPs |
| Indices | |
| n | Index of buildings, running from 1 to N. |
| t | Index of time intervals, running from 1 to T. |
| i | Index of generators, running from 1 to I. |
| Parameters | |
| Operation cost of CHP unit i | |
| Start-up and shut-down costs of CHP unit i | |
| Penalty for shortage power at t | |
| Power-to-heat ratio of CHP unit i | |
| Electricity buying/selling price signal for trading power at t | |
| Heat buying/selling price signal for receiving/sending heat energy among BMGs at t | |
| Heat buying/selling price signal of BMGs for trading with the heat pipeline system at t | |
| Cooling buying/selling price signals for trading with the EES at t | |
| Generation amount of renewable distributed generator at t | |
| Electric load amount at t | |
| Capacity of BESS | |
| Capacity of HPL | |
| Charging/discharging losses of BESS | |
| Charging/discharging losses of HP | |
| Heat load amount at t | |
| Cooling load amount at t | |
| Cost of adjustable power at t | |
| Operation cost of ECHP | |
| Start-up cost of ECHP | |
| Shut-down cost of ECHP | |
| Power-to-heat ratio of ECHP | |
| Maximum cooling generation limit of EHP and AC | |
| Minimum/Maximum power generation limits of CHP i at t | |
| Minimum/Maximum heat generation limits of CHP i at t | |
| Minimum/Maximum power generation limits of ECHP at t | |
| Electricity to cooling ratio of EHP | |
| Heat to cooling ratio of AC | |
| Penalty for load shedding at t | |
| Variables | |
| Amount of power generated by CHP unit i at t | |
| Amount of heat generated by CHP i at t | |
| Operation status of CHP i and ECHP at t | |
| Start-up and shut-down status of CHP i at t | |
| Start-up and shut-down status of ECHP at t | |
| Amount of power generated by ECHP at t | |
| Amount of heat generated by ECHP at t | |
| Amount of heat wasted by ECHP at t | |
| Amount of shortage/surplus power in a BMG at t | |
| Amount of shortage/surplus heat in a BMG at t | |
| Amount of shortage of cooling in a BMG at t | |
| Charging/discharging amount of BESS at t | |
| State of charge of BESS at t | |
| State of charge of HPL at t | |
| Adjustable power for CHP unit i at t | |
| Adjustable heat for CHP unit i at t | |
| Heat charging/discharging amount to/from building at t | |
| Amount of heat charged from large CHP and amount of heat discharged to AC at t | |
| Amount of cooling energy bought at t | |
| Total increasable amount of electric/heat energies in building n at t | |
| Amount of power bought from buildings for EHP at t | |
| Amount of power bought from buildings for AC at t | |
| Amount of power bought from buildings for pumping system at t | |
| Amount of power received from ECHP for EHP at t | |
| Amount of power received from ECHP for AC at t | |
| Amount of power received from ECHP for pumping system at t | |
| Amount of power sold to the buildings at t from the external system | |
| Amount of power bought from the buildings at t | |
| Amount of cooling energy sold to building n at t by the EES | |
| Amount of power received/sent by a BMG at t | |
| Amount of heat received/sent by a BMG at t | |
| Amount of heat wasted by CHP unit i at t | |
| Amount of load shed in a BMG at t | |
References
- Mirez, J.; Hernandez-Callejo, L.; Horn, M.; Bonilla, L.M. Simulation of direct current microgrid and study of power and battery charge/discharge management. DYNA 2017, 92, 673–679. [Google Scholar]
- Marnay, C.; Chatzivasileiadis, S.; Abbey, C.; Iravani, R.; Joos, G.; Lombardi, P.; Mancarella, P.; Appen, V.J. Microgrid evolution roadmap. In Proceedings of the 2015 International Symposium on Smart Electric Distribution Systems and Technologies (EDST), Vienna, Austria, 8–11 September 2015; pp. 139–144. [Google Scholar]
- Gu, W.; Wu, Z.; Bo, R.; Liu, W.; Zhou, G.; Chen, W.; Wu, Z. Modeling, planning and optimal energy management of combined cooling, heating and power microgrid: A review. Int. J. Electr. Pow. Energy Syst. 2014, 54, 26–37. [Google Scholar] [CrossRef]
- Cho, H.; Smith, A.D.; Mago, P. Combined cooling, heating and power: A review of performance improvement and optimization. Appl. Energy 2014, 136, 168–185. [Google Scholar] [CrossRef]
- Carpenter, J.; Mago, P.J.; Luck, R.; Cho, H. Passive energy management through increased thermal capacitance. Energy Build. 2014, 75, 465–471. [Google Scholar] [CrossRef] [Green Version]
- Li, H.; You, S.; Zhang, H.; Zheng, W.; Zheng, X.; Jia, J.; Ye, T.; Zou, L. Modelling of AQI related to building space heating energy demand based on big data analytics. Appl. Energy 2017, 203, 57–71. [Google Scholar] [CrossRef]
- Energy Efficient Buildings: Europe. Available online: https://ovacen.com/wp-content/uploads/2014/09/edificios-energeticamente-eficientes-en-europa.pdf (accessed on 17 August 2018).
- Oh, S.D.; Yoo, Y.; Song, J.; Song, S.J.; Jang, H.N.; Kim, K.; Kwak, H.Y. A cost-effective method for integration of new and renewable energy systems in public buildings in Korea. Energy Build. 2014, 74, 120–131. [Google Scholar] [CrossRef]
- Korkas, C.D.; Baldi, S.; Michailidis, I.; Kosmatopoulos, E.B. Intelligent energy and thermal comfort management in grid-connected microgrids with heterogeneous occupancy schedule. Appl. Energy 2015, 149, 194–203. [Google Scholar] [CrossRef]
- Hussain, A.; Bui, V.H.; Kim, H.M.; Im, Y.H.; Lee, J.Y. Optimal energy management of combined cooling, heat and power in different demand type buildings considering seasonal demand variations. Energies 2017, 10, 789. [Google Scholar] [CrossRef]
- Ouammi, A. Optimal power scheduling for a cooperative network of smart residential buildings. IEEE Trans. Sustain. Energy 2016, 7, 1317–1326. [Google Scholar] [CrossRef]
- Zidan, A.; Gabbar, H.A.; Eldessouky, A. Optimal planning of combined heat and power systems within microgrids. Energy 2015, 93, 235–244. [Google Scholar] [CrossRef]
- Liu, G.; Ollis, T.B.; Xiao, B.; Zhang, X.; Tomsovic, K. Community Microgrid Scheduling Considering Network Operational Constraints and Building Thermal Dynamics. Energies 2017, 10, 1554. [Google Scholar] [CrossRef]
- Dagdougui, H.; Ouammi, A.; Dessaint, L.; Sacile, R. Global energy management system for cooperative networked residential green buildings. IET Renew. Power Gener. 2016, 10, 1237–1244. [Google Scholar] [CrossRef]
- Sun, T.; Lu, J.; Li, Z.; Lubkeman, D.; Lu, N. Modeling combined heat and power systems for microgrid applications. IEEE Trans. Smart Grid 2017, 9, 4172–4180. [Google Scholar] [CrossRef]
- Zenginis, I.; Vardakas, J.; Abadal, J.; Echave, C.; Morato, M.; Verikoukis, C. Optimal power equipment sizing and management for cooperative buildings in microgrids. IEEE Trans. Ind. Inform. 2018. [Google Scholar] [CrossRef]
- Thangavelu, S.R.; Nutkani, I.U.; Hwee, C.M.; Myat, A.; Khambadkone, A. Integrated electrical and thermal grid facility-testing of future microgrid technologies. Energies 2015, 8, 10082–10105. [Google Scholar] [CrossRef]
- Salem, R.; Bahadori-Jahromi, A.; Mylona, A.; Godfrey, P.; Cook, D. Comparison and Evaluation of the Potential Energy, Carbon Emissions and Financial Impacts from the Incorporation of CHP and CCHP Systems in Existing UK Hotel Buildings. Energies 2018, 11, 1219. [Google Scholar] [CrossRef]
- Luo, Z.; Gu, W.; Sun, Y.; Yin, X.; Tang, Y.; Yuan, X. Performance Analysis of the Combined Operation of Interconnected-BCCHP Microgrids in China. Sustainability 2016, 8, 977. [Google Scholar] [CrossRef]
- Anne, H.; Rick, T.; Michael, F.; Rachel, W. Combined Heat and Power (CHP) Technical Potential in the United States. Available online: https://www.energy.gov/sites/prod/files/2016/04/f30/CHP%20Technical%20Potential%20Study%203-31-2016%20Final.pdf (accessed on 17 August 2018).
- Weber, M. Combined Heat and Power in Europe. University of Edinburgh 2012. Available online: http://www.csas.ed.ac.uk/__data/assets/pdf_file/0006/81285/Weber_on_CHP_V3_FINAL_120330.pdf (accessed on 17 August 2018).
- Li, Z.; Xu, Y. Optimal coordinated energy dispatch of a multi-energy microgrid in grid-connected and islanded modes. Appl. Energy 2018, 210, 974–986. [Google Scholar] [CrossRef]
- Kim, J.Y.; Park, J.H.; Lee, H.J. Coordinated control strategy for microgrid in grid-connected and islanded operation. IFAC Proc. Vol. 2011, 44, 14766–14771. [Google Scholar] [CrossRef]
- Mehrasa, M.; Pouresmaeil, E.; Jørgensen, B.N.; Catalão, J.P. A control plan for the stable operation of microgrids during grid-connected and islanded modes. Electr. Power Syst. Res. 2015, 129, 10–22. [Google Scholar] [CrossRef] [Green Version]
- Wang, Y.; Mao, S.; Nelms, R.M. On hierarchical power scheduling for the macrogrid and cooperative microgrids. IEEE Trans. Ind. Inform. 2015, 11, 1574–1584. [Google Scholar] [CrossRef]
- Tian, P.; Xiao, X.; Wang, K.; Ding, R. A hierarchical energy management system based on hierarchical optimization for microgrid community economic operation. IEEE Trans. Smart Grid 2016, 7, 2230–2241. [Google Scholar] [CrossRef]
- Bui, V.H.; Hussain, A.; Kim, H.M. A multiagent-based hierarchical energy management strategy for multi-microgrids considering adjustable power and demand response. IEEE Trans. Smart Grid 2018, 9, 1323–1333. [Google Scholar] [CrossRef]
- IBM ILOG CPLEX V12.6 User’s Manual for CPLEX 2015, CPLEX Division; ILOG: Incline Village, NV, USA, 2015; Available online: https://www.ibm.com/support/knowledgecenter/SSSA5P_12.6.2/ilog.odms.studio.help/pdf/usrcplex.pdf (accessed on 17 August 2018).
- Liu, Y.; Gao, S.; Zhao, X.; Zhang, C.; Zhang, N. Coordinated operation and control of combined electricity and natural gas systems with thermal storage. Energies 2017, 10, 917. [Google Scholar] [CrossRef]
Figure 1.
CCHP system configuration.

Figure 2.
Operation strategy of the CCHP system in normal operation mode.

Figure 3.
Operation strategy of the CCHP system in event time.

Figure 4.
Rescheduling of the CCHP system with an event time.

Figure 5.
Load profiles and output power of RDG in each building during a weekday.
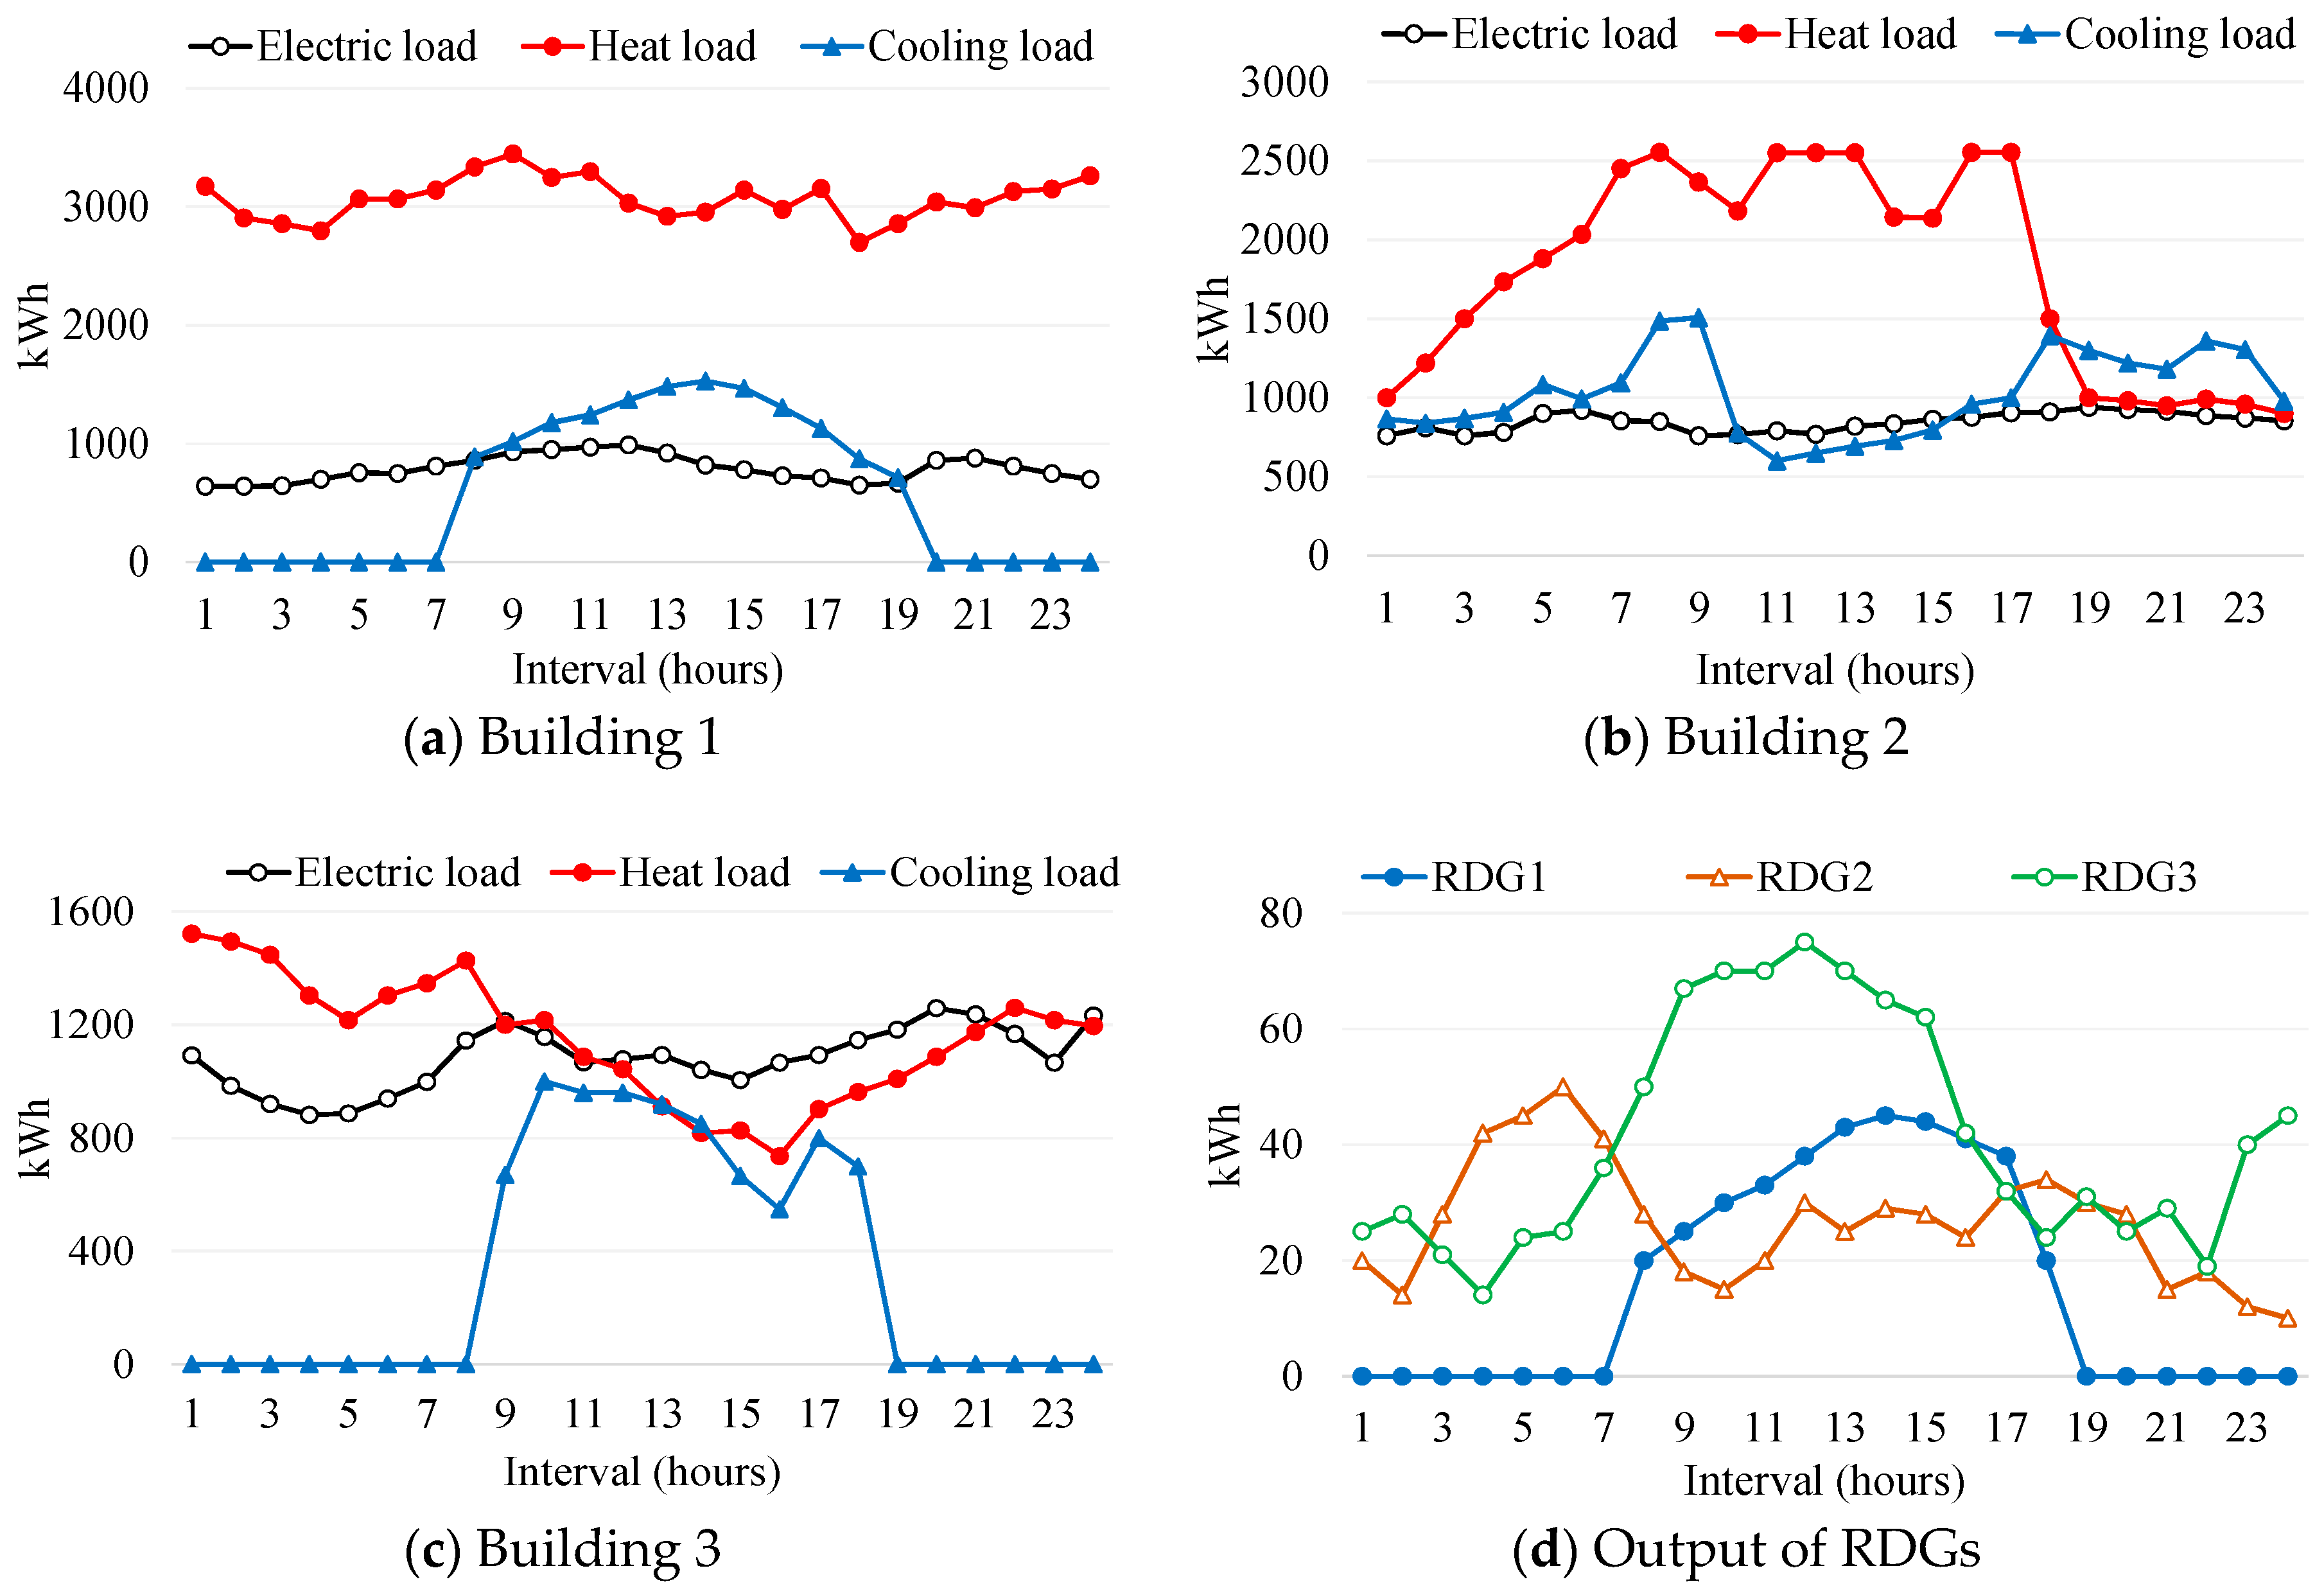
Figure 6.
Load profiles and output power of RDG in each building during a weekend day.

Figure 7.
Information of the surplus/shortage energies in each building during a weekday.

Figure 8.
Operation of all components in the external system during a weekday.

Figure 9.
Adjustable power and energy trading in buildings during a weekday.

Figure 10.
Rescheduling for the event case at interval 6 during a weekday.

Figure 11.
Rescheduling for the event case at interval 13 during a weekday.

Figure 12.
Rescheduling for the event case at interval 20 during a weekday.

Figure 13.
Sensitivity analysis of different values of parameters on saved cost during a weekday.


Table 1.
Parameter of CHPs and ECHP.
| Parameters | CHP1 | CHP2 | CH3 | ECHP |
|---|---|---|---|---|
| Min. (kWh) | 0 | 0 | 0 | 0 |
| Max. (kWh) | 1000 | 1000 | 1000 | 850 |
| Operation cost (won/kWh) | 95 | 100 | 80 | 70 |
| Start-up cost (won) | 200 | 200 | 200 | 300 |
| Shut-down cost (won) | 200 | 200 | 200 | 300 |
| Ratio | 3.5 | 1 | 1.8 | 3 |
Table 2.
Parameter of BESSs and HPL system.
| Parameters | BESS1 | BESS2 | BESS3 | HPL |
|---|---|---|---|---|
| Min. (kWh) | 0 | 0 | 0 | 2000 |
| Max. (kWh) | 200 | 250 | 300 | 50,000 |
| Initial (kWh) | 50 | 100 | 100 | 10,000 |
| C-Loss (%) | 5 | 5 | 5 | 5 |
| D-Loss (%) | 5 | 5 | 5 | 5 |
Table 3.
Saved cost with the proposed operation strategy.
| Saved Cost | Weekday | Weekend Day | ||
|---|---|---|---|---|
| KRW | % | KRW | % | |
| Method | ||||
| Without adjustable power | 0 | 0 | 0 | 0 |
| With adjustable power | 417,655 | 6.38% | 330,572 | 4.79% |
© 2018 by the authors. Licensee MDPI, Basel, Switzerland. This article is an open access article distributed under the terms and conditions of the Creative Commons Attribution (CC BY) license (http://creativecommons.org/licenses/by/4.0/).
Share and Cite
MDPI and ACS Style
Bui, V.-H.; Hussain, A.; Kim, H.-M.; Im, Y.-H. Optimal Energy Management of Building Microgrid Networks in Islanded Mode Considering Adjustable Power and Component Outages. Energies 2018, 11, 2351. https://doi.org/10.3390/en11092351
AMA Style
Bui V-H, Hussain A, Kim H-M, Im Y-H. Optimal Energy Management of Building Microgrid Networks in Islanded Mode Considering Adjustable Power and Component Outages. Energies. 2018; 11(9):2351. https://doi.org/10.3390/en11092351
Chicago/Turabian StyleBui, Van-Hai, Akhtar Hussain, Hak-Man Kim, and Yong-Hoon Im. 2018. "Optimal Energy Management of Building Microgrid Networks in Islanded Mode Considering Adjustable Power and Component Outages" Energies 11, no. 9: 2351. https://doi.org/10.3390/en11092351
Note that from the first issue of 2016, this journal uses article numbers instead of page numbers. See further details here.