Theoretical Modeling of Vertical-Axis Wind Turbine Wakes


Department of Engineering, Aarhus University, 8000 Aarhus C, Denmark
Energies 2019, 12(1), 10; https://doi.org/10.3390/en12010010
Submission received: 26 November 2018
/
Revised: 14 December 2018
/
Accepted: 17 December 2018
/
Published: 21 December 2018
Abstract
:In this work, two different theoretical models for predicting the wind velocity downwind of an H-rotor vertical-axis wind turbine are presented. The first model uses mass conservation together with the momentum theory and assumes a top-hat distribution for the wind velocity deficit. The second model considers a two-dimensional Gaussian shape for the velocity defect and satisfies mass continuity and the momentum balance. Both approaches are consistent with the existing and widely-used theoretical wake models for horizontal-axis wind turbines and, thus, can be implemented in the current numerical codes utilized for optimization and real-time applications. To assess and compare the two proposed models, we use large eddy simulation as well as field measurement data of vertical-axis wind turbine wakes. The results show that, although both models are generally capable of predicting the velocity defect, the prediction from the Gaussian-based wake model is more accurate compared to the top-hat counterpart. This is mainly related to the consistency of the assumptions used in the Gaussian-based wake model with the physics of the turbulent wake development downwind of the turbine.
1. Introduction
Vertical-axis wind turbines (VAWTs) are a type of wind turbines that rotate around an axis perpendicular to the incoming flow. The two main advantages of these family of wind turbines are associated with harvesting wind from any direction, and the possibility of mounting the power generation system close to the land surface which reduces the operation and maintenance costs [1]. Also, since the swept area of the VAWTs can increase irrespective of their footprints, they have the potential to provide higher power densities compared to the traditional horizontal-axis wind turbines (HAWTs) [2]. Besides the aforementioned benefits associated with the VAWTs, recent studies show that there is a potential to enhance the performance of the existing wind farms (or optimizing the layout of new wind farms) by deploying wind turbines with different types and combining horizontal-axis and vertical-axis wind turbines [3,4,5].
Much work, including field-scale measurements [6,7,8,9], laboratory experiments [10,11,12,13,14,15,16,17], and numerical simulations [18,19,20,21,22,23,24,25] has been done recently to study the aerodynamics of VAWTs. In the following, a brief review of the most recent studies related to fluid mechanics of VAWTs is provided. Kinzel et al. [7] analyzed the wake flow within an array of real-scale VAWTs. By quantifying the mean and turbulent kinetic energy fluxes, they found a high planform kinetic energy flux that promotes the recovery of the wake. Li et al. [9] investigated the power performance and wake properties of a full-scale straight-bladed wind turbine. They showed that the recovery process in the wake region is asymmetric. Battisti et al. [10] conducted wind tunnel experiments to study the wake behind a VAWT. They showed that the wake appears to be asymmetric due to the rotation of the blades. Posa et al. [13] studied the wake structure of an isolated wind turbine using both particle image velocimetry (PIV) and numerical simulation. They found that the momentum deficit is deflected toward the retreating blade region. Araya et al. [15] investigated the wake of the turbines with different blade numbers using PIV. They observed that the far-wake region of the VAWT exhibits features that are quantitatively similar to those of a circular cylinder with the same aspect ratio. Rolin and Porté-Agel [16] employed PIV to examine the VAWT wakes in a boundary-layer wind tunnel. They found that the formation of two counter-rotating vortex pairs behind the turbine highly contributes to the turbulent momentum flux into the wake. Kadum et al. [17] carried out wind tunnel experiments to study the near wake of a model VAWT using PIV. They also highlighted the asymmetry behavior of both first and second order moments of the wake downstream. Regarding the numerical simulations, Shamsoddin and Porté-Agel [18] used large eddy simulation (LES), for the first time, to simulate the wake downwind of the VAWTs. They showed that LES coupled with an actuator-line model can yield accurate predictions of the mean and higher-order statistics in the wake. Lam and Peng [20] used a blade-resolving numerical technique to study the near and far-wake regions of a straight-bladed VAWT. They showed that the asymmetry of the wake increases as the wake is advected downstream. Hezaveh et al. [21] conducted LES to study the effect of turbine solidity, height-to-diameter aspect ratio and tip-speed ratio on the wake flow downwind of an isolated wind turbine. Abkar and Dabiri [22] used LES to explore the wake over the VAWTs and found that the wake has self-similar properties after some distance downstream. Abkar [23] investigated the role of subgrid-scale models in LES on the aerodynamic load and on the recovery of the wake under uniform inflow conditions. Rezaeiha et al. [24] studied numerically the impact of operational parameters including the Reynolds number, tip-speed ratio, and turbulence intensity on the performance of the turbine as well as the wake structure downstream. They found that the high turbulence intensity in the incoming flow deteriorates the optimal operation of wind turbines in the dynamic stall condition. Mendoza et al. [25] simulated the near-wake flow of a VAWT using an actuator-line technique. They showed that the actuator-line model is able to characterize the main features of the wake flow downwind of the turbine. All the above-mentioned studies have provided valuable insights into the interaction between the incoming flow and the turbine including wake flow characteristics, aerodynamic loads on the blades and structural fatigue due to dynamic stall and blade-wake interactions.
Besides the computational and experimental tools, developing reduced-order models to predict the aerodynamics of VAWTs is of great importance for the wind energy community. Among the existing theoretical tools for VAWTs, one can highlight the steamtube model [26,27], the vortex model [28], and the leaky-Rankine body model [2]. The first two approaches were mainly focused on the aerodynamic load prediction and the flow features in the near-wake region. The later one, which is a two-dimensional potential flow model, was mainly utilized for the array performance prediction [8]. However, there is a lack of improved low-order models to predict the spatial distribution of the mean flow in the far-wake region of VAWTs in the real environment. Hence, developing reliable theoretical models with low computational complexity that can be used for power harvesting optimization and operational purposes is extremely useful and is the focus of this study.
This work aims to propose a theoretical framework for prediction of the mean wake flow behind an H-rotor wind turbine. Section 2 describes the derivation of the theoretical models. In Section 3, the two proposed wake models are examined and compared using the LES and field measurement data. Concluding remarks are provided in Section 4.
2. Theoretical Wake Modeling
In this section, a theoretical framework is proposed in order to predict the wind velocity field downstream of an H-rotor wind turbine with blade span of H and rotor diameter of D. Two sets of wake models with different assumptions for the velocity defect distribution are systematically derived and validated. In the following, the description of both models is provided.
2.1. Top-Hat Wake Model
In this approach, it is assumed that the wake downwind of the turbine has a rectangular shape with dimensions of and which are expanded linearly as the wake is transported downstream as
where the wake expands in the wall-normal direction at the rate of and in the spanwise direction at the rate of . Note that considering the linear growth for the wake in turbulent free stream is similar to the one first used by Jensen [29] and later by many other researchers for HAWTs (see the review of Stevens and Meneveau [30]). By applying mass continuity and considering a top-hat shape for the velocity deficit, one can write [31]
where is the air density, and are the upstream velocity and the velocity in the wake in the streamwise direction, respectively. is the wake area and is the turbine projected area. shows the velocity immediately downwind of the turbine and is related to the upstream velocity following
where a is the induction factor. Substituting (1) and (3) in (2), one can obtain the following equation for the normalized velocity defect,
Note that the induction factor in (4) can be estimated using the one-dimensional momentum theory [32] as . Here, is the thrust coefficient computed based on the projected area of the turbine as , where is the total force acting on the rotor in the mean wind direction. Similar to Jensen [29], and for the sake of simplicity, the same value can be adopted for the rate of the wake expansion in both wall-normal and spanwise directions, i.e., . It should be noted that, if the turbine has a circular projected area with diameter D, the above mentioned equations lead to the well-known Jensen model proposed for HAWT wakes.
2.2. Gaussian Wake Model
Consistent with the classical theories of shear flow (see e.g., Pope [33]), Abkar and Dabiri [22] recently showed that the velocity deficit in the far wake of a VAWT has self-similar properties following a normal distribution. Using this important finding, and by applying mass continuity and momentum balance (as similarly used in Bastankhah and Porté-Agel [31] for HAWTs), they derived the following equation for the maximum velocity defect downwind of the turbine,
where the standard deviations of the velocity defect distribution in the wall-normal and spanwise directions are denoted by and , respectively. By considering a two-dimensional Gaussian shape for the wake, it is straightforward to describe the velocity deficit as
Note that assuming an elliptical shape for the wake allows the model to take into account the effect of turbine aspect ratio. As previously shown [22,31,34,35,36,37,38,39,40], and are varying quasi-linearly with downwind distance in turbulent inflow as
where the wake expansion rates in the wall-normal and spanwise directions are represented by and , respectively, and the non-dimensional parameter , which characterize the standard deviation of the wake at the rotor, is defined as , where [31]. Here, for the sake of simplicity, it can be assumed that the wake expansion rates are similar in the wall-normal and spanwise directions, i.e., . It is worth mentioning that, for a wind turbine with a circular projected area of diameter D, the aforementioned equations lead to the formula introduced by Bastankhah and Porté-Agel [31] for HAWT wakes.
Note that, in the wake models proposed in this study, the slight deflection of the wake in the spanwise directions, caused by the blade rotation, is not taken into account. This is a valid approximation especially at high tip-speed ratios in which the spanwise wake displacement is gradually disappeared [41]. Our future research aims at quantifying the spanwise wake deflection at different tip-speed ratios and different turbine solidities and incorporating that effect in the proposed wake models.
3. Case Descriptions and the Results
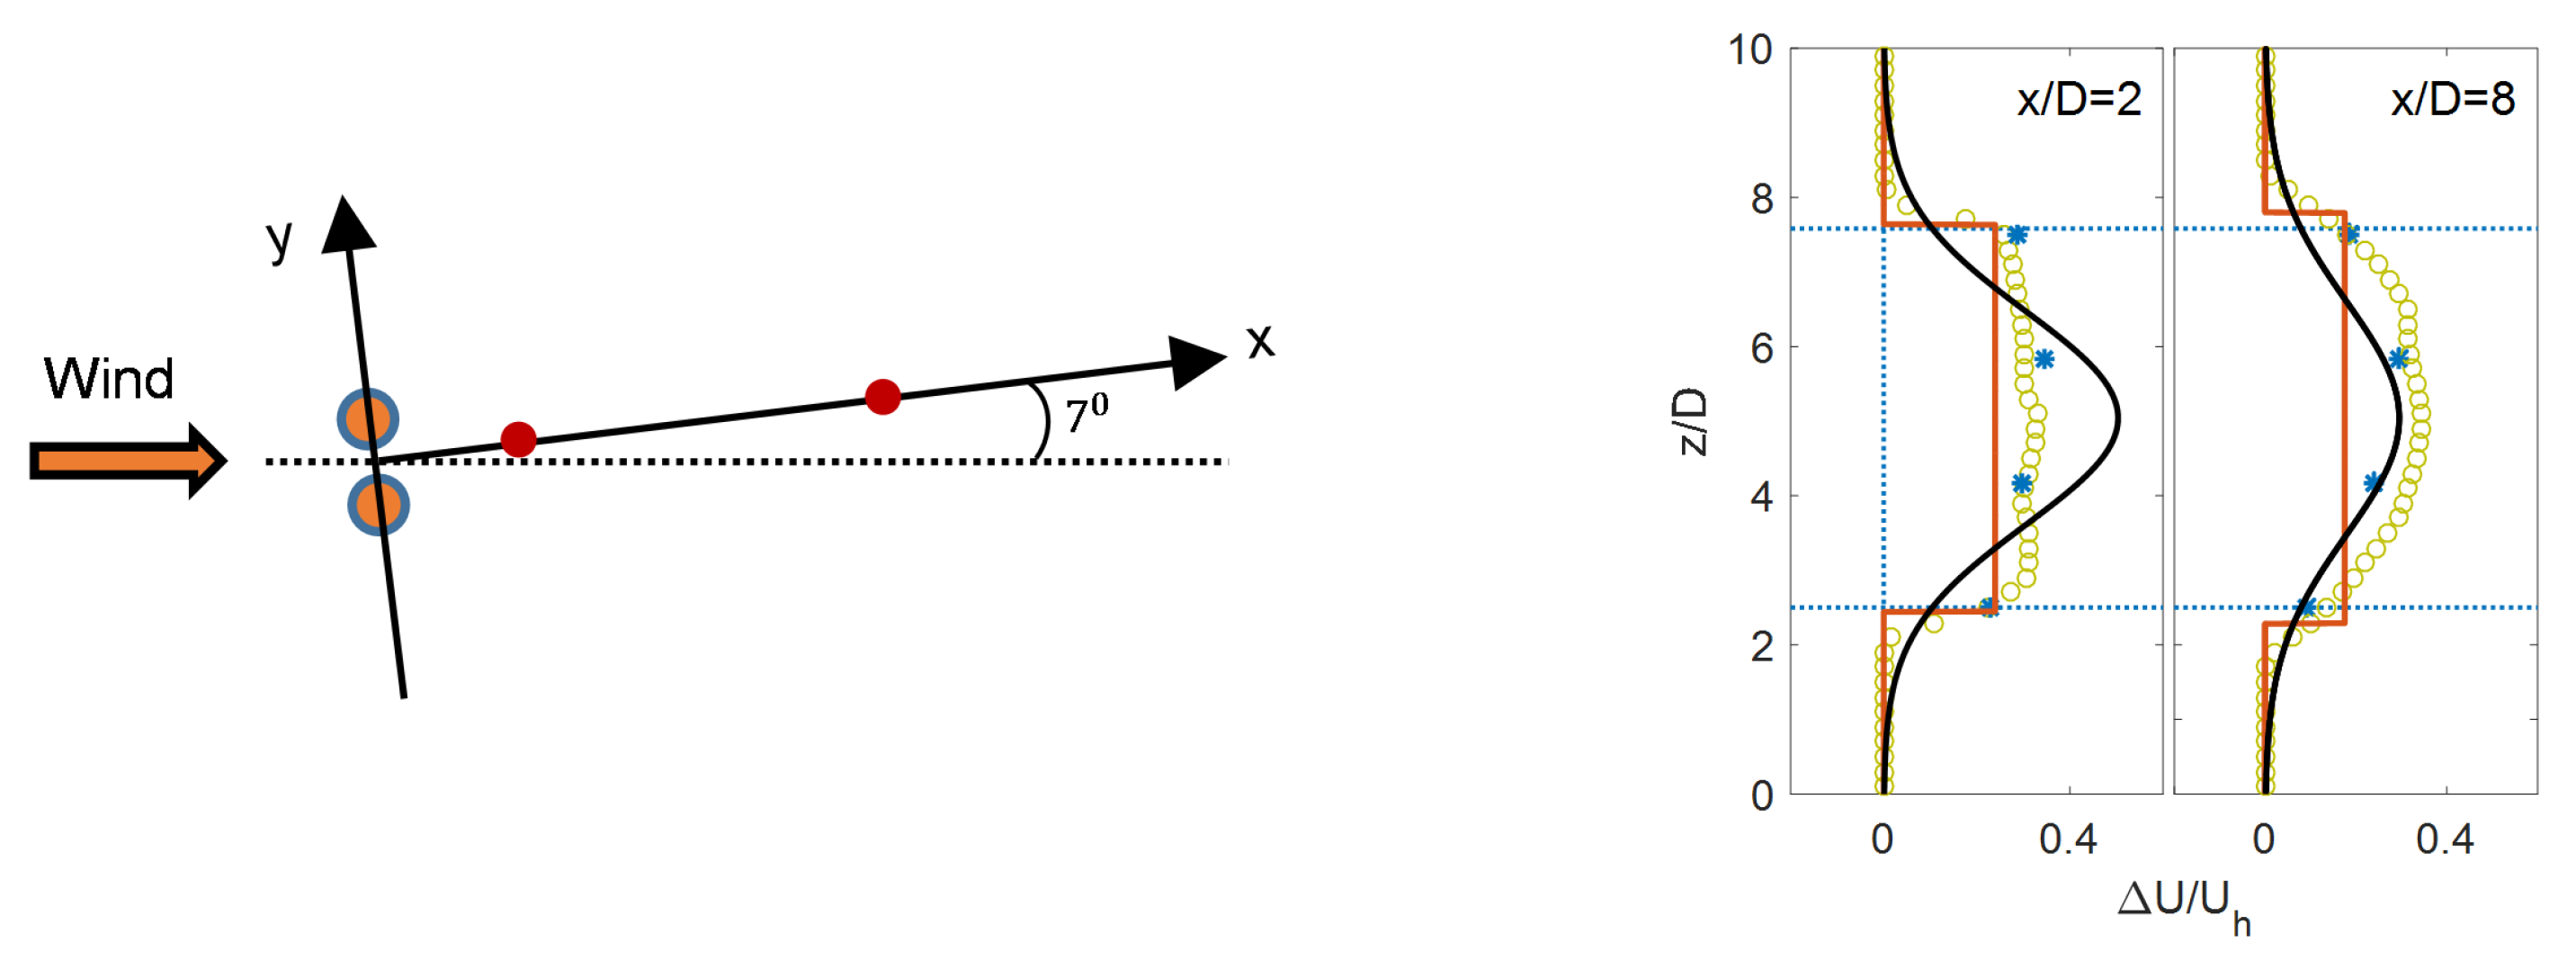
The two proposed wake models are tested and compared using different LES and field measurement data summarized in Table 1. Cases (1–3) represent the actuator-line based LES of H-rotor wind turbine wakes in the turbulent boundary-layer flow [22,23]. Case (4) corresponds to the LES study conducted by Shamsoddin and Porté-Agel [19] in which the wake behind a 1MW wind turbine was simulated. In Case (5), performed by Hezaveh et al. [42], LES was employed for wake-flow simulations and the results were validated against the field measurement data collected by Kinzel et al. [43] for two neighboring wind turbines separated by 1.6 rotor diameters (a schematic is shown in Figure 6). All the wind turbines considered in the above-mentioned studies consist of three straight blades. The key characteristics of the wind turbines and the incoming flows are provided in Table 1. In this table, is the hub (or equator) height of the turbine, D is the rotor diameter, H is the blade span, is the tip-speed ratio (the ratio between the speed of the blades and the speed of the incoming flow at the equator level), c is the blade chord length, is the thrust coefficient computed based on the projected area of the turbine , is the aspect ratio of the turbine, is the mean wind speed at the turbine equator, and is the turbulence level at the same height. Note that for Case (5), the thrust coefficient, the hub-height velocity and the turbulence level are estimated based on the information provided in the simulation setup.
As stated before, it would be more convenient and practical to specify only one input parameter (i.e., for the top-hat and for the Gaussian-type wake models) to determine the wind velocity downstream of the turbine. Here, the wake expansion ratios in the top-hat and Gaussian-type wake models are estimated from the following expressions suggested for the wake development in turbulent regimes without any further tuning: [44] and [39].
Figure 1 illustrates the spatial distribution of the time-averaged velocity in the streamwise direction and in the central vertical and lateral planes, obtained from the LES, for Cases (1–3). It can be visually acknowledged that the wake behind the turbine is expanded and, thus, recovered with downstream distance due to the entertainment of the faster moving air into the wake. As expected, the wake is stronger for the case with a higher tip-speed ratio associated with a higher thrust coefficient. Also, it can be observed that the larger cross-sectional area in Case (3) leads to a higher momentum extraction from the incoming wind and, consequently, a larger wake region downwind of the turbine.
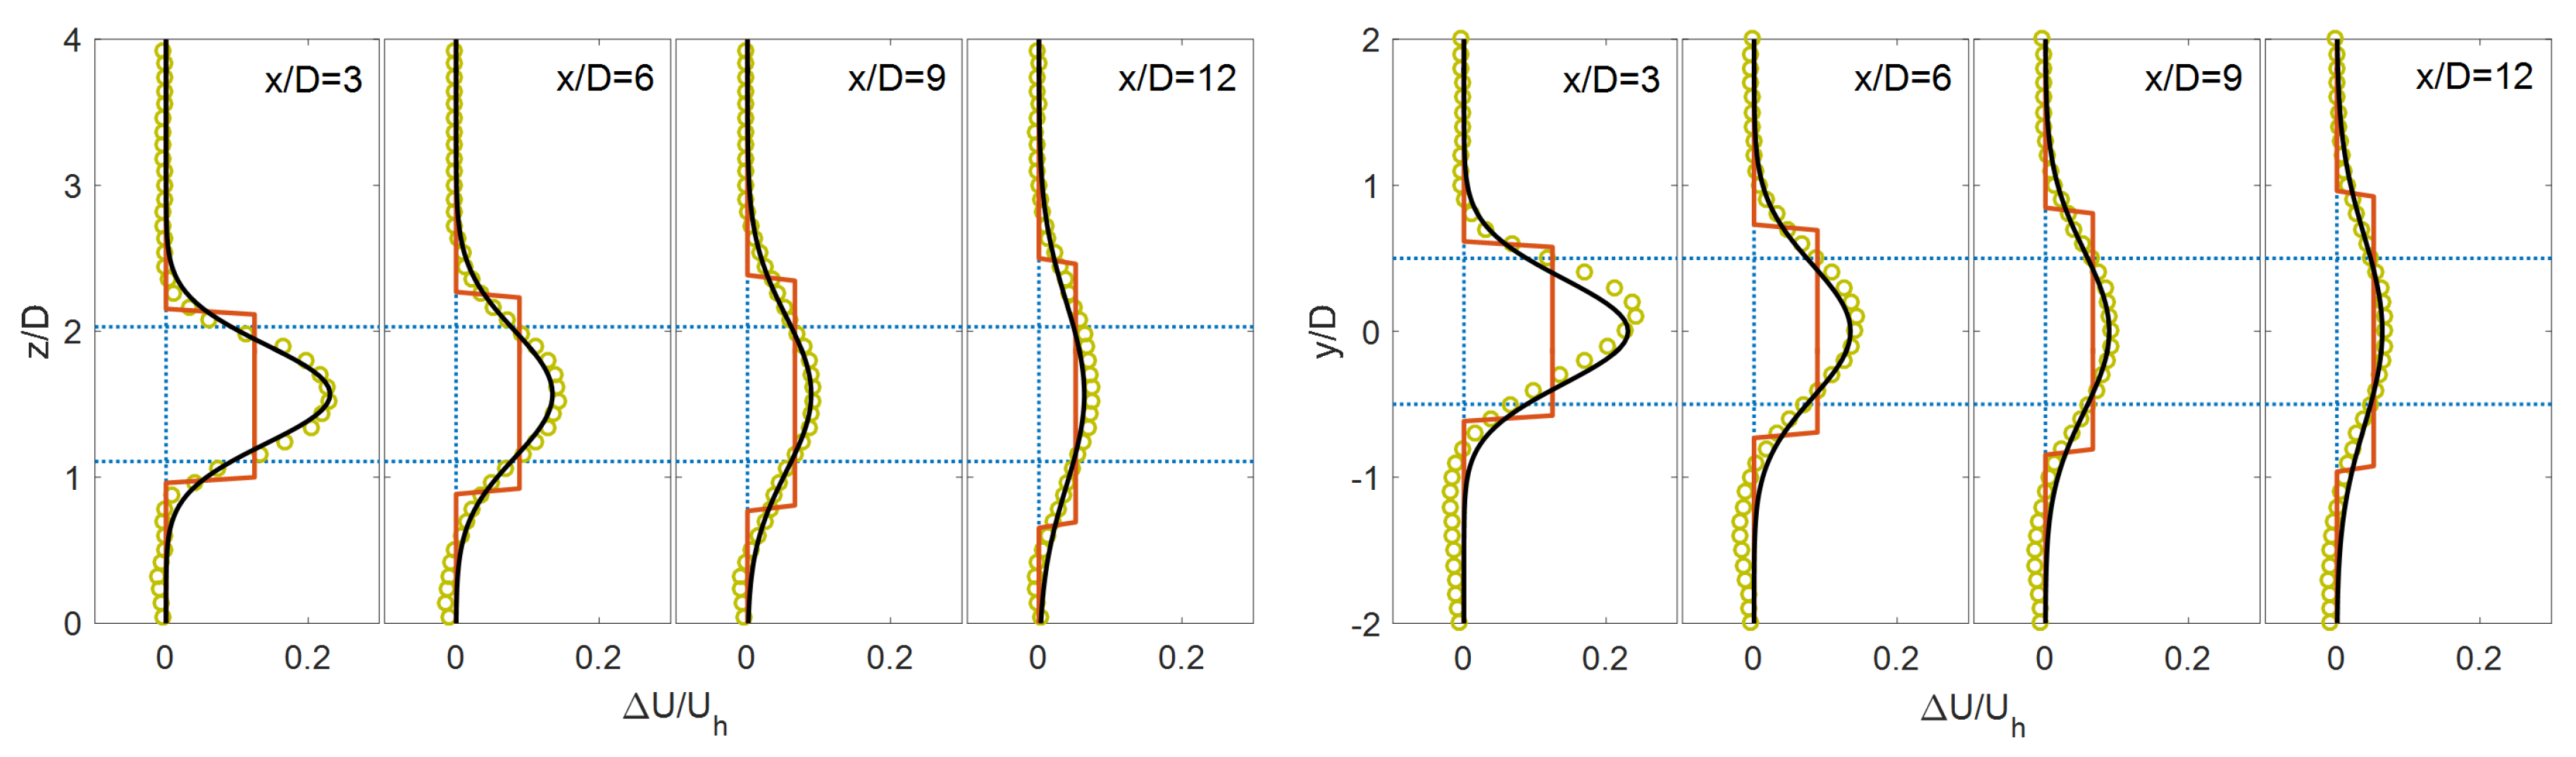
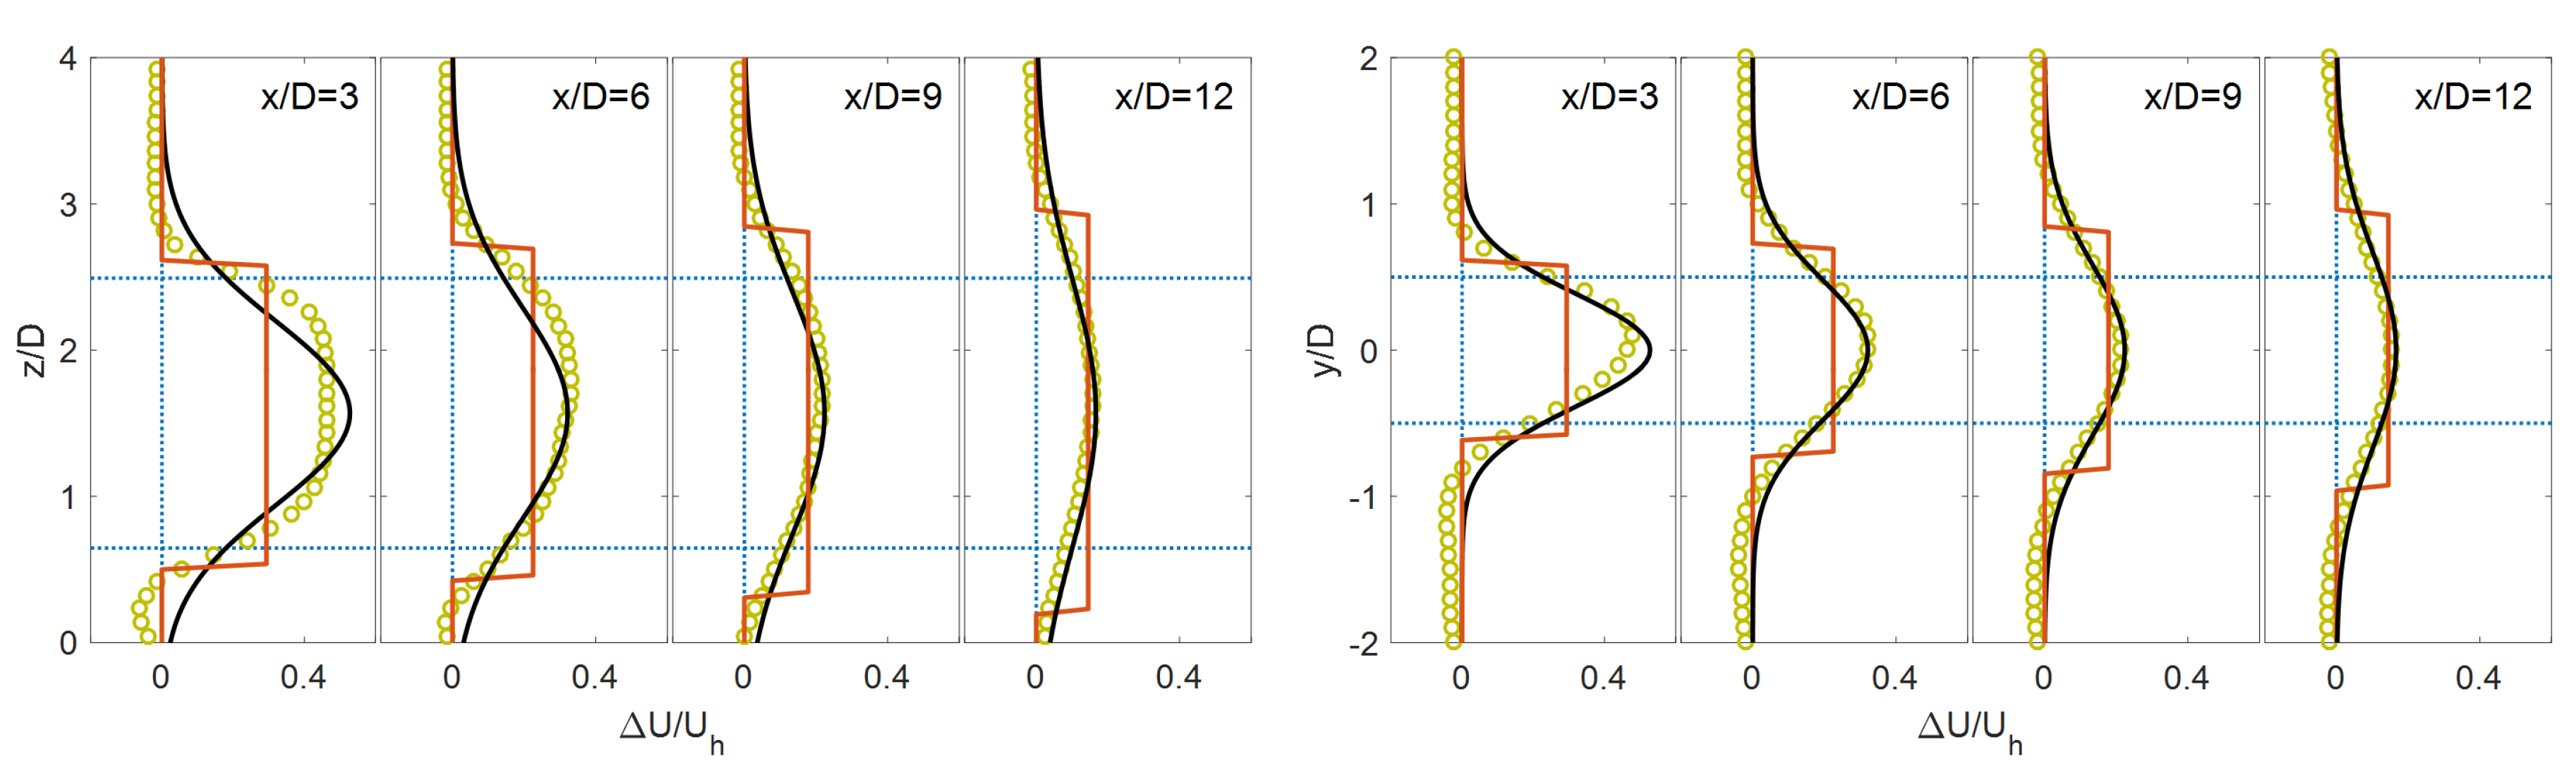
Figure 2, Figure 3, Figure 4, Figure 5 and Figure 6 present a detailed comparison between the theoretical wake models and the available data given in Table 1. As can be seen, both models are capable of predicting the recovery and the expansion of the wake with downwind distance with relatively good accuracy. Regarding the top-hat model, although this approach is not able to capture the spatial distribution of the wake correctly, it is still beneficial and useful due to its simplicity and its consistency with the widely-used Jensen model for HAWT wakes. The comparison also reveals that the Gaussian-based wake model is more accurate compared to the top-hat model in predicting the wake velocity defect. This is mainly related to the consistency of the Gaussian wake model with the physics of the turbulent wake development downwind of the turbine. Note that, for the cases with higher aspect ratios, shown in Figure 4, Figure 5 and Figure 6, a larger discrepancy between the Gaussian-based wake model and the simulation data is observed in the vertical direction and in the near wake. The reason behind that is, due to the higher aspect ratio and, consequently, the higher momentum extraction, the velocity defect in the vertical direction does not exhibit a full Gaussian distribution in the regions just behind the turbine [36]. In other words, the Gaussian-based wake model yields more accurate results in the far-wake region.
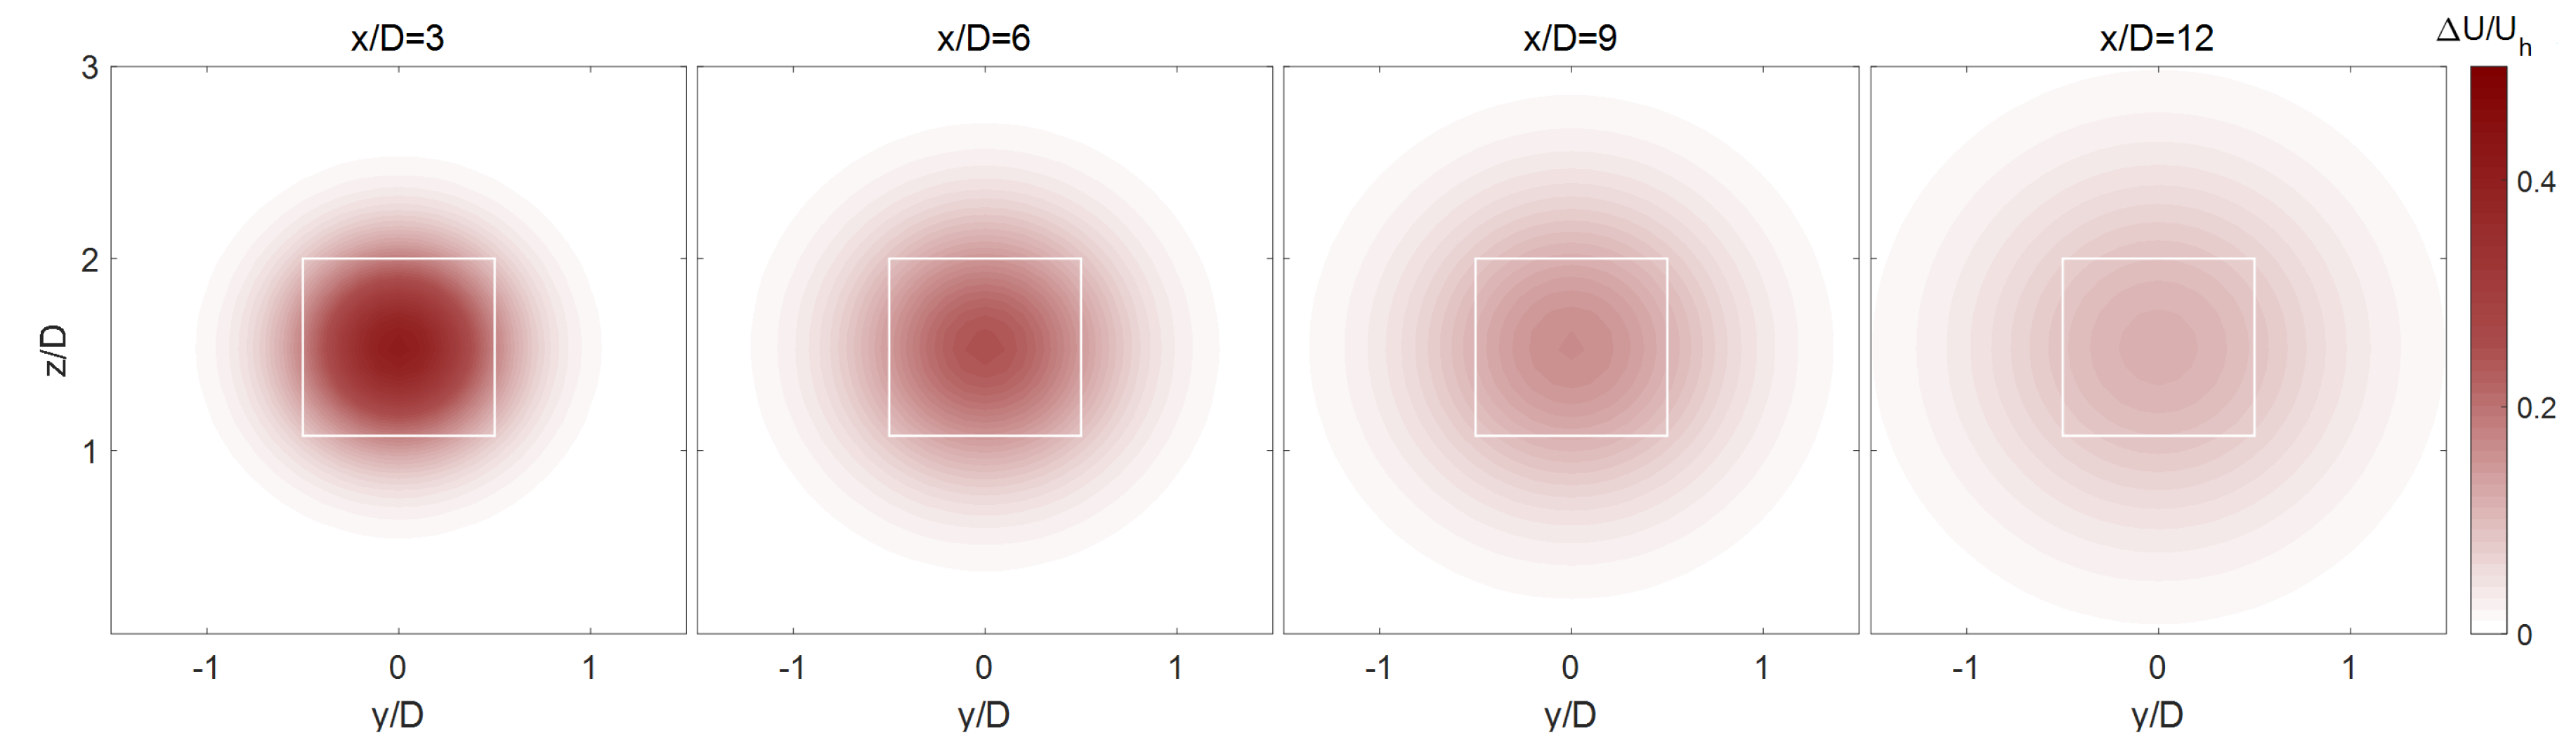
Figure 7, Figure 8 and Figure 9 show the contour plots of the velocity deficit field obtained from the LES and the proposed theoretical wake models in the cross-sectional planes at different locations downstream for Case (1). The figures confirm a better agreement between the Gaussian-based wake model and the simulation data. Specifically, it can be clearly observed that only the Gaussian wake model is successful in capturing the spatial distribution of the wake at different downwind distance.
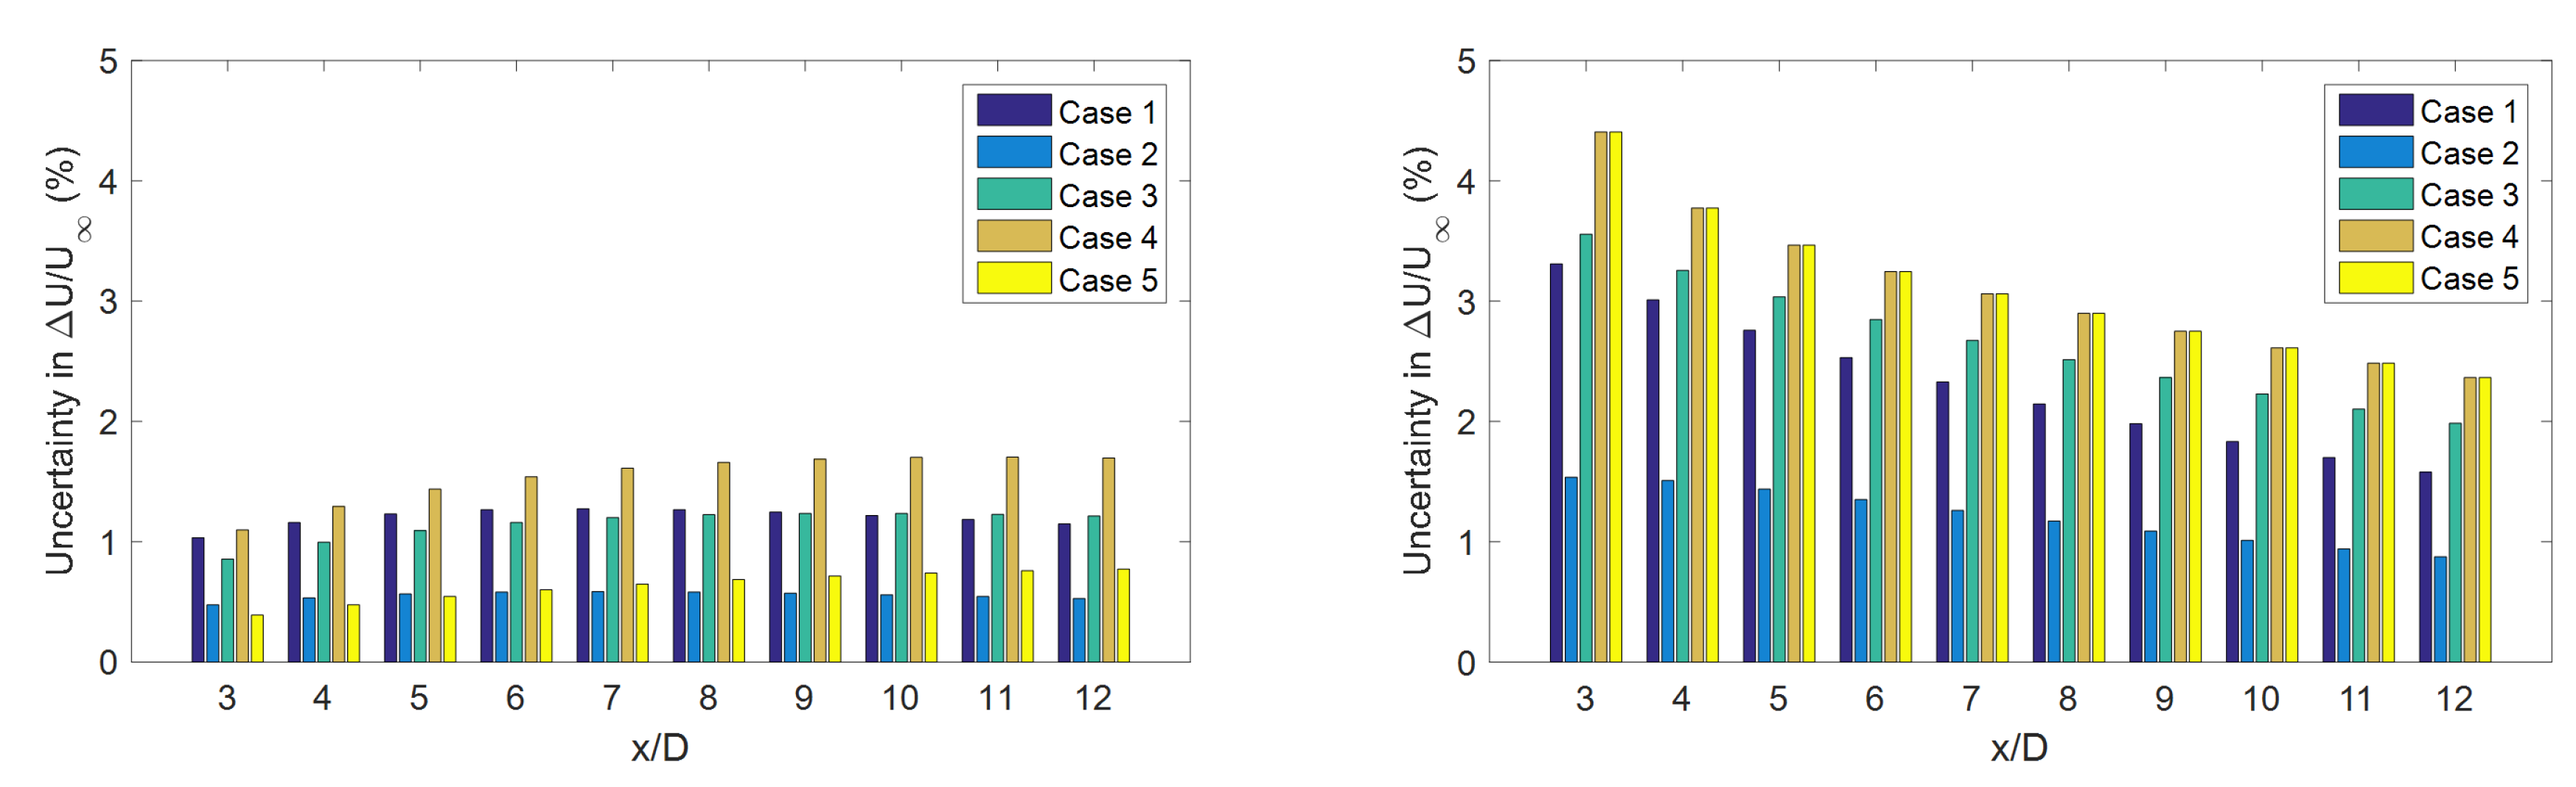
As mentioned before, in this study, the model coefficients (i.e., and ) are not tuned, and they are obtained from the available expressions reported in the literature. However, it would be useful to quantify the uncertainty in the wind velocity prediction due to the uncertainty in those parameters. Figure 10 addresses this issue and shows the uncertainty in prediction of the normalized velocity deficit as a result of 10% uncertainty in the wake expansion rates. As can be seen, 10% uncertainty in the wake growth rates leads to an uncertainty up to 4.4% in the wind velocity prediction, and that happens close to the turbines and is corresponding to the Gaussian wake model. Also, it can be understood from this figure that the sensitivity of the top-hat wake model to the model coefficient is less than the Gaussian counterpart.
4. Summary and Conclusions
Developing a theoretical framework for predicting the wind velocity field downwind of an H-rotor VAWT is the main emphasis of this study. In this regard, two types of wake models, based on different assumptions for the velocity deficit distribution, are systematically derived and validated. Both models are compatible with the existing wake models proposed for HAWTs [29,31] and, hence, can be implemented in the available numerical codes used for optimization and operational purposes [45,46]. The first model utilizes the mass conservation together with the one-dimensional momentum theory and considers a top-hat shape for the wake velocity defect. The second model, in which the mass and momentum are conserved, assumes that the velocity defect has an elliptical Gaussian shape. We examined both proposed models using the LES and field measurement data of the H-rotor wind turbine wakes, and found that both models are generally capable of predicting the mean wake flow downstream. However, the Gaussian wake model provides a more accurate prediction for the wind velocity compared to the top-hat counterpart. This is mainly related to the better consistency between the Gaussian-type wake model and the physics of the turbulent wake development downwind of the turbine. Note that the proposed models can be utilized in the near future when VAWTs are deployed in arrays and their interactions have to be accounted for.
Funding
The APC is provided by the Department of Engineering, Mechanical Engineering Section, at Aarhus University.
Acknowledgments
This work benefited from comments by three anonymous reviewers.
Conflicts of Interest
The author declares no conflict of interest.
References
- Paraschivoiu, I. Wind Turbine Design—With Emphasis on Darrieus Concept; Polytechnic International Press: Montreal, QC, Canada, 2002. [Google Scholar]
- Araya, D.B.; Craig, A.E.; Kinzel, M.; Dabiri, J.O. Low-order modeling of wind farm aerodynamics using leaky Rankine bodies. J. Renew. Sustain. Energy 2014, 6, 063118. [Google Scholar] [CrossRef] [Green Version]
- Feng, J.; Shen, W.Z. Design optimization of offshore wind farms with multiple types of wind turbines. Appl. Energy 2017, 205, 1283–1297. [Google Scholar] [CrossRef]
- Xie, S.; Archer, C.L.; Ghaisas, N.; Meneveau, C. Benefits of collocating vertical-axis and horizontal-axis wind turbines in large wind farms. Wind Energy 2017, 20, 45–62. [Google Scholar] [CrossRef]
- Govind, B. Increasing the operational capability of a horizontal axis wind turbine by its integration with a vertical axis wind turbine. Appl. Energy 2017, 199, 479–494. [Google Scholar] [CrossRef]
- Dabiri, J.O. Potential order-of-magnitude enhancement of wind farm power density via counter-rotating vertical-axis wind turbine arrays. J. Renew. Sustain. Energy 2011, 3, 043104. [Google Scholar] [CrossRef] [Green Version]
- Kinzel, M.; Mulligan, Q.; Dabiri, J.O. Energy exchange in an array of vertical-axis wind turbines. J. Turbul. 2012, 13, 1–13. [Google Scholar] [CrossRef]
- Brownstein, I.D.; Kinzel, M.; Dabiri, J.O. Performance enhancement of downstream vertical-axis wind turbines. J. Renew. Sustain. Energy 2016, 8, 053306. [Google Scholar] [CrossRef] [Green Version]
- Li, Q.; Maeda, T.; Kamada, Y.; Ogasawara, T.; Nakai, A.; Kasuya, T. Investigation of power performance and wake on a straight-bladed vertical axis wind turbine with field experiments. Energy 2017, 141, 1113–1123. [Google Scholar] [CrossRef]
- Battisti, L.; Zanne, L.; Dell’Anna, S.; Dossena, V.; Persico, G.; Paradiso, B. Aerodynamic Measurements on a Vertical Axis Wind Turbine in a Large Scale Wind Tunnel. J. Energy Resour. Technol. 2011, 133, 031201. [Google Scholar] [CrossRef]
- Bachant, P.; Wosnik, M. Characterising the near-wake of a cross-flow turbine. J. Turbul. 2015, 16, 392–410. [Google Scholar] [CrossRef]
- Araya, D.B.; Dabiri, J.O. A comparison of wake measurements in motor-driven and flow-driven turbine experiments. Exp. Fluids 2015, 56, 1–15. [Google Scholar] [CrossRef]
- Posa, A.; Parker, C.M.; Leftwich, M.C.; Balaras, E. Wake structure of a single vertical axis wind turbine. Int. J. Heat Fluid Flow 2016, 61, 75–84. [Google Scholar] [CrossRef]
- Ryan, K.J.; Coletti, F.; Elkins, C.J.; Dabiri, J.O.; Eaton, J.K. Three-dimensional flow field around and downstream of a subscale model rotating vertical axis wind turbine. Exp. Fluids 2016, 57, 38. [Google Scholar] [CrossRef]
- Araya, D.B.; Colonius, T.; Dabiri, J.O. Transition to bluff-body dynamics in the wake of vertical-axis wind turbines. J. Fluid Mech. 2017, 813, 346–381. [Google Scholar] [CrossRef]
- Rolin, V.; Porté-Agel, F. Experimental investigation of vertical-axis wind-turbine wakes in boundary layer flow. Renew. Energy 2018, 118, 1–13. [Google Scholar] [CrossRef]
- Kadum, H.; Friedman, S.; Camp, E.H.; Cal, R.B. Development and scaling of a vertical axis wind turbine wake. J. Wind Eng. Ind. Aerodyn. 2018, 174, 303–311. [Google Scholar] [CrossRef]
- Shamsoddin, S.; Porté-Agel, F. Large Eddy Simulation of Vertical Axis Wind Turbine Wakes. Energies 2014, 7, 890–912. [Google Scholar] [CrossRef] [Green Version]
- Shamsoddin, S.; Porté-Agel, F. A Large-Eddy Simulation Study of Vertical Axis Wind Turbine Wakes in the Atmospheric Boundary Layer. Energies 2016, 9, 366. [Google Scholar] [CrossRef]
- Lam, H.; Peng, H. Study of wake characteristics of a vertical axis wind turbine by two-and three-dimensional computational fluid dynamics simulations. Renew. Energy 2016, 90, 386–398. [Google Scholar] [CrossRef]
- Hezaveh, S.H.; Bou-Zeid, E.; Lohry, M.W.; Martinelli, L. Simulation and wake analysis of a single vertical axis wind turbine. Wind Energy 2017, 20, 713–730. [Google Scholar] [CrossRef]
- Abkar, M.; Dabiri, J.O. Self-similarity and flow characteristics of vertical-axis wind turbine wakes: An LES study. J. Turbul. 2017, 18, 373–389. [Google Scholar] [CrossRef]
- Abkar, M. Impact of Subgrid-Scale Modeling in Actuator-Line Based Large-Eddy Simulation of Vertical-Axis Wind Turbine Wakes. Atmosphere 2018, 9, 257. [Google Scholar] [CrossRef]
- Rezaeiha, A.; Montazeri, H.; Blocken, B. Characterization of aerodynamic performance of vertical axis wind turbines: Impact of operational parameters. Energy Convers. Manag. 2018, 169, 45–77. [Google Scholar] [CrossRef]
- Mendoza, V.; Bachant, P.; Ferreira, C.; Goude, A. Near-wake flow simulation of a vertical axis turbine using an actuator line model. Wind Energy 2018, 1–18. [Google Scholar] [CrossRef]
- Strickland, J.H. Darrieus Turbine: A Performance Prediction Model Using Multiple Streamtubes; Technical Report; Sandia Labs.: Albuquerque, NM, USA, 1975.
- Paraschivoiu, I. Double-multiple streamtube model for studying vertical-axis wind turbines. J. Propul. Power 1988, 4, 370–377. [Google Scholar] [CrossRef]
- Strickland, J.H.; Webster, B.; Nguyen, T. A vortex model of the Darrieus turbine: An analytical and experimental study. J. Fluids Eng. 1979, 101, 500–505. [Google Scholar] [CrossRef]
- Jensen, N. A Note on Wind Turbine Interaction; Technical Report Ris-M-2411; Roskilde National Laboratory: Roskilde, Denmark, 1983.
- Stevens, R.J.; Meneveau, C. Flow structure and turbulence in wind farms. Ann. Rev. Fluid Mech. 2017, 49, 311–339. [Google Scholar] [CrossRef]
- Bastankhah, M.; Porté-Agel, F. A new analytical model for wind-turbine wakes. Renew. Energy 2014, 70, 116–123. [Google Scholar] [CrossRef]
- Manwell, J.F.; McGowan, J.G.; Rogers, A.L. Wind Energy Explained: Theory, Design and Application; John Wiley & Sons: Hoboken, NJ, USA, 2010. [Google Scholar]
- Pope, S. Turbulent Flows; Cambridge University Press: Cambridge, UK, 2000. [Google Scholar]
- Xie, S.; Archer, C. Self-similarity and turbulence characteristics of wind turbine wakes via large-eddy simulation. Wind Energy 2015, 18, 1815–1838. [Google Scholar] [CrossRef]
- Abkar, M.; Porté-Agel, F. Influence of atmospheric stability on wind turbine wakes: A large-eddy simulation study. Phys. Fluids 2015, 27, 035104. [Google Scholar] [CrossRef]
- Bastankhah, M.; Porté-Agel, F. Experimental and theoretical study of wind turbine wakes in yawed conditions. J. Fluid Mech. 2016, 806, 506–541. [Google Scholar] [CrossRef]
- Abkar, M.; Porté-Agel, F. Influence of the Coriolis force on the structure and evolution of wind turbine wakes. Phys. Rev. Fluids 2016, 1, 063701. [Google Scholar] [CrossRef]
- Ishihara, T.; Qian, G.W. A new Gaussian-based analytical wake model for wind turbines considering ambient turbulence intensities and thrust coefficient effects. J. Wind Eng. Ind. Aerodyn. 2018, 177, 275–292. [Google Scholar] [CrossRef]
- Carbajo Fuertes, F.; Markfort, C.D.; Porté-Agel, F. Wind Turbine Wake Characterization with Nacelle-Mounted Wind Lidars for Analytical Wake Model Validation. Remote Sens. 2018, 10, 668. [Google Scholar] [CrossRef]
- Abkar, M.; Sørensen, J.; Porté-Agel, F. An Analytical Model for the Effect of Vertical Wind Veer on Wind Turbine Wakes. Energies 2018, 11, 1838. [Google Scholar] [CrossRef]
- Bergeles, G.; Michos, A.; Athanassiadis, N. Velocity vector and turbulence in the symmetry plane of a Darrieus wind generator. J. Wind Eng. Ind. Aerodyn. 1991, 37, 87–101. [Google Scholar] [CrossRef]
- Hezaveh, S.H.; Bou-Zeid, E.; Dabiri, J.; Kinzel, M.; Cortina, G.; Martinelli, L. Increasing the Power Production of Vertical-Axis Wind-Turbine Farms Using Synergistic Clustering. Bound.-Layer Meteorol. 2018, 169, 275–296. [Google Scholar] [CrossRef]
- Kinzel, M.; Araya, D.B.; Dabiri, J.O. Turbulence in vertical axis wind turbine canopies. Phys. Fluids 2015, 27, 115102. [Google Scholar] [CrossRef] [Green Version]
- Peña, A.; Réthoré, P.E.; van der Laan, M.P. On the application of the Jensen wake model using a turbulence-dependent wake decay coefficient: The Sexbierum case. Wind Energy 2016, 19, 763–776. [Google Scholar] [CrossRef]
- Meyers, J.; Meneveau, C. Optimal turbine spacing in fully developed wind farm boundary layers. Wind Energy 2012, 15, 305–317. [Google Scholar] [CrossRef]
- Iungo, G.; Santoni-Ortiz, C.; Abkar, M.; Porté-Agel, F.; Leonardi, S. Data-driven Reduced Order Model for prediction of wind turbine wakes. J. Phys. Conf. Ser. 2015, 625, 012009. [Google Scholar] [CrossRef] [Green Version]
Figure 1.
Time-averaged streamwise wind velocity, normalized with the hub-height speed, in the central vertical (left) and lateral planes (right). From top to the bottom: Case (1), Case (2) and Case (3). The turbines rotate counterclockwise.
Figure 1.
Time-averaged streamwise wind velocity, normalized with the hub-height speed, in the central vertical (left) and lateral planes (right). From top to the bottom: Case (1), Case (2) and Case (3). The turbines rotate counterclockwise.

Figure 2.
Normalized velocity defect profiles (), in wall-normal (left) and spanwise (right) directions, through the turbine center downstream for Case (1). LES data (open circle), top-hat model (solid red line), and Gaussian model (solid black line). The horizontal dotted lines denote the turbine extent.

Figure 3.
Same as Figure 2 but for Case (2).
Figure 3.
Same as Figure 2 but for Case (2).

Figure 4.
Same as Figure 2 but for Case (3).
Figure 4.
Same as Figure 2 but for Case (3).

Figure 5.
Same as Figure 2 but for Case (4). The LES data (open circle) was extracted from Shamsoddin and Porté-Agel [19].

Figure 6.
Schematic of the two turbines immersed in the flow (red circles are the measurement locations) (left), and wall-normal profiles of the normalized velocity defect (right) for Case (5). The LES (open circle) and field measurement (asterisk) data were extracted from Hezaveh et al. [42].
Figure 6.
Schematic of the two turbines immersed in the flow (red circles are the measurement locations) (left), and wall-normal profiles of the normalized velocity defect (right) for Case (5). The LES (open circle) and field measurement (asterisk) data were extracted from Hezaveh et al. [42].

Figure 7.
Contours of the normalized velocity defect in the cross-sectional planes downwind of the turbine for Case (1) obtained from the LES. The turbine location is represented with the white rectangle.
Figure 7.
Contours of the normalized velocity defect in the cross-sectional planes downwind of the turbine for Case (1) obtained from the LES. The turbine location is represented with the white rectangle.

Figure 8.
Same as Figure 7 but obtained from the top-hat wake model.
Figure 8.
Same as Figure 7 but obtained from the top-hat wake model.

Figure 9.
Same as Figure 7 but obtained from the Gaussian-type wake model.
Figure 9.
Same as Figure 7 but obtained from the Gaussian-type wake model.

Figure 10.
Uncertainty in the normalized velocity defect due to 10% change in the model coefficients in the top-hat (left) and in the Gaussian (right) wake models.
Figure 10.
Uncertainty in the normalized velocity defect due to 10% change in the model coefficients in the top-hat (left) and in the Gaussian (right) wake models.


Table 1.
Key characteristics of the wind turbines and the incoming wind.
| Cases | D (m) | H (m) | c (m) | (m/s) | |||||
|---|---|---|---|---|---|---|---|---|---|
| Case 1 | 40 | 26 | 24 | ||||||
| Case 2 | 40 | 26 | 24 | ||||||
| Case 3 | 40 | 26 | 48 | ||||||
| Case 4 | 100 | 50 | 100 | ||||||
| Case 5 | 6 |
© 2018 by the author. Licensee MDPI, Basel, Switzerland. This article is an open access article distributed under the terms and conditions of the Creative Commons Attribution (CC BY) license (http://creativecommons.org/licenses/by/4.0/).
Share and Cite
MDPI and ACS Style
Abkar, M. Theoretical Modeling of Vertical-Axis Wind Turbine Wakes. Energies 2019, 12, 10. https://doi.org/10.3390/en12010010
AMA Style
Abkar M. Theoretical Modeling of Vertical-Axis Wind Turbine Wakes. Energies. 2019; 12(1):10. https://doi.org/10.3390/en12010010
Chicago/Turabian StyleAbkar, Mahdi. 2019. "Theoretical Modeling of Vertical-Axis Wind Turbine Wakes" Energies 12, no. 1: 10. https://doi.org/10.3390/en12010010
Note that from the first issue of 2016, this journal uses article numbers instead of page numbers. See further details here.