Supporting the Smart Readiness Indicator—A Methodology to Integrate A Quantitative Assessment of the Load Shifting Potential of Smart Buildings


1
Department of Material Sciences and Process Engineering, Institute for Chemical and Energy Engineering, University of Natural Resources and Life Sciences, 1190 Vienna, Austria
2
Department of Landscape, Spatial and Infrastructure Sciences, Institute of Spatial Planning, Environmental Planning and Land Rearrangement, University of Natural Resources and Life Sciences, 1190 Vienna, Austria
*
Author to whom correspondence should be addressed.
Energies 2019, 12(10), 1955; https://doi.org/10.3390/en12101955
Submission received: 23 April 2019
/
Revised: 16 May 2019
/
Accepted: 17 May 2019
/
Published: 22 May 2019
(This article belongs to the Special Issue Energy Performance and Indoor Climate Analysis in Buildings)
Abstract
:With the third revision of the Energy Performance of Buildings Directive (EPBD) issued in July 2018, the assessment of buildings now has to include a Smart Readiness Indicator (SRI) to consider the fact that buildings must play an active role within the context of an intelligent energy system. In order to support the development of the SRI, this article describes a methodology for a simplified quantitative assessment of the load shifting potential of buildings. The aim of the methodology is to provide a numerical, model-based approach, which allows buildings to be categorized based on their energy storage capacity, load shifting potential and their subsequent interaction with the grid. A key aspect is the applicability within the Energy Performance Certificate (EPC) in order to provide an easy to use calculation, which is applied in addition to the already established energy efficiency, building services and renewable energy assessments. The developed methodology is being applied to theoretical use cases to validate the approach. The results show that a simplified model can provide an adequate framework for a quantitative assessment for the Smart Readiness Indicator.
1. Introduction
By 2050 the EU must reduce its greenhouse gas emissions to 80% below 1990-based levels [1]. Considering that the building sector currently contributes up to 40% to the overall emission levels, the European Commission is recognizing that energy efficiency in buildings can add significantly to this reduction. For 2030 a new binding energy efficiency target of 32.5% has been defined in a political agreement between the European Commission, the European Parliament and the European Council [2], which should subsequently trigger legislative measures and financial incentives on the respective national levels. Energy efficiency contributes in this context to the reduction of costs for consumers, reduction of the import dependency in Europe and redirecting investments towards smart and sustainable infrastructure [3]. This also highlights, that higher energy efficiency must be achieved by innovative measures without increasing the financial burden on the consumers.
Innovation plays one of the key roles to facilitate the transformation towards an energy efficient building stock in Europe. In order to boost clean energy innovation, the EU has defined several fundamental initiatives: The ‘Strategy on accelerating clean energy innovation’ [3], together with the ‘Accelerating clean energy in buildings’ initiative [4] define a comprehensive plan for the main policy levers. Thus in regard to energy, the focus of the Horizon 2020 funding—the core of the research and innovation pillar—is on the decarbonization of the EU building stock [5]. The funding schemes should ensure that industry and research are strongly working together towards innovative systems, products and business models to accelerate this transformation. Another key aspect to increase efficiency in the building sector is the legislative framework on a European level, which directly influences the national building energy performance standards. Understanding the economic, political and social drivers in reducing energy and greenhouse gas emission in the buildings industry are crucial in order to propose new policies related to climate change. Studies that outline the impact of energy policies contribute significantly to the adequate framing of future policies [6].
The related key European legislative framework documents are the Energy Efficiency Directive [7], the Renewable Energy Directive [8] and Energy Performance of Buildings Directive (EPBD) [9]. Each of these directives provides targets and framework conditions for the implementation into national regulations and standards. The EPBD sets out the conditions for the national and regional building regulations, which subsequently define the quality of the European building stock. Currently the EPBD states that an Energy Performance Certificate (EPC), which includes an assessment of the energy efficiency as well as the building services and renewable energy systems, has to be submitted to the local building authorities for approval. With the latest revision of the EPBD in July 2018 [10] the assessment now has to include a Smart Readiness Indicator (SRI) to take into account the capacity of the building to manage and optimize itself and to interact with occupants and the grid. A study, subsequently commissioned by the EC, consisting of an assessment methodology for the SRI has been issued as a guiding document for the member states. The provided methodology is focusing on a wide range of qualitative aspects in a rather complex matrix approach, covering a series of impact criteria, domains and domain services [11]. However the approach proposed in this study is highly qualitative. An expert judgment, with appraisals to be carried out by certified assessors, dominates the application of the methodology. Even though this approach addresses relevant aspects related to so-called Smart Buildings, it does not include a calculation of the actual load shifting potential or “grid friendliness” of a building, which is one of the key objectives of the SRI. Since an assessment of the building to adapt to user and grid cannot be solely based on a qualitative appraisal, the expert judgments should be complemented by a quantitative and replicable assessment.
Therefore in this article we propose to support the existing SRI approach with a methodology based on a quantitative approach to assess the load shifting potential of buildings. The aim of the proposed methodology is to provide a numerical, model-based approach, which allows buildings to be categorized based on their energy storage capacity, load shifting potential and their subsequent interaction with the grid. One of the key aspects of the proposed methodology is to provide an easy to use calculation within the EPC, which is applied in addition to the already established energy efficiency, building services and renewable energy assessments.
In the next sections the legislative and content related framework conditions related to the EPBD and SRI are outlined. This is followed by a description of state-of-the-art research in the context of demand response, load shifting and smart grid in relation to buildings. A separate sub-section is dedicated to the development of Smart Buildings. Subsequently Section 3 outlines the main principles behind the proposed methodology, followed by the results in Section 4, where the mathematical models are being tested on theoretical use cases in order to validate the approach. Finally, the discussion and conclusions deliver a review of the approach and provide an outlook on how this methodology might be implemented in the revisions of the national and regional building regulations the member states have to undertake following the latest update of the legally binding EPBD.
2. Background
In 2002 the European Parliament has released the first version of the EPBD in order to promote energy efficiency in buildings with the aim of fulfilling the climate targets as specified in the Kyoto protocol [9,12]. By adhering to the guidelines set out in the EPBD the member states acknowledge the fact, that within the EU, buildings are responsible for approximately 40% of energy consumption and 36% of CO2 emissions [2]. Stricter guidelines, including the commitment to Nearly Zero Energy Buildings (NZEBs) have been added in the 2010 revision of the EPBD [13], stipulating that all new buildings must be built to this standard as of 1st January 2021. The NZEBs characterize a significant opportunity to provide future-proof buildings with minimal energy consumption. Other aspects include the mandatory issuance of energy performance certificates in all advertisements and whenever a building is sold or rented. In addition, member states had to set cost-optimal levels for minimum energy performance requirements for new buildings and renovations and had to draw up a list of financial measures to improve the energy efficiency in buildings [13]. In regards to aspects relating to governments’ own building stock the member states must ensure that at least 3% of the total floor area of buildings owned and occupied by central government are renovated, that only highly efficient buildings are purchased by the governments and that long-term national building renovation strategies are drawn up to be included in their National Energy Efficiency Action Plans [2]. Judging the impact of this legislation, one can look at overall emission figures: Between 1990 and 2016, greenhouse gas emissions in the EU have been reduced by 22% [14]. In parts, this can also be attributed to the stricter efficiency guidelines for the European building stock.
In the third revision of the EPBD issued in July 2018 [10] further improvements have been made in order to accelerate the reduction of greenhouse gas emissions associated with the building sector. With the 2018 amendment, EU member states will have to establish stronger long-term renovation strategies with sound financial components, aiming at decarbonizing the national building stock by 2050. With around 40% of Europe’s housing stock dating pre-1960 [15], renovation becomes ever more important as climate targets are getting raised. Smart technologies will have to be promoted e.g., by adding conditions related to control engineering and building automation systems. Other measures include the increased support of e-mobility by adding requirements on respective infrastructure for buildings as well as aspects on ventilation and air quality to increase the health and well-being for the occupants [2,10]. Finally, one of the key new requirements includes a provision for the assessment of buildings with the definition of a Smart Readiness Indicator (SRI) to give justice to the fact, that buildings must play an active role within the context of an intelligent energy system.
2.1. Smart Readiness Indicator (SRI)
As the EPBD is providing the framework for the national building regulations, a key factor for including additional parameters in mandatory assessments is the applicability to a national or regional context and the usability within a formal assessment procedure. Based on the legislation, the SRI should ideally be a combination of a simple indicator whilst at the same time factoring in a series of highly complex aspects related to the management and interaction capability of the building with its occupants and the grid:
“…The smart readiness indicator should be used to measure the capacity of buildings to use information and communication technologies and electronic systems to adapt the operation of buildings to the needs of the occupants and the grid and to improve the energy efficiency and overall performance of buildings. The smart readiness indicator should raise awareness amongst building owners and occupants of the value behind building automation and electronic monitoring of technical building systems and should give confidence to occupants about the actual savings of those new enhanced-functionalities…”[10]
Even though there is no general definition of the term Smart Building within the revised EPBD the smartness of the building is defined by having the technical capability of (a) managing itself efficiently (b) being able to interact with and respond to its occupants (c) being able to actively and passively interact with the grid. This approach has been applied in the legislative document that the:
“…methodology shall rely on three key functionalities relating to the building and its technical building systems: (a) the ability to maintain energy performance and operation of the building through the adaptation of energy consumption for example through use of energy from renewable sources; (b) the ability to adapt its operation mode in response to the needs of the occupant while paying due attention to the availability of user-friendliness, maintaining healthy indoor climate conditions and the ability to report on energy use; and (c) the flexibility of a building’s overall electricity demand, including its ability to enable participation in active and passive as well as implicit and explicit demand response, in relation to the grid, for example through flexibility and load shifting capacities…”.[10]
In order to support the member states with a definition of the SRI, a technical study has been commissioned by the European Commission DG Energy. The aim of the study was to propose a methodological framework for the SRI and the smart services that the indicator builds on. The study also provided a first EU wide impact assessment of the newly developed indicator [11]. The proposed SRI-calculation methodology builds on a single score system that classifies the building’s smart readiness. The score is based on eight impact criteria: energy, flexibility for the grid, self-generation, comfort, convenience, wellbeing & health, maintenance & fault prediction and information to occupants. Each impact criterion is expressed as a percentage of the maximum score that can be achieved for the evaluated building. Each impact criterion is in turn the weighted average of 10 domain scores, which constitute of heating, cooling, domestic hot water, controlled ventilation, lighting, dynamic building envelope, on site renewable energy generation, demand side management, electric vehicle charging and monitoring and control. For each domain various functionality levels are defined, with higher functionality levels reflecting a smarter implementation of the respective service. The overall methodology has been tested on two use cases and is thoroughly described in the Final Report of the study. The study concludes that the developed methodology follows the principles as outlined in the EPBD 2018 whilst being able to be practically implemented. Even though the methodology is not binding for the member states, it provides a template that is stated to be flexible enough to be adapted to local framework conditions [11].
Since the above described report [11] has been finalized in August 2018 and the implementation of the amended EPBD has not yet been included within the national laws of the member states, so far there is no empirical data on the validity of the methodology or the usability available. However, based on the case study assessment undertaken within the above study, one can conclude that: (a) the appraisal heavily relies on a (potentially subjective) expert judgment, (b) the assessment needs to be carried out within an operational building and might not be applicable for the use of the building design and (c) the assessment can be time consuming as there are a high number of criterions and domains that need to be covered. It is also understood, that the assessment is undertaken on site by a qualified consultant, which inherently necessitates an accreditation and certification structure. Whilst this is a valid way forward to address the increasing management capabilities of buildings, it is questionable if the strong focus on building and information system technology adequately addresses the requirement for an indicator that still should have energy and resource efficiency at its core. The question remains as to who defines smartness and how it can be measured.
2.2. Demand Response and Load Shifting in Buildings
Buildings have been inherently energy autarkic in early settlements. With increasing energy demand, it was advantageous to move from individual energy supply to a more centralized supply and thus physically separate consumption and generation. For this purpose, the energy supply networks were built, which commonly encompass large scale centralized energy generation and wide distribution networks surpassing regional and national borders. The Liberalization of the energy market at the end of the 20th century together with the understanding of the correlation between CO2 emissions and climate change have resulted in a transformation process towards a less fossil fuel dependent and more sustainable system. With the advance of renewable energy generation, the distribution grids become ever more complex as the grids need to respond to heavily fluctuating supply. The transition of the current centralized market towards a smart market in an intelligent smart grid has been exemplary documented by Aichele et al. [16]. The increasing demands on this structure make it imperative to switch from a centralized to a decentralized and interactive system. For this purpose, numerous concepts and methodologies have already been developed and tested, with some relevant studies as briefly outlined below. In summary, these concepts are termed Smart Grids and Smart Markets.
Assessing the heat dynamics of buildings Madsen et al. have already proposed in 1995 to apply building performance data and statistical methods instead of simply relying on the physical characteristics of the building and building systems [17]. At a time when building energy modeling was not yet an inherent part of advanced building design processes, this approach presented an alternative route to assessing the thermal behavior of buildings. The methodology has been further improved by applying the use of stochastic differential equations to assess heat dynamics [18] and by including a methodology for the identification of suitable models in this context [19].
In order to actively interact with the grid, buildings are moving from consumers to producers, which resulted in the terminology of the prosumer (producer + consumer). Using buildings to produce energy by integrating renewable energy systems constitutes one of the key principles of our changing energy system. Another key aspect is to use the storage capacity of buildings in order to shift loads over time. Buildings with a high thermal mass can thus activate their thermal capacities by storing thermal energy (adding energy for later use) or conserving thermal energy (using the previously stored energy). Le Dreau and Heiselberg have evaluated the dynamic behavior of buildings by applying thermal storage solutions as opposed to water or battery storage solutions. The study highlights the importance of high efficiency buildings, as poorly insulated buildings have a short autonomy and thus thermal capacity over a longer time constant compared to buildings with a low heating and cooling energy demand [20]. Other storage devices in buildings can include e.g., ice storage units or water tanks as well as batteries. Selecting the best storage type for a certain use depends on a series of factors. Using optimization models for an appropriate selection process can determine the most advantageous system as outlined by Xu et al. [21]. However, it is imperative to consider the current market situation as prices for building systems can significantly vary over time. In an analysis carried out for batteries used in the automotive industry a cost reduction averaging from over USD300/kWh to under USD100/kWh is projected for 2020 to 2025. The automotive market can thus significantly contribute to the wider application (and second life) of electrical batteries for the use in buildings [22]. In a study undertaken to assess the application of all electric storage systems in buildings, the results showed that electrical batteries could successfully perform load shifting and peak-shaving in order to take advantage of price differences of a smart market [23].
A surplus of energy generation can also be efficiently managed by using power-to-heat or power-to-gas storage. Whilst power-to-gas is currently mainly applied in large-scale projects, it provides a suitable technology to convert surplus electrical energy into hydrogen to be used directly as a final energy carrier or to be converted into e.g., methane or liquid fuels [24]. Power-to-heat on the other hand can be used directly in buildings by exploiting the entire thermal mass available for activation. Converting surplus electrical energy in times of high electrical renewable energy generation through wind and solar into locally stored heat constitutes one of the great potential buildings offer for short-term demand response [25]. Whilst smart grids are mostly associated with electricity grids, the use of smart thermal grids opens up the thermal networks for the integration of decentralized thermal energy generation. In a study undertaken in the framework of the Austrian Climate and Energy Fund an in depth analysis of the potential of thermal prosumers concludes that whilst the technical capabilities are manageable, business models must still be developed in order to provide the necessary incentives for the thermal grid operators to allow a large integration of decentralized thermal energy integration [26]. Lund et al. also argue, that the challenge of thermal networks, the 4th Generation District heating (4GDH), will be in the utilization of low temperature heat sources (such as ambient and waste heat from cooling) and the interaction with zero and low energy buildings [27].
Whilst the management of the grids is focused on the optimization for the grid operator, the building side needs to respond to the requirements of the grid whilst maintaining optimal comfort and efficiency levels for the building. Building management systems (BMS) already contribute to the optimization of the building and its building services systems. A BMS can control any devices from passive architectural elements, such as shading or opening elements to active systems such as heating, cooling, ventilation and lighting systems. In combination with sensors that measure a range of system parameters such as room temperature, humidity, lux levels, CO2 or any set point temperatures to name just a few, the BMS can actively contribute to increased comfort levels and reduction of the overall energy demand. Using the BMS with distributed energy resources (DERs) in order to reduce energy costs and overall CO2 emissions is a way forward in managing buildings on a system level. Optimization models, which work with different pricing and energy demand scenarios support the understanding of how buildings can be actively integrated into the energy grids [28]. Other studies have shown that user comfort optimization and energy use reduction can be achieved by applying Smart-Context-Awareness Management (Smart-CAM) by using smart building ontology and context awareness mechanisms [29]. Clustering buildings in order to further increase the load shifting potential and thus enhance the energy flexibility of whole regions is the consequential result from the optimization of the single entity [30]. Accompanying policy measures to increase the use of building energy management systems play a crucial role in this context [31]. Real-time optimization models are increasingly necessary to adjust demand and supply in the smart grids. Genetic algorithms can support the assessment of load shifting towards improving the application of buildings as distributed thermal storage within a smart grid [32].
Within the Horizon 2020 research, there is an uptake of research and innovation projects, which have smart buildings and associated sectors as a part of their projects plans. Based on an analysis from 2017, 42 projects with a total funding of 304.1 million Euros between 2014 and 2017 have directly or indirectly addressed the subject of smart buildings within their research. 15 out of the 42 analyzed projects explicitly deal with demand response, 19 each with the control of appliances and individual buildings, 18 with the subject of full automation and 29 with user interfaces [33]. Even though this data represents only a snapshot of projects running at that time, it nevertheless highlights that this area is likely to progress further with the new legislation of the EPBD being transformed into national law in the next years in the member states.
2.3. Smart Buildings
In order to give justice to the terminology of smart, one has to consider how this term has been attributed to the field of construction over time. In the European Commission’s Strategic Energy Technology (SET) Plan 2011 [34] smart cities were defined within their own thematic field. This has been the first time that in addition to individual technologies (such as wind or geothermal power) a systemic topic has been included in the SET Plan. It has thus been acknowledged, that—in addition to the incremental improvement of individual technologies—only the added focus on the overall system will bring a paradigm shift in the energy system and substantial changes in energy and resource efficiency. The optimization of the overall system at the interface of urban planning, mobility, industry, buildings and energy thus opened up a new focus.
The potential for optimization on this system level can be attributed to two main factors: (1) Based on the UN World Urbanization Prospects [35] by the middle of 2009, the number of people living in urban areas had surpassed the number living in rural areas. This trend is strongly continuing with virtually all of the expected growth in the world population concentrated in the urban areas of the less developed regions. The second factor can be attributed to the advance of (2) Information and communication technology (ICT), which has improved exponentially over the last two decades. The collection, storage and analysis of large quantities of data have facilitated new potentials such as the Internet of things (IoT) and machine-to-machine (M2M) communication. In conclusion the world is becoming more urban than rural and new systemic approaches made possible by the advance of ICT can support cities and regions in becoming more sustainable whilst ensuring a high quality of life.
Smart Buildings have been cited along Smart Cities and Smart Grids as the new way forward towards a transformation of our current fossil-fuel dependent energy structure into an energy and resource efficient system. Even though the smartness of buildings has been roughly defined in the latest version of the EPBD as outlined in the chapters above, smart can and should encompass much more than only interaction of the building system with the building itself, the occupants or the grid. Looking back at the actual need for buildings, one has to acknowledge that the fundamental aim of constructing buildings was always to provide shelter from the climate and security from potential enemies. Thus, autochthonous architecture is characterized by the provision of a comfortable, secure indoor environment under the given climatic conditions and with the available resources. Transferring this fundamental approach to the present, building smart is thus building according to the local climate by exploiting passive design measures to increase energy efficiency in an integrated design. After exploiting passive design measures, the next step is the adequate and resource-oriented integration of technical building systems and renewable energy systems. Only then can we optimize systems by exploiting synergies through connection and load shifting, which opens up new potentials to increase efficiency of bigger systemic entities such as districts or cities.
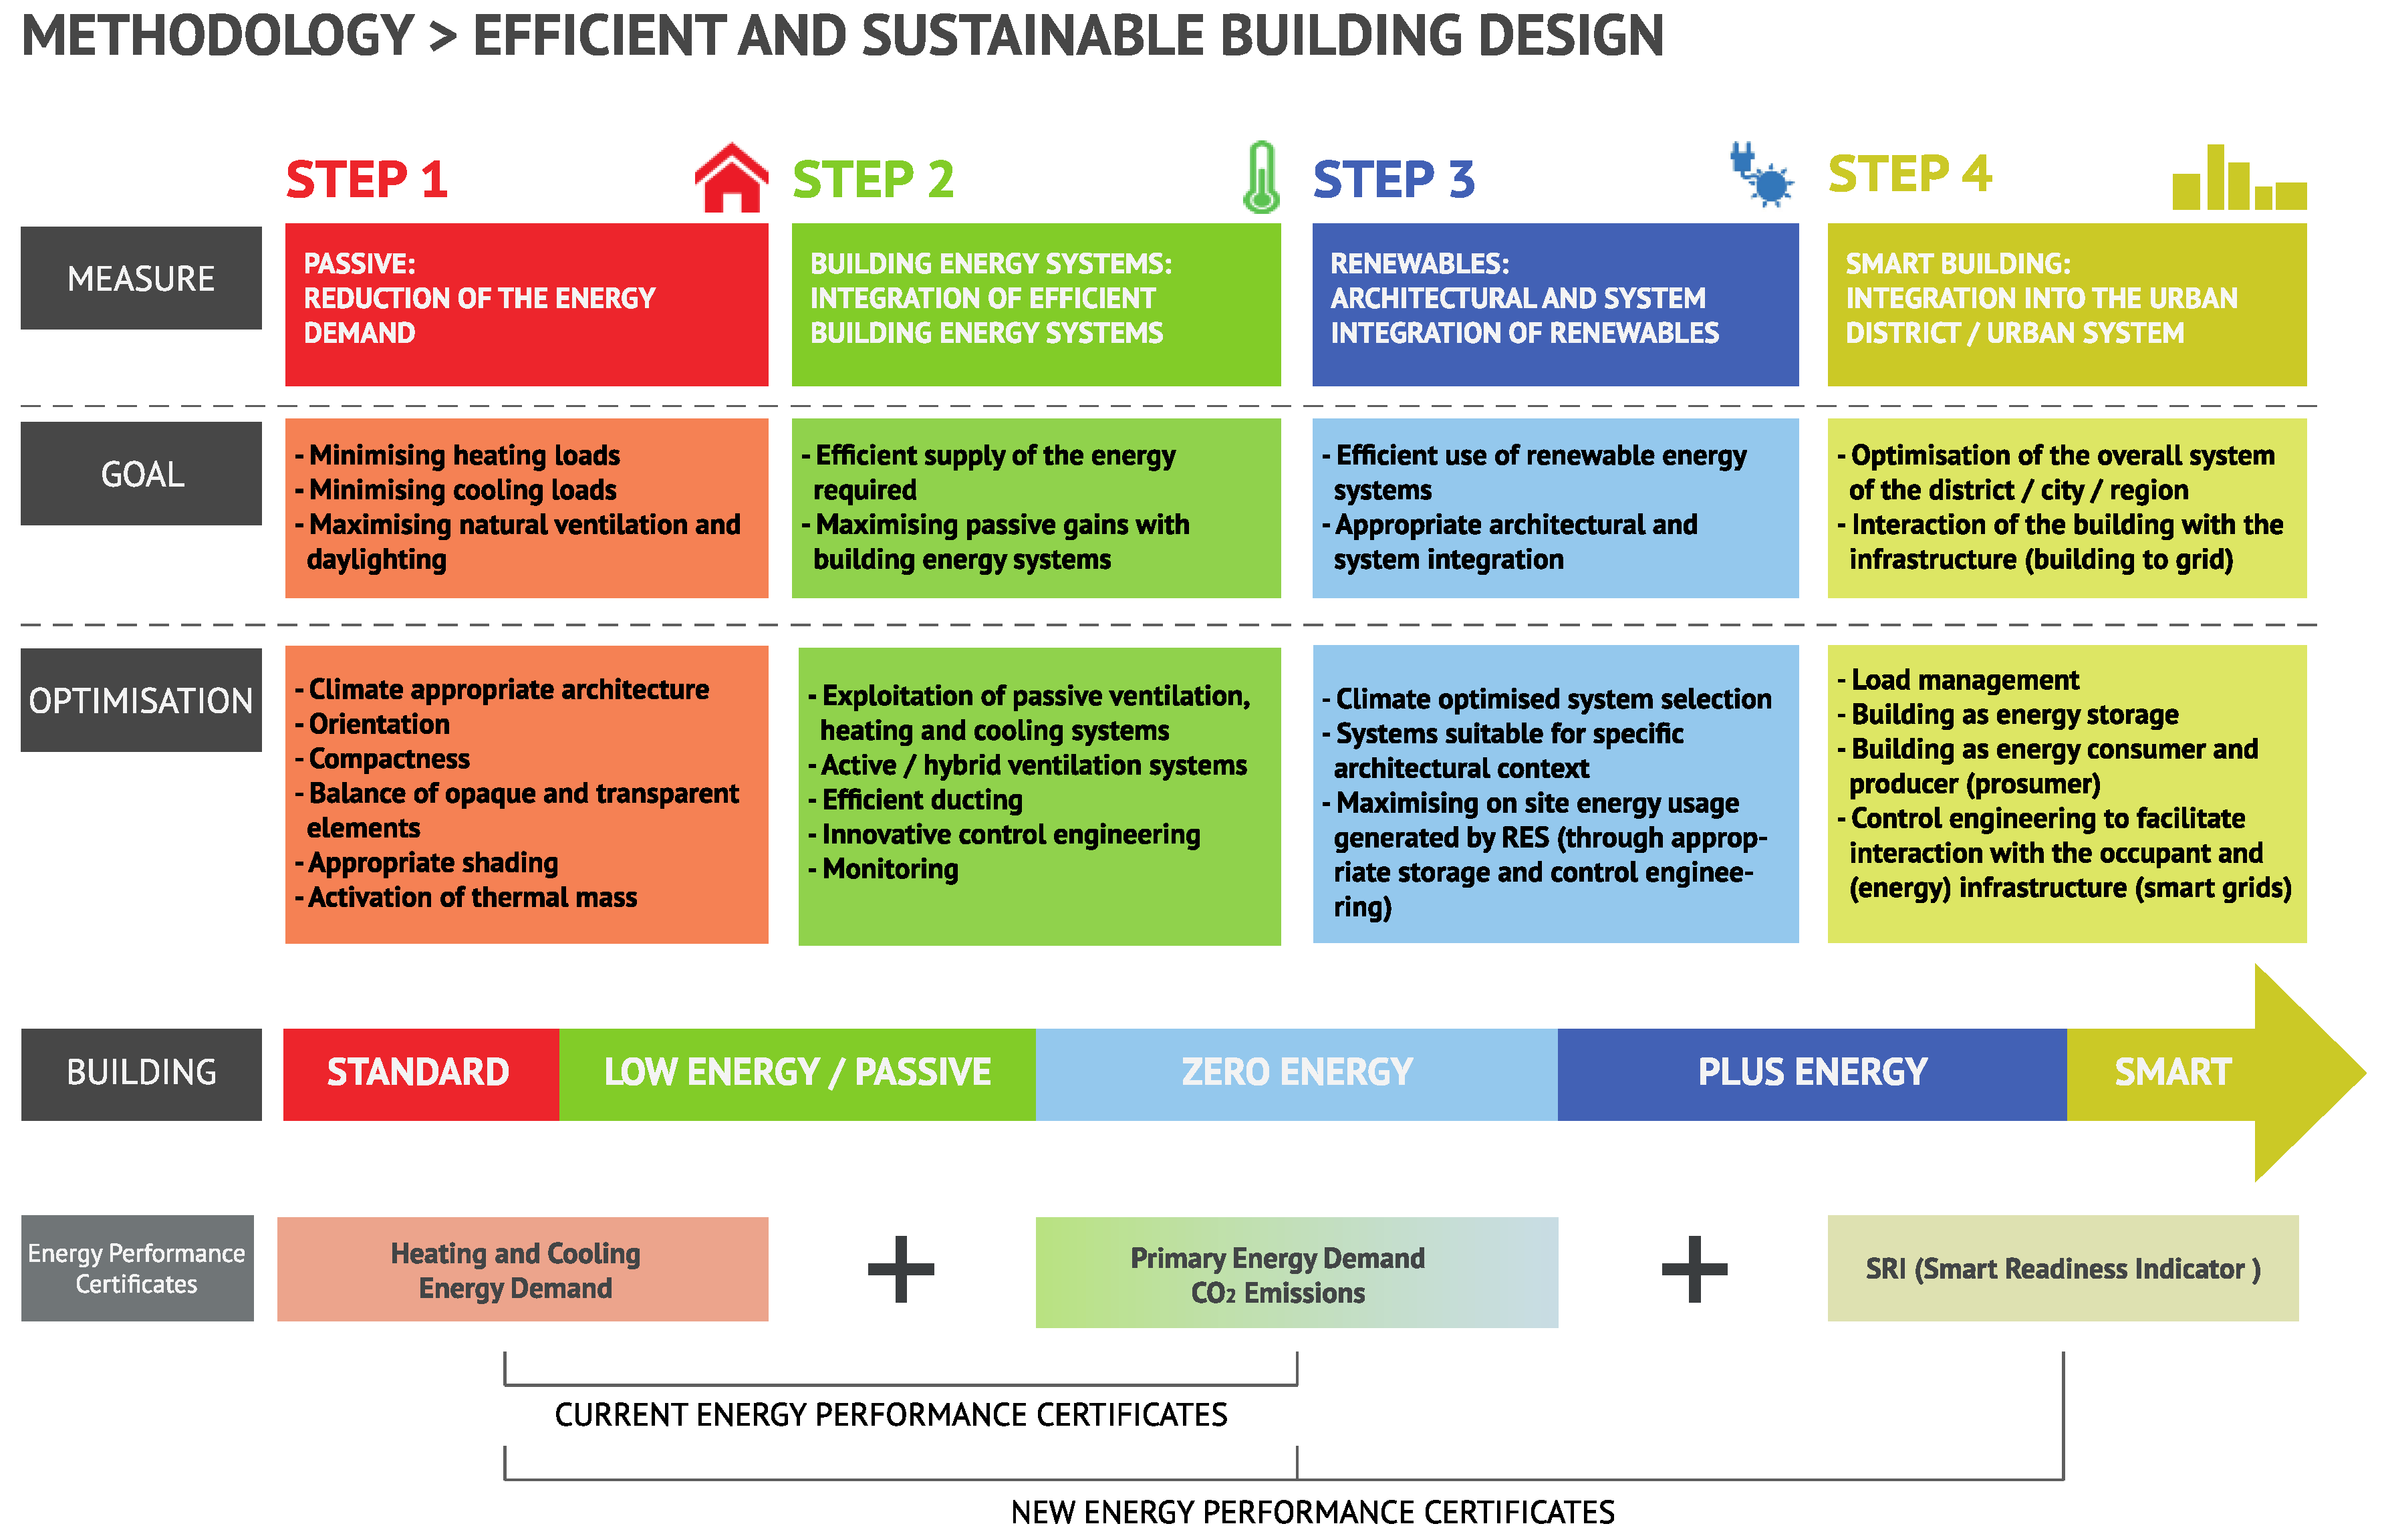
A methodology for energy-efficient and sustainable building design must consecutively focus on a structured approach starting with energy-demand reduction (Step 1), followed by energy-efficient equipment (Step 2), renewable energy systems (Step 3) and as a last step the system optimization and interaction with the grid (Step 4) as outlined in Figure 1 The approach should ensure that passive measures are always fully exploited before any active technology—and system-intense measures are considered. The architecture plays a key role in defining the least possible energy demand. Thus demand-side measures are optimized before distribution and supply measures are even considered, resulting in efficient use of resources and adequate application of technical and renewable building energy systems [36]. Whilst Step 1, 2 and 3 are accounted for in the EPCs by calculation the relevant indicators, the last Step 4 encompassing the interaction with the grid has yet to be included in any EPC assessment. Adding to the already existing indicators of heating and cooling energy demand (based on Step 1) as well as the primary energy demand and CO2 emissions (consecutively resulting from Steps 2 and 3), the SRI as outlined in the last amendment of the EPBD is in this context the key indicator for this Step 4 and should in the future constitute a mandatory part in the EPC assessment.
An indicator for smartness can thus include a variety of aspects such as: building to high efficiency standards, responding automatically to external conditions (e.g., weather, grid), managing building systems automatically and in response to the user and the grid, supplying large amounts of renewable energy on site and feeding energy back into the grid. This can subsequently be measured by, for example: summing up the number of responsive appliances in buildings, assessing how many technical items can be controlled with a building management system, assessing if and how the building and its systems support energy and grid management and assessing how many systems contribute to the internal comfort of the occupants.
This however would constitute a rather qualitative way forward, where an assessor has to decide, which systems contribute to what extent to the smartness of the building. An example of such a qualitative but nonetheless thorough approach has been proposed within the study commissioned by DG Energy [11] as a methodology for the SRI as outlined above. The question however remains, if this type of assessment favors the increased use of smart appliances without adequately addressing the underlying aim of the SRI, which is inherently to reduce resource and energy consumption by the management and connection of systems. Another disadvantage of this qualitative approach lies in the timing of the implementation of the respective systems. Whilst most energy related systems (heating, cooling, ventilation) form an inherent part of the overall building design, additional smart systems might not necessarily be included in the planning of the building as appliances and other gadgets are more likely to be installed by the final user rather than the building developer.
Focusing again on this fundamental principle of resource and energy efficiency, one can conclude that:
“…A smart building is offering maximal quality of living with minimal consumption of resources by (1) exploiting architectural passive design measures to increase energy efficiency, by (2) joining internal and external systems and integrating renewable energy infrastructure and by (3) optimizing load management and load shifting to increase energy efficiency on all levels of the building, district or city…”.[37]
Extracting this for the above stated question on how we can measure the smartness of a building:
“…We can assess the load shifting potential of a building by calculating how much of the thermal and electrical energy can be loaded from the grid, stored and unloaded into the grid over a certain period of time whilst maintaining required comfort levels…”.[37]
3. Methodology
Whilst there exist numerous approaches to analyze the thermal and electrical behavior of the building as outlined in the introduction section, there is still a need to address the actual load shifting potential of buildings by an assessment, which can be carried out as part of the SRI within the EPC. The aim of this article is thus to provide a methodology for a simplified quantitative assessment for an SRI with a numerical, model-based approach. Following the requirements of the current EPBD as outlined above, the methodology covers the flexibility of interaction with a grid and thus grid-friendliness of a building. The proposed approach focuses on this aspect only, as it can be assumed that the ability of a building to adapt to energy performance requirements as well as the ability to respond to the needs of the user are covered by the integration of a BMS, which in turn is a pre-requisite for the building systems to interact with the grid. With the proposed numerical approach, buildings should be able to be rated and subsequently categorized with a single indicator per energy type based on their energy storage capacity, load shifting potential and subsequent interaction with the grid.
3.1. Description of the Model
A key aspect of the proposed methodology is the applicability within the scope of the EPBD and subsequently in the EPC in order to provide an easy to use calculation, which can be carried out in addition to the already established calculations as outlined above. Therefore, the use of input data, which is already being applied in the current EPC as well as other data, which is easily accessible at an early design stage, constitutes a prerequisite for the development of the methodology. Another crucial requirement is that the calculation can be both carried out during the design phase as well as during operation, i.e., covering both new and existing buildings.
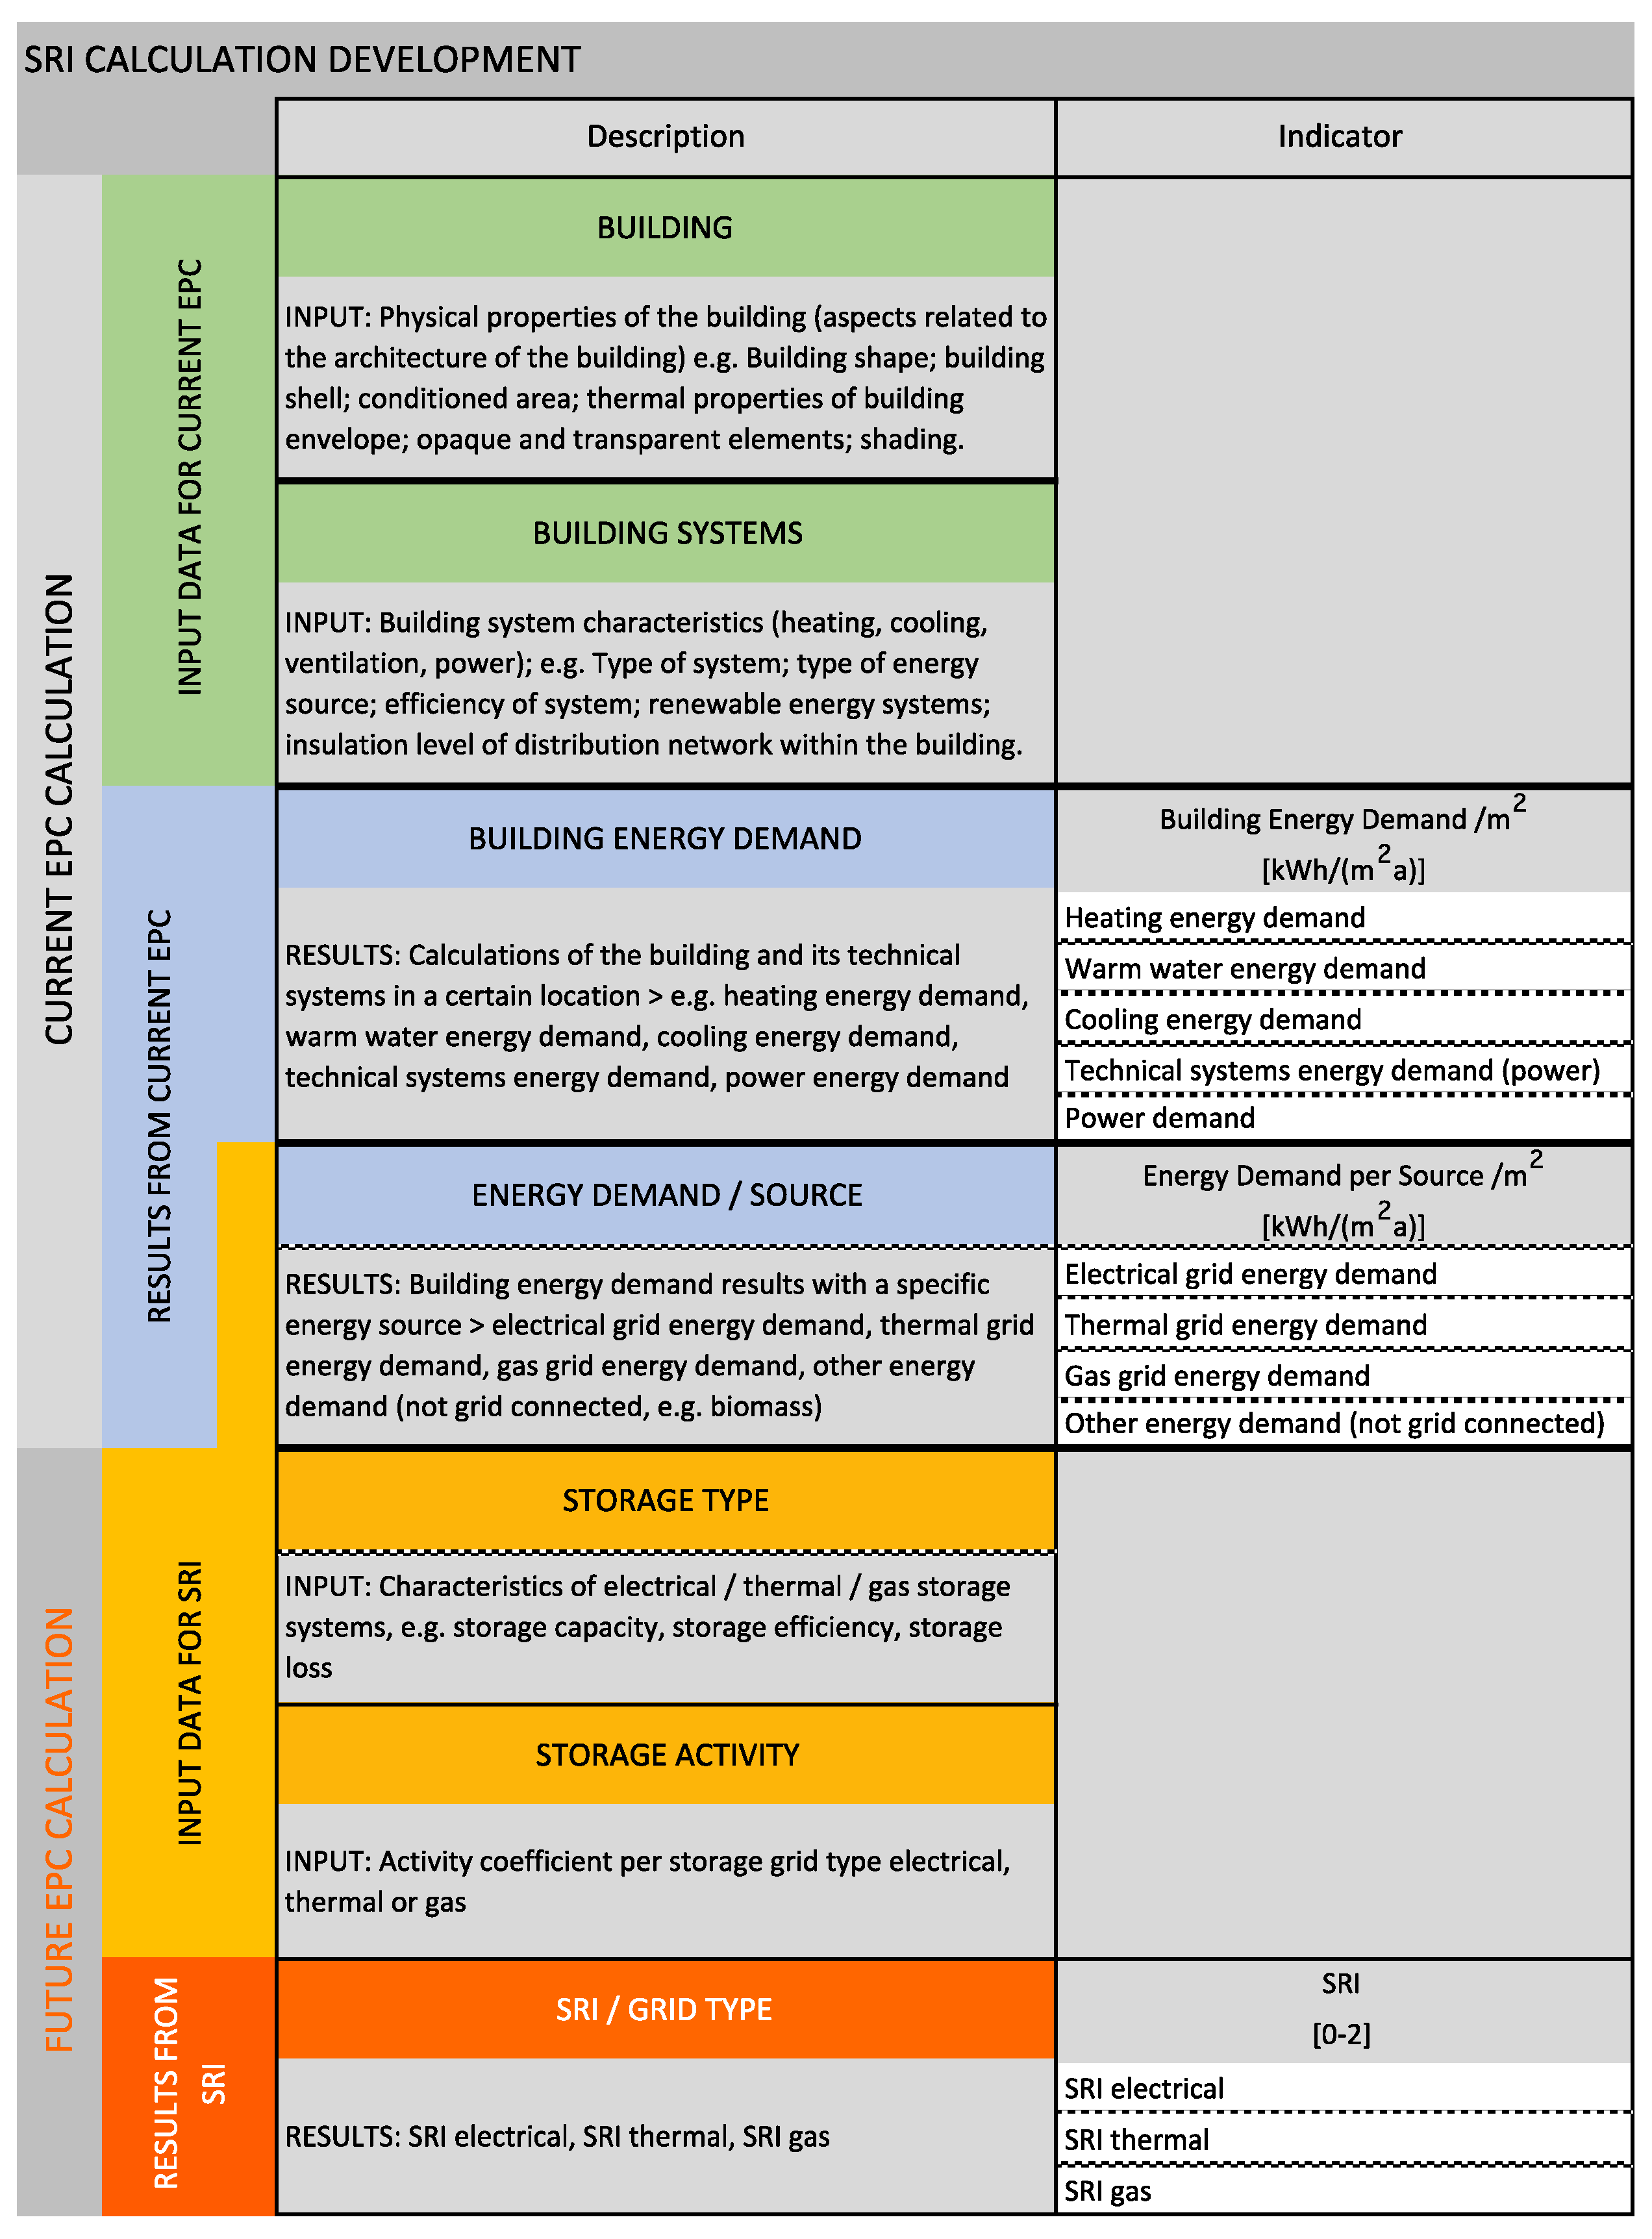
Currently for the calculation of the EPC all relevant aspects related to the building as well as its technical building systems need to be considered. Thus the characteristics of the building (e.g., physical and thermal properties) and technical systems (e.g., type, efficiency), including the respective energy sources, are already part of the assessment. As a result the overall energy demand in terms of heating, cooling ventilation and power as well as the primary energy demand and associated CO2 emissions are calculated. The source of the final energy as well as the grid connection is therefore already included in the input data. At this point it is thus already clear, if the building will be connected to a grid (electrical, thermal, gas) or if the building is independent from a grid. In order to calculate the SRI as proposed in this article, additional characteristics related to the storage potential of the building and its systems need to be included in a future assessment. Factors that should be considered within the model are the physical structural storage capacity of the building (e.g., activation of thermal mass), the physical technical storage capacity (e.g., chemical, electrical, thermal) and the potential of thermal/electrical conversion systems (e.g., heat pumps). One of the key input parameters is also the time component as it is highly relevant how long a certain system can obtain, store and dispatch energy. The model foresees, that an indicator is calculated for each energy source provided via an energy network. The calculation itself is dependent on the type of energy source, e.g., electricity, thermal (heating, cooling) or gas. In Figure 2 the SIR calculation development is outlined to describe the input data for the proposed SRI methodology.
The input data already included in the current EPC (building, building systems) are needed for the calculation of the current EPC (building energy demand, energy demand/source). These results from the current EPC (energy demand/source) provide together with the additional input data for the SRI (storage type, storage activity) the basis for the future EPC calculations. As a result, one SRI is subsequently calculated per grid type. The most relevant grid types are considered to be electrical, thermal and gas, however additional grid types can be added if necessary.
3.1.1. System Boundaries
The calculated smart readiness indicator (SRI) should represent the ability of a building for the meaningful participation in smart grid concepts. For this reason, two key aspects are considered in the first step:
- Is there a grid with appropriate energy sources available?
- To what extent is the building able to communicate with the corresponding grid?
The building is examined with regard to: (1) qualitative and (2) quantitative criteria. In the qualitative criteria (1), a distinction is made in terms of the interaction potential and activity with the grid: no possibility to shift energy to and from the grid, the possibility to shift the energy demand according to the needs of the grid or the possibility to fully participate in smart grid solutions. The possibility of interaction is in this context independent of the actual building energy demand. The interaction is based on the usefulness for the networks, i.e., is it useful to take energy from the grid or is it useful to give energy back to the grid. The quantitative criteria (2) of the building are defined as independent of the used technology. For the active interaction of a building with a smart grid concept, the temporal flexibility of a building is essential with regard to its characteristics relating to energy consumption, energy production or both. To take this fact into account, the building is simplified and acts as energy storage in the model (see Figure 2).
To determine the quantitative values, the building energy requirements are based on the relevant standards per m2 or, if calculations have already been carried out, on the actual building energy demand. Since smart-grid concepts require periods other than one year, the building energy requirement must be adapted to the selected period. This value is used as a reference and the building storage is normalized in this regard. To counteract any oversupply of stored energy, an upper bound was added in the model function. Energy costs or associated costs for auxiliary energy to load or unload the storage have been explicitly excluded from the model. Following the EPCs currently applied in the member states, the focus lies on the energy rather than the costs aspects.
The proposed SRI does not assess the efficiency of the building nor of the technical building systems, as this is already part of the current Energy Performance Certificate calculations. In addition, it does not take into account the capability of the interaction of the building with the user, i.e., the building management systems that allow the user to communicate with the respective technology items (often referred to as “smart home technology”) as this is assumed to be covered with a BMS.
The proposed SRI provides a quantitative assessment of the interaction capabilities of the building with the networks. It can answer the question of:
“What is the potential of the building to take energy from the grid, store it over a certain period of time and again dispatch it back to the grid?”
Within this context the methodology does not differentiate to where the energy is stored (e.g., in thermal mass, water storage tank or electrical battery). It only assesses the connection of the respective grid to the building (electrical, thermal, gas) and the loading and unloading capabilities in this context. If the energy source is not grid connected (e.g., biomass, coal or other energy source) then it is not taken into account. The BMS is considered to be a prerequisite in order for the building systems to interact with the relevant networks. The SRI calculation system boundaries are subsequently defined by the energy storage types and the activity with the respective grids (See Figure 3). For example, if the main thermal energy source of the building is biomass, then there might not be a thermal grid connection nor a gas connection. In this case only the electrical grid connection can be considered for the SRI calculation. Therefore one SRI must be calculated separately for each grid connection (electrical, thermal, gas). If only one grid connection is available, then the two others do not apply. It should be noted that purposefully there is no distinction made between district heating, low-temperature district heating, district cooling or other thermal grids such as anergy-networks, as it is assumed that only one thermal grid connection per building is realized. However, within the methodology other grid types can be added if necessary.
3.1.2. Description of the Indicator
To describe the ability of a building to interact with the utility grids, four different options are distinguished, depending on the activity of the building. From these options the following possible values are derived:
- No grid available n/a.
- No interaction with the grid; activity coefficient 0.
- Passive interaction with the grid; activity coefficient 1.
- Active interaction with the grid; activity coefficient 2.
In this context “no interaction with the grid” means that no storage or load shifting potential is available, the building is a simple consumer. A “passive interaction with the grid” requires the building to offer storage and/or load shifting potential to the grid. The load shifting is however only one-directional from the grid to the building. The “active interaction with the grid” stands for an energy flexible building that provides storage and/or load shifting capabilities and offers bi-directional load shifting from the grid to the building as well as from the building to the grid. This building would be able to produce as well as consume energy and consequently be a prosumer.
3.1.3. Description of the Model Functions
The basis for the selection of the function was to connect two barriers with a smooth curve. Consequently, the following sigmoid function was chosen:
With the individual coefficients of Y(x) as follows:
- L
- Lower asymptote.
- U
- Upper asymptote.
- G
- Growth rate.
- ν > 0
- Affects the growth near the asymptote.
- C
- Coefficient influencing Y(0).
- M
- Move the curve to the right.
From this basic equation a normalized curve, which leads from 0 to 1 and goes through the point (1, 0.5), has been created. Subsequently the chosen coefficients are as follows:
- L = 0
- U = 1
- G = 6
- = 1
- C = 1
- M = 1
From the selected curve the subsequent function can be derived:
For the calculation of the proposed SRI the following variables are necessary:
- ED
- Energy demand of the building per energy source for the selected time period τ.
- SC
- Storage capacity of the respective storage in the building.
- ηSC
- Efficiency factor of the storage capacity. (Here the efficiency for loading as well as unloading the storage must be considered). ηSC := ηC·ηD
- ηC
- Efficiency factor of the storage capacity for charge.
- ηD
- Efficiency factor of the storage capacity for discharge.
- ζSC
- Storage loss during the selected period in full storage (e.g., self-discharge, heat losses)
- AC
- Activity coefficient for the building.
Following Equation (2) and the variables as outlined above, the following equation can be defined as a result for the SRI:
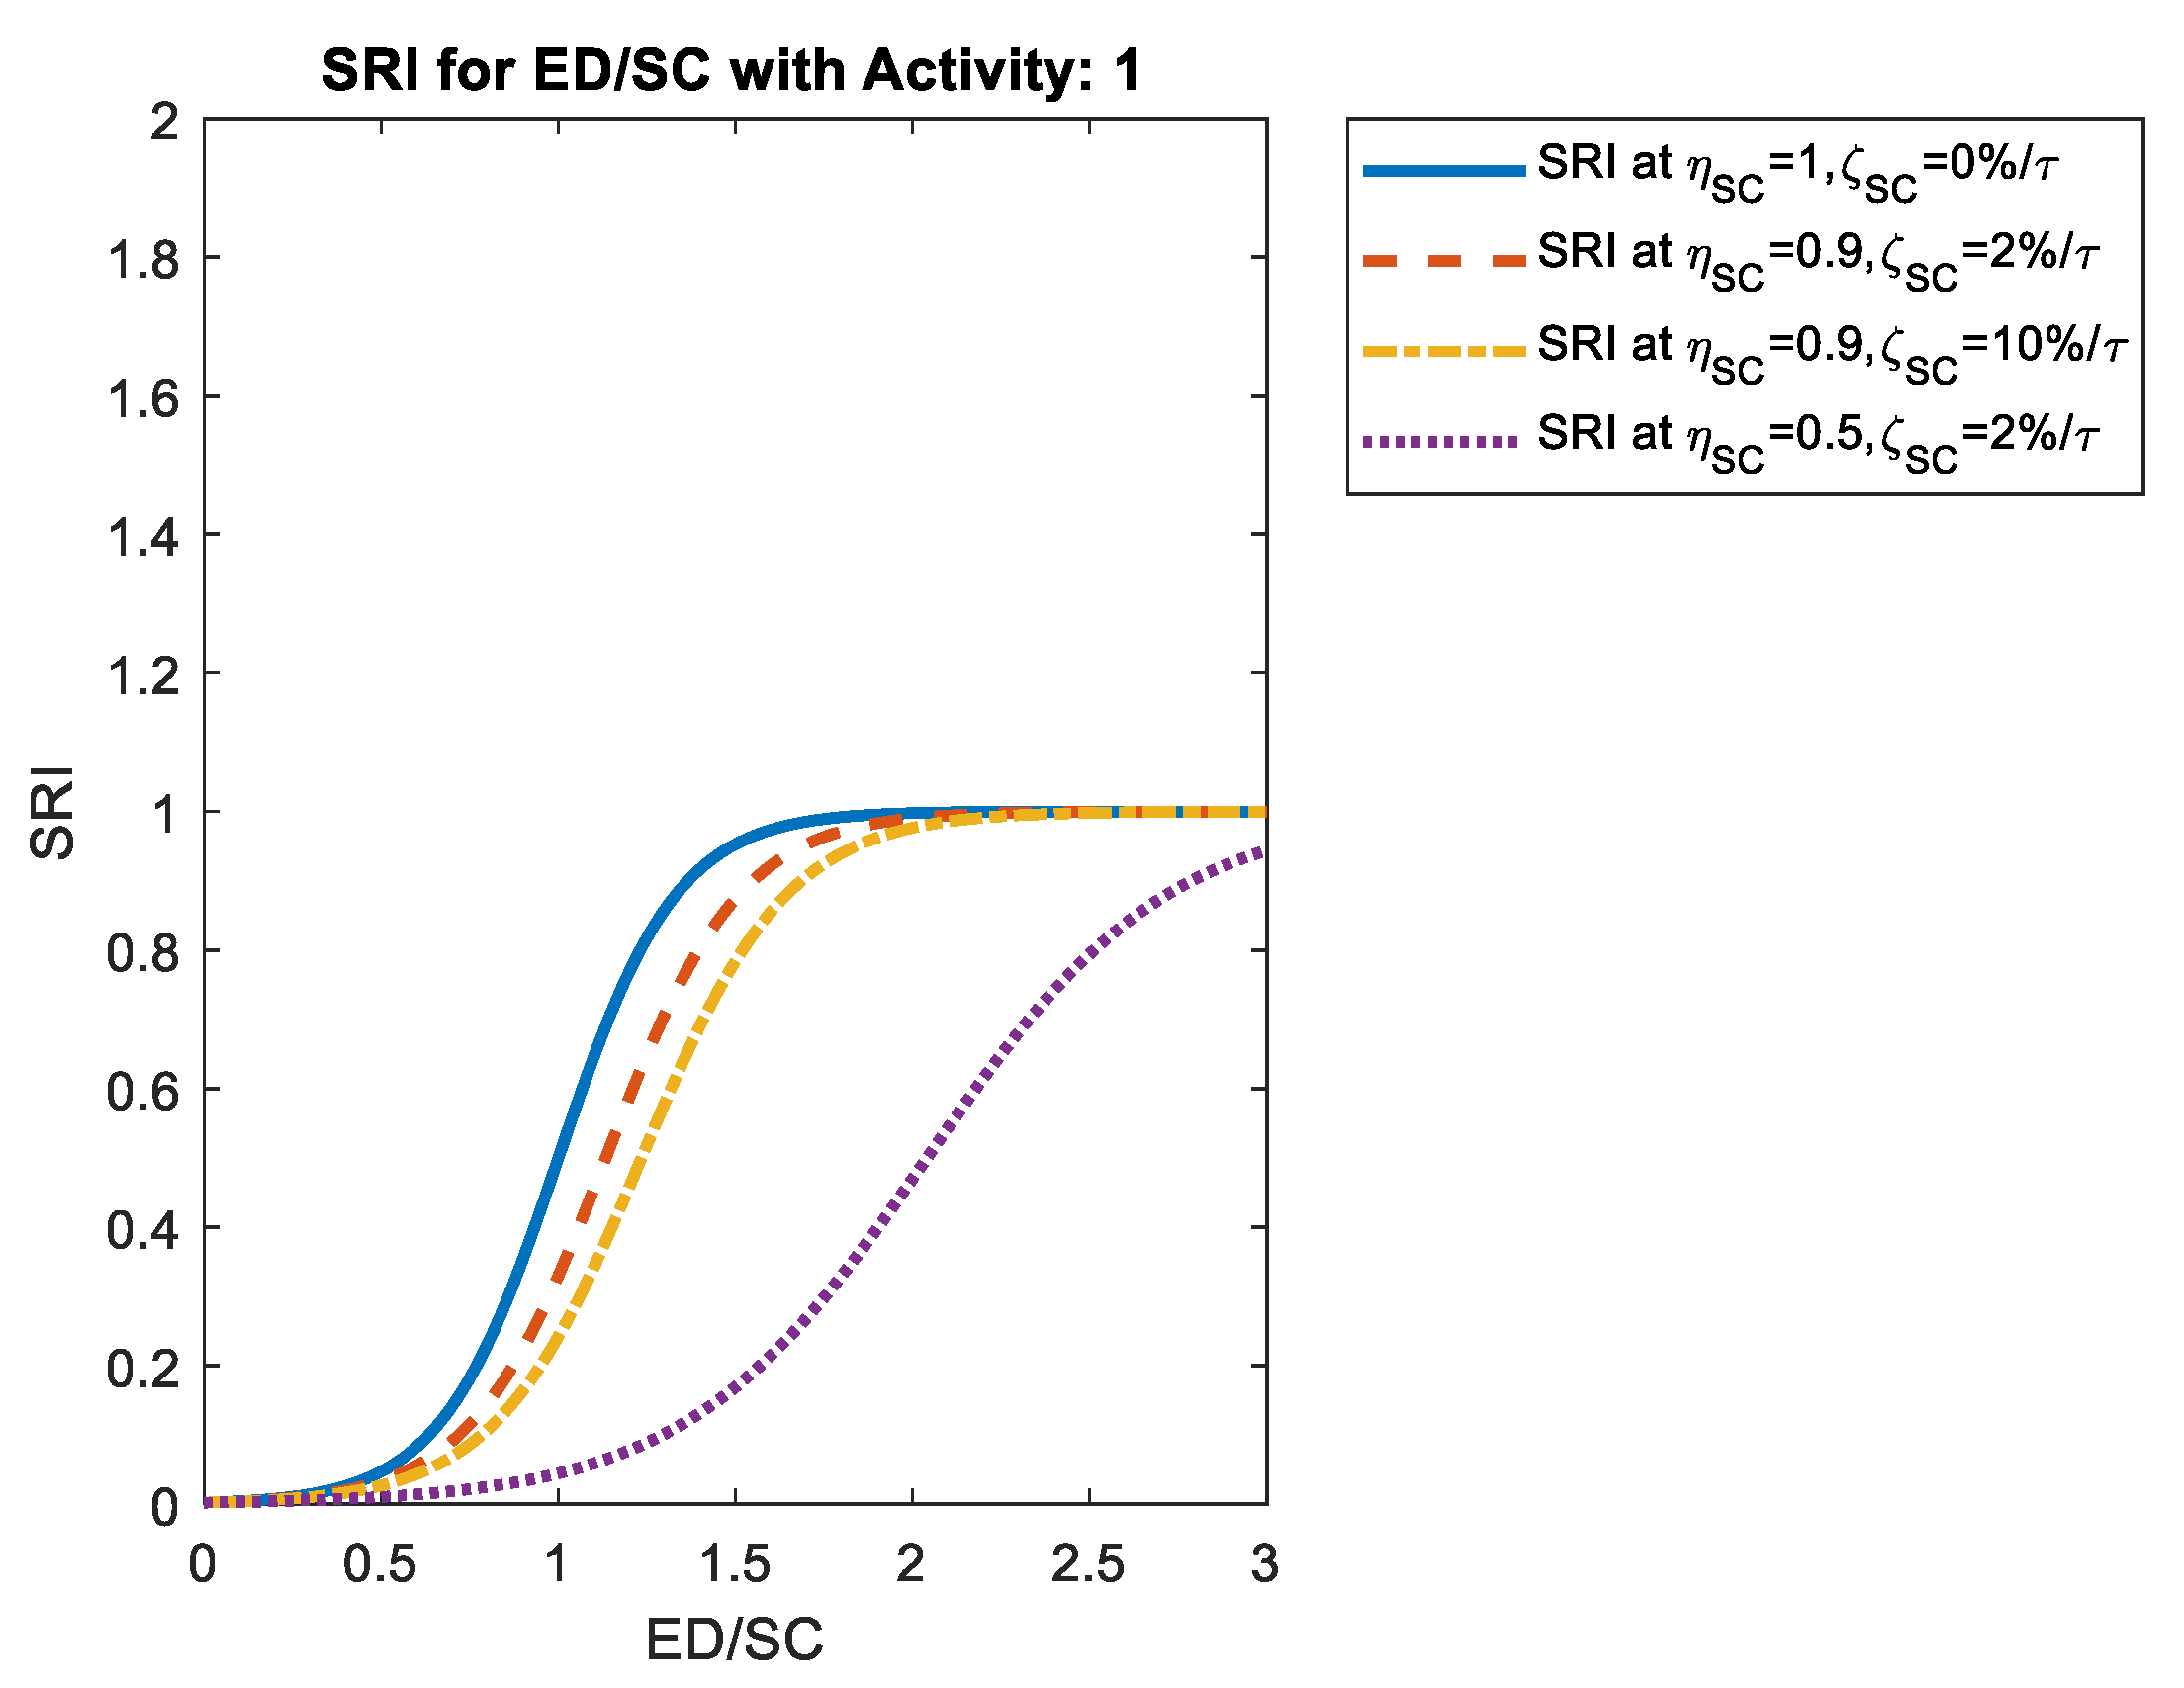
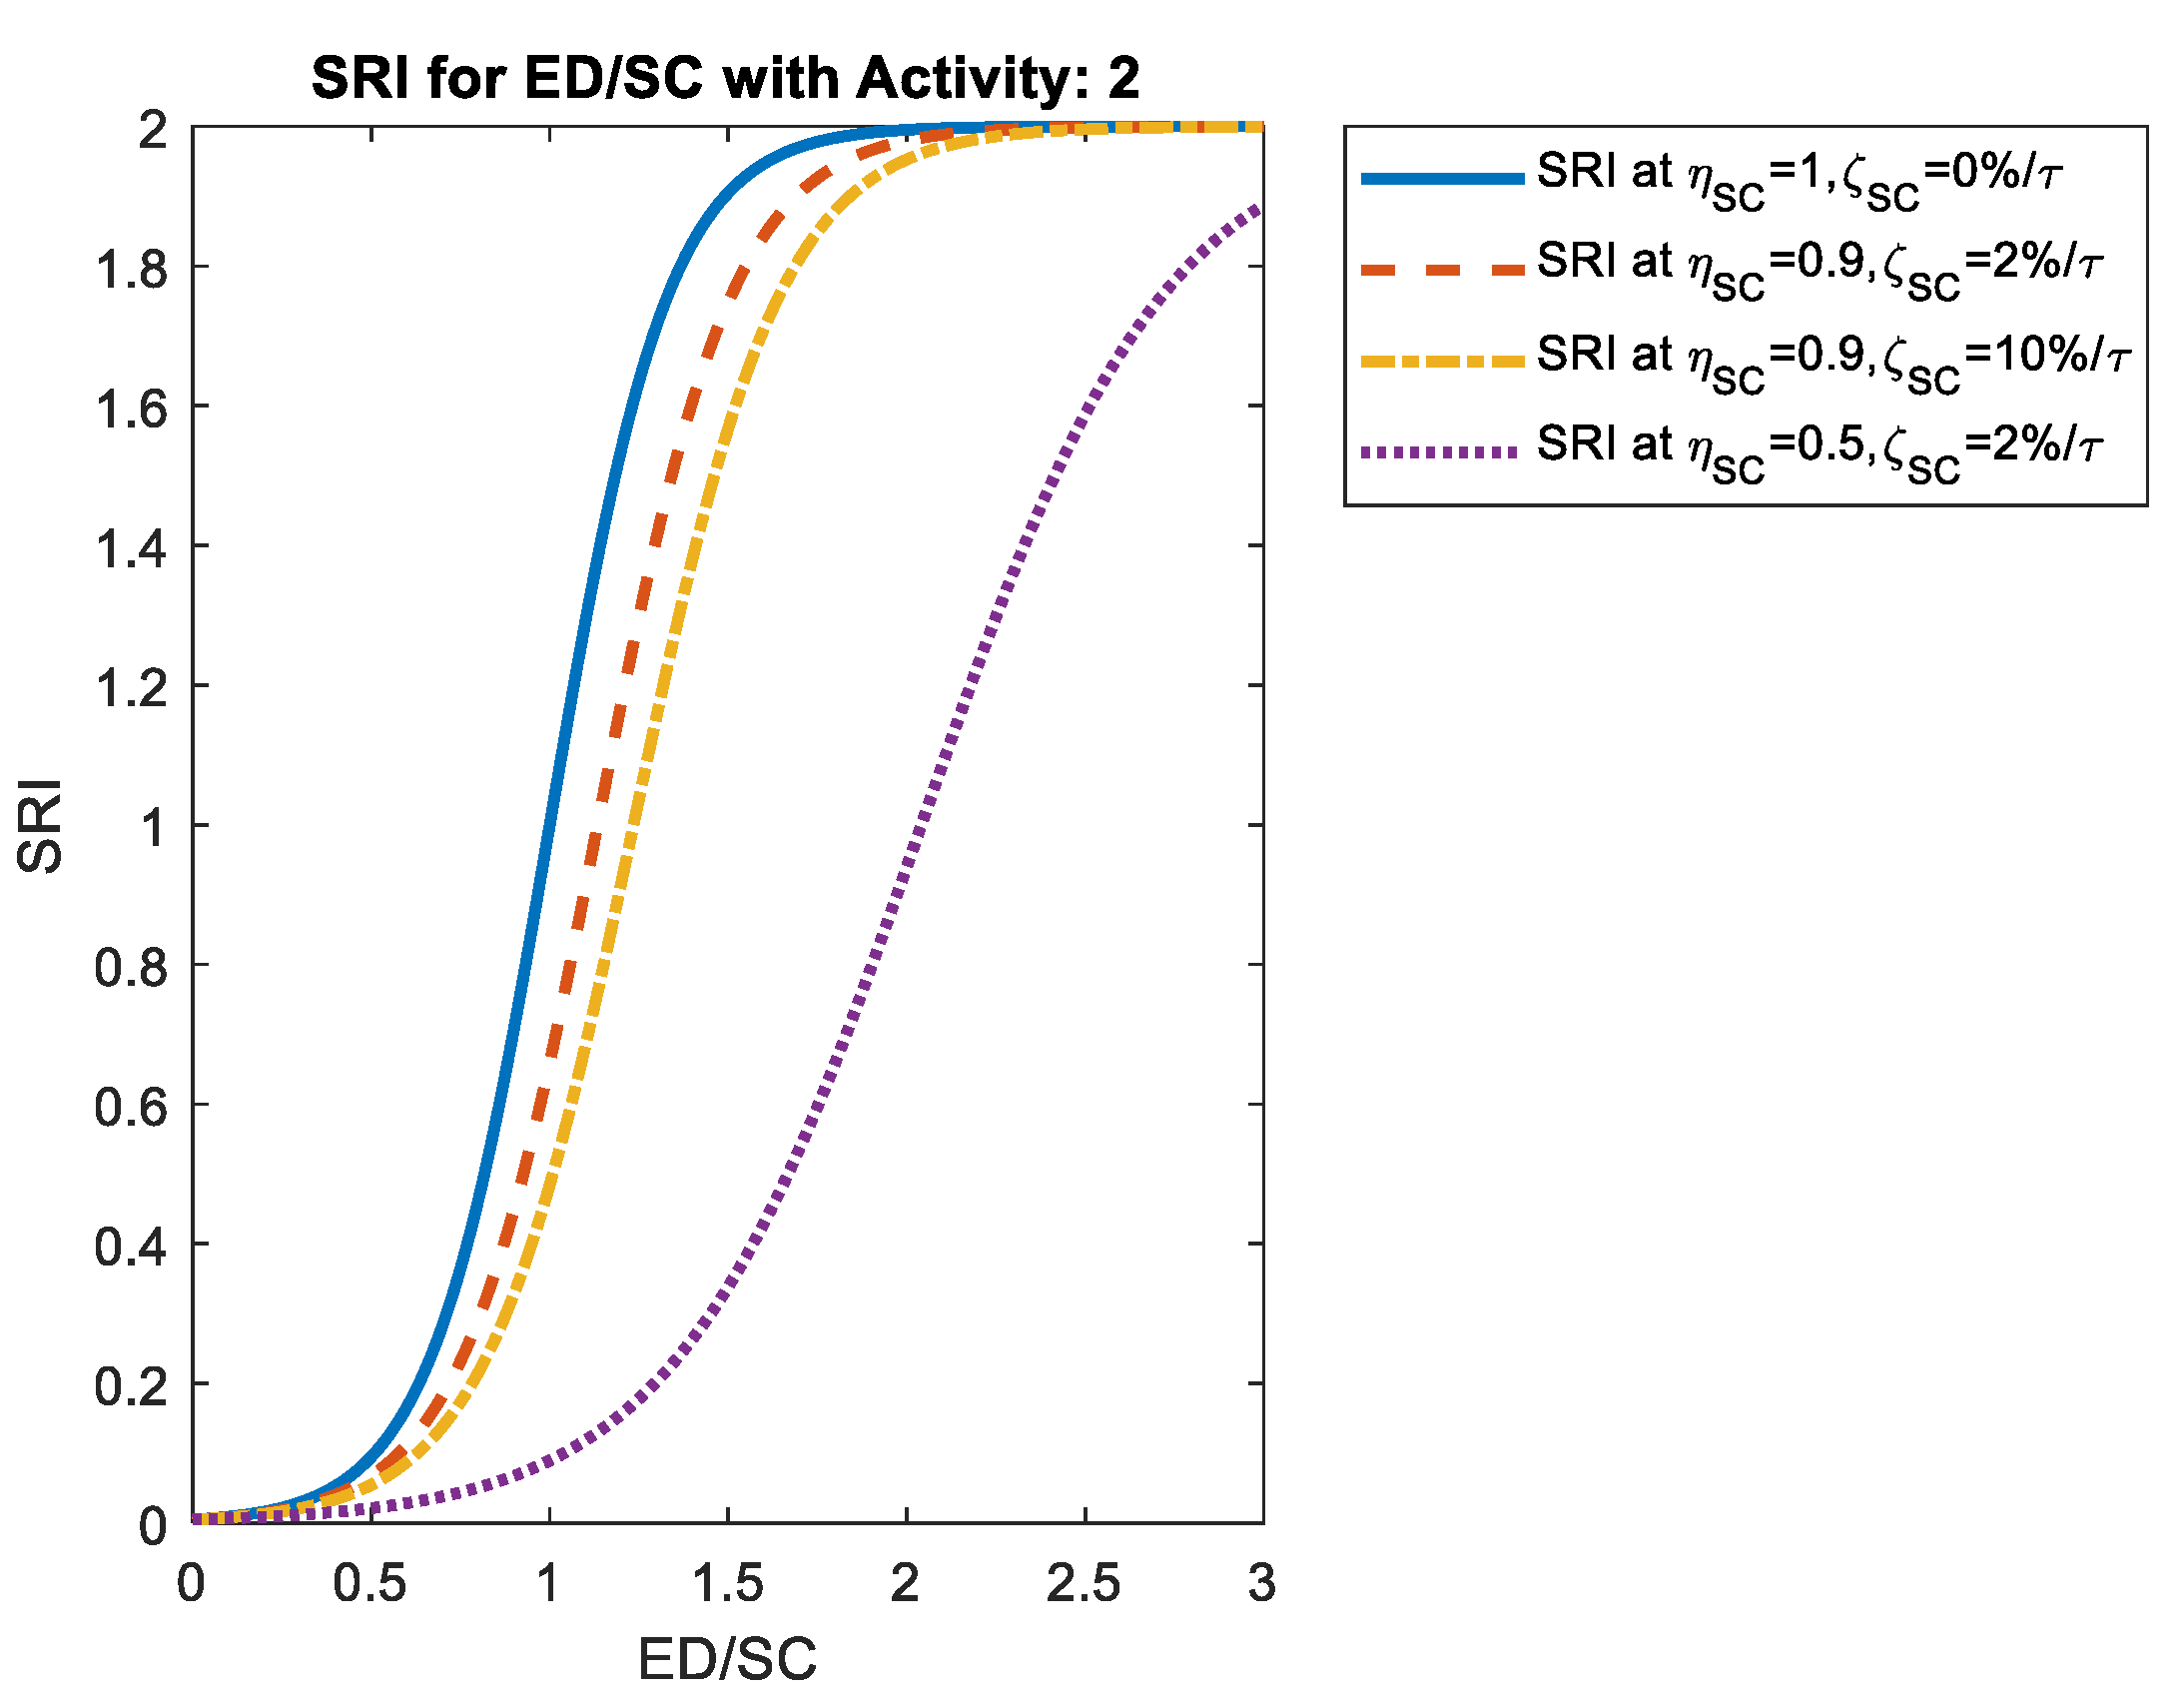
Based on this equation the required characteristics for the SRI methodology can be achieved. The figures below depict the SRI curves based on the Equation (3) for the various activity coefficients. Figure 4 shows the SRI curves with the activity coefficient 1 and Figure 5 shows the SRI curves with the activity coefficient 2. The SRI with an activity coefficient of 0 would result in all values to be equally 0. With an activity coefficient 1, the resulting SRI is between 0 and 1 and with an activity coefficient of 2, the SRI falls between 0 and 2.
3.2. Characteristics of the SRI Methdology
The described SRI methodology has been chosen based on a series of requirements that form an essential part of the methodology. These requirements can be described as follows:
- There is a convergence of the SRI curve in respect to the upper and lower limit.
- The upper and lower limit can be freely selected.
- The period length τ can be freely selected: e.g., one day for a 24 h load profile or one year for a seasonal load profile, depending on the time period; the energy demand (ED) needs to be adjusted accordingly (e.g., for thermal loads the total heating energy demand would need to be divided by the heating days whereas for the total warm water energy demand this would need to be divided by 365 days if only a 24 h period is selected).
- Inclusion of system losses
- Inclusion of system efficiency
- The storage capacity is given in relation to the amount of energy, which is taken from the grid within a defined period.
- Query for the extent of interaction between the building and the grid. The query asks, whether the system can actively, passively or not at all interact with the grid (i.e., no grid available n/a; no interaction with the grid; activity coefficient 0; passive interaction with the grid; activity coefficient (1); active interaction with the grid; activity coefficient 2.
For the load profile of the charge and discharge of any storage in the building the following model has been assumed, which is based on the below equations:
With the individual coefficients as follows:
- E(t)
- Energy in the storage at the time t in kWh.
- P(t)
- Load Power in the storage at the time t in kW.
- PL(t)
- System losses kW.
- ηC
- Efficiency factor at charge.
- ηD
- Efficiency factor at discharge.
- ζSC
- Loss coefficient of the system.
- PN
- Rated power of the grid connection of the building in kW.
- SC
- Storage capacity in kWh.
This load profile is of particular relevance, if the building generates its own energy e.g., by means of renewable energy. For each grid type (electrical, thermal, gas) a separate load profile must be calculated. Figure 6 shows the graphical representation of the load profile of the charge and discharge of any storage in the building.
If there are multiple storage system within the same energy type (e.g., two or more thermal storage systems) then the SRI can either be depicted as a max (SRI) or as a weighted average. Therefore, the proposal is, that for the SRI used in the EPCs, SRIs for all storage systems of one energy type are calculated and only the maximum is considered for the certificate. To assess a combined SRI with multiple storage systems per energy type, the following Equations (10)–(15) can be applied:
With the individual coefficients as follows:
- N
- Number of storage systems per energy type.
- ωi
- Weighting factor for i
- SCi
- Storage capacity of the respective storage i in the building.
- ηCi
- Efficiency factor of the storage capacity for charge of storage i.
- ηDi
- Efficiency factor of the storage capacity for discharge of storage i.
- ζSCi
- Storage loss during the selected period in full storage of storage i.
4. Application of the Methodology in Theoretical Use Cases
To assess whether the methodology can be used as a standard assessment within the EPCs, four use cases, which are considered to be typically covering a wide range of building stock, have been selected. The main characteristics for two residential and two office buildings have been chosen in order to test a range of potential applications. The use cases cover existing buildings, considered to have little interaction with the grid as well as newer buildings, which already have an active and bi-directional interaction with the grid. In the following the uses case are explained in more detail and subsequently the results for the SRI are presented and discussed.
4.1. Description of Use Cases
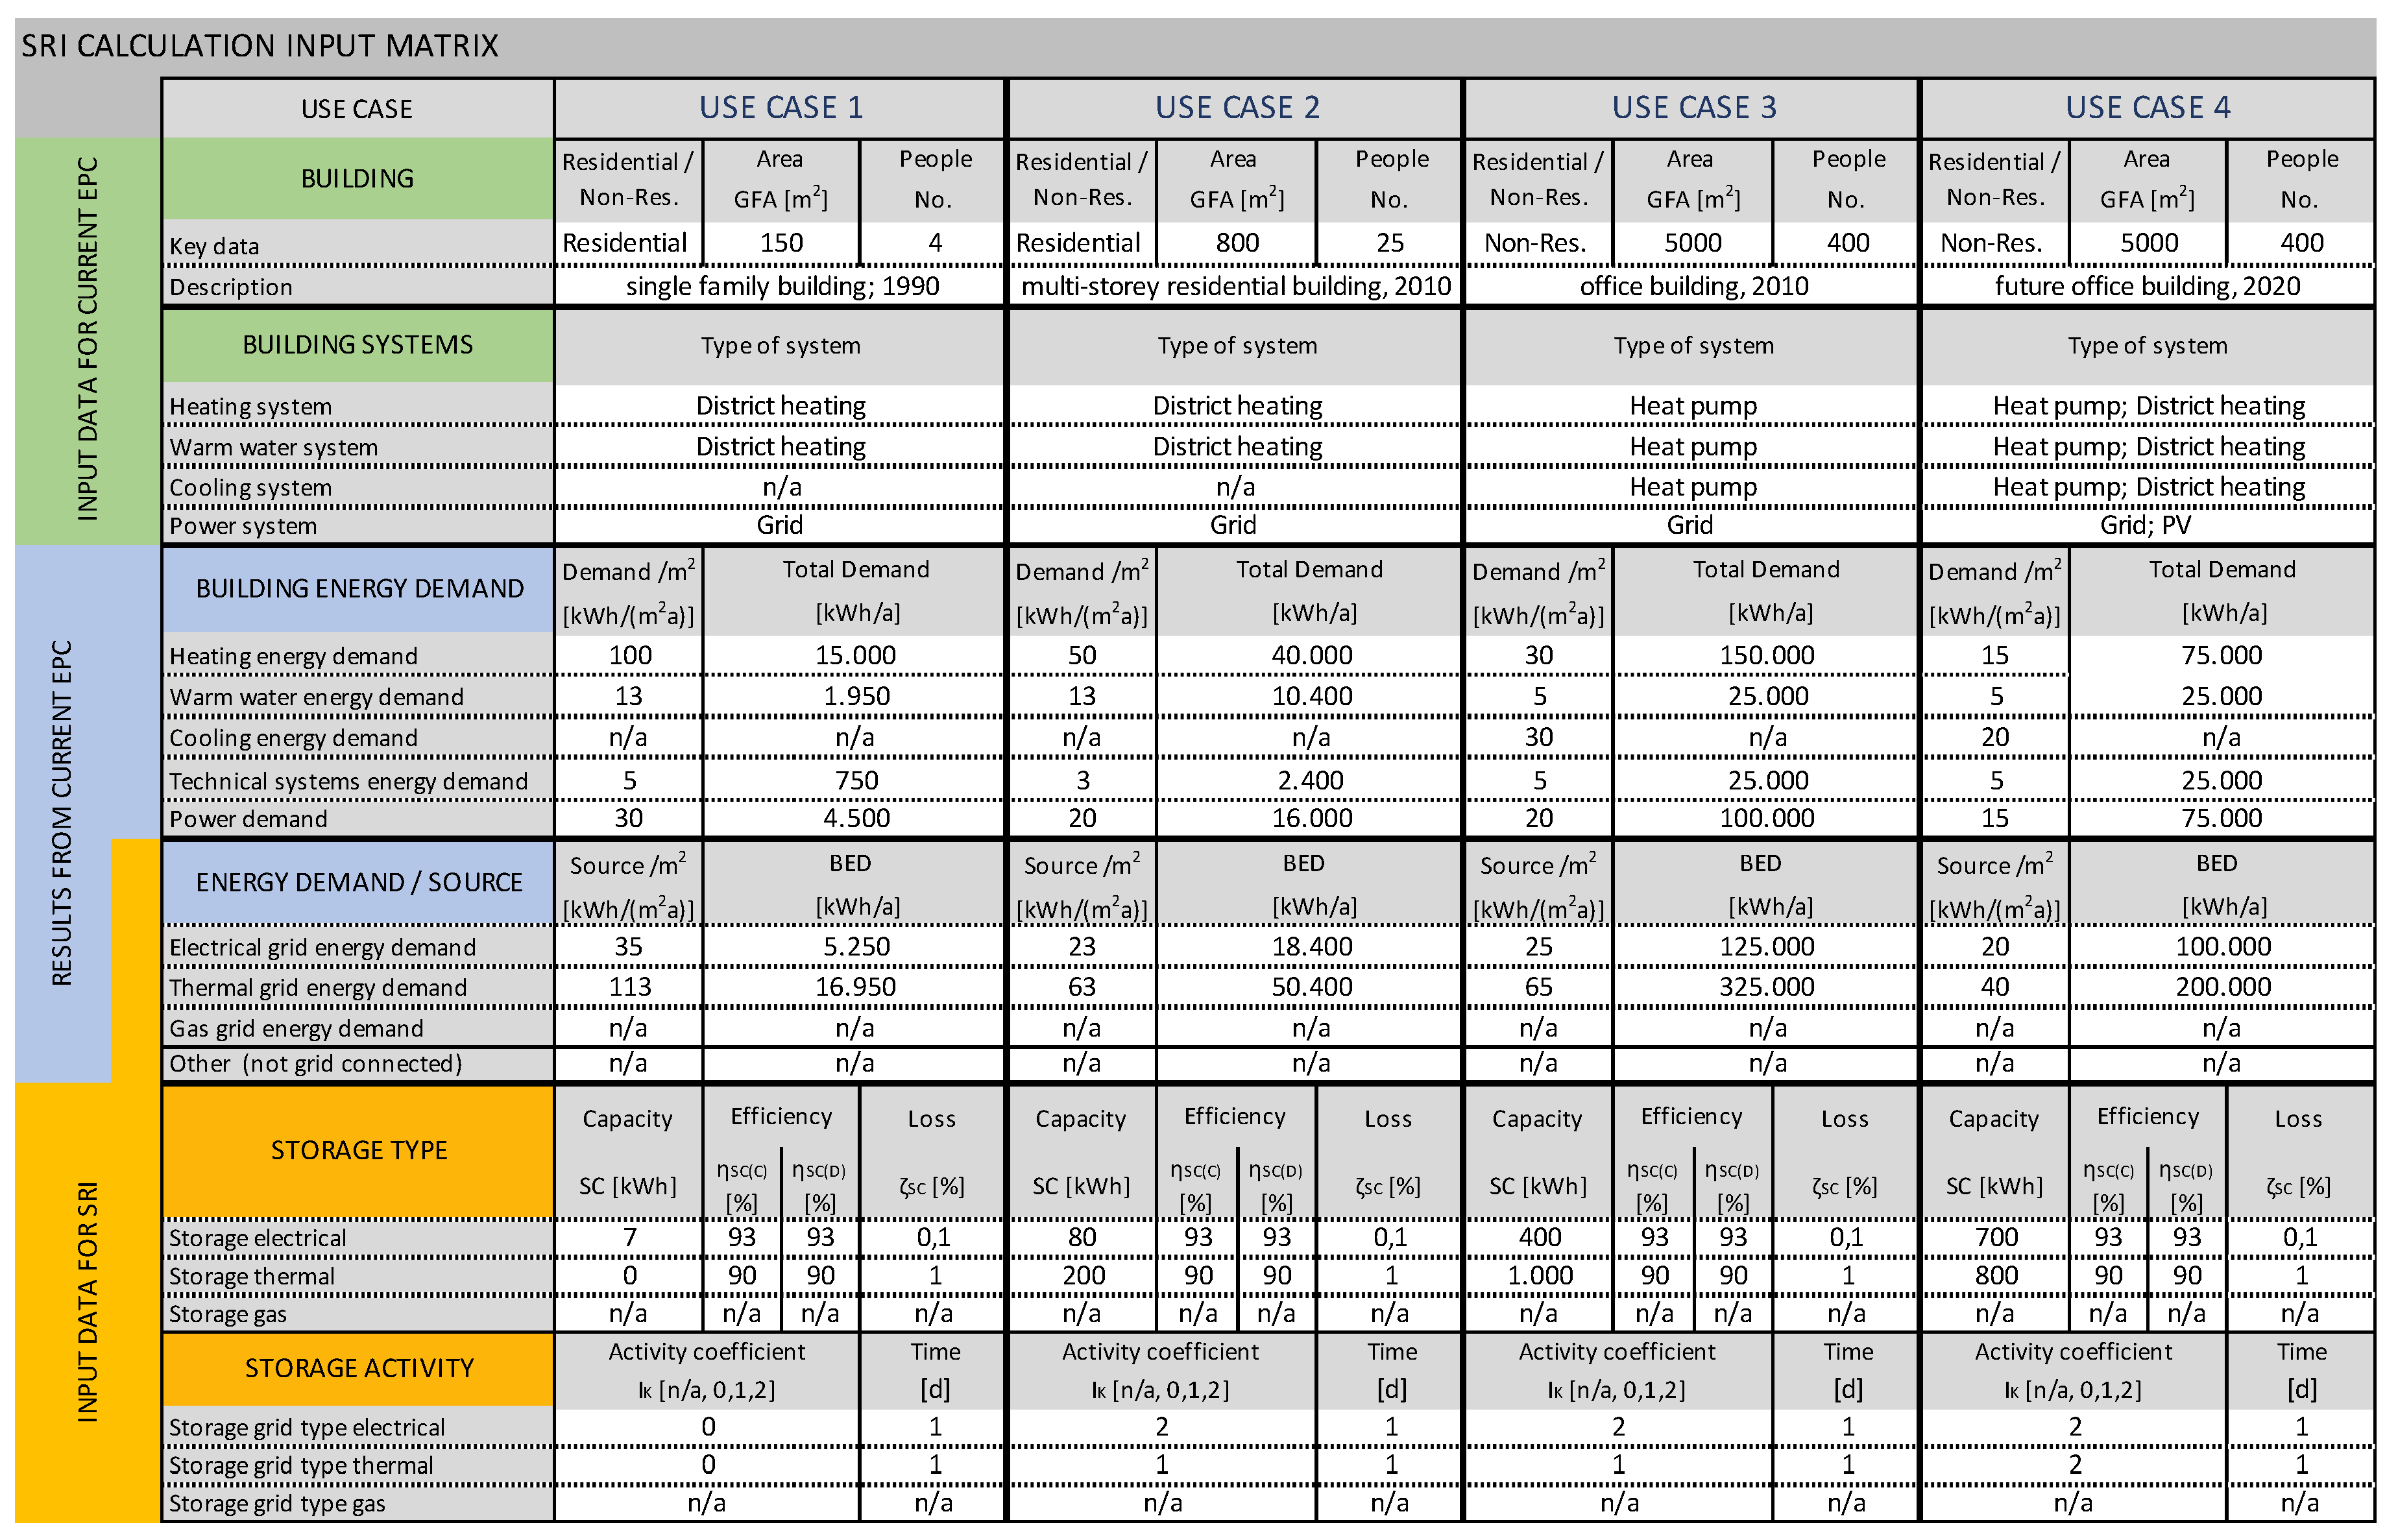
In Figure 7 the SRI use case matrix with the relevant input data for the four selected uses cases is shown. In addition to the characteristics of the building (type, year of construction, area, number of people) and energy related data (heating energy demand, warm water energy demand, cooling energy demand, technical systems energy demand and power demand) the thermal and electrical storage capacities as well as the activity coefficient with the thermal and electrical grids differ within the four use cases. The option for technical storage gas has also been included as in the future the potential to generate, store and unload (bio)gas might be a viable option for certain building types. The proposed SRI methodology can thus equally cover this option. However, for the purpose of the selected use cases gas grids have not been considered.
- Use case 1: Single family building built in 1990; the building has not yet been refurbished, the external envelope is therefore poor compared to state of the art standards; the heating system is based on a typical floor heating system connected to district heating; no cooling; the building is not able to store thermal energy from the grid (activity coefficient 0 electrical; activity coefficient 0 thermal).
- Use case 2: Multi-storey residential building built in 2010; the quality of the external envelope is better than use case 1 with a resulting heating energy demand half of that of use case 1; the heating is equal to use case 1 with floor heating connected to district heating; no cooling; an electrical battery has been added; the building is able to store thermal energy from the grid in a water storage tank and to load and unload electrical energy from the grid (activity coefficient 2 electrical; activity coefficient 1 thermal;).
- Use case 3: office building built in 2010; external envelope to a high standard based on building regulations as of 2010; heating and cooling energy is generated by ground-coupled heat pumps; the building is connected to district heating; an electrical battery has been added; the building is able to load and unload electrical energy from the grid (activity coefficient 2 electrical; activity coefficient 1 thermal).
- Use case 4: office building to be built in 2020; external envelope twice as high as use case 3; the heating and cooling is equal to use case 3; in addition the system is connected to a district heating grid; a building integrated photovoltaic system is installed; an electrical battery has been added; the building is able to load and unload electrical as well as thermal energy to and from the grid (activity coefficient 2 electrical; activity coefficient 2 thermal).
4.2. Results of Use Cases
The results highlight that, based on the activity coefficient, the SRI figures are in the range of 0 to 1 for activity coefficient 1 and in the range of 0 to 2 for activity coefficient 2 (Figure 8). It is evident, that a higher SRI stands for a higher flexibility of the building to store and subsequently dispatch energy back to the grid on demand.
- Results of use case 1: The activity coefficient for all grids is 0, thus the SRI is similarly 0 as the building is not able to actively engage with the energy networks. The building is a simple consumer.
- Results of use case 2: Since the building can store energy from the thermal grid in a water tank but cannot actively discharge energy back to the thermal grid, the SRI thermal is below 1 and due to the limited storage capacity relatively low. The SRI electrical is with 1.81 high, since the electrical battery can actively store surplus energy from the grid and dispatch it back into the electrical network.
- Results of use case 3: The first example for the office building has similarly to use case 2 an activity coefficient of 2 for the electrical storage and an activity coefficient of 1 for the thermal storage system. This results in a SRI below 1 for the thermal connection and a just above 1 SRI for the electrical coefficient. The latter is due to the relatively small storage capacity of the electrical battery.
- Results of use case 4: This use case is the only one with an activity coefficient of 2 for both the thermal as well as the electrical connection. The resulting SRI of 2 shows that the electrical storage is at its limit for the charge and discharge of the electrical energy. The SRI thermal is with 1.91 relatively high due to the high thermal storage capacity of the system. It can be seen that compared to use case 3, the SRI is with a lower thermal storage capacity higher, due to the fact that in this use case, the system can charge as well as discharge thermal energy from the grid and is thus bi-directional.
5. Discussion
The outcome of the uses cases show that the calculated SRI provides a clear result in regard to the load shifting potential of a building and its interaction with the grid. It thus delivers one single number per grid type, which can be used to depict the potential interaction of the various energy carriers of the building with the respective energy networks (and subsequently with other buildings). It can also be used to assess the potential of the building to interact with the energy markets. The SRI thus provides a quantitative assessment, highlighting that the building either does not at all interact with the grid (SRI 0), that the building can shift its own energy demand based on the requirements of the grid and thus take energy from the grid on demand (SRI near 1) or that the building can charge and discharge its own energy demand and that of a similar building thus taking energy from the grid and shifting energy back to the grid (SRI near 2).
The methodology could similarly be applied to any other building use case, with the prerequisite that the building has one or more active storage systems (otherwise the SRI is by default 0) and that these storage systems can be actively managed by a BMS. If the building generates its own energy (e.g., by means of renewable energy) and that energy can be stored and shifted to the grid, then the energy sources can be assessed based on the load profiles as outlined in Equations (4)–(9) and Figure 8. The SRI always needs to be calculated per energy grid (i.e., electrical, thermal, gas). Whilst any additional grid can be added, it is not useful to combine the SRI across the various grids, as this would not provide a meaningful answer. The fact that one SRI is calculated per energy type is an inherent advantage, as buildings with no connection to the grid (for example buildings with no connection to a thermal network) are not disadvantaged (the SRI would then show not available). However, if there is a grid available and the building is not actively engaging with the grid, then the SRI is 0.
The time period could theoretically be determined by the respective regulations, i.e., to define if a specific storage is required for one day or one season. This could also be viewed differently for different energy sources. Thus a specific time period could be defined for a specific energy source (e.g., 1 day for electricity; 1 week for thermal energy and 1 year for gas) making the SRI comparable.
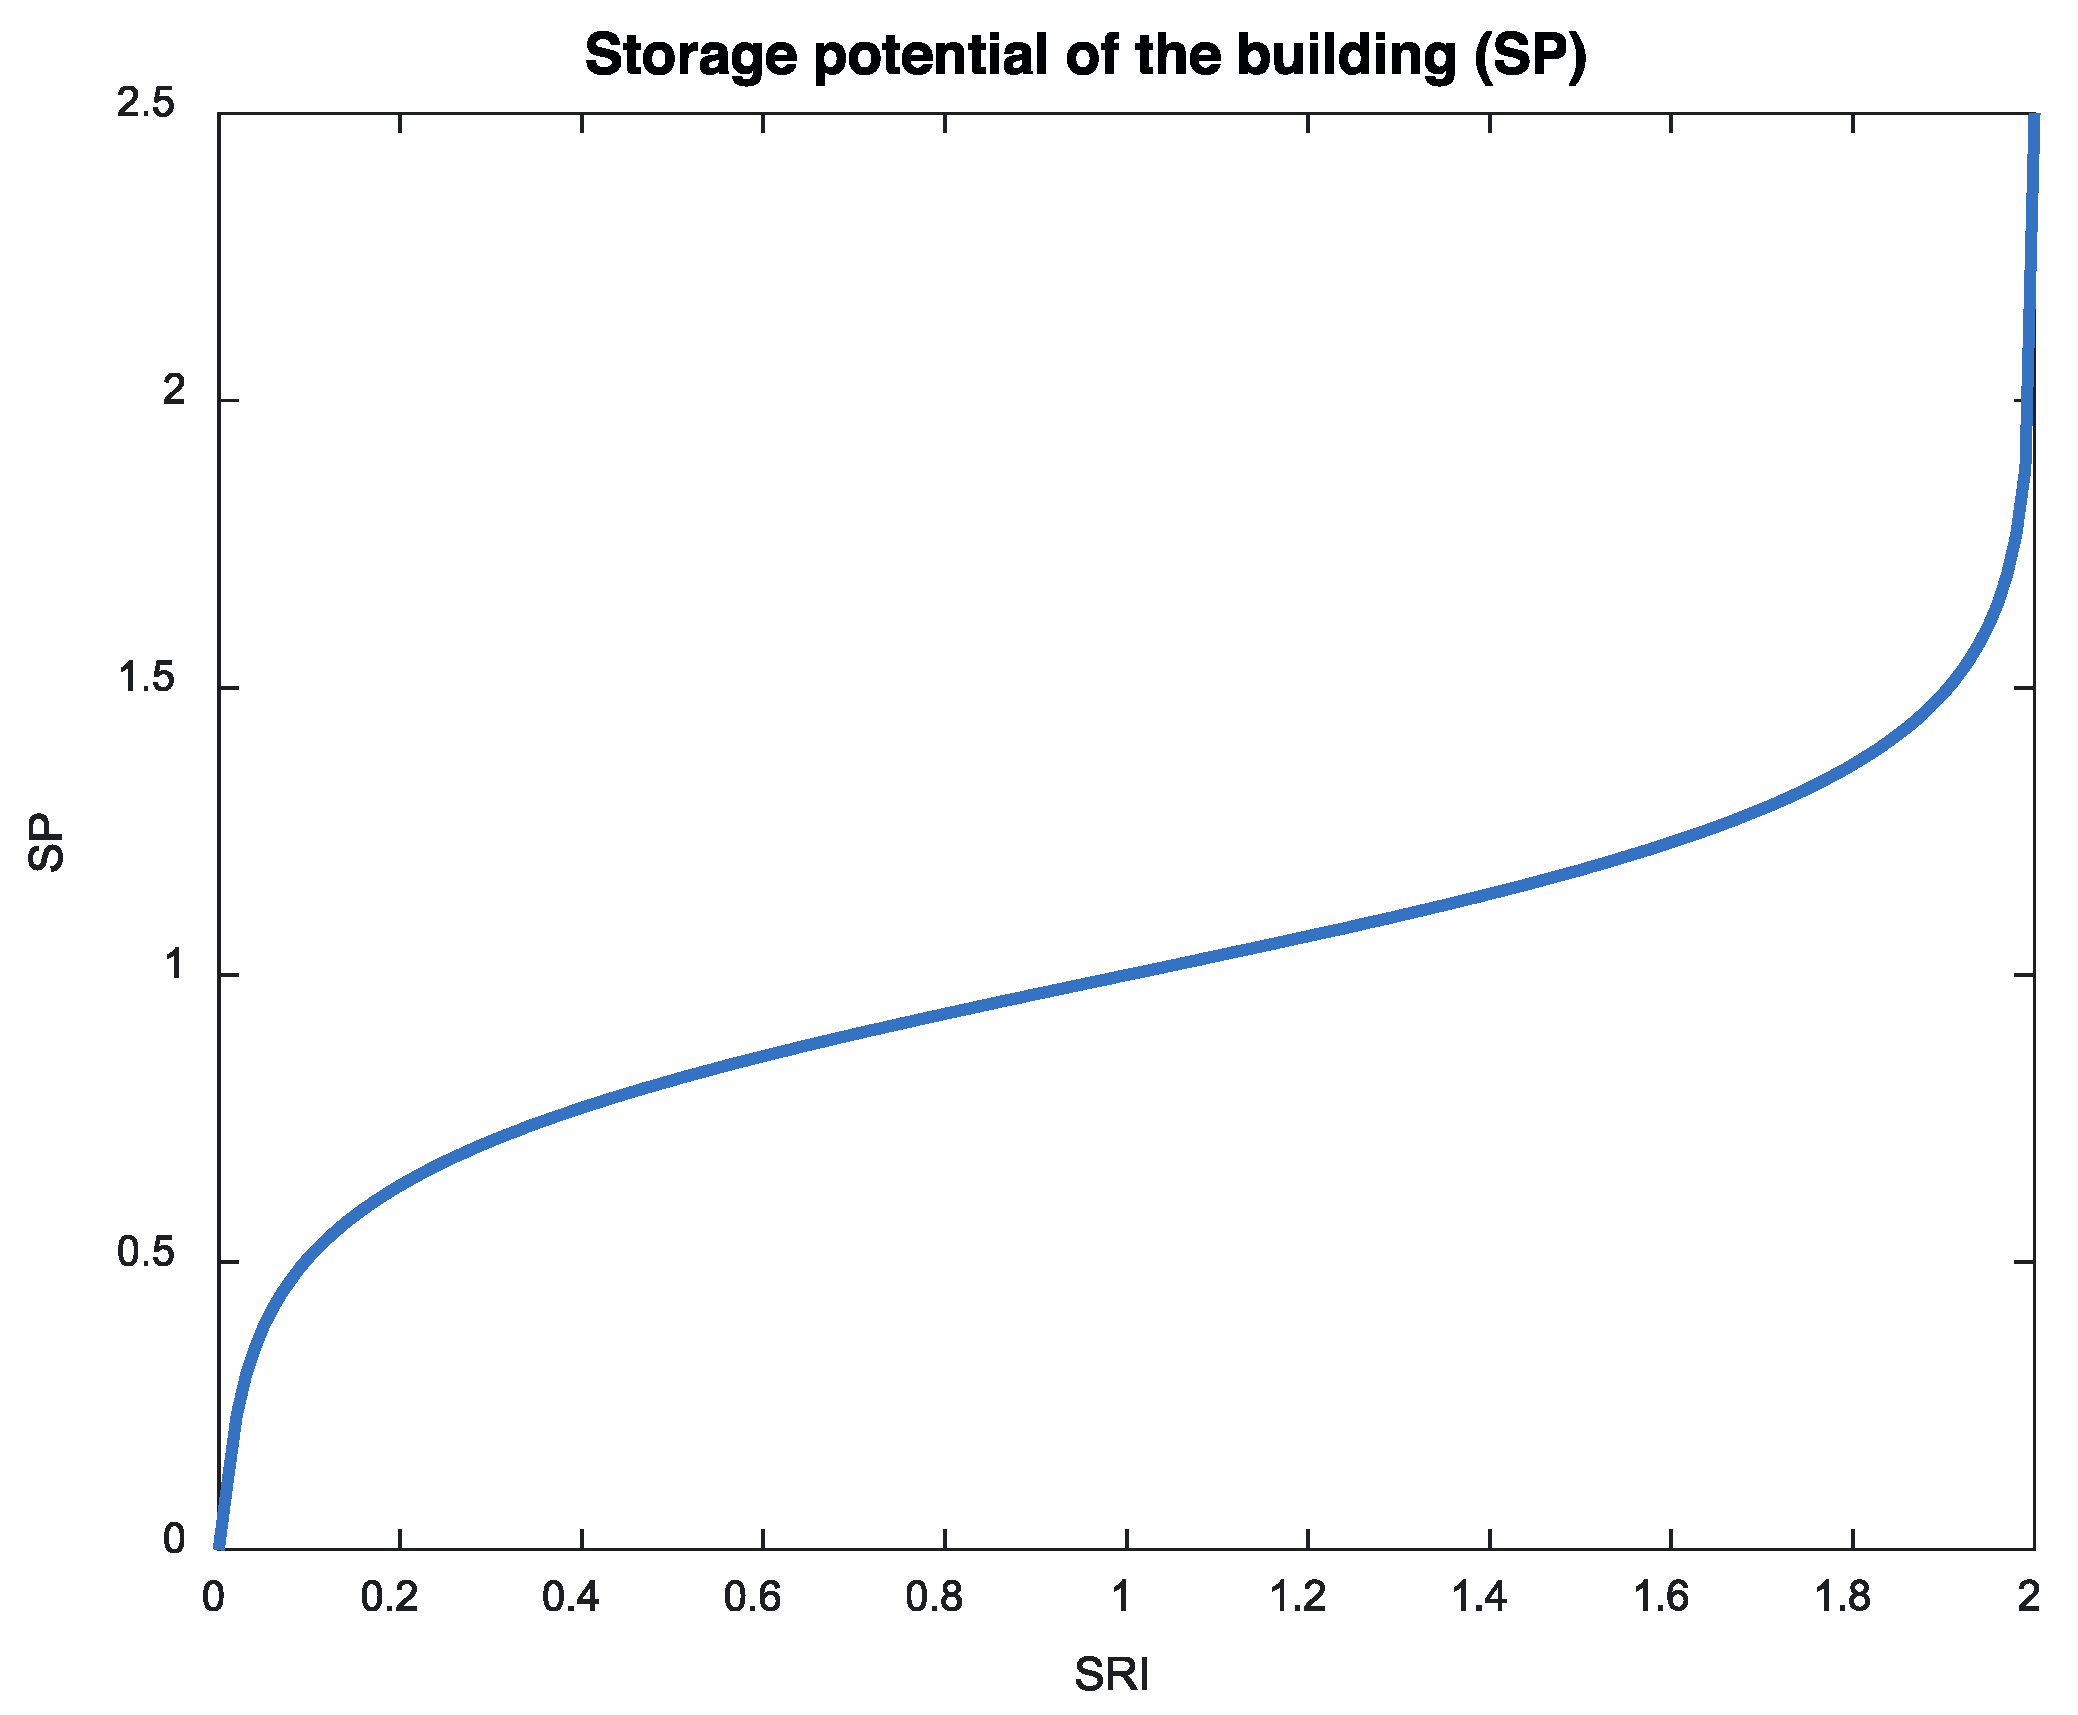
In order to assess the relationship of the storage capacity to the energy demand, the function could be inversed as shown in Figure 9 and Equation (16). This could be useful for an assessment of a whole building quarter or district as it provides the view from the system perspective of the energy provider.
With the individual coefficients as follows:
- SP
- Storage potential of the building (Relationship of SC/EB; dimensionless)
Overall, there are several key advantages of providing a qualitative assessment for the SRI as proposed in this article: One of the most important aspects is that the methodology builds on already existing and well-established assessments and provides only an add-on, as existing quantitative information is used to calculate the SRI (see Figure 2). The calculation can thus be included in the existing EPC systems of the member states and planners can calculate the SRI already during the design phase of the building in addition to other energy related indicators that already need to be provided when applying for a building permit. The input data for the storage characteristics that would be required at this stage could be supplied by the technology providers. This would avoid having potentially costly assessments, based on a series of qualitative measures, which would need to be carried out by accredited assessors once the building is operational as currently proposed in the template for the SRI assessments [11]. The SRI calculation as proposed in this article can be used to serve as a planning aid for other applications e.g., to assess Smart Grid and Smart Market strategies if the indicator is made available for whole districts or cities. Furthermore, it does not reward an unnatural proportion of the storage capabilities of the building towards the grids. It does however consider the efficiency of the energy transfer and the increase of the SRI is within a meaningful range a maximum. One of the key advantages of the proposed SRI compared to a qualitative assessment is that there is no specific state of the art in terms of technical systems required for the methodology to be applied. This means that (a) it can be avoided that the SRI is becoming meaningless once the technology advances and (b) that the indicator cannot be used to evaluate how many services are sold, if certain technologies are installed or how many smart Apps are included. Thus, the SRI is limited to the bare essentials and is not at risk of reaching the highest category only with paid services. The proposed indicator can also be used within the framework of future research proposals, as the potential pilot projects can be rated based on their “grid friendliness” in addition to impacts on energy efficiency and renewable energy integration.
Even though the methodology offers a series of advantages, there are several limits, that need to be taken into account: For one, the methodology does not consider the efficiency of the smart grid as it only considers the interaction of the building with the network. It must also be noted, that neither the energy efficiency of the building nor the building systems are assessed as part of the SRI, as this is already an inherent part of the current EPCs. If the building offers storage systems for the same type of energy within the same building, then those must be considered in a greatly simplified manner. In addition, the methodology only considers the fact, that a BMS is available in the building and it assumes that a user, energy and/or market-oriented function is defined within the BMS. This subsequently means that essential information (e.g., energy use of certain systems) related to the user is considered as standard in this model. One of the key drawbacks of the methodology is however the fact that currently temporary storage capabilities cannot be assessed (e.g., batteries in e-mobility systems such as cars or bikes that only serve as temporary storage for the building). This could be an opportunity for a further development of the SRI. Another aspect that could be further developed would be a cost assessment, which is currently not part of the proposed methodology.
6. Conclusions
The Smart Readiness Indicator (SRI) as outlined in the latest amendment of the Energy Performance of Buildings Directive (EPBD) is considered to be a key indicator to:
“…measure the capacity of buildings to use information and communication technologies and electronic systems to adapt the operation of buildings to the needs of the occupants and the grid and to improve the energy efficiency and overall performance of buildings…”.[10]
With the European legislation coming into force in the next years, a sound methodology for the calculation of the SRI must be developed. Whilst a template for a rather qualitative procedure already exists [11], this article outlines a quantitative approach based on the load shifting potential and subsequent active interaction of a building with a grid.
One of the key advantages of this approach is the usability and applicability with data that is already being calculated as part of the EPCs, which are mandatory in the member states. The proposed SRI does not include the efficiency of the building nor of the technical building systems, as this is already part of the assessments currently in place. Whilst the capability of the interaction of the building with the user as well as the capability of efficient energy management is not explicitly addressed, these aspects are inherently covered as the active interaction of any building with the grids necessitates the integration of a BMS. The methodology follows in logic the input data already applied in the current EPC and only needs additional input data related to the storage system and the potential to interact with the respective grids. The application of the proposed methodology in a series of use cases outlines that it can be applied to a wide variety of building types. The methodology is future proof in a sense that it is equally applicable for current as well as for innovative technologies that are yet to be implemented. In addition it can also be used to assess the load shifting capabilities of building quarters or districts to support energy providers in their grid developments.
It is shown that the methodology can provide an adequate framework for a quantitative assessment of the load shifting potential of buildings, which can be integrated into the calculations for the current EPC. The proposed approach thus complements and supports the development and implementation of the Smart Readiness Indicator in the Member States.
Author Contributions
Author D.Ö. contributed mainly to the conceptualization, methodology, writing of the original draft, review and editing. Author T.M. contributed mainly to the development of the methodology, the mathematical equations, the analysis and the writing of the original draft.
Funding
This research received no external funding.
Acknowledgments
Supported by the University of Natural Resources and Life Sciences, Vienna Open Access Publishing Fund.
Conflicts of Interest
The authors declare no conflict of interest.
References
- European Commission. COM(2011) 112 Final. A Roadmap for Moving to a Competitive Low Carbon Economy in 2050; European Commission: Brussels, Belgium; Luxembourg, 2011. [Google Scholar]
- European Commission. Policies, Information and Services, Energy/Topics/Buildings/Energy Efficiency/Buildings. Available online: https://ec.europa.eu/energy/en/topics/energy-efficiency/buildings (accessed on 10 March 2019).
- European Commission. COM(2016) 763 Final. Accelerating Clean Energy Innovation; European Commission: Brussels, Belgium; Luxembourg, 2016. [Google Scholar]
- European Commission. COM(2016) 860 Final, Annex 1. Accelerating Clean Energy in Buildings; European Commission: Brussels, Belgium; Luxembourg, 2016. [Google Scholar]
- European Commission—Fact Sheet; Towards Reaching the 20% Energy Efficiency Target for 2020, and Beyond. European Commission Press Release. 1 February 2017. Available online: http://europa.eu/rapid/press-release_MEMO-17-162_en.htm (accessed on 10 March 2019).
- Allouhi, A.; El Fouih, Y.; Kousksou, T.; Jamil, A.; Zeraouli, Y.; Mourad, Y. Energy consumption and efficiency in buildings: Current status and future trends. J. Clean. Prod. 2015, 109, 118–130. [Google Scholar] [CrossRef]
- Directive 2012/27/EU of the European Parliament and of the Council of 25 October 2012 on Energy Efficiency; L315/1-56; Official Journal of the European Union: Brussels, Belgium, 2012.
- Directive 2009/28/EC of the European Parliament and of the Council of 23 April 2009 on the Promotion of the Use of Energy from Renewable Sources; L140/16-62; Official Journal of the European Union: Brussels, Belgium, 2009.
- Directive 2002/91/EU of the European Parliament and of the Council of 16 December 2002 on the Energy Performance of Buildings; L1/65; Official Journal of the European Union: Brussels, Belgium, 2003.
- Directive (EU) 2018/844 of the European Parliament and of the Council of 30 May 2018 Amending Directive 2010/31/EU on the Energy Performance of Buildings Directive 2012/27/EU on Energy Efficiency; L156/75; Official Journal of the European Union: Brussels, Belgium, 2018.
- Verbeke, S.; Ma, Y.; Van Tichelen, P.; Bogaert, S.; Gómez Oñate, V.; Waide, P.; Bettgenhäuser, K.; Ashok, J.; Hermelink, A.; Offermann, M.; et al. Support for Setting Up a Smart Readiness Indicator for Buildings and Related Impact Assessment, Final Report; Study Accomplished under the Authority of the European Commission DG Energy 2017/SEB/R/1610684; Vito NV: Mol, Belgium, 2018. [Google Scholar]
- United Nations Climate Change. ‘Kyoto Protocol—Targets for the First Commitment Period’. Available online: https://unfccc.int/process/the-kyoto-protocol (accessed on 5 October 2018).
- Directive 2010/31/EU of the European Parliament and of the Council of 19 May 2010 on the Energy Performance of Buildings (Recast); L153/13; Official Journal of the European Union: Brussels, Belgium, 2010.
- Eurostat. ‘Greenhouse Gas Emissions Statistics—Emission Inventories’. Data from June 2018. Available online: https://ec.europa.eu/eurostat/statistics-explained/index.php/Greenhouse_gas_emission_statistics (accessed on 5 October 2018).
- Atanasiu, B.; Despret, C.; Economidou, M.; Maio, J.; Nolte, I.; Rapf, O. Europe’s Buildings under the Microscope, A Country-by-Country Review of the Energy Performance of Buildings; Buildings Performance Institute Europe (BPIE): Bruxelles, Belgium, 2011; ISBN 9789491143014. [Google Scholar]
- Aichele, C.; Doleski, O.D. Smart Markt, Vom Smart Grid Zum Intelligenten Energiemarkt; Springer Vieweg: Wiesbaden, Germany, 2014. [Google Scholar] [CrossRef]
- Madsen, H.; Holst, J. Estimation of continuous-time models for the heat dynamics of a building. Energy Build. 1995, 22, 67–79. [Google Scholar] [CrossRef]
- Andersen, K.K.; Madsen, H.; Hansen, L.H. Modelling the heat dynamics of a building using stochastic differential equations. Energy Build. 2000, 31, 13–24. [Google Scholar] [CrossRef] [Green Version]
- Bacher, P.; Madsen, H. Identifying suitable models for the heat dynamics of buildings. Energy Build. 2011, 43, 1511–1522. [Google Scholar] [CrossRef] [Green Version]
- Le Dréau, J.; Heiselberg, P. Energy flexibility of residential buildings using short term heat storage in the thermal mass. Energy 2016, 111, 991–1002. [Google Scholar] [CrossRef]
- Xu, Z.B.; Guan, X.H.; Jia, Q.S.; Wu, J.; Wang, D.; Chen, S.Y. Performance Analysis and Comparison on Energy Storage Devices for Smart Building Energy Management. IEEE Trans. Smart Grid 2012, 3, 2136–2147. [Google Scholar] [CrossRef]
- Berckmans, G.; Messagie, M.; Smekens, J.; Omar, N.; Vanhaverbeke, L.; Van Mierlo, J. Cost Projection of State of the Art Lithium-Ion Batteries for Electric Vehicles up to 2030. Energies 2017, 10, 1314. [Google Scholar] [CrossRef]
- Georgakarakos, A.D.; Mayfield, M.; Hathway, E.A. Battery Storage Systems in Smart Grid Optimised Buildings. Energy Procedia 2018, 151, 23–30. [Google Scholar] [CrossRef]
- Wulf, C.; Linßen, J.; Zapp, P. Review of Power-to-Gas Projects in Europe. Energy Procedia 2018, 155, 367–378. [Google Scholar] [CrossRef]
- Kohlhepp, P.; Hagenmeyer, V. Technical Potential of Buildings in Germany as Flexible Power-to-Heat Storage for Smart-Grid Operation. Energy Technol. 2017, 5, 1084–1104. [Google Scholar] [CrossRef] [Green Version]
- Lichtenegger, K.; Moser, A.; Muschick, D.; Reiterer, D.; Wöss, D.; Leitner, A. Einbindung von dezentralen Einspeisern in Wärmenetze, der Prosumer am Wärmemarkt. AEE Arbeitsgemeinschaft Erneuerbare Energie NÖ-Wien. Wien. 2018. Available online: http://www.aee-now.at/cms/fileadmin/downloads/projekte/bine2/Publikationen/Bine2plus%20Leitfaden%20final.pdf (accessed on 10 March 2019).
- Lund, H.; Ostergaard, P.A.; Chang, M.; Werner, S.; Svendsen, S.; Sorknaes, P.; Thorsen, J.E.; Hvelplund, F.; Mortensen, B.O.G.; Mathiesen, B.V.; et al. The status of 4th generation district heating: Research and results. Energy 2018, 164, 147–159. [Google Scholar] [CrossRef]
- Pooranian, Z.; Abawajy, J.H.; Vinod, P.; Conti, M. Scheduling Distributed Energy Resource Operation and Daily Power Consumption for a Smart Building to Optimize Economic and Environmental Parameters. Energies 2018, 11, 1348. [Google Scholar] [CrossRef]
- Degha, H.E.; Laallam, F.Z.; Said, B. Intelligent context-awareness system for energy efficiency in smart building based on ontology. Sustain. Comput. Inform. Syst. 2019, 21, 212–233. [Google Scholar] [CrossRef]
- Vigna, I.; Pernetti, R.; Pasut, W.; Lollini, R. New domain for promoting energy efficiency: Energy Flexible Building Cluster. Sustain. Cities Soc. 2018, 38, 526–533. [Google Scholar] [CrossRef]
- Rocha, P.; Siddiqui, A.; Stadler, M. Improving energy efficiency via smart building energy management systems: A comparison with policy measures. Energy Build. 2015, 88, 203–213. [Google Scholar] [CrossRef] [Green Version]
- Kolokotsa, D. The role of smart grids in the building sector. Energy Build. 2016, 116, 703–708. [Google Scholar] [CrossRef] [Green Version]
- Moseley, P. EU Support for Innovation and Market Uptake in Smart Buildings under the Horizon 2020 Framework Programme. Buildings 2017, 7, 105. [Google Scholar] [CrossRef]
- SETIS Strategic Energy Technologies Information System, 5th SET Plan Conference 2011. Available online: https://setis.ec.europa.eu/set-plan-conferences/5th-set-plan-conference-2011 (accessed on 10 March 2019).
- United Nations, Department of Economic and Social Affairs, Population Division. World Urbanization Prospects, the 2009 Revision; ESA/P/WP/215; United Nations: New York, NY, USA, 2010. [Google Scholar]
- Österreicher, D. A Methodology for Integrated Refurbishment Actions in School Buildings. Buildings 2018, 8, 42. [Google Scholar] [CrossRef]
- Österreicher, D. The Role of Smart Buildings for Energy Efficiency. Smart Buildings for a Greener Europe: Emerging Policy and Practice. Concerted Action Energy Performance of Buildings. La Valetta, Malta. 14.02.2017. Available online: https://www.epbd-ca.eu/wp-content/uploads/2017/02/2.-Doris-the-role-of-smart-buildings_170214.pdf (accessed on 26 September 2018).
Figure 1.
General methodology: development of building-energy concepts in a 4-step approach, adapted from authors’ graphic from [36].
Figure 1.
General methodology: development of building-energy concepts in a 4-step approach, adapted from authors’ graphic from [36].

Figure 2.
Smart Readiness Indicator (SRI) calculation development.

Figure 3.
System boundaries of SRI calculation.
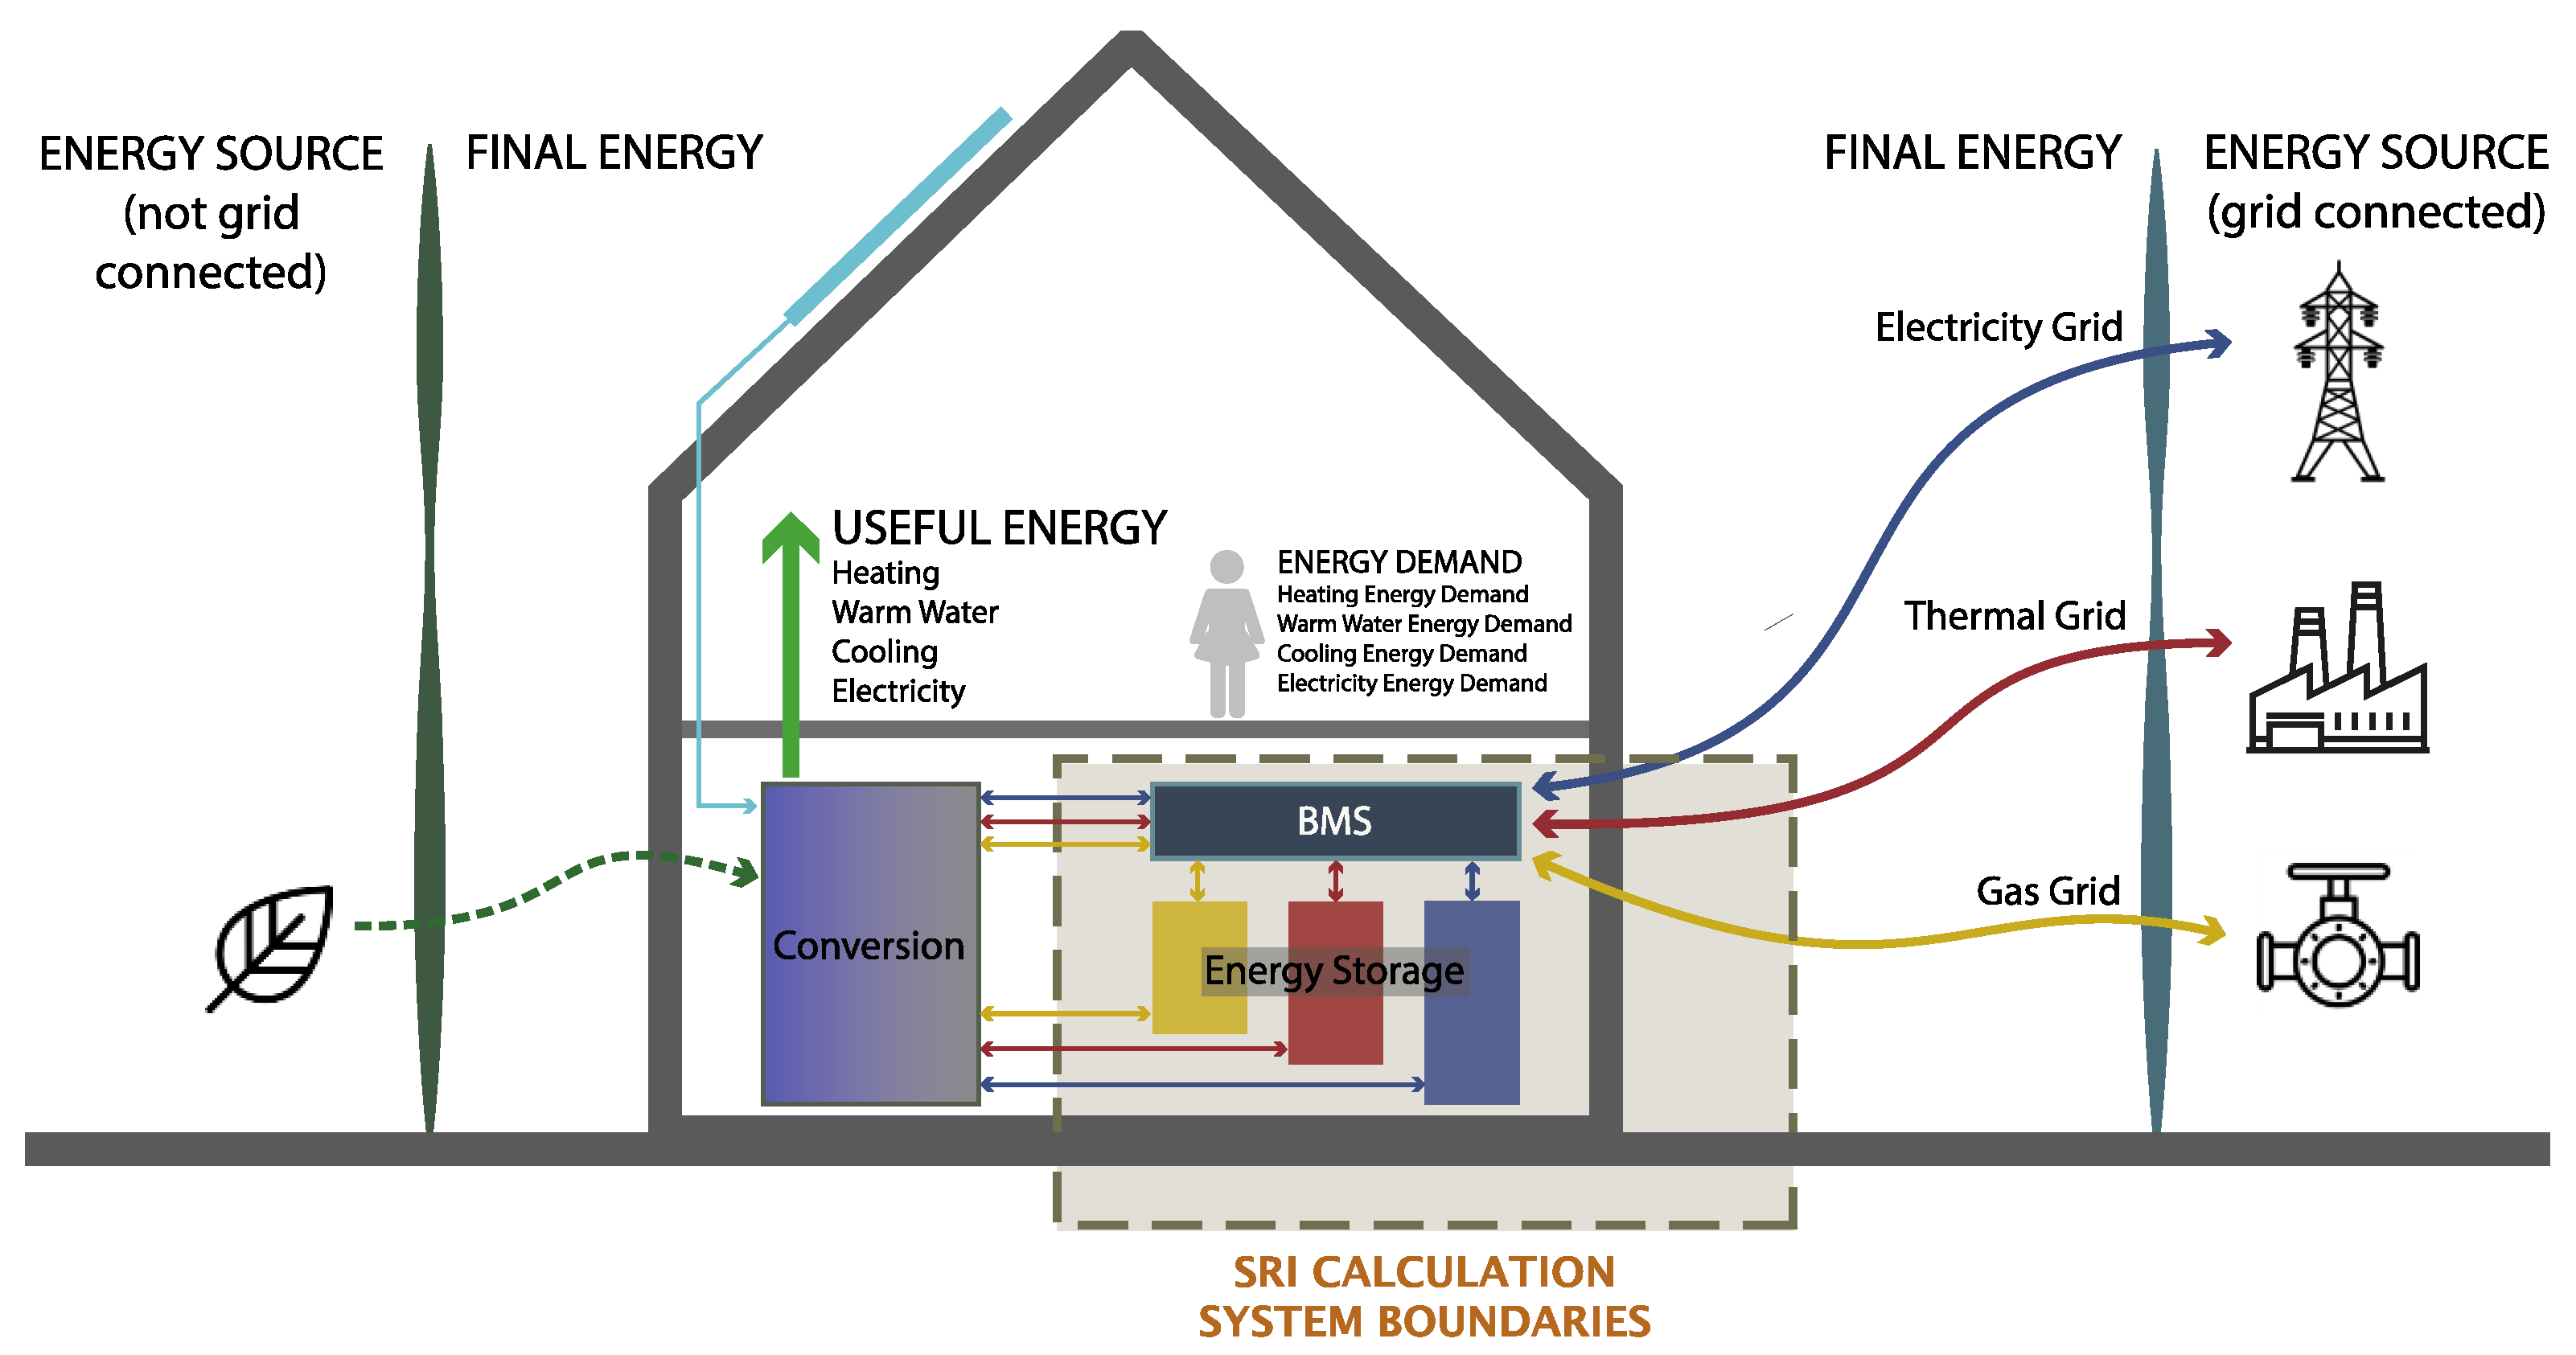
Figure 4.
Example for SRI with activity coefficient 1.

Figure 5.
Example for SRI with activity coefficient 2.

Figure 6.
Load profile for the assumed function of the storage charge and discharge model.

Figure 7.
SRI use case matrix showing input data for use cases 1, 2, 3 and 4.

Figure 8.
SRI results showing activity coefficients and subsequent results for use cases 1, 2, 3 and 4.
Figure 8.
SRI results showing activity coefficients and subsequent results for use cases 1, 2, 3 and 4.

Figure 9.
Use of the SRI to assess the load shifting potential of buildings.

© 2019 by the authors. Licensee MDPI, Basel, Switzerland. This article is an open access article distributed under the terms and conditions of the Creative Commons Attribution (CC BY) license (http://creativecommons.org/licenses/by/4.0/).
Share and Cite
MDPI and ACS Style
Märzinger, T.; Österreicher, D. Supporting the Smart Readiness Indicator—A Methodology to Integrate A Quantitative Assessment of the Load Shifting Potential of Smart Buildings. Energies 2019, 12, 1955. https://doi.org/10.3390/en12101955
AMA Style
Märzinger T, Österreicher D. Supporting the Smart Readiness Indicator—A Methodology to Integrate A Quantitative Assessment of the Load Shifting Potential of Smart Buildings. Energies. 2019; 12(10):1955. https://doi.org/10.3390/en12101955
Chicago/Turabian StyleMärzinger, Thomas, and Doris Österreicher. 2019. "Supporting the Smart Readiness Indicator—A Methodology to Integrate A Quantitative Assessment of the Load Shifting Potential of Smart Buildings" Energies 12, no. 10: 1955. https://doi.org/10.3390/en12101955
Note that from the first issue of 2016, this journal uses article numbers instead of page numbers. See further details here.