Real-Time Reliability Monitoring of DC-Link Capacitors in Back-to-Back Converters


1
Electrical Engineering Department, Majmaah University, Al-Majmaah 11952, Saudi Arabia
2
Electrical Engineering Department, Assiut University, Assiut 71515, Egypt
3
Electrical and Electronics Engineering Technology Dept., Yanbu Industrial College, Yanbu Al Bahr 46452, Saudi Arabia
*
Author to whom correspondence should be addressed.
Energies 2019, 12(12), 2369; https://doi.org/10.3390/en12122369
Submission received: 17 May 2019
/
Revised: 17 June 2019
/
Accepted: 18 June 2019
/
Published: 20 June 2019
(This article belongs to the Special Issue Control in Power Electronics)
Abstract
:Electrolytic capacitors have large capacity, low price, and fast charge/discharge characteristics. Therefore, they are widely used in various power conversion devices. These electrolytic capacitors are mainly used for temporary storage and voltage stabilization of DC energy and have recently been used in the renewable energy field for linking AC/DC voltage and buffering charge/discharge energy. However, electrolytic capacitors continue to be disadvantageous in their reliability due to their structural weaknesses due to the use of electrolytes and very thin oxide and dielectric materials. Most capacitors are considered a failure when the capacitance has changed by 25% of its initial value. Accurate and fast monitoring or estimation techniques are essential to be used with low cost and no extra hardware. In order to achieve these objectives, an online, reliable, and high-quality technique that continuously monitors the DC-link capacitor condition in a three-phase back-to-back converter is proposed. In this paper, the particle swarm optimization (PSO)-based support vector regression (PSO-SVR) approach is employed for online capacitance estimation based on sensing or deriving the capacitor current. Because the SVR performance alone severely depends on the tuning of its parameters, the PSO algorithm is used, which enables a fast online-based approach with high-parameter estimation accuracy. Experimental results are provided to verify the validity of the method.
1. Introduction
Nowadays, one of the most important parts of power electronic systems is the electrolytic capacitors, which are used to smooth voltage because it has high capacitance for its size and low price. The high energy density (J/cm3) characteristics give it special advantages for smoothing voltage oscillation and pulse discharge circuitry. On the other hand, a disadvantage is its short lifetime, which is considered the shortest in power electronic circuits. At an ambient temperature of 25 ºC and under the rated conditions, electrolytic capacitors’ failure is highest among all capacitor types [1,2]. Figure 1 shows the failure ratio of different parts in power electronics systems [3]. The wear-out process of electrolytic capacitors is due to the evaporation and deterioration of the electrolyte through the seals. Therefore, an oscillation of the capacitor’s internal equivalent series resistance (ESR) can occur [4,5,6,7].
The aluminium electrolytic capacitor consists of a cathode aluminium foil, an anode foil, and a separator plate wound together and soaked with electrolyte as shown in Figure 2. The main components of the liquid electrolyte are solvent, solute, such such as ethylene glycol and ammonium borate, water, corrosion inhibitors, and hydrogen absorbers. In case of heating, the capacitor internal temperature increases and rushes evaporation of the capacitor’s electrolyte. Therefore, the volume of the electrolyte is reduced so that the etched tunnels are not fully filled due to the electrolyte evaporation. Hence, the capacitance decreases as a result of the electrolyte volume reduction. The evaporation process will be higher whenever the ambient temperature increases; then, the capacitance value decreases and the lifetime deteriorated more.
The normal lifetime for the electrolytic capacitors operating at maximum allowed core temperature are typically 1000 to 10,000 hours, which is almost 1 year maximum. This lifetime is short for most of power electronics systems and makes it the weakest part [8]. Therefore, a wearing-out detection method of the electrolytic capacitor is essential for protective maintenance of the power electronics circuit.
The aluminum electrolytic capacitor consists of two aluminum sheets and an electrolytic solution as shown in Figure 2. During the process of forming a capacitor, an electrochemical reaction is generated on the surface of the anode through a molding process, and as a result, an oxide layer is formed to prevent the two metal plates from contacting each other. The effective cross-sectional area can be increased by etching the anode surface during the manufacturing process. The two separate aluminum plates are rolled into a cylindrical shape to minimize volume. Through this manufacturing process, the thickness between the poles can be thinned and the cross-sectional area can be made thick, and as a result, the capacity per unit volume of the capacitor can be increased. Also shown also in Figure 2 is an oxide layer is formed on the cathode surface through a natural chemical reaction between the electrolyte and aluminum. Compared to the thickness of the anode surface oxidation layer formed by the manufacturing process, the capacitance on the cathode side is larger than that on the anode side. Therefore, since the anode and cathode capacitors can be regarded as connected in series, the total capacitance becomes similar to the capacitance value of the anode. Equivalent series resistance (Rs) represents the sum of all the resistances of the electrolyte, oxide layer, electrode, lead, and connection. The equivalent inductance (Ls) is the inductance formed by winding the coil in a cylindrical shape, which can usually be ignored in the frequency range of the power converter. Thus, the equivalent circuit can be simplified in the form of a series connection of the resistor and the capacitor.
Due to the structural characteristics of the capacitor, the capacitor can be electrically modeled as a series connection of capacitors, resistors, and inductors [9]. The major eroding mechanisms in these capacitors are the leakage and deterioration of the electrolyte by vapor diffusion through the seals. Such deterioration causes a fluctuation of the capacitor’s internal ESR [10,11,12,13]. Several methods to estimate the deterioration status of the electrolytic capacitor have been proposed in the literature [14,15].
In [14], ESR was estimated by various methods such as fundamental wave, filter use, and complicated signal processing from voltage and current across the capacitor. However, since there is no sensor for measuring the charge/discharge current of the capacitor in the power conversion device, there is a disadvantage that additional hardware must be added in order to implement the above method. In [15], the capacitance is estimated from the injected ripples on the DC-link, and the lifetime of the DC capacitor is determined without additional hardware.
In [9], ESR of the capacitor was estimated using only the DC voltage and the phase current sensor. However, in order to measure the rapid charge/discharge change of the voltage during the inverter switching period, A/D with a higher sampling frequency than the device is required. Reference [16] proposes ESR calculation technique by measuring both capacitor voltage and current. The disadvantage of this method is the effect of current sensor on the waveforms, which is unavoidable.
Recently, artificial intelligent and machine learning methods have been implemented widely for monitoring the DC-link capacitor’s condition. Capacitance estimation in back-to-back converters using machine learning techniques such as the artificial neural network (ANN) method has been investigated in [17]. To implement ANN-based methods and to ensure accurate capacitance estimation, the number of neurons and hidden layers should be large, which causes the process to take more time in the training stage. The support vector machine (SVM) is a powerful machine learning technique that implements structural risk minimization instead of the empirical risk minimization. It overcomes ANN prediction and classification problems, non-linear function problems, and loss functions [18]. Support vector regression (SVR) is also an efficient machine learning technique due to its accuracy, which is influenced by the parameter selection.
In this study, an improved real-time capacitance monitoring based on PSO and SVR, namely particle swarm optimization-based support vector regression (PSO-SVR), is proposed. The main idea is that the PSO algorithm is used to select an approximation of the three parameters of the SVR model. The proposed method is tested using a dataset of converter input and output power. The most important features about the proposed algorithm are 1) low cost, easy to implement in current industrial system, 2) no additional hardware is required, and 3) no complicated algorithm is required. A comparison is made between the proposed method and the SVR method. The experimental setup has been developed and analyzed to show the effectiveness of the proposed method.
2. Electrolytic Capacitor’s Degradation
The elements of ESR have characteristics that change in value depending on temperature and frequency. As the temperature increases, the polarization of the dielectric forming the electrolyte increases, and the mobility of the electrons increases, reducing the ESR. In addition, because the electrolyte expands thermally and the cross-sectional area increases, the equivalent series resistance decreases, and the capacitance increases. As the frequency increases, the loss due to the alignment of the polarized dipole increases, so the ESR decreases, and the capacitance tends to decrease slightly as the dielectric constant of the capacitor decreases [19,20]. Therefore, when using the ESR and capacitance value for the electrolytic capacitor diagnosis, it is necessary to consider the temperature and frequency characteristics to make accurate state diagnosis.
When the capacitor is charged/discharged, due to the charge/discharge current flowing, a loss due to the equivalent series resistance occurs and the temperature rises. When the temperature of the capacitor rises, the volume of the electrolyte increases. When the temperature rises above the rated value, the electrolyte leaks to the outside of the capacitor. When the temperature is room temperature, the amount of the electrolytic solution is reduced, and the cross-sectional area is reduced. The reduction of the electrolyte reduces the effective cross-sectional area, the equivalent series resistance increases, and the capacitance decreases.
As the ESR increases, the ripple voltage of the capacitor increases, which affects the control of the load and increases the power loss, thereby accelerating the temperature rise. When the capacitor is repeatedly charged/discharged, the electrolytic solution decreases due to this process, the capacitor deteriorates, and the capacitance decreases. Therefore, it is possible to judge the state of the capacitor by measuring the change of the capacitor ESR value. According to IEC 60384-4 [21], a general-grade electrolytic capacitor with a rated voltage of 160 V or more is judged to be faulty when the capacitance is reduced by more than 15% and the ESR is increased by more than three times [22].
The simplest and most inexpensive method of electrolytic capacitors studied to date is to determine the degree of deterioration from the magnitude of the ripple voltage across the capacitor. When the capacitor degrades, the ESR increases, and voltage ripple increases from the charge/discharge current. The degree of degradation of the capacitor can be determined from the amount of increase of the ripple [8,13]. However, since the influence of the load is included in addition to the deterioration information of the capacitor in the change of the ripple voltage, it is difficult to know exactly how much the capacitor is deteriorated.
3. PSO-SVR for Capacitor Condition Monitoring
This study aims to monitor the converter DC-link capacitor condition in back-to-back converters without removing the capacitor, using extra hardware, or injecting low-frequency voltage component to the DC-link voltage.
The basic idea of the proposed PSO-SVR method is to find a function or model that defines the relation between given DC-link voltage, grid voltages, grid currents, load voltages, load currents, and its corresponding capacitance is determined using a set of training data as shown in Figure 3. Through the offline training, a particular model is obtained to relate these inputs and output. The collected training sets are measured at different load posers, which are 1, 1.5, 2, 2.5, and 3 kW. This function is then used online to predict the output for the given inputs that are not included in the training set. Then, the capacitance can be calculated online with the input of the capacitor power. The modified PSO-SVR is used to estimate the capacitance, and since using SVR alone severely depends on the tuning of its parameters, the PSO algorithm is used, which enables a fast online-based approach with high parameter estimation accuracy. The training data are collected when the capacitance changed between 1950 to 3950 .
The SVR is an algorithm that estimates a function that predicts unknown mapping between a system’s l-dimensional inputs and real output using a series of training data. When the map is accurately constructed, the relation between the inputs and output is then used to predict the target output. The regression algorithm approximates the unknown desired function in the following form [23,24]:
where represents the weight vector and is the bias. These values are extracted from the available training data to determine the target function. The first step is to obtain both and to minimize the real data differences outside the insensitive region, which are determined by slack variables and . To minimize the empirical risk, the slack variables are applied as [25]
subject to
where is a cost function, is a constant determining the trade-off between minimizing training errors and minimizing the model complexity term , and is the allowable error. SVR reduces the error to zero if the penalty factor is very high. This option leads to a complex model. However, a low leads to high estimation errors.
The regression problem in (3) is then solved using dual multipliers [26]:
where and are Lagrange multipliers. Furthermore, is the kernel function that enables a dot product in high-dimensional feature space using low-dimensional space data input without calculating the function. The radial base function that is used in the framework is expressed as [27,28]
where σ is the RBF width.
The PSO method is a population-based search technique that starts with a population of random solutions [29]. Every solution within the swarm is called a particle [30]. The swarm is arbitrarily initialized and updated in each reiteration t to fully adapt the fitness function. The d-dimensional particle is characterized by its location vector , and its speed vector , . Each particle knows its best personal location and the entire population’s best global solution . The position of the population at iteration t is , ,, where is the population size. Each particle updates its location according to (6) and (7):
where (cognition factor) and (social learning factor) are constants, and are random values in the range , and is the speed weight at iteration . The constriction coefficients presented in [30] is used to set and :
where . In this paper, ; thus, . Location and speed boundaries are adjusted such that if a particle tries to pass the allowable boundaries, a limiting procedure brings it back within the permissible limit. If the best personal solution has a higher fitness than the current best global solution , then is equal to . The end points are determined when the best global solution results in a permissible fitness or when a predetermined number of iterations is achieved.
The PSO is mainly used to tune and optimize the SVR parameters. A detailed description divided into steps is as follows:
Step 1: Initialize. The initial value of the parameter is established. The particles are set in the characteristics space. Each particle i is represented by xi = {, σ, ε}.
Step 2: Conformity assessment. Once the coding procedure is completed, three values of the , σ, and ε parameters are inserted in the SVR model to predict the problem. To avoid overuse, a cross-validation of K-fold (CV) is used in the training phase and a validity error is calculated. The training data points are selected as input variables and the current data are selected as output variables. First, the training datasets are entered into the proposed model.
Step 3: Update pbest. In the current iteration, if the physical condition value of particle i is greater than the physical condition value of pbesti, pbesti is replaced by xi.
Step 4: Update gbest. If the value of adjustment of pbesti exceeds the value of adjustment of gbest in the current iteration, gbest is replaced by pbesti.
Step 5: Update the speed. The velocity of each particle is calculated according to (6).
Step 6: Update your location. The position of each particle is calculated according to (7).
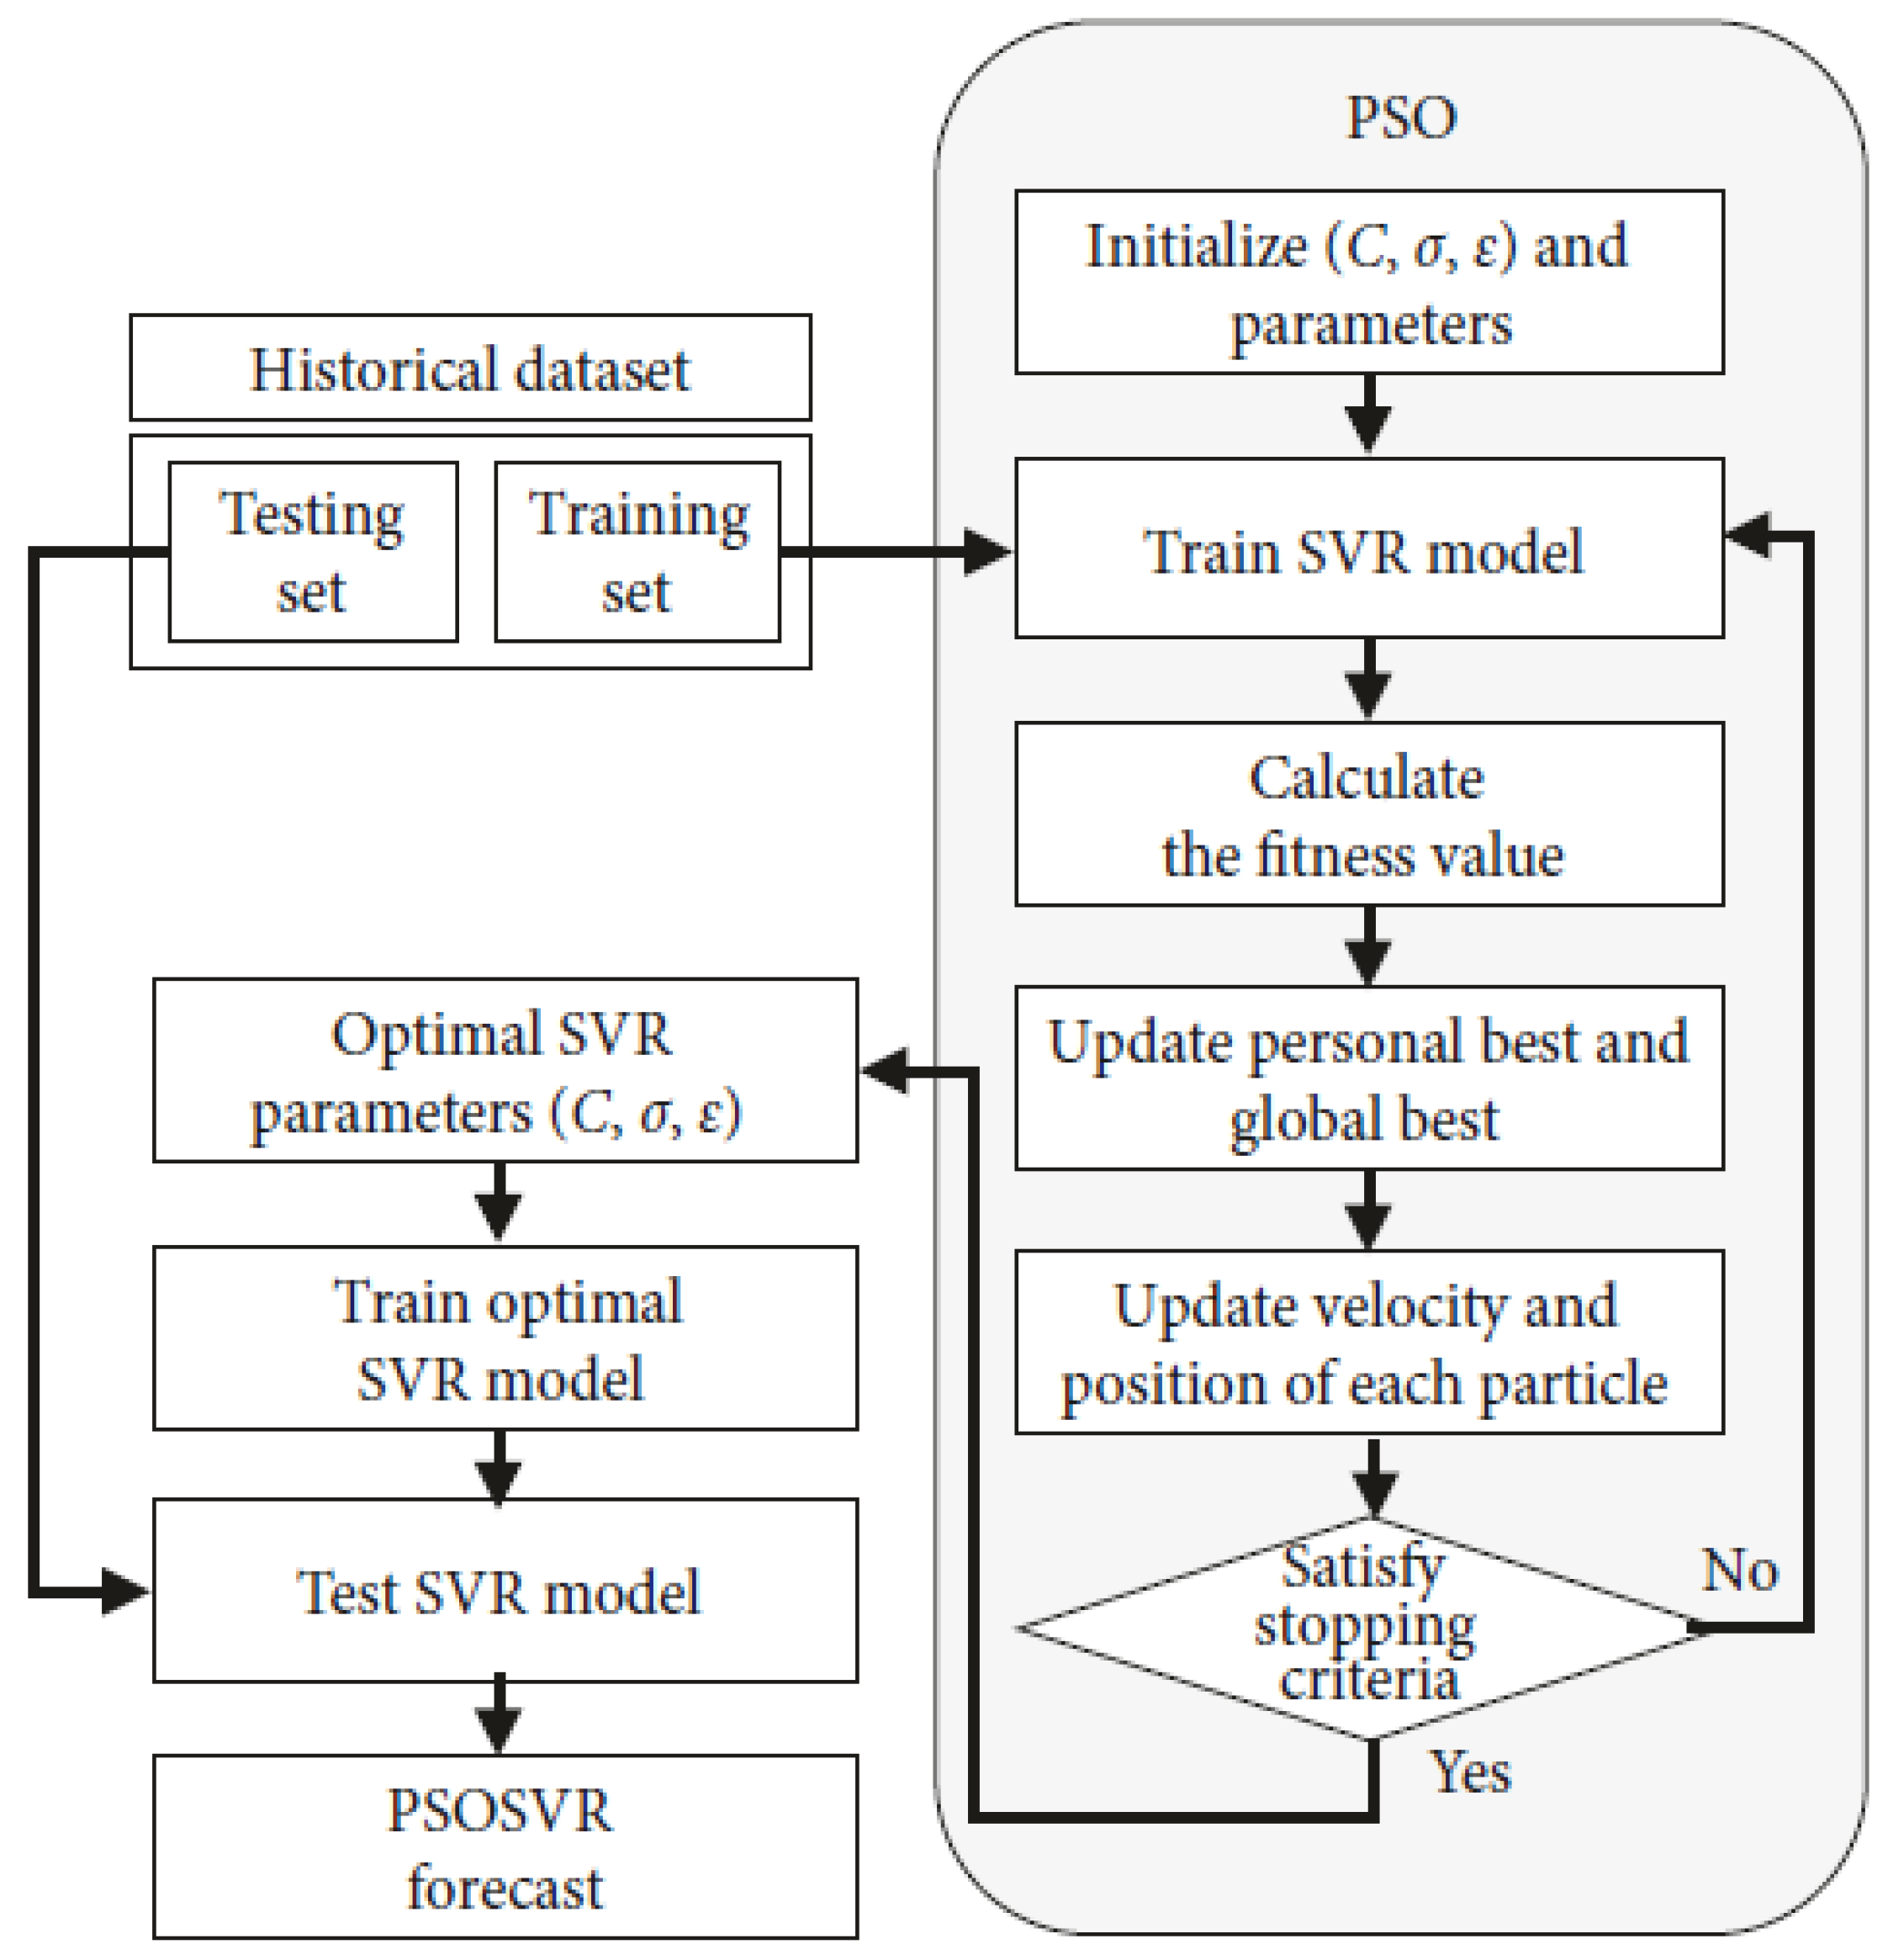
Step 7: Stop the criteria. The process is repeated in the order described above until the maximum iteration is reached. The framework of a PSO-SVR method is depicted in Figure 4 [31].
In order to find the coefficients in (10), parameters , , and are obtained from the PSO algorithm. With such different parameter types, a separate equation for each parameter is used to update a different inertial weight. The PSO-SVR method updates the inertial weight as follows:
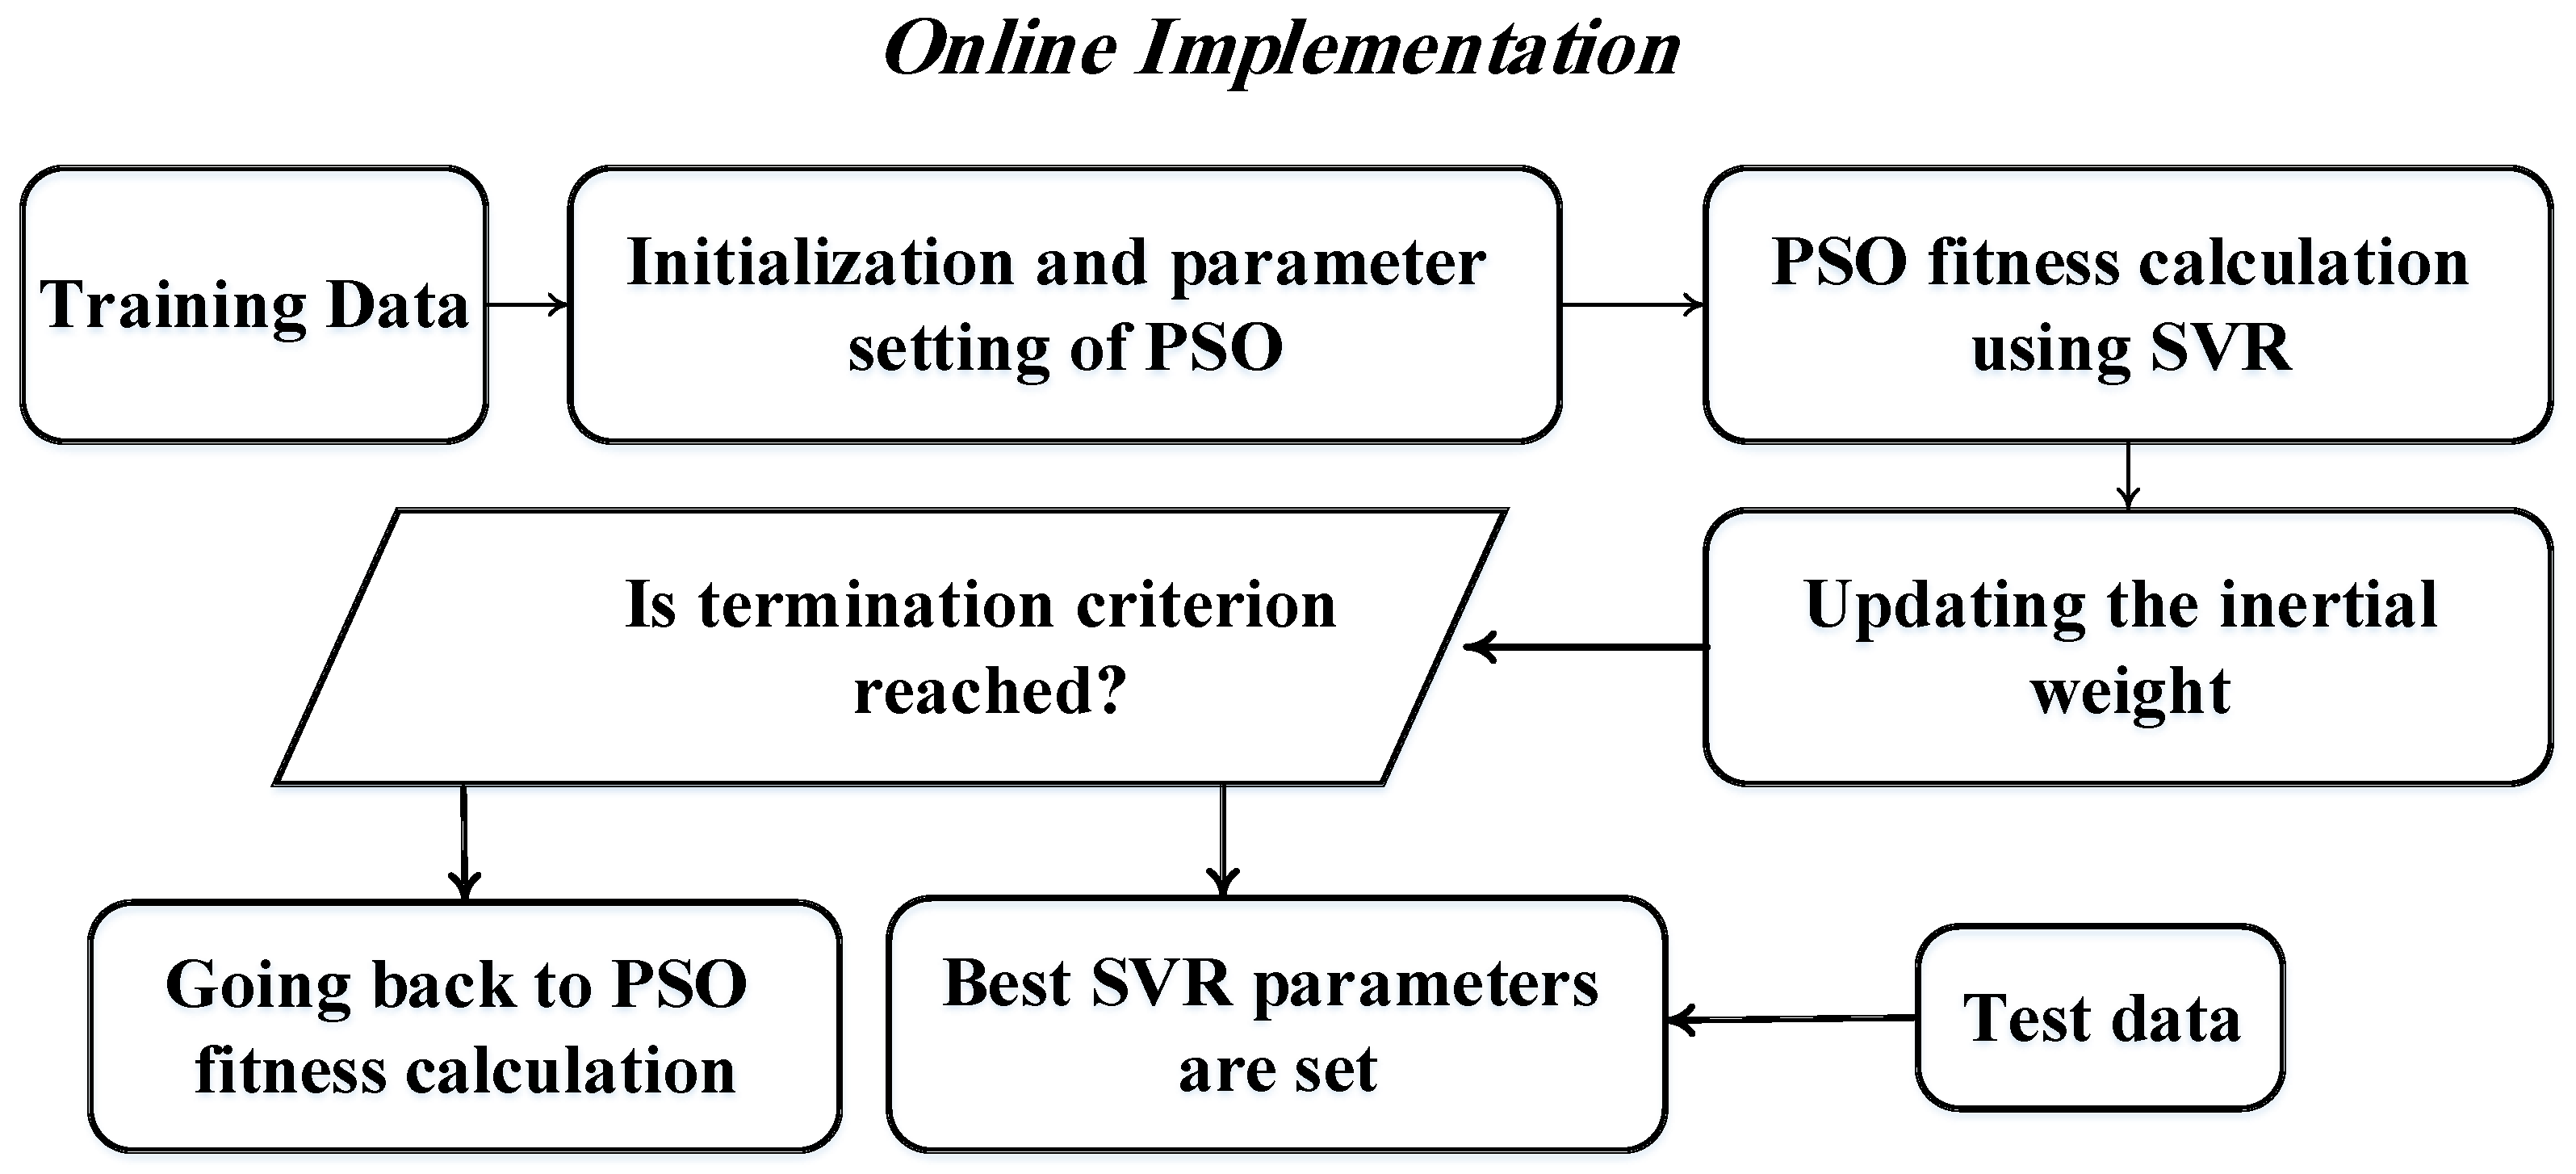
The summary of implementation process is shown in Figure 5. The main steps are as follows:
- (1)
- Generate offline data, which are the input and output information.
- (2)
- Initialize PSO. The P0 = {P01, P02,..., P0N} are randomly set, where N is the swarm population.
- (3)
- Train SVR using each particle as SVR parameters.
- (4)
- Calculate fitness, which is the root mean square error (RMSE) between the SVR prediction and output of test data.
- (5)
- Find personal and global best positions, and update weight.
- (6)
- Repeat steps until t reaches a set maximum number.
- (7)
- SVR prediction with optimal parameters obtained by PSO.
In the lab experiment, a capacitor bank consisting of five branches, that is, four parallel-connected capacitors of 500 and two series connection in one branch of 3900 , corresponding to the case A in Table 1, the initial capacitance is 3950 . It is assumed that the lifetime of this capacitor bank ends when its capacitance is reduced to 1950 . The training data are listed in Table 1, where and represent 1950 and 500 capacitors, respectively.
Each of these five samples corresponds to the RMS input voltage, current, and DC-link, respectively. Due to the different loading conditions of the AC/DC/AC converter, five sets of 5k samples are used under the load levels of 1 kW, 1.5 kW, 2 kW, 2.5 kW, and 3 kW. The capacitor is estimated periodically by monitoring the abovementioned variables.
Table 2 shows a list of the predicted and measured data for the tested capacitor set. The proposed method shows a superior performance with estimation error less than 0.15% in different conditions.
4. Experimental Results
The experimental setup was constructed on a reduced scale in the laboratory and its configuration is shown in Figure 6. The converter parameters are listed in Table 3. A high-performance DSP chip TMS320C33 was used as a main controller, which operates at a 33.3 MHz clock and is capable of 32-bit floating-point operation. The sampling rate of the current control loop is double the PWM frequency; that is, the sampling period is 100 . The space-vector modulation with symmetrical switching patterns was employed as a PWM strategy.
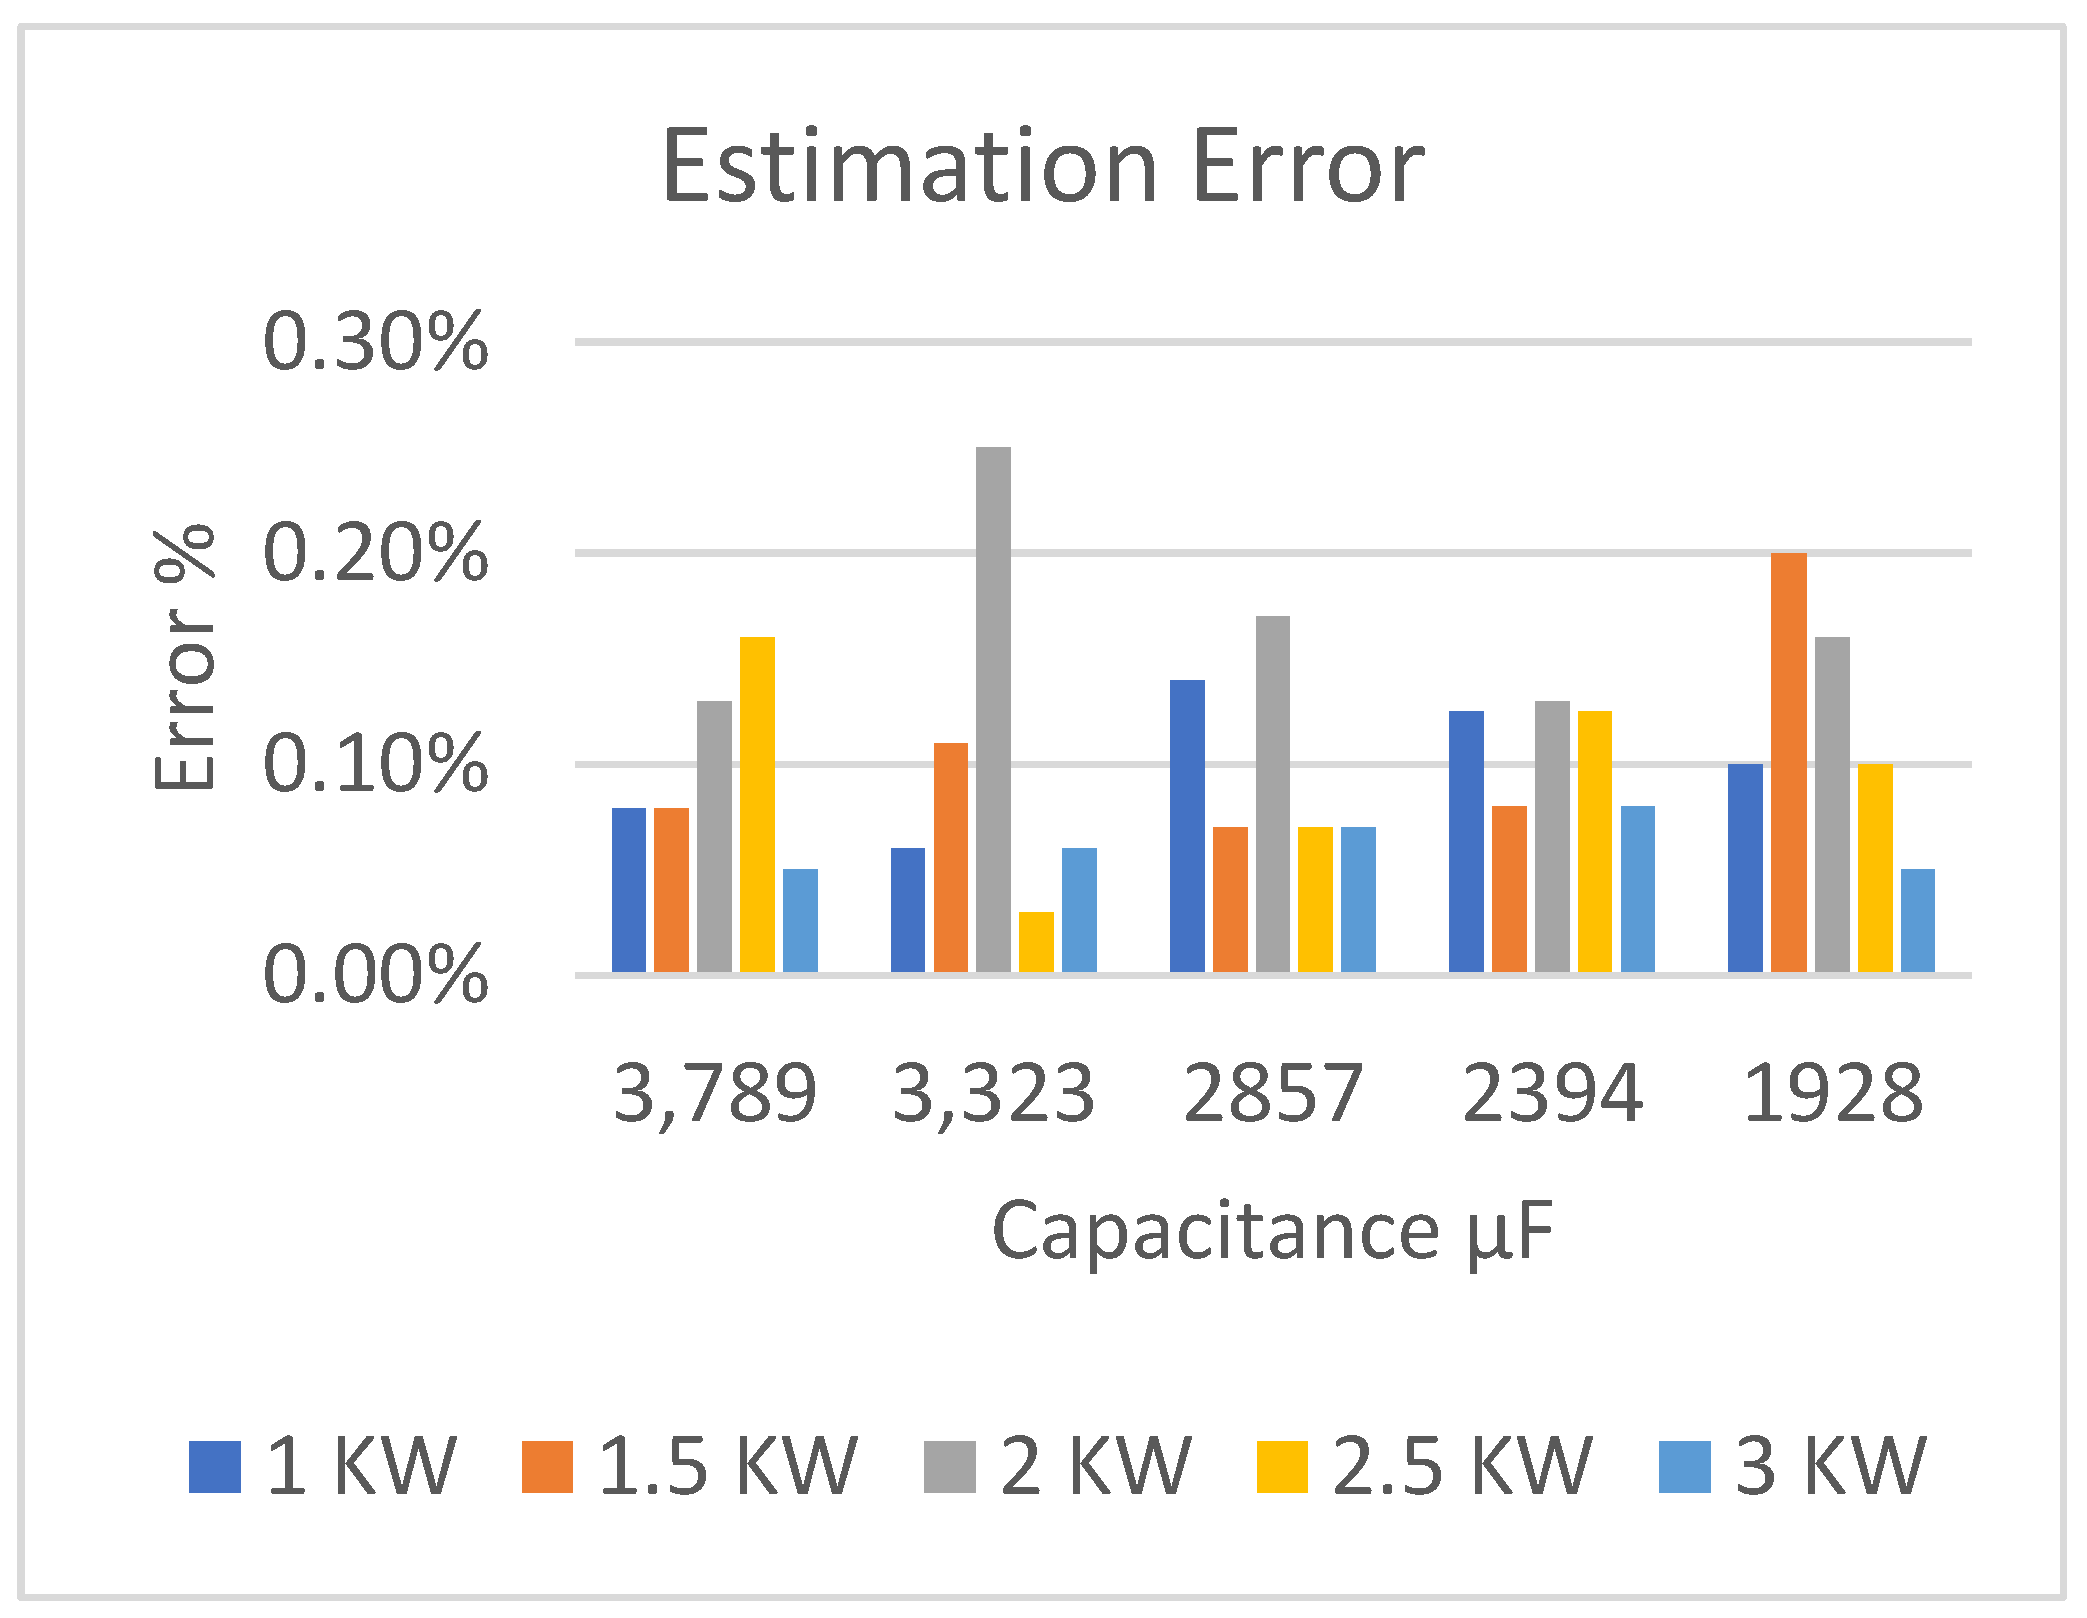
Figure 7 shows the expected capacitance for transition from Case D to E in Table 1. For Case D, the expected capacitance is 2.391. This capacitance only contains an error of +0.125%. Table 1 shows the estimated capacitance with different methods. The errors of measurements in Figure 7 are listed in Table 2. For further investigation of PSO-SVR accuracy, a set of random values of capacitance estimation are implemented under five different power levels, and their actual and estimated values are shown in Table 4. In all cases, the estimation error is less than 0.2%. The proposed method is compared with the SVR method as shown in Figure 8. The percentage of errors for different power levels is shown in Figure 9. Table 5 shows the calculation of mean, maximum, minimum, standard deviation, and estimation errors in different loads.
5. Conclusions
A novel method for capacitance estimation of the electrolytic capacitor has been proposed for the three-phase back-to-back converters. The proposed scheme has been applied by software only, without a need for removing the capacitor, sensing the capacitor current, or injecting a low-frequency component in the DC-link voltage reference. A particle swarm optimization-based support vector regression technique is used to estimate the capacitance value based on the input and output information such as voltage, current, power, as well as the DC-link voltage. An offline process for different capacitance values and several power levels is implemented to extract the relation between these variables and the DC-link capacitor. SVR then calculates the value of C online when using an input other than the trained sample. The error analysis can be tolerated if the maximum estimation error is less than 0.2%, which could be acceptable in many practical applications. However, in some cases, the estimation error exceeds the 0.2%. In this case, the online estimation process should be repeated and if the error still more than 0.2% and the offline process should be done again to modify the SVR parameters to reduce the estimation error. Such errors occasionally occur when the capacitor temperature is out of the tested and training range. The proposed method does not cover all the operating temperatures.
Author Contributions
For research articles with several authors, a short paragraph specifying their individual contributions must be provided. The following statements should be used “Conceptualization, A.G.A.-K.; Methodology, A.G.A.-K. and S.A..; Software, A.B.A.; Validation, A.G.A.-K., S.A. and A.A.; Formal Analysis, A.G.A.-K.; Investigation, A.G.A.-K.; Resources, A.G.A.-K.; Data Curation, A.A.; Writing-Original Draft Preparation, A.G.A.-K.; Writing-Review & Editing, S.A.; Visualization, S.A.; Supervision, Project Administration, A.G.A.-K.; Funding Acquisition, A.G.A.-K.”, please turn to the CRediT taxonomy for the term explanation. Authorship must be limited to those who have contributed substantially to the work reported.
Funding
The author would like to thank Deanship of Scientific Research at Majmaah University for supporting this work under Project Number No. 1439/68.
Conflicts of Interest
The authors declare no conflict of interest.
References
- Yang, Y.; Kazerani, M.; Quintana, V.H. Realization of a smart electrolytic capacitor circuit. IEEE Trans. Power Electron. 2003, 18, 857–864. [Google Scholar]
- Abo-Khalil, A.G. Current Injection-Based DC-link Capacitacne Estimation Using Support Vector Regression. IET J. Power Electron. 2012, 5, 53–58. [Google Scholar] [CrossRef]
- Kieferndorf, F.D.; Forster, M.; Lipo, T.A. Reduction of DC-bus capacitor ripple current with PAM/PWM converter. IEEE Trans. Ind. Appl. 2004, 41, 781–787. [Google Scholar] [CrossRef]
- Pu, X.-S.; Nguyen, T.H.; Lee, D.-C.; Lee, K.-B.; Kim, J.-M. Fault diagnosis of DC-link capacitors in three-phase ac/dc pwm converters by online estima-tion of equivalent series resistance. IEEE Trans. Ind. Electron. 2013, 60, 4118–4127. [Google Scholar] [CrossRef]
- Harada, K.; Katuski, A.; Fujiw, M. Use of ESR for deterioration diagnosis of electrolytic capacitors. IEEE Trans. Power Electron. 1993, 8, 1199–1207. [Google Scholar] [CrossRef]
- Rendusara, D.; Cengelci, E.; Enjeti, P.; Lee, D.C. An evaluation of the DC-link capacitor heating in adjustable speed drive systems with different utility interface options. In Proceedings of the APEC ’99. Fourteenth Annual Applied Power Electronics Conference and Exposition, Dallas, TX, USA, 14–18 March 1999; Volume 2, pp. 781–787. [Google Scholar]
- Aeloiza, E.; Kim, J.-W.; Enjeti, P.; Ruminot, P. A real time method to estimate electrolytic capacitor condition in PWM adjustable speed drives and uninterruptible power supplies. In Proceedings of the 2005 IEEE 36th Power Electronics Specialists Conference, Recife, Brazil, 16 June 2005; pp. 2867–2872. [Google Scholar]
- Shoyama, M.; Deriha, F.; Ninomiya, T. Steady-state characteristics of resonance switched capacitor converters. J. Power Electron. 2005, 5, 206–212. [Google Scholar]
- Kemet Electronics, Co. Electrolytic Capacitors. Available online: http://www.kemet.com/kemet/web/homepage/kechome.nsf/weben/322E1646C60C72B285257713006ADB65/$file/F3304.pdf (accessed on 8 October 2016).
- Abo-Khalil, A.G.; Park, H.G.; Lee, D.C. Loss minimization control for doubly fed induction generators in variable speed wind turbines. In Proceedings of the IECON 2007—33rd Annual Conference of the IEEE Industrial Electronics Society, Taipei, Taiwan, 5–8 November 2007; Volume 7, pp. 1109–1114. [Google Scholar]
- Abo-Khalil, A.G.; Lee, D.C. DC-Link. Capacitance Estimation using Support Vector Regression in AC/DC/AC PWM Converters. Korean Inst. Electr. Eng. J. 2007, 56, 81–87. [Google Scholar]
- Parler, S.G., Jr. Improved Spice models of aluminum electrolytic capacitors for inverter applications. IEEE Trans. Ind. Appl. 2003, 39, 929–935. [Google Scholar] [CrossRef]
- Abo-Khalil, A.G.; Lee, D.C. DC-Link Capaciance Estimation in AC/DC/AC PWM Converters using Voltage Injection. IEEE Trans. Ind. Appl. 2008, 44, 1631–1637. [Google Scholar] [CrossRef]
- Gasperi, M.L. Life prediction modeling of bus capacitors in AC variable-frequency drives. IEEE Trans. Ind. Appl. 2005, 41, 1430–1435. [Google Scholar] [CrossRef]
- Abo-Khalil, A.G.; Lee, D.C. DC-Link Capacitance Estimation using Support Vector Regression in AC/DC/AC PWM Converters. Trans. Korean Inst. Electr. Eng. 2006, 44, 2095–2100. [Google Scholar]
- Stevens, J.; Shaffer, J.; Vandenham, J. The service life of large aluminum electrolytic capacitors: Effects of construction and application. IEEE Trans. Ind. Appl. 2002, 38, 1441–1446. [Google Scholar] [CrossRef]
- Soliman, H.; Wang, H.; Gadalla, B.; Blaabjerg, F. Condition monitoring of dc-link capacitors based on artificial neural network algorithm. In Proceedings of the 2015 IEEE 5th International Conference on Power Engineering, Energy and Electrical Drives (POWERENG), Riga, Latvia, 11–13 May 2015; pp. 1–5. [Google Scholar]
- Lee, D.-C.; Lee, K.-J.; Seok, J.-K.; Choi, J.-W. Online capacitance estimation of DC-link electrolytic capacitors of three-phase AC/DC/DC PWM converters using recursive least square method. IEE Proc. Electr. Power Appl. 2005, 152, 1503–1508. [Google Scholar] [CrossRef]
- Ma, H.; Wang, L. Fault diagnosis and failure prediction of aluminum electrolytic capacitors in power electronic converters. In Proceedings of the 31st Annual Conference of IEEE Industrial Electronics Society, 2005. IECON 2005, Raleigh, NC, USA, 6–10 November 2005; pp. 842–847. [Google Scholar]
- Sankaran, V.A.; Rees, F.L.; Avant, C.S. Electrolytic capacitor life testing and prediction. In Proceedings of the IAS ‘97. Conference Record of the 1997 IEEE Industry Applications Conference Thirty-Second IAS Annual Meeting, New Orleans, LA, USA, 5–9 October 1997; Volume 2, pp. 1058–1065. [Google Scholar]
- IEC. Fixed Capacitors for Use in Electronic Equipment—Part 4: Specification–Alumnium Electrolytic Capacitors with Solid and Non-Solid Electrolyte; International Electrotechnichal Commission: Geneva, Switzerland, 2007. [Google Scholar]
- Abo-Khalil, A.G. Impacts of Wind Farms on Power System Stability; IntecOpen: London, UK, 2013; ISBN 980-953-307-562-9. [Google Scholar]
- Abo-Khalil, A.G.; Lee, D.C. MPPT control of wind generation systems based on estimated wind speed using SVR. IEEE Trans. Ind. Electron. 2008, 55, 1489–1490. [Google Scholar] [CrossRef]
- Müller, K.R.; Smola, A.J.; Rätsch, G.; Schölkopf, B.; Kohlmorgen, J.; Vapnik, V. Predicting time series with support vector machine. In Pm/CA 1997; Springer: Berlin, Germany.
- Abo-Khalil, A.G.; Alyami, S.; Sayed, K.; Alhejji, A. Dynamic Modeling of Wind Turbines Based on Estimated Wind Speed under Turbulent Conditions. Energies 2019, 12, 1907. [Google Scholar] [CrossRef]
- Cherkassky, V.; Miller, F. Learning from Data Concepts, Theory and Methods; Wiley: Hoboken, NJ, USA, 1998. [Google Scholar]
- YU, B.G.; Abo-Khalil, A.G.; Matsui, M.; Yu, G. Support Vector Regression Based Maximum Power Point Tracking for PV Grid-Connected System. In Proceedings of the 2009 34th IEEE Photovoltaic Specialists Conference PVSC, Philadelphia, PA, USA, 7–12 June 2009. [Google Scholar]
- Abo-Khalil, A.G.; Ab-Zied, H. Sensorless Control for DFIG Wind Turbines Based on Support Vector Regression. In Proceedings of the IECON 2012—38th Annual Conference on IEEE Industrial Electronics Society, Montreal, QC, Canada, 25–28 October 2012. [Google Scholar]
- Rastgoufard, S.; Charalampidis, D. Parameter selection of multi-class SVM with evolutionary optimization methods for static security evaluation in power systems. In Proceedings of the 2016 IEEE Electrical Power and Energy Conference (EPEC), Ottawa, ON, Canada, 12–14 October 2016. [Google Scholar]
- Lee, K.; El-Sharkawi, M. Modern Heuristic Optimization Techniques; Wiley: Hoboken, NJ, USA, 2008. [Google Scholar]
- Liu, H.-H.; Chang, L.-C.; Li, C.-W.; Yang, C.-H. Particle swarm optimization-based support vector regression for tourist arrivals forecasting. Computational Intelligence and Neuroscience. Comput. Intell. Neurosci. 2018, 2018. [Google Scholar] [CrossRef] [PubMed]
Figure 1.
Distribution of failure of power components.
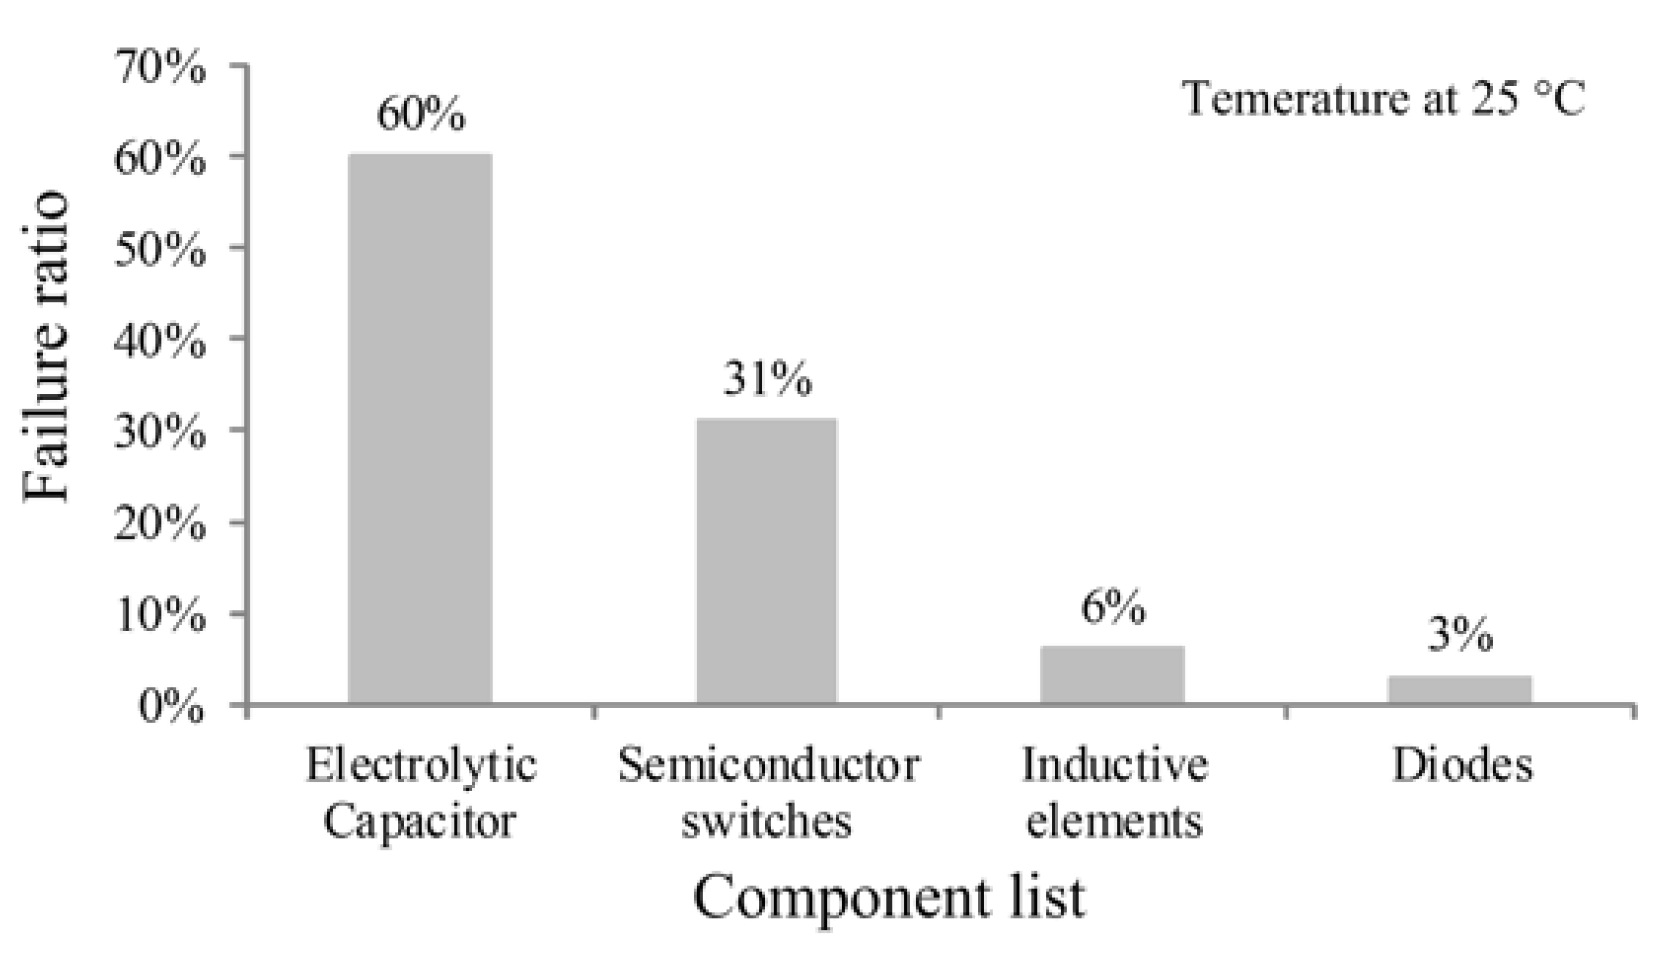
Figure 2.
Structure of electrolytic capacitor.

Figure 3.
The structure of DC-link capacitor monitoring.
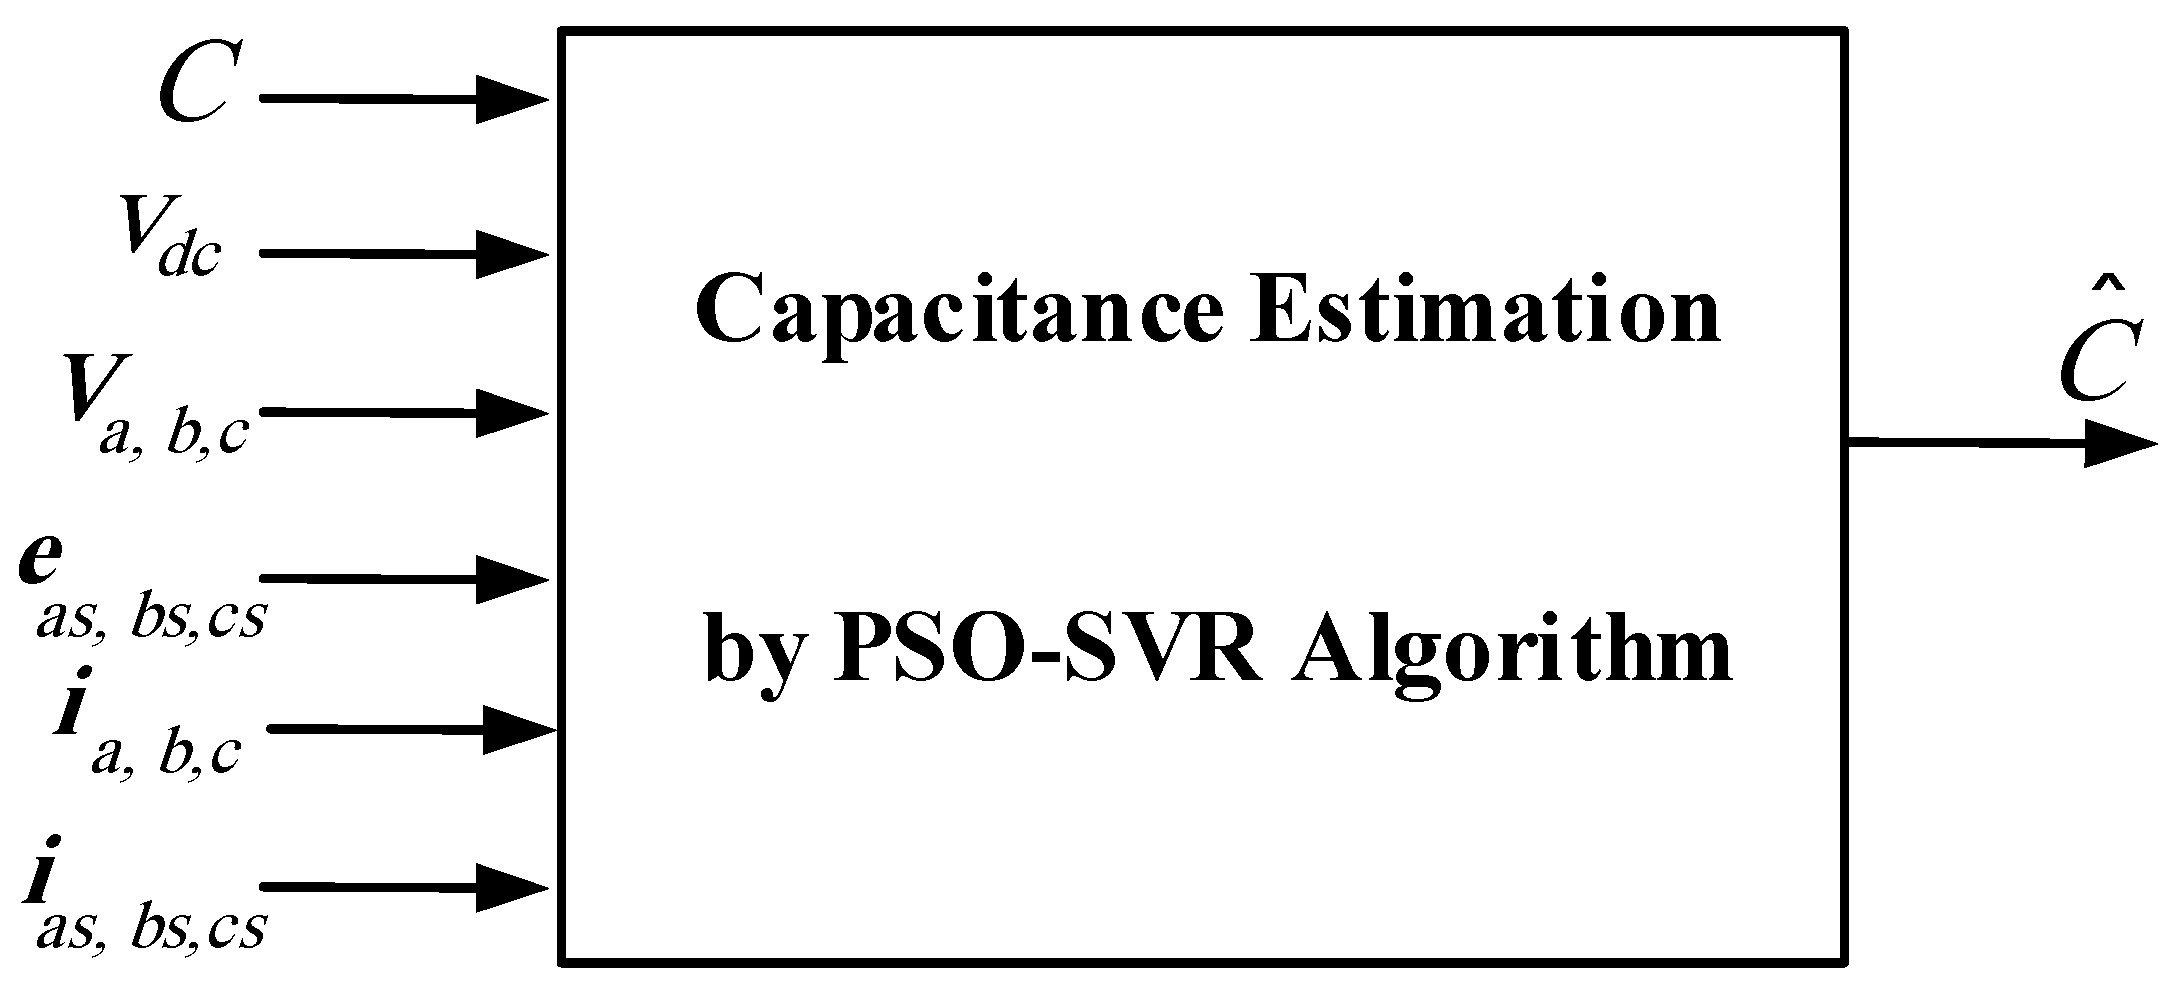
Figure 4.
Process implementation diagram.

Figure 5.
Implementation process diagram.

Figure 6.
System hardware configuration.
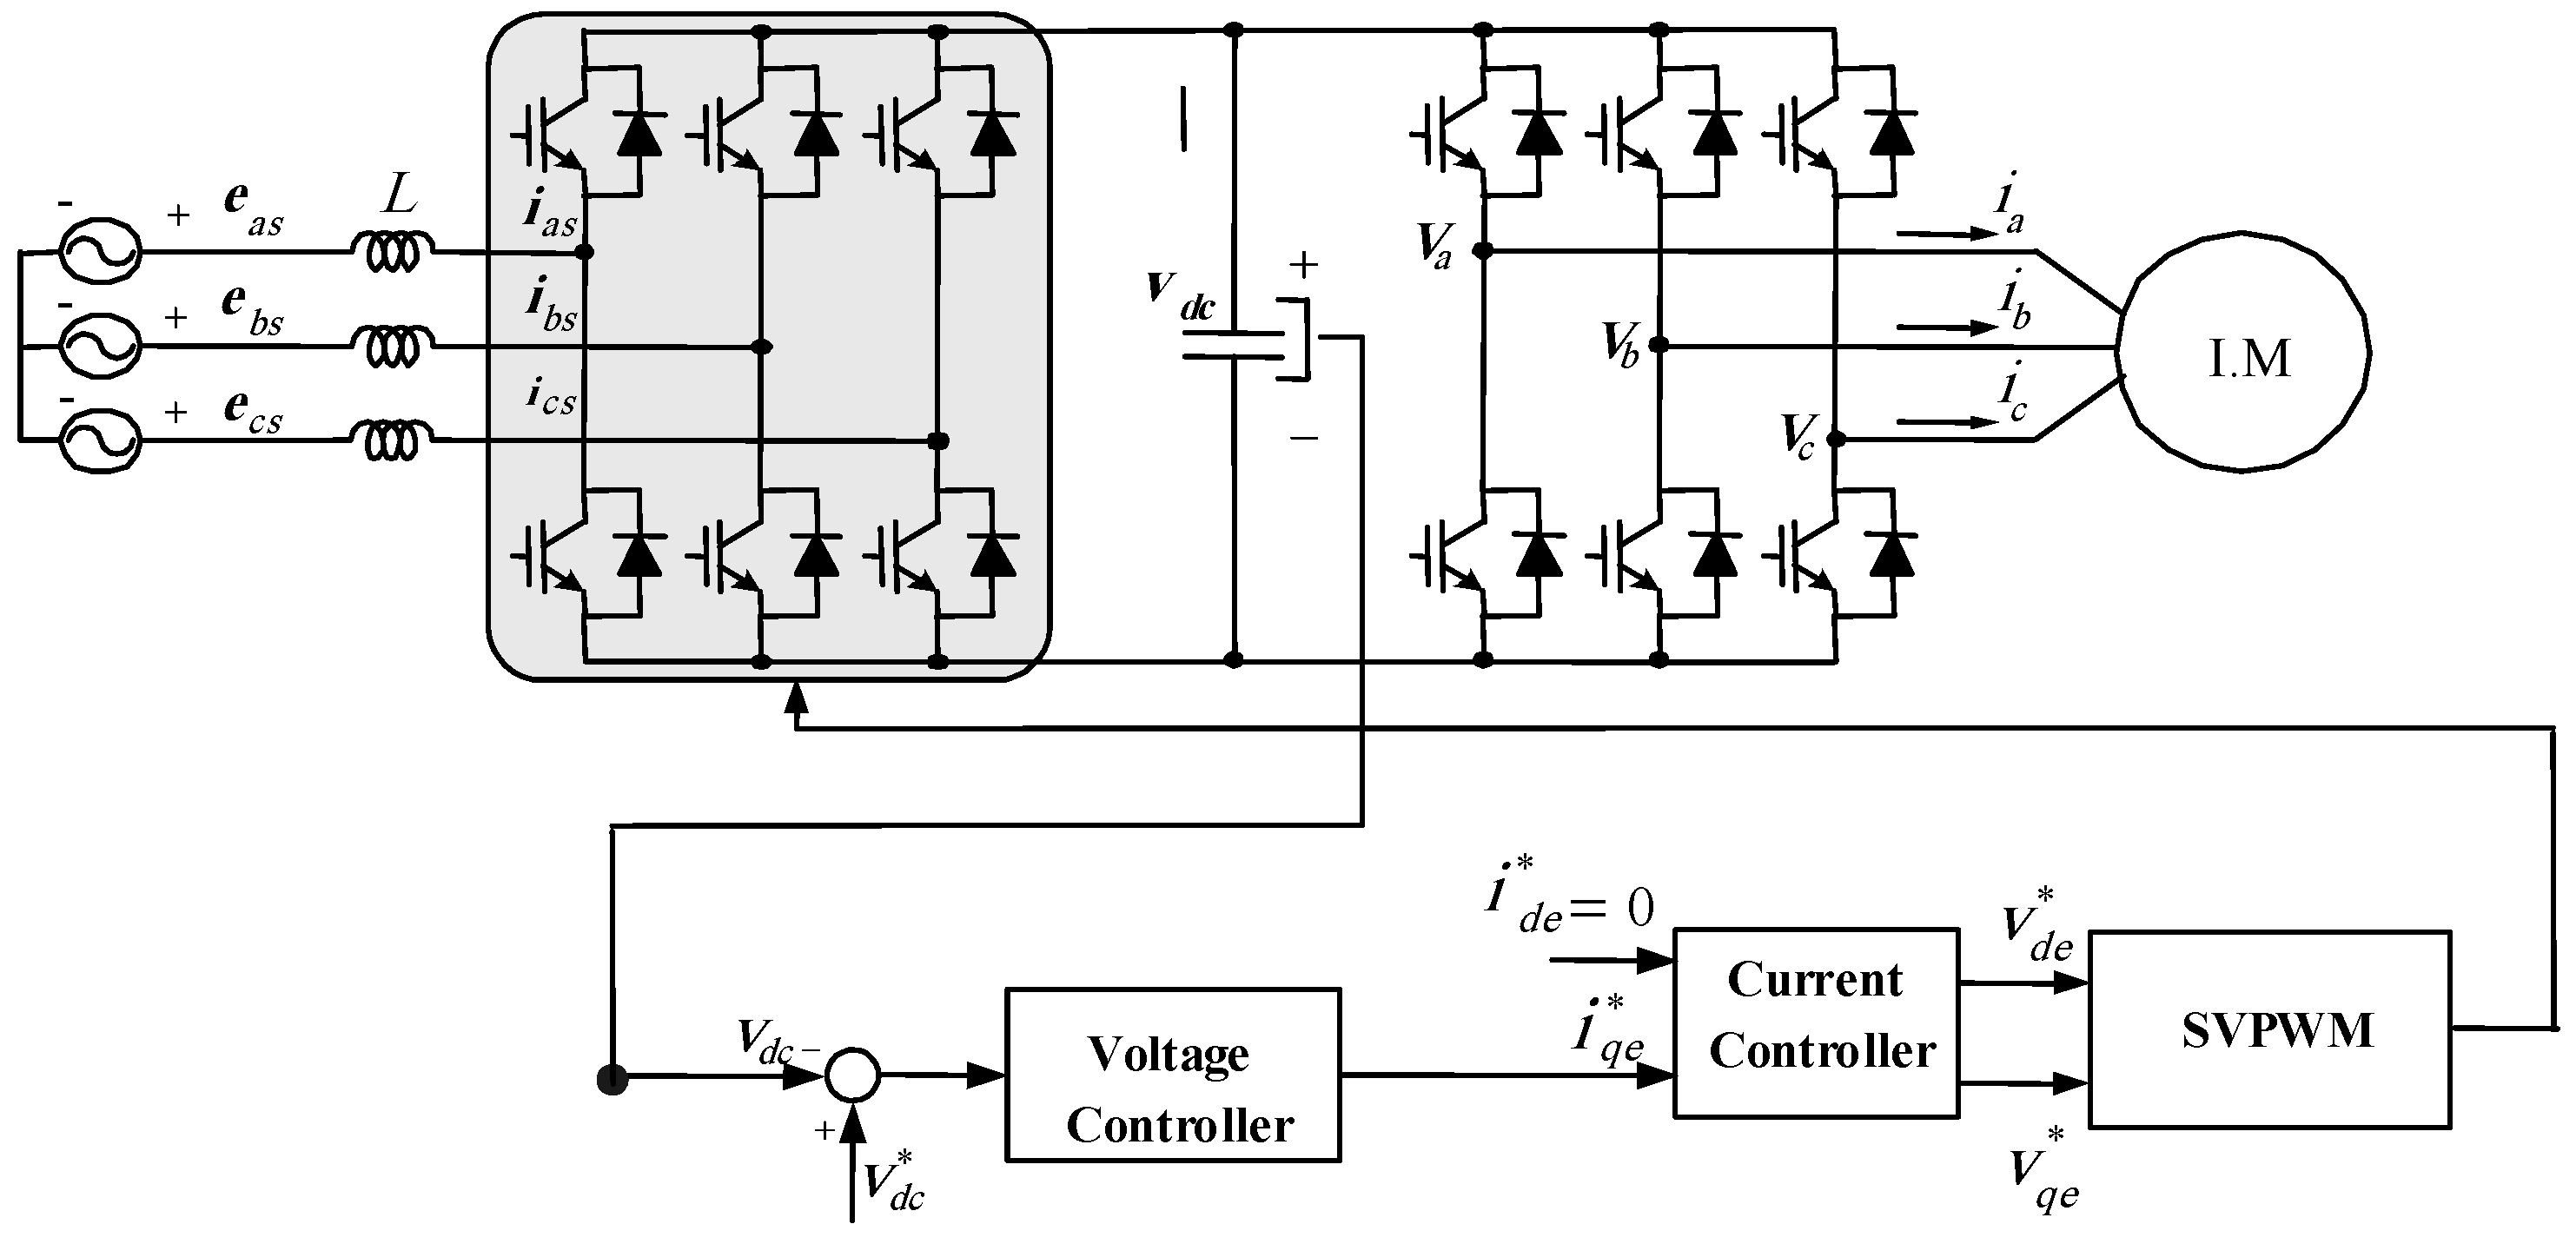
Figure 7.
Capacitance estimation at abrupt variation of C using particle swarm optimization-based support vector regression (PSO-SVR).
Figure 7.
Capacitance estimation at abrupt variation of C using particle swarm optimization-based support vector regression (PSO-SVR).

Figure 8.
Capacitance estimation at abrupt variation of C using SVR.
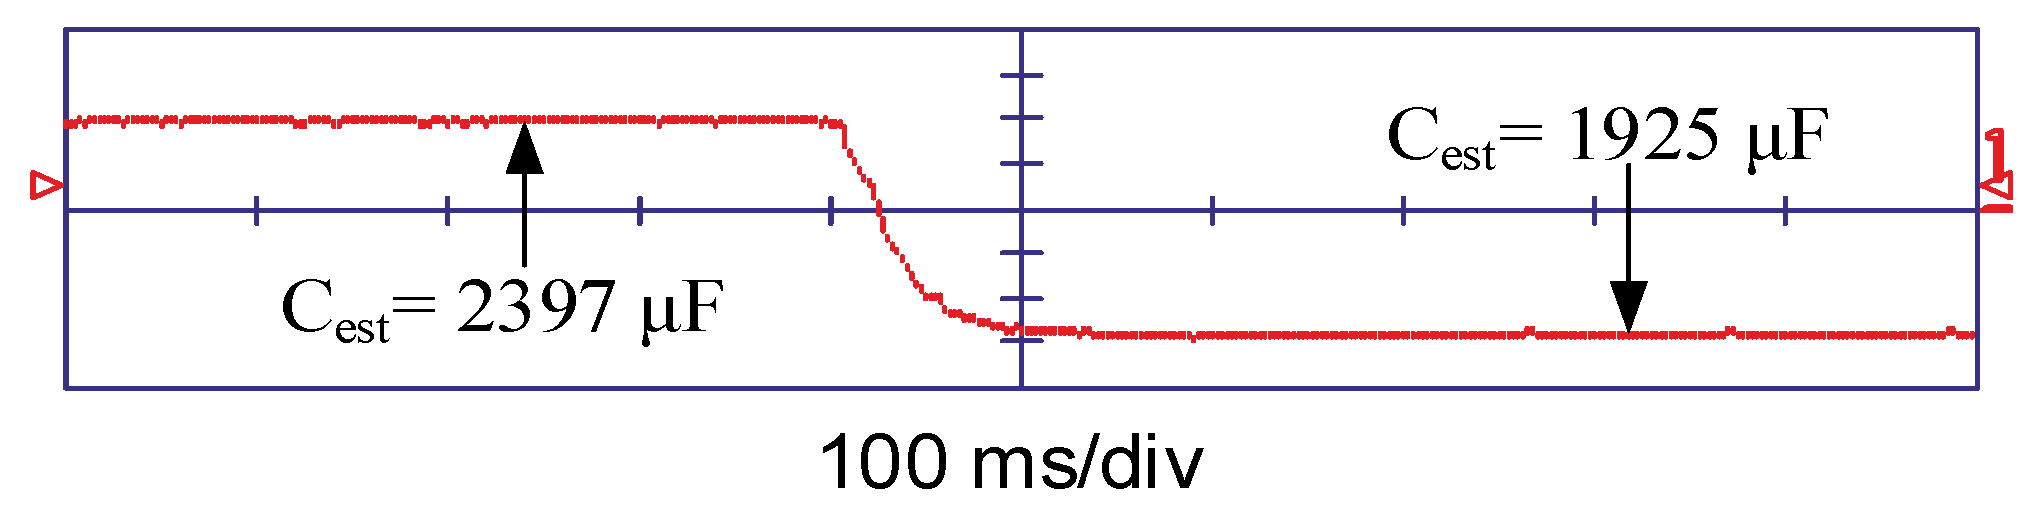
Figure 9.
Capacitance estimation errors in different power.

Table 1.
Training data and estimation accuracy.
| A | 3789 | 3789 | 3789 |
| B | 3323 | 3323 | 3323 |
| C | 2857 | 2857 | 2857 |
| D | 2394 | 2394 | 2394 |
| E | 1928 | 1928 | 1928 |
Table 2.
Capacitance estimation error.
| Estimation Error [%] | |||
|---|---|---|---|
| by SVR | by PSOSVR | ||
| 1928 | 1925 | 1927 | 0.05 |
| 2394 | 2397 | 2391 | 0.125 |
Table 3.
System parameters.
| Parameters | Value |
| Converter power rating | 3 kVA |
| Input AC voltage | 220 V |
| Input boost inductance | 3.5 mH |
| Line resistance | 0.5 Ω |
| Switching frequency | 5 kHz |
| Injected voltage | 10 V peak, 30 Hz |
| DC-link voltage | 340 V |
Table 4.
Real-time monitoring of DC-link capacitor for different input power.
| Power = 1 kW | Power = 1.5 kW | Power = 2 kW | Power = 2.5 kW | Power = 3 kW | ||||||
|---|---|---|---|---|---|---|---|---|---|---|
| Error | Error | Error | Error | Error | ||||||
| 3789 | 3786 | 0.079% | 3786 | 0.079% | 3784 | 0.13% | 3783 | 0.16% | 3787 | 0.05% |
| 3323 | 3319 | 0.06% | 3322 | 0.11% | 3319 | 0.25% | 3324 | 0.03% | 3321 | 0.06% |
| 2857 | 2853 | 0.14% | 2859 | 0.07% | 2852 | 0.17% | 2855 | 0.07% | 2855 | 0.07% |
| 2394 | 2391 | 0.125% | 2396 | 0.08% | 2392 | 0.13% | 2391 | 0.125% | 2392 | 0.08% |
| 1928 | 1926 | 0.1% | 1924 | 0.2% | 1925 | 0.16% | 1926 | 0.1% | 1927 | 0.05 |
Table 5.
Capacitance monitoring error.
| Power = 1 kW | Power = 1.5 kW | Power = 2 kW | Power = 2.5 kW | Power = 3 kW | Mean | Max | Min | STD | |
|---|---|---|---|---|---|---|---|---|---|
| Error | Error | Error | Error | Error | |||||
| 3789 | 0.079% | 0.079% | 0.13% | 0.16% | 0.05% | 0.000917186 | 0.16% | 0.05% | 0.000397 |
| 3323 | 0.06% | 0.11% | 0.25% | 0.03% | 0.06% | 0.001609477 | 1.00% | 0.03% | 0.004655 |
| 2857 | 0.14% | 0.07% | 0.17% | 0.07% | 0.07% | 0.000960228 | 0.17% | 0.07% | 0.000427 |
| 2394 | 0.125% | 0.08% | 0.13% | 0.125% | 0.08% | 0.001053874 | 0.13% | 0.08% | 0.000229 |
| 1928 | 0.1% | 0.2% | 0.16% | 0.1% | 0.05 | 0.002759459 | 5.00% | 0.10% | 0.019444 |
© 2019 by the authors. Licensee MDPI, Basel, Switzerland. This article is an open access article distributed under the terms and conditions of the Creative Commons Attribution (CC BY) license (http://creativecommons.org/licenses/by/4.0/).
Share and Cite
MDPI and ACS Style
Abo-Khalil, A.G.; Alyami, S.; Alhejji, A.; Awan, A.B. Real-Time Reliability Monitoring of DC-Link Capacitors in Back-to-Back Converters. Energies 2019, 12, 2369. https://doi.org/10.3390/en12122369
AMA Style
Abo-Khalil AG, Alyami S, Alhejji A, Awan AB. Real-Time Reliability Monitoring of DC-Link Capacitors in Back-to-Back Converters. Energies. 2019; 12(12):2369. https://doi.org/10.3390/en12122369
Chicago/Turabian StyleAbo-Khalil, Ahmed G., Saeed Alyami, Ayman Alhejji, and Ahmed B. Awan. 2019. "Real-Time Reliability Monitoring of DC-Link Capacitors in Back-to-Back Converters" Energies 12, no. 12: 2369. https://doi.org/10.3390/en12122369
Note that from the first issue of 2016, this journal uses article numbers instead of page numbers. See further details here.