Why Coal Bed Methane (CBM) Production in Some Basins is Difficult


Faculty of Mining and Geoengineering, AGH University of Science and Technology, 30-059 Kraków, Poland
*
Author to whom correspondence should be addressed.
Energies 2019, 12(15), 2918; https://doi.org/10.3390/en12152918
Submission received: 29 June 2019
/
Revised: 23 July 2019
/
Accepted: 25 July 2019
/
Published: 29 July 2019
(This article belongs to the Special Issue Latest Research Progress for Nanotech for Oil and Gas)
Abstract
:The changes in the permeability of coal-bed reservoirs with methane, as associated with gas depletion, are the consequence of two opposing processes, namely geomechanical compaction that narrows down fractures, and matrix shrinkage, which, in turn, widens fractures. Many previous studies on the effects of these processes have emphasised, albeit not always, the circumstances and conditions that led to a greater coal permeability, with a natural decrease in the pore pressure of methane during its production, and, in consequence, to an increase in the cumulative volume of this gas. However, in some coal basins, there are beds where the methane production has failed to reach the appropriate level, whether in economic or engineering terms. This paper identifies some reasons for the failed attempts at well exploration of gas from such coal beds. Specifically, it describes seven parameters to be considered in relation to CBM, including geomechanical parameters such as Young’s modulus, Poisson’s ratio, and the initial porosity, which define coal cleat compressibility, a very important parameter, and parameters related to methane desorption, i.e., desorption-induced volumetric strain, the Langmuir pressure, and the initial pressure of gas within the bed. In addition to cleat compressibility, there are other, equally important parameters, such as the rebound pressure and recovery pressure, which are defined by the following parameters in order of importance: Young’s modulus, desorption-induced volumetric strain, initial pressure of methane, the Langmuir pressure, and Poisson’s ratio. To assess the impact of these parameters on changes in permeability, we used the Cui-Bastin model. The simulation results were analysed to allow us to present our findings.
1. Introduction
Coal bed methane (CBM) is stored in coal matrix submicropores and micropores through volume absorption and surface adsorption. As appropriate conditions are created within the coal bed, methane can escape by leaving the large internal surface of the matrix through configurational diffusion and surface diffusion, both of which can be considered to constitute activated diffusion. In many coal beds, these processes are slow. As a result, the desorption of pre-adsorbed gas into the coal cleats is delayed. Methane release at a high pressure can be very limited because of the non-linear Langmuir-type isotherm. Deep, non-explored beds require the reservoir pressure to decrease significantly below the critical desorption pressure in order to promote desorption.
The system of cleats within the coal bed can usually be divided into two categories, namely face cleats, which traverse the length of the bed, and perpendicular butt cleats, which terminate at the intersection cleats. Within the bed, these two categories of cleats are usually oriented vertically to the bedding plane. The shape of the cleats network is crucial for the permeability of methane within the coal bed. For the purposes of modelling, it is assumed that horizontal strains are equal to zero, meaning that the strains are uniaxial, and that the vertical stresses remain unchanged [1,2,3,4].
There are two important processes related to reservoir pressure depletion, which have opposing effects on in-situ coal permeability [5,6,7]. The first is a geomechanical phenomenon where cleats narrow down as a result of increased effective stress. The second, occurring mainly at a later stage of production, is the widening of the cleats due to coal matrix shrinkage caused by methane desorption. When this matrix shrinkage is greater than the compaction of coal, there is an increase in permeability, which, in turn, facilitates a constant deliverability of methane. The processes described above are mainly observed in the bituminous coals. In the case of coals with a vitrinite reflectance above 2%, the shrinkage/swelling effect is lost.
The geomechanical properties of coal are represented by such parameters as Young’s modulus E, Poisson’s ratio v, and the associated cleat compressibility cf. The matrix shrinkage as a result of desorption is represented by the coal maximum strain at an infinite pressure εl and the Langmuir pressure PL, which is found in an equation similar to the Langmuir equation. Other important parameters include the cleat porosity ϕ and the initial pressure of methane Po [1,3]. The values of these and other parameters are determined on the basis of laboratory measurements or in field tests. All these parameters have been used in the available analytical and numerical models to explore changes in coal permeability dependent on decreasing methane pressure [2,3,4]. Compared to numerical models, analytical models are often simpler and easier to apply, and their simplifications have been relatively justified. Such models provide a way to calculate the rebound pressure and recovery pressure, as produced by the methane pressure decrease during methane production, and to compute the correlation between the coal permeability and methane pressure decrease.
Many previous studies have demonstrated that in several coal basins around the world, the value of such rebound pressure and recovery pressure is high enough to cause the coal permeability to grow, thus increasing the cumulative volume of methane produced.
This article, however, focuses on the beds across different coal basins where, as a result of the methane pressure reduction, the rebound pressure and recovery pressure are insufficient to produce an increase in the coal permeability necessary to produce a satisfactory volume of methane. The paper discusses the relationships between the key model parameters that prevent coal permeability from increasing and the conditions that support such an increase. For the data on selected coal basins around the world (mainly in USA but also in Canada), we have analysed the sensitivity of the Cui and Bastin [3] analytical model to changes in the geomechanical parameters and in the parameters responsible for methane desorption. The results of our analyses show that it is possible to identify in these models the most relevant parameters that are largely responsible for the increase in the coal permeability related to changes in the methane pressure. Changes in the coal permeability are produced by two opposing processes, including geomechanical phenomena and processes related to methane desorption. Our computations show that, in the literature, the ranges of parameter values used for the analysed coal basins can either support (if the parameter configuration is favourable) or prevent (if the parameter configuration is unfavourable) an increase in the coal permeability. In view of the above, we have emphasised the importance of both laboratory [8] and in-field tests for determining the geomechanical and methane-desorption-related properties, and demonstrated the significant differences between the two types of tests.
2. Pore-Pressure-Dependent Permeability in Some Models
Of all the known models, the following are often presented together: Palmer and Mansoori [1,2], Shi and Durucan [9] and Cui and Bustin [3]. These models combine the geomechanical aspect and the aspect related to the shrinkage of the matrix due to methane desorption. They consider coal to be a poroelastic rock which is analogous to the effect of temperature [10,11,12]. Two boundary conditions for the solution to these models are uniaxial strain conditions and the constant vertical stress of the overburden. In addition to the above-mentioned, in the literature there are many models based on the assumptions similar to those adopted earlier.
2.1. The Palmer and Mansoori Model
The original analytical model, as presented in [1,2], is based on changes in the desorption-induced volumetric strain, which, in turn, result in changes in the coal permeability and porosity. Experimental data on desorption-induced strains [13,14,15] have suggested that there is an approximation-based, linear correlation between the volume of desorbed methane and its corresponding deformations εv. Moreover, deformations caused by the matrix shrinkage εv may be fitted to a Langmuir-type equation:
where εL is the maximum strain value when the gas pressure tends to infinity, and PL is the pore pressure at which the coal matrix strain is half of the maximum strain value. Based on the constitutive relations for poroelastic media, as in Palmer and Monsoori [1,2] the change of the cleat porosity as a function of the pore pressure was derived as:
where ϕo is the initial (clean) porosity, v—Poisson ratio, and E—Young’s modulus. The permeability ratio has the form of the cubic law:
where ko is the initial permeability.
In their modified model, Palmer and Reeves [17] introduced, in addition to the previously used coefficient f as the fraction 0.1, the coefficient g as a geometric term related to the orientation of the cleat system.
2.2. The improved Shi-Durucan Model
The original Shi-Durucan Model [9] will not be discussed here. Instead, we will talk about its improved version. Zimmerman [10] and Seidle [16] have proven that the correlation between the permeability and mean effective stress σm is exponential in nature. In the original Shi-Durucan model [9], they replaced the mean stress σm by the horizontal stress σh and introduced the cleat volume compressibility cf with respect to the horizontal stress σh.
Here, we introduce the improved version of the correlation between the horizontal stress and methane pressure, as follows:
where σh means the effective horizontal stress normal to cleats, and the subscript o refers to the initial parameter value.
The improved correlation between the permeability and methane pressure, resulting from their exponential relation:
is as follows:
The analysis of Equation (5) in the improved Shi-Durucan model shows that the difference in stress (σo-σh) is at its minimum for the rebound pressure Prb in the following form:
Furthermore, the recovery pressure Prc, for which the initial value effective stress σo is recovered, can be expressed as:
Equations (5) and (7)–(9) are different from Equations (6), (7), and (9), (11), respectively, in the original Shi and Durucan model [9].
2.3. The Cui-Bustin Model
The Cui-Bustin [3] model accounts for changes in the mean normal stress σm (for the three main directions, assuming that the horizontal stress σxx = σyy). This produces a change in the mean normal stress σm in the form of:
The exponential relation between the permeability and decreasing methane pressure produces the following expression:
An analysis of Equation (10) produces an expression to calculate the rebound pressure Prb and recovery pressure Prc:
and:
3. Analysis of the Sensitivity of Permeability to Changes in Geomechanical Parameters and Methane-Desorption-Related Parameters
In the first part of our analyses, we presented a comparison of the results obtained for the Palmer-Mansoori [1,2], Cui-Bustin [3] and the improved Shi-Durucan models, which describe changes in the permeability in relation to changes in the pore pressure for coal from the Boomer B1 San Juan basin. The models used in the simulations are not compatible and have been defined using different values taken from studies and analyses by various authors.
Because of the availability of data on coal properties and the specific nature of the discussed analytical models, in the second part of our analyses we used the model by Cui and Bustin [3] for simulation purposes. Unlike the model by Palmer and Mansoori [1] and the original Shi-Durucan model [9], this model shows less favourable, and in our opinion more realistic, changes in permeability. In our simulations, we used five regions where methane is currently being extracted from coal beds, including three from the basin in San Juan, USA, and two in Canada (Manville and Mesaverde).
3.1. The Choice of Analytical Model Parameters for the Selected Coal Basins
With the Cui-Bustin [3] model, the initial porosity ϕo is not used explicitly as a parameter, but its use in analytical models was argued for by Palmer and Mansoori [1,2]. Thanks to the correlation adopted by Palmer and Mansoori [1] to define the cleat compressibility cf, the initial porosity can be included in analyses if only the measurement data are available, since:
where M—constrained axial modulus:
Based on studies by various authors, for the purposes of our analysis, we prepared sets of parameters in ranges corresponding to their variability in the specific coal basin area. In all cases, the cleat compressibility cf was calculated on the basis of Equation (14). The coal petrophysical properties, as used in the analyses depending on the region, are described in Table 1, Table 2, Table 3, Table 4 and Table 5.
The data concerning coal from the basin Boomer Well B-1 San Juan (Table 1) were taken from a paper by Palmer and Mansoori [1,2]. It is important to note that these data were in part matched to the results of experimental tests performed on the coal core Boomer Well B-1. Moreover, those authors used the history matching approach to scale core-matching results up to the field.
In their paper, Bustin and Bustin [18] presented the results of extensive analyses on the model by Palmer and Mansoori for coal from Lower Cretaceous, Mannville Group. They had obtained most of the data for their simulations from academic databases and laboratory tests performed on coal cores from Mannville wells. The minimum, average and maximum parameter values were used as the model input. The fracture porosities were estimated from the match-stick model [19]. Some parameter values from both those papers were adapted for the purposes of calculations in this article (Table 2).
The values of the Mesaverde Group coal parameters used for the simulations (Table 3) are similar to those used in the paper by Cui and Bustin [3]. Similarly to the cited work, some parameter values for methane desorption were artificially chosen. The initial porosity was considered constant, and its value was similar to the minimum value for the Mannville Group coal. It was also similar to the initial porosity value for the Cretaceous Gates Formation coal [20].
The geomechanical and desorption data for the Northern San Juan Basin coal, as used in our simulations (Table 4), were retrieved from laboratory tests performed on Liu and Harpalani coal cores [21] and by Liu et al. [22]. The desorption parameters, as used in this paper, are similar to those estimated by Liu and Harpalani [22] and Liu et al. [21] on the basis of the characteristics of deformations induced by methane desorption.
For the simulations involving coal from the Northeast of Fairway San Juan Basin (Table 5), we used data retrieved from a publication by Gerhard et al. [23], Clarkson and McGovern [24], who presented the in-field permeability data match. The simulation parameters were based on data from one of the holes discussed in those works, where the increase in permeability accompanying a decrease in pore pressure was very small.
The petrographic composition and the coal rank for the analyzed coal beds are as follows. Fruitland coals within the south-central San Juan Basin are composed of vitrinite (80%), liptinite (5.2%), and inertinite (14.1%). In the northern San Juan Basin, the coal rank is high-volatile A bituminous, corresponding to vitrinite reflectance measurements of 0.78% or higher [25]. In the southern and western margins of the San Juan Basin Fruitland, the coal rank is subbituminous B to high-volatile A bituminous. It increases to low-volatile bituminous in the north-central part of the basin [26,27]. Mannville coals are composed of inertinite varied from 35.8–51.0%, vitrinite with an average content of 62.8% and liptinite varied from 5.2–8.8%. Mannville basin coal has a maximum vitrinite reflectance of 0.54%, indicating a high volatile C bituminous rank [28]. Coals of the Mesaverde Group in general consist mainly of vitrinite (> 75%) and lesser amounts of liptinite and inertinite. The lower part of the Mesaverde in the southeastern part of the basin have liptinite contents as high as 20%. In the north edge of the basin, the coal rank is a high-volatile B bituminous (R0 value of about 0.7%). The R0 values for the coals in the lower part of the Mesaverde increase regularly from less than 0.7% around the margins of the basin to more than 2.1% along a trough in the southeastern part of the basin [29].
Some petrographic data, as well as the coal rank data, for the analyzed basins can also be found in the work of Siedle [6]. Attention should be paid to the large scatter of results, and therefore for a given basin the results should be treated only as a guide.
3.2. Permeability Changes in Boomer B-1 Well San Juan Basin Coal
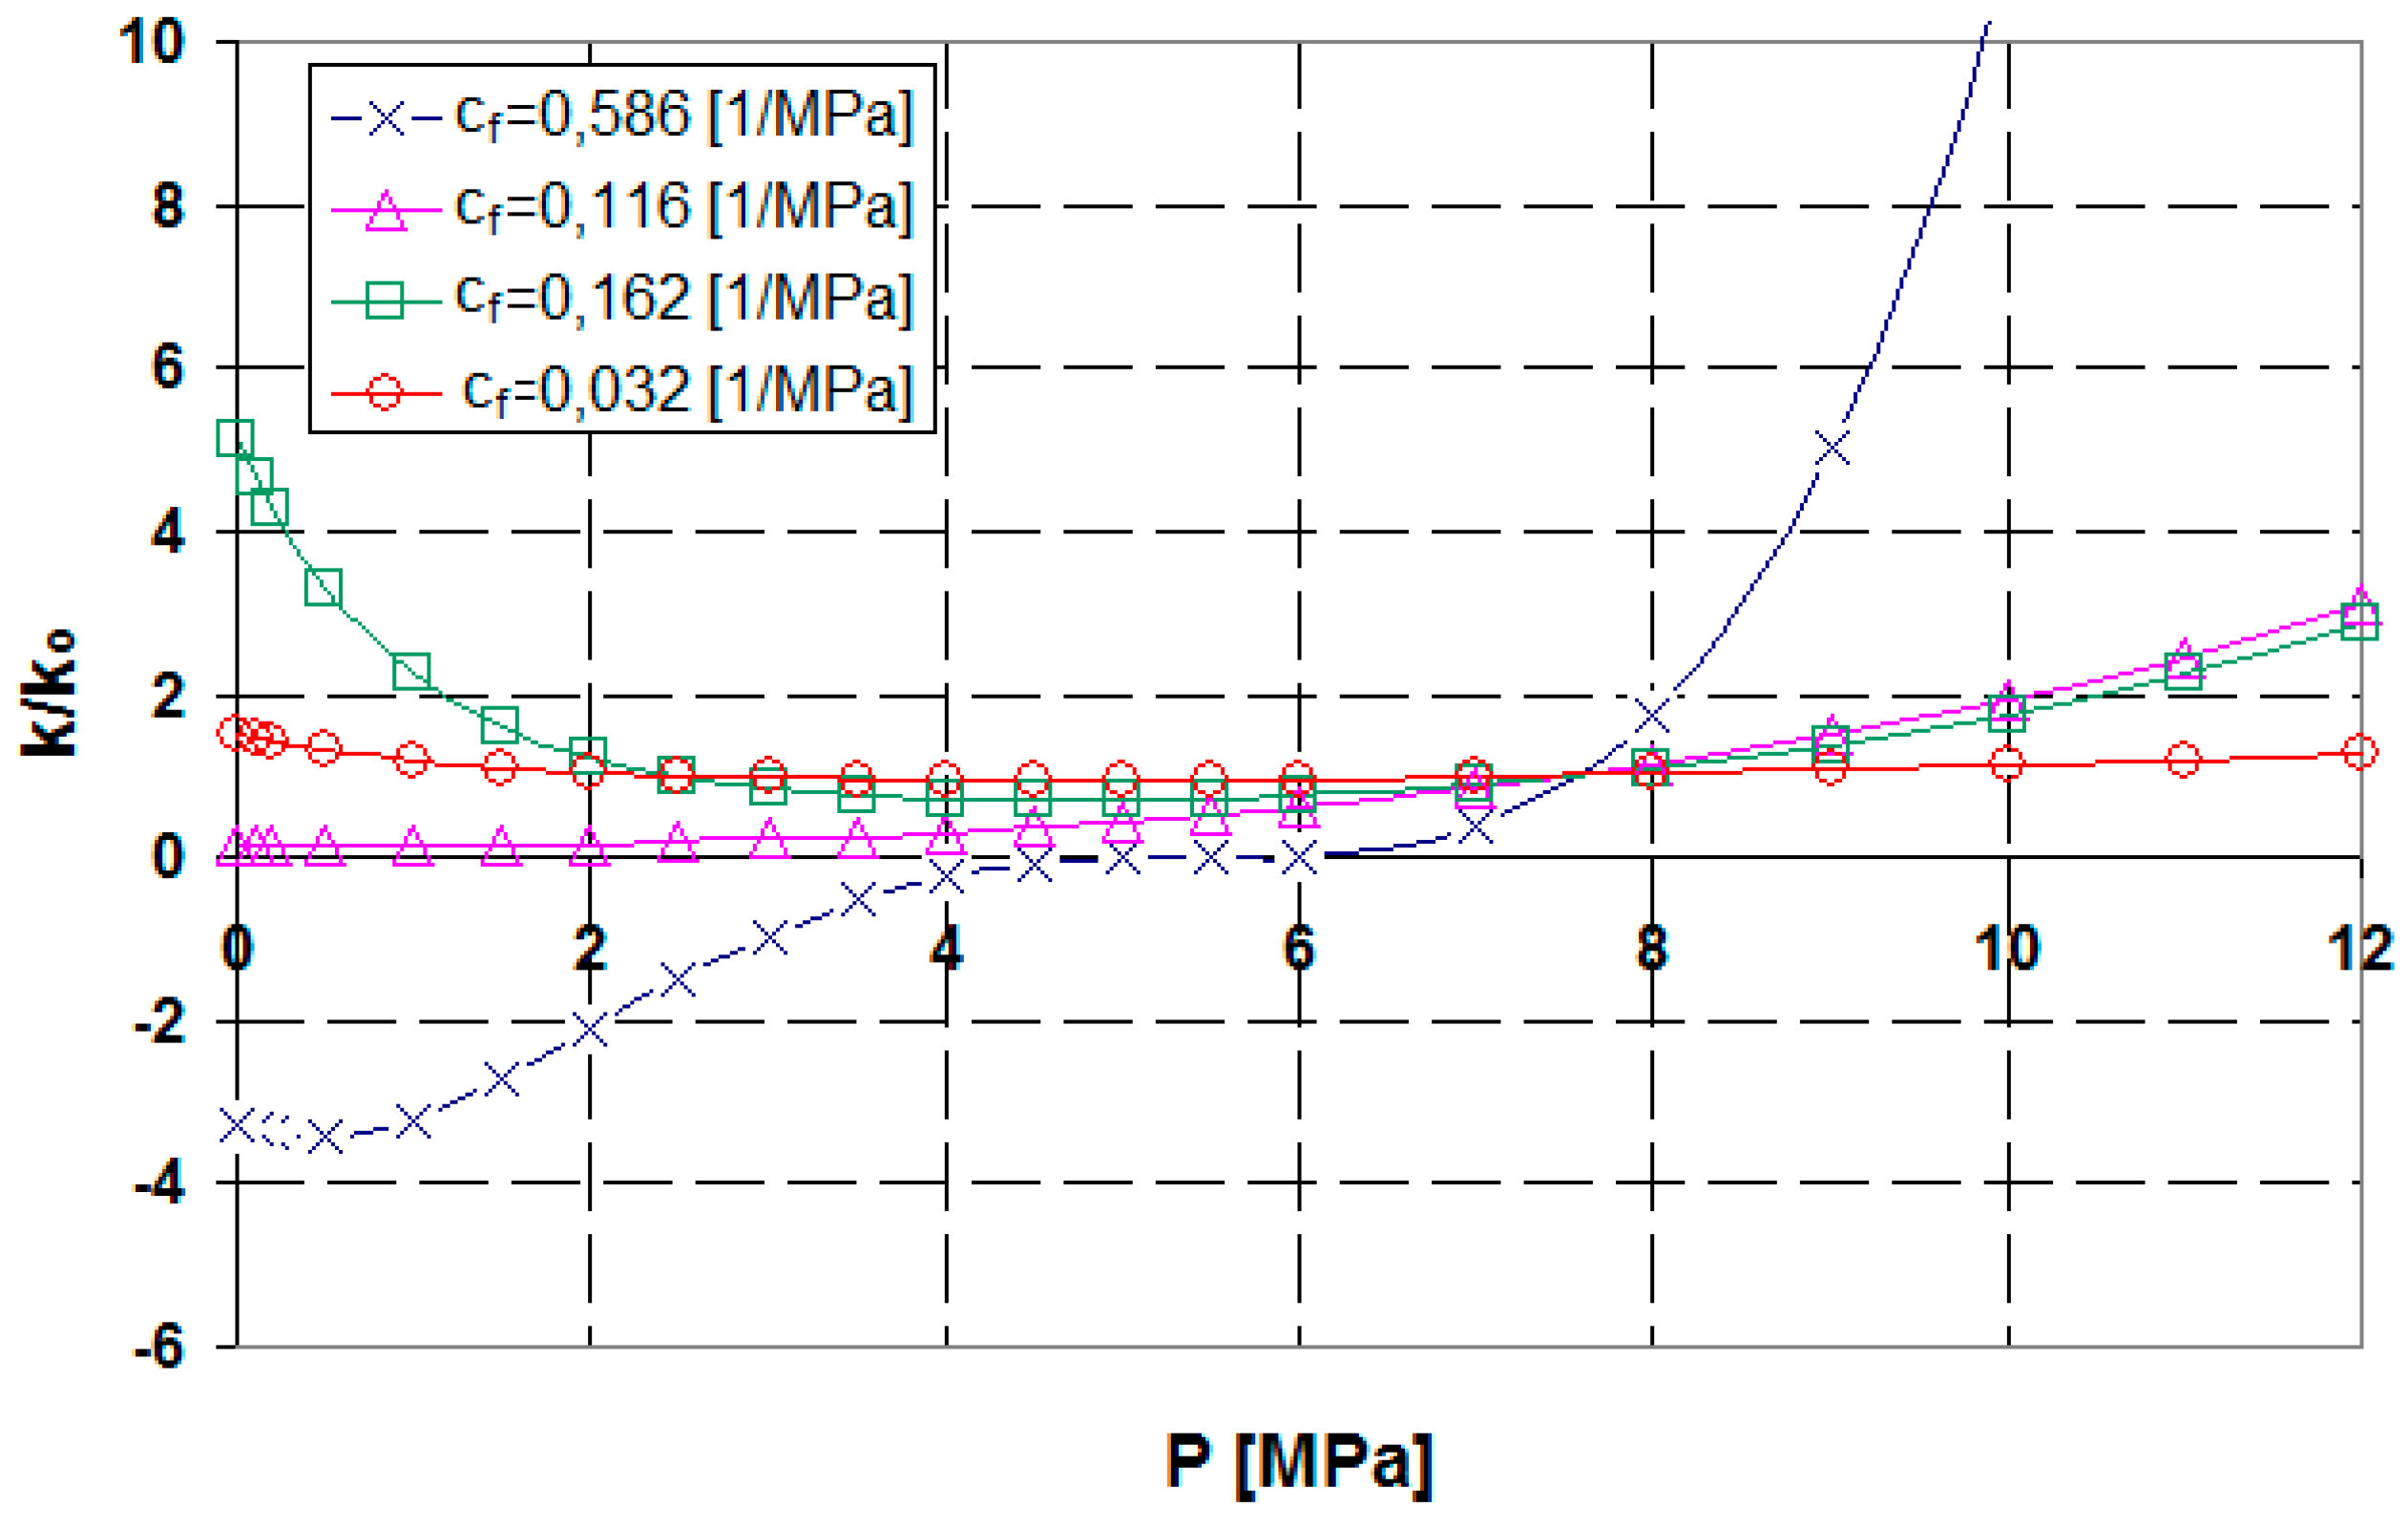
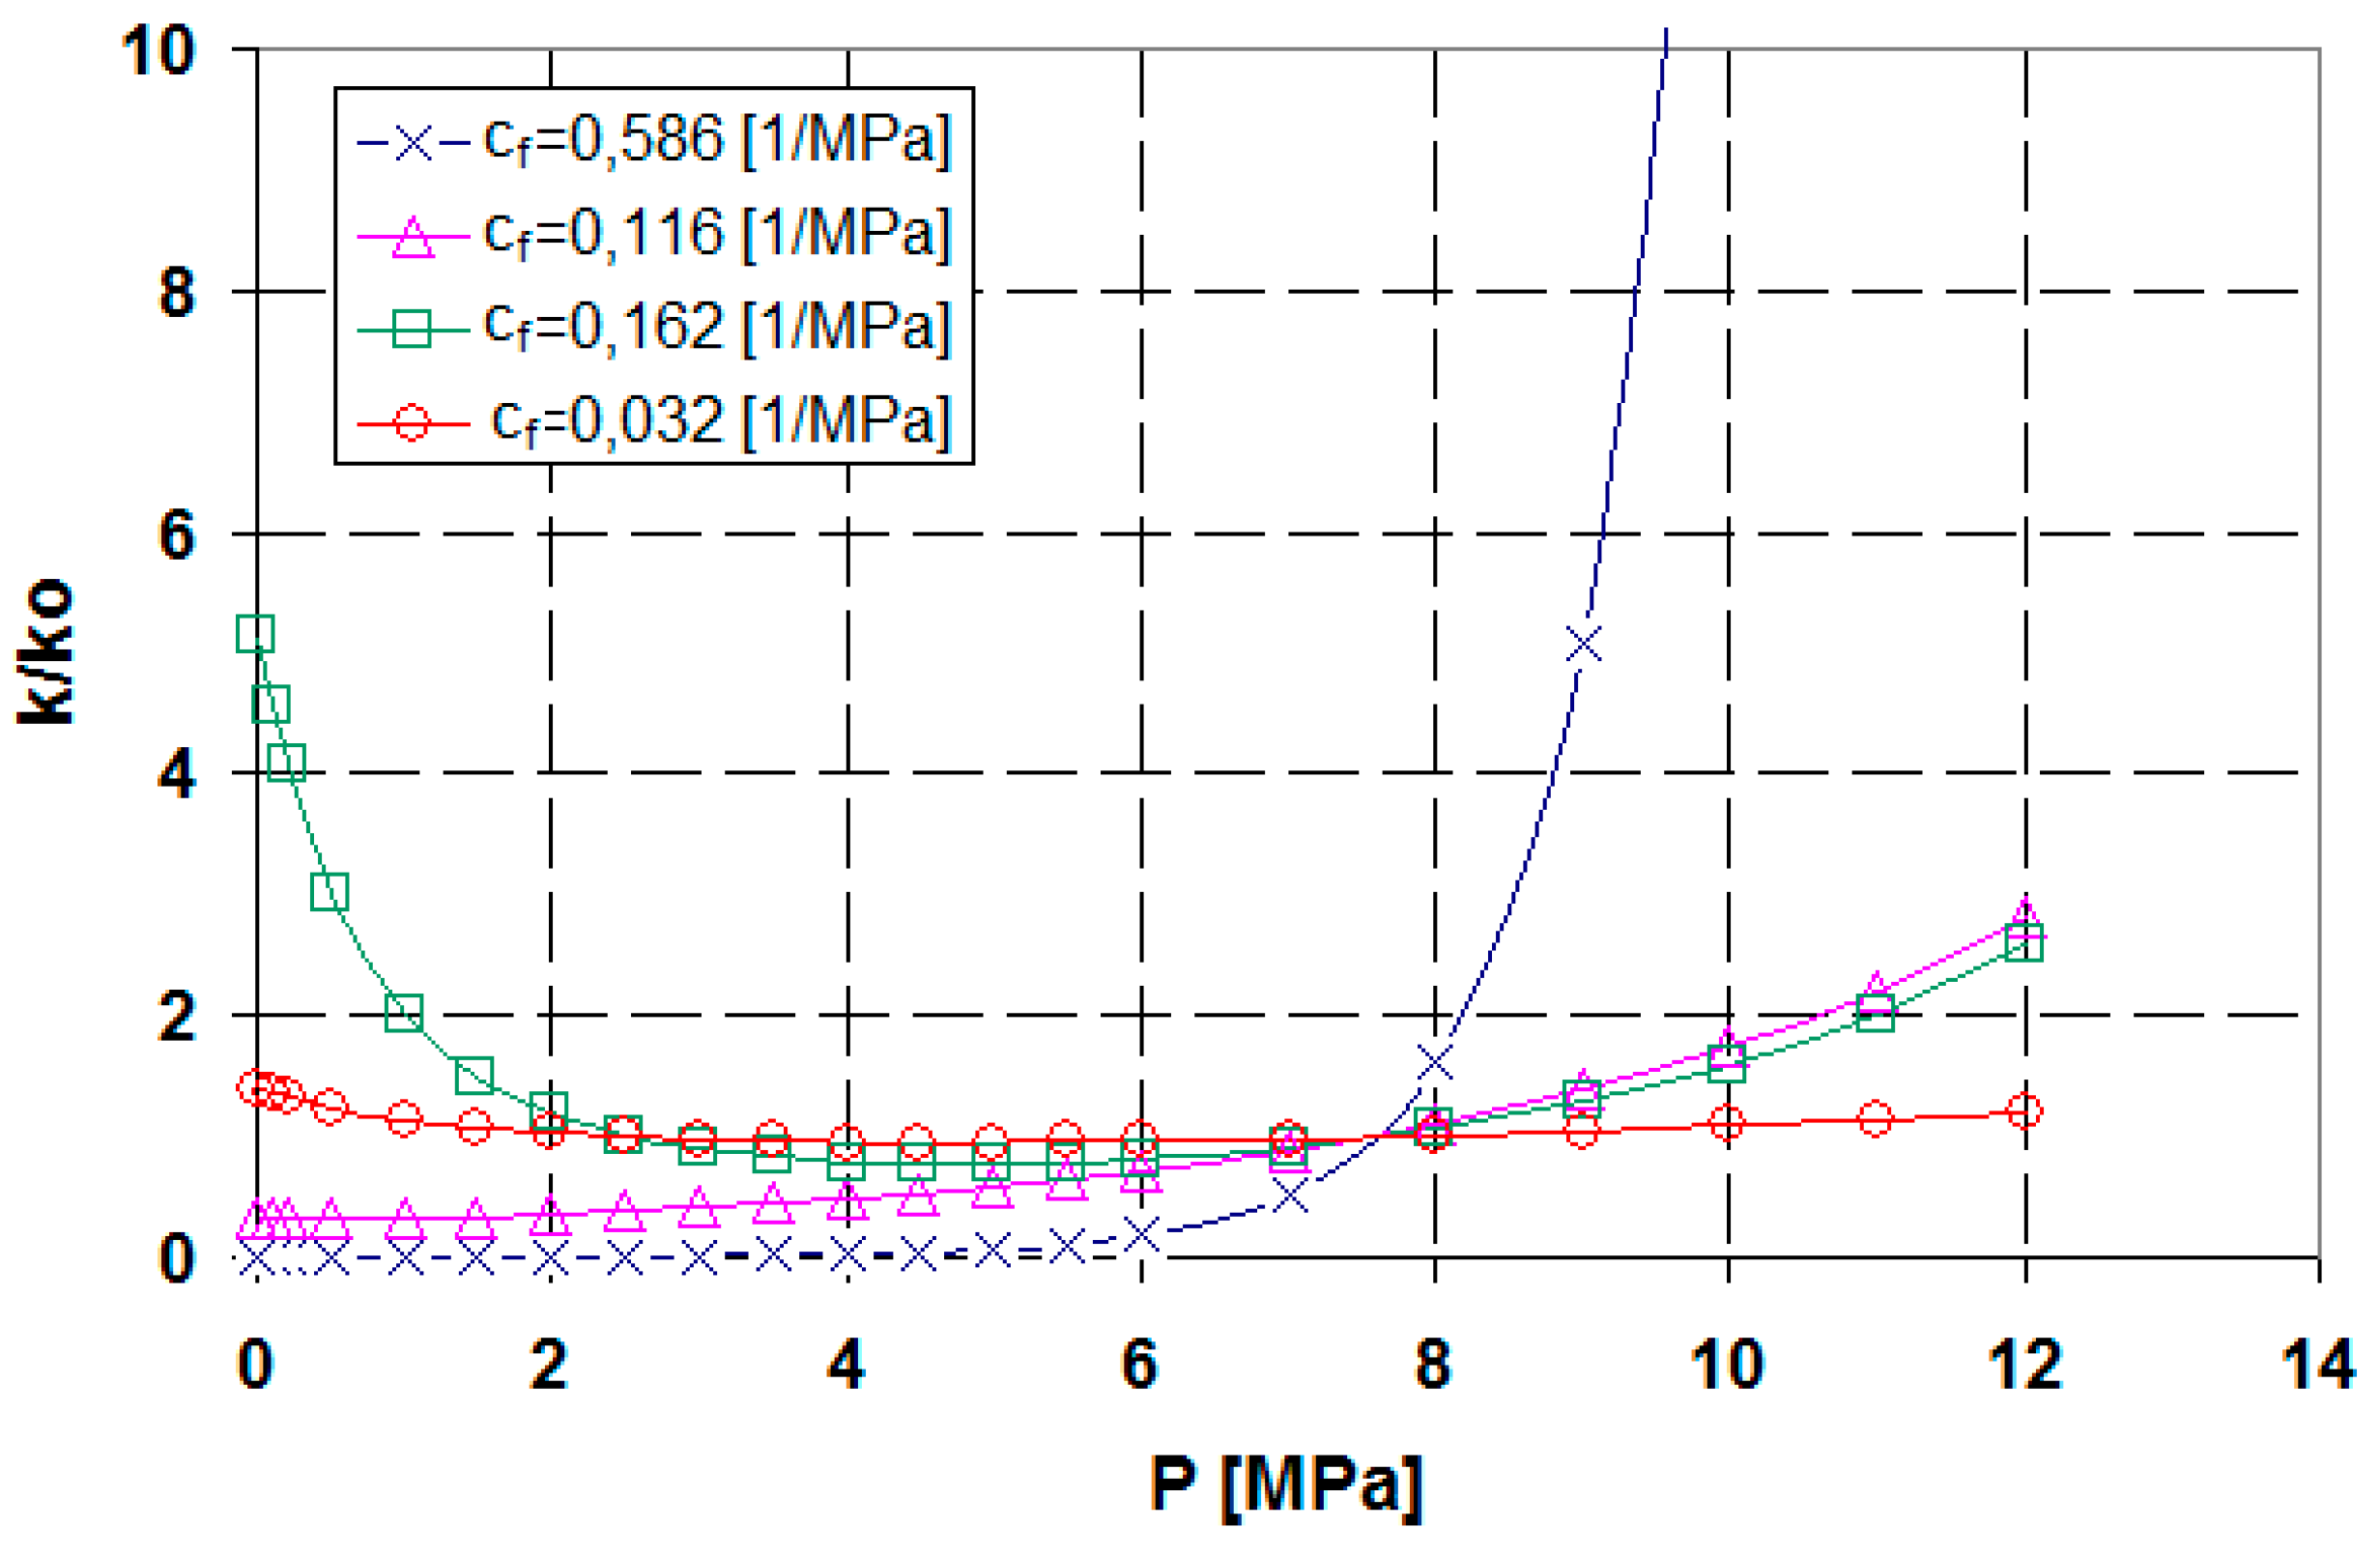
For the coal from the Boomer B-1 well San Juan Basin, this paper only presents a comparison of the results of the permeability-change simulations based on the Palmer and Mansoori model [1,2], the Cui and Bustin model [3], and the improved Shi-Durucan model. It is important to note that the simulation data on the coal properties were taken from the Palmer and Mansoori paper [1]. For their analysis, Palmer and Mansoori adopted four sets of coal parameters that differed in terms of Young’s modulus and porosity (Table 1). This resulted in a variability in the parameter cf, which describes the coal cleat compressibility within a range of cf = 0.582–0.032 1/MPa. From the geomechanical perspective, the parameters that describe the mechanical properties of coal (E and v) and the initial porosity ϕo are correlated and should not be considered as independent. Figure 1, Figure 2 and Figure 3 show graphs depicting changes in permeability as a function of the methane pressure for different models.
Changes in permeability, as depicted above, are determined by two opposing processes involving changes in the coal volume. The first process involves changes in volume produced by the geomechanical action of the methane pore pressure. These changes accompanying the pressure decrease have an adverse impact on the permeability. The higher the coal compressibility 1/M Equation (14), the greater the changes. The second process involves methane desorption, and the changes in volume that accompany desorption (shrinkage) have beneficial effects on the permeability. Both of these processes occur simultaneously but with different intensities during changes in the methane’s pore pressure, depending on the coal properties.
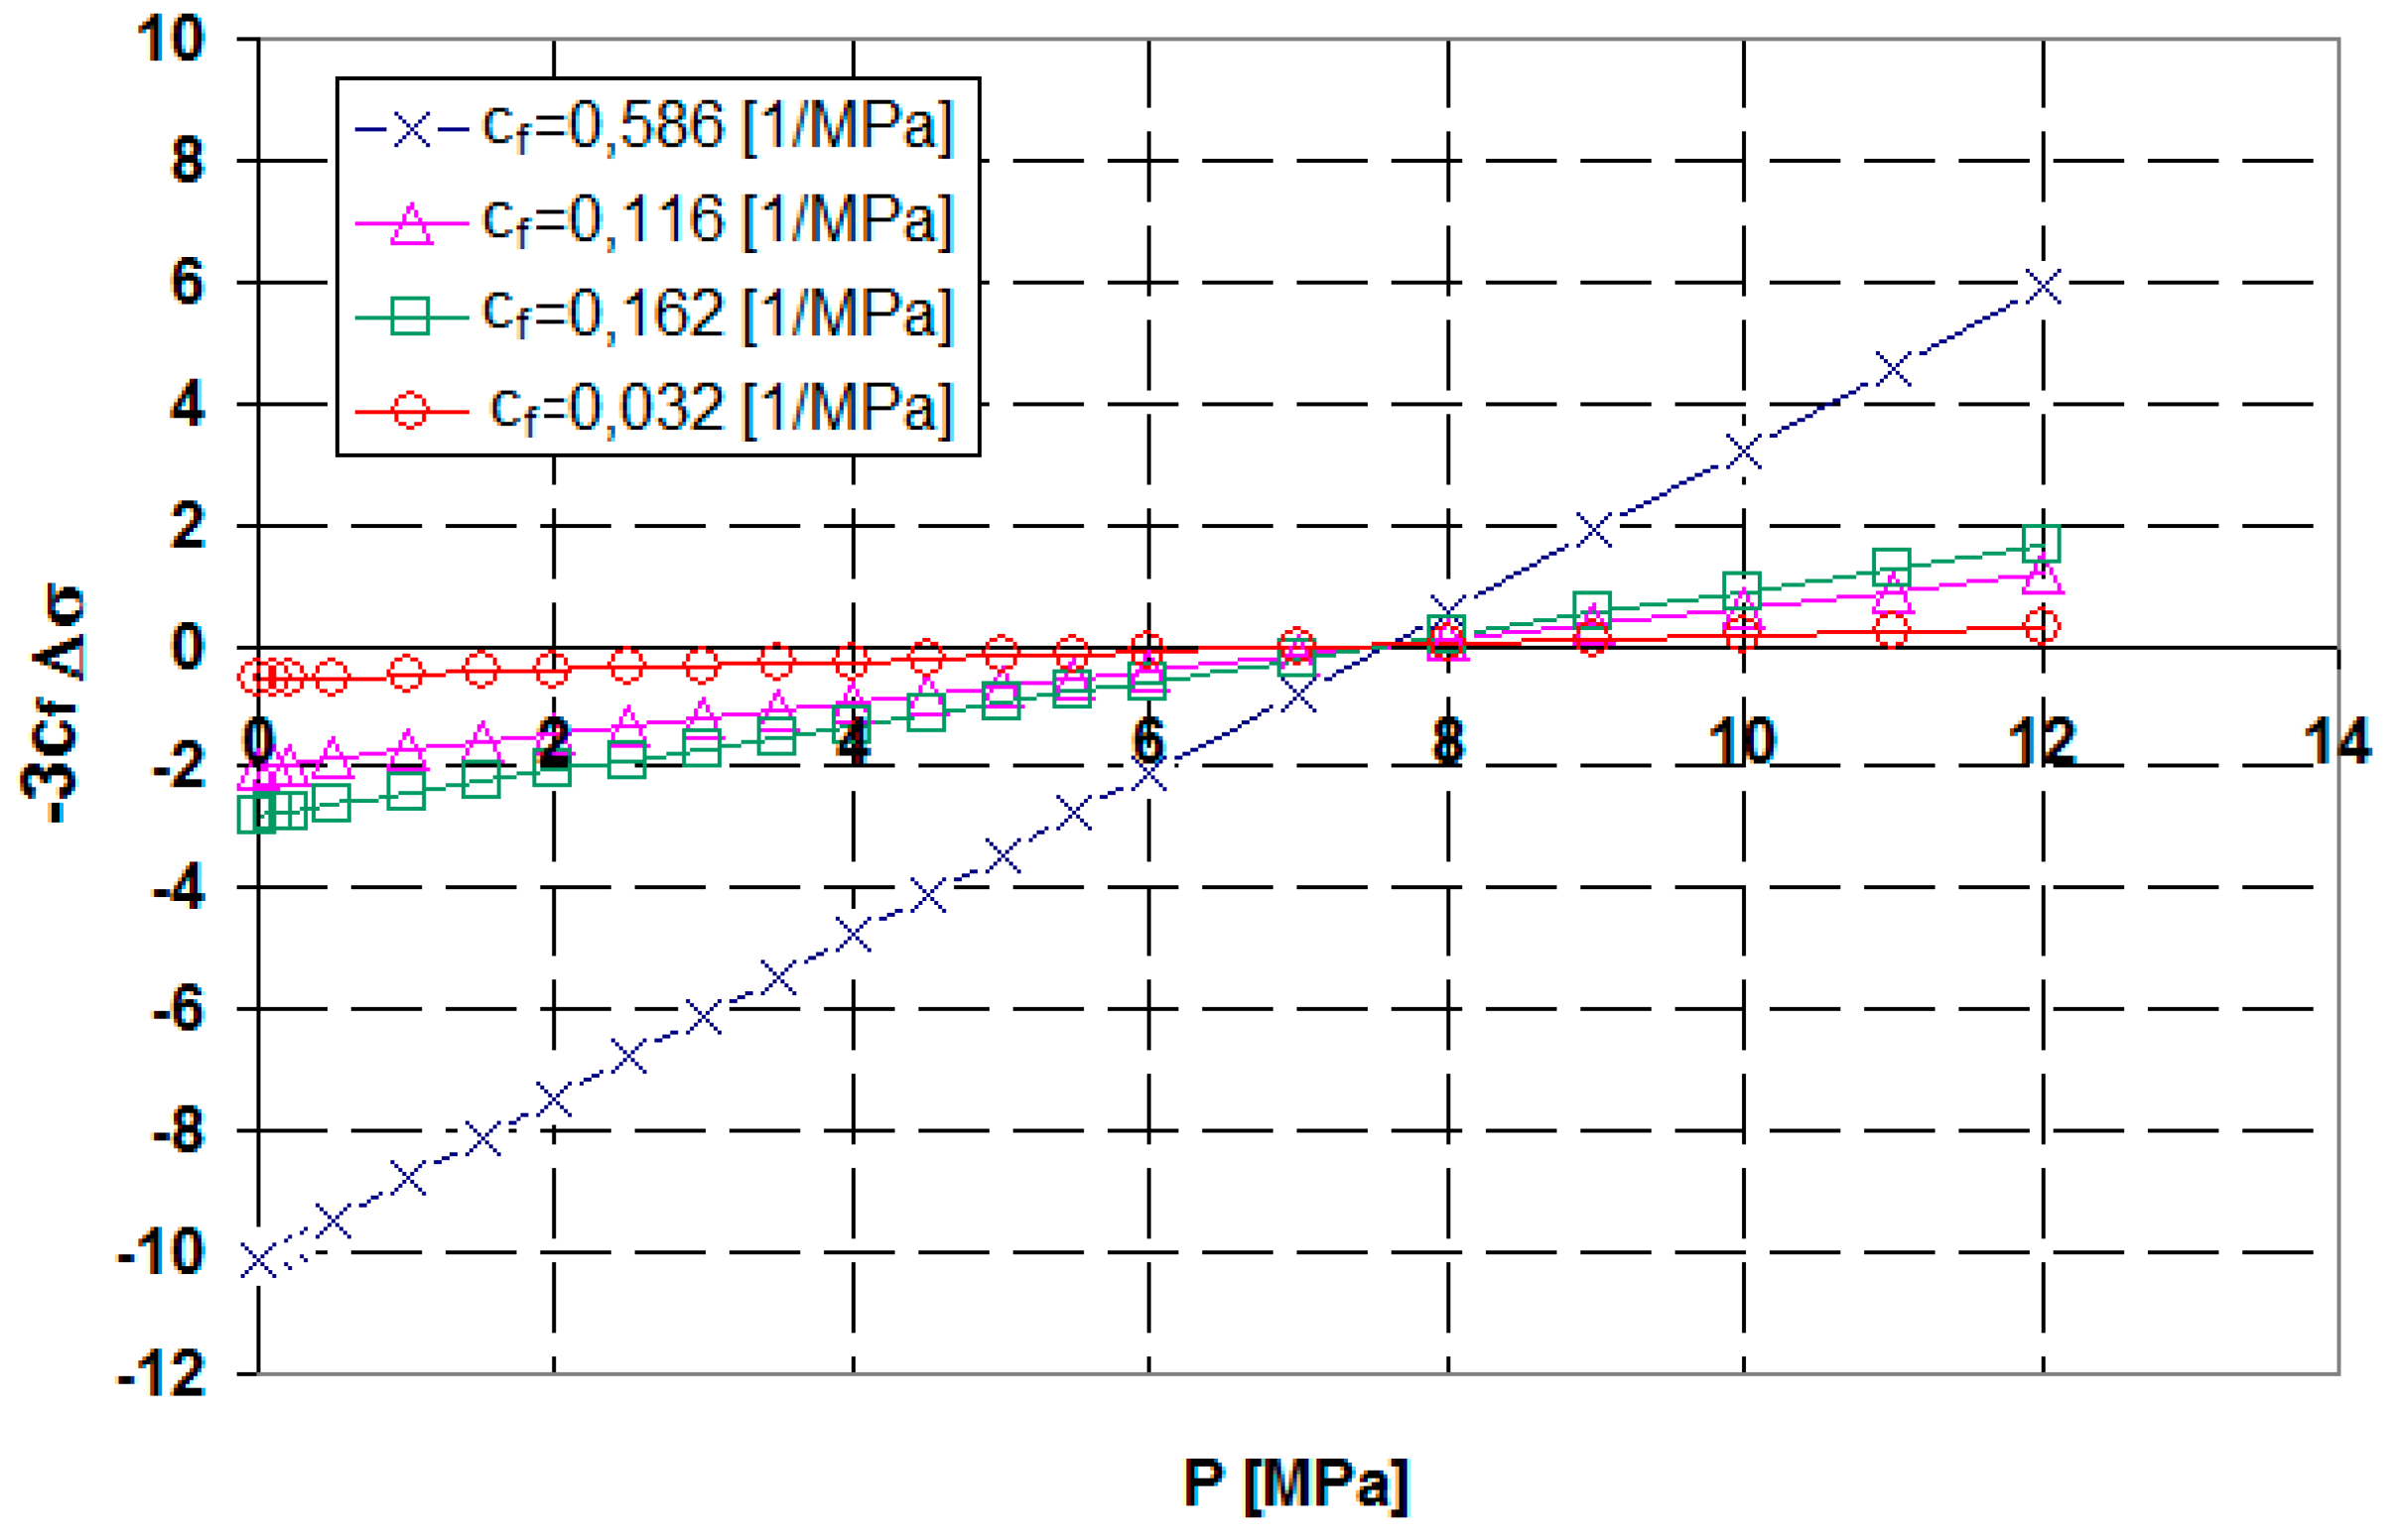
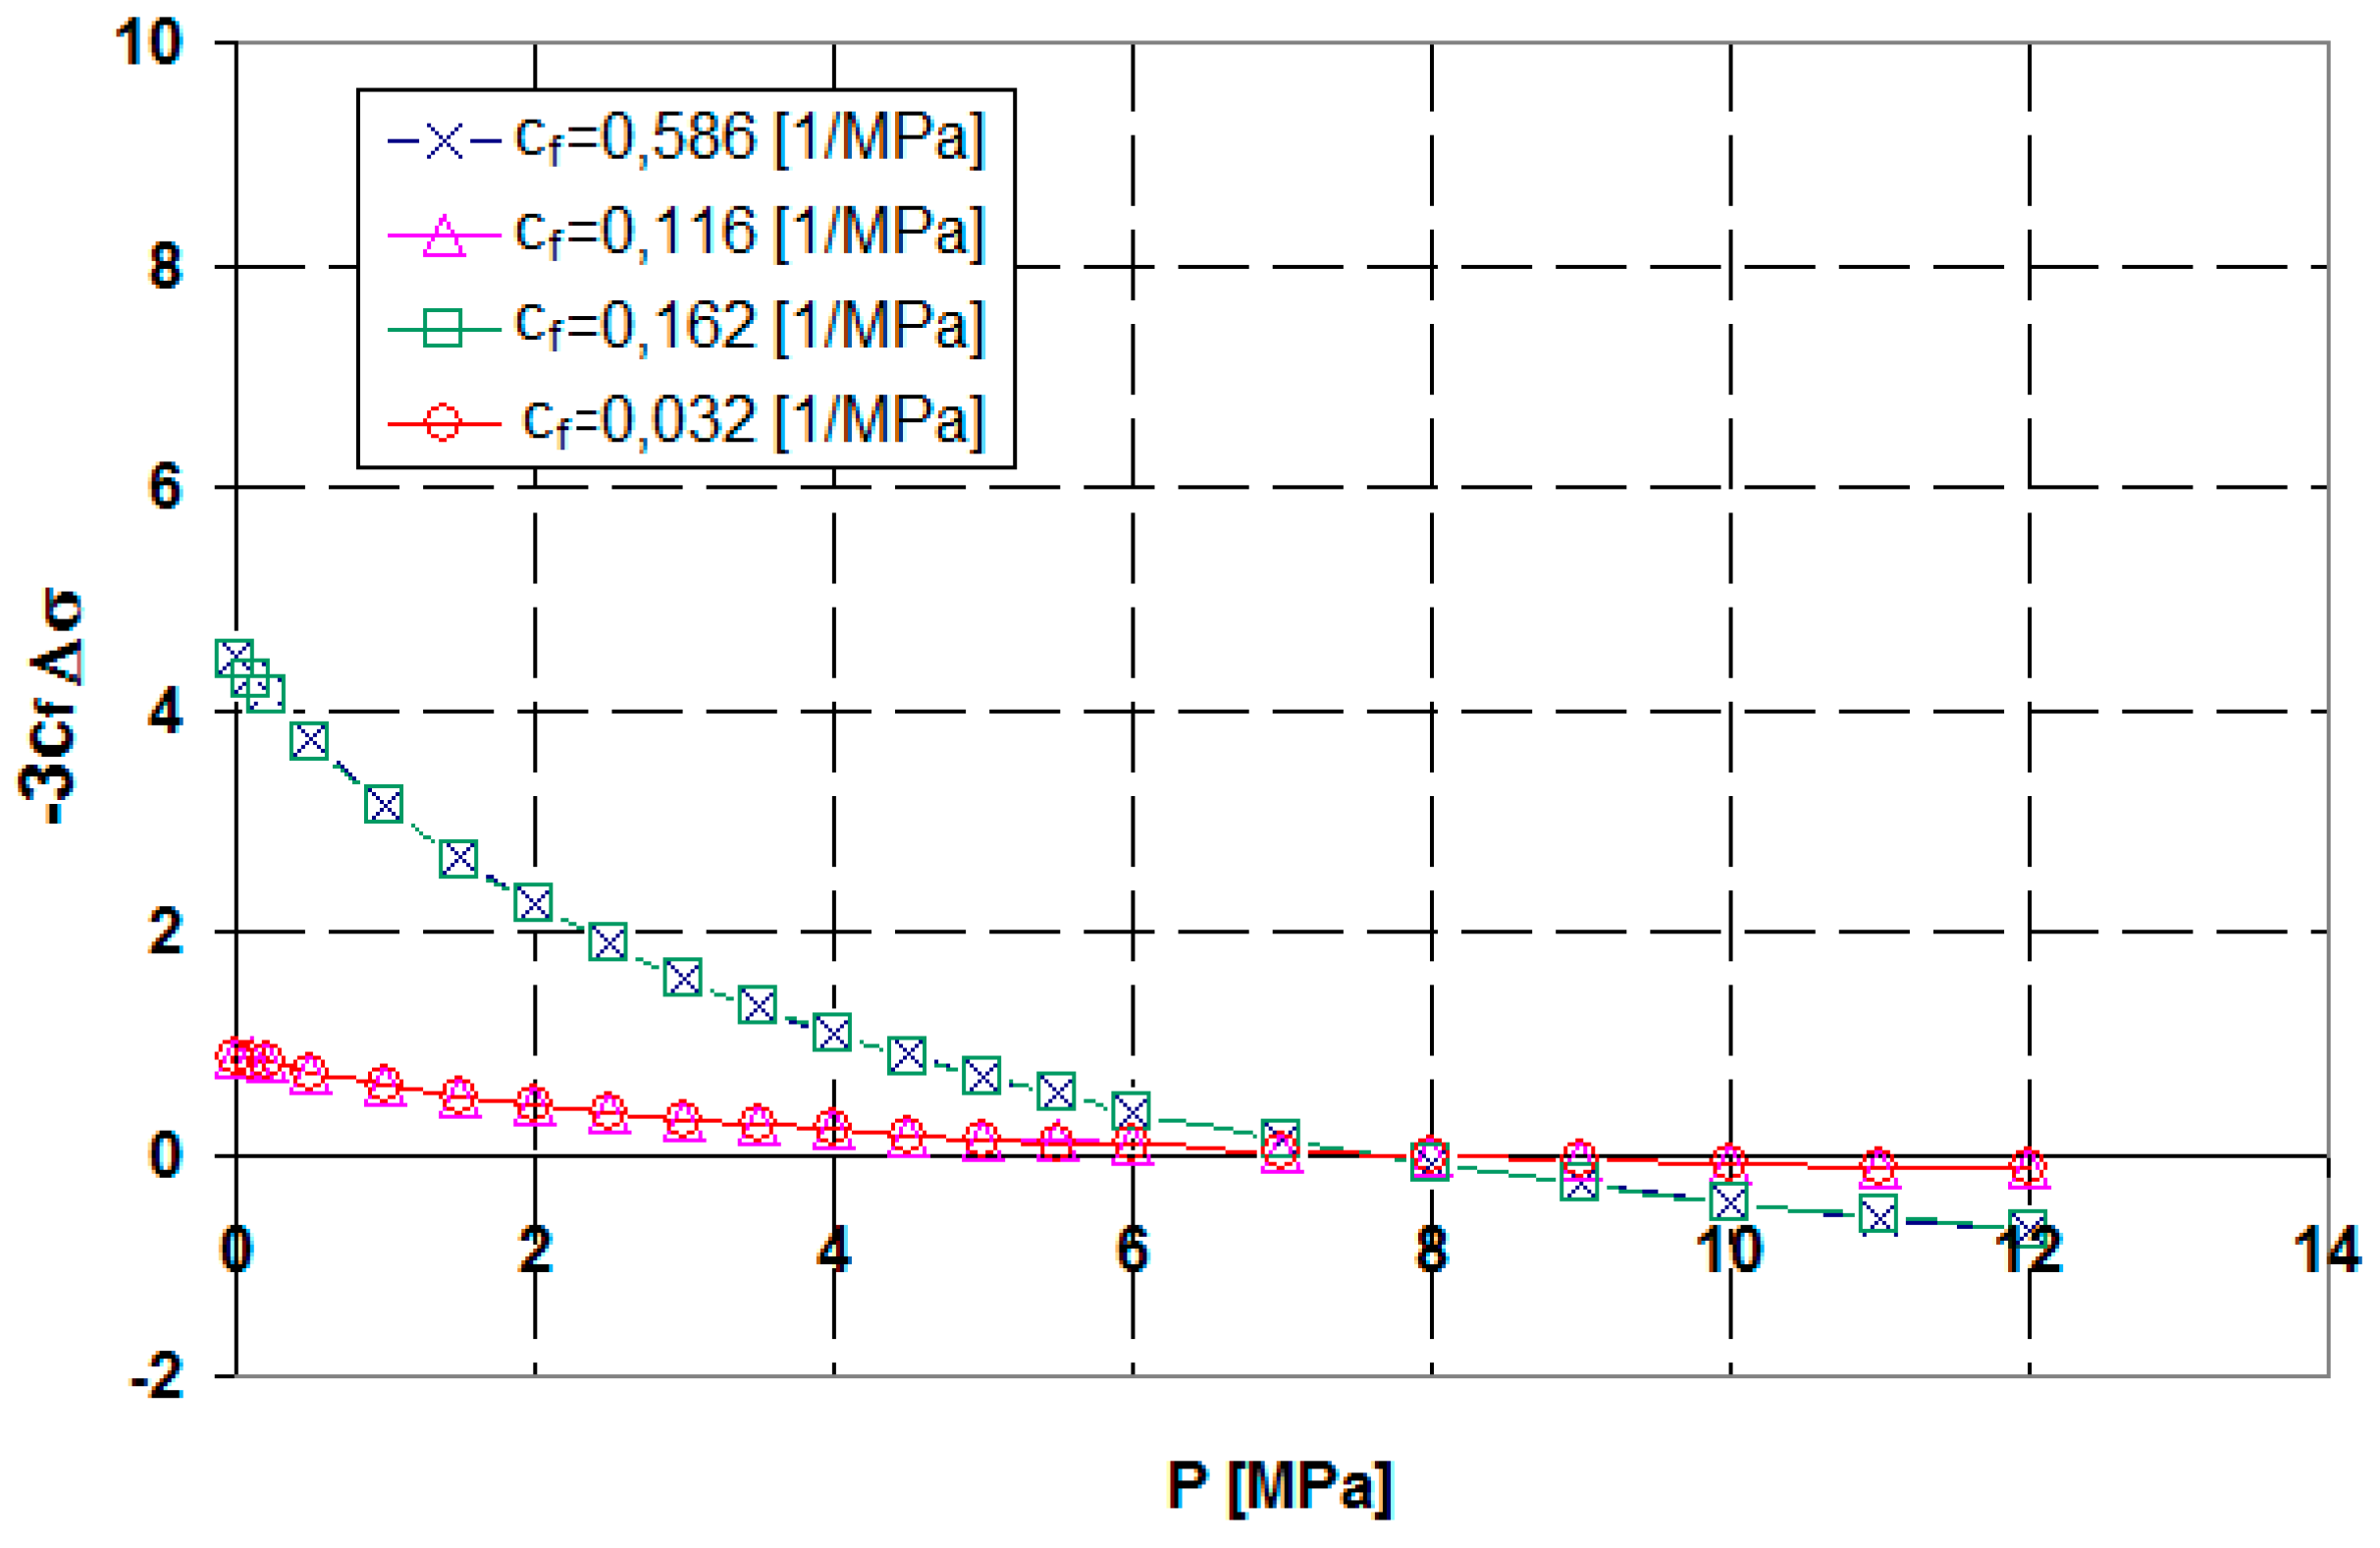
These effects are clear in the separate graphs depicting changes in deformations produced as a result of the geomechanical action of the pore pressure and desorption. For example, using the Cui and Bustin model [3], these correlations can be obtained on the basis of Equation (10) by separating the mechanical action and desorption (Figure 4 and Figure 5), since the −3cfΔσ expression has a linear form as the sum of the two components. The product of the difference of Δσ and the cleat compressibility coefficient cf is highly important for studying changes in coal permeability accompanying changes in the methane’s pore pressure.
The graphs depicted in Figure 4 and Figure 5 show the intensity of deformations resulting from the geomechanical action of methane and desorption, respectively. The cleat compressibility cf is inversely proportional to the constrained axial modulus M and initial porosity ϕo (Equation 14). Consequently, when Young’s modulus for the coal matrix is high (E = 3070 MPa), the geomechanical action is weaker, and it is desorption that determines changes in the permeability (Figure 2, cf = 0.162 1/MPa, cf = 0.032 1/MPa).
The values of the rebound pressure Prb and recovery pressure Prc for each model are presented in Table 6.
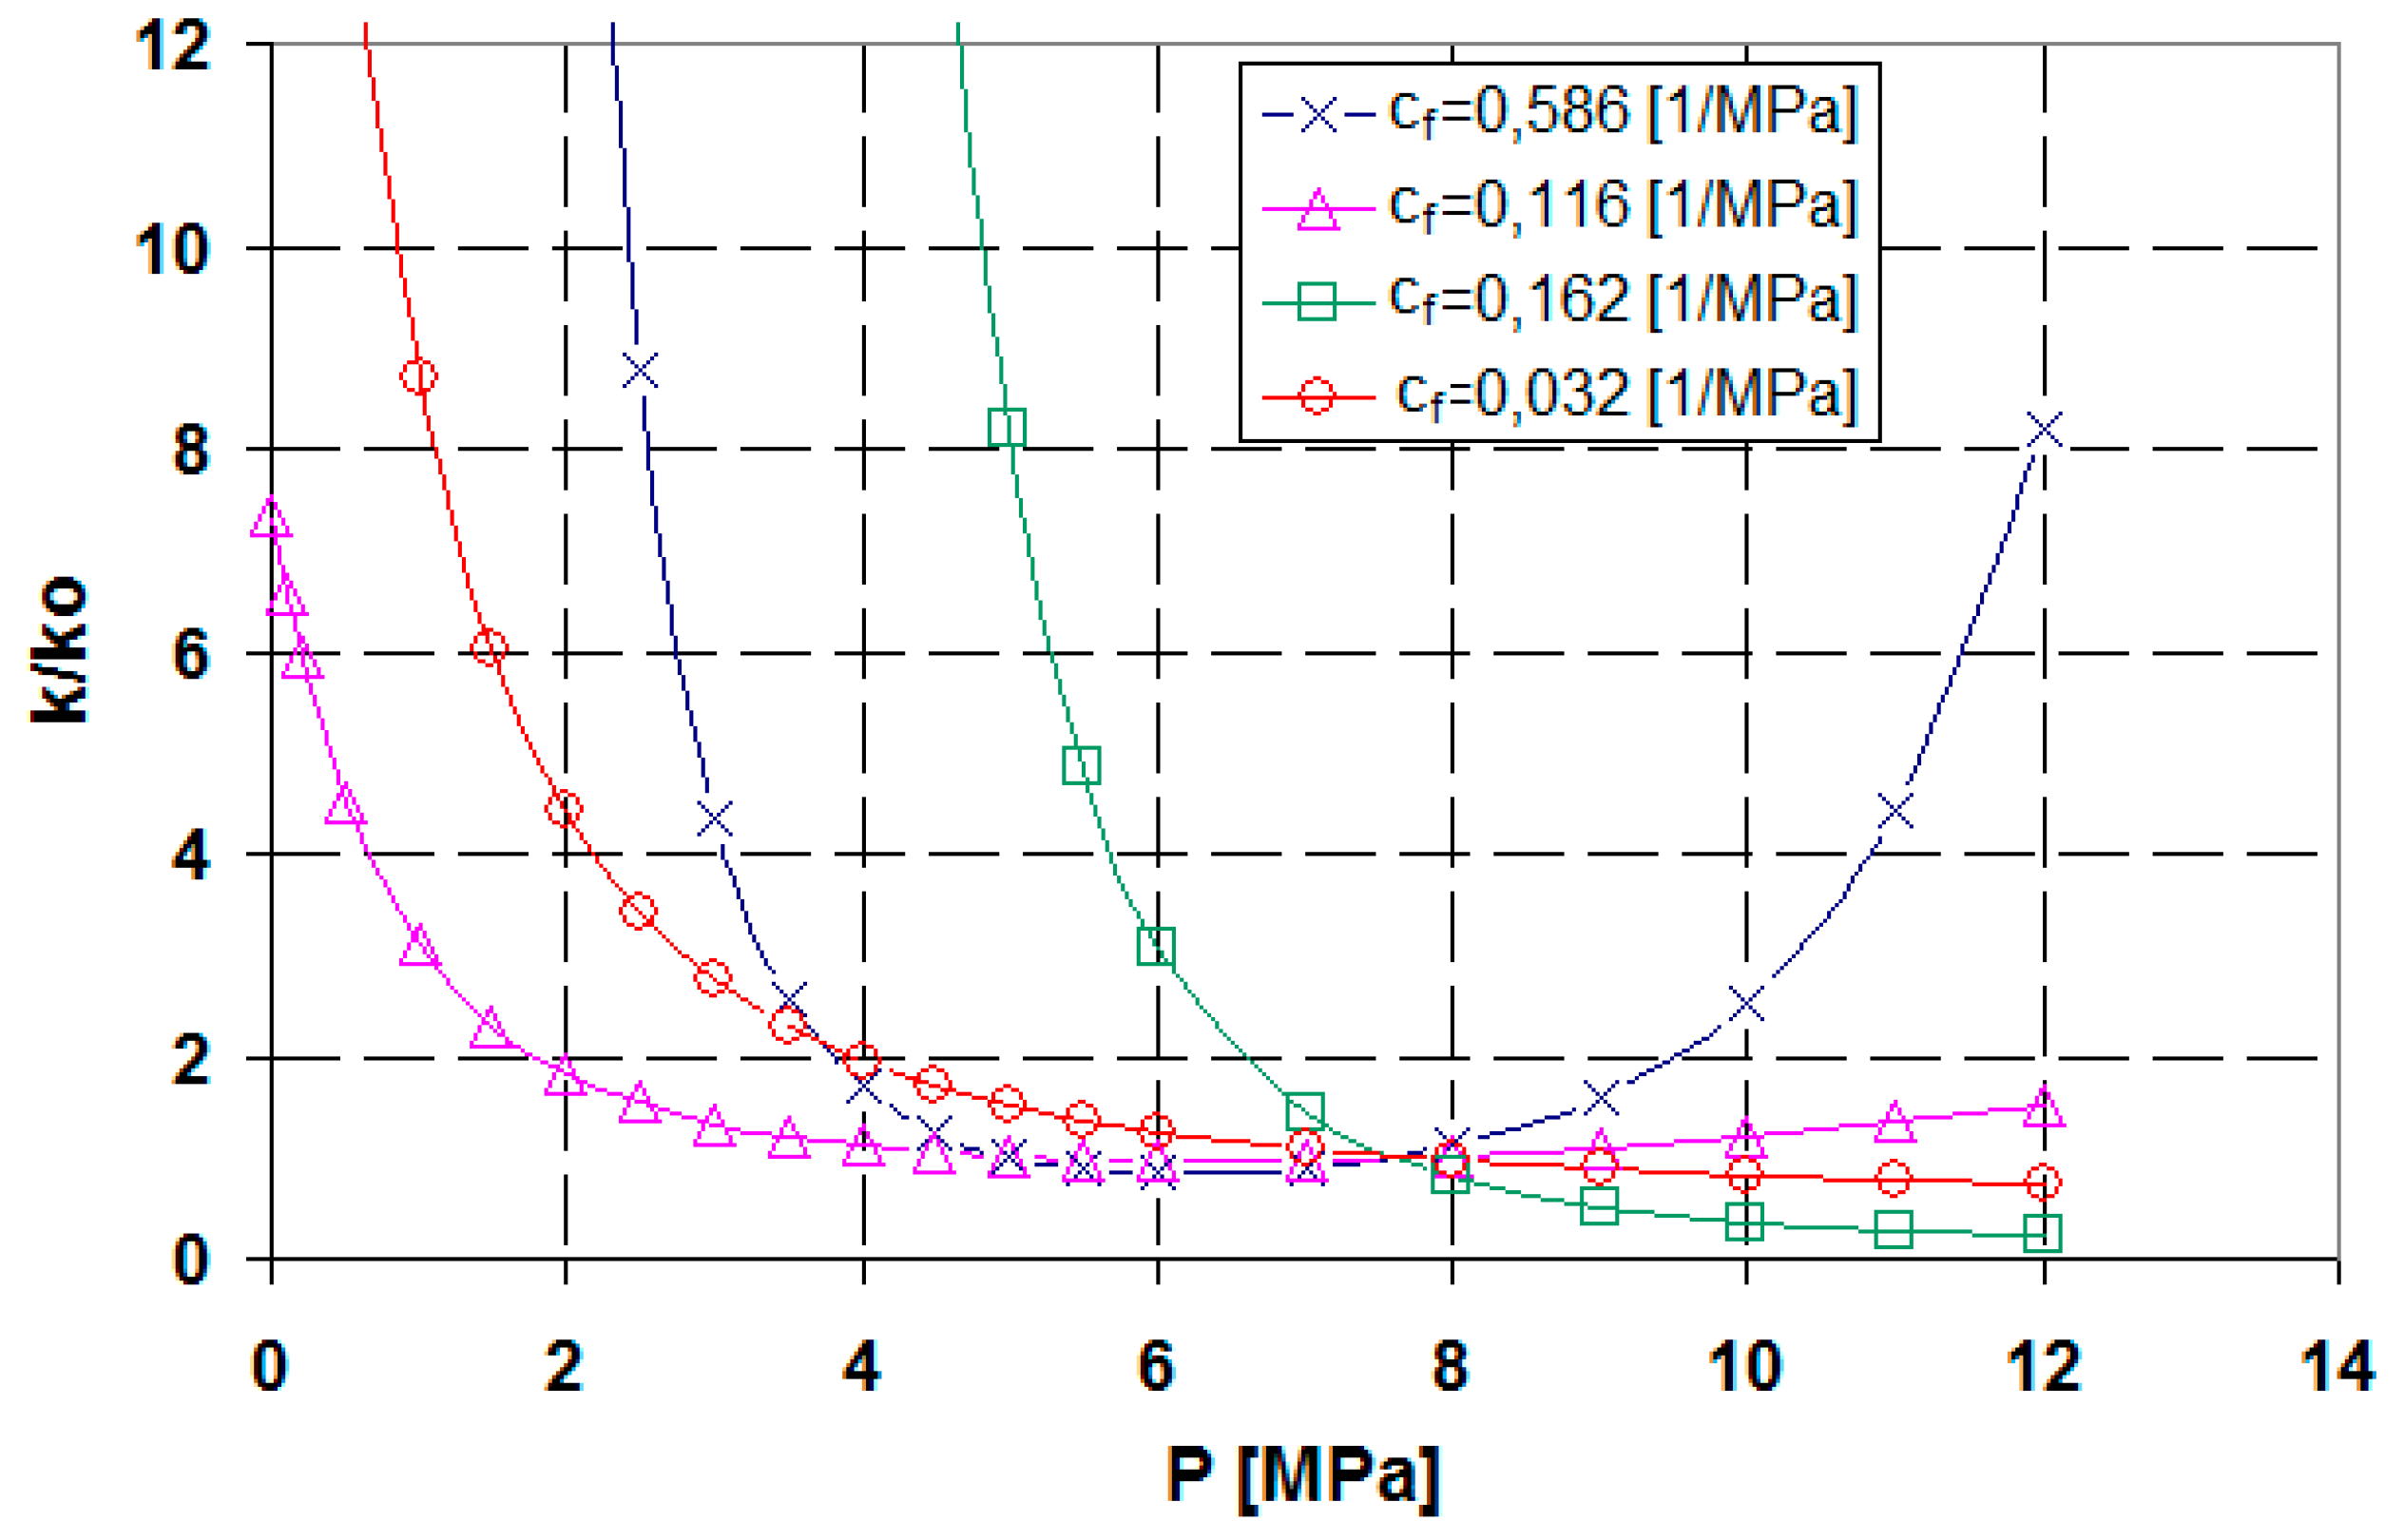
It can be noticed that the simulations for the high constrained axial modulus (M = 6123.9 MPa) rebound pressure Prb has positive values across all of the analysed models. The low constrained axial modulus results (M = 1705.5 MPa) in the low values of Prb. and recovery pressure Prc < 0 suggest that the coal permeability does not reach its initial value k/ko < 1. These results were obtained on the basis of the Palmer and Mansoori, and Cui and Bustin models. The results for changes in permeability based on the improved Shi-Durucan model were significantly overestimated.
Commenting on the results of the analyses of the Boomer well B-1 San Juan basin permeability changes, as presented in Figure 1, Figure 2, Figure 3 and Figure 4, Palmer and Mansoori [1,2] emphasised the importance of the coal deformation properties (E and v) and porosity ϕo, which are crucial for keeping the permeability changes at the appropriate, cost-effective level. Without a doubt, the parameters related to desorption, including low PL = 4.31 MPa and high εl = 0.0128, adopted as constants by Palmer and Mansoori [1,2] for the purposes of their analyses, facilitated the increase in permeability. Unfortunately, there are no detailed data on the variability of these parameters for the Boomer well B-1 San Juan coal to analyse how sensitive these changes in permeability are to different values of εl and PL.
The above considerations actually apply to two of the three discussed models, namely Palmer and Mansoori, and Cui and Bustin. The improved Shi-Durucan model clearly produces results that differ significantly from the others.
3.3. Changes in Permeability in Relation to the Coal from the Mannville Group, Lower Cretaceous, Western Canada
The simulations of the sensitivity to changes in permeability due to parameters related to either methane desorption (εl and PL) or geomechanical action (E, v) and porosity ϕo were possible with the data on the coal from the Mannville Group, Lower Cretaceous, Western Canada (Table 2).
The Bustin and Bustin [18] parameter values, as adopted on the basis of the results of studies by various authors, are within specific ranges, which makes it possible to analyse the sensitivity of the permeability to changes in these parameters.
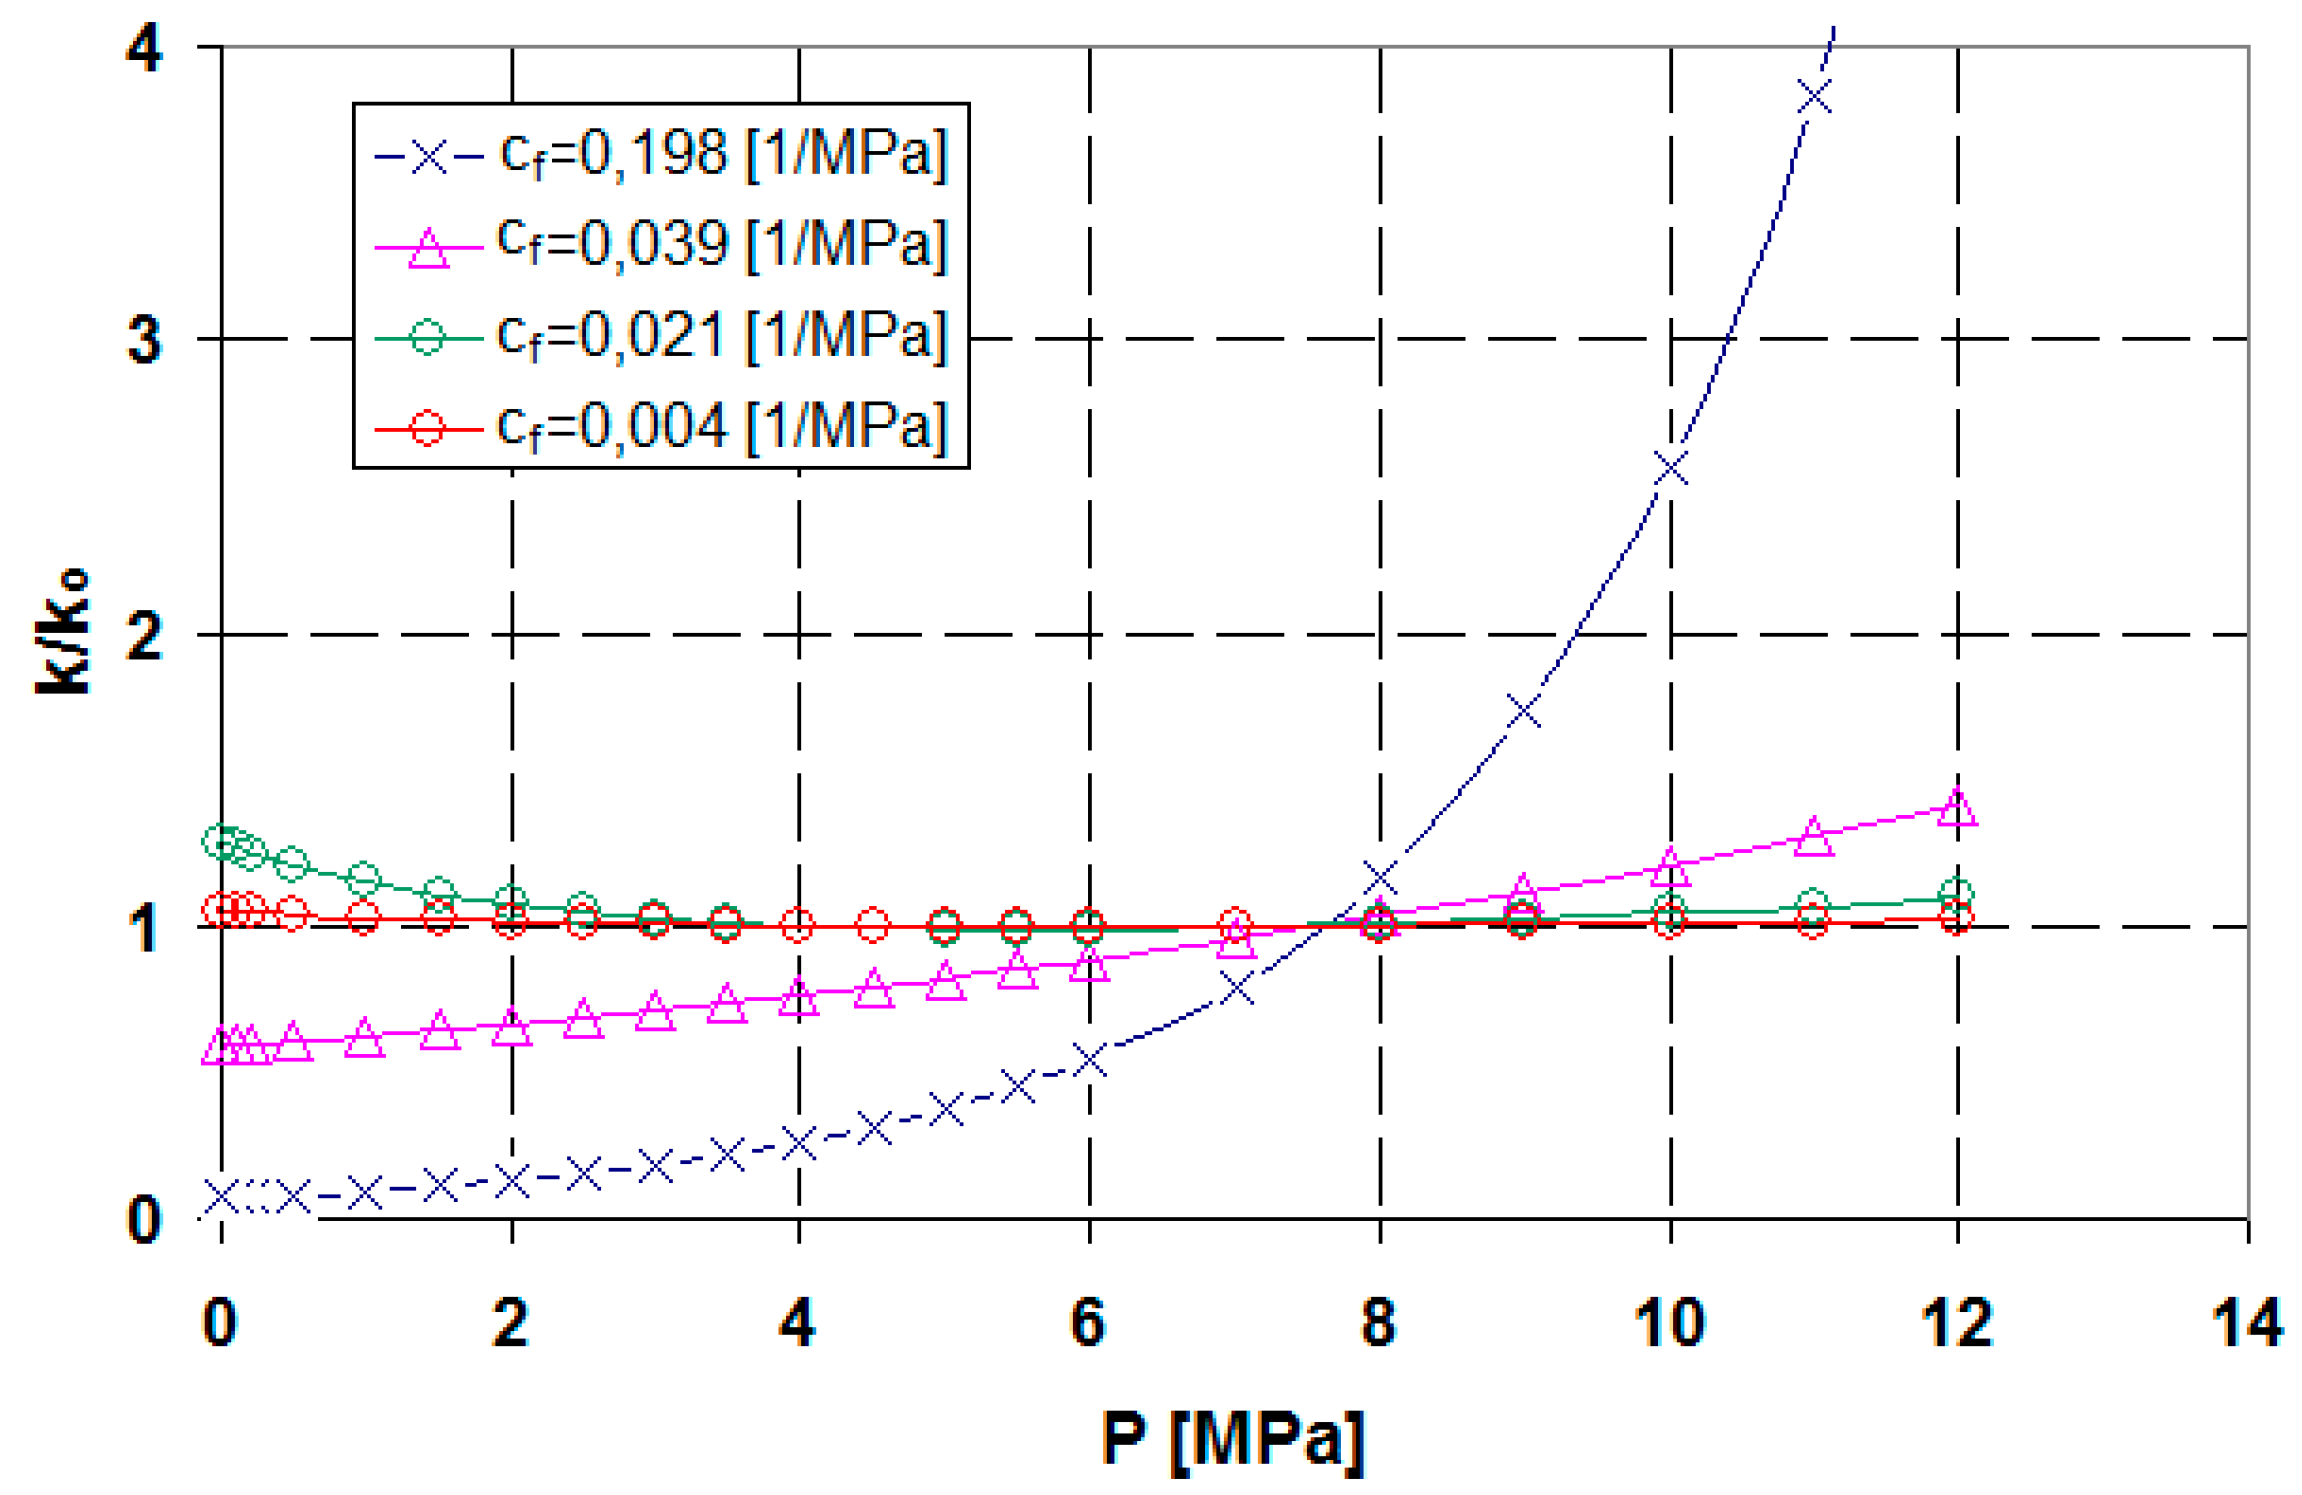
Initially, similarly to the Boomer well B-1 San Juan Basin coal, we adopted different values for the cleat compressibility cf, as obtained for the extreme ranges of the M and ϕo values. The results presented here are based solely on the Cui and Bustin model simulations. Figure 6 shows a graph depicting changes in the Mannville Group coal permeability as a function of the methane’s pore pressure.
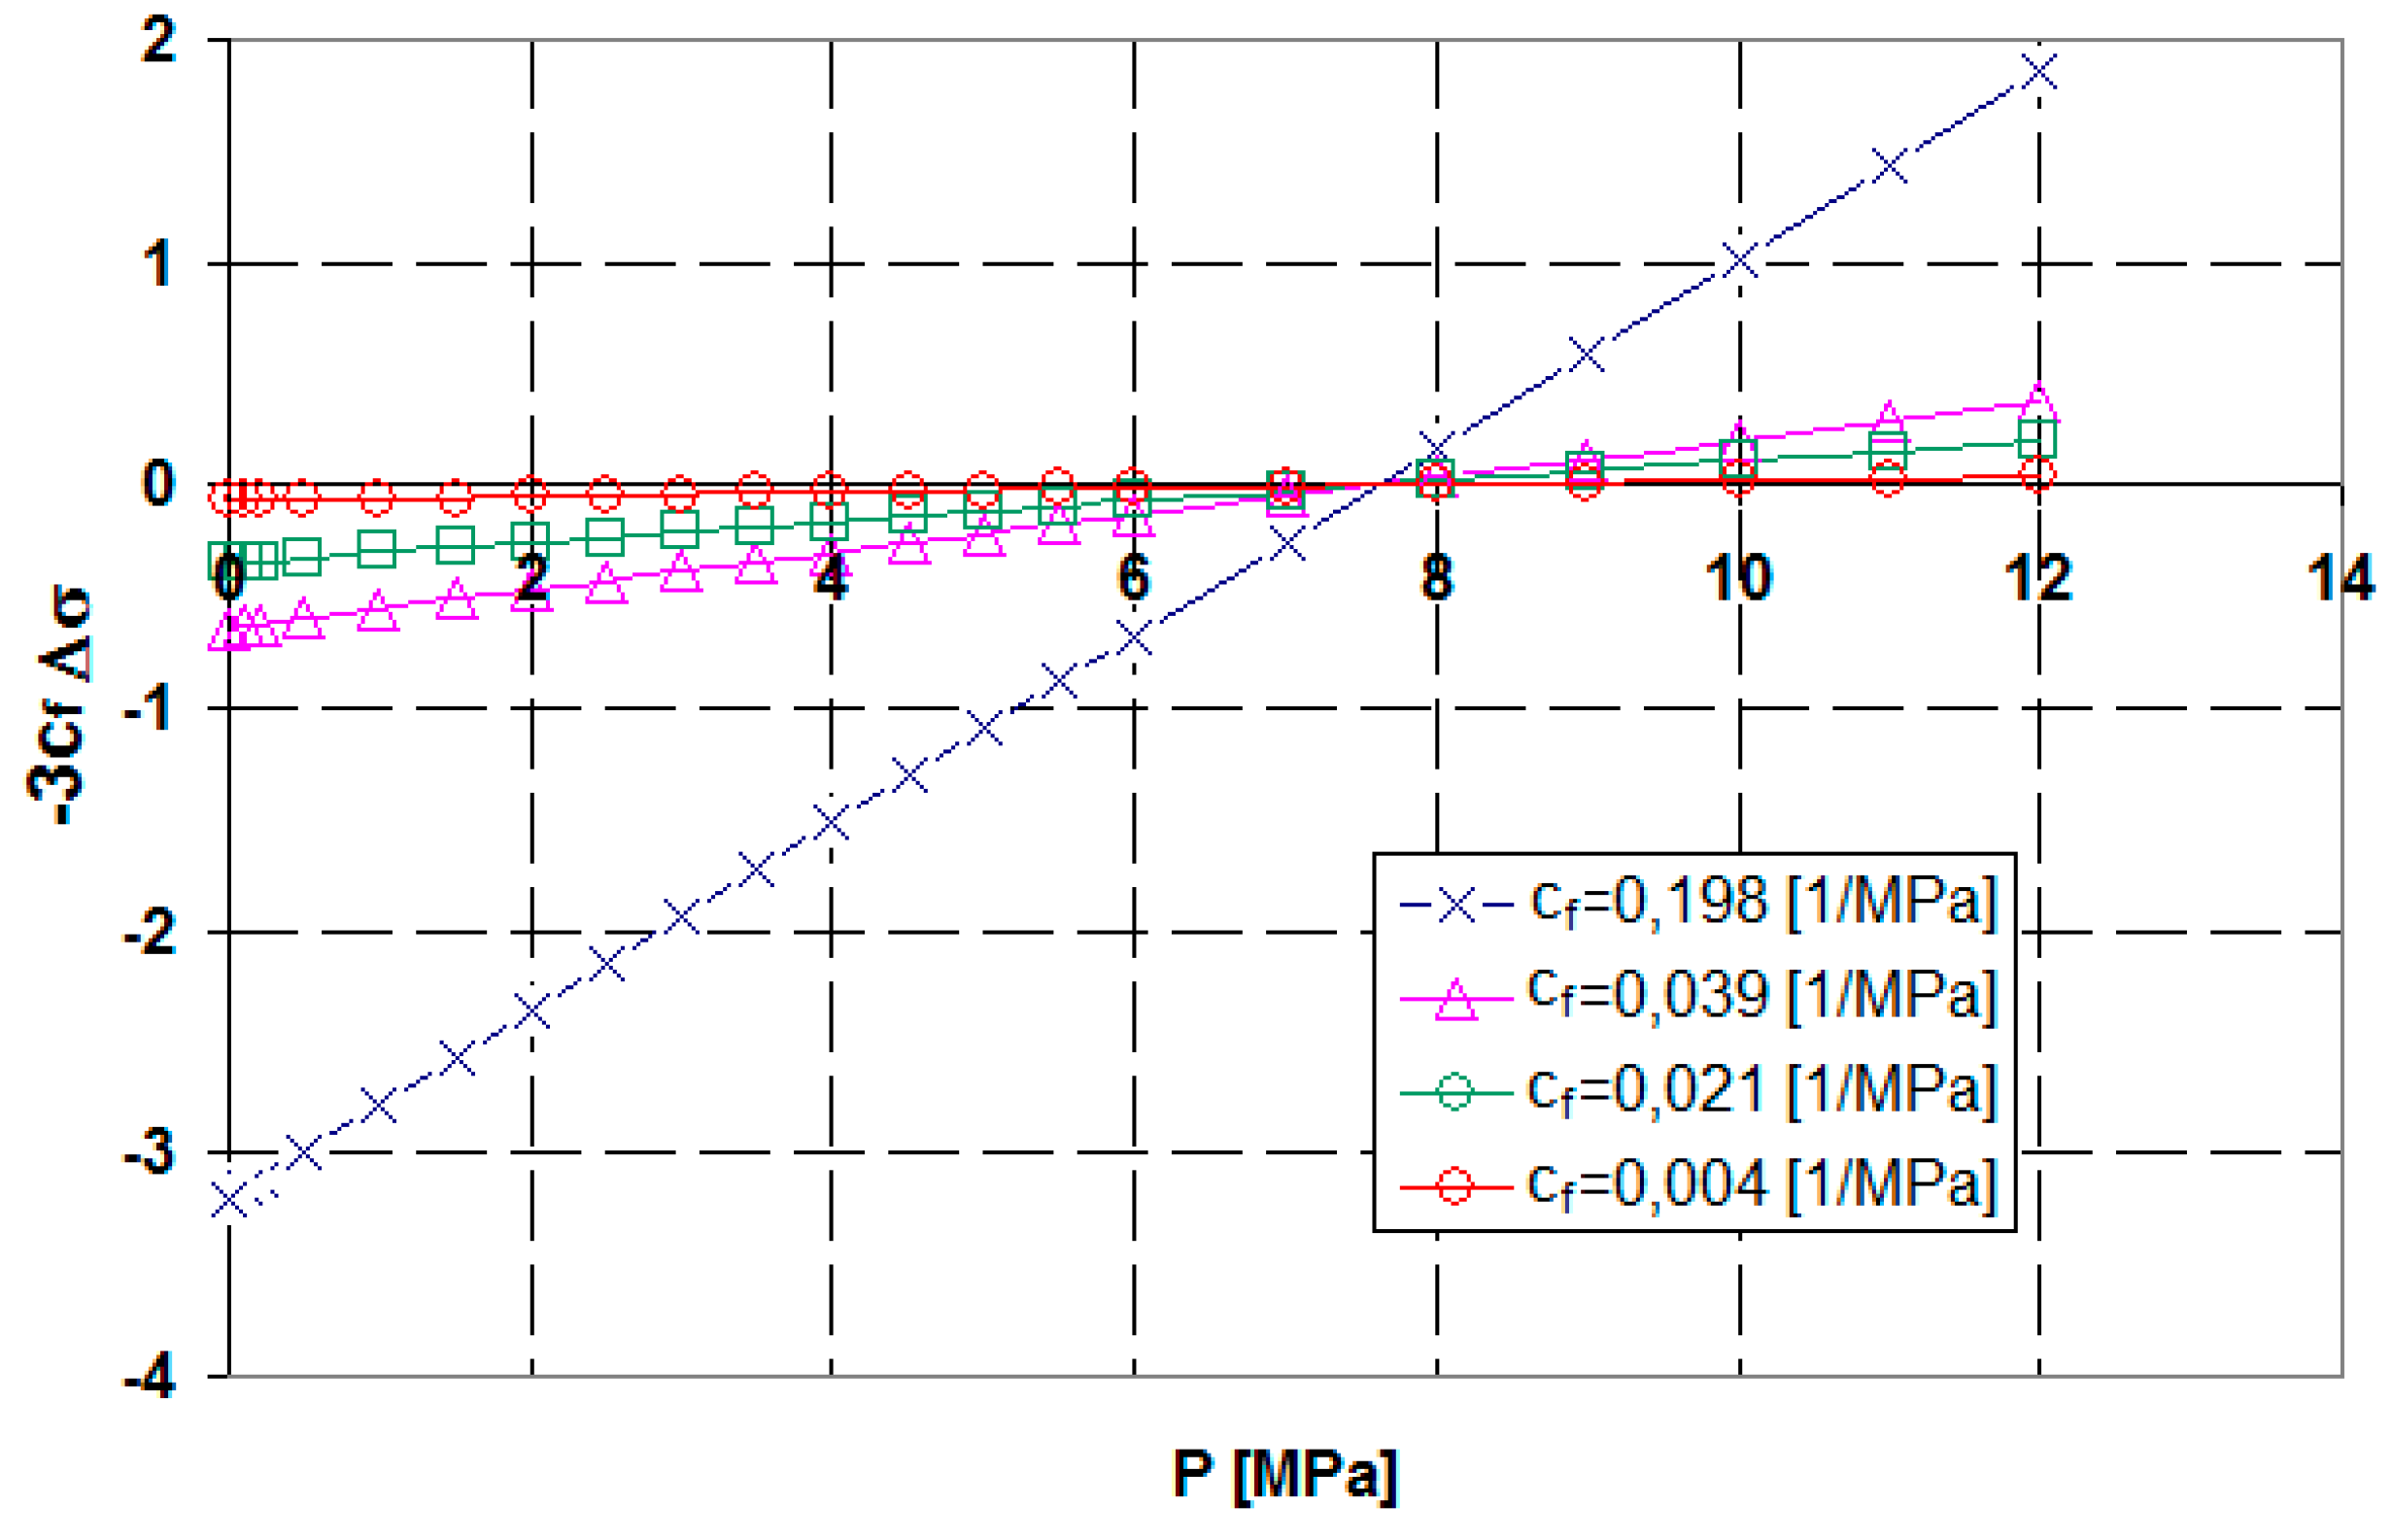
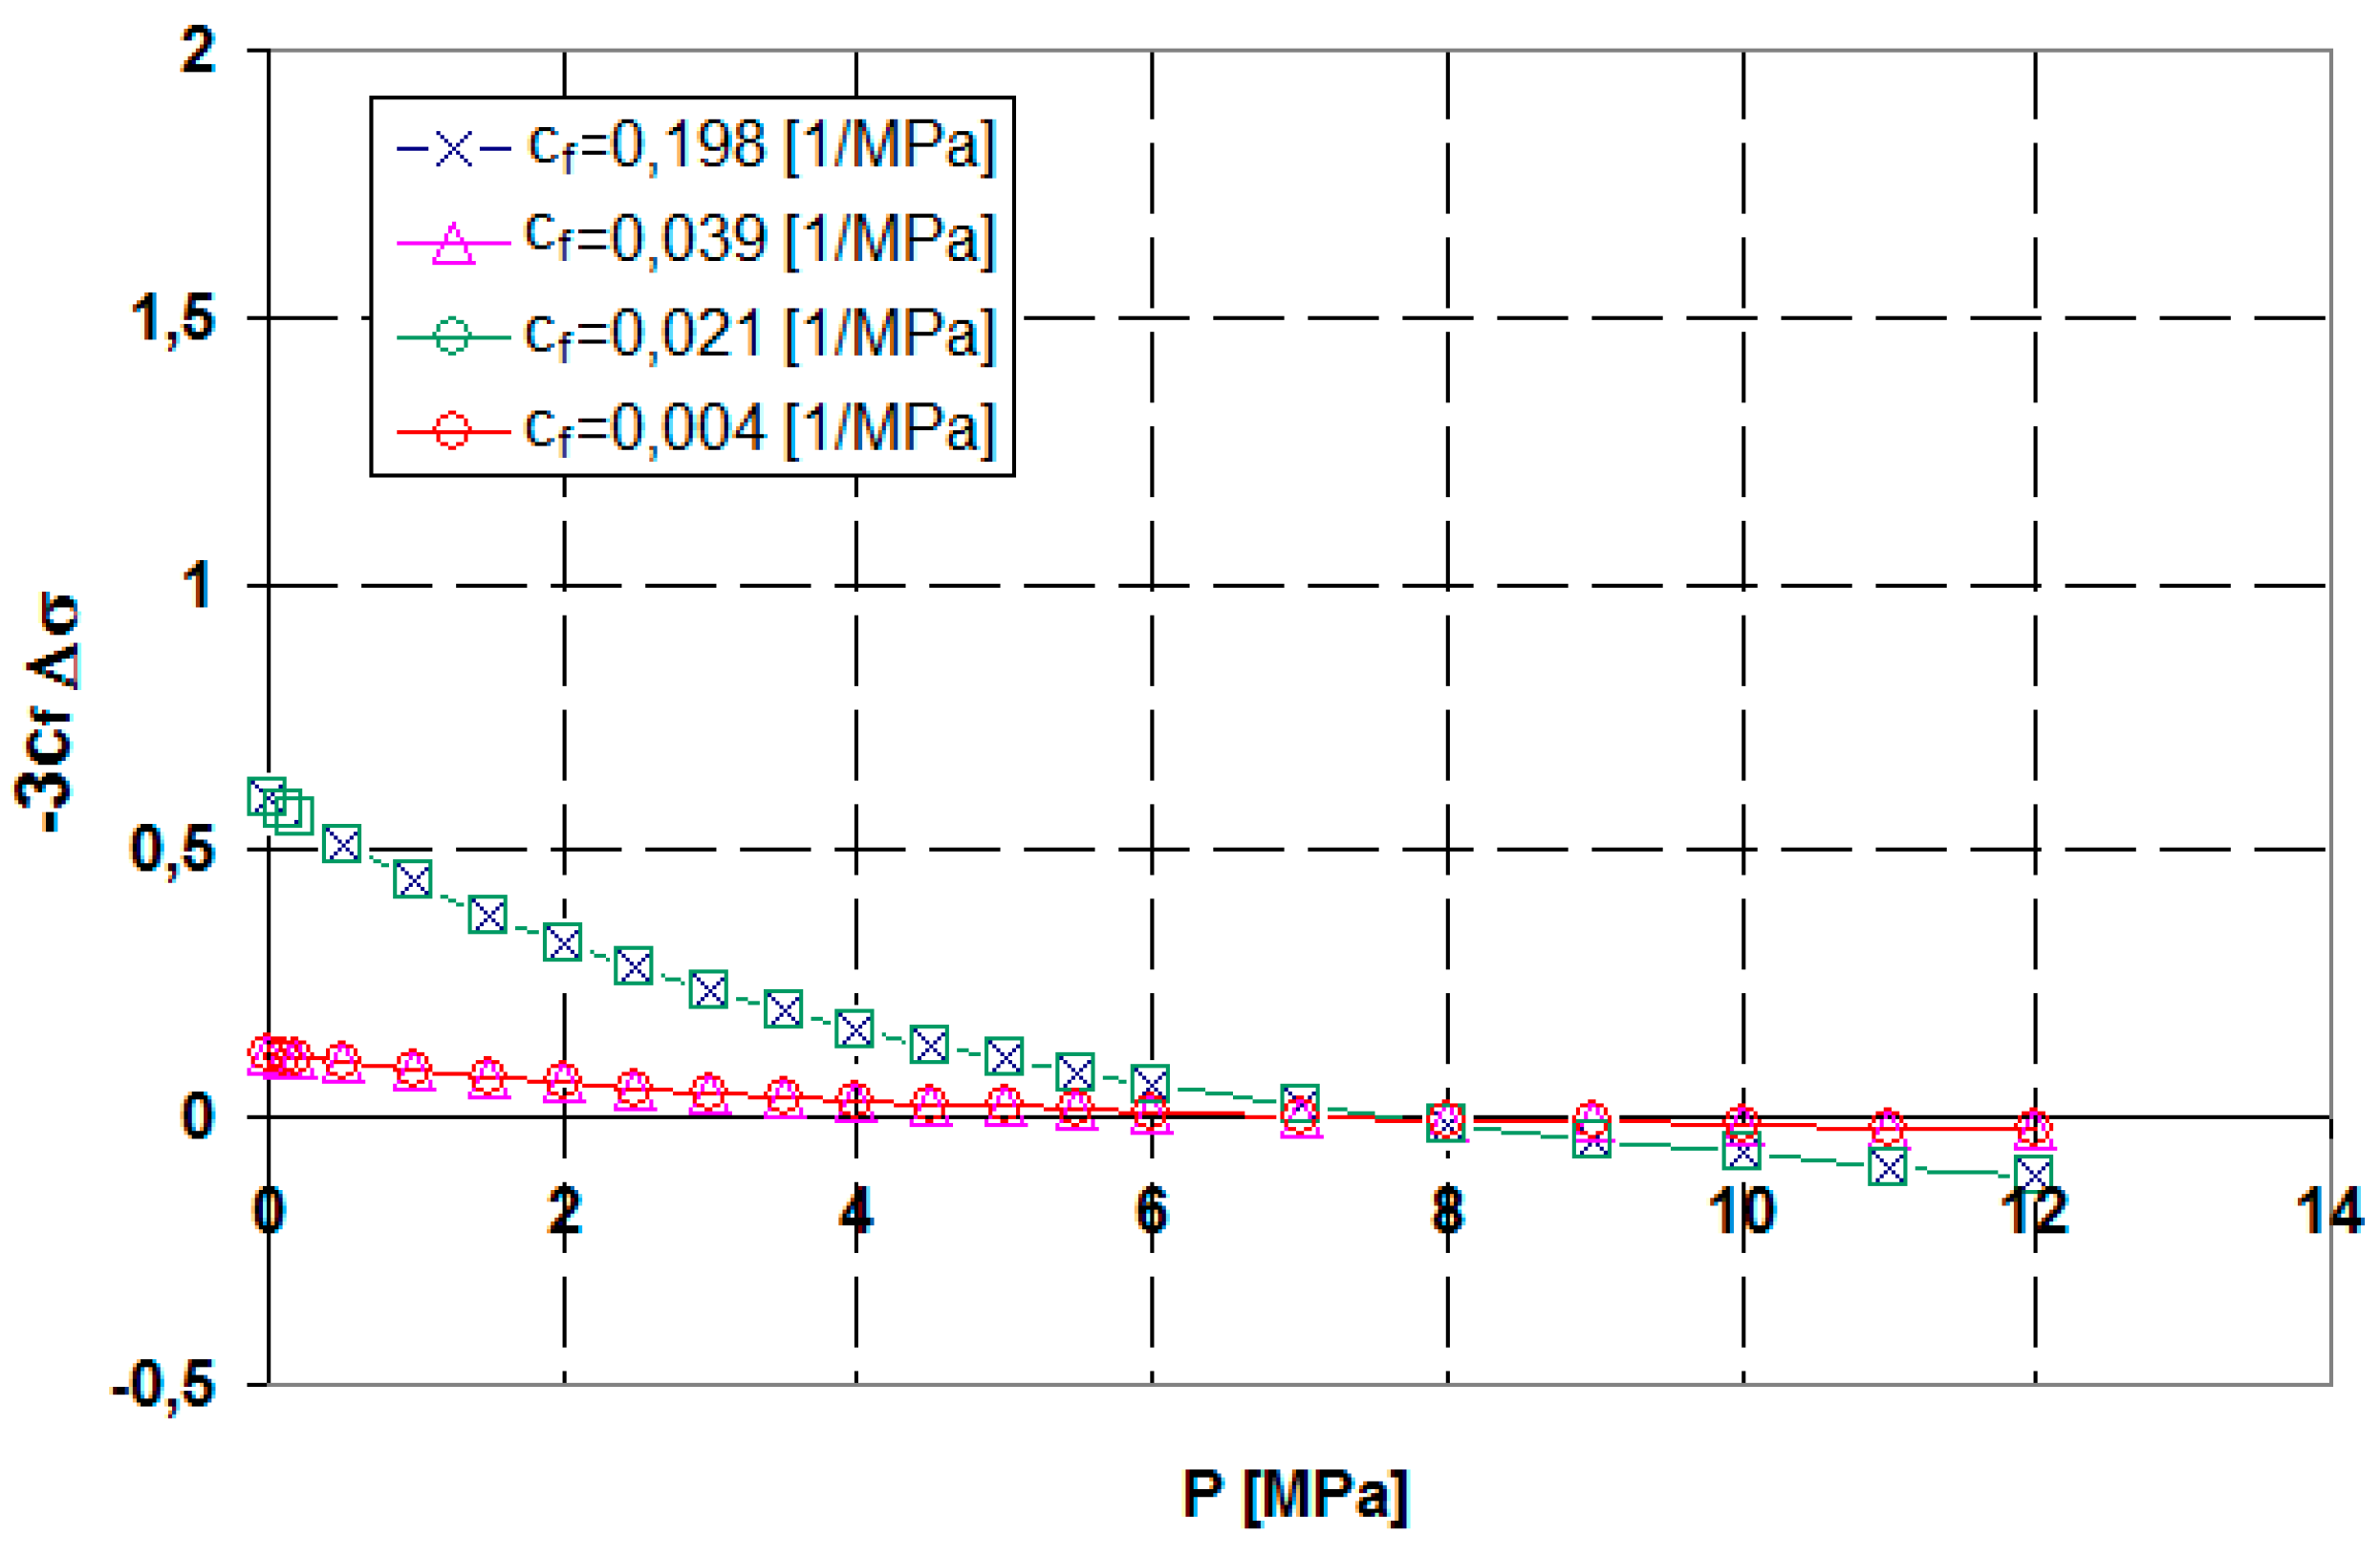
It can be observed that with a high cleat compressibility cf = 0.198 1/MPa and a relatively lower cleat compressibility cf = 0.039 1/MPa, changes in permeability are inefficient, and as the pore pressure drops such changes do not reach their initial values. This is different for coal with a lower cleat compressibility. Here, as the pore pressure drops, the value k/ko > 1, and the chances of an efficient methane extraction improve. In both cleat compressibility cases, the lower values of the initial porosity support changes in the porosity (Figure 6, cf = 0.021 1/MPa, cf = 0.004 1/MPa). These observations are corroborated by Figure 7 and Figure 8, where the changes in deformations are presented separately for the geomechanical action and desorption. With a high cleat compressibility, regardless of the porosity, and with εl = 0.0101 (Figure 7, cf = 0.198 1/MPa, ϕo = 0.006 and cf = 0.039 1/MPa, ϕo = 0.03), the deformation changes produced solely by the geomechanical action of the pore pressure outweigh the effects associated with methane desorption.
These results show that deformations caused by the geomechanical action of methane’s pore pressure (Figure 7, cf = 0.198 1/MPa) contribute to unfavourable changes in permeability (Figure 6, cf = 0.198 1/MPa), and this is largely due to the coal cleat compressibility cf. A low or high initial porosity can significantly influence these changes.
The above comments on the impact of geomechanical parameters, such as coal compressibility 1/M and ϕo, on the coal permeability are confirmed by the rebound pressure Prb and recovery pressure Prc values (Table 7).
For the coal from the Mannville Group basin, which has a lower constrained axial modulus M = 840.3 MPa, i.e., a lower coal cleat compressibility cf, both the rebound pressure and recovery pressure take negative values (Table 7). For a higher constrained axial modulus M = 7731.1 MPa, both pressure types had high, positive values. This shows that, as the pore pressure drops, the coal permeability changes beneficially.
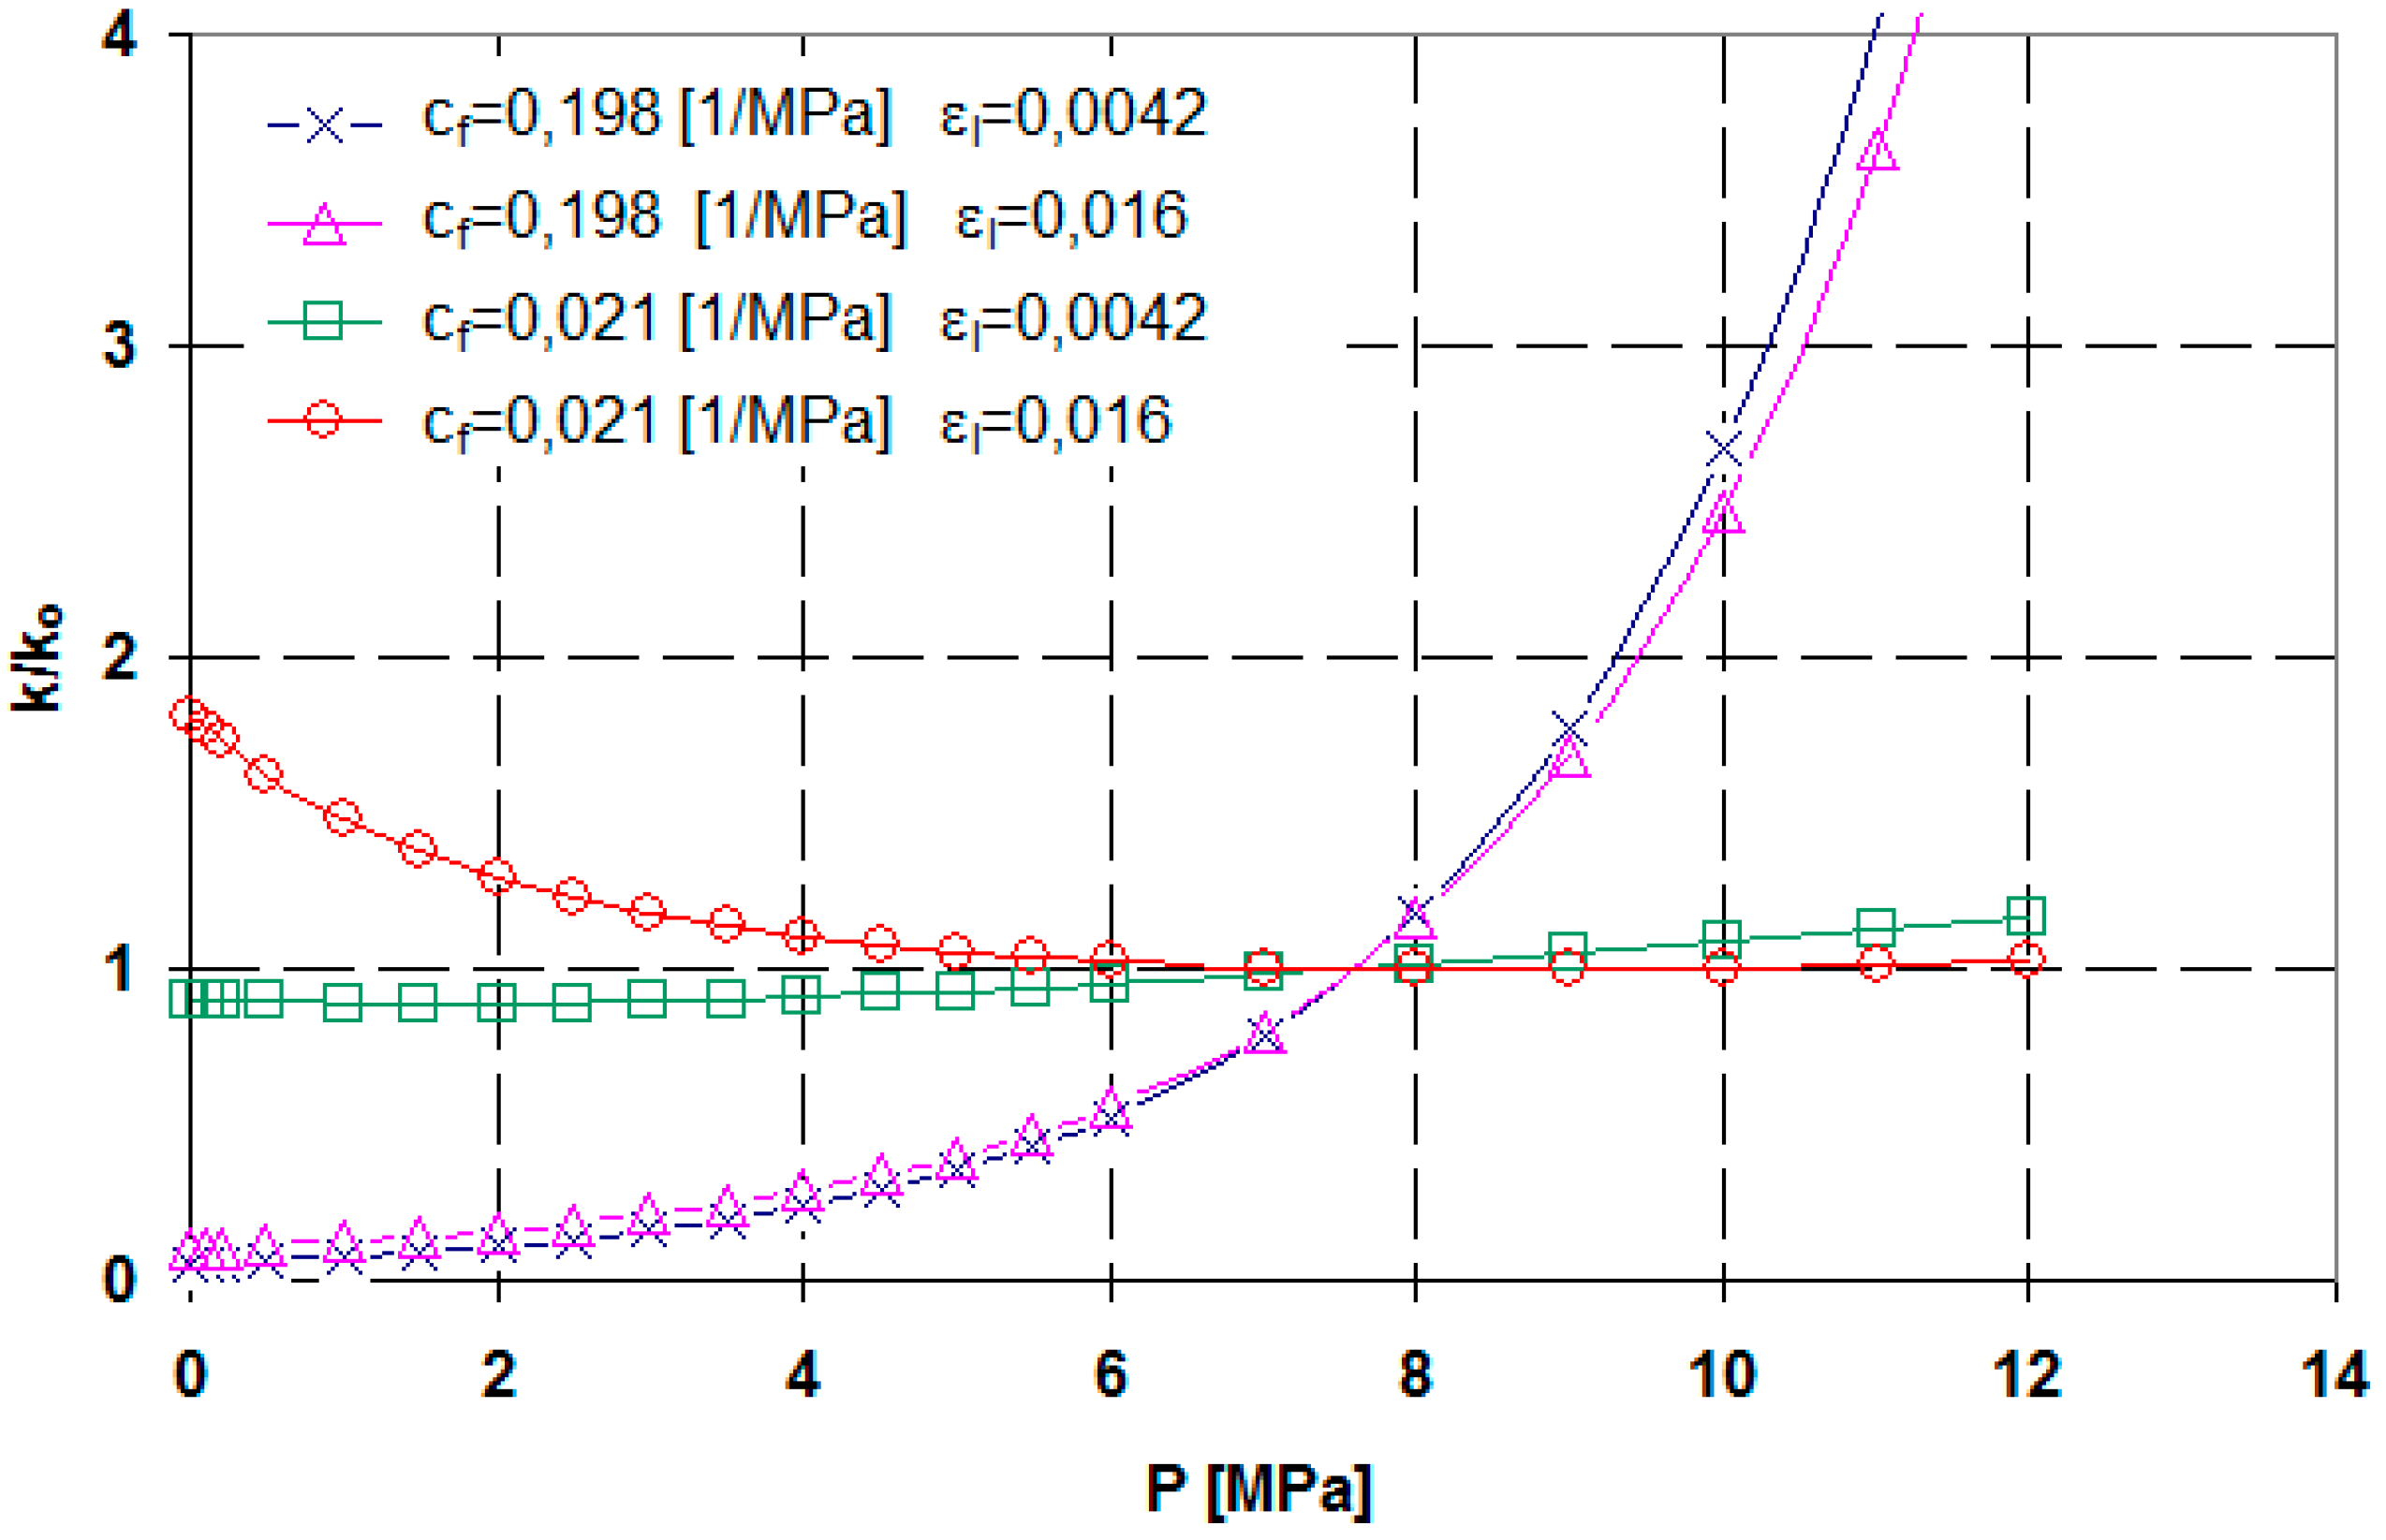
Having access to the Mannville Group basin data on the parameters describing methane desorption (εl and PL), we were able to simulate changes in permeability for the extreme values of these parameters. The first to be analysed was the impact of εl, where for the greatest and smallest changes in k/ko from previous simulations, we adopted the extreme values εl = 0.042 and εl = 0.016, respectively.
The analyses of the results depicted in Figure 9 and Figure 10 show that the parameter εl has a much stronger effect on changes in coal permeability than the parameter PL, even though the role of the latter is not negligible either.
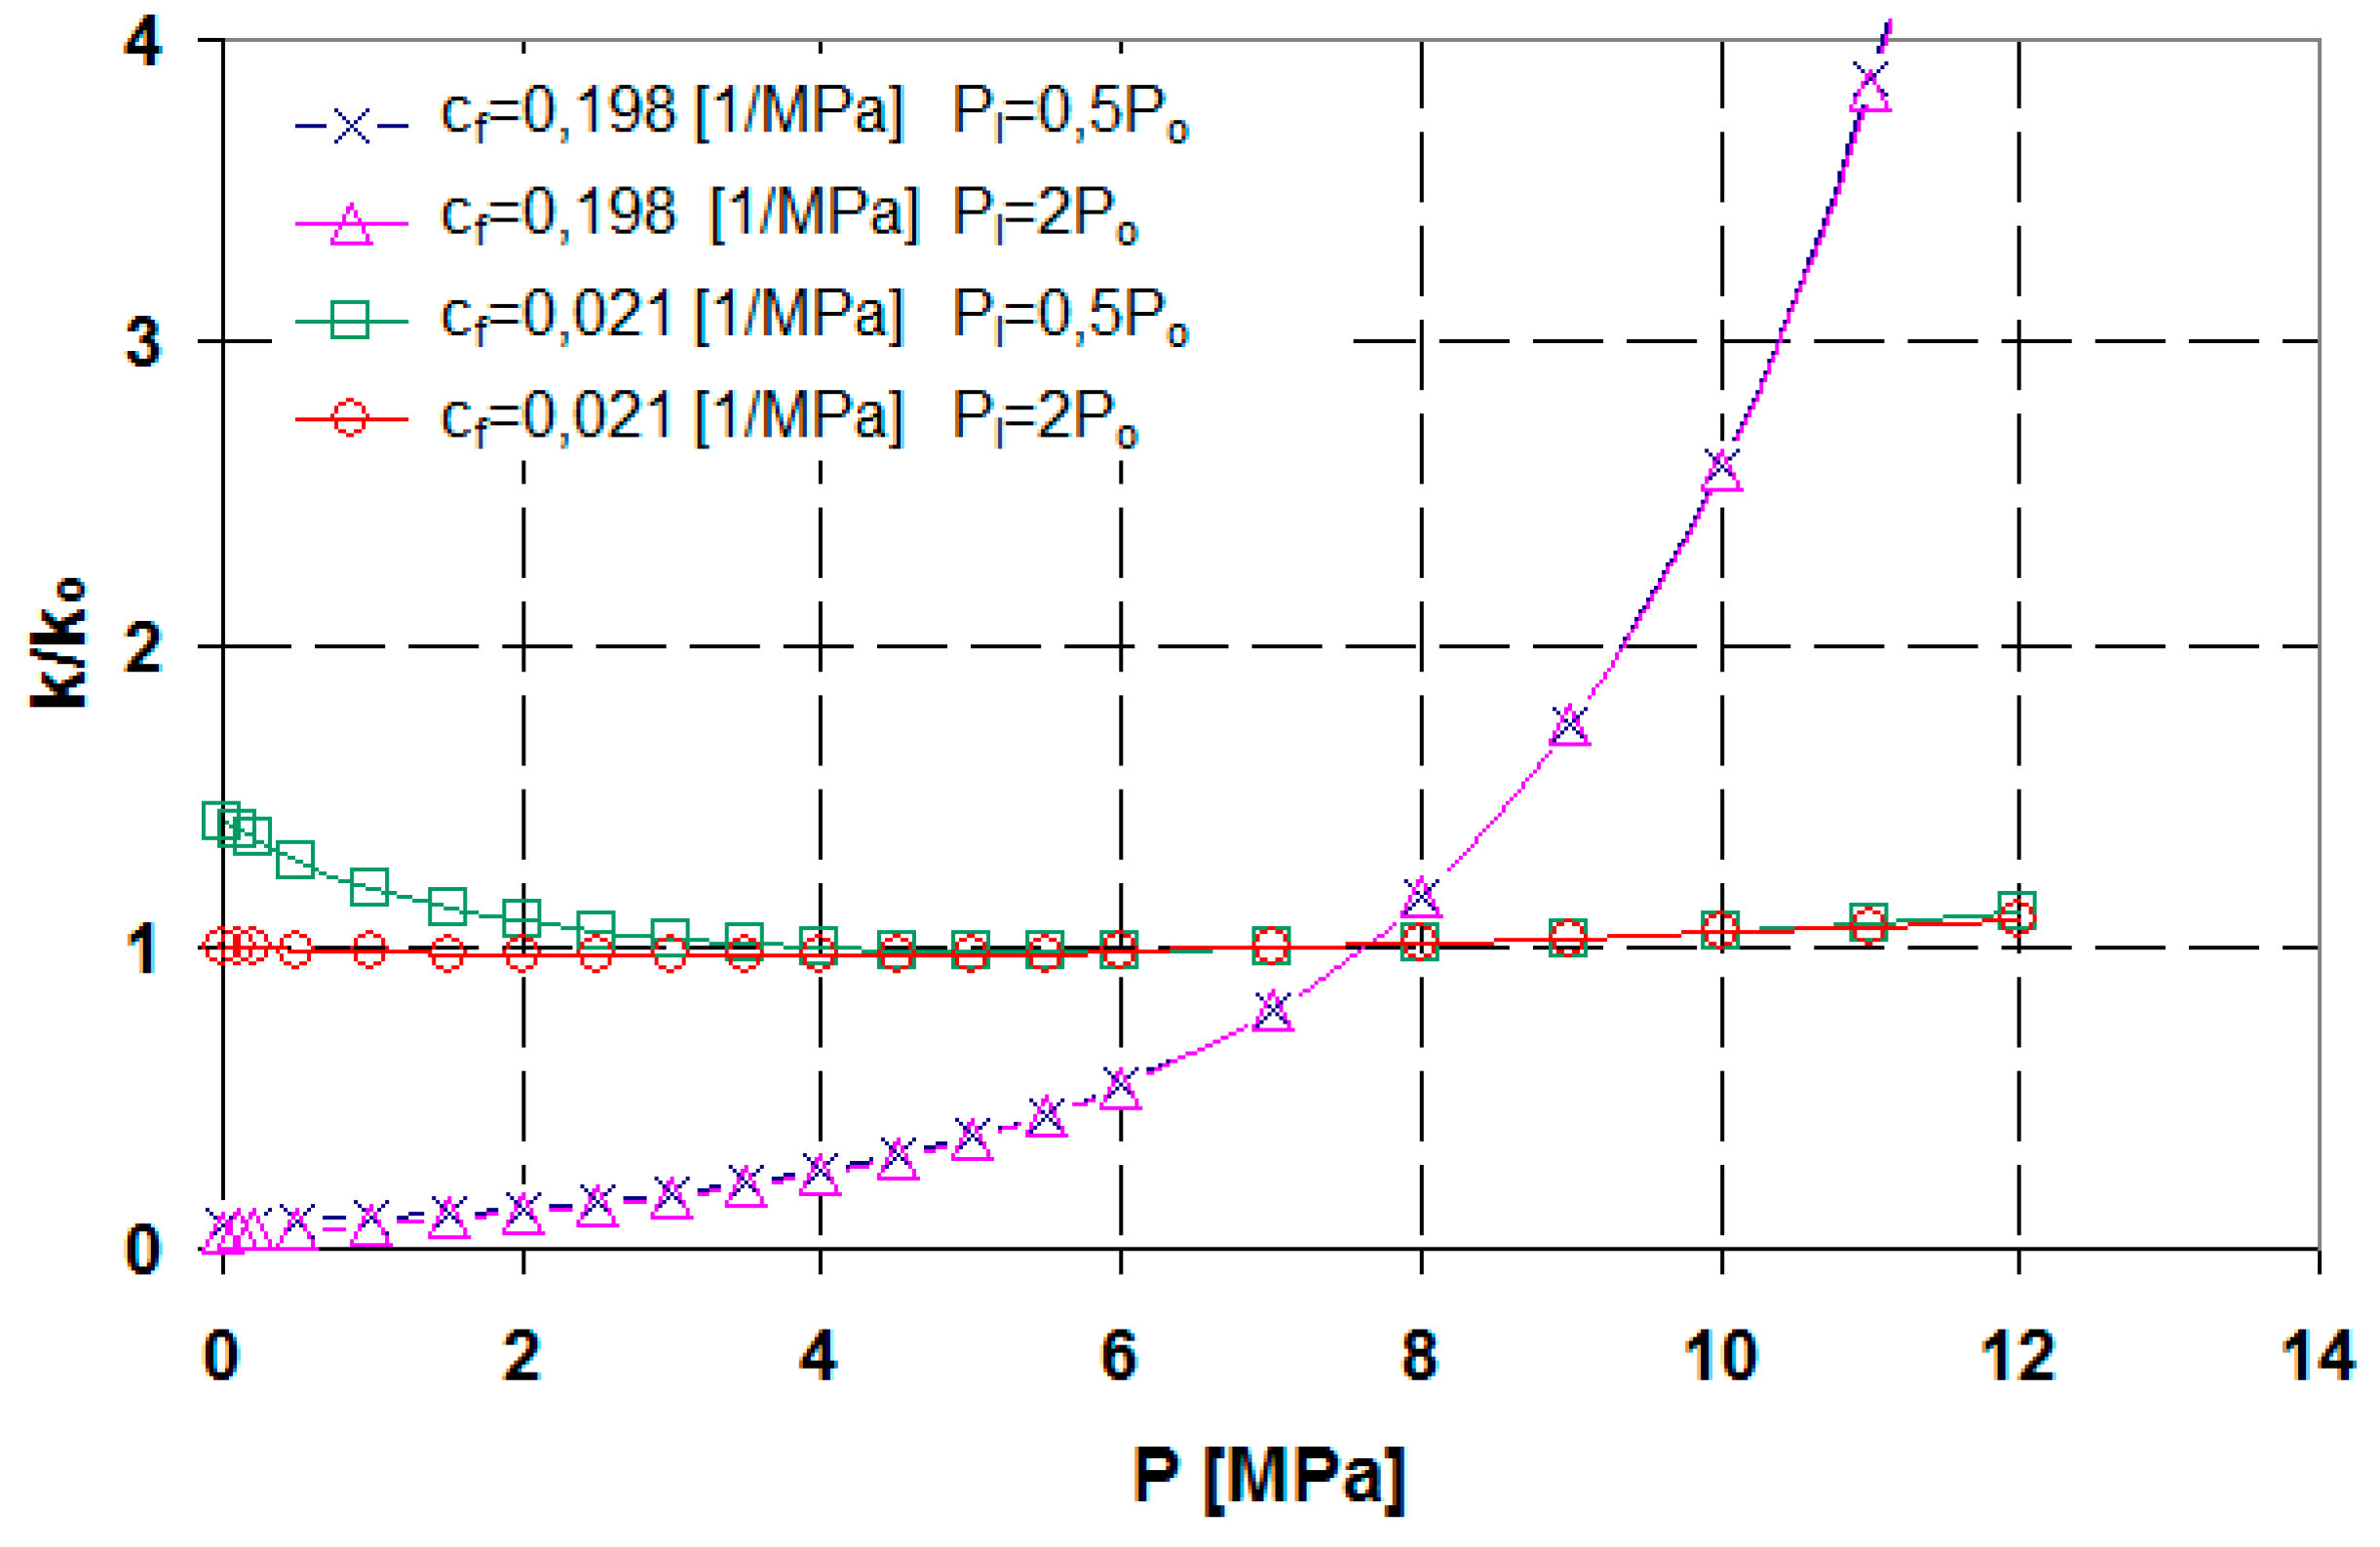
Similar simulations were performed in relation to the changes in Pl. The values of PL were matched with the greatest and smallest changes in k/ko from previous simulations for the two variants PL = 0.5Po, and PL = 2Po.
3.4. Changes in Permeability in Relation to the Coal from the Cretaceous Mesaverde Group, Western Canada
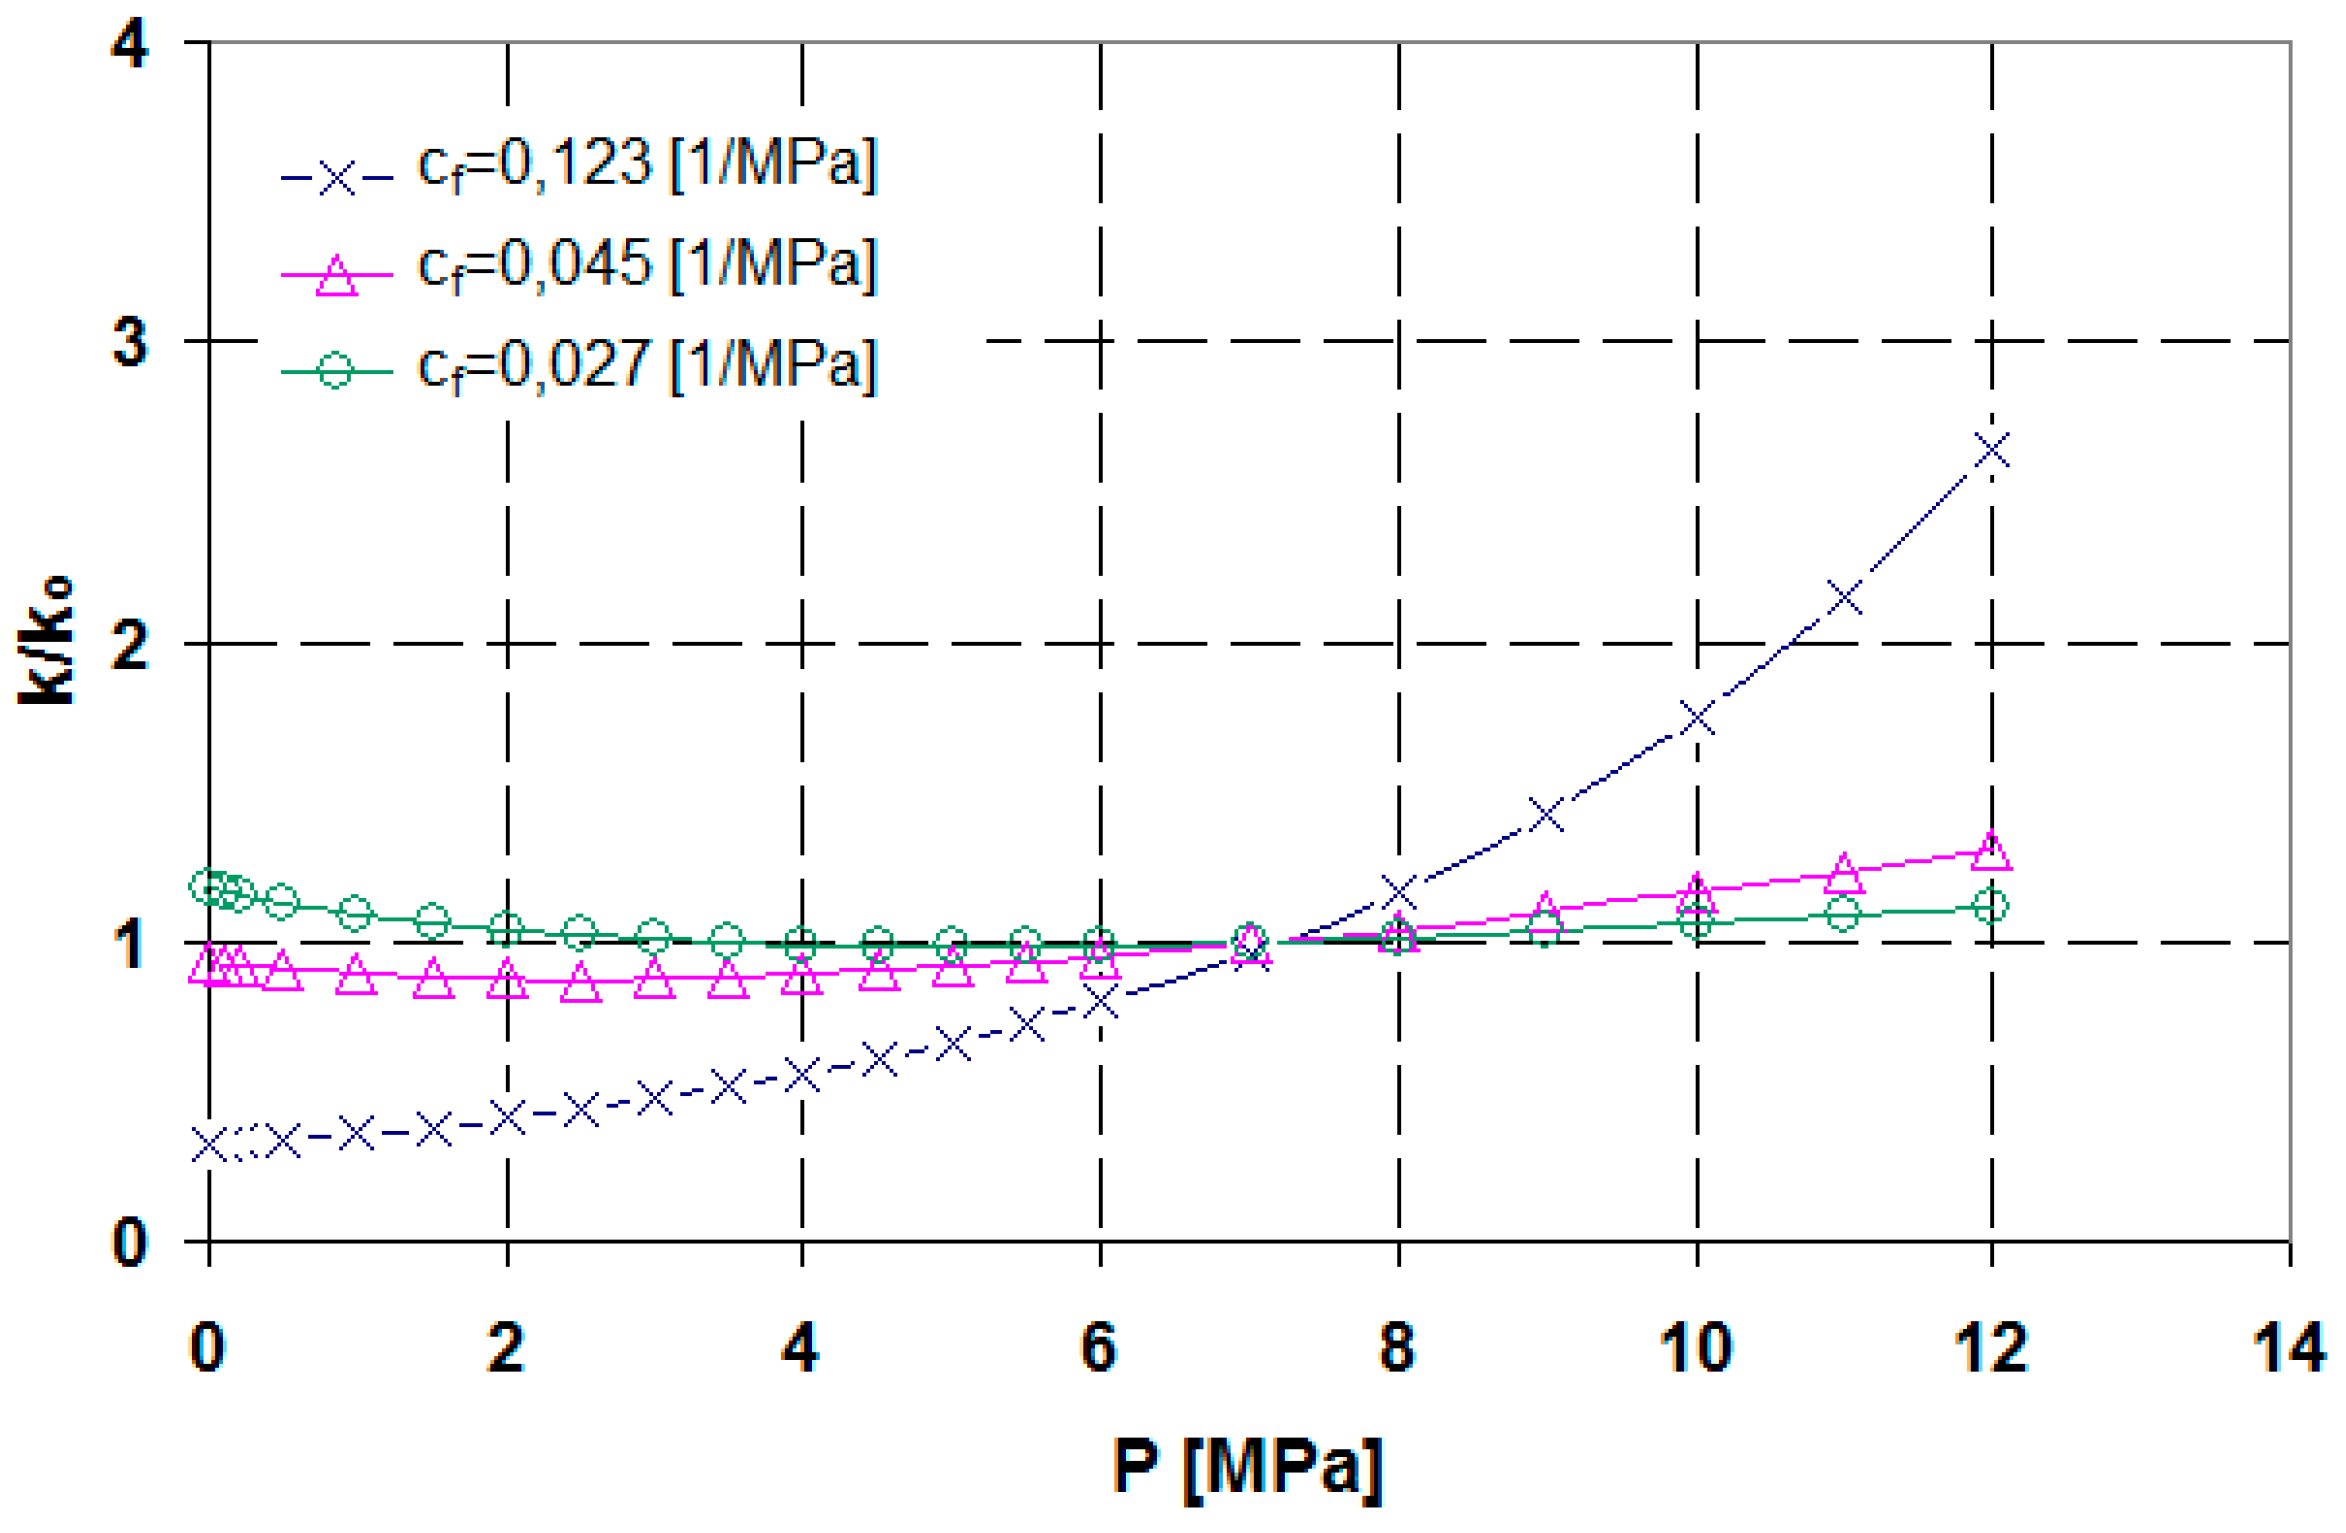
For the data from the Cretaceous Mesaverde Goup basin (Table 3), we presented how permeability varies as a result of changes in methane’s pore pressure in relation to different cleat compressibility cf values (Figure 11). Given the available data, cf was calculated for the extreme and mean values of Young’s modulus, with a constant porosity at ϕo = 0.006.
The changes in permeability observed in the simulations were at relatively low levels. These results were undoubtedly affected by the relatively high coal cleat compressibility cf = 0.123 1/MPa, and low εl = 0.009 compared to the Mannville Group basin coal. This observation is supported by the rebound pressure Prb and recovery pressure Prc values, as presented in Table 8. For the lowest and mean values of the coal compressibility 1/M, we obtained negative values of the recovery pressure Prc. Only the lowest compressibility causes an increase in permeability that improves the prospects of the extraction being economically viable (Prc > 0).
3.5. Changes in Permeability in Relation to the Coal from the Northern and Northeast of Fairway of San Juan Basin
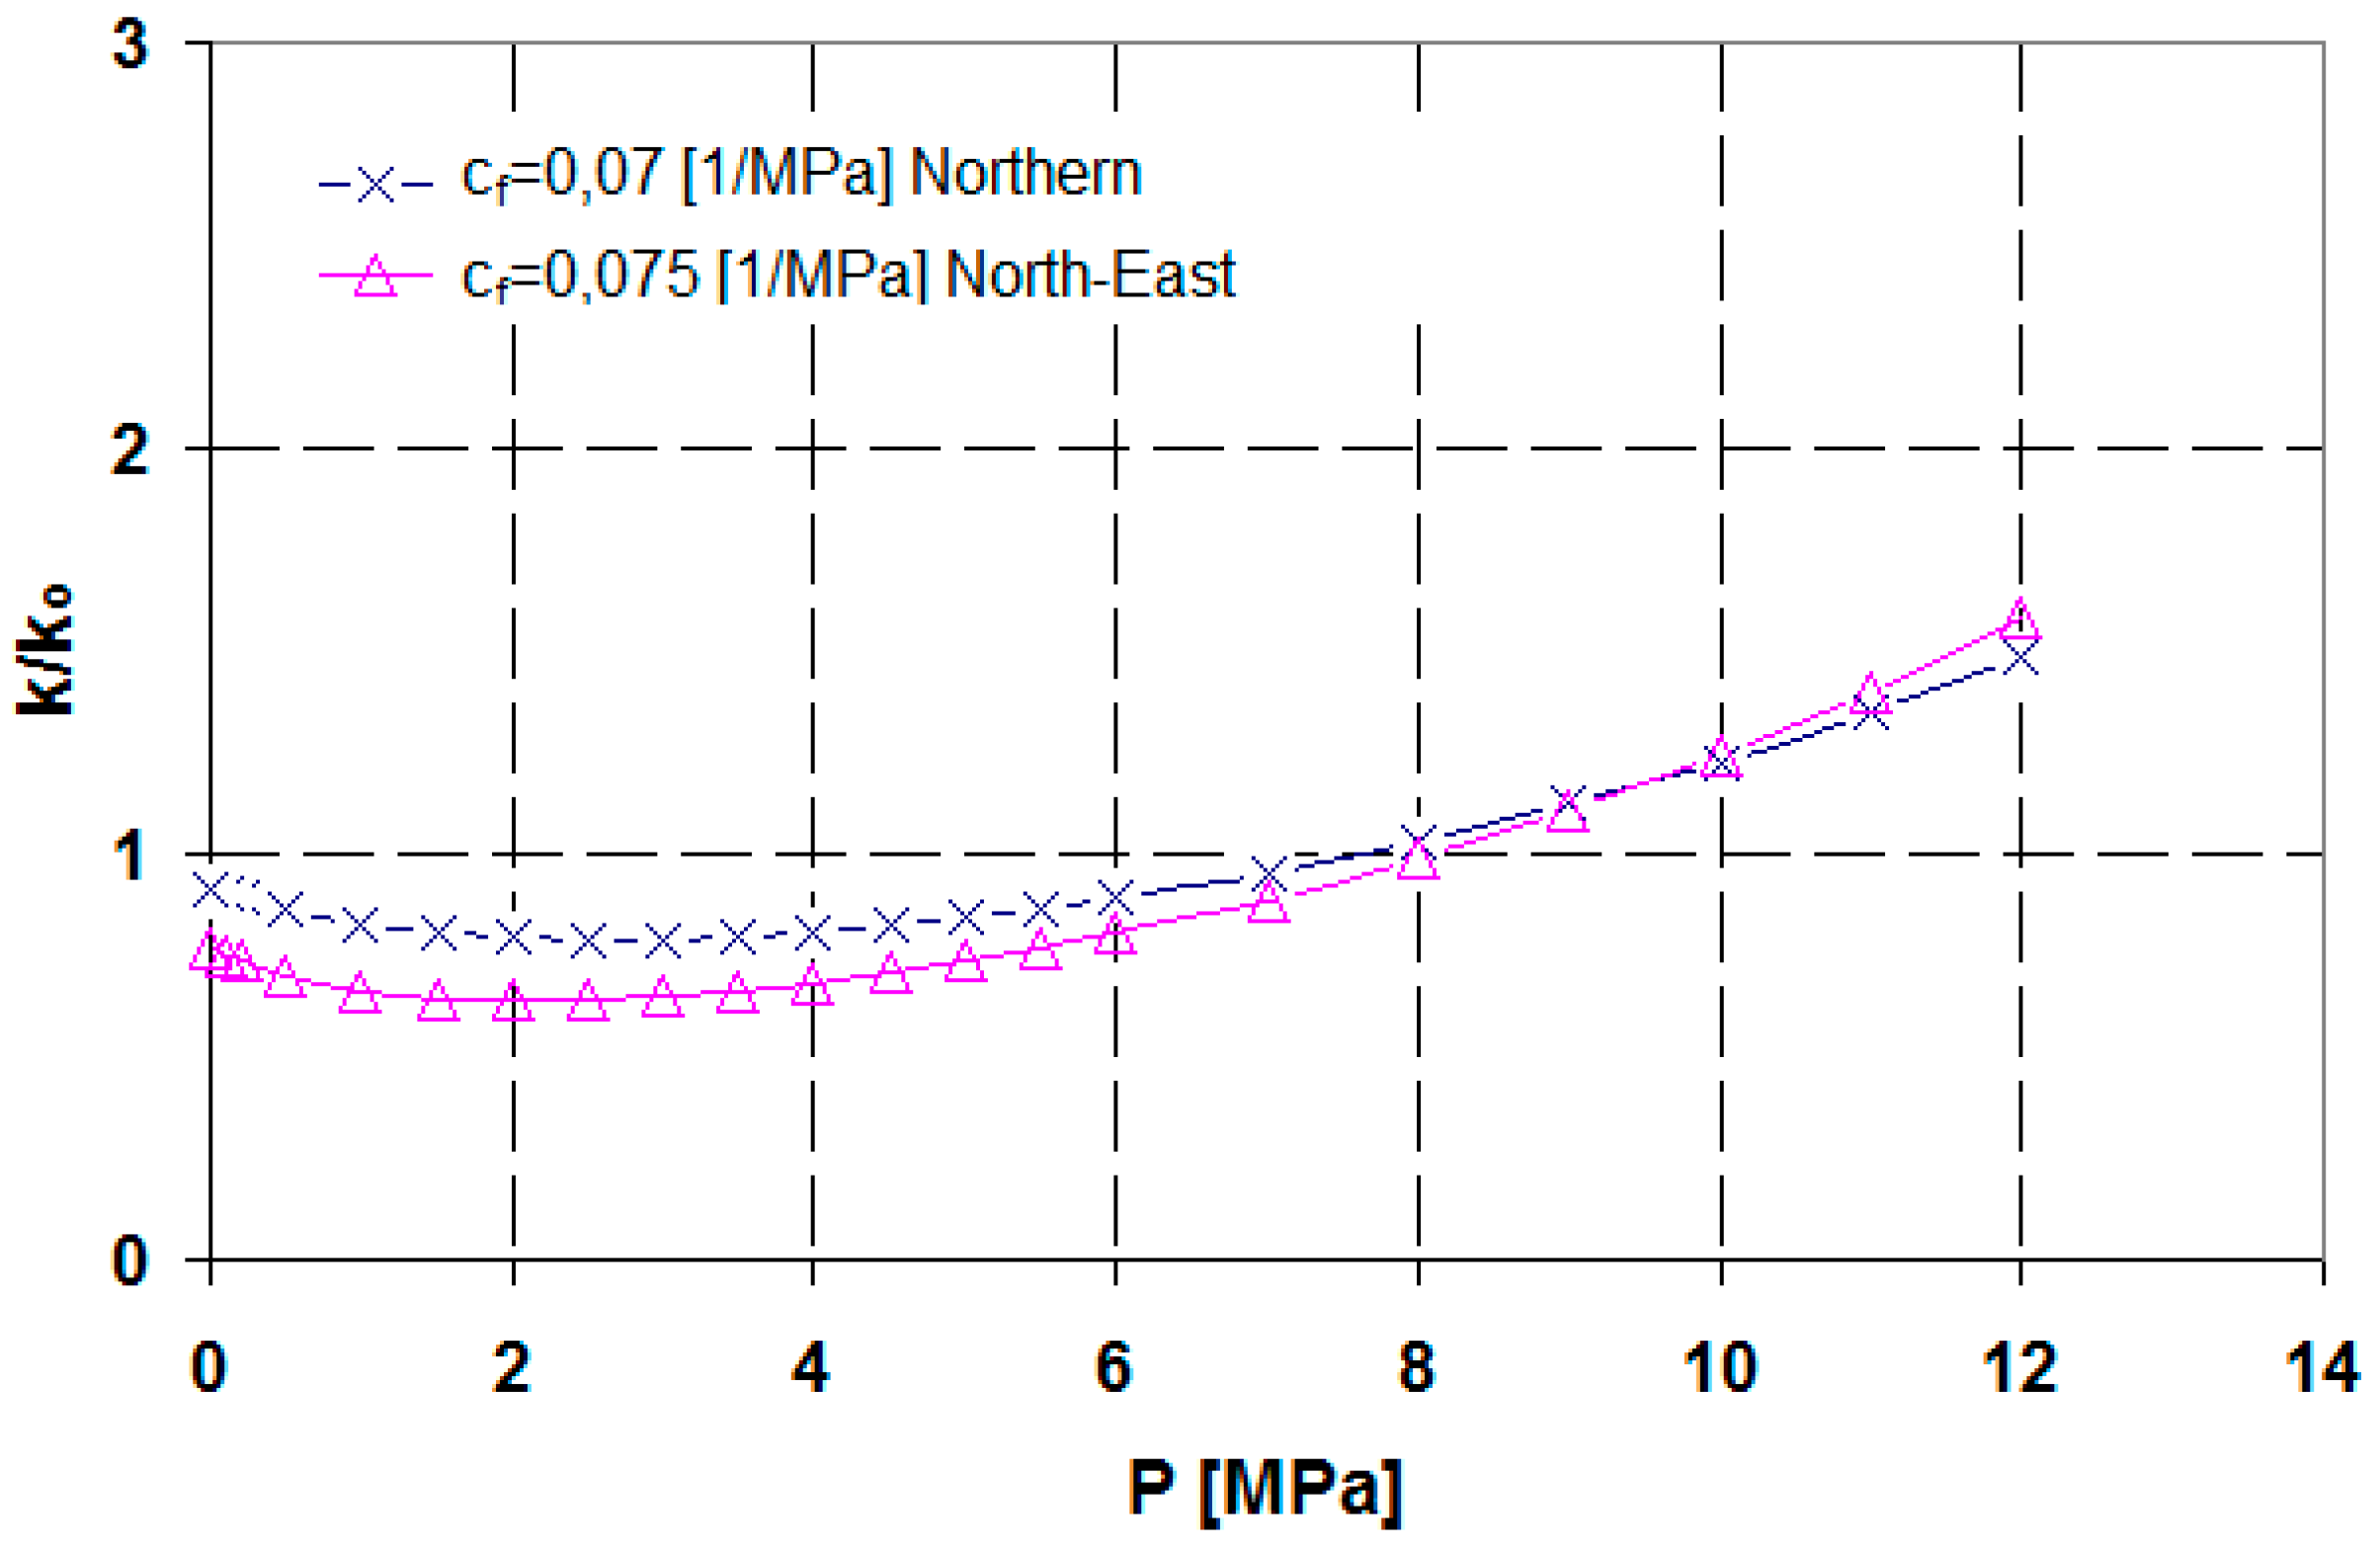
These simulations of changes in permeability based on the Cui-Bustin model are related to two types of coal from the San Juan basin, namely Northern and Northeast of Fairway (Table 4 and Table 5).
Similarly to the Mesaverde Group coal, the obtained changes in permeability for the two selected coal beds from the San Juan basin, i.e., Northern and Northeast of Fairway (Figure 12), are generally far from promising. This is largely due to the low Young’s modulus values for both types of coal from this basin: E = 2411.5 MPa and E = 2067 MPa (Table 4 and Table 5). Given the initial porosity of ϕo = 0.004, this results in a relatively high cleat compressibility, cf =0.07 1/MPa and cf = 0.075 1/MPa, respectively. Low εl values, at 0.009 for both cases, do not promote an increase in permeability, since the recovery pressure Prc takes negative values (Table 9 and Table 10).
3.6. Summary of Basin-Specific Analyses of Changes in Coal Permeability
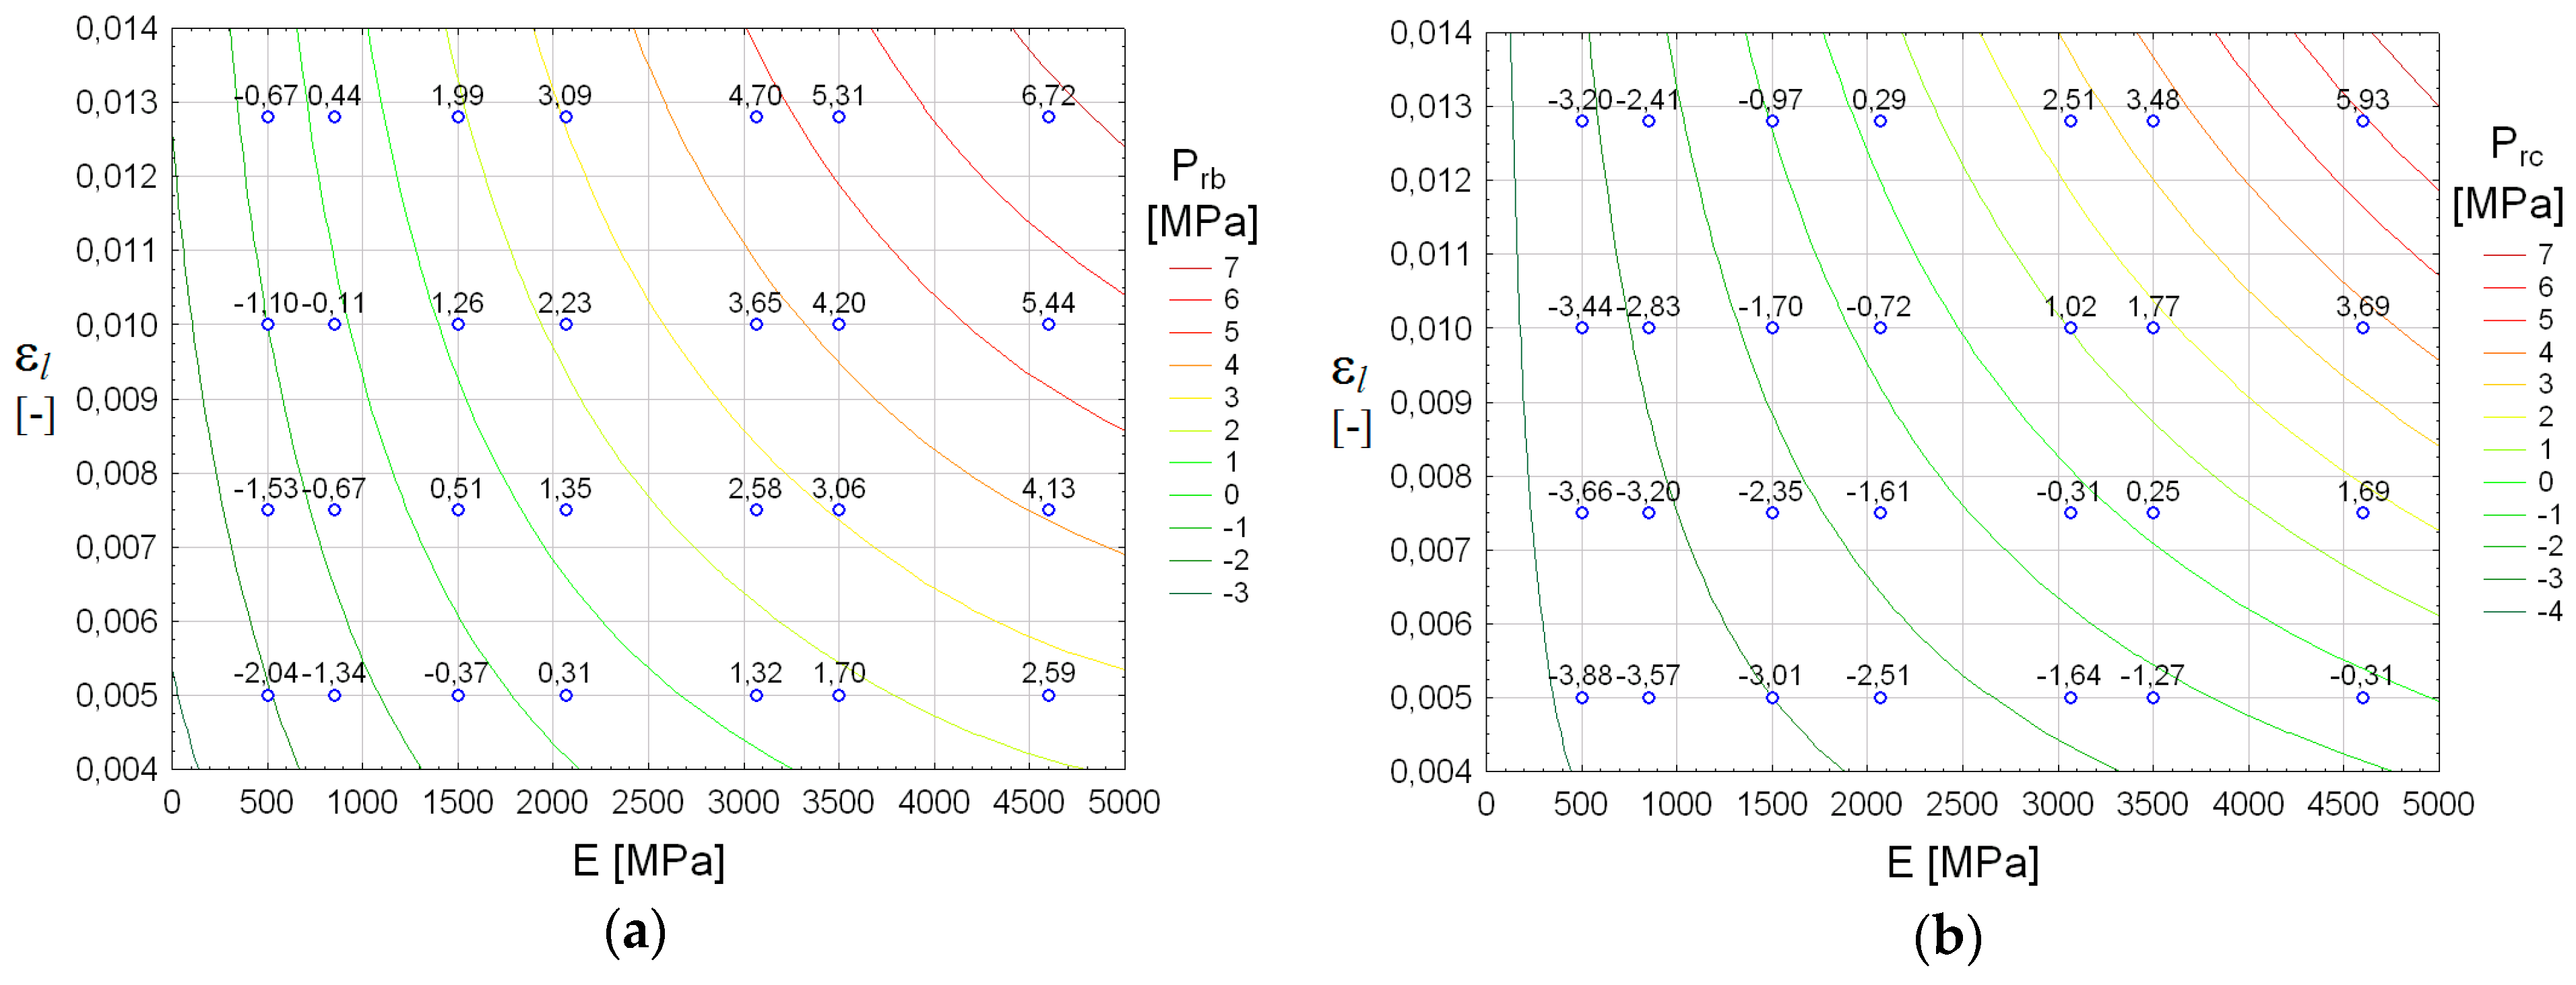
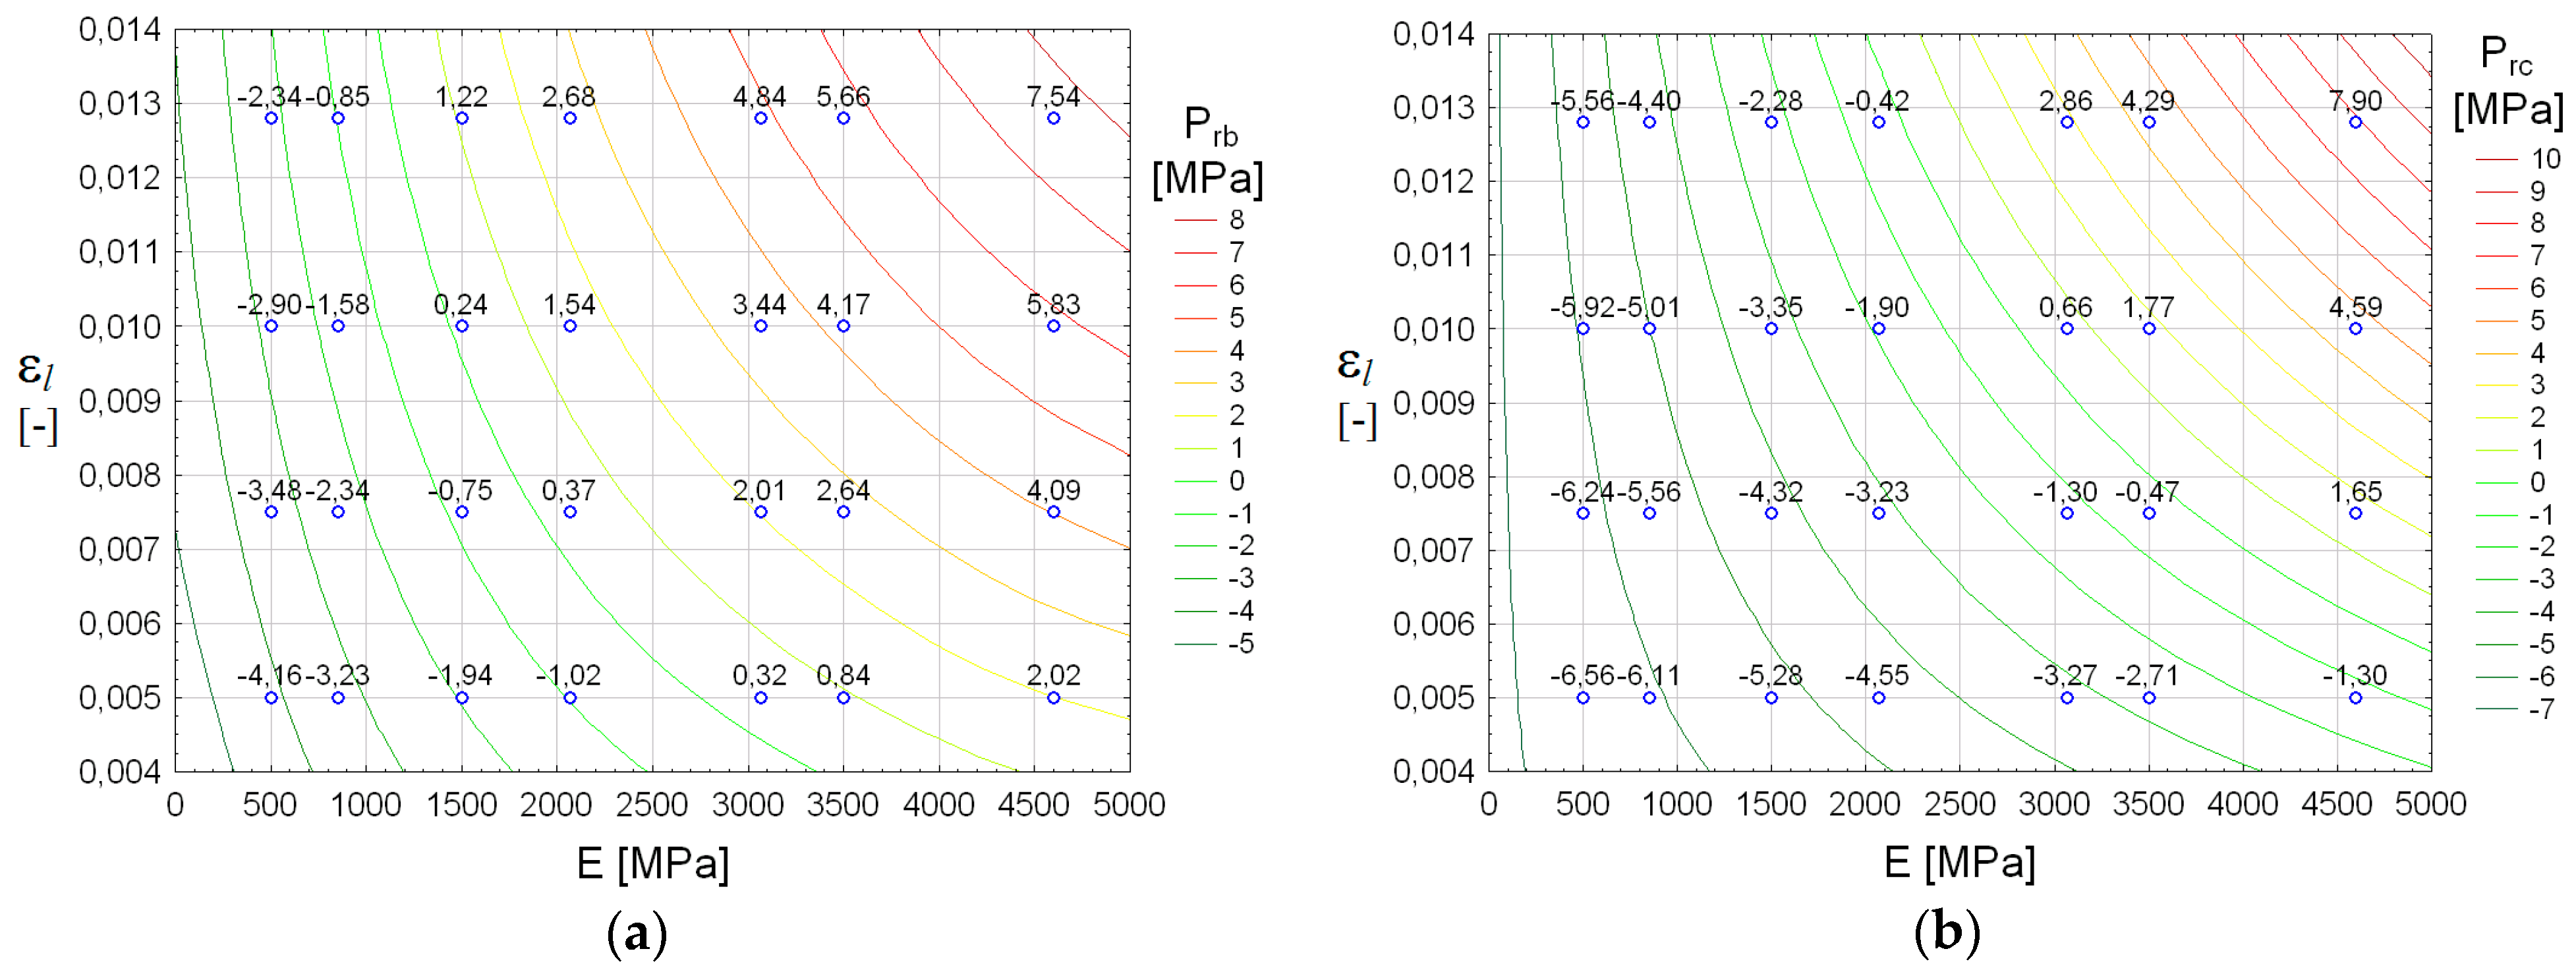
As shown in the above-mentioned analyses, the key properties that affected changes in the permeability of the analysed coal were the coal deformation parameters that determined the coal cleat compressibility cf, the initial porosity ϕo and the parameters associated with methane desorption εl and PL. The analyses of the sensitivity of changes in permeability to the values of each parameter show that permeability is mostly determined by two parameters, namely Young’s modulus E and the desorption-induced deformation εl (see, for instance, Figure 6 and Figure 9). It is these two parameters that determine whether there are good or bad prospects for an increase in the coal permeability. As shown in the earlier study results, changes in coal permeability are described well by the rebound and recovery pressure values Prb and Prc. In view of the above, the further part of this paper discusses the results of the analyses of how these two key parameters, i.e., Young’s modulus E and εl (which describes desorption), affect the pressure Prb and Prc for the coal from all of the basins analysed above. For the analysed coal basins, we used constant ranges of variability in Young’s modulus E = 500–4600 MPa and in εl = 0.004–0.014, to represent extreme values. The results of the analyses are presented using maps, which show the location of specific values for the parameters E and εl, for which the extraction prospects are poor (Prc < Prb < 0 or Prc < 0 < Prb < Po) and of those for which such prospects might be good (0 < Prc < Prb).
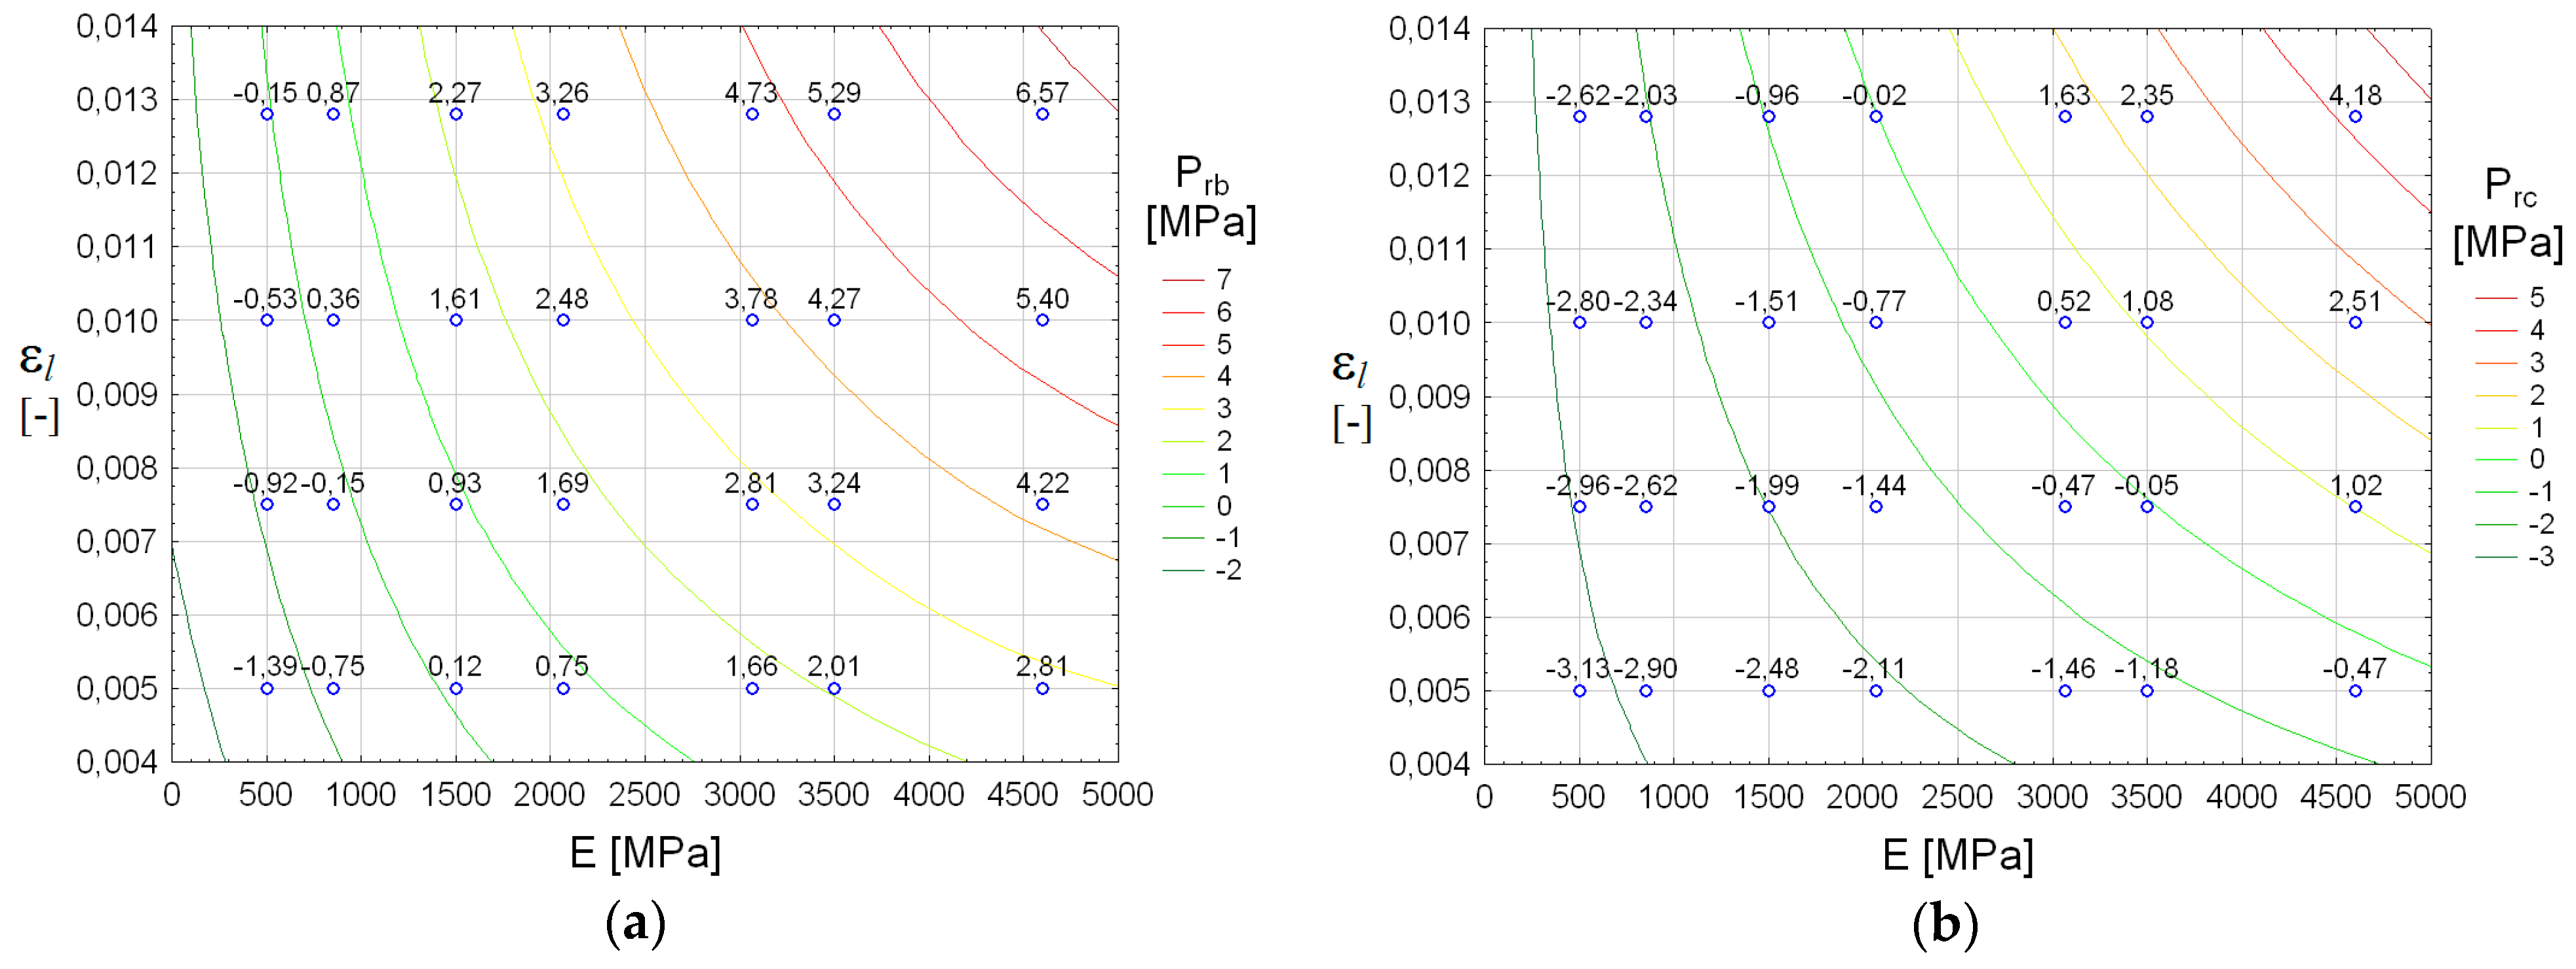
The subsequent Figure 13a,b shows maps that depict the values Prb and Prc as functions of the two parameters E and εl as used for the coal from the Fruitland Boomer Well B-1 San Juan basin. In addition to the variables E and εl, the other coal parameters are shown in Table 1.
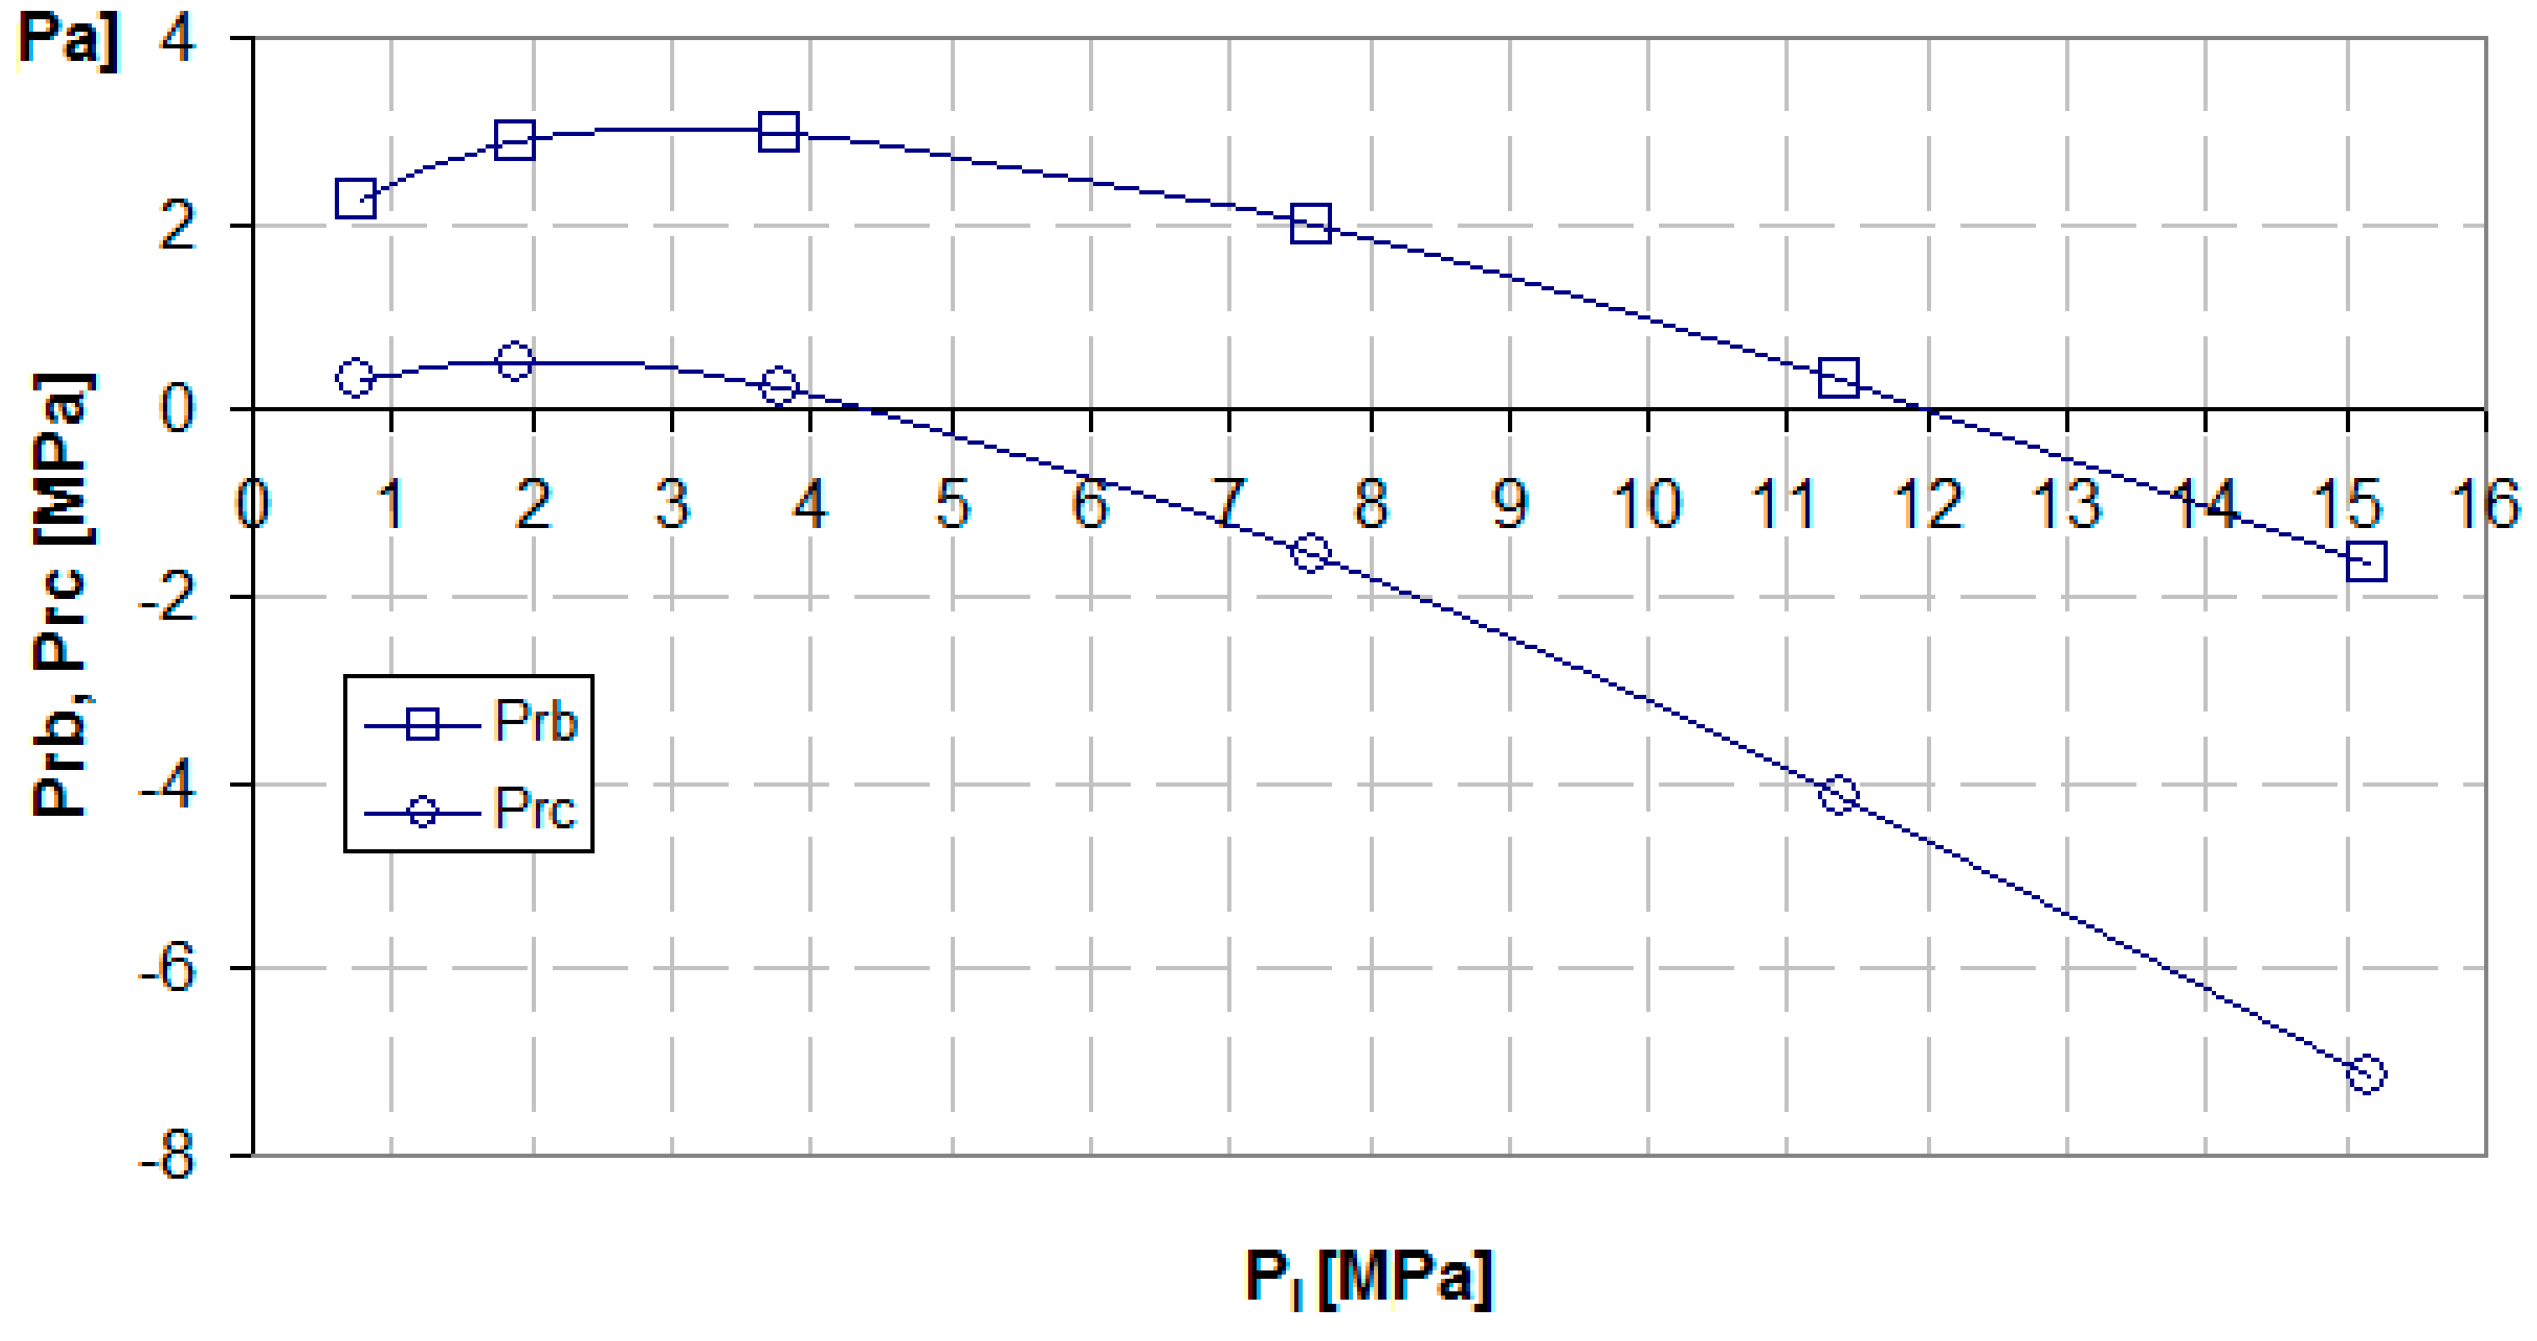
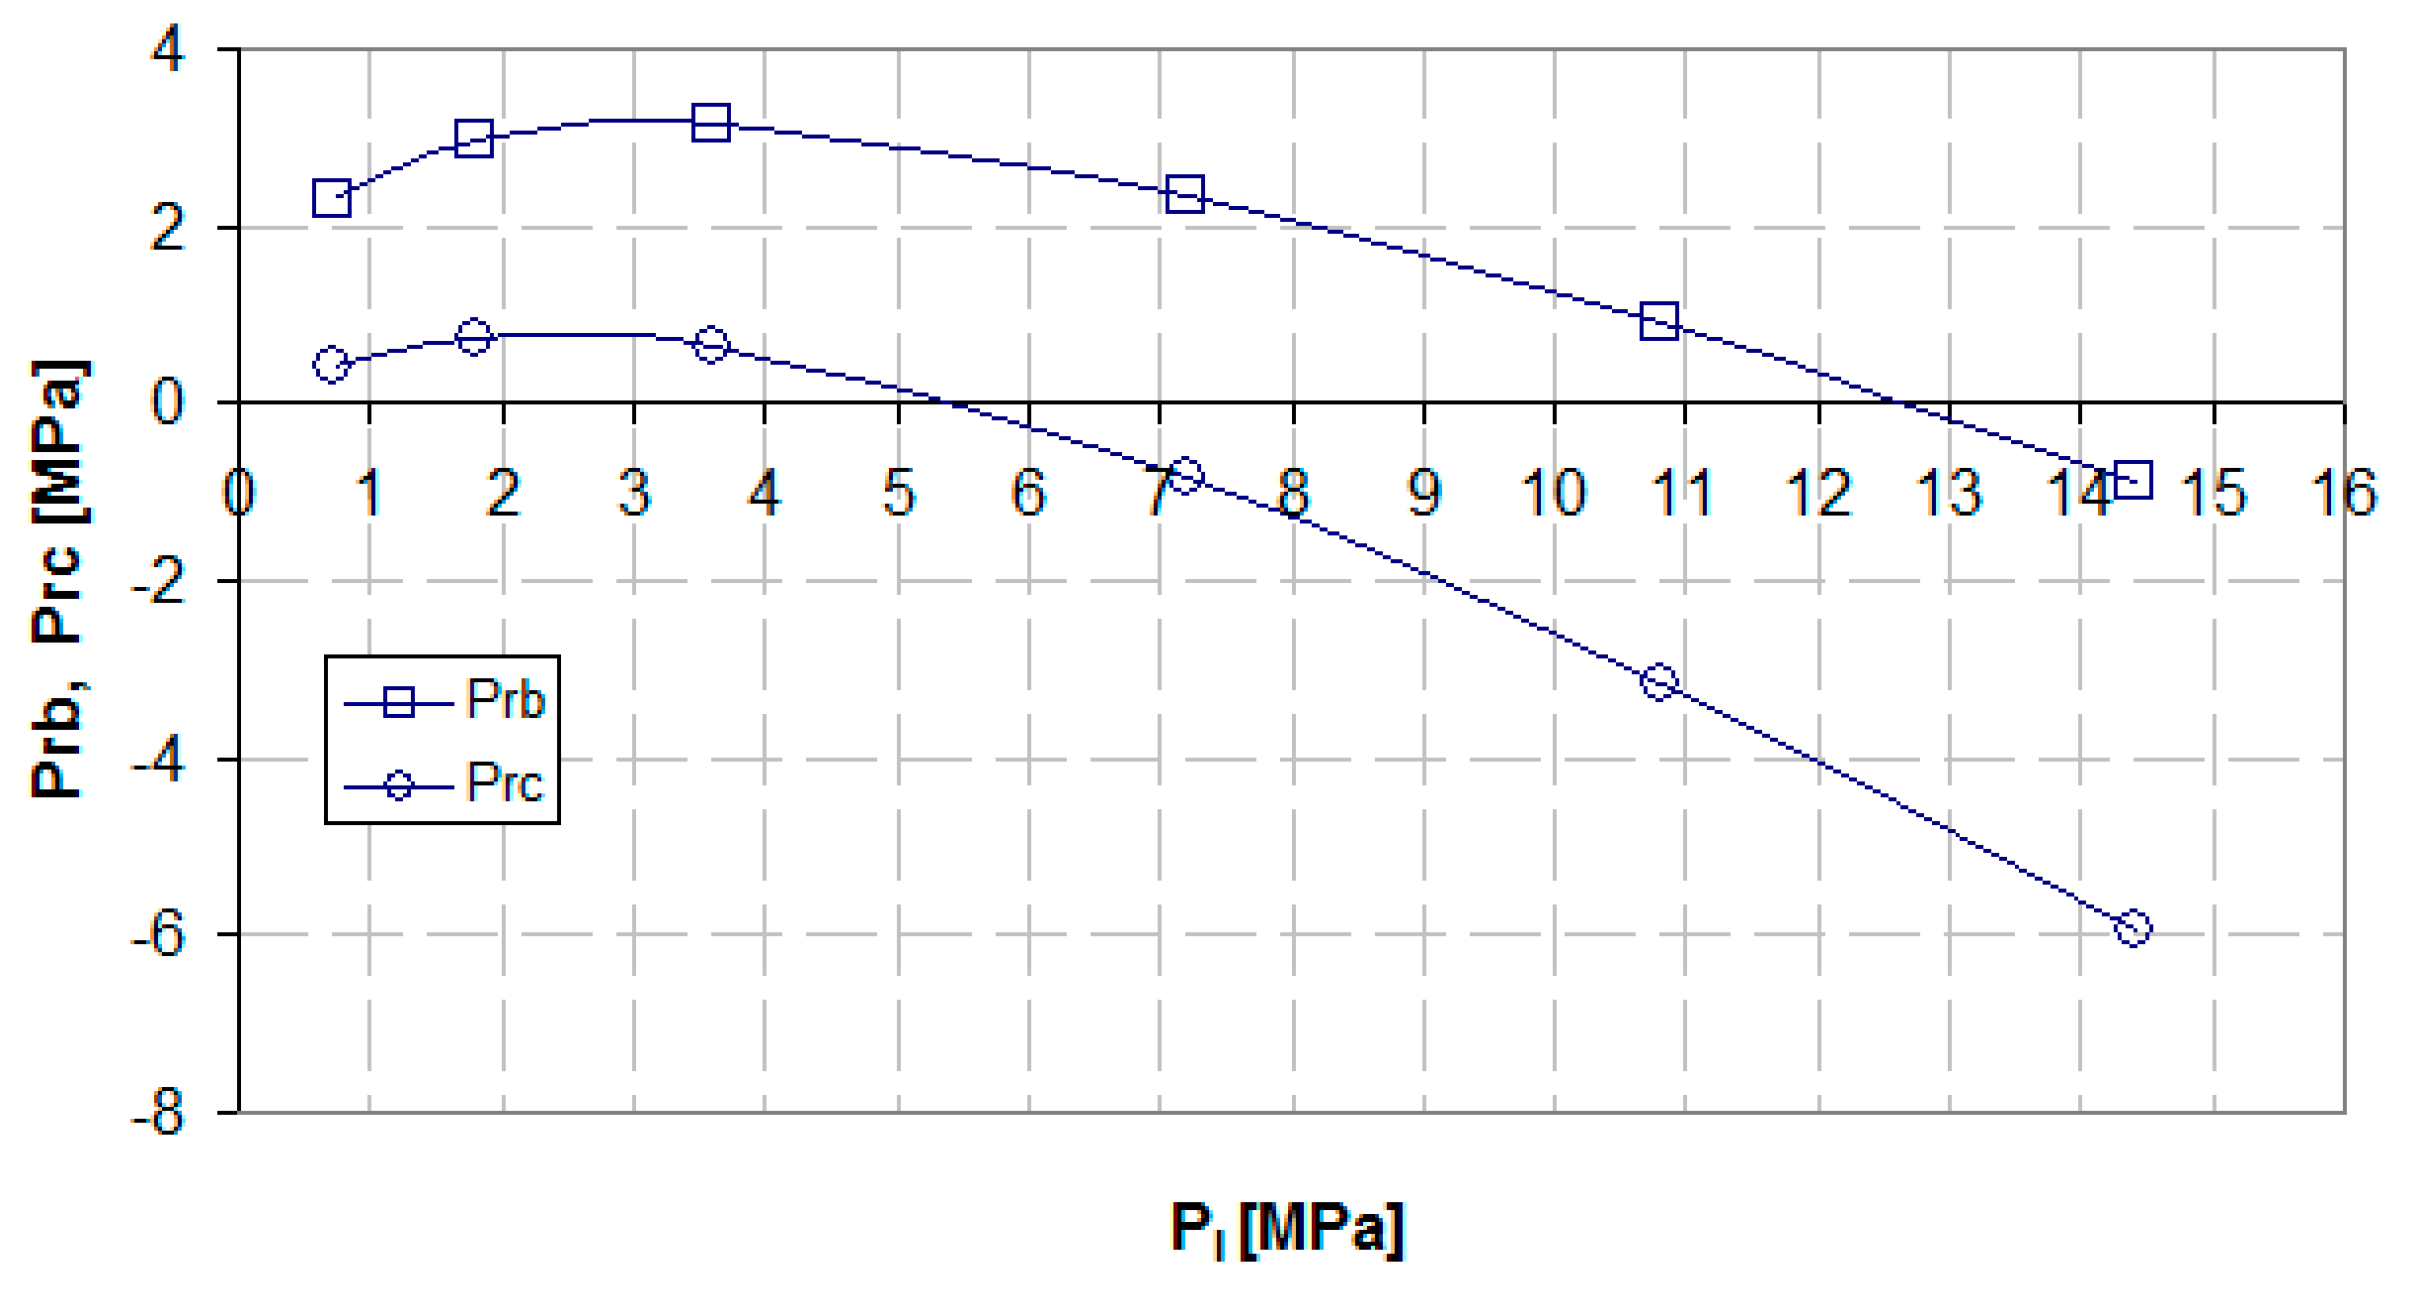
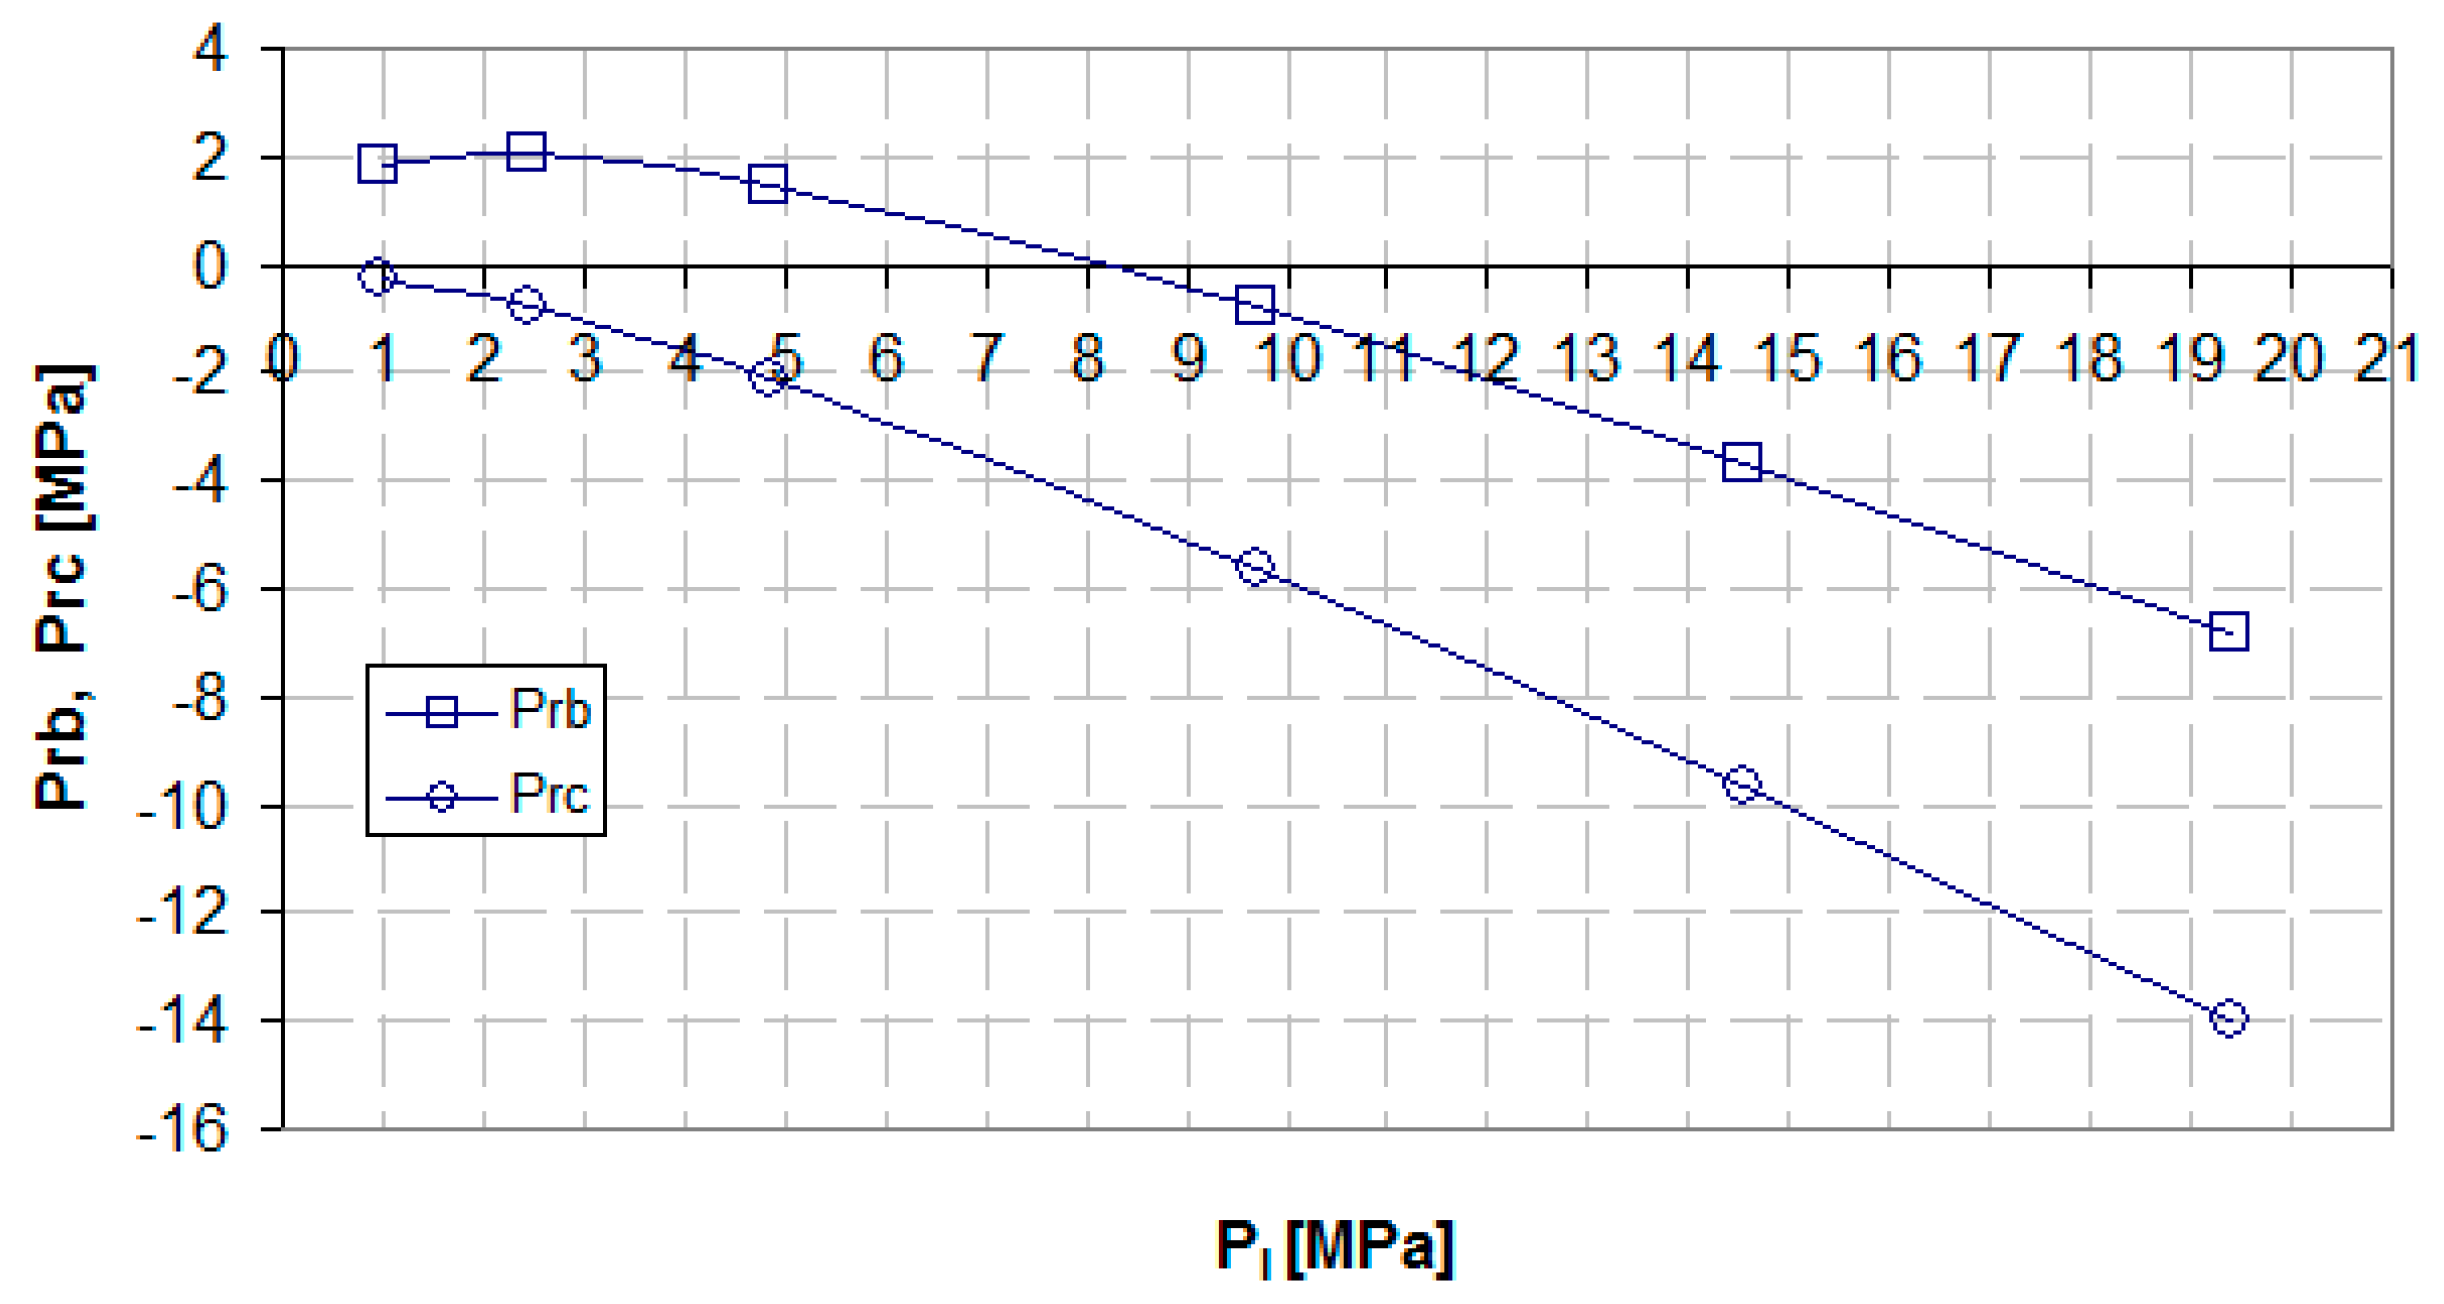
The graph below (Figure 14) depicts Prb and Prc as correlated with the pressure PL. For the purposes of our calculations, we assumed that the value of PL was the multiple of the initial pore pressure Po. We assumed that PL might take the following values: PL = 2Po, PL = 1.5Po, PL = Po, PL = 0.5Po, PL = 0.25Po, and PL = 0.1Po. In addition to the variable PL, the other coal parameters are shown in Table 1 (mean E = 1960 MPa).
As shown in Figure 13a,b, the zero isoline of the pressure Prb and Prc demarcates an area with two parts of Young’s modulus E and εl values, to describe the respective values of the parameters Prb and Prc. In one part of this area, Prb has a negative value, while in the other, it has a positive value. This is also the case for the parameter Prc. Similar analyses can be carried out on the basis of Figure 14 for the parameter PL. With different configurations of these key geomechanical parameters and desorption, one can identify coal properties which will make the extraction of methane from the Fruitland Boomer Well B-1 San Juan coal bed unfavourable.
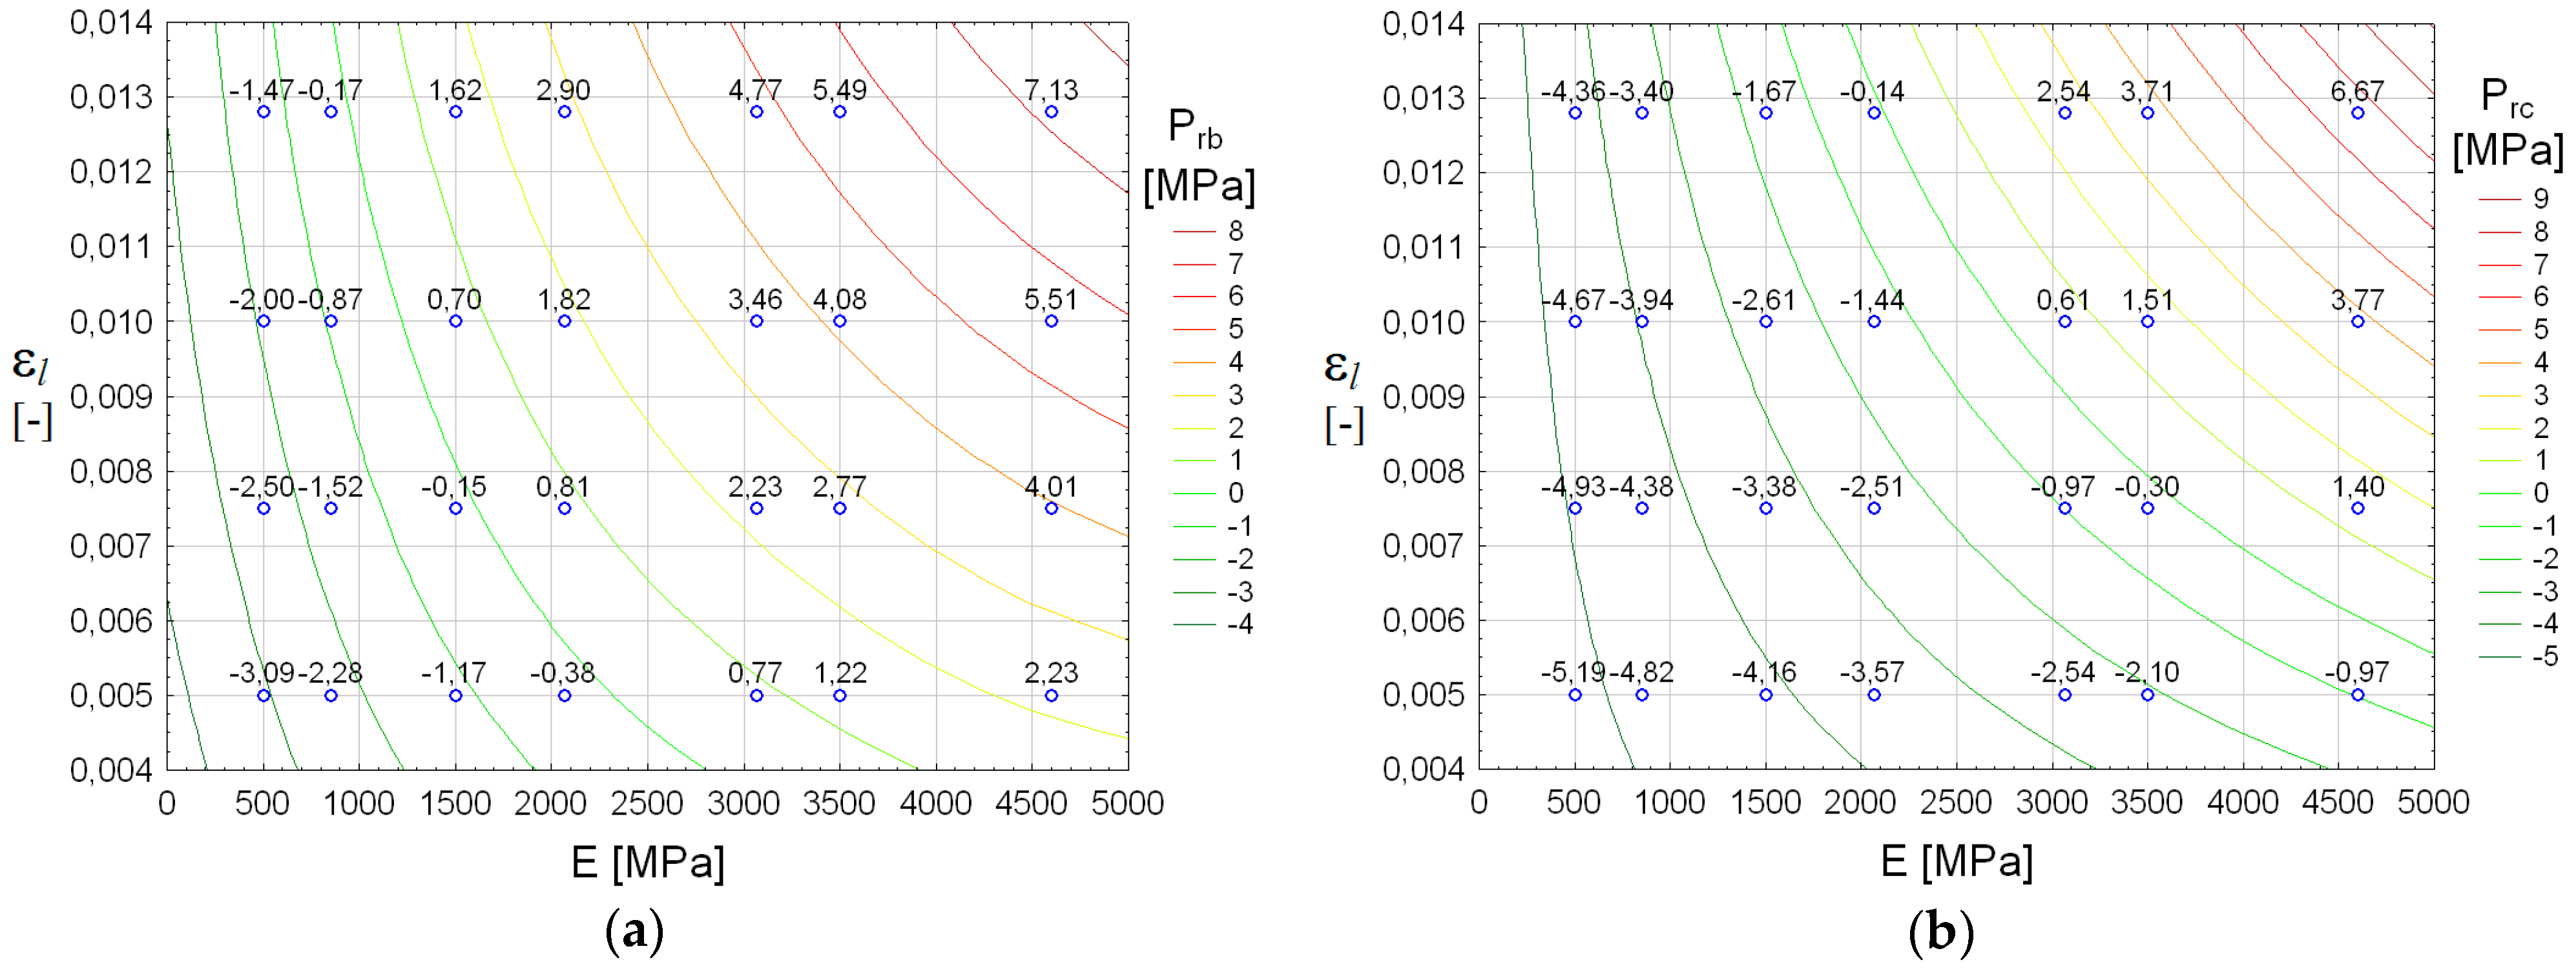
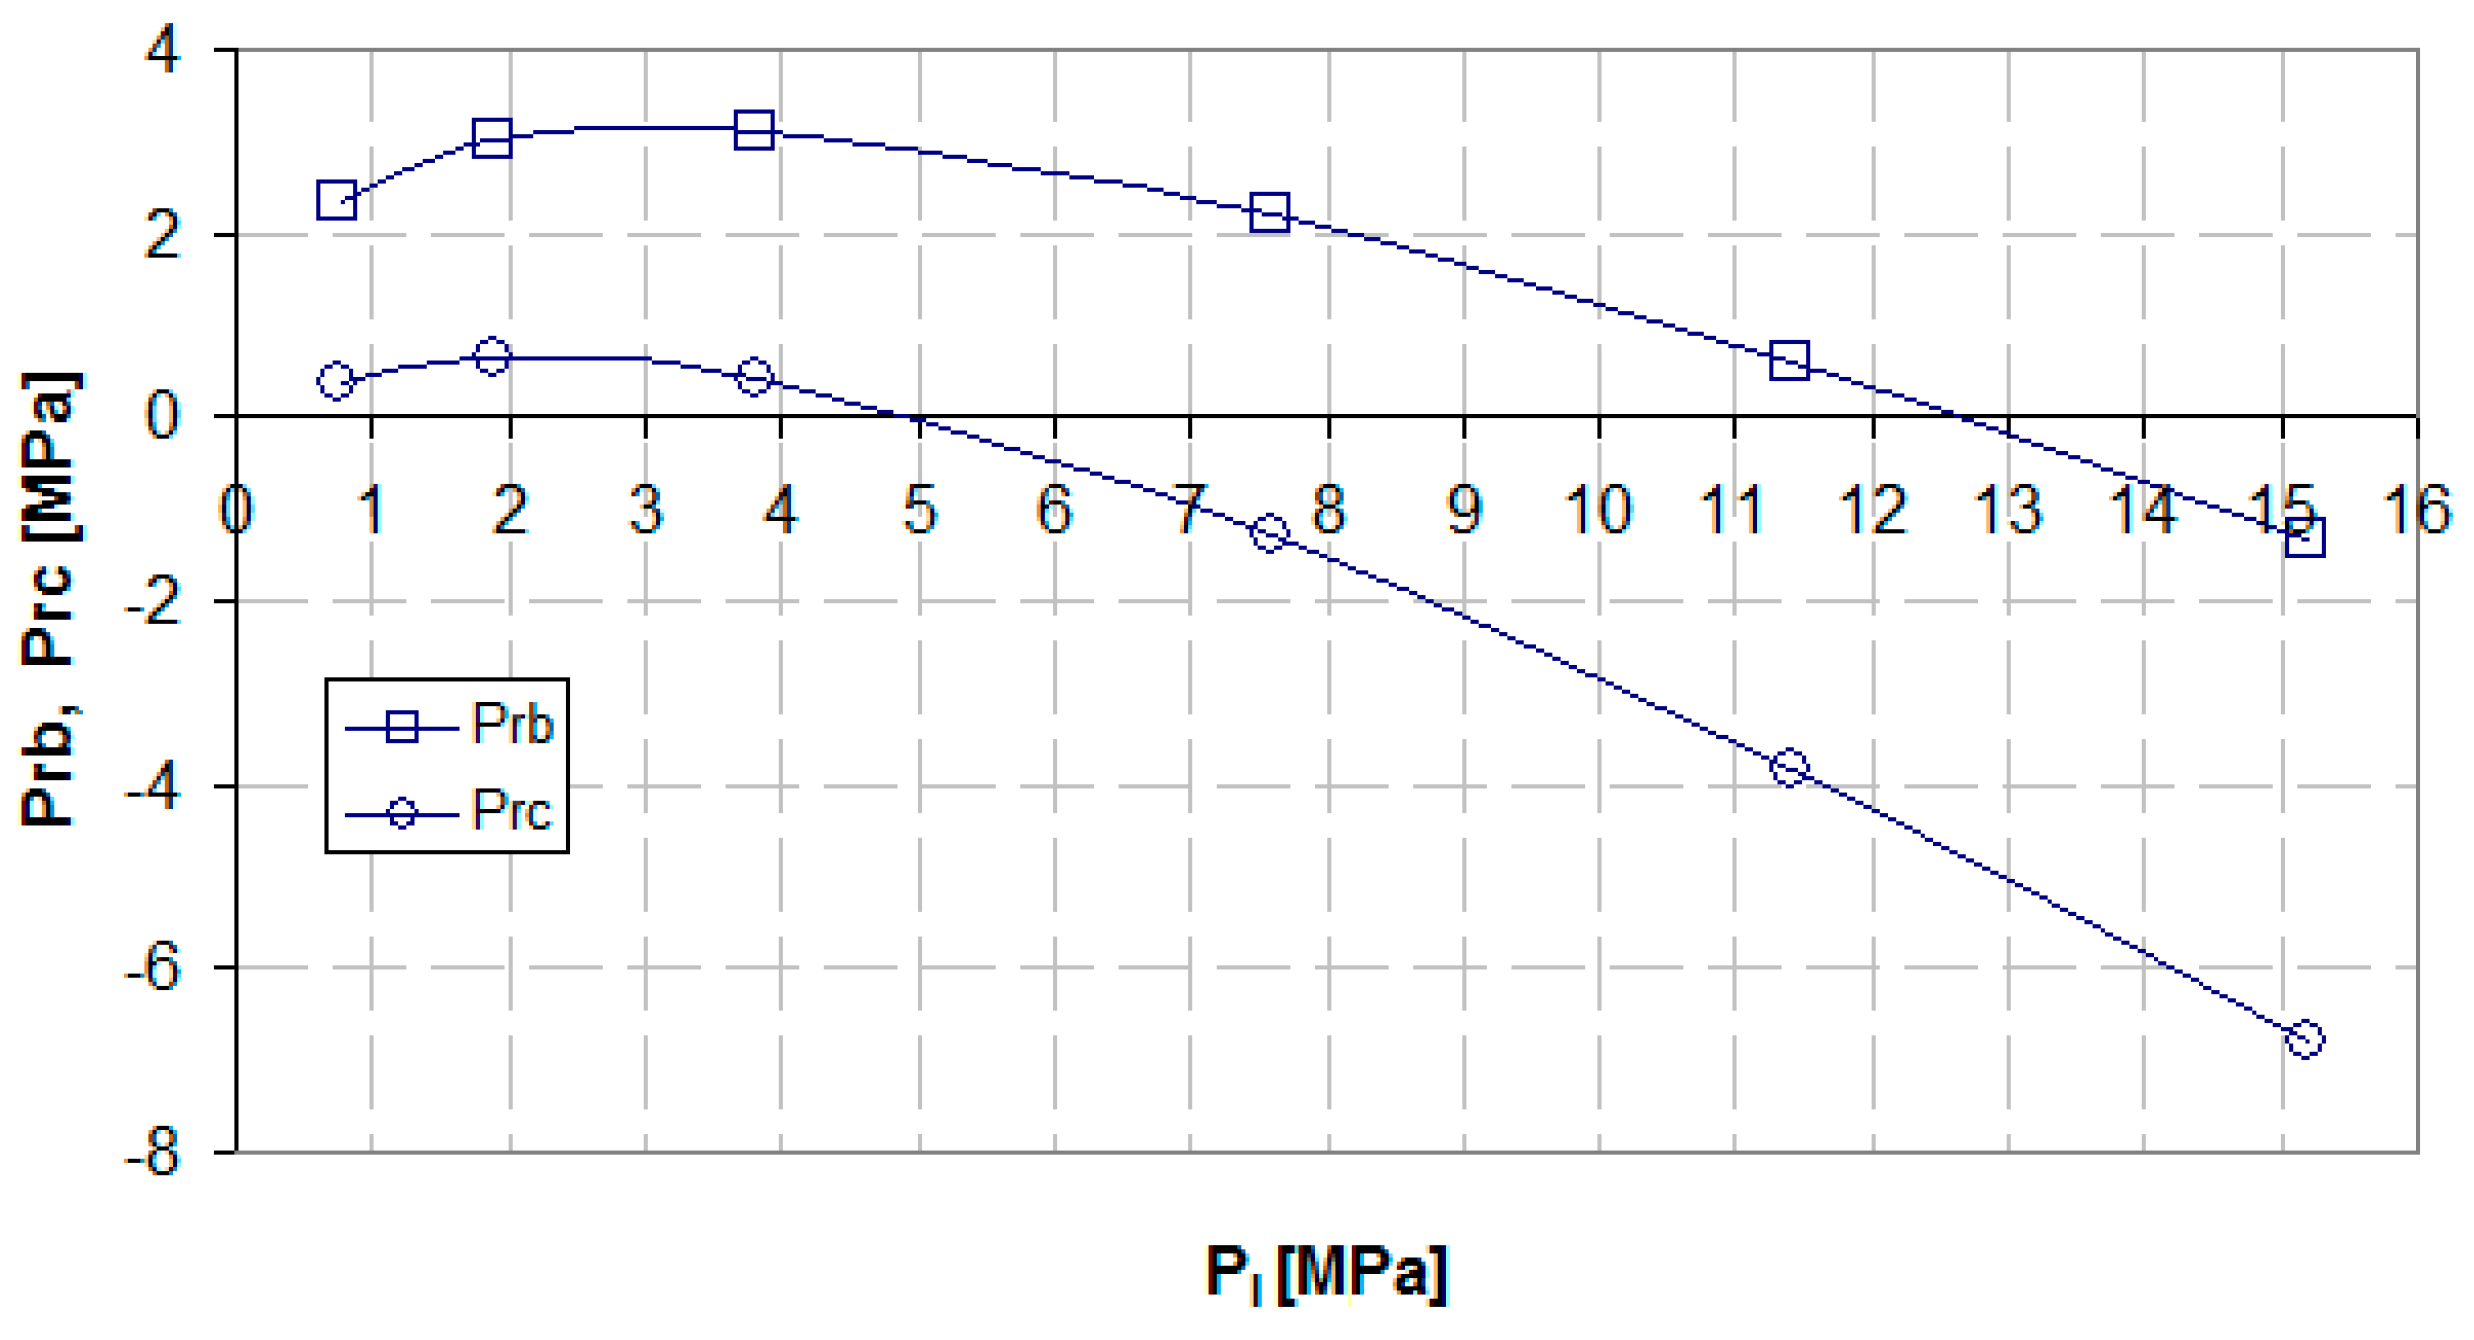
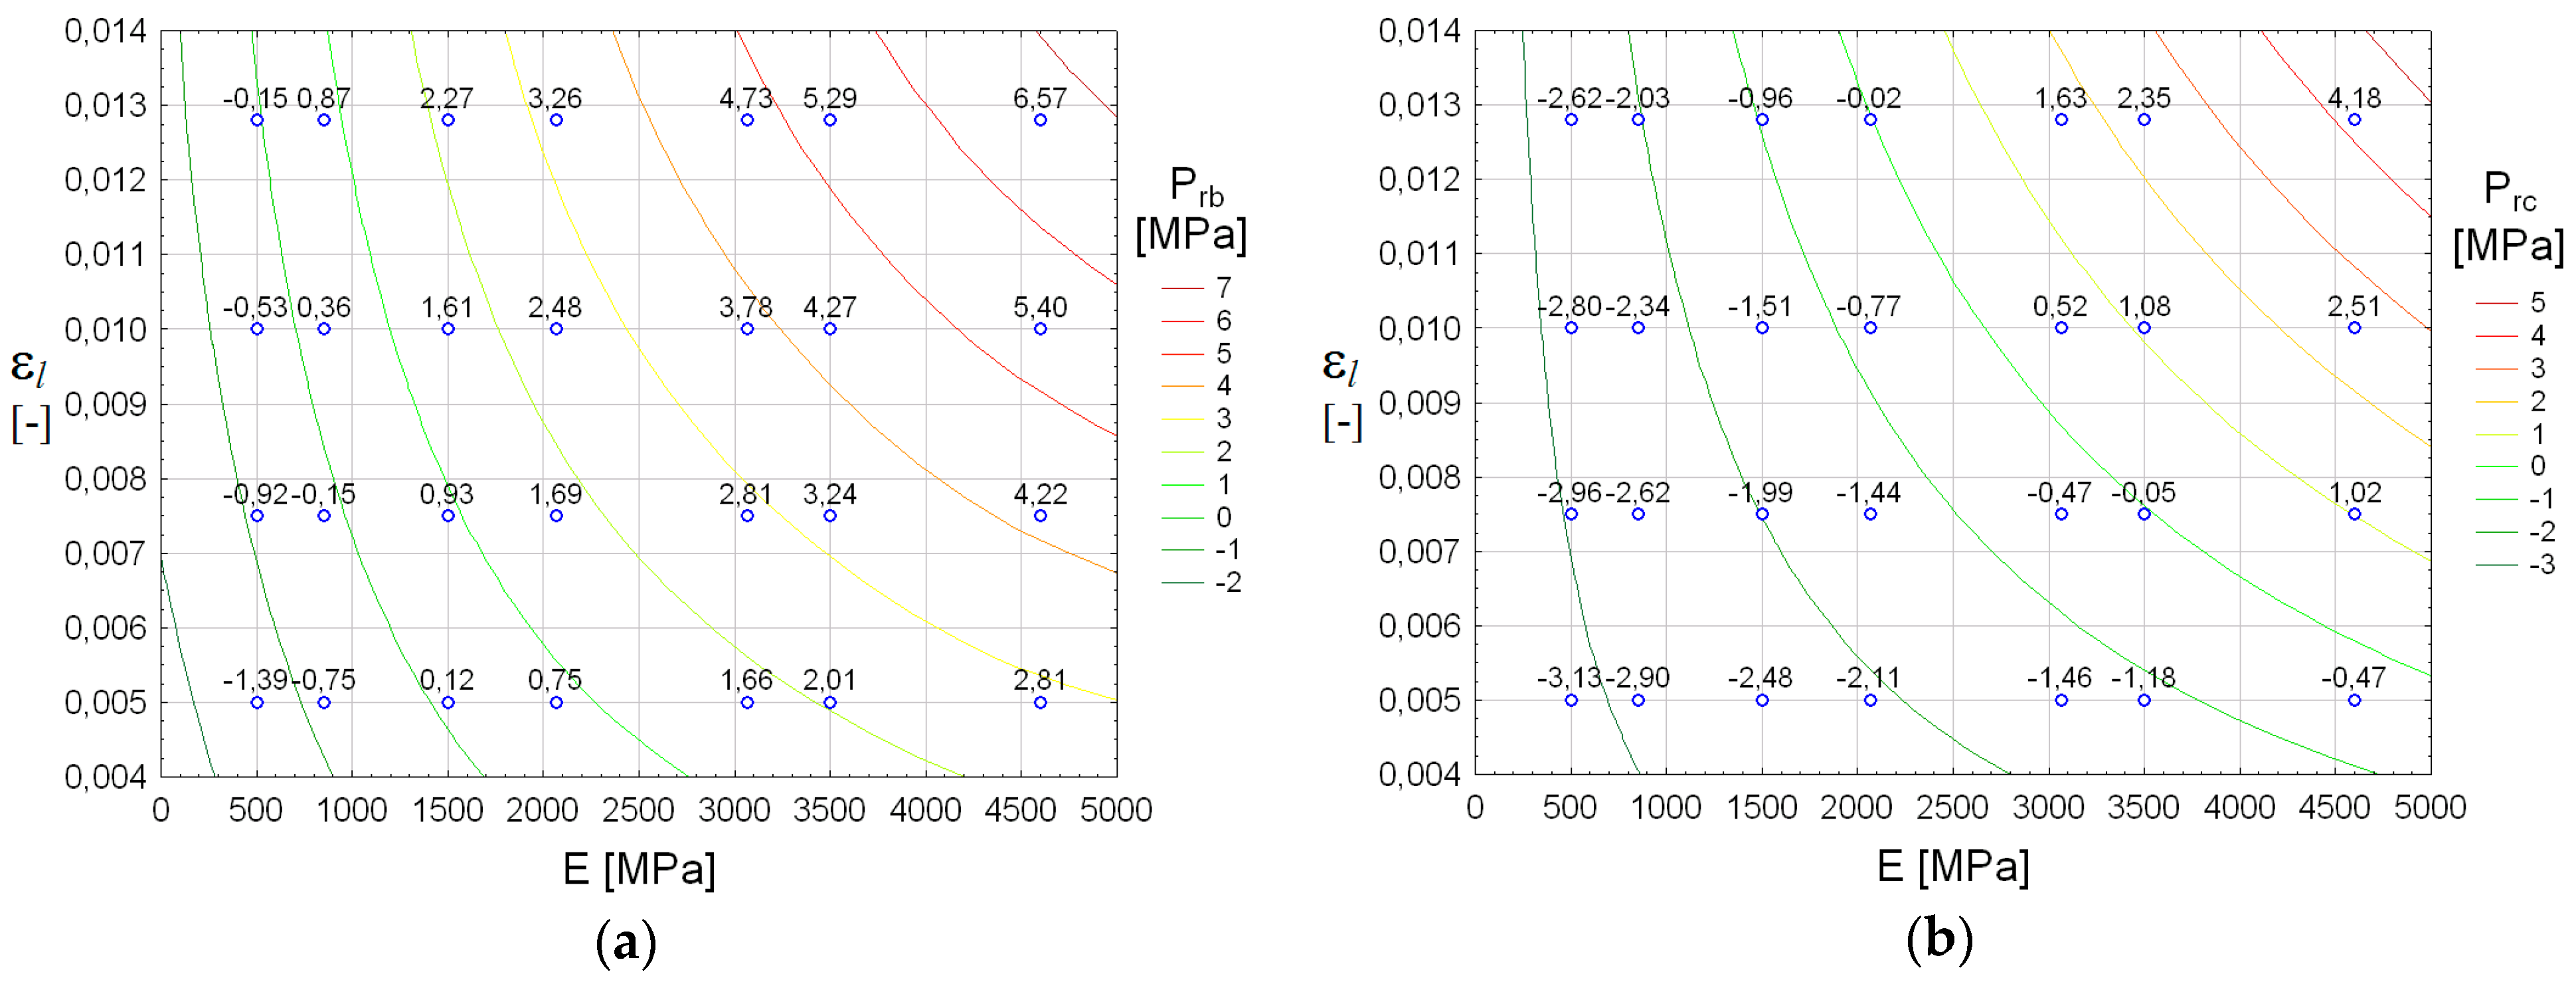
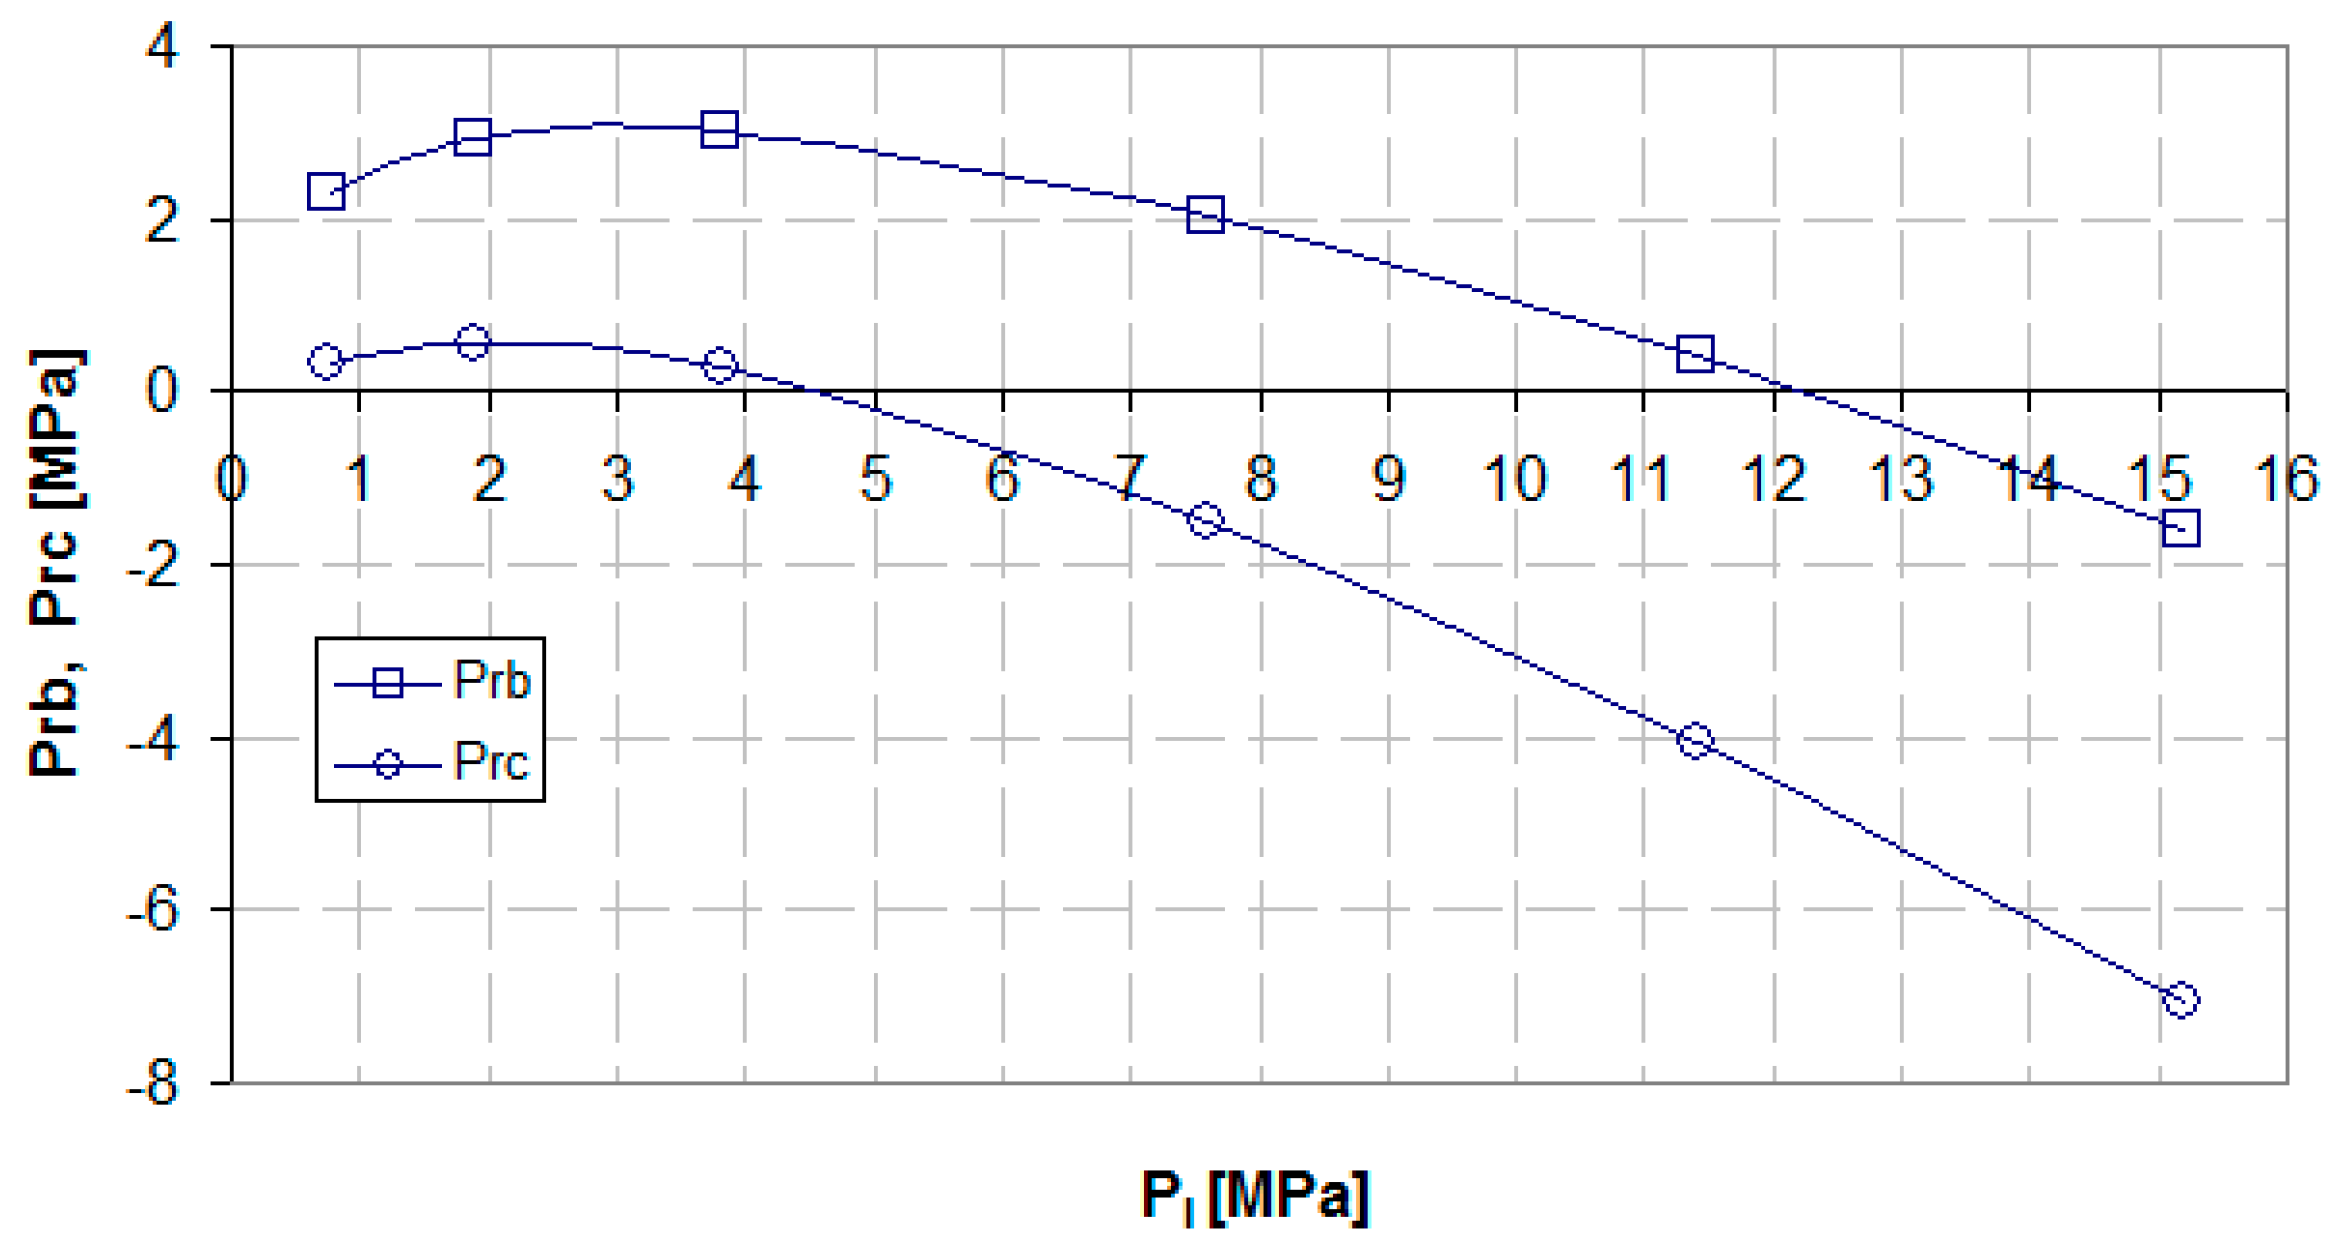
Such analyses were also conducted for the other coal basins, including Mannville Group, Mesaverde Group Western Canada, and Northern and North-East of Fairway San Juan, to identify the coal properties which cause the permeability to either rise or drop. The results of these analyses are presented in Figure 15, Figure 16, Figure 17, Figure 18, Figure 19, Figure 20, Figure 21 and Figure 22, respectively.
3.7. Examples of Problems with Methane Extraction from Coal Beds—Poland, Japan
3.7.1. Recopol CO2—ECBM project—Poland
This project was designed to store carbon dioxide and support methane production in the Upper Silesia Basin, Poland [30]. Two holes were bored to the Carboniferous system at 900–1250 m intervals. During coal-bed dewatering, we observed a small increase in permeability and some stabilisation of the gas volume in the production hole, but this was relatively small. Then, there was a reduction in the CO2 injected into the coal bed. A test performed in situ showed a drop in the coal permeability. Over a period of about 1.5 years, the overall recovery of methane proved to be small, as a result of which the project was terminated. These poor results were due to a slow gas diffusion within the micro-pore structure of the coal and the swelling of the matrix, which narrowed down the cleats due to high-pressure CO2 adsorption.
The different properties of coal which hamper the release of methane from coal beds have been explored by Olajossy [31], who provided some information about the coal from the Upper Silesian Basin. Furthermore, the impact of such properties as the maceral content and rank of coal on the sorption capacity of the Upper Silesian Basin coal was investigated by Olajossy [32].
3.7.2. Yubari CO2/N2—ECBM Project—Japan
Tests designed to employ Enhanced Coal Bed Methane Recovery (ECBM) were performed on the Yubari coal bed over two years at a depth of 900 m [33]. They used a multi-well injection of CO2 and N2, alternately. This involved three consecutive stages—pre-flooding with CO2 to establish the baseline injectivity, N2 flooding, and a post-flooding CO2 injection. After CO2 and N2 were injected repeatedly, the coal permeability did not return to its initial value. This could possibly be due to coal matrix swelling during CO2 adsorption and, consequently, an increased stress within the zone near the injection well.
4. Summary and Conclusions
In some well-known coal basins, where methane is being or was produced, there are beds where methane production has failed to reach the appropriate level, whether in economic or engineering terms. One possible reason for this unfavourable situation, as argued in this paper, is the need to identify, in qualitative and quantitative terms, the key parameters that are at play in CBM. With regard to geomechanics, by emphasising the role of coal cleat compressibility, the Cui-Bastin model selected here describes how permeability changes when the methane pressure drops within the bed during the production of this gas. In addition, the model accounts for the extremely important role of desorption parameters. The results of the simulations of changes in permeability for the selected coal basins in the USA and Canada, as discussed here, have allowed us to identify the geomechanical and methane-desorption-related properties that are crucial for an efficient methane production. In these simulations, we used the data available from previous studies on CBM, as conducted by other authors. These values are provided as ranges or means. Such data is still limited. Moreover, the differences between the coal properties observed in laboratory tests on cores, and those identified as part of in situ tests, are noticeable.
Following an analysis of our simulations, we were able to identify some trends in the correlations between the rebound pressure and recovery pressure values, as well as in the relations between the rebound pressure, and recovery pressure and initial pressure, depending on the values of some key parameters, which do not support an increase in the coal permeability based on its correlation with the gas pressure. We also presented some other configurations of those parameters that seem to contribute to the increase in the coal permeability. Based on the findings discussed here, the following conclusions are important to consider:
- There are three well-known, traditional models that are considered to be representative and elementary, namely Palmer and Mansoori, Shi-Durucan and Cui-Bustin. The Shi-Durucan model was improved here to give it a form that is correct and has probably not been presented yet. However, as it grossly overestimates the modelling results, it was not used for our simulations.
- Coal cleat compressibility is an absolutely crucial input parameter. It depends, in the following order, on the Young’s modulus, initial porosity, and Poisson’s ratio.
- Another key parameter is desorption-induced volumetric strain.
- In two types of coal from a certain basin, with the same but—importantly—low values of the Young’s modulus and different values of the initial porosity, an increase in permeability will not be possible if the desorption-induced volumetric strain is low and the Langmuir pressure, as a parameter, is high.
- The presented two-dimensional maps can be used as the sources of information about the distribution of the rebound pressure and recovery pressure depending on the Young’s modulus and desorption of the produced volumetric deformations. The values of such rebound pressure and recovery pressure, which can be negative or positive, play an important role in the assessment of the cost-effectiveness of methane production.
- Being able to predict changes in the coal permeability is crucial for the well exploration of methane from coal beds and methane production management.
- For the analyzed coal beds, the coal petrographic composition and coal rank has a significant impact on methane depletion. A detailed analysis of these dependencies is needed. Such an analysis requires detailed data, which, as can be seen for the presented coal beds, have a large dispersion. This scattering of data means that the analysis should take place on a large set of data designated for an individual coal bed region, in order to obtain statistically significant relationships. Such an analysis goes beyond the scope of this article, but it will be the subject of further research.
Author Contributions
A.O.; concept, methodology, review and editing, J.C.; methodology and writing—review and editing.
Funding
This research received no external funding.
Acknowledgments
The study was supported by the statutory research funds of the AGH University of Science and Technology, Faculty of Mining and Geoengineering within the framework of the research program No. 11.11.100.277.
Conflicts of Interest
The authors declare no conflict of interest.
References
- Palmer, I.; Mansoori, J. How permeability depends on stress and pore pressure in coalbeds: A new model. In Proceedings of the SPE Annual Technical Conference and Exhibition, Denver, CO, USA, 6–9 October 1996. [Google Scholar]
- Palmer, I.; Mansoori, J. How permeability depends on stress and pore pressure in coalbeds: A new model. SPE Reservoir Eval. Eng. 1998, 52607, 539–544. [Google Scholar] [CrossRef]
- Cui, X.; Bustin, R. Volumetric strain associated with methane desorption and its impact on coalbed gas production from deep coal seams. AAPE Bull. 2005, 89, 1181–1202. [Google Scholar] [CrossRef]
- Pan, Z.; Connell, L. Modelling permeability for coal reservoirs: A review of analytical models and testing data. Int. J. Coal Geol. 2012, 92, 1–44. [Google Scholar] [CrossRef]
- Feng, R.; Harpalani, S.; Pandey, R. Laboratory measurement of stress-dependent coal permeability using pulse-decay technique and flow modeling with gas depletion. Fuel 2016, 177, 76–86. [Google Scholar] [CrossRef]
- Seidle, J. Fundamentals of Coalbed Methane Reservoir Engineering; Penn Well Corporation: Tulsa, OK, USA, 2011. [Google Scholar]
- Connell, L. Coupled flow and geomechanical processes during gas production from coal seams. Int. J. Coal Geol. 2009, 79, 18–28. [Google Scholar] [CrossRef]
- Gao, X.; Yang, T.; Yao, K.; Zhang, B.; Wu, Q.; Liu, C. Mechanical Performance of Methane Hydrate—Coal Mixture. Energies 2018, 11, 1562. [Google Scholar] [CrossRef]
- Shi, J.; Durucan, S. Drawdown induced changes in permeability of coalbeds: A new interpretation of the reservoir response to primary recovery. Trans. Porous Media 2004, 56, 1–16. [Google Scholar] [CrossRef]
- Zimmerman, R.W.; Somerton, W.H.; King, M.S. Compressibility of porous rocks. J. Geophys. Res. Solid Earth 1986, 91, 12765–12777. [Google Scholar] [CrossRef]
- Jaeger, J.C.; Cook, N.G.W.; Zimmerman, R. Fundamentals of Rock Mechanics, 4th ed.; John Wiley & Sons: Hoboken, NJ, USA, 2007. [Google Scholar]
- Neuzil, C.E. Hydromechanical coupling in geologic processes. Hydrogeol. J. 2003, 11, 4–83. [Google Scholar] [CrossRef]
- Harpalani, S.B.; Chen, G. Estimation of Change in Fracture Porosity of Coal with Gas Emission. Fuel 1995, 74, 1491–1498. [Google Scholar] [CrossRef]
- Levine, J.R. Model study of the influence of matrix shrinkage on absolute permeability of coal bed reservoirs. Geol. Soc. Lond. Spec. Pub. 1996, 109, 197–212. [Google Scholar] [CrossRef]
- Chikatamarla, L.; Cui, X.; Bustin, R.M. Implications of volumetric swelling/shrinkage of coal in sequestration of acid gases. In Proceedings of the International Coalbed Methane Symposium, Tuscaloosa, AL, USA, 3–7 May 2004. [Google Scholar]
- Seidle, J.P.; Jeansonne, M.W.; Erickson, D.J. Application of Matchstick Geometry to Stress Dependent Permeability in Coals. In Proceedings of the SPE Rocky Mountain Regional Meeting, Casper, WY, USA, 18–21 May 1992. [Google Scholar]
- Palmer, J.; Reeves, S.R. Modeling changes of permeability in coal seams. Final Report, DOE Contract No. DE-FC26-OONT 40924; Advanced Resources International, Inc.: Arlington, VA, USA, July, 2007. [Google Scholar]
- Bustin, M.M.; Bustin, R.M. Impact of reservoir properties on the production of the Manville Coal Measures, South Central Alberta from a numerical modeling parametric analysis. Engineering 2017, 9, 291–327. [Google Scholar] [CrossRef]
- Harpalani, S.; Chen, G. Influence of gas production induced volumetric strain on permeability of coal. Geotech. Geol. Eng. 1997, 15, 303–325. [Google Scholar] [CrossRef]
- Clarkson, C.R.; Bustin, R.M. The effect of pore structure and gas pressure upon the transport properties of coal: a laboratory and modeling study. Fuel 1999, 78, 1345–1362. [Google Scholar] [CrossRef]
- Liu, S.; Harpalani, S. Gas production induced stress and permeability variations in coalbed methane reservoirs. ARMA 12-624. In Proceedings of the 46th US Rock Mechanics/Geomechanics Symposium, Chicago, IL, USA, 24–27 June 2012. [Google Scholar]
- Liu, S.; Harpalani, S.; Pillalamarry, M. Laboratory measurement and modeling of coal permeability with continued methane production: Part 2—Modeling results. Fuel 2012, 94, 117–124. [Google Scholar] [CrossRef]
- Gierhart, R.R.; Clarkson, C.R.; Seidle, J.P. Spatial variation of San Juan basin Fruitland coalbed methane pressure dependent permeability: magnitude and function form. JPTC-11333-PP. In Proceedings of the International Petroleum Technology Conference, Dubai, UAE, 4–6 December 2007. [Google Scholar]
- Clarkson, C.R.; Mc Govern, J.M. A new tool for unconventional reservoir exploration and development applications. In Proceedings of the International Coalbed Methane Symposium, University of Alabama, Tuscaloosa, AL, USA, 5–9 May 2003. [Google Scholar]
- Close, J.C.; Woolverton, S.; Swainson, K. Non-fairway, under pressured Fruitland coal resource characterization study, southern San Juan basin, New Mexico: University of Alabama College of Continuing Studies. In Proceedings of the International Coalbed Methane Symposium, Tuscaloosa, AL, USA, 12–17 May 1997. [Google Scholar]
- Ayers, W.B., Jr. Coalbed methane in the Fruitland Formation, San Juan Basin, western United States: A giant unconventional gas play. Giant oil and gas fields of the decade 1990–1999. AAPG Mem. 2003, 78, 159–188. [Google Scholar]
- Rice, D.D.; Clayton, J.L.; Pawlewicz, M.J. Characterization of coal-derived hydrocarbons and source-rock potential of coal beds, San Juan Basin, New Mexico and Colorado, U.S.A. Int. J. Coal Geol. 1989, 13, 597–626. [Google Scholar] [CrossRef]
- Gentzis, F.; Goodarzi, F.K.; Cheung, F.L.D. Coalbed methane producibility from the Mannville coals in Alberta, Canada: A comparison of two areas. Int. J. Coal Geol. 2008, 74, 237–249. [Google Scholar] [CrossRef] [Green Version]
- Rice, D.D. Composition and Origins of Coalbed Gas. In Hydrocarbons from Coal: AAPG Studies in Geology; AAPG: Tulsa, OK, USA, 1993; pp. 159–184. [Google Scholar]
- Van Bergen, F.; Pagnier, H.; Krzystolik, P. Field experiment of enhanced coalbed methane—CO2 in the Upper Silesian Basin of Poland. Environ. Geosci. 2006, 13, 201–224. [Google Scholar] [CrossRef]
- Olajossy, A. Some parameters of coal methane system that cause very slow release of methane from virgin coal beds (CBM). Intern. J. Min. Sci. Tech. 2017, 27, 321–326. [Google Scholar] [CrossRef]
- Olajossy, A. The influence of the rank of coal on methane sorption capacity in coals. Arch. Min. Sci. 2014, 59, 509–516. [Google Scholar]
- Kiyama, T.; Nishimoto, S.; Fujioka, M.; Xue, Z.; Ishijiama, Y.; Pan, Z.; Connel, L.D. Coal swelling strain and permeability change with injecting CO2, N2 at stress-constrained condition. Int. J. Coal. Geol. 2011, 85, 56–64. [Google Scholar] [CrossRef]
Figure 1.
Changes in permeability in relation to changes in the methane pressure based on the Palmer and Mansoori model [1,2].

Figure 2.
Changes in permeability in relation to changes in the methane pressure based on the Cui and Bustin model [3].
Figure 2.
Changes in permeability in relation to changes in the methane pressure based on the Cui and Bustin model [3].

Figure 3.
Changes in permeability in relation to changes in the methane pressure based on the improved Shi-Durucan model.
Figure 3.
Changes in permeability in relation to changes in the methane pressure based on the improved Shi-Durucan model.

Figure 4.
Deformations caused solely by the geomechanical action of the pore pressure based on the Cui and Bustin model.
Figure 4.
Deformations caused solely by the geomechanical action of the pore pressure based on the Cui and Bustin model.

Figure 5.
Deformations caused solely by desorption based on the Cui and Bustin model.

Figure 6.
Changes in the Mannville Group coal permeability in relation to changes in the methane pressure based on the Cui and Bustin model [3].
Figure 6.
Changes in the Mannville Group coal permeability in relation to changes in the methane pressure based on the Cui and Bustin model [3].

Figure 7.
Deformations in Mannville Group coal produced solely by the geomechanical action of the pore pressure based on the Cui and Bustin model.
Figure 7.
Deformations in Mannville Group coal produced solely by the geomechanical action of the pore pressure based on the Cui and Bustin model.

Figure 8.
Deformations in Mannville Group coal produced solely by desorption based on the Cui and Bustin model.
Figure 8.
Deformations in Mannville Group coal produced solely by desorption based on the Cui and Bustin model.

Figure 9.
Changes in the Mannville Group coal permeability depending on the extreme values of εl.

Figure 10.
Changes in the Mannville Group coal permeability depending on the extreme values of PL.

Figure 11.
Changes in the Cretaceous Mesaverde Group coal permeability in relation to changes in the methane pressure based on the Cui and Bustin model [3].
Figure 11.
Changes in the Cretaceous Mesaverde Group coal permeability in relation to changes in the methane pressure based on the Cui and Bustin model [3].

Figure 12.
Changes in the coal permeability of two types of coal from the San Juan basin, i.e., Northern and Northeast of Fairway in relation to changes in methane’s pore pressure based on the Cui and Bustin model [3].
Figure 12.
Changes in the coal permeability of two types of coal from the San Juan basin, i.e., Northern and Northeast of Fairway in relation to changes in methane’s pore pressure based on the Cui and Bustin model [3].

Figure 13.
Maps of: (a) the rebound pressure Prb; and (b) the recovery pressure Prc, as correlated with E and εl for the Fruitland Boomer Well B-1 San Juan basin.
Figure 13.
Maps of: (a) the rebound pressure Prb; and (b) the recovery pressure Prc, as correlated with E and εl for the Fruitland Boomer Well B-1 San Juan basin.

Figure 14.
The variability in Prb and Prc as a function of the pressure PL for the coal from the Fruitland Boomer Well B-1 San Juan basin.
Figure 14.
The variability in Prb and Prc as a function of the pressure PL for the coal from the Fruitland Boomer Well B-1 San Juan basin.

Figure 15.
Maps of: (a) the rebound pressure Prb; and (b) the recovery pressure Prc, as correlated with E and εl for the Mannville Group basin, Lower Cretaceous, Western Canada.
Figure 15.
Maps of: (a) the rebound pressure Prb; and (b) the recovery pressure Prc, as correlated with E and εl for the Mannville Group basin, Lower Cretaceous, Western Canada.

Figure 16.
The variability in Prb and Prc as a function of the pressure PL for the coal from the Mannville Group basin, Lower Cretaceous, Western Canada.
Figure 16.
The variability in Prb and Prc as a function of the pressure PL for the coal from the Mannville Group basin, Lower Cretaceous, Western Canada.

Figure 17.
Maps of: (a) the rebound pressure Prb; and (b) the recovery pressure Prc, as correlated with E and εl for the Mesaverde Group, Piceance basin, Western Canada.
Figure 17.
Maps of: (a) the rebound pressure Prb; and (b) the recovery pressure Prc, as correlated with E and εl for the Mesaverde Group, Piceance basin, Western Canada.

Figure 18.
The variability in Prb and Prc as a function of the pressure PL for the coal from the Mesaverde Group, Piceance basin, Western Canada.
Figure 18.
The variability in Prb and Prc as a function of the pressure PL for the coal from the Mesaverde Group, Piceance basin, Western Canada.

Figure 19.
Maps of: (a) the rebound pressure Prb; and (b) the recovery pressure Prc, as correlated with E and εl for the Northern San Juan basin.
Figure 19.
Maps of: (a) the rebound pressure Prb; and (b) the recovery pressure Prc, as correlated with E and εl for the Northern San Juan basin.

Figure 20.
The variability in Prb and Prc as a function of the pressure PL for the coal from the Northern San Juan basin.
Figure 20.
The variability in Prb and Prc as a function of the pressure PL for the coal from the Northern San Juan basin.

Figure 21.
Maps of: (a) the rebound pressure Prb; and (b) the recovery pressure Prc, as correlated with E and εl for the North-East of Fairway San Juan basin.
Figure 21.
Maps of: (a) the rebound pressure Prb; and (b) the recovery pressure Prc, as correlated with E and εl for the North-East of Fairway San Juan basin.

Figure 22.
The variability in Prb and Prc as a function of the pressure PL for the coal from the North-East of Fairway San Juan basin.
Figure 22.
The variability in Prb and Prc as a function of the pressure PL for the coal from the North-East of Fairway San Juan basin.


| E (MPa) | v (-) | ϕo (-) | Po (MPa) | PL (MPa) | εl (-) | cf (1/MPa) |
|---|---|---|---|---|---|---|
| 854 | 0.39 | 0.001 | 7.58 | 4.31 | 0.0128 | 0.582 |
| 854 | 0.005 | 0.116 | ||||
| 3070 | 0.001 | 0.162 | ||||
| 3070 | 0.005 | 0.032 |
Table 2.
Lower Cretaceous, Mannville Group, Western Canada [18].
Table 2.
Lower Cretaceous, Mannville Group, Western Canada [18].
| E (MPa) | v (-) | ϕo (-) | Po (MPa) | PL (MPa) | εl (-) | cf (1/MPa) |
|---|---|---|---|---|---|---|
| 500 | 0.25–0.47, aver. 0.36 | 0.006 | 7.6 | 3.8–7.6, aver. 5.7 | 0.0042–0.016, aver. 0.0101 | 0.198 |
| 500 | 0.03 | 0.039 | ||||
| 4600 | 0.006 | 0.021 | ||||
| 4600 | 0.03 | 0.004 |
| E (MPa) | v (-) | ϕo (-) | Po (MPa) | PL (MPa) | εl (-) | cf (1/MPa) |
|---|---|---|---|---|---|---|
| 1000 | 0.3 | 0.006 | 7.2 | 7.2 | 0.005–0.013, aver. 0.009 | 0.123 |
| 2750 | 0.045 | |||||
| 4500 | 0.027 |
| E (MPa) | v (-) | ϕo (-) | Po (MPa) | PL (MPa) | εl (-) | cf (1/MPa) |
|---|---|---|---|---|---|---|
| 2411.5 | 0.29 | 0.0045 | 7.6 | 5.9 | 0.0098 | 0.07 |
| E (MPa) | v (-) | ϕo (-) | Po (MPa) | PL (MPa) | εl (-) | cf (1/MPa) |
|---|---|---|---|---|---|---|
| 2067 | 0.35 | 0.004 | 9.7 | 3.45 | 0.008 | 0.075 |
Table 6.
The rebound pressure Prb and recovery pressure Prc values for the Palmer and Mansoori, Cui and Bustin, and improved Shi-Durucan models, as obtained for the Boomer well B-1 San Juan basin.
Table 6.
The rebound pressure Prb and recovery pressure Prc values for the Palmer and Mansoori, Cui and Bustin, and improved Shi-Durucan models, as obtained for the Boomer well B-1 San Juan basin.
| Pressure (MPa) | M (MPa) Equation (14) | Palmer and Mansoori, Equation (4) | Cui and Bustin, Equations (12) and (13) | Improved Shi-Durucan, Equations (8) and (9) |
|---|---|---|---|---|
| Prb | 1705.5 | 1.99 | 0.44 | 6.26 |
| 6123.9 | 7.64 | 4.70 | 15.7 | |
| Prc | 1705.5 | - | −2.4 | 5.09 |
| 6123.9 | - | 2.52 | 29.4 |
Table 7.
The rebound pressure Prb and recovery pressure Prc values for the Cui and Bustin model, as obtained for the coal from the Mannville Group basin, Lower Cretaceous, Western Canada.
Table 7.
The rebound pressure Prb and recovery pressure Prc values for the Cui and Bustin model, as obtained for the coal from the Mannville Group basin, Lower Cretaceous, Western Canada.
| Pressure (MPa) | M (MPa) | Cui and Bustin |
|---|---|---|
| Prb | 840.3 | −1.94 |
| 7731.1 | 5.69 | |
| Prc | 840.3 | −4.64 |
| 7731.1 | 4.06 |
Table 8.
The rebound pressure Prb and recovery pressure Prc values for the Cui and Bustin model, as obtained for the coal from the Mesaverde Group basin, Western Canada.
Table 8.
The rebound pressure Prb and recovery pressure Prc values for the Cui and Bustin model, as obtained for the coal from the Mesaverde Group basin, Western Canada.
| Pressure (MPa) | M (MPa) | Cui and Bustin |
|---|---|---|
| Prb | 1346.1 | −1.43 |
| 3701.9 | 2.35 | |
| 6057.6 | 5.02 | |
| Prc | 1346.1 | −4.89 |
| 3701.9 | −0.85 | |
| 6057.6 | 3.18 |
Table 9.
The rebound pressure Prb and recovery pressure Prc values for the Cui and Bustin model, as obtained for the coal from the San Juan-Northern basin.
Table 9.
The rebound pressure Prb and recovery pressure Prc values for the Cui and Bustin model, as obtained for the coal from the San Juan-Northern basin.
| Pressure (MPa) | M (MPa) | Cui and Bustin |
|---|---|---|
| Prb | 3317.4 | 1.85 |
| Prc | −1.30 |
Table 10.
The rebound pressure Prb and recovery pressure Prc values for the Cui and Bustin model, as obtained for the coal from the San Juan-Northeast of Fairway basin.
Table 10.
The rebound pressure Prb and recovery pressure Prc values for the Cui and Bustin model, as obtained for the coal from the San Juan-Northeast of Fairway basin.
| Pressure (MPa) | M (MPa) | Cui and Bustin |
|---|---|---|
| Prb | 3160.1 | 2.58 |
| Prc | −0.56 |
© 2019 by the authors. Licensee MDPI, Basel, Switzerland. This article is an open access article distributed under the terms and conditions of the Creative Commons Attribution (CC BY) license (http://creativecommons.org/licenses/by/4.0/).
Share and Cite
MDPI and ACS Style
Olajossy, A.; Cieślik, J. Why Coal Bed Methane (CBM) Production in Some Basins is Difficult. Energies 2019, 12, 2918. https://doi.org/10.3390/en12152918
AMA Style
Olajossy A, Cieślik J. Why Coal Bed Methane (CBM) Production in Some Basins is Difficult. Energies. 2019; 12(15):2918. https://doi.org/10.3390/en12152918
Chicago/Turabian StyleOlajossy, Andrzej, and Jerzy Cieślik. 2019. "Why Coal Bed Methane (CBM) Production in Some Basins is Difficult" Energies 12, no. 15: 2918. https://doi.org/10.3390/en12152918
Note that from the first issue of 2016, this journal uses article numbers instead of page numbers. See further details here.