Transitioning Island Energy Systems—Local Conditions, Development Phases, and Renewable Energy Integration


Department of Planning, Aalborg University, Rendsburggade 14, 9000 Aalborg, Denmark
*
Author to whom correspondence should be addressed.
Energies 2019, 12(18), 3484; https://doi.org/10.3390/en12183484
Submission received: 7 August 2019
/
Revised: 31 August 2019
/
Accepted: 5 September 2019
/
Published: 10 September 2019
(This article belongs to the Special Issue 100% Renewable Energy Transition: Pathways and Implementation)
Abstract
:Islands typically have sensitive energy systems depending on natural surroundings, but innovative technologies and the exploitation of renewable energy (RE) sources present opportunities like self-sufficiency, but also challenges, such as grid instability. Samsø, Orkney, and Madeira are in the transition to increase the RE share towards 100%—however, this is addressed in different ways depending on the local conditions and current development phases in the transition. Scenarios focusing on the short-term introduction of new technologies in the energy systems are presented, where the electricity sector is coupled with the other energy sectors. Here, both smart grid and sector-integrating solutions form an important part in the next 5–15 years. The scenarios are analyzed using the modeling tool EnergyPLAN, enabling a comparison of today’s reference scenarios with 2030 scenarios of higher RE share. By including three islands across Europe, different locations, development stages, and interconnection levels are analyzed. The analyses suggest that the various smart grid solutions play an important part in the transition; however, local conditions, sector integration, and balancing technologies even more so. Overall, the suggestions complement each other and pave the way to reach 100% RE integration for both islands and, potentially, other similar regions.
1. Introduction on RE Integration on Islands
Islands’ energy systems are like most other energy systems aiming to utilize renewable energy (RE) to supply their demands. However, they are under more pressure due to their inherent isolation and higher dependence on their natural surroundings, including conditions affecting possible RE utilization. The European Union (EU) has the general ambition to increase the use of RE in the near future [1], and various studies suggest how to increase the use up to 100% through sector integration [2,3].
The EU specifically targets “clean energy for EU islands” to support this transition [4]. Islands are to follow the same trend despite their limitations, but they can also benefit much more from local utilization of local resources to increase self-sufficiency. Research has already touched on the present and potential future, but also the limits of RE on islands as it can be difficult to increase the RE share without proper step-by-step integration and balancing.
A review of RE utilization on islands by Kuang et al. [5] presented various cases of current developments, as well as suggested strategies to improve the utilization further. While solar, wind, hydro, and other technologies have been implemented to various extents, the sole exploitation of these potentials does not seem enough to reach high levels of self-sufficiency. Instead, further exploration of storages, demand side management, and micro and smart grids are mentioned to increase the RE shares further.
Praene et al. [6] presented the example of Reunion, where the self-sufficiency rate with RE has been decreasing over a period of years due to increasing energy demands. While hydropower has been a technology early and substantially explored on Reunion, by 1982, the limited potentials were almost fully exploited and unable to match the growing demands, resulting in a decreasing RE share.
While some islands in the Pacific are still struggling with small-scale RE projects hitting barriers of financial, institutional, environmental, and skill basis, the willingness for these was shown by Weir [7], but the information on how best to approach this on islands is yet to be evaluated. Thushara et al. [8] presented an example of an island (Sri Lanka) without grid connection or fuel reserves on the verge of finding the right future power generation, showing limits and conflicts to a full renewable supply.
Ioannidis et al. argued that islands are forced to invest in RE to avoid dependence on fossil fuel imports, energy scarcity, and other uncertainties [9]. These investments might happen uncontrolled, resulting in imbalanced energy systems. Meschede et al. [10] applied the EnergyPLAN model to the island of La Gomera and, based on analyses of different supply time series, the authors’ results show advantages of diversified energy supply for this case study.
New technological solutions are currently being tested and studied on islands in this regard. Dorotić et al. presented a novel approach of relying on vehicle-to-grid (V2G) in combination with wind and photovoltaic (PV) power for the Croatian island of Korčula [11]. Meschede et al. discussed the necessary determination of appropriate smart energy system design for various-sized Philippine islands, including solutions around hybrid and storage technologies, besides connection to larger grids [12].
Rakopoulos et al. [13] mentioned the trend towards smart grids in the development of island energy systems. Colmenar-Santos et al. [14] discussed the development of RE for islands from a grid regulation perspective. Besides the requirement to align regulatory plans between islands and the rest of the country, the continental part of the country can benefit from using islands as testbeds, as they often present the same energy system aspects. To test large RE shares, the consideration of smart grid, storage, and electric vehicle (EV) implementation is suggested. For this, the specific locations and characteristics, as well as the involvement of the people of the islands, should be included. With the advance of information and communication technologies, grids can transition to smart grids that allow the use of monitoring, analysis, and control within its supply chain with the aim to improve the energy system. Rakopoulos et al. [13] further defined the framework for the development of island smart grids under the prospect of this technology becoming a priority for the European Commission. They are to help decrease carbon footprint and costs of energy by improved automation, distribution, and reduction of peaks in the grid.
Demonstration and evaluation of selected smart grid and sector integration technologies is addressed in the 2017–2021 project SMILE (Smart Island Energy systems) [15]. This focuses on the new phase in the RE transition with smart technologies to reach 100% RE shares on three demonstration islands: Samsø, Orkney, and Madeira. These islands are all investigating ways of increasing the RE share in their energy system, though local conditions and potentials differ widely, as well as their level of progress in this transition. While Samsø has been undergoing a decade-long transition from nearly zero to a high RE share after winning a competition of being Denmark’s officially designated RE island [16], it has, however, not solved the full energy system integration. The Orkney Isles are characterized by a large number of wind turbines and offshore energy production testing facilities, but suffer from fuel poverty and curtailment [17]. Madeira lies far off the European continent and stands out in European terms with great solar potential, while having to balance their energy system and grid stability autonomously [18]. These islands are therefore good case studies with challenges, as well as potentials, for the evaluation of RE integration in the transition to 100% RE.
Scope and Structure
While some islands still largely depend on fossil fuels and struggle to introduce RE, other islands already exploit most of their RE potential, but also face problems related to this. The literature study shows that growing energy demands, various barriers, and imbalances require more research and exploration of solutions. While new technologies, such as V2G, hybrid and storage options, and other smart grid solutions, have been introduced or studied, they have mainly been considered individually and in limited contexts. In addition, they have not been studied as part of a holistic island energy system transition process considering and comparing local conditions’ impacts.
With trends and plans aiming at full self-sufficiency in the near future, further transition is suggested with various new technologies, yet it is not clear how the smartening of the grid and wider energy systems with these could be addressed, realized, and aligned on islands. Hence, it can be said that a new phase in the transition towards 100% RE is emerging. In contrast to previous publications, this paper presents an alternative approach to explore the transition towards higher shares of RE by presenting a three-phase characterization and important criteria to help the transition within. The study and presentation of the case studies’ complex energy systems and the alignment, as well as distinction of the transition of three similar yet individual islands, further address the research gap.
The work presented here should be seen as the first technical explorative step in a required energy system transition, where the explorative step unveils the technical possibilities. This is not limited by local economic, social, or political aspects. Subsequent steps assess what is required to implement the technical solutions, focusing on social acceptance and business and socio-economic costs—and finally, possibly the adaption of policies, regulations and business economic framework conditions to advance technically and socio-economically favorable solutions. These later steps, however, are beyond the scope of the work presented in this article.
Section 2 presents the scenario simulation tool EnergyPLAN, along with scenario data acquisition and scenario design methods. They are used to evaluate the case study islands as presented in Section 3, specifically addressing the steps from today’s to 2030 energy systems. This is adopted from the framework of the EU-founded research project SMILE, resulting in Samsø, Orkney, and Madeira as cases [15]. A final overview of the case studies is added and discussed in relation to the general ongoing transition progress in Section 4, before the conclusions are presented.
2. Materials and Methods
This section presents the EnergyPLAN model applied in the scenario simulations, as well as the data gathering and verification methodology applied. Finally, the scenario design approach is detailed.
2.1. EnergyPLAN
The EnergyPLAN model can simulate the electricity, heating, cooling, industry, and transport sectors of an energy system on an hourly basis over a one-year time horizon, and can be used on various geographic levels and sizes of energy systems. Hence, it can be adjusted to specific locations and years by applying the respective data, such as projections to 2030. It simulates the mix of technologies in the whole system by identifying and exploiting synergies across the sectors. It is able to model fluctuating energy sources, and simulates their effects on the rest of the energy system. Depending on the inputs, such as technology capacities, efficiencies, and costs, as well as the demand and supply of the investigated case, various simulations become possible [19,20].
EnergyPLAN’s simulation strategy is either technical or economic. While the economic strategy focuses on the most economically feasible operation of the energy production units based on exogenously given market data, the technical strategy focuses on primary energy supply (PES) and hourly system balance. For this article, the technical strategy is chosen as the basis for comparisons of technical possibilities in the transitions. As Sorknæs et al. [21] and Djørup et al. [22] point out, RE influences market prices, thus for 100% RE systems, existing market data (as used in EnergyPLAN) cannot be used for simulations, whereas technical simulations show the technical possibilities. Nonetheless, the socio-economic assessment includes technology costs without taxes or subsidies and CO2 costs, assuming to bring socio-economic perspective to the otherwise technical simulation. Any variation between the business economic and socio-economic cost will be comparable between different technologies.
The reference models are adjusted to fit to a reference year for which sufficient data is available. These are compared to future scenarios that include other technologies or changes in demand and supply profiles, according to the suggestions for the case studies of the transition towards 100% RE. Especially relevant for this study, EnergyPLAN may simulate island mode, allowing for an analysis irrespective of interconnections. Any export or import is therefore not evaluated further in terms of fuel consumption or related emissions avoided through export and caused by import.
The resulting relevant effects in this study include RE shares of PES and electricity production, import/export balance, CO2 emissions, and annual socio-economic costs for each scenario investigated. The scenarios presented include the reference scenarios, which are created through research and in cooperation with the SMILE partners, as well as the future scenarios, which focus on high RE shares in relation to local conditions.
2.2. Data Gathering and Verification
The modeling of island energy systems entails the study of energy supply, conversion, and consumption. The unique characteristics of each of the studied island systems in this article are established in cooperation with SMILE partners of the respective islands. This includes the consideration of data from annual energy accounts and reports, as well as applicable literature for a reference year to build a reference model upon [31,32].
References are based on data of existing technologies with capacities, efficiencies, and costs. Furthermore, hourly distribution profiles are gathered and added to the models for the simulation of production of renewable electricity and heat, as well as for the consumption of electricity, heat, and transport. The hourly production of electricity is based on local inputs [33] or numerical models [34], [35]. The one for hot water with solar collectors is simulated with the help of energyPRO [36], with the temperature and radiation data of the selected reference year and an inclination angle typical for each region [37]. energyPRO is a simulation model created to make detailed business–economic simulations of particularly district heating plants (see [38] for a more thorough description); however, here, it is only applied due to its facility to model solar collectors. Consumption data results from local measurements or studies of households [39] and weather data.
The hourly distributions are applied in the model according to the annual values for each of the production and consumption units to represent the energy systems as close to reality as possible. For verification, EnergyPLAN is run and the annual modeled values compared to the actual ones—for example, the remaining required production from conventional power plants. If needed, alignments and corrections are made in the models, in coordination with the partners, to improve their representation of the reference energy systems [31].
2.3. Transition Scenario Design
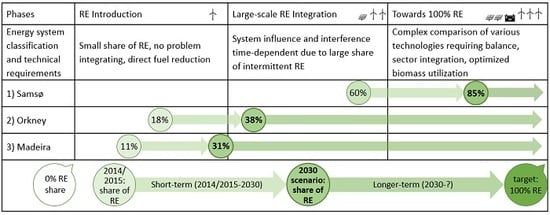
After establishing and verifying the reference scenarios, a classification of the respective energy systems is made, categorizing them into the specific RE integration phase, as illustrated in Table 1. These phases are typical for systems going from fossil reliance to RE integration and finally complete independence from fossils as defined by Lund [40]. Energy systems with up to 20% of RE are thereby grouped in the RE Introduction phase, characterized by no to little RE integration problems, where RE would be able to directly reduce fossil fuel consumption. The next phase is large-scale RE integration, with RE influencing and interfering with the existing system(s), requiring hourly analyses due to the time-dependence intermittency of RE. This second phase might already require balancing technologies as the influence from RE on the system becomes complex. The final phase of the transition to 100% RE systems requires the integration and comparison of various technologies supporting stability depending on the local conditions.
The next step in a transition depends on already existing RE utilization, local demands, and further potentials, but also on the availability of technologies. These might include various RE technologies, power-to-heat, power-to-gas, power-to-transport, thermal energy storage (TES), battery electricity energy storage (BESS), and fuel storages, as well as demand side management and algorithmic approaches—including various smart grid solutions. With EnergyPLAN, it is possible to define and model the respective technologies depending on the local data gathered. For example, the potential addition of electric transport can be included and defined with various charging and V2G options that are most suitable for the individual case.
In this paper, a short-term analysis of the transition of three island energy systems is made. Therefore, the resulting scenarios are created under consideration of the current energy system, as well as the planned actions in the upcoming 5–15 years. With this approach, certain possible changes are neglected, such as potential changes in weather conditions, demography, and unforeseeable changes in production or consumption. Related rebound effects are thereby also not studied, and neglected in the simulation. In relation to this, the temporal distribution profiles for heating and electricity are kept the same, unless specifically studied and changed due to a certain technical modification.
The scenarios consider the following: Case-specific savings potentials, case-specific RE availability, and case-specific potential energy conversion shifts. Furthermore, as an integrated part, they consider the extent to which the systems should or could rely on interconnection to the mainland or be self-sufficient. Reducing or limiting the amount of import and export is therefore aimed not to rely on the balancing capability of surrounding energy systems. Instead, local products should be used for the local systems to the largest sustainable extent possible, including using otherwise exported or curtailed electricity. For this, the integration and balancing of energy sectors becomes important.
As introduced, sector integration—partly through smart grid solutions—is key to the transition towards high RE shares in the total PES [40], and is therefore included in the scenario design, which goes beyond the idea of SMILE. In line with the RE aspect, fossil fuels, but also biomass, should be limited to a sustainable level, respectively. This goes hand in hand with the target of reducing CO2 emissions, and aligns with the EU climate targets [1]. While costs play a secondary role in the scenario making, its reduction should nonetheless also be aimed to ease implementation. Finally, the aim should be to minimize losses in the various sectors and throughout the entire energy system. This illustrates the detailed requirements for the transition of these islands towards large-scale and eventually 100% RE integration.
The scenarios are made in parallel and involve similar tasks for the different geographical areas—though different starting points and RE options result in scenarios of varying complexity and composition. Adopting this methodology for the demonstration islands of the SMILE project somewhat predefines the scenarios, yet they are further dependent on the local conditions and demands. Finally, this presents a variety of suggestions on smart grid solutions and, though being tested for three specific island cases, it can give insight into further planning approaches for most energy systems. The SMILE islands and their approaches to transit towards higher RE shares are presented in the following.
3. Case Study and Island Scenarios
To evaluate RE potentials on Samsø, Orkney, and Madera, scenarios are developed which include (1) the SMILE smart grid demonstrations, (2) a potentially larger deployment of them if suitable, and (3) in general a shift from energy systems relying on fossil fuels to energy systems relying highly on RE by 2030. The focus of the scenarios is the approach of the ongoing transition to ensure a balanced energy system with increased RE share, which may look very different for each island.
With the definition of the three phases in Table 1, the islands are classified in different stages as seen in Table 2. Samsø is furthest ahead in terms of self-sufficiency and supply through RE. With a reference RE share of almost 60% in 2015, Samsø is classified as being in the second phase of RE integration, aiming for the third phase: 100% RE. It can be said that Samsø achieved the first phase of RE introduction already in 2007. This shapes the evaluation of technologies and creation of the future scenario.
Orkney and Madeira have RE shares in the reference year 2014 of 18% and 11%, respectively, classifying them as still being in the RE introduction phase. Consequently, the next step is to reach large-scale RE integration, before aiming at the 100% target. This is characterized by the expansion of RE, such as wind and PV capacity, instead of a focus on integration and balancing, as would be the case afterwards. However, due to the long-term goal of reaching higher RE shares, some technologies, mostly defined through SMILE, already include sector-integrating and balancing options. The technologies considered for these steps are presented in the overview in Table 2, showing that different phases are reached in the addressed 2030 scenarios.
Based on the methodology, the EnergyPLAN models of Samsø, Orkney, and Madeira are introduced in the following, including the 2014/2015 references and the 2030 scenarios with the incorporation of transition suggestions. The corresponding data of all scenarios are shown in the overview Section 4.
3.1. Samsø, Denmark
Samsø is located off the east coast of the Danish mainland. It presents typical characteristics of Danish municipalities regarding energy supply, but also specifics related to being an exemplary RE island [41]. Being part of Denmark and its ambitious targets for sustainability, district heating has become an important cornerstone to supply clusters of heat demands. The employment of wind power is another important aspect, which makes up a major characteristic of Samsø’s reference and future energy system. With most data available for 2015, this year is used in the reference scenario.
3.1.1. Samsø Today
Today, Samsø’s population is at around 3700 inhabitants, and their electricity supply is mainly covered by both onshore and offshore wind power, as well as some PV capacity. With fixed capacities and temporal distributions, yearly productions are fixed in the model. These are aligned with known yearly reference productions in EnergyPLAN. Next to solar and wind resources producing mainly electricity, but also some hot water from solar panels, Samsø relies on the electricity imported through a 40 MW connection to the mainland of Denmark. This connection is mainly used for the export of surplus wind power, as well as for a limited amount of hours for import of electricity. There is no fuel-based power generation on Samsø [42,43,44,45].
Heat is supplied from four district heating plants running on woodchips, straw, and solar heat, or by individual heating devices using further biomass, oil, solar collectors, or electricity [44]. The transport sector is 99% fossil fuel-dependent, with only a small number of EVs. The main consumers—ferries connecting Samsø to Danish mainland—run mostly on oil and some natural gas.
With a high share of wind power, as well as an extensive exploration of biomass, the RE share of the PES reached 60% in the reference year 2014. Especially the transport sector, and some of the individually-heated buildings, still require fossil fuels. When it comes to electricity needed on Samsø, 94% is produced by wind and PV and the remaining 6% is imported.
Samsø is the smallest of the three case study islands, with the highest RE share and the comparably lowest CO2 emissions (28.5 kt). The biomass heating share is 69% in the reference system with 35% of the heat supplied through district heating, but still 18% from oil boilers. The electric and solar heating shares are at 11% and 2%, respectively, and the electric transport share at 1%—hence having room for improvement, especially with 78% of the local RE electricity being exported.
3.1.2. Transition of Samsø
In SMILE, Samsø therefore addresses the possibility of employing more local electricity on the island. For this, some further PV capacity is installed, but also unused existing capacity can be better integrated with smart controls and a BESS. This is tested in the scope of Ballen Marina, which is used by both locals and tourists, hence an integrated part of the energy system. Here, PV power is planned to be smartly used and stored to decrease the dependency on imports, which in combination with heat pumps further contributes to this local test scope. If successful, this idea could be replicated in the other marinas on Samsø and elsewhere [46].
The impact of the Ballen demonstration can be integrated in the EnergyPLAN reference model by adapting the total remaining electricity demand and by adding the excess PV production as supply available for other uses. The expected outcome is a reduction of imports by shaving the marina’s peaks, increasing the usage of fluctuating renewable electricity locally, and thereby decreasing the island’s dependency on others. Looking further ahead, the improved utilization of local RE becomes important when more electric heating and EVs are introduced.
The smart controlling of heat production via heat pumps further opens up the possibility to reduce the use of biomass boilers. While biomass heating is renewable, it is not an optimal use of a storage fuel, and the biomass could alternatively enable the production of biofuel for other uses—e.g., for running one of the ferries such as the natural gas-run Prinsesse Isabella. The overall goal of Samsø is therefore the reduction of imports by using more otherwise exported electricity, reducing further biomass consumption in the heating sector and freeing it for the transport sector. Thereby, Samsø is currently in transition phase two, with an already large RE share and aiming for 100% RE.
Further steps besides the SMILE ideas for the further transition to 100% RE include local biogas production and electricity for transport, improving the district heating plants, as well as an increase in RE capacity. By 2030, a biogas plant is to be realized, contributing to reducing the fossil fuel demand of the ferries and potentially also to the road transport. In addition, the road transport is considered to be further electrified, with focus on passenger vehicles, as recommended by Mathiesen et al. [2] and Connolly et al. [47]. With the implementation of EVs, some of the excess electricity is utilized, while it also increases the island’s electricity demand. Overall, the higher efficiency of electric compared to internal combustion vehicles decreases the total energy demand [48].
District heating plants are considered retrofitted with heat pumps due to the availability of excess electricity and the scarcity of biomass resources. By keeping the existing boilers for peaks, heat pump support, and backup, the heat pumps can be operated to run entirely on excess electricity from RE. This is furthermore supported by additional TES next to the existing ones. Depending on the available excess RE electricity on Samsø, the amount of heat produced from heat pumps depends on the increase of electricity consumption in the other sectors. Hence, if the number of EVs increases, the heat pump production might be reduced to avoid increasing electricity imports.
Furthermore, additional wind and PV capacity under the condition of limiting the critical excess electricity production is evaluated. Large RE capacities of one technology can result in large amounts of excess electricity in certain (e.g., windy) hours, so an increase of PV capacity with a total of 10 MW is suggested. Electricity from PV is shown to be better integrable in the energy system and potentially easier realized regarding space demand and potential opposition in the population [49].
To reduce the remaining fossil fuel use, heat pumps should replace the individual oil boilers, after which any remaining fossil fuel consumption is found in the transport sector. One option to lower this and to integrate the still high RE export further is through electrolyzers and hydrogen production as fuel replacement. In total, with the short-term steps in the transition of Samsø, the RE share reaches 85% and the CO2 emissions are below 10 kt per year compared to the reference model with 59.5% and 28.5 kt.
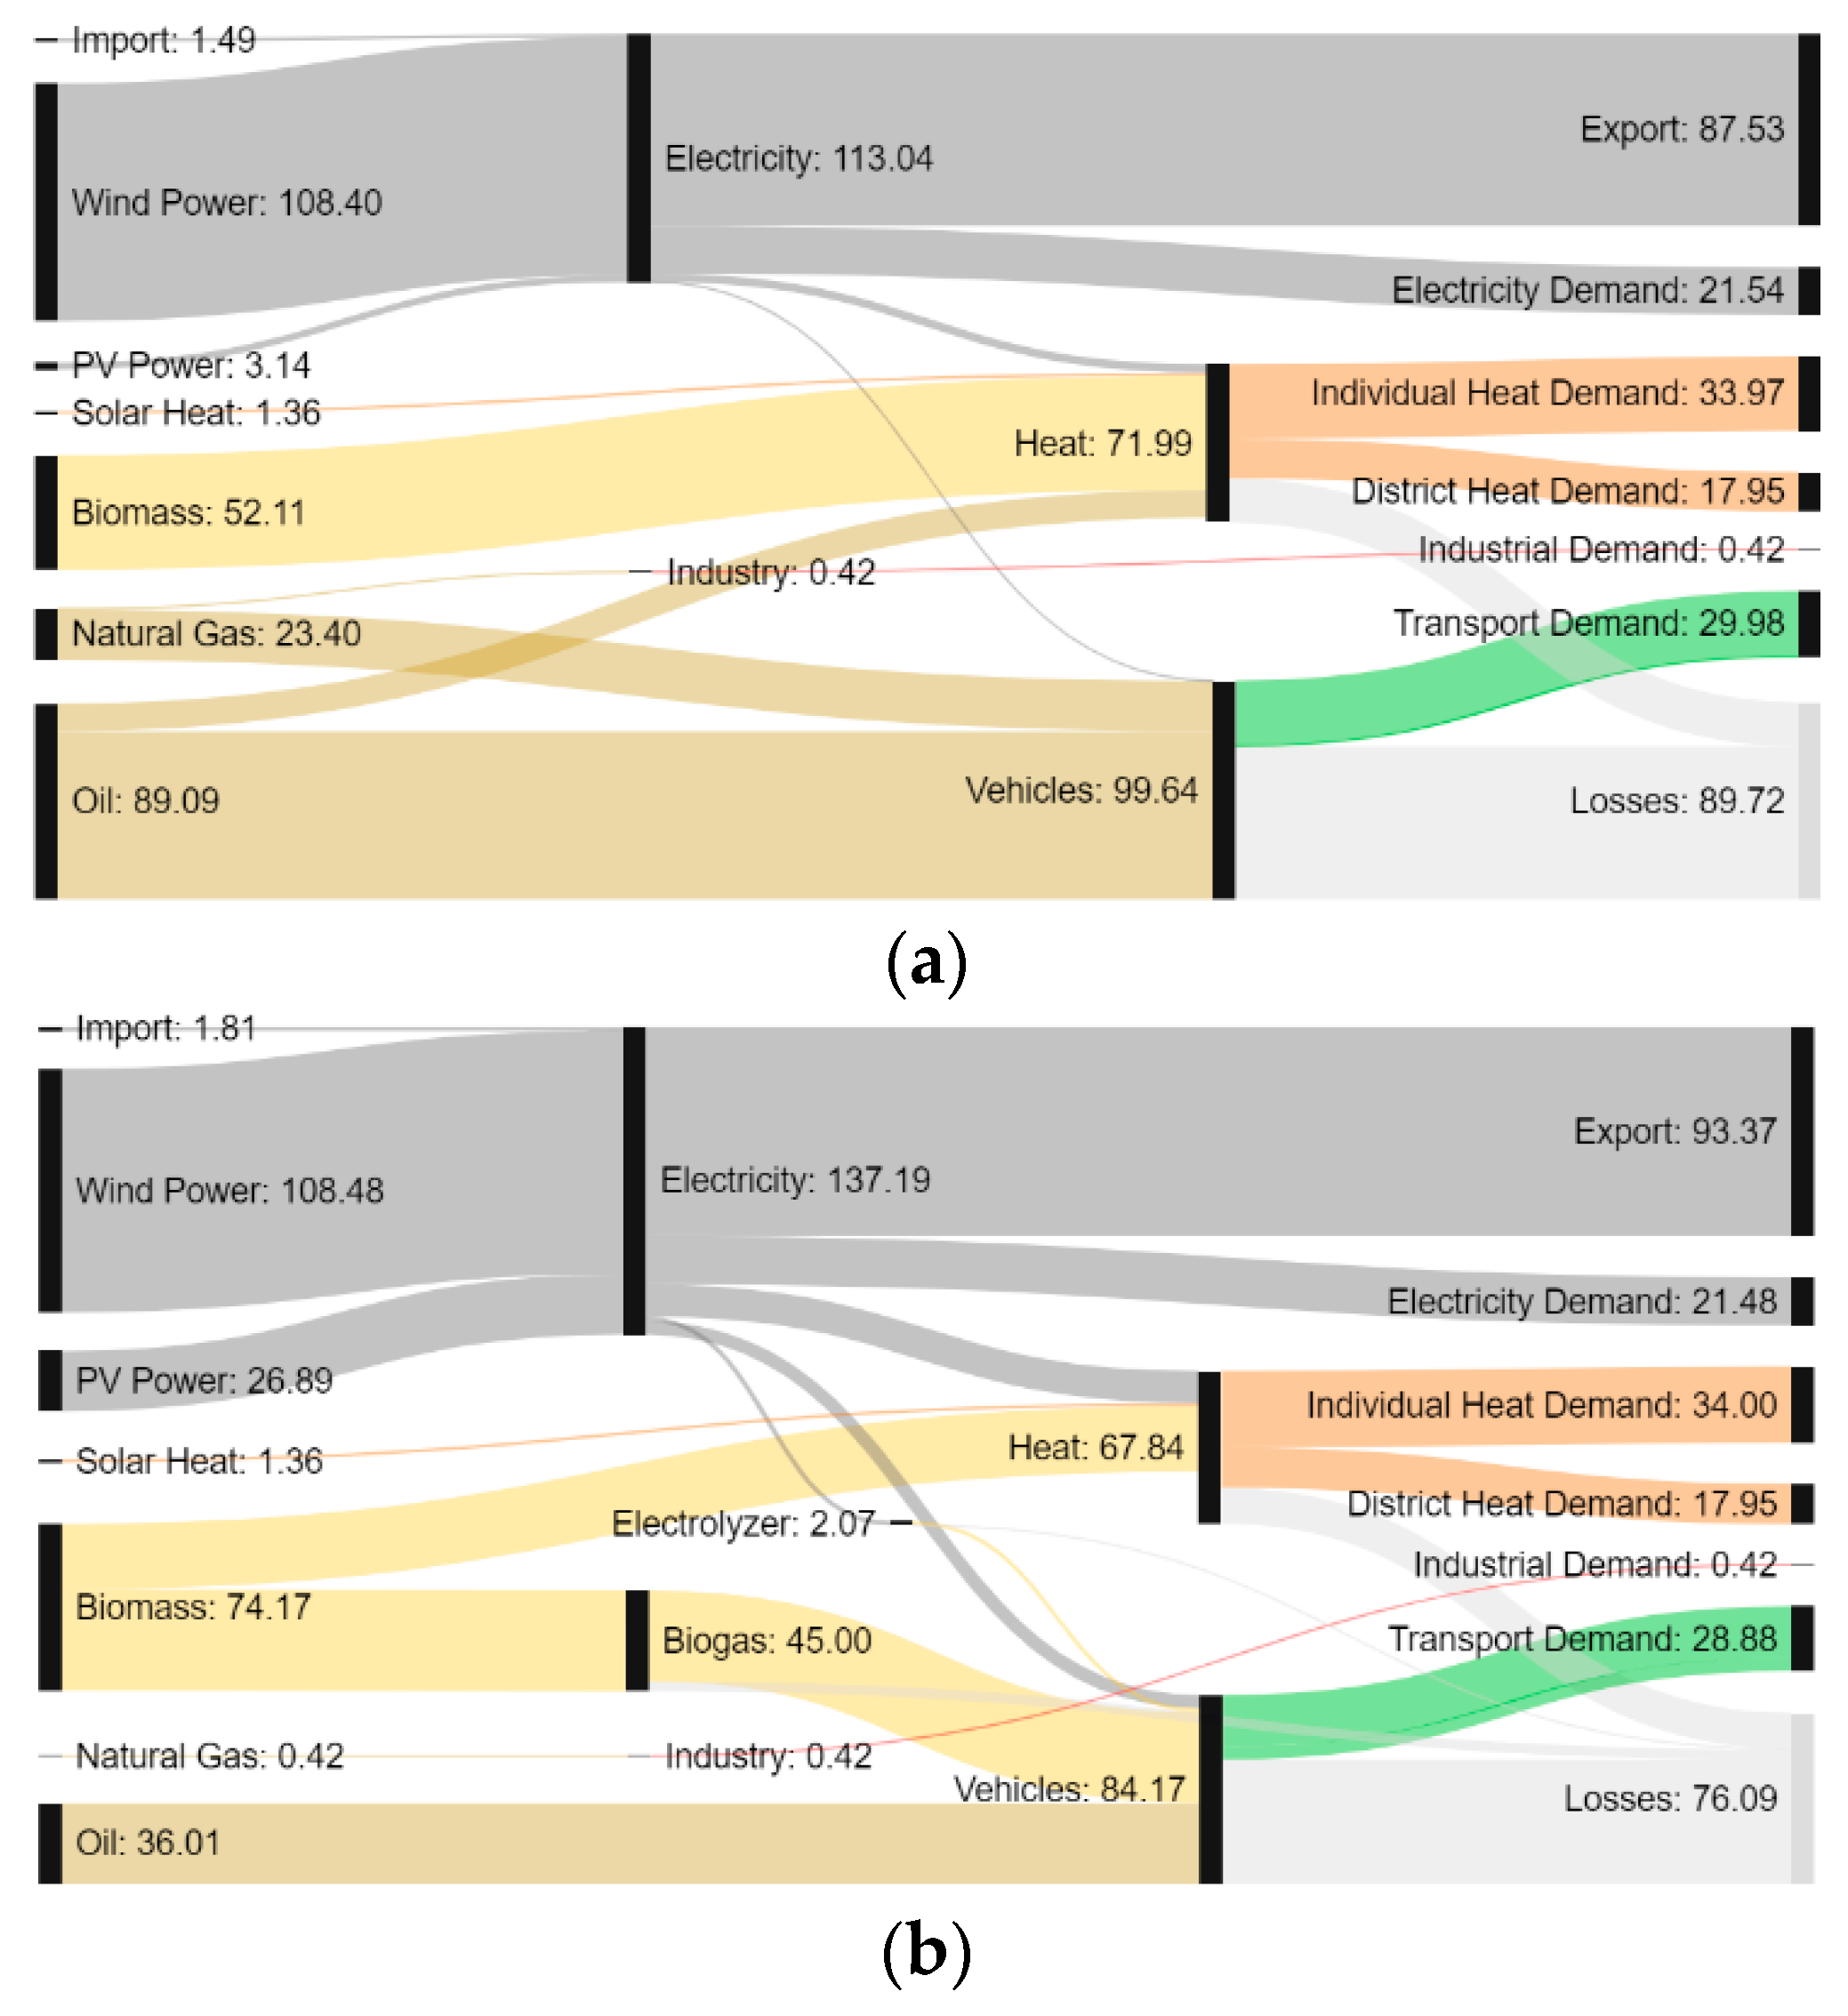
3.1.3. Samsø’s Future
The concluding Figure 1 presents data for demand and supply before and after the transition steps (see tables in Section 4). Most notably, the connections between sectors increase as sector integration and balance options are pointed out as important parts of the transition. However, a small share of the now increased electricity demand needs to be imported due to the inflexibility of the modeled demand. Despite an overall electricity demand increase of 64%, the RE share of the electricity consumption is increased by 2% point to 96% from the 2015 to the 2030 model (cf., Table 6).
To replace the remaining fossil fuels, alternative fuels are needed, which can also further reduce system losses. An extension of the biogas plant or a replacement of remaining fuels with electro- or biofuels could be considered. Next to the further increase of the RE capacity, more efficient heating and transport options are still required for a full transition to a 100% RE island. Additionally, smart controlling and management of various demands could support the transition, so further exploration and integration of solutions such as those presented in SMILE is recommended.
3.2. Orkney, United Kingdom
The 70 islands in the Orkney archipelago, out of which 20 are inhabited, lie to the north of the Scottish mainland. The Orkney Isles are characterized by a mild climate with open waters on three sides, which offers good opportunities for wind and ocean energy exploitation. Within the United Kingdom and over the last 30 years, Orkney has been a frontrunner in the development of RE technologies [50]. With an Energy Audit made for 2014, this is chosen as the reference year.
3.2.1. Orkney Today
Orkney represents the medium size case study island, with around 22,000 inhabitants, and lies between Samsø and Madeira in terms of RE share and CO2 emissions (186 kt). Wind and some PV power supply the majority of the islands’ electricity demand in the reference year: Only 7% of the demand is imported and 27% is supplied by the local power plant. A large part of the heat is still relying on oil, as is the industry and transport sector, despite the relatively high amount of EVs compared to other regions in the UK or Europe; its share is estimated at only around 0.1% of the total transportation demand (0.2% of the road transport).
Utility-scale turbines and around 500 domestic-scale turbines [51] almost reach the annual electricity demand of Orkney in the reference year, but due to the fluctuation of its production, other electricity needs to be provided [52]. Next to the fluctuation, intra-island grid bottlenecks are a problem, causing high degrees of curtailment and a limit of firm connections from turbines to the grid. For the remaining electricity demand [53], a small share of PV systems and two subsea cables supply some of the additionally required electricity [50,52]. Since the wave and tidal power facilities are still considered test facilities and not in commercial operation, they are not considered in the reference system.
Additionally, fuels are used for electricity production through a local thermal power plant. The total amount of fuel for electricity production results from the EnergyPLAN model, which simulates the production of electricity from fossil fuels when not enough wind and PV power is produced. Therefore, the amount of gas to supply the energy system of Orkney is made up of a large share for power production, as well as gas-fueled heating systems [54,55]. Solar radiation is also used to produce heat through around 20 solar thermal collectors [56,57].
While the electricity sector is mainly supplied by locally produced electricity, the heating sector still relies a lot on fossil fuels, even though Orkney has an electric heating share above the average [54,58]. Together with the fuels needed in the transport and industrial sector, this results in the overall RE share of 18%. All data of the reference as well as the future model are presented in Section 4.
3.2.2. Transition of Orkney
In the reference model of Orkney, the CO2 emissions are at a similar amount per capita as on Samsø. The biomass share, however, is much smaller, with 1% of the modeled heat sector for 2014, while the electric heating share is at 44%, resulting in a high share of fuel poverty in the area [58]. With a current export share of 32% of the local RE production and no district heating grid, there is room for improvement.
To address the option of more efficient heating, in combination with otherwise curtailed or exported electricity, the SMILE demonstration project on Orkney focuses on new domestic electric heaters with storage, as well as on including electric transport through more EV charging stations. Both options include smart planning and operation, meaning taking into account the temporality of excess RE production and the potential demands.
By integrating RE in a smarter way, the local energy can be used locally and benefit both the heating and the transport sector. Furthermore, it can reduce imports and production at the power plant if demands can be shifted to hours of excess production. This reduces the islands’ fuel use and CO2 emissions, as well as reduced electricity exchange and curtailment. An increase in self-sufficiency is the overall goal and is presented in the following through a technical approach, including the SMILE demonstration.
The resulting impact on CO2 emissions can be connected to the reduction in heating oils, while the heat pumps increase the total electricity demand, causing a reduction in exported electricity. Adding more EVs, even though smart-charged, adds to this reduction of export and CO2 because of the shift from transport oils to electricity. Furthermore, an increase of import happens due to inevitable temporal mismatches between RE production and charging.
Besides the SMILE approaches of heat and transport sector, some other changes that are taking place on Orkney need to be incorporated and matched with the transition to achieve higher RE shares. One such change is the addition of marine energy exploitation, including wave and tidal power, as well as hydrogen and electrolyzers, which have shown promising test results for future exploration [50,59,60]. Not all included technologies have an appropriate technology readiness level today, but there is an ongoing technology development in the field. Thus, for future scenarios, particularly in islands setting, the technologies must be considered.
Additionally, with a focus on banning the sale of diesel and petrol cars by 2032 in Scotland [61], Orkney is on the way to increasing the use of EVs to a suggested maximum around the year 2030 [2,47]. Therefore, 80% of the road transport (all passenger vehicles) is modeled to be reliant on EVs with V2G balancing the electricity import and export to the highest extent possible. This is modeled by allowing the EVs to supply the grid via a standard 10 kW capacity per car of battery to grid connection [48].
As part of the further transition and to improve the heating sector of the island, district heating is proposed to be implemented in the largest town on Orkney, namely Kirkwall, as previous studies [62,63] suggest large heat densities there. With the selection of this central heat demand, 33% of the current heat demand on Orkney could be covered with district heating. Due to the still large amounts of excess electricity, a heat pump is to supply this district heating grid, as well as a biomass boiler as a supplement and back-up to avoid increased electricity imports. In addition, the individual heating sector is to develop further towards renewable heat: The remaining boilers are to change to biomass or heat pumps. While this, on the one hand, increases the RE share beyond 30%, it also increases both electricity demand and biomass consumption.
3.2.3. Orkney’s Future
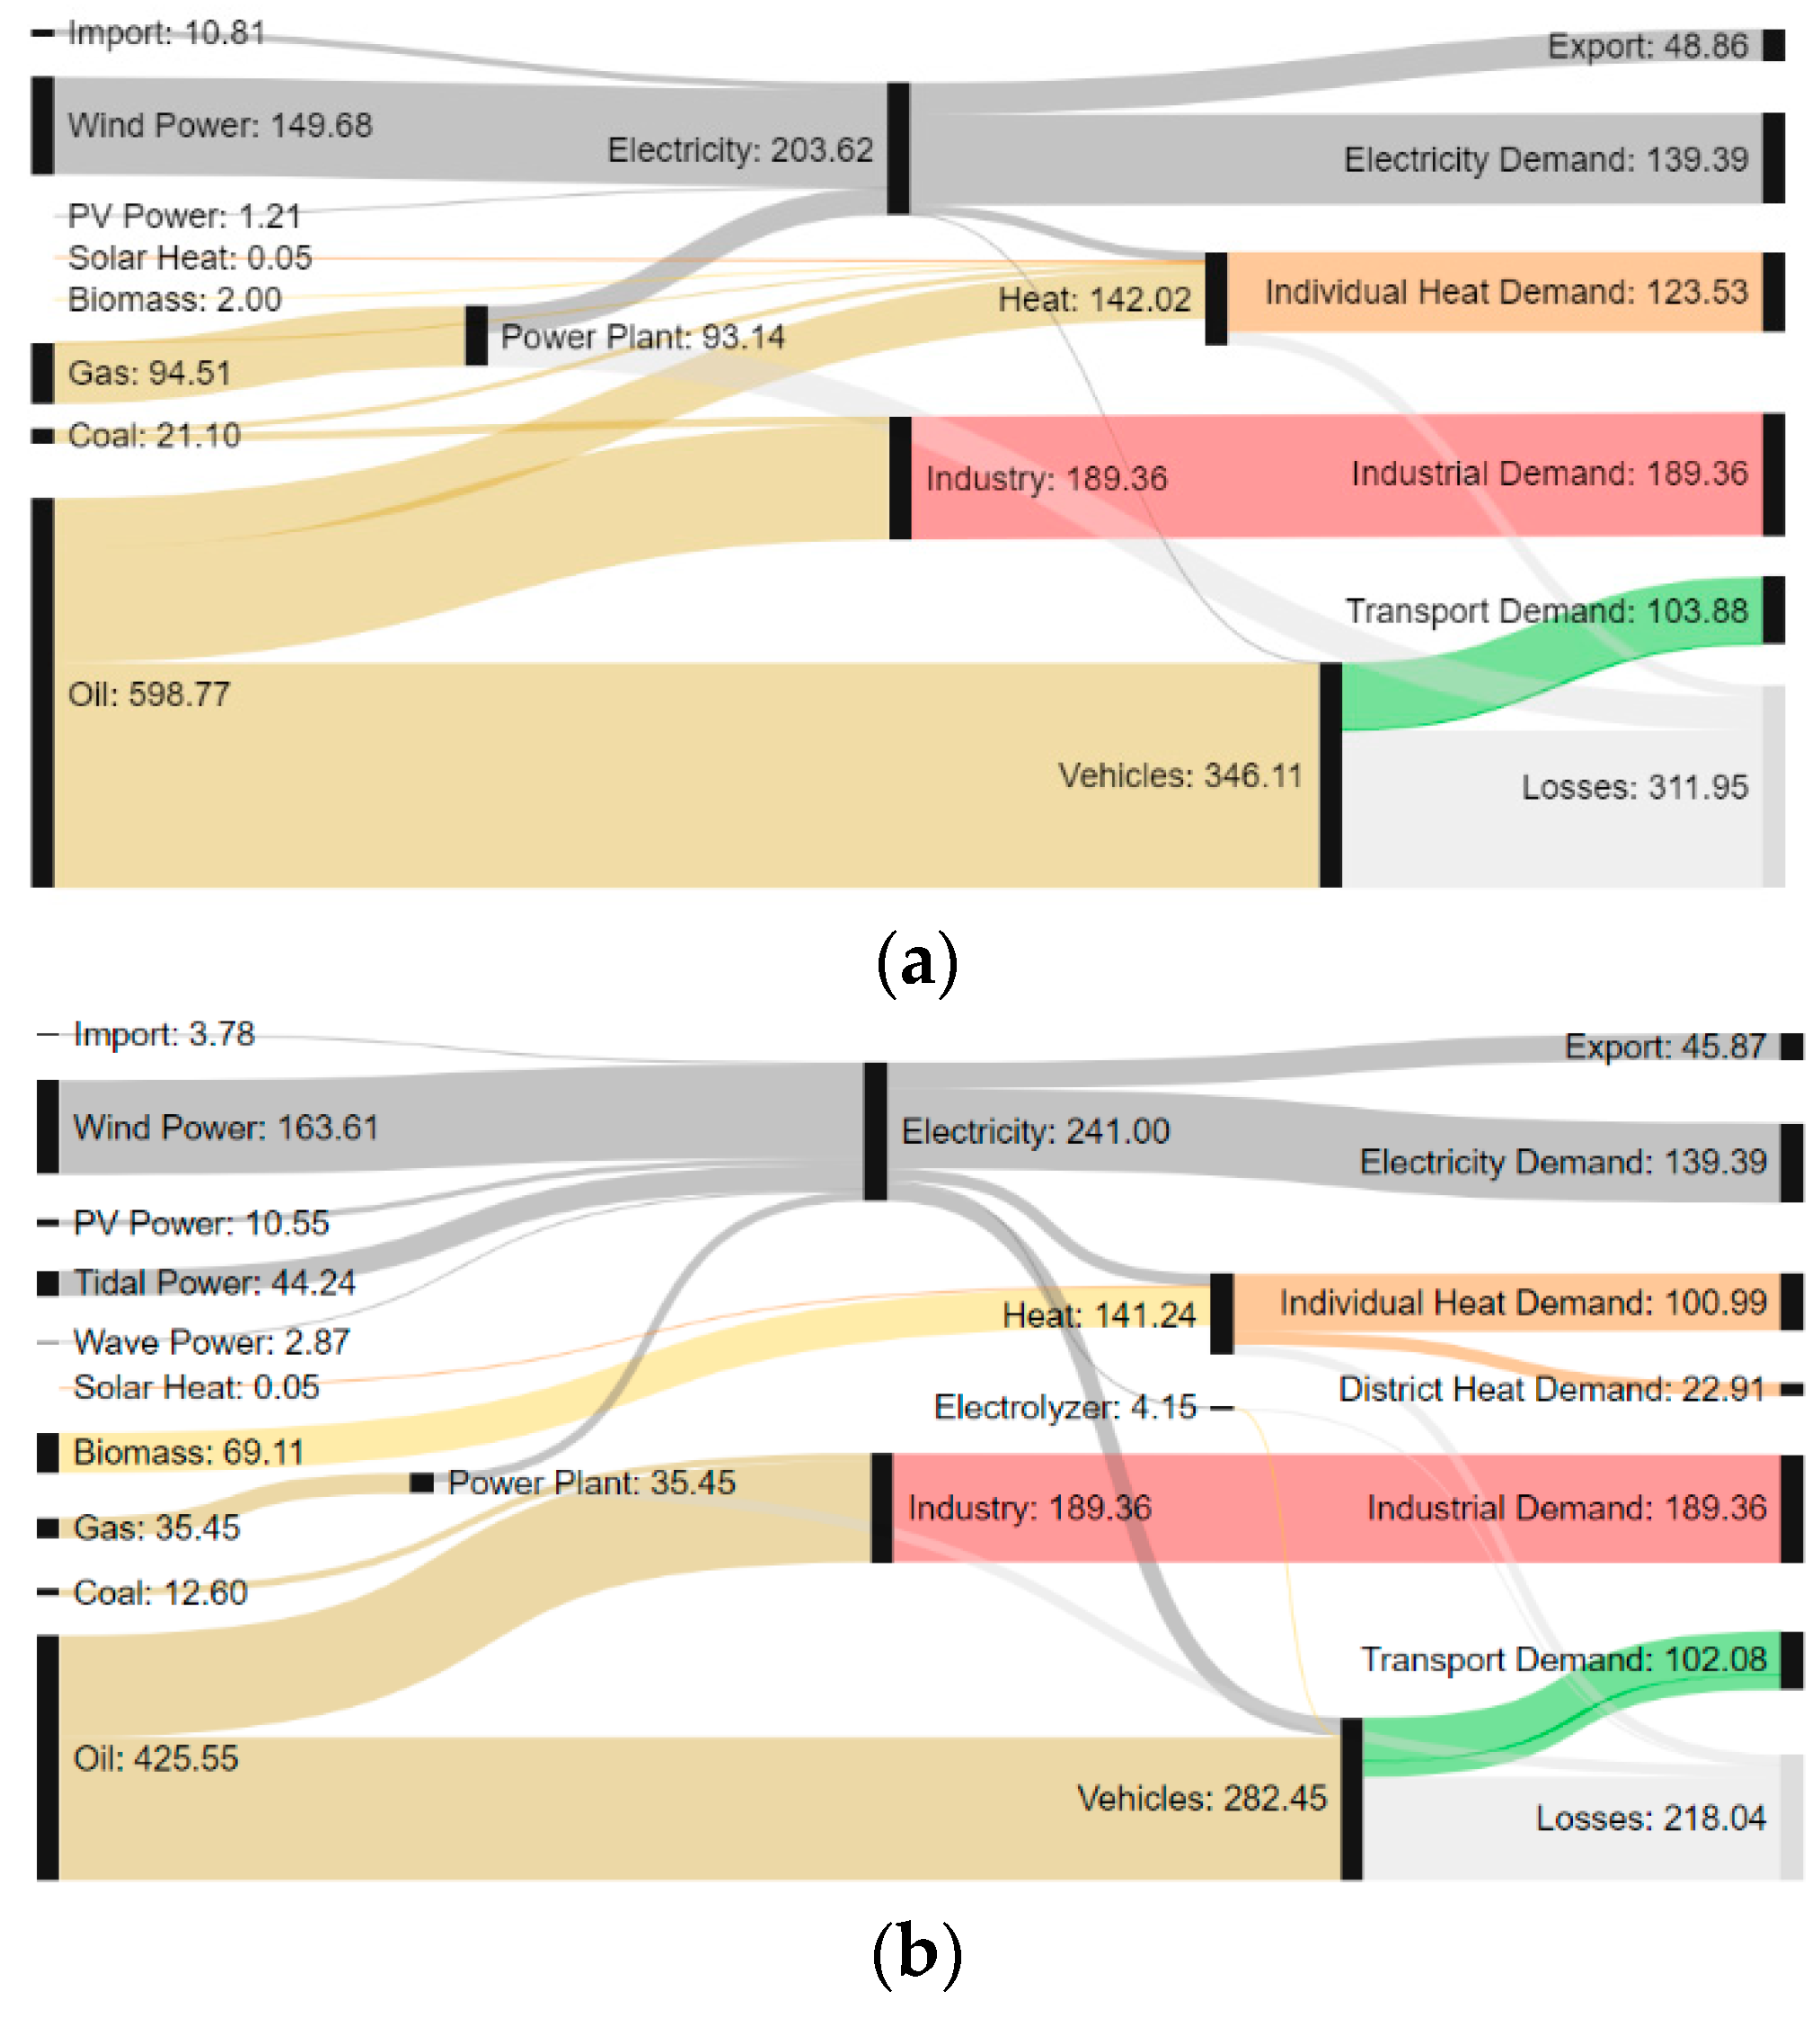
All the suggested transition steps, together, result in an RE share of 38% (cf., before 18%) for the PES of Orkney next to a 33% reduction in CO2 emission, while the other key parameters can be found in Section 4. Figure 2 shows all input and output specifications of the reference and transition scenario for Orkney. This illustrates that one of the focus areas in the transition, namely fossil fuel consumption, is changing the most. Instead of using these, electricity replaces some of the corresponding demands, while biomass supplies others.
To address the remaining fossil fuels in transport, a replacement with electro- or biofuels could be considered, similar to Samsø, with either local biogas production or additional hydrogen. However, if electricity-based fuels are considered, the amount of excess electricity can be taken into account, which still makes up a large share. Alternatively, additional RE capacity might be required to allow these further electrification measures.
As further illustrated in Figure 2, the industrial demands have not been addressed with these improvements of heating and transport sector. Due to insufficient data and the unusually complex conditions in the industrial sector, an optimization of it requires an in-depth study. Another recommendation is therefore the investigation of this sector, besides the transport sector, which still relies largely on fossil fuels. The second Sankey diagram in Figure 2 presents Orkney in the second RE integration phase, after which further balancing and interconnections are needed to approach the next phase towards the 100% RE target.
3.3. Madeira, Portugal
Madeira lies isolated both from the lands and from the electricity grids of Europe and Africa. In comparison to Samsø and Orkney, it therefore presents the only true island system, supplying itself almost independently and even incinerating its produced waste to the best extent possible. Further differentiating it from most other European areas, Madeira has the typical characteristics of a southern climate, with high solar radiation and cooling demands rather than a heating demand. For the reference model, 2014 is selected to represent a normal weather year, especially in regards to precipitation and the impact on hydropower.
3.3.1. Madeira Today
With a population of around 250,000, Madeira represents the largest population and island of the three. However, the production of RE and some of the energy demands are not necessarily as big as to be expected in comparison to Samsø and Orkney. The demands are, to a large extent, covered by fossil fuels, but also a variety of RE [64,65,66].
Thermal power plants are still used for grid stabilization, run mostly on fuel oil or gas, and produce most of the electricity needed on Madeira [65]. Hydropower plants form the second largest production group with dammed and river hydro plants with small reservoirs suitable for hourly flexibility [65]. The wind farms have a total capacity similar to the reference models of Samsø and Orkney, but a much larger PV capacity relating to the comparably higher potential. This, however, is limited due to difficulties with the grid frequency. Finally, the annual waste of more than 100,000 t produces electricity through incineration [66].
Next to the RE for electricity production, solar radiation is further used for heat production. Other heating fuels are electricity, biomass, gas, and a minor share of oils—50% of the oil is otherwise needed in the transport sector [67]. In total, the reference model shows that 11% of the PES is based on RE, including waste incineration. The electricity production, however, is made up by 29% RE, despite limits in the RE exploitation.
3.3.2. Transition of Madeira
Without an interconnection, Madeira is the only SMILE island with an autonomous electricity grid. Therefore, the dependency on fuel imports and need for better utilization of local resources are even greater than for most other islands. With a current RE share of 11% and CO2 emissions of 895 kt, Madeira presents a contrast to the other islands with a much lower CO2 per capita, but a similar transition process towards 100% RE system is required nonetheless.
The Madeira reference energy system has 115 MW RE capacity, which is far from sufficient for the comparably large electricity demands, resulting in major fossil power production. However, there are limits to an RE expansion due to grid and stabilization issues. The transition of Madeira towards higher RE shares therefore looks a bit different from Samsø and Orkney, with the RE introduction phase reached and large steps required to reach the second phase.
The existing circumstances are considered in the definition of the SMILE demonstration projects for Madeira, as well as the further transition steps. SMILE addresses the existing PV installations and the sensitive grid with BESS for both residential and commercial buildings, as well as the optimization of the transport sector through touristic and private EVs. This is tested in a comparable small scale considering the size of the island, but is further explored as can be projected by 2030. The overall target on Madeira lies in the optimization of local resources and the reduction of fossil fuels in the power production and transport sector through smart grid solutions [18]. For this, power plant stabilization is reduced and the new SMILE technologies added to the EnergyPLAN model.
Next in line in the transition is the incorporation of the plans for additional PV, hydro, and wind capacity [68]. Thereafter, the transport sector is addressed closer: After the introduction of EV for commercial, touristic, and private purposes, with the addition of smart chargers, a further exploration is expected. Similar to Orkney, an exponential increase of EV by the year 2030 is modeled with the inclusion of a V2G option, reducing the production at the power plant by enabling EVs to be used as temporary electrical storages. The same approach as on Orkney is assumed and modeled [48].
Eventually, also the heating sector must be addressed to reach higher RE shares. A first logical step is the replacement of oil and natural gas for heating with heat pumps. In the same step, more solar thermal is explored, while reducing the electricity requirement to hours with insufficient solar resources.
3.3.3. Madeira’s Future
The result of the additional capacities, as well as of the other assumed improvements by 2030, is an RE share of the PES of 31%, while the share for the electricity demand is at 71%. Additional RE capacity would increase both even further, but would at the same time result in critical excess electricity production, so the benefits would be limited. Therefore, a more balanced approach towards the 100% RE share is required in the longer term, especially for an autonomous energy system like Madeira.
Figure 3 shows the resulting energy flows of the reference and transition scenario, while the detailed data are found in Section 4. The major change that can be noted is the reduction in fossil fuels, mainly oil from 2014 to 2030. Instead, electricity is produced more from RE, but further optimization should be found for the remaining oil and gas consumption. Generally, the transition could be more successful with the RE integration on all levels and in combination with balancing and storing technologies.
As it could be tested for Samsø and expanded on Orkney, hydrogen production through electrolyzer could become relevant for the replacement of fossil fuels in the transport sector. Alternatively, biogas production could be pursued. For the second technology, the local biomass potential—both dry and wet—should be evaluated before it can be included in the model.
The final point of discussion relates to the heating sector transition, since—also here—changes are required for the overall development of the Madeira energy system towards 100% RE. The uncertain heating demands currently covered by electricity can provide relevant information for possible improvements. If inefficient boilers and heaters are used, a replacement with efficient heat pumps or even the establishment of district heating could improve the energy system. Besides the uncertainties in the heating sector, the cooling supply could be evaluated and improved. With the possibility of district cooling, the service sector of Madeira could achieve benefits through more suitable supply technologies, ultimately benefitting large-scale RE integration.
4. Overview and Discussion
This section presents an overview of the different scenarios and resulting island energy systems’ characteristics after implementation of various smart grid and balancing technologies in the transition towards 100% RE. It shows the short-term changes with their potentials and challenges on three cases and suggests options for other islands. Even though the three islands are of different sizes and populations, some similarities in regard to their energy systems can be identified. By presenting the different RE capacities and their impacts, possible gaps or potentials in the plans and models of other islands can be found and help shape the future creation of sustainable island energy systems.
The energy demands are presented by sectors with the reference and short-term scenarios in Table 3. Here, the main changes are due to more electricity being used in the heating or the transport sector, while the total demands generally stay the same.
The different approaches for the islands in regard of added RE capacity and resulting RE production are shown in Table 4. Despite the plans of decommissioning the power plants on Madeira, as well as reducing the dependence on the power plant on Orkney, the energy system analyses show some still required power production from these.
Since the fossil fuel reduction was paid special attention to in order to increase the RE share in the energy systems, they are included in Table 5. It shows that the fossil fuel consumption on Samsø is reduced by 68% between 2015 and 2030 with the presented scenarios. Similarly, on Orkney, this number is reduced by 34% and on Madeira by 40%.
In Table 6, the comparison of the RE share generally shows great improvements, with increases of 20% points and more. However, for Orkney and Madeira, it is still a long way to the large-scale and 100% RE share targeted, despite the ambitious scenarios to improve the energy systems presented in this report. This can partly be explained by the more balanced approached taken in the scenario creation, rather than a simple increase in RE capacities. The latter would increase the RE share, but also the export and potential curtailment/critical excess production. Instead, more moderate capacity additions are introduced, together with balancing options, such as smart charging and storage options, presenting one approach for the smooth transition to 100% RE.
Further indicators included in Table 6 are electricity import and export/excess production to show the share of local energy consumption and self-sufficiency. Samsø’s share of RE electricity is close to 100% and, despite the suggested RE capacity increase, the share of the local electricity that is exported is reduced, as more can be used on Samsø now. The same applies to Orkney, which furthermore reduces the import share from 7 to 2% of the electricity demand. Finally, with different framework conditions on Madeira without import/export option, it is possible to keep the critical excess production at 0.02%. This shows the strength of including the full energy system in the transition, instead of focusing on the electricity sector only. While RE capacity could be further increased, improving the RE share in the electricity sector, it would lead to increased excess production, if not integrating the energy sectors. A step-by-step transition approach is therefore proven and recommended, despite being more complex and requiring a more integrated energy system.
Similarly, the CO2 emissions are reduced with the increase of RE and decrease of fossil fuel combustion. On Samsø, the reduction is 66%, 33% on Orkney, and 40% on Madeira. The final CO2 emissions are equal to annually 2.6, 5.7, and 2.2 t per capita for Samsø, Orkney, and Madeira, respectively. The high amount for Orkney might relate to the big industrial sector and limited biomass potential.
Finally, the last row of Table 6 shows the tendencies for annual total socio-economic system costs with current data on technologies, fuels, operation, and CO2 costs. For each of the islands, the annual costs are similar or even decreased in the short term—compared to the references—by −5, +3, and +7%. Considering the large investments in new technologies and infrastructure, these values are acceptable and come with possible long-term benefits. While fuel and CO2 costs drastically decrease, the annual investments increase by 34, 61, and 120%, respectively, showing how the money is being spent on local infrastructure instead of imported goods now.
The three islands are all presenting cases of reduced or stabilized electricity import and export, with strongly improved CO2 values at acceptable socio-economic costs, in the transition to 100% RE systems. Taking into consideration the different phases of the transition, as well as the sensitive and specific circumstances for each island, an increase in RE share can be achieved.
5. Conclusions
Investigating the transition towards 100% RE supply for islands, this paper presents transition scenarios for Samsø, Orkney, and Madeira with their potentials and challenges. Built upon reference energy systems of 2014/2015, scenarios are created incorporating smart grid demonstration projects, as well as further possibilities in the energy system, to present energy system scenarios of 2030. Local conditions influence the possibilities, as do local plans and strategies. These are incorporated into suggested steps for a transition to higher RE shares as a three-phase approach, of which Samsø is the farthest ahead, while Orkney and Madeira are in the second phase from low towards high RE share. The resulting short-term scenarios of 2030 generally show that local conditions and opportunities vary, which leads to the conclusion that every transition, island, and energy system is unique and must be evaluated separately, while some similarities exist.
This article presents Samsø’s energy system moving from the reference system, with already large-scale RE integration, towards a system with 100%, resulting in the incorporation of technologies focusing at balancing the energy system instead of further increasing RE capacity. As part of this transition, the local abundance of wind energy and biomass, as well as transmission capabilities, influence the technical choices leading to the next phase. While some technologies are specific for Samsø, they can generally be replicated and thereby improve island energy systems in various ways.
Orkney’s reference energy system is characterized in the RE introduction phase, hence the increase of this to large-scale RE integration is currently in focus, instead of balancing the energy production and demands. With local limits in their transmission grid, but otherwise good RE conditions, the smart grid solutions and integration technologies are chosen accordingly. As this paper shows, more potential RE capacity would still be required, as well as the further exploration of sector integration, to support fragile energy systems such as this.
Madeira is in the process of introducing more RE to their energy system and aiming at an increase of its share, hence being in the beginning of the RE integration phase. Therefore, Madeira’s short-term development focuses on the expansion of various RE capacities, as well as the potentials in the transport and heating sector. Without a transmission line, the autonomous energy island already requires balancing options through sector integration and making use of local hydropower production and storage. The combination with smart grid applications plays another major part in autonomous energy systems, such as Madeira.
This case study demonstrates possible transitions to 100% RE systems, which is taking place all over the world. With new problems coming into view with an increased RE share, new solutions are presented and tested for three islands. With islands being potential representatives of bigger energy systems, the results can be transferred to other systems as well. However, individual variations are also to be expected, as is shown from the demonstration islands in this report depending on their current development phase. While an interconnection can ease the transition, balancing and integrating technologies are even more important, as well as the local conditions. Further smart grid technology employment could support this further. This case study shows a variety of energy systems and solutions and therefore gives examples of the required transition of islands towards 100% RE share. The general tendency points to smart and balanced planning of the next steps to ensure this.
Author Contributions
Conceptualization and validation, H.M.M., P.A.Ø., and S.R.D.; methodology and software, H.M.M. and P.A.Ø.; formal analysis, investigation, data curation, visualization, and writing—original draft preparation, H.M.M.; writing—review and editing, H.M.M., P.A.Ø., and S.R.D.; supervision, P.A.Ø. and S.R.D.; project administration and funding acquisition, P.A.Ø.
Funding
This research was funded by the Horizon2020 research programme under the grant agreement no. 731249.
Acknowledgments
This work is supported by the SMILE partners on Samsø, Orkney, and Madeira for helping in the data gathering and optimization process of the full reports that this paper is based on [31,32] and which are available on www.h2020smile.eu.
Conflicts of Interest
The authors declare no conflicts of interest.
References
- European Commission. 2030 Climate & Energy Framework. Climate Action. 2014. Available online: https://ec.europa.eu/clima/policies/strategies/2030_en (accessed on 2 April 2019).
- Mathiesen, B.V.; Lund, H.; Connolly, D.; Wenzel, H.; Østergaard, P.A.; Möller, B.; Nielsen, S.; Ridjan, I.; Karnøe, P.; Sperling, K.; et al. Smart Energy Systems for coherent 100% renewable energy and transport solutions. Appl. Energy 2015, 145, 139–154. [Google Scholar] [CrossRef]
- Connolly, D.; Lund, H.; Mathiesen, B.V. Smart Energy Europe: The technical and economic impact of one potential 100% renewable energy scenario for the European Union. Renew. Sustain. Energy Rev. 2016, 60, 1634–1653. [Google Scholar] [CrossRef]
- European Commission. Clean Energy for EU Islands Launch. European Commission Energy News. 2017. Available online: https://ec.europa.eu/energy/en/news/clean-energy-eu-islands-launched-malta (accessed on 20 April 2019).
- Kuang, Y.; Zhang, Y.; Zhou, B.; Li, C.; Cao, Y.; Li, L.; Zeng, L. A review of renewable energy utilization in islands. Renew. Sustain. Energy Rev. 2016, 59, 504–513. [Google Scholar] [CrossRef]
- Praene, J.P.; David, M.; Sinama, F.; Morau, D.; Marc, O. Renewable energy: Progressing towards a net zero energy island, the case of Reunion Island. Renew. Sustain. Energy Rev. 2012, 16, 426–442. [Google Scholar] [CrossRef]
- Weir, T. Renewable energy in the Pacific Islands: Its role and status. Renew. Sustain. Energy Rev. 2018, 94, 762–771. [Google Scholar] [CrossRef]
- Thushara, D.S.M.; Hornberger, G.M.; Baroud, H. Decision analysis to support the choice of a future power generation pathway for Sri Lanka. Appl. Energy 2019, 240, 680–697. [Google Scholar] [CrossRef]
- Ioannidis, A.; Chalvatzis, K.J.; Li, X.; Notton, G.; Stephanides, P. The case for islands’ energy vulnerability: Electricity supply diversity in 44 global islands. Renew. Energy 2019, 143, 440–452. [Google Scholar] [CrossRef]
- Meschede, H.; Hesselbach, J.; Child, M.; Breyer, C. On the impact of probabilistic weather data on the economically optimal design of renewable energy systems—A case study on La Gomera island. In Proceedings of the 13th International Renewable Energy Storage Conference (IRES 2019), 12–14 March 2019 , Messe Düsseldorf, Germany. [CrossRef]
- Dorotić, H.; Doračić, B.; Dobravec, V.; Pukšec, T.; Krajačić, G.; Duić, N. Integration of transport and energy sectors in island communities with 100% intermittent renewable energy sources. Renew. Sustain. Energy Rev. 2019, 99, 109–124. [Google Scholar] [CrossRef]
- Meschede, H.; Esparcia, E.A., Jr.; Holzapfel, P.; Bertheau, P.; Ang, R.C.; Blanco, A.C.; Ocon, J.D. On the transferability of smart energy systems on off-grid islands using cluster analysis–A case study for the Philippine archipelago. Appl. Energy 2019, 251, 113290. [Google Scholar] [CrossRef]
- Pramangioulis, D.; Atsonios, K.; Nikolopoulos, N.; Rakopoulos, D.; Grammelis, P.; Kakaras, E. A Methodology for Determination and Definition of Key Performance Indicators for Smart Grids Development in Island Energy Systems. Energies 2019, 12, 242. [Google Scholar] [CrossRef]
- Colmenar-Santos, A.; Monzón-Alejandro, O.; Borge-Diez, D.; Castro-Gil, M. The impact of different grid regulatory scenarios on the development of renewable energy on islands: A comparative study and improvement proposals. Renew. Energy 2013, 60, 302–312. [Google Scholar] [CrossRef]
- Rina Consulting S.p.A. SMart IsLand Energy Systems Project. 2017. Available online: http://www.h2020smile.eu/ (accessed on 20 September 2017).
- Hermansen, S.; Johnsen, A.; Nielsen, S.P.; Jantzen, J.; Lundén, M.; Jørgensen, P.J. Samsø—A renewable energy island—10 years of Development and Evaluation, 2nd ed.; Chronografisk: Ballen, Denmark, 2007. [Google Scholar]
- Community Energy Scotland. Smart Island Energy Systems Deliverable D2.1; Community Energy Scotland: Kirkwall, Scotland, 2017. [Google Scholar]
- ACIF-CCIM. Smart Island Energy Systems Deliverable D4.1; ACIF-CCIM: Funchal, Portugal, 2017. [Google Scholar]
- Aalborg University. EnergyPLAN—Department of Development and Planning; Aalborg University: Aalborg, Denmark, 2017. [Google Scholar]
- Østergaard, P.A. Reviewing optimisation criteria for energy systems analyses of renewable energy integration. Energy 2009, 34, 1236–1245. [Google Scholar] [CrossRef]
- Sorknæs, P.; Djørup, S.R.; Lund, H.; Thellufsen, J.Z. Quantifying the influence of wind power and photovoltaic on future electricity market prices. Energy Convers. Manag. 2019, 180, 312–324. [Google Scholar] [CrossRef]
- Djørup, S.; Thellufsen, J.Z.; Sorknæs, P. The electricity market in a renewable energy system. Energy 2018, 162, 148–157. [Google Scholar] [CrossRef]
- Cantarero, M.M.V. Reviewing the Nicaraguan transition to a renewable energy system: Why is “business-as-usual” no longer an option? Energy policy 2018, 120, 580–592. [Google Scholar] [CrossRef]
- Østergaard, P.A. Reviewing EnergyPLAN simulations and performance indicator applications in EnergyPLAN simulations. Appl. Energy 2015, 154, 921–933. [Google Scholar] [CrossRef]
- Marczinkowski, H.M.; Østergaard, P.A. Residential versus communal combination of photovoltaic and battery in smart energy systems. Energy 2018, 152, 466–475. [Google Scholar] [CrossRef] [Green Version]
- Marczinkowski, H.M.; Østergaard, P.A. Evaluation of electricity storage versus thermal storage as part of two different energy planning approaches for the islands Samsø and Orkney. Energy 2019, 175, 505–514. [Google Scholar] [CrossRef]
- Østergaard, P.A.; Jantzen, J.; Marczinkowski, H.M.; Kristensen, M. Business and socioeconomic assessment of introducing heat pumps with heat storage in small-scale district heating systems. Renew. Energy 2019, 139, 904–914. [Google Scholar] [CrossRef]
- Cabrera, P.; Lund, H.; Carta, J.A. Smart renewable energy penetration strategies on islands: The case of Gran Canaria. Energy 2018, 162, 421–443. [Google Scholar] [CrossRef] [Green Version]
- Haydt, G.; Leal, V.; Pina, A.; Silva, C.A. The relevance of the energy resource dynamics in the mid/long-term energy planning models. Renew. Energy 2011, 36, 3068–3074. [Google Scholar] [CrossRef]
- Pillai, J.R.; Heussen, K.; Østergaard, P.A. Comparative analysis of hourly and dynamic power balancing models for validating future energy scenarios. Energy 2011, 36, 3233–3243. [Google Scholar] [CrossRef]
- Marczinkowski, H.M. Smart Island Energy Systems Deliverable D8.1; Aalborg University: Aalborg, Denmark, 2017. [Google Scholar]
- Marczinkowski, H.M. Smart Island Energy Systems Deliverable D8.2; Aalborg University: Aalborg, Denmark, 2018. [Google Scholar]
- Henriques, A.; Vasconcelos, D. EEM Dispatch Center Production 2014; Empresa de Eletricidade da Madeira: Funchal, Portugal, 2015. [Google Scholar]
- Staffell, I.; Pfenninger, S. Using bias-corrected reanalysis to simulate current and future wind power output. Energy 2016, 114, 1224–1239. [Google Scholar] [CrossRef] [Green Version]
- Pfenninger, S.; Staffell, I. Long-term patterns of European PV output using 30 years of validated hourly reanalysis and satellite data. Energy 2016, 114, 1251–1265. [Google Scholar] [CrossRef] [Green Version]
- EMD International A/S. Energypro—EMD International A/S; EMD International A/S: Aalborg, Denmark, 2018. [Google Scholar]
- Saha, S.; Moorthi, S.; Wu, X.; Wang, J.; Nadiga, S.; Tripp, P.; Behringer, D.; Hou, Y.-T.; Chuang, H.-Y.; Iredell, M.; et al. The NCEP Climate Forecast System Version 2. J. Clim. 2014, 27, 2185–2208. [Google Scholar] [CrossRef]
- Østergaard, P.A.; Andersen, A.N. Booster heat pumps and central heat pumps in district heating. Appl. Energy 2016, 184, 1374–1388. [Google Scholar] [CrossRef]
- Andersen, F.M. Electricity Profiles. 2012. Available online: http://www.elforbrugspanel.dk/Pages/Rapportering.aspx (accessed on 12 April 2018).
- Lund, H. Renewable Energy Systems—A Smart Energy Systems Approach to the Choice and Modeling of 100% Renewable Solutions, 2nd ed.; Academic Press: Cambridge, MA, USA; Elsevier: Cambridge, MA, USA, 2014. [Google Scholar]
- Samso Energy Academy. Samsø Energy Academy. Vedvarende Energi-Ø. Available online: https://energiakademiet.dk/vedvarende-energi-o/ (accessed on 20 October 2017).
- Danish Energy Agency. Data for Energy Sector (Wind Turbines), Version 2017. 2017. Available online: https://ens.dk/service/statistik-data-noegletal-og-kort/data-oversigt-over-energisektoren (accessed on 5 August 2019).
- Energinet.dk. PV in Denmark. 2017. Available online: https://www.energinet.dk/-/media/Energinet/El-CSI/Dokumenter/Data/Graf-for-solceller-i-Danmark.xlsx (accessed on 12 April 2018).
- Region Midtjylland. Energy Account Samsø. 2017. Available online: http://www.rm.dk/regional-udvikling/klima-og-miljo/strategisk-energiplanlagning/ (accessed on 5 August 2019).
- Christensen, B.G. Personal Communication with NRGi on SAMSØ Connections; Aalborg University: Aalborg, Denmark, 2017. [Google Scholar]
- Jantzen, J.; Bak-Jensen, B. Smart Island Energy Systems Deliverable D3.1; Samsø Energy Academy: Ballen, Denmark, 2018. [Google Scholar]
- Connolly, D.; Mathiesen, B.V.; Ridjan, I. A comparison between renewable transport fuels that can supplement or replace biofuels in a 100% renewable energy system. Energy 2014, 73, 110–125. [Google Scholar] [CrossRef]
- Lund, H.; Kempton, W. Integration of renewable energy into the transport and electricity sectors through V2G. Energy Policy 2008, 36, 3578–3587. [Google Scholar] [CrossRef]
- Kaldellis, J.K.; Kapsali, M.; Kaldelli, E.; Katsanou, E. Comparing recent views of public attitude on wind energy, photovoltaic and small hydro applications. Renew. Energy 2013, 52, 197–208. [Google Scholar] [CrossRef]
- Orkney Renewable Energy Forum (OREF) and Community Energy Scotlant. Orkney-Wide Energy Audit 2014: Energy Sources and Uses; Orkney Renewable Energy Forum (OREF) and Community Energy Scotland: Stromness, Scotland, 2015. [Google Scholar]
- Orkney Renewable Energy Forum (OREF). OREF Homepage. 2017. Available online: http://www.oref.co.uk/ (accessed on 27 November 2017).
- Department for Business Energy & Industrial Strategy. UK Statistics on Renewable Electricity. 2018. Available online: https://www.gov.uk/government/statistics/regional-renewable-statistics (accessed on 23 November 2017).
- Department for Business Energy & Industrial Strategy. UK Statistics on Electricity Consumption. 2017. Available online: https://www.gov.uk/government/statistical-data-sets/regional-and-local-authority-electricity-consumption-statistics-2005-to-2011 (accessed on 23 November 2017).
- Department for Business Energy & Industrial Strategy. UK Statistics on Residual Fuel Consumption. 2016. Available online: https://www.gov.uk/government/statistical-data-sets/estimates-of-non-gas-non-electricity-and-non-road-transport-fuels-at-regional-and-local-authority-level (accessed on 23 November 2017).
- Department of Energy & Climate Change. UK Statistics on Road Transport. Sub-National Road Transport Fuel Consumption 2014–2016. Available online: https://www.gov.uk/government/statistical-data-sets/road-transport-energy-consumption-at-regional-and-local-authority-level (accessed on 23 November 2017).
- Department for Business Energy & Industrial Strategy. RHI statistics. Collective Renewable Heat Incentive Statistics; 2015. Available online: https://www.gov.uk/government/collections/renewable-heat-incentive-statistics (accessed on 28 November 2017).
- Danish Energy Agency. Technology Data for Energy Plants—Individual Heating Plants and Energy Transport; Danish Energy Agency: København, Denmark, 2013. [Google Scholar]
- National Records of Scotland. Scotland’s Census. Area Profiles; 2017. Available online: http://www.scotlandscensus.gov.uk/ods-web/area.html#! (accessed on 29 November 2017).
- Allan, G.; Gilmartin, M.; McGregor, P.; Swales, K. Levelised costs of Wave and Tidal energy in the UK: Cost competitiveness and the importance of ‘banded’ Renewables Obligation Certificates. Energy Policy 2011, 39, 23–39. [Google Scholar] [CrossRef]
- Astariz, S.; Iglesias, G. The economics of wave energy: A review. Renew. Sustain. Energy Rev. 2015, 45, 397–408. [Google Scholar] [CrossRef]
- Orkney Renewable Energy Forum (OREF). Orkney Electric Vehicle Strategy 2018–2023; OREF: Stromness, Scotland, 2018. [Google Scholar]
- The Scottish Government. Scotland Heat Map. 2017. Available online: http://heatmap.scotland.gov.uk/ (accessed on 29 November 2017).
- Mathiesen, B.V. Heat Roadmap Europe: A Low-Carbon Heating and Cooling Strategy for Europe. 2018. Available online: http://heatroadmap.eu/ (accessed on 5 August 2019).
- Miguel, M.; Nogueira, T.; Martins, F. Energy storage for renewable energy integration: The case of Madeira Island, Portugal. Energy Procedia 2017, 136, 251–257. [Google Scholar] [CrossRef]
- Empresa de Eletricidade da Madeira. Annual Report EEM 2014; Empresa de Eletricidade da Madeira: Funchal, Portugal, 2015. [Google Scholar]
- DREM—Direção Regional de Estatística da Madeira. Statistics Madeira. Available online: https://estatistica.madeira.gov.pt/ (accessed on 20 June 2017).
- Miguel Martins. Energy balance of RAM. In Autonomous Region of Madeira; Governo Regional da Madeira: Funchal, Portugal, 2017. [Google Scholar]
- Vasconcelos, D.; Correia, H.; Barros, L. Personal communication with EEM and M-ITI; mpresa de Eletricidade da Madeira: Funchal, Portugal, 2018. [Google Scholar]
Figure 1.
Sankey diagrams of energy flows in GWh for Samsø for 2015 (a) and 2030 (b) [32].
Figure 1.
Sankey diagrams of energy flows in GWh for Samsø for 2015 (a) and 2030 (b) [32].

Figure 2.
Sankey diagrams of energy flows in GWh for Orkney for 2014 (a) and 2030 (b) [32].
Figure 2.
Sankey diagrams of energy flows in GWh for Orkney for 2014 (a) and 2030 (b) [32].

Figure 3.
Sankey diagrams of energy flows in GWh for Madeira for 2014 (a) and 2030 (b) [32].
Figure 3.
Sankey diagrams of energy flows in GWh for Madeira for 2014 (a) and 2030 (b) [32].


Table 1.
The phases of renewable energy (RE) integration in the transition to 100% RE to classify energy systems and respective technical requirements, based on [40].
Table 1.
The phases of renewable energy (RE) integration in the transition to 100% RE to classify energy systems and respective technical requirements, based on [40].
| Phases | RE Introduction | Large-Scale RE Integration | Towards 100% RE |
|---|---|---|---|
| Example energy system | Small share of RE, no problem integrating, direct fuel reduction | Existing large share of RE, system influence and interference time-dependent due to large share of intermittent RE | Transformation into 100% RE-based system, complex comparison of various technologies requiring balance, sector integration, optimized biomass utilization |
Table 2.
The SMILE islands and respective required technologies for the varying phases in the transition to 100% RE (shares are current references and projected targets with respective year).
Table 2.
The SMILE islands and respective required technologies for the varying phases in the transition to 100% RE (shares are current references and projected targets with respective year).

Table 3.
Comparison of energy demands.
| Annual Data | Samsø | Orkney | Madeira | |||
|---|---|---|---|---|---|---|
| 2015 | 2030 | 2014 | 2030 | 2014 | 2030 | |
| Electricity Demand (GWh) | 25.5 | 41.8 | 154.7 | 195.0 | 838.8 | 1042.7 |
| Heat Demand (excl. electric) (GWh) | 46.3 | 21.3 | 69.4 | 38.7 | 192.7 | 76.0 |
| Transport Demand (GWh) | 30.0 | 28.9 | 103.9 | 99.7 | 453.5 | 433.8 |
| Industry Demand (GWh) | 0.4 | 0.4 | 189.4 | 189.4 | 275.4 | 275.4 |
Table 4.
Comparison of electricity production.
| Annual Data | Samsø | Orkney | Madeira | |||
|---|---|---|---|---|---|---|
| 2015 | 2030 | 2014 | 2030 | 2014 | 2030 | |
| Wind power capacity (MW) | 34.4 | 34.4 | 48.3 | 52.8 | 45.1 | 133.1 |
| PV capacity (MW) | 1.3 | 11.5 | 1.2 | 11.5 | 19.1 | 121.7 |
| Tidal and wave capacity (MW) | - | - | - | 19.0 | - | - |
| Geothermal capacity (MW) | - | - | - | - | - | 30.0 |
| Hydro power capacity (MW) | - | - | - | - | 50.7 | 111.6 |
| Waste incineration (GWh) | - | - | - | - | 32.9 | 32.9 |
| Transmission capacity (MW) | 40 | 40 | 40 | 40 | - | - |
| Power plant power supply (GWh) | - | - | 41.9 | 16.0 | 599.7 | 311.8 |
Table 5.
Comparison of fuel consumption.
| Annual Data | Samsø | Orkney | Madeira | |||
|---|---|---|---|---|---|---|
| 2015 | 2030 | 2014 | 2030 | 2014 | 2030 | |
| Biomass consumption (GWh) | 52.2 | 74.2 | 2.0 | 69.1 | 172.9 | 149.4 |
| Oil consumption (GWh) | 89.0 | 36.0 | 598.8 | 425.6 | 2910.4 | 1791.7 |
| Gas consumption (GWh) | 23.4 | 0.4 | 94.5 | 35.5 | 503.3 | 232.0 |
| Coal consumption (GWh) | - | - | 21.1 | 12.6 | - | - |
| Total fossil fuels (GWh) | 112.4 | 36.4 | 714.4 | 473.7 | 3413.8 | 2023.7 |
| Total consumption (GWh) | 164.6 | 110.6 | 716.4 | 542.8 | 3586.7 | 2173.1 |
Table 6.
Comparison of energy system indicators.
| Annual Data | Samsø | Orkney | Madeira | |||
|---|---|---|---|---|---|---|
| 2015 | 2030 | 2014 | 2030 | 2014 | 2030 | |
| RE share of PES | 60% | 85% | 18% | 38% | 11% | 31% |
| RE share of electricity demand | 94% | 96% | 66% | 85% | 29% | 71% |
| Imported electricity (GWh) | 1.5 | 1.8 | 10.8 | 3.8 | 0.0 | 0.0 |
| Exported/Excess electricity (GWh) | 87.5 | 93.4 | 48.9 | 46.0 | 0.0 | 0.2 |
| CO2 emissions on island (kt) | 28.5 | 9.7 | 186.0 | 124.9 | 894.5 | 541.1 |
| CO2 emissions per capita (t) | 7.7 | 2.6 | 8.5 | 5.7 | 3.5 | 2.2 |
| Total socio-economic costs (M€) | 16.5 | 15.6 | 57.7 | 59.6 | 315.7 | 337.2 |
© 2019 by the authors. Licensee MDPI, Basel, Switzerland. This article is an open access article distributed under the terms and conditions of the Creative Commons Attribution (CC BY) license (http://creativecommons.org/licenses/by/4.0/).
Share and Cite
MDPI and ACS Style
Marczinkowski, H.M.; Alberg Østergaard, P.; Roth Djørup, S. Transitioning Island Energy Systems—Local Conditions, Development Phases, and Renewable Energy Integration. Energies 2019, 12, 3484. https://doi.org/10.3390/en12183484
AMA Style
Marczinkowski HM, Alberg Østergaard P, Roth Djørup S. Transitioning Island Energy Systems—Local Conditions, Development Phases, and Renewable Energy Integration. Energies. 2019; 12(18):3484. https://doi.org/10.3390/en12183484
Chicago/Turabian StyleMarczinkowski, Hannah Mareike, Poul Alberg Østergaard, and Søren Roth Djørup. 2019. "Transitioning Island Energy Systems—Local Conditions, Development Phases, and Renewable Energy Integration" Energies 12, no. 18: 3484. https://doi.org/10.3390/en12183484
Note that from the first issue of 2016, this journal uses article numbers instead of page numbers. See further details here.