1. Introduction
With the increasing demand for energy and concerns about environmental issues, different approaches have been used for more efficient use of active power and energy. One of the most commonly used methods in the last few years involves the use of nonlinear elements to cut off a part of a waveform (voltage or current), which results in the equipment to consume less active energy [
1]. From the point of view of energy efficiency, it is clear that the results are significant. On the other hand, the signals change to a nonlinear profile, and there is always a valid concern about harmonic distortion. This issue has received more attention in recent years with the extensive use of electronic devices with nonlinear elements, in other words, with the ever increasing number of power electronic devices connected to power systems [
2,
3,
4]. This leads to a power quality—PQ—problem due to the harmonics injection in the power network by this equipment [
5,
6,
7,
8,
9,
10]. Moreover, the distributed generation has become a real alternative to improve grid efficiency and reliability. Hence, power quality is one of the main concerns of both power plant owners and network system operators [
11].
Many researchers have focused on measuring the distortion in voltage and current waveform, which has been generated by generators, transformers, static compensators, fluorescent and LED (light emitting diode) bulbs, liquid crystal display (LCD) TVs, washers and other modern electronic systems [
12,
13,
14,
15]. Saturable devices and power electronic devices has always been the two general sources of harmonic distortion. Harmonics produced by saturable devices are generated due to iron saturation, which is the case for transformers, machines and fluorescent lamps (with magnetic ballasts) [
16,
17]. On the other hand, power electronic devices, as in the case of voltage source converters, switch-mode power supplies, power electronic converters and fluorescent lights (with electronic ballasts), which are some kind of power electronic devices [
18,
19,
20]. The distortions in the power network can influence negatively the functions of some equipment, making them respond in an unpredicted manner when subjected to multiple frequencies [
21,
22,
23,
24]. Due to this fact methods to monitoring the sources of harmonics system have been developed to quantify/qualify the effects of the distortion in the system [
25,
26,
27,
28,
29].
Some standards and recommendations have been developed aiming to limit the harmonic distortion in the electrical system. For instance, the IEEE Std 519™ 2014 recommends for low voltage grids (V ≤ 1.0 kV) a total harmonic voltage distortion (THDv) until 8%. This limit is applied at the point of common coupling (PCC) and should not be applied to either individual pieces of equipment [
12]. On the other hand, the IEC Std 61000-3-2 “deals with the limitation of harmonic currents injected into the public supply system. It specifies limits of harmonic components of the input current which can be produced by equipment tested under specified conditions. It is applicable to electrical and electronic equipment having a rated input current up to and including 16 A per phase and intended to be connected to public low-voltage distribution systems”. Furthermore, “for systems with nominal voltages less than but not equal to 220 V (line-to-neutral), the limits have not yet been considered”. The standard has not established a total harmonic current distortion (THDi) [
30]. It is important to highlight that this standard works with individuals loads limits and not with in the PCC.
Moreover, a lot of monitoring methods have been developed to estimate the harmonic profiles generated by the many existing devices accurately and fast. These monitoring methods aim to verify if the limits established are in accordance with those generated by these systems [
6,
31,
32,
33]. There are other works that analyze the effects caused by different lighting devices technologies on the electrical systems, as well as power quality issues [
34,
35,
36,
37,
38,
39,
40]. It is a challenging task to model the random variation of the harmonic outputs of the various residential loads [
34]. For instance, in [
35], the authors highlight that different lamp manufacturers use several ballast technologies. Hence, they conclude that, for the tested lamps in the paper, the THDi is strongly dependent on the power supplier circuit topology and control strategy, and it is independent on the lamp technology and size. Furthermore, in [
36], the authors present that each brand of LED lamp gives a great variety of harmonic distortion values. This is done by considering different brands and types of lamps. It means that the harmonic emission of the LED lamps depends considerably on technology, i.e., power electronics, used within the LED lamps. Similarly, in [
37], the authors also show that that LED lamps currently available on the market show a large variety of harmonic emission and displacement power factor. They show that the THDi varies between 16.8% and 189% for the lamps considered, as well as the displacement power factor (DPF) and true power factor (TPF) of the lamps vary between 0.2 and 0.99. Another interesting conclusion is that cheaper as well as more expensive lamps can show a high THDi, so the harmonic distortion has no link to the price of the lamp. Moreover, in [
38], the authors highlight that although the input power of a single LED bulb is quite low, a large number of customers using LED bulbs and CFLs (compact fluorescent lamps) per premises could create significant power quality problems into the power system network. They also show that the bulbs use different filtering methods to reduce harmonic generation. In other words, it means that these loads have a different harmonic profile.
In [
39], aiming to identify the harmonic levels from some LED lamps, the authors use different wattage bulbs (4, 5 and 7 W) by different manufacturers and they conclude that different manufacturers of LED lamps use diverse ballast technologies, as ballast with passive filters, active filters, and valley-filled circuit. For this, each lamp has a different harmonic level. Furthermore, in [
40] the authors emphasized the power quality indexes, as THD, luminous performance and power factor of different types of an illumination system, including CFL and LED. An experimental setup was developed to measure the THD. The scope of the work is focused on the harmonics contents from various residential illumination systems, which deteriorate the power quality. They concluded that the power factor of all energy efficient lamps, which were analyzed, is very low. The operation of CFL and LED are affected by the supply voltage and current waveform significantly. Therefore, the authors of [
40] recommend that the manufacturers must be bound to produce and supply CFLs and LED to improve the power quality related performance.
Therefore, it is clear that the lighting devices have different characteristics. Currently, there are several manufacturers that develop different driver topology. It means that each load has a specific harmonic profile. There is not a standard model. Besides this, it is important to investigate the relationship between the voltage grid and the electrical quantities, as well as power quality indexes. In [
41], the authors investigate the voltage level dependencies of different modern lighting types. For this, commercially available LED and CFL luminaires were considered, investigating specifically how their behaviors vary with the applied voltage level of the electricity supply. A range between 0.90–1.10 pu of voltage was used. Exploring the relationship between the applied voltage level, and the harmonic current distortion and power consumption characteristics of these luminaires, the experimental results demonstrate that a strong correlation exists between these performance metrics. It is important to highlight that they do not consider different THDv levels. However, in [
42] the authors presents measurements of the electric power absorbed by a newly built facility for office and scientific research activities, focusing the need for compensation of capacitive reactive power, due to the vast use of LED lighting in the facility. Among the results, it is worth to note that they investigated the basic electrical parameters of some LEDs devices as a function of the changes in harmonic levels occurring in the supply voltage. The test illustrated that samples were characterized by a very low power factor, which decreased as the level of harmonic disturbances increased. Four tests were developed, using different harmonic voltage distortion levels (T1 to T4). Test T1 was used as the reference level in which the LED lighting source was supplied with voltage without harmonic disturbances. The other tests considered a harmonic distortion level (THDv) varying between nearly 5% and 14%. The values of all harmonics ranging from 14th to 40th harmonic were 0%. However, the authors did not change the harmonic profile of the THDv signal—just on the type of each level was applied.
Therefore, it is important to investigate the response of measurements with the same THDv level, but with different harmonic profiles. As it is known, a THDv can have the same value, but be composed of different harmonics orders. Finally, another interesting question is the influence of the THDv on the electrical billing system. In [
43], the authors investigated the billing accuracy of some types of revenue meters, under sinusoidal and distorted conditions. They conclude that if the THDv is lower than the limits established by IEEE Standard 519, the effects on the accuracy of the meters are not significant. Six harmonic levels were considered, however up to 5% of THDv. In [
34], the authors conclude that higher distortion levels may affect the performance of revenue meters and lead to billing inequities. They presented some researches that show the accuracy of the revenue meter is not guaranteed when voltage distortion exceeds 5%.
It is important to highlight that, in general, the THDv on the electric distribution system is under 5% [
21,
44,
45,
46]. Moreover, standards recommend a maximum THDv between 8% and 10% for low voltage grids (V ≤ 1.0 kV) [
12,
47,
48]. However, in this paper the authors consider these and higher values, to discuss the influence of the voltage distortion with different levels and harmonic profiles, aiming to simulate hypothetical scenarios, with high levels of harmonic distortion in the system. That is, it is aimed to analyze the influence of some values of THDv in the measurement of electric energy in systems with predominantly electronic loads.
Therefore, this paper has the aim of analyzing the impact of voltage distortion on the electrical quantities measured by revenue meters and the influences on the electrical energy billing. For this, a CFL and two different types of LED bulbs were used. These devices were subjected to the same THDv levels, but with different harmonic profiles. A power quality and energy analyzer and revenue meter were used to perform the measurements. The main contribution of this paper is to show that by combining for the first time in a study different levels of THDv, with different harmonic profiles and considering different loads, the electrical quantities and the electrical energy billing will be influenced in different ways: sometimes the parameters remained numerically the same; sometimes have improved and sometimes have become worse. For this, qualitative and quantitative analyses were developed, and it can be concluded that the effects of the combination of variables are not as clear as the effects of considering only one variable. The reference case considered for the analyses consist in the sinusoidal voltage signal supplying the loads (directly applied in the input terminals of the loads).
2. Materials and Methods
All the experiments were performed in a laboratory in the Federal University of Mato Grosso, which offered the following equipment used in this research (
Table 1). Three different lighting devices were used, each one from a different manufacturer. All devices are available in the market. The different manufacturers hereafter will be called Brands A, B and C.
As seen in
Section 1, different bulbs, from different manufacturers, use different driver technologies. Hence, the results have different current harmonic distortion values. In [
37], the authors suggest to repeat the experiments using LED lamps every few years, due to the rapid technology changes.
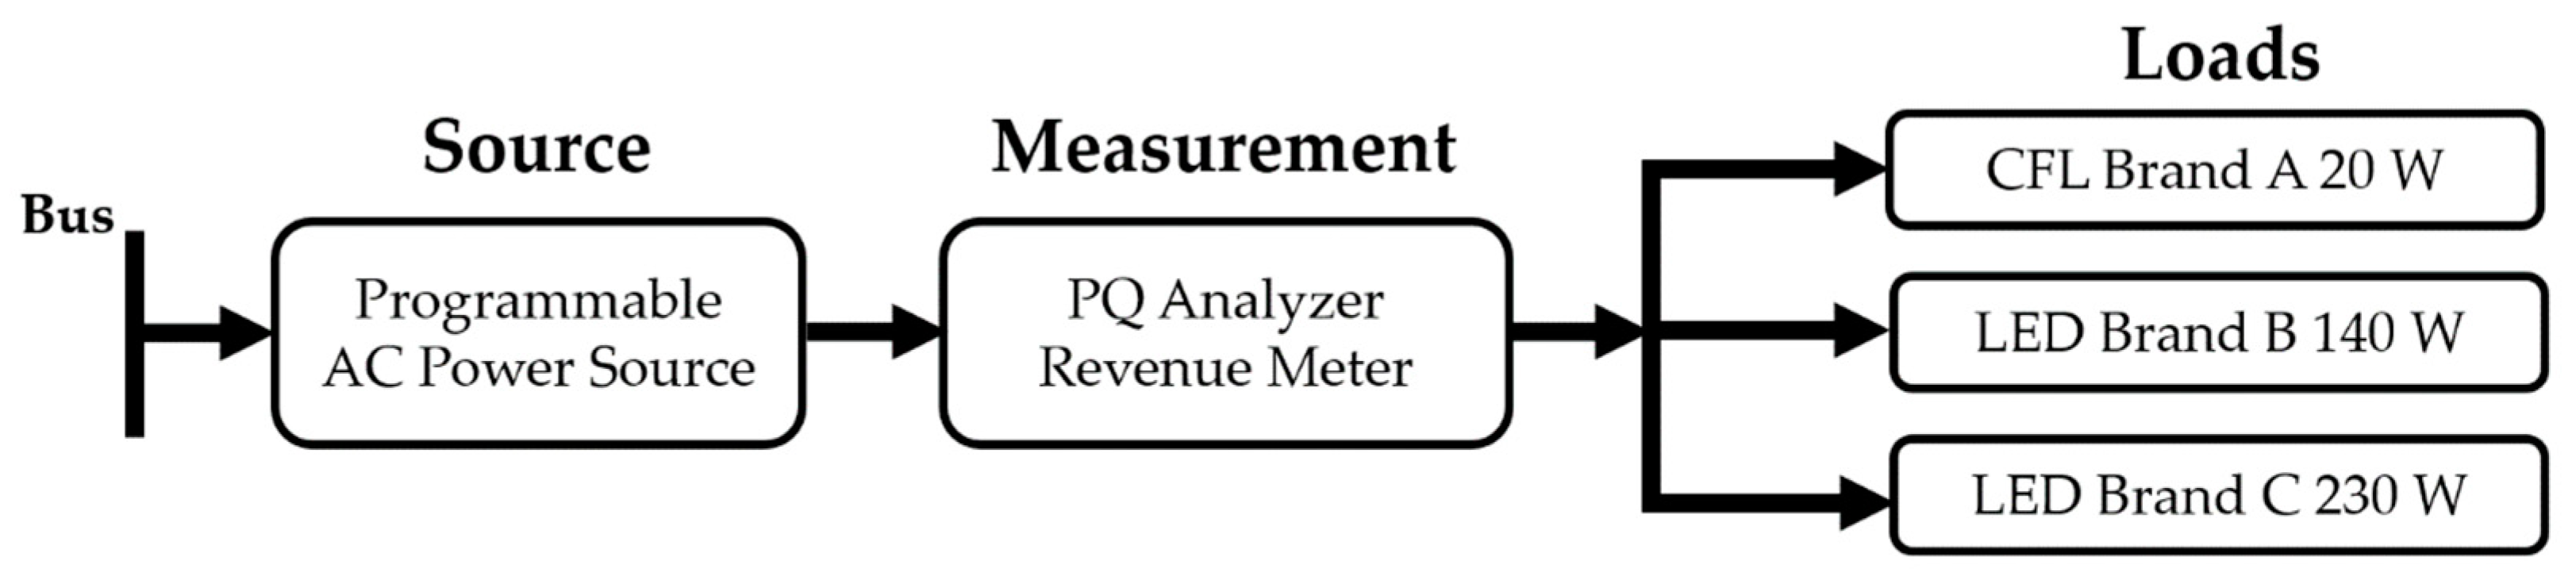
The block diagram of the experimental setup is shown in
Figure 1. It consists of the following components: programmable AC power source (model Chroma 61702, Chroma ATE Inc., Taoyuan County, Taiwan), power quality and energy analyzer (model FLUKE 434, Fluke Corporation, Everett, WA, USA), revenue meter (E750—Landis + Gyr), CFL and two different LED bulbs under test.
The current investigation involves measuring of the behavior of the three loads under different voltage distortion profiles (three different THDv levels, each one with two different harmonic profiles), by using a programmable AC power source, considered as an ideal AC supply, which is an isolated power system. Measurements of individual lamps were performed aiming to obtain the electrical quantities and their harmonic profiles.
Similar to [
35], in this paper the voltage harmonics produced by the interaction between current harmonics and the equivalent impedance were not considered. The THDv values were only due to the distortion applied through programmable power source on the input terminals of the loads.
The main objective of this paper was to analyze how much the different harmonic voltage profiles influences the electrical quantities, and how they interfere on the power quality indexes and on the electrical energy billing. Moreover, other objectives were considered as follows:
To evaluate the behavior of the three aforementioned loads under different voltage distortion profiles. It means three different THDv levels (4.9%, 18.8% and 24.5%), each one with two different harmonic profiles.
To demonstrate that when compared with the sinusoidal voltage, applying a distorted voltage signal does not mean that the electrical quantities and the power quality indexes of any nonlinear load will get worse. It depends on the signal characteristics, as well as each driver topology, i.e., each load.
To contribute to the better understanding of the electrical energy billing issues under nonsinusoidal conditions.
Some assumptions were considered:
The power source was considered as an ideal AC supply, which is an isolated power system. Therefore, the network equivalent impedance was not considered.
The sinusoidal conditions were the reference case. From this assumption, it was possible to investigate if a parameter remained numerically the same, if it improved or if it became worse, considering the point of views of power quality and billing.
It is important to highlight that the programmable AC power source, which was utilized, allows applying up to 43% of harmonic distortion in the voltage waveform in two different ways. One mode consists in applying any level of THDv without using schedule functions offered by the source. In this way, to know the harmonic profile of the applied signal, it is necessary to use an energy analyzer. On the other hand, with the use of schedule functions, just some levels of THDv are available, but the harmonic profile of the distortion, which was applied, can be acknowledged. In order to cover different kinds of the harmonic profile of THDv (different levels) and considering mainly those harmonic most common or dominants in the low voltage grids, i.e., 3rd, 5th and 7th [
21,
44], the selected options were Functions 01, 04 and 13. These functions have the following THDv: 18.8%, 4.9% and 24.5%, respectively. These values would be important for the analysis that would be presented later.
The voltage waveforms of each schedule function used in this study is shown in
Figure 2 and the harmonic profiles can be found in
Table 2,
Table 3 and
Table 4, respectively [
49]. Measurement was performed with the power quality and energy analyzer to confirm the information from the power source manufacturer.
Table 5 shows the harmonic profile for Function 01 of the programmable power source. This measurement was performed for the other two functions used (Functions 04 and 13) and the results were also in agreement with the data of the
Table 3 and
Table 4.
The measurements were made with Fluke 434 power quality and energy analyzer in FULL mode, which considers all harmonics (up to and including the 50th). This is due to the purpose of this paper, which was to analyze the influence of the harmonic distortion applied in electronic loads, aiming at the impact on the commercial measurement (for billing purposes) of the electrical quantities. The commercial power meter (revenue meter) was used for the sake of comparison. In [
50,
51], the authors present the detail discussions about the different methods used by some electronic meters. Moreover, they discuss on some proposals to electrical energy billing (focused on reactive power/energy) under nonsinusoidal conditions. Two types of meters were used. A revenue meter, commercially used by the utilities, and a power quality and energy analyzer. This helps to record the electrical quantities used to electrical energy billing, as well as to analyze some power quality indexes. Some recorded data were converging (for instance, active, apparent and nonactive powers, power factor and current). Therefore, in order to simplify the analysis, the power quality and energy analyzer data were used and the details about the algorithm are shown.
It is important to highlight how the meters calculate the electrical quantities, to understand the results. Firstly, the screen of the power quality analyzer limits the showed data in two digits (decimals). This fact justifies some slight differences in results/numbers, which were showed. Besides this, the loads measured were low rated power. However, the electrical quantities were small, which permits too slight variations on the measurements. This was not necessarily a problem, since the main objective was to analyze in a broader way, and therefore, the decimal numbers were not essential. The displacement power factor (DPF) or fundamental power factor was determined by the meter according to the following:
Furthermore, the power factor (PF) was determined by the meter according to the following:
where
SN is non-fundamental apparent power (VA);
PH is non-fundamental active power or harmonic active power (W) and
P1 and
S1 are fundamental active power and fundamental apparent power, respectively [
52]. Moreover, the power quality and energy analyzer was based on the IEEE 1459 power theory to calculate the electrical quantities (power), and in the IEC 61000-4-7: Class 1, IEC 61000-4-30 Class S and EN 50160, to calculate power quality measurements [
53].
3. Results and Discussions
3.1. CFL Brand A 20 W
The CFL Brand A was subjected in different levels of THDv without the use of schedule functions. The objective was to measure the electrical quantities of this load when the supplied voltage has different levels and types of distortion. The data were recorded by Fluke 434. In
Table 6 it can be seen that the active power remained numerically equal for all applied values of THDv. However, the apparent power increased from THDv of 20%. The non-active power (kVAr) also demanded increased, draining more current of the source. The power factor and the displacement power factor decreased with the increase of the THDv applied. The current measurement increased significantly, from the sinusoidal condition to the THDv condition of 30%, it almost doubled. The THDi increased between 30% and 40% with each increase of 10% in the THDv and with 30% of THDv, THDi had become more than double, in relation to the sinusoidal signal. It means that, in the same way as [
54], it is possible to say that this load probably not using any kind of filtering technique as part of their driver circuit.
It is also interesting to note the symbols “c” and “i” that accompany the measurement of the non-active power (kVAr). This indicates how the meters, both commercial and power quality and energy analyzer, characterize the load. That is, it is a load with capacitive or inductive characteristics, in other words, the power factor is leading or lagging, respectively. This fact becomes relevant, for example, in the Brazilian billing system, since the billing of the surplus of reactive is based on the characteristic of the consumer unit before the measurement system and according to the established schedules. In summary, it directly affects electric energy billing for Brazilian medium and large consumers [
55].
The distorted voltage signals were applied through Function 01 and THDv of 18.8%.
Table 7 presents the harmonic profile for 18.8% THDv. As can be noticed, this function had harmonics until the 15th order, although the higher harmonic was the 3rd. It should be noted that the presentation up to the 15th order occurred for two reasons: the measurement presented significant values up to this order, as well as a limitation of the presentation of the screen of the energy analyzer used. Therefore, the equipment was configured to show the most significant orders for each experiment.
Table 8 shows the results when the CFL was subjected to distorted voltage, through Function 01 and THDv of 18.8%.
In comparison with the sinusoidal conditions, in both cases, the active power remained numerically equal. The apparent power had an increase, when applied to Function 01. The non-active power suffered variations. Yet, occurred a decrease in the power factor in the Function 01 condition the power factor measured was higher than when applied to THDv of 18.8%.
On the other hand, the displacement power factor in the case of Function 01 was higher than the sinusoidal condition and the 18.8% THDv condition, in the last one this parameter was the significantly lower. This occurred due to the phase angle of the signal. To calculate the DPF, the angle between fundamental signals was considered, and these angles were different for each signal applied. This result was according to that found by [
56]. The current value in the sinusoidal condition was lower, as expected. The total harmonic distortion in this parameter increased around 80% in comparison with a sinusoidal condition and the value between Function 01 and 18.8% of THDv was close.
Following the experiments for the condition of Function 01 (THDv of 18.8%), we proceeded to the next step, which was to apply Function 04 and THDv of 4.9%. Therefore, using the energy analyzer to know the harmonic profile of the 4.9% THDv, as can be seen there existed harmonics until the 15th order, while the 3rd harmonic had the most significant value.
Table 9 shows the data.
Similar to the first case presented (Function 01 and 18.8% of THDv), when applying Function 04, the waveform and the harmonic profile were very different from when applying 4.9% of THDv directly.
Table 10 presents the harmonic profile for Function 04. It is important to note that Function 04 had a larger spectrum, containing harmonics orders up to 33rd.
Table 11 presents the results of the tests performed. In comparison to the sinusoidal conditions, in both cases, an active power remained numerically equal. The apparent power increased when Function 04 was applied. The non-active power changed, even if small, also when applicable to Function 04 and the 4.9% THDv. However, a decrease in the power factor occurred, but now in the Function 04 condition the power factor measured was lower. It is important to highlight that the PF had changed, which shows the influence of the THDv in the measurements.
On the other hand, the displacement power factor in the case of Function 04 was equal to the sinusoidal condition and higher than the 4.9% THDv condition. The value of the current only changed when the Function 04 was applied. The total harmonic distortion in this parameter increased around 40% in comparison with a sinusoidal condition, when applied to Function 04, and only 8% when applied 4.9% of THDv. If we compared THDi between Function 04 and THDv 4.9% applied directly, the difference was approximately 30%.
The last experiment with the CFL brand A was the application of Function 13 of the programmable source, as well the direct application of 24.5% of THDv.
Table 12 shows the harmonic profile for 24.5% of THDv. As it can be seen, significant harmonics up to the 15th order existed, while the 3rd harmonic had the most significant value.
Similar to the other cases presented, when Function 13 was applied, the harmonic profile was very different from when 24.5% of THDv applied directly.
Table 13 presents the harmonic profile for the case of Function 13 and
Table 14 shows the results of the tests performed.
In comparison with the sinusoidal conditions, in both cases, the active power remained numerically equal. The apparent power increased significantly when 24.5% of THDv was applied. The non-active power varied and had a greater increase in the application of THDv of 24.5%. In relation to the power factor, a decrease occurred, but in the THDv of 24.5% condition the power factor measured was lower. The displacement power factor in the case of Function 13 was higher than the 24.5% THDv condition, in the last one this parameter was the significantly lower.
The current value presented a significant variation when applied to THDv of 24.5% and did not change when applied to Function 13. The total harmonic distortion in this parameter increased almost 60% in comparison with a sinusoidal condition, when applied to Function 13, and practically 120% when applied 24.5% of THDv. If we compared the THDi between Function 13 and THDv 24.5% applied directly, the difference was approximately 40%. It should be noted that in all experiments the power quality and energy analyzer, as well the commercial power meter were used, and the measurements results of both was similar.
3.2. LED Brand B bulb 140 W
Firstly, the LED brand B bulb was subjected to different levels of THDv without the use of schedule functions. From
Table 15, we can see that the active power remained numerically equal for all applied values of THDv. However, the apparent power decreased with the application of a THDv of 30%. The non-active power (kVAr) demanded also decreased, however, in a more significant way, registering a reduction of 33% when applied a THDv of 30%, when compared with the sinusoidal condition.
The power factor and displacement power factor increased with the growth of the THDv applied. This result was contrary to the first one, where a CFL was used. The reason for this result was basically the interaction between two factors: first, the characteristics of the applied signal and the second, due to the load driver topology. Hence, each load would behave differently when subjected to the same signal. For instance, in [
54], the authors show the different harmonic emission levels of three LED lamps. Emissions ranged from about 12% to 102%. The lowest value refers to a load with a topology to filter out harmonic emissions. Therefore, considering the THDi level of this load, it could be said that it had a filter. The value of the current presented a variation when applied the THDv of 5% and 10% and did not change when applied the other signals distorted. The THDi decreased until 10% of THDv applied and started growing after exceeding 10% until 30% THDv applied.
The distorted voltage signals were applied through Function 01 and THDv of 18.8%. In comparison with the sinusoidal conditions, in both cases the active power remained numerically equal. The apparent power had a small decrease, when applied to THDv of 18.8%. The non-active power also decreased in the previous condition.
However, an increase in the power factor and displacement power factor occurred when THDv of 18.8% was applied. This result was contrary to the other, where was used a CFL. The reason for this result was presented earlier. In other words, each load would behave differently when subjected to the same signal.
When Function 01 was applied, such parameters remained unchanged (except for THDi). The current value was similar in the three cases, even in the sinusoidal condition. Regarding THDi, when applied to Function 01 there was an increase of about 57% if compared to the sinusoidal condition and, when applied to THDv of 18.8%, there was also an increase, however, of a smaller amplitude (about 19%). Summaries of these parameters are presented in
Table 16.
Following the experiments for the condition of Function 01 (THDv of 18.8%), we proceeded to the next step, which was to apply Function 04 and THDv of 4.9%. The measured electrical quantities are given in
Table 17. In comparison with the sinusoidal conditions, in both cases, the active power remained numerically equal. The apparent power reduced when applied to THDv of 4.9%. The non-active power remained the same when applied to the THDv of 4.9%, but had an increase when applied to Function 04. However, an increase in the power factor occurred when THDv of 4.9% was applied. When Function 04 was applied, the power factor did not change. In relation to the displacement power factor, this parameter remained unchanged for both cases. The current value was similar in the three cases, even in the sinusoidal condition. In relation to THDi, when applied to Function 04 there was an increase of about 11%, when compared with the sinusoidal condition. However, when the THDv of 4.9% was applied, there was a reduction, if even compared with the sinusoidal condition (about 20%).
The last experiment with LED brand B bulb was the application of Function 13 of the programmable source, as well as the direct application of 24.5% of THDv.
Table 18 presents the results of the tests performed. In comparison with the sinusoidal conditions, in both cases, the active power remained numerically equal. The apparent power and the non-active power suffered reductions in both cases. In relation to the power factor and the displacement power factor, an increase occurred.
The current value was similar in the three cases, even in the sinusoidal condition. The total harmonic distortion in this parameter increased almost 65% in comparison with a sinusoidal condition, when applied to Function 13, and practically 53% when 24.5% of THDv was applied. If we compared THDi between Function 13 and THDv 24.5% applied directly, the difference was approximately 8%.
3.3. LED Brand C bulb 230 W
The distorted voltage signals were applied through Function 01 and THDv of 18.8%. In comparison with the sinusoidal conditions, in both cases, the active power and the apparent power remained numerically equal. The non-active power remained the same when applied to the THDv of 18.8%, but had a significant increase when applied to Function 01. Besides that, a decrease in the power factor occurred when Function 01 was applied.
In relation to the displacement power factor, the same remained unchanged for all three conditions. The current value was similar in the three cases, even in the sinusoidal condition. Regarding THDi, when applied to Function 01 there was an increase of about 240% when compared to the sinusoidal condition and, when applied to THDv of 18.8%, there was also an increase, however, of a smaller amplitude (about 131%). The summaries of these parameters are presented in
Table 19.
Following the experiments for the condition of Function 01 (THDv of 18.8%), we proceeded to the next step, which was to apply Function 04 and THDv of 4.9%. The measured electrical quantities are given in
Table 20.
In comparison with the sinusoidal conditions, the active and apparent powers suffered from small increases when Function 04 was applied. The non-active power increased in both cases. However, a decrease occurred in the power factor when applied to Function 04. In relation to the displacement power factor, it was reduced in both cases, if we compared with the sinusoidal condition. The current value was similar in the three cases, even in the sinusoidal condition. In relation to THDi, when applied to Function 04 there was an increase of about 149%, when compared with the sinusoidal condition. However, when the THDv of 4.9% was applied, this parameter remained practically equal to the value in the sinusoidal condition.
The last experiment with the LED Brand C bulb was the application of Function 13 of the programmable source, as well as the direct application of 24.5% of THDv.
Table 21 presents the results of the tests performed. In comparison with the sinusoidal conditions, in both cases, the active and apparent powers remained numerically equal. The non-active power increased in the two cases where the distortions (about 20% increase) were applied. In relation to the power factor and the displacement power factor, there was a sensitive decrease. The current value was similar in the three cases, even in the sinusoidal condition. The THDi increased around 210% with respect to the sinusoidal condition and the values resulted from the application of Function 13 and THDv of 24.5%.
Table 22 shows a qualitative analysis. For this, three scenarios were considered: if a parameter remained numerically the same, it was assigned the gray color, if a parameter improved, it was assigned a green color, and if a parameter got worse, it was assigned a red color. This was done for each load and each signal applied.
It is possible to note that the CFL had the worst performance among the three loads. In this case, only one parameter has improved (DPF when Function 01 was applied). Most of the parameters got worse. The LED bulb Brand B had the best performance. Most parameters remained numerically equal and a significant number improved. It is important to highlight that when THDv 4.9% was applied directly, THDi to this load decreased. The LED bulb Brand C had an intermediate performance. Its parameters remained numerically the same or significantly worsened. No parameter had improved.
Overall, this means that driver topology was the determining factor when this type of analysis was performed and, as seen in the literature review, it was clear that each load had a specific driver topology. Moreover, another interesting result was that voltage distortion had improved in some parameters. For instance, such as LED B, if we considered PF and DPF, which are used in some countries for reactive power billing, these parameters show a higher value than measured under sinusoidal conditions. On the other hand, and as expected, in most cases, the parameters had worsened and therefore there was a negative impact on the electrical networks, hence, measurement and billing systems.
4. Conclusions
This paper evaluated and quantified the effects of different levels and harmonic profiles of THDv on the electrical quantities of the three electronic loads. The analysis was based on extensive laboratory measurements, through an experimental setup, which combined three variables for the first time in an experiment: different THDv levels; among these levels, different harmonic profiles; and different loads. The results showed that, despite applying the same THDv level, the different harmonic profiles made the measured electrical quantities different. The results showed that low THDv levels (about 5%), for two loads analyzed (CFL and LED Brand C), the electrical quantities remained numerically the same or got worse. The CFL, when subjected to Function 01 (THDv 18.8%), had improved the DPF. This was the unique parameter that got improved considering the CFL. On the other hand, considering LED bulb Brand B, most parameters remained numerically equal and a significant number improved. This load had another interesting result. When it was subjected to THDv of 24.5%, considering both harmonic profiles, four parameters got improved (apparent and nonactive powers, power factor and displacement power factor); two parameters remained numerically the same (active power and current) and only one got worse (THDi). The other loads, for this THDv level, the parameters in most cases got worse, and the others remained numerically equal. The LED Brand C was the unique load for which none of the parameters got improved.
Quantitatively, the results showed a significant change among the parameters. For instance, considering the CFL, the non-active power (kVAr) increased around 67%, when Function 01 was applied—comparing when a sinusoidal signal was applied; PF had a significant reduction (around 42%) and DPF increased. When a low THDv level was applied (Function 04), PF reduced as well. In this case, the reduction was around 26%. It is worth to note that, for this case (PF), similar results were obtained when Function 13 was applied. To the LED Brand B, the non-active power (kVAr) decreased 33% when the THDv of 18.8% was applied (comparing with the sinusoidal condition). Similar results were found when 24.5% of THDv and Function 13 were applied. On the other hand, when Function 04 was applied, the non-active power increased around 33%. The THDi decreased until when a THDv of 10% was applied (from 14.1% in sinusoidal conditions to 11.0% with THDv of 10%) and started increasing after exceeding 10% until 30% of the THDv were applied (reaching a THDi equal 28.1%). Finally, considering the LED Brand C, regarding THDi, when Function 01 was applied, there was an increase of about 240% when compared to the sinusoidal condition and the non-active power increased 40%. Moreover, when Function 13 and the THDv of 24.5% were applied, the non-active power increased about 20% in both cases.
Therefore, it could be concluded that the effects of combination of the variables considered in this paper had a direct impact on the electrical energy billing, besides the effects on the electrical network. Another interesting result was that voltage distortion, considering different levels and harmonic profiles, improved some parameters. For instance, for LED B, if we considered PF and DPF, which are used in some countries for reactive power billing, these parameters show a higher value than measured under sinusoidal conditions. However, these effects are diverse and further works are required to better analyze them. Furthermore, it is clear that the results will depend on the applied signal characteristics, as well as each driver topology, in other words, of each load.
Finally, it is important to note that, in this paper, the loads were analyzed individually. However, for future work, it is interesting to consider the effects of the attenuation and diversity factors, as these factors will have effects on the electrical quantities recorded by the revenue meters and, hence, on the electrical energy billing. It is important to model more loads and analyze the measured electrical quantities, mainly under nonsinusoidal conditions, in order to discuss new ways for electrical energy billing, considering the real scenario with different types of loads, as well as different harmonic levels and profiles in the electrical networks.

 ,
, 


