Experimental Research of Transmissions on Electric Vehicles’ Energy Consumption
by
 and
and
Polychronis Spanoudakis
1,*, 
Nikolaos C. Tsourveloudis
1,
Lefteris Doitsidis
2 and
Emmanuel S. Karapidakis
3 
1
School of Production Engineering & Management, Technical University of Crete, 73100 Chania, Greece
2
Department of Electronic Engineering, School of Applied Sciences, Technological Educational Institute of Crete, 73133 Chania, Greece
3
Department of Electrical Engineering, School of Engineering, Technological Educational Institute of Crete, 71410 Heraklion, Greece
*
Author to whom correspondence should be addressed.
Energies 2019, 12(3), 388; https://doi.org/10.3390/en12030388
Submission received: 10 December 2018
/
Revised: 17 January 2019
/
Accepted: 22 January 2019
/
Published: 26 January 2019
(This article belongs to the Special Issue Alternative Sources of Energy Modeling and Automation)
Abstract
:The growth of electric vehicles share of total passenger-vehicle sales is evident and is expected to be a very big market segment by 2030. Range of travel and pricing are the most influencing factors that affect their gain in market share. As so, powertrain development is a key technology factor researched by the automotive industry. To explore, among others, how the energy consumption of zero emission vehicles is affected by different transmissions, we developed, built and installed a variety of them on a custom hydrogen fuel cell powered urban vehicle. In this work we present a comparison of the effect, on the energy consumption of the proposed testbed, of a prototype custom build 2-speed gearbox and a single stage transmission. Results presented show a reduction of the overall energy consumption with the use of the 2-speed gearbox, compared to single stage, as well as the effect of gear change speed, related to speed, in energy consumption. Finally, a correlation of experimental results using a custom build CVT is conducted compared to single stage transmission. A comparison to simulation results found in literature is performed for all the transmissions tested on road.
1. Introduction
There is an increasing demand for Electric Vehicles (EV). In 2017, 1.3 million units were purchased around the world. The aforementioned number corresponds to 1% of the total passenger-vehicle sales, and corresponds to a 57% increase from 2016 numbers [1]. Some of the biggest original equipment manufacturers (OEMs) have announced the introduction of more than 100 original models powered by an electric motor by 2024, while the total share of electric vehicles is estimated to reach 30–35% in major markets, and 20–25% globally by 2030. EVs market share will be boosted by their ability to reach higher ranges and their target to increase design efficiency and reduce manufacturing cost to become affordable to more customer segments. Currently, after extended testing in different types of EVs, the average range is more than 300 Km, and has surpassed the expectation of the largest customer segments, which combined with the current (reduced) price tag in EVs, shows the increased potential of the aforementioned market.
To lower the fuel consumption and increase the autonomy, different types of engines and power transmission components are investigated. Currently the automotive manufacturers are focusing either in new or in optimized powertrain systems that can achieve better fuel consumption. These types of designs are developed not only for internal combustion engines but also for the case of hybrid/electric cars [2].
The majority of production vehicles use conventional Manual Transmissions (MTs) or Automatic Transmissions (ATs), while a viable alternative are the Continuously Variable Transmissions (CVTs) and infinitely variable transmissions. A detailed study of their characteristics, including but not limited to their efficiency, torque transfer and applicability is presented in [3,4,5].
The torque characteristic is the main advantage of an electric motor, since it can provide the maximum value of the available torque from completely stopped up to relatively low speeds, and then it is proportional to the maximum power as the motor’s speed is increasing [6]. To exploit the aforementioned advantage, most of the commercially available EVs are using powertrains which are directly connected to the driving wheels via a single reduction ratio, having several competitive advantages [3].
However, gearbox use can be a solution in order to meet the design requirements of vehicle acceleration and maximum speed, where high-performance traction motor and batteries are required. Thus, a 2-speed or even an n-speed gearbox may be installed to increase the available wheel torque, to reduce acceleration times and increase the achievable road grade, whilst prompting the power source to operate in a higher efficiency region during drive cycles. A multiple-speed transmission adopted for an electric drivetrain has energy consumption benefits over a single-speed equivalent [7]. There are two main advantages that cope with that. When using a two-speed transmission the first gear ratio can be chosen to increase the low speed torque to improve acceleration and increase the achievable road grade, whereas the second gear ratio can be reduced to extend the operating vehicle speed range. The second major advantage from adopting a multiple speed transmission is that the drivetrain can theoretically operate in a higher efficiency region for a larger portion of a driving cycle [6].
Current state-of-the-art on gearbox or alternative transmissions use on electric vehicles (EVs) is found in [8,9,10,11,12] including a vast number of simulation based comparisons using 2-speed versus single speed gearbox or CVT’s use [6,7,8,13,14,15,16,17]. In [18] different electric drivetrain configurations were discussed along with the implications of installing a multiple speed transmission in a fully electric drivetrain. In [19] a vehicle model was developed consisting of physical models of the components considering the moments of inertia, drag torques and efficiency maps which accounted for the variation on temperature (specifically the electric motor). Furthermore, an optimisation of the gear ratios for both transmissions and shift points for the two-speed was undertaken. The two-speed vehicle evidently operates in the high efficiency region for a larger portion of the driving cycle giving rise to a reduction in energy consumption. Specifically, it was found that on flat ground above 35 km/h, the two-speed is saving energy being in second gear as opposed to first gear so spends the majority of the driving cycle in second gear. The authors also compared the two drivetrains with the same electric motor and found a 5–10% energy consumption improvement in favour of the two-speed system.
In [20] the authors went on to analyse two-speed, three-speed and four-speed drivetrains with gear ratios selected based on the results of the CVT gear ratio optimisation. The results show a marked improvement over the single-speed drivetrain by using a multiple-speed transmission with energy consumption gains ranging from 4.5 % to 11 % over different driving cycles. It is evident that further gains can be made by adopting a CVT, however, the marginal gains over the four-speed transmission would in fact be lost in the additional transmission losses between the two systems. Finally, some concept gearbox prototypes targeting mostly EVs use are already presented in the market, such as those by Vocis/Oerlikon Graziano, Antonov and Kreisler Electric [21,22,23].
According to the above, there is limited research on real on road tests, in order to identify if gearbox use can provide a feasible solution towards reduced energy consumption, as also to define the effects of gear change. As already mentioned, to the best of our knowledge such research results have been only based in simulation results. In the proposed work we present a comparative analysis of a custom 2-speed gearbox and a flat belt driven CVT, developed by our research team with a single stage transmission. Energy consumption and different gear change speed effects on an urban electric vehicle are presented, based on road tests experimental results and comparisons. These results are also used as an evaluation tool compared to literature simulation results.
The rest of the manuscript is organised as follows, in Section 2 the experimental set-up is presented including the detailed vehicle specifications, the description of the powertrain and the drivetrain as well as the description of the on the road experimental procedure and set-up. In Section 3 we describe in detail the experiments conducted with the different configurations and we provide a comparison between the different configurations. Finally, in Section 4 we conclude with some key findings and discussion for future research.
2. Experimental Set-Up
2.1. Vehicle Specifications
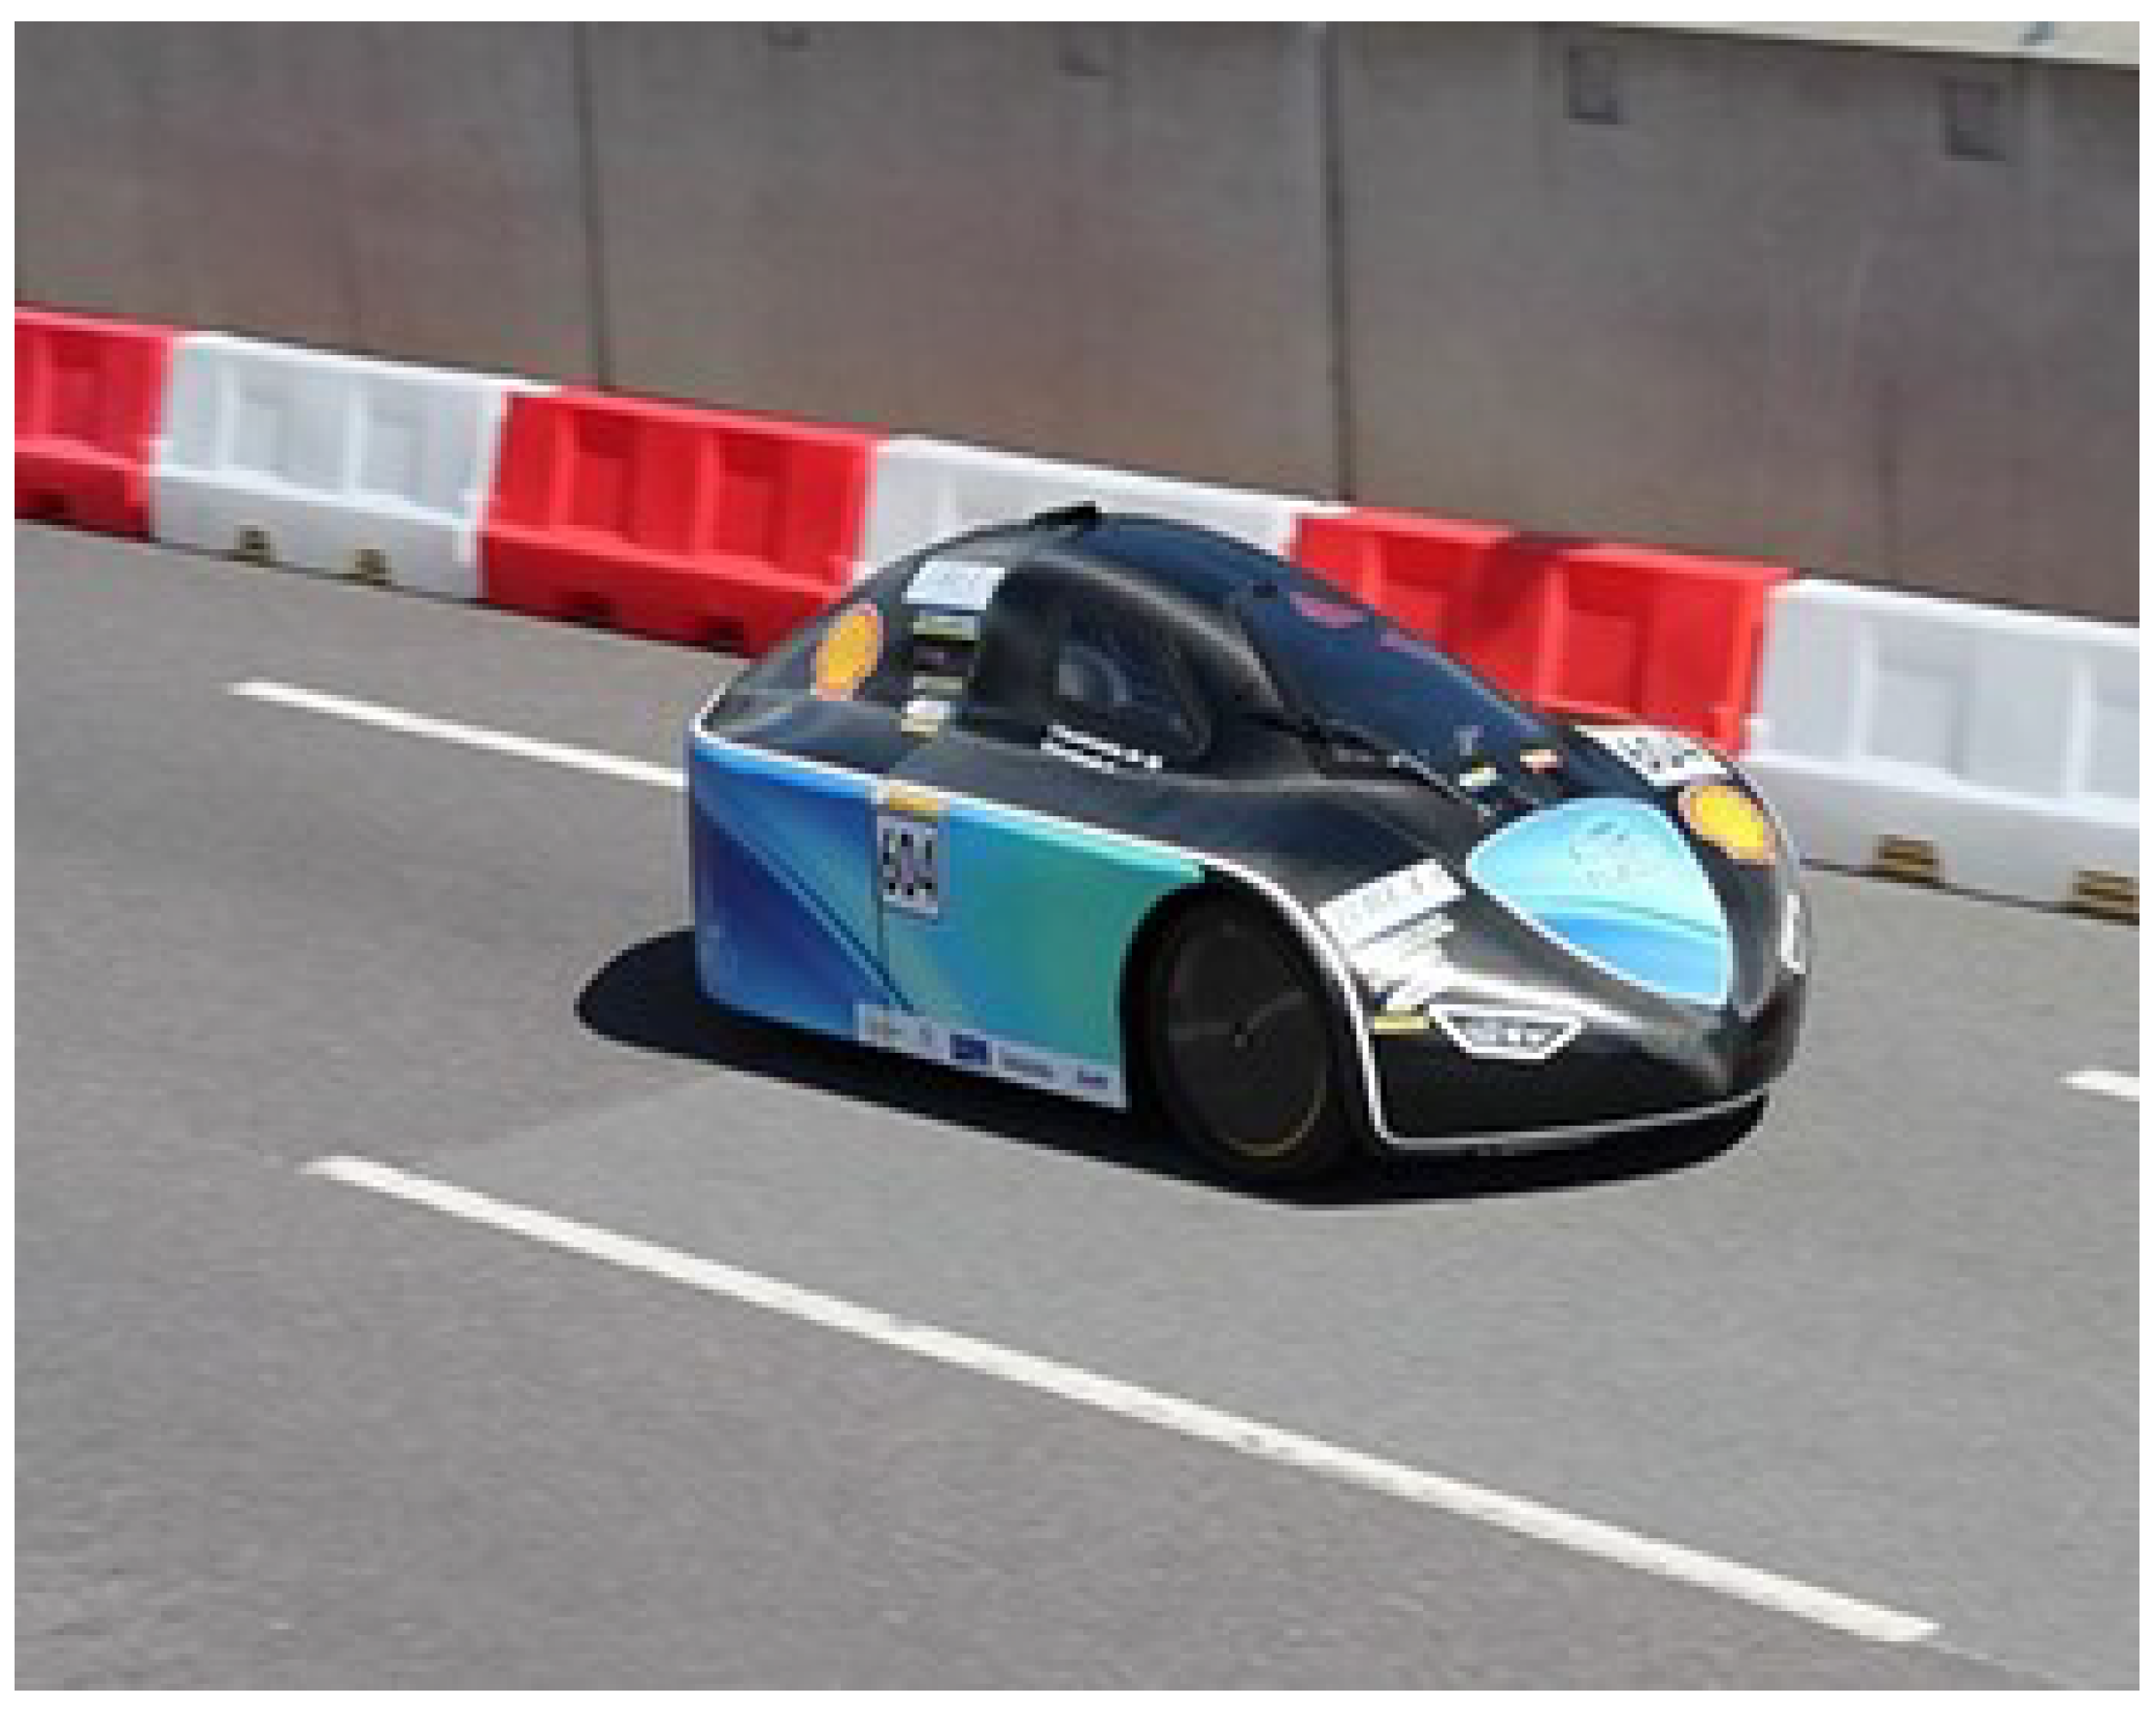
For the evaluation of the proposed system, we conducted tests using realistic conditions. Our testbed was the custom build urban vehicle ER16 (Figure 1). The powertrain is an electric motor which uses as a power source an fuel cell. The drivetrain (standard transmission) is composed from a single-stage geared transmission with ratio 10:1. The main technical characteristics of the vehicle are presented at Table 1.
2.2. Powertrain and Drivetrain Setup
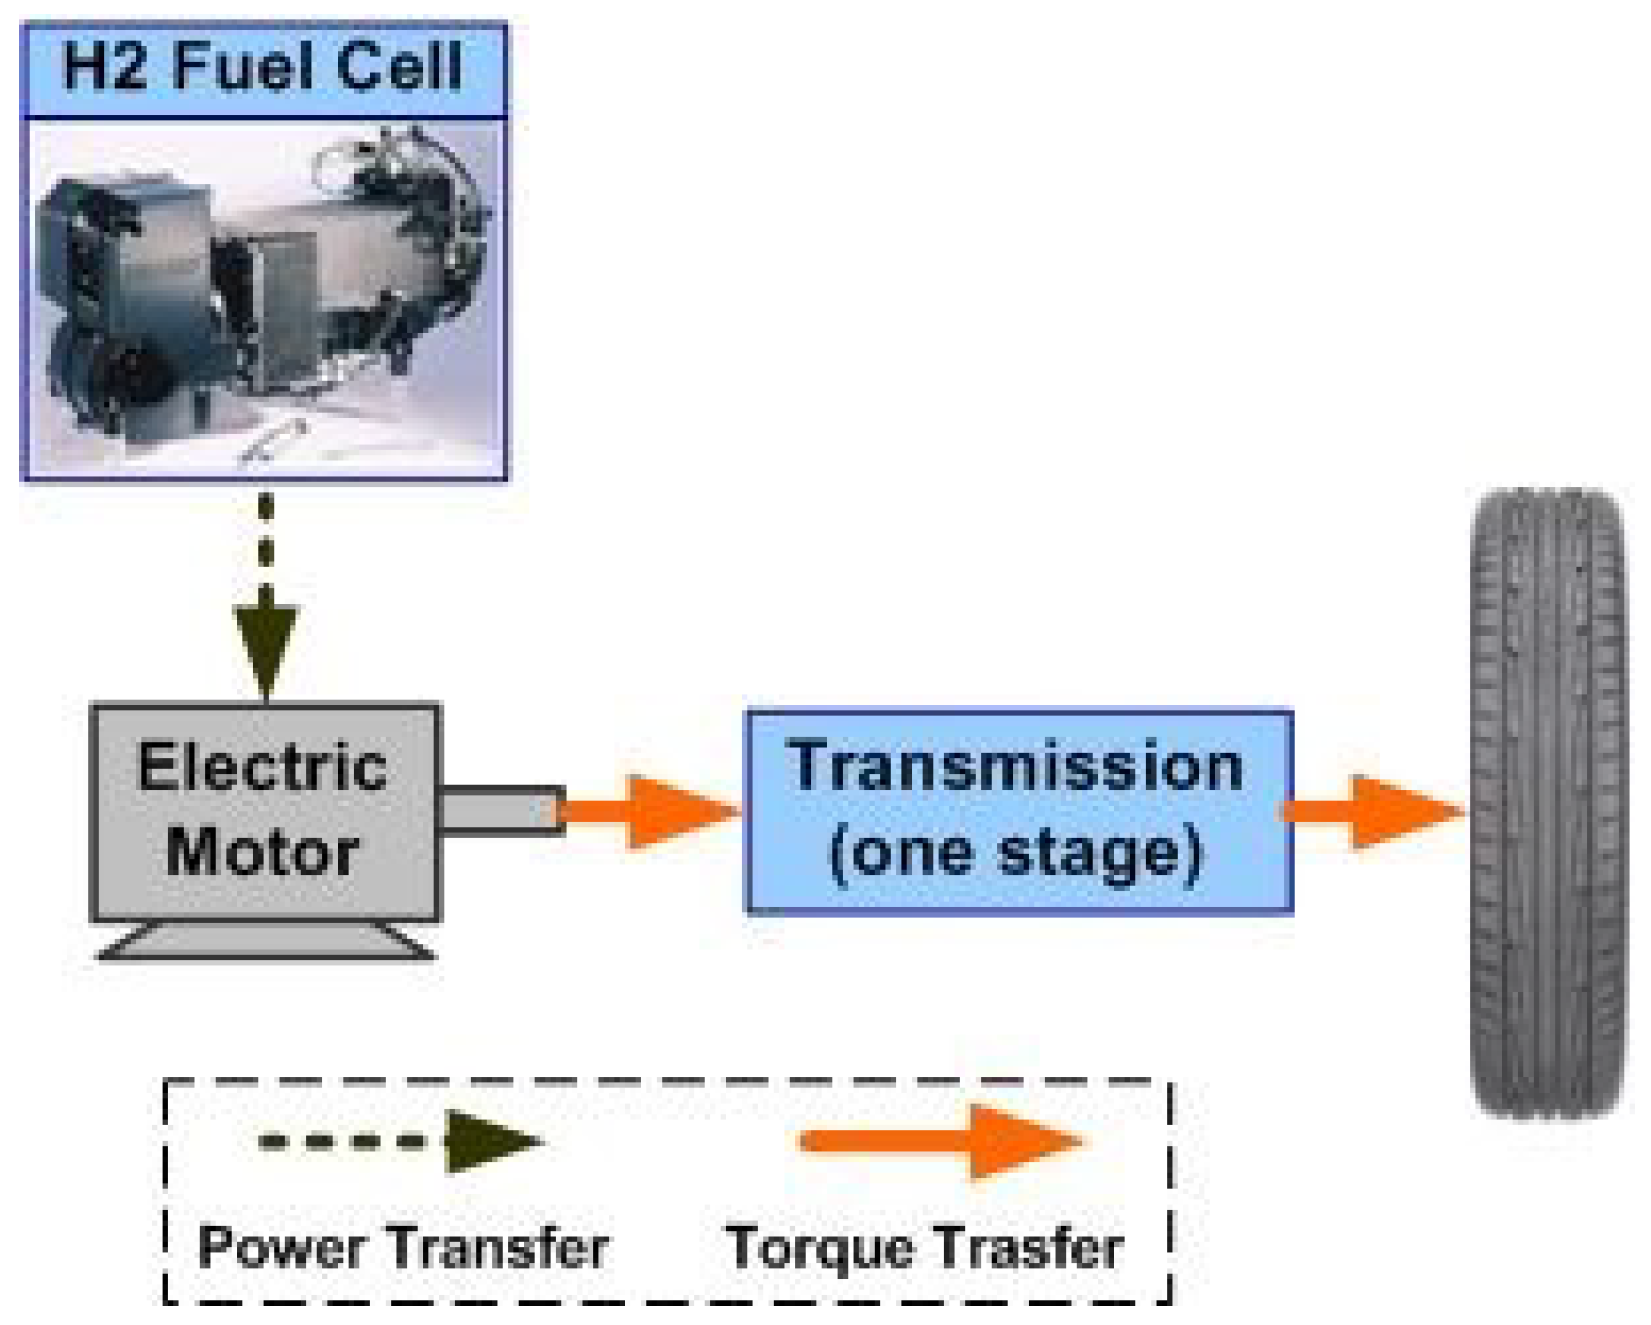
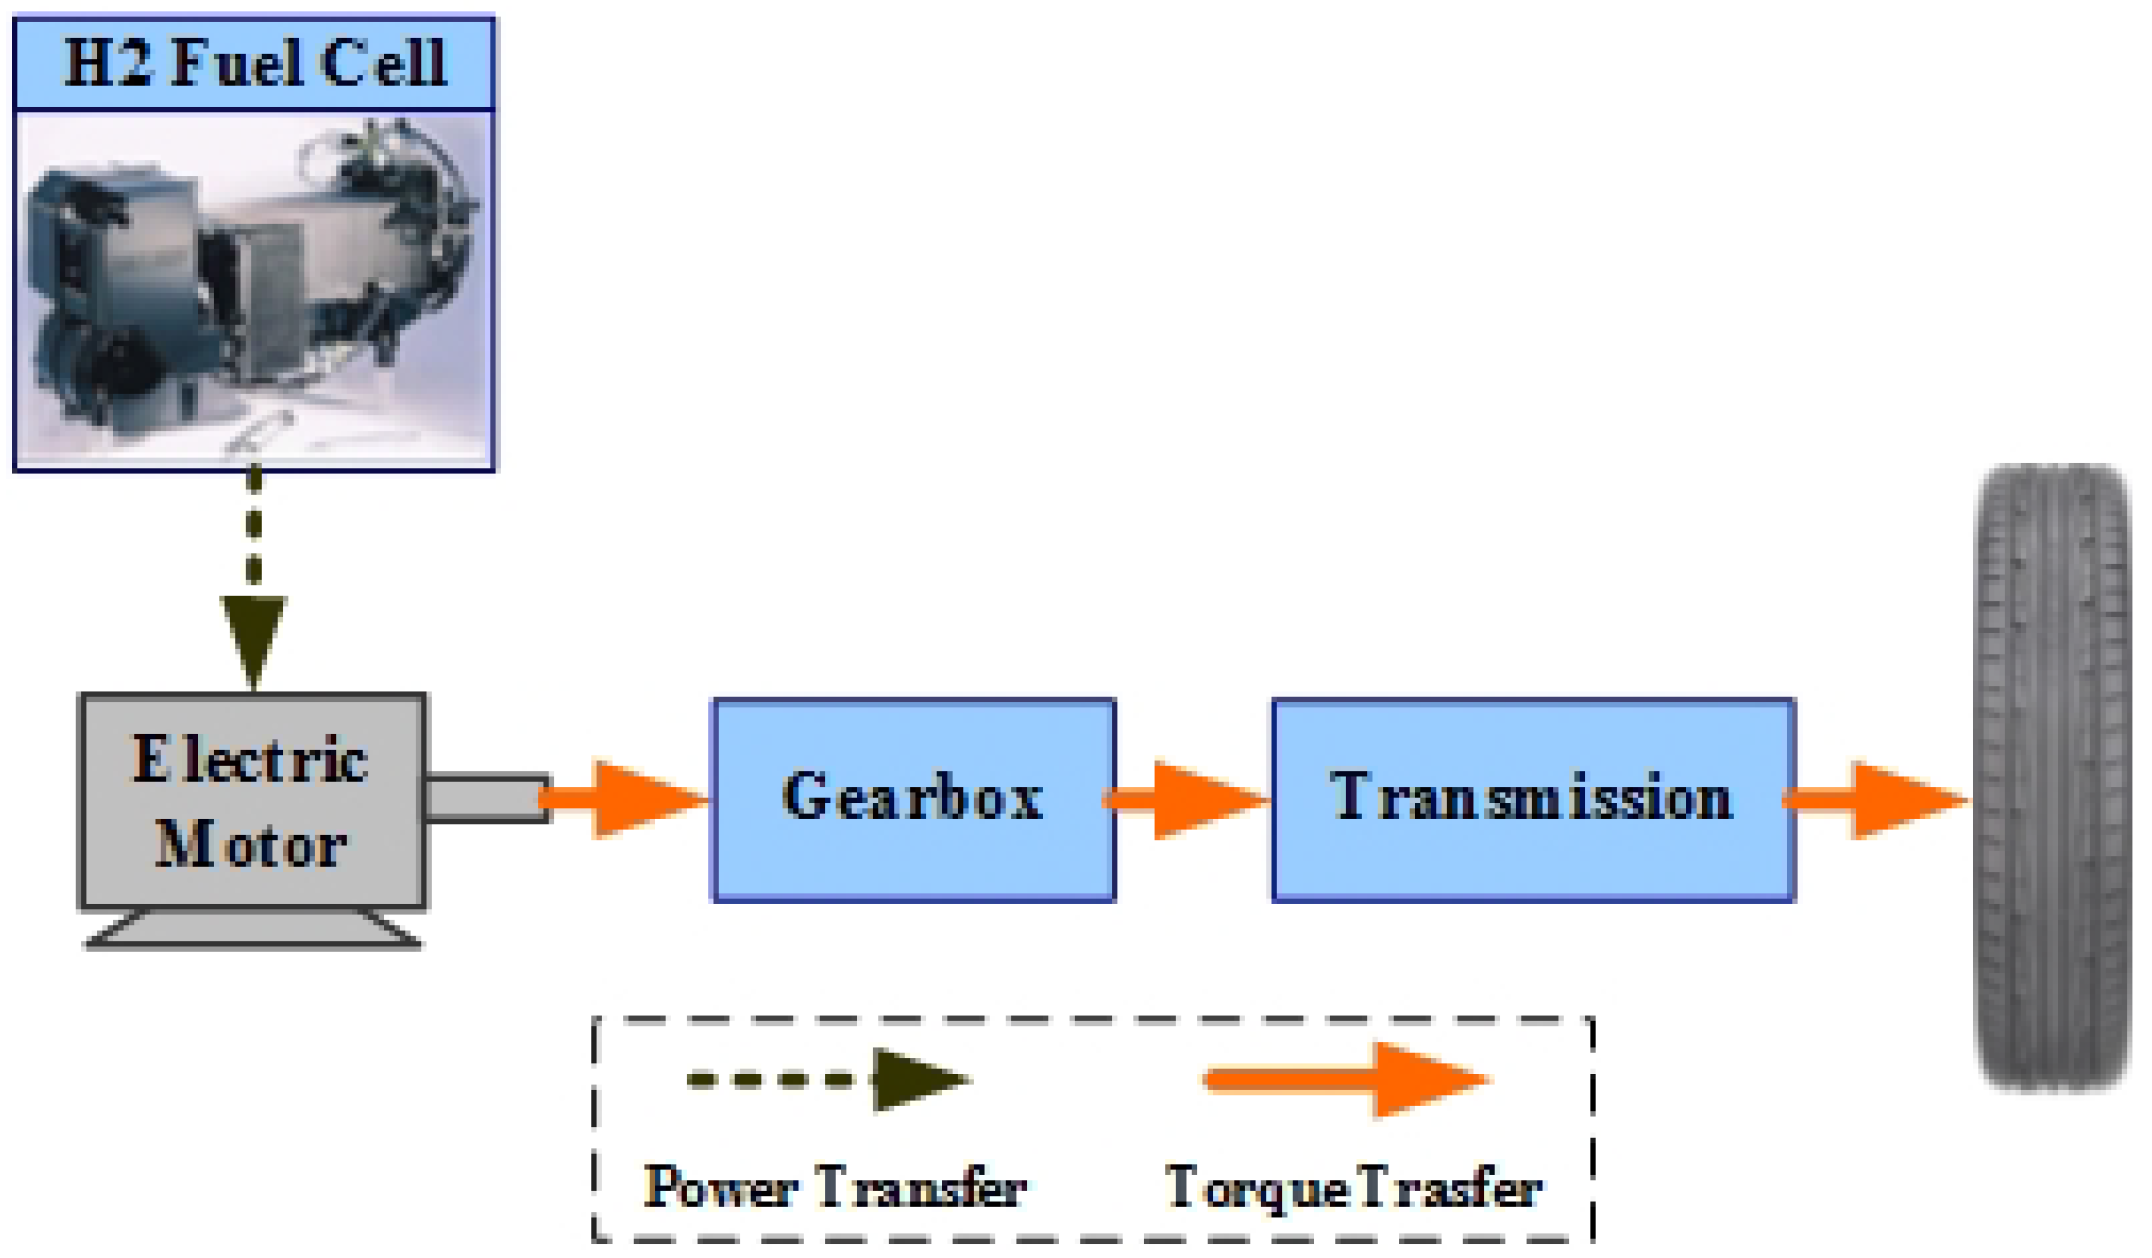
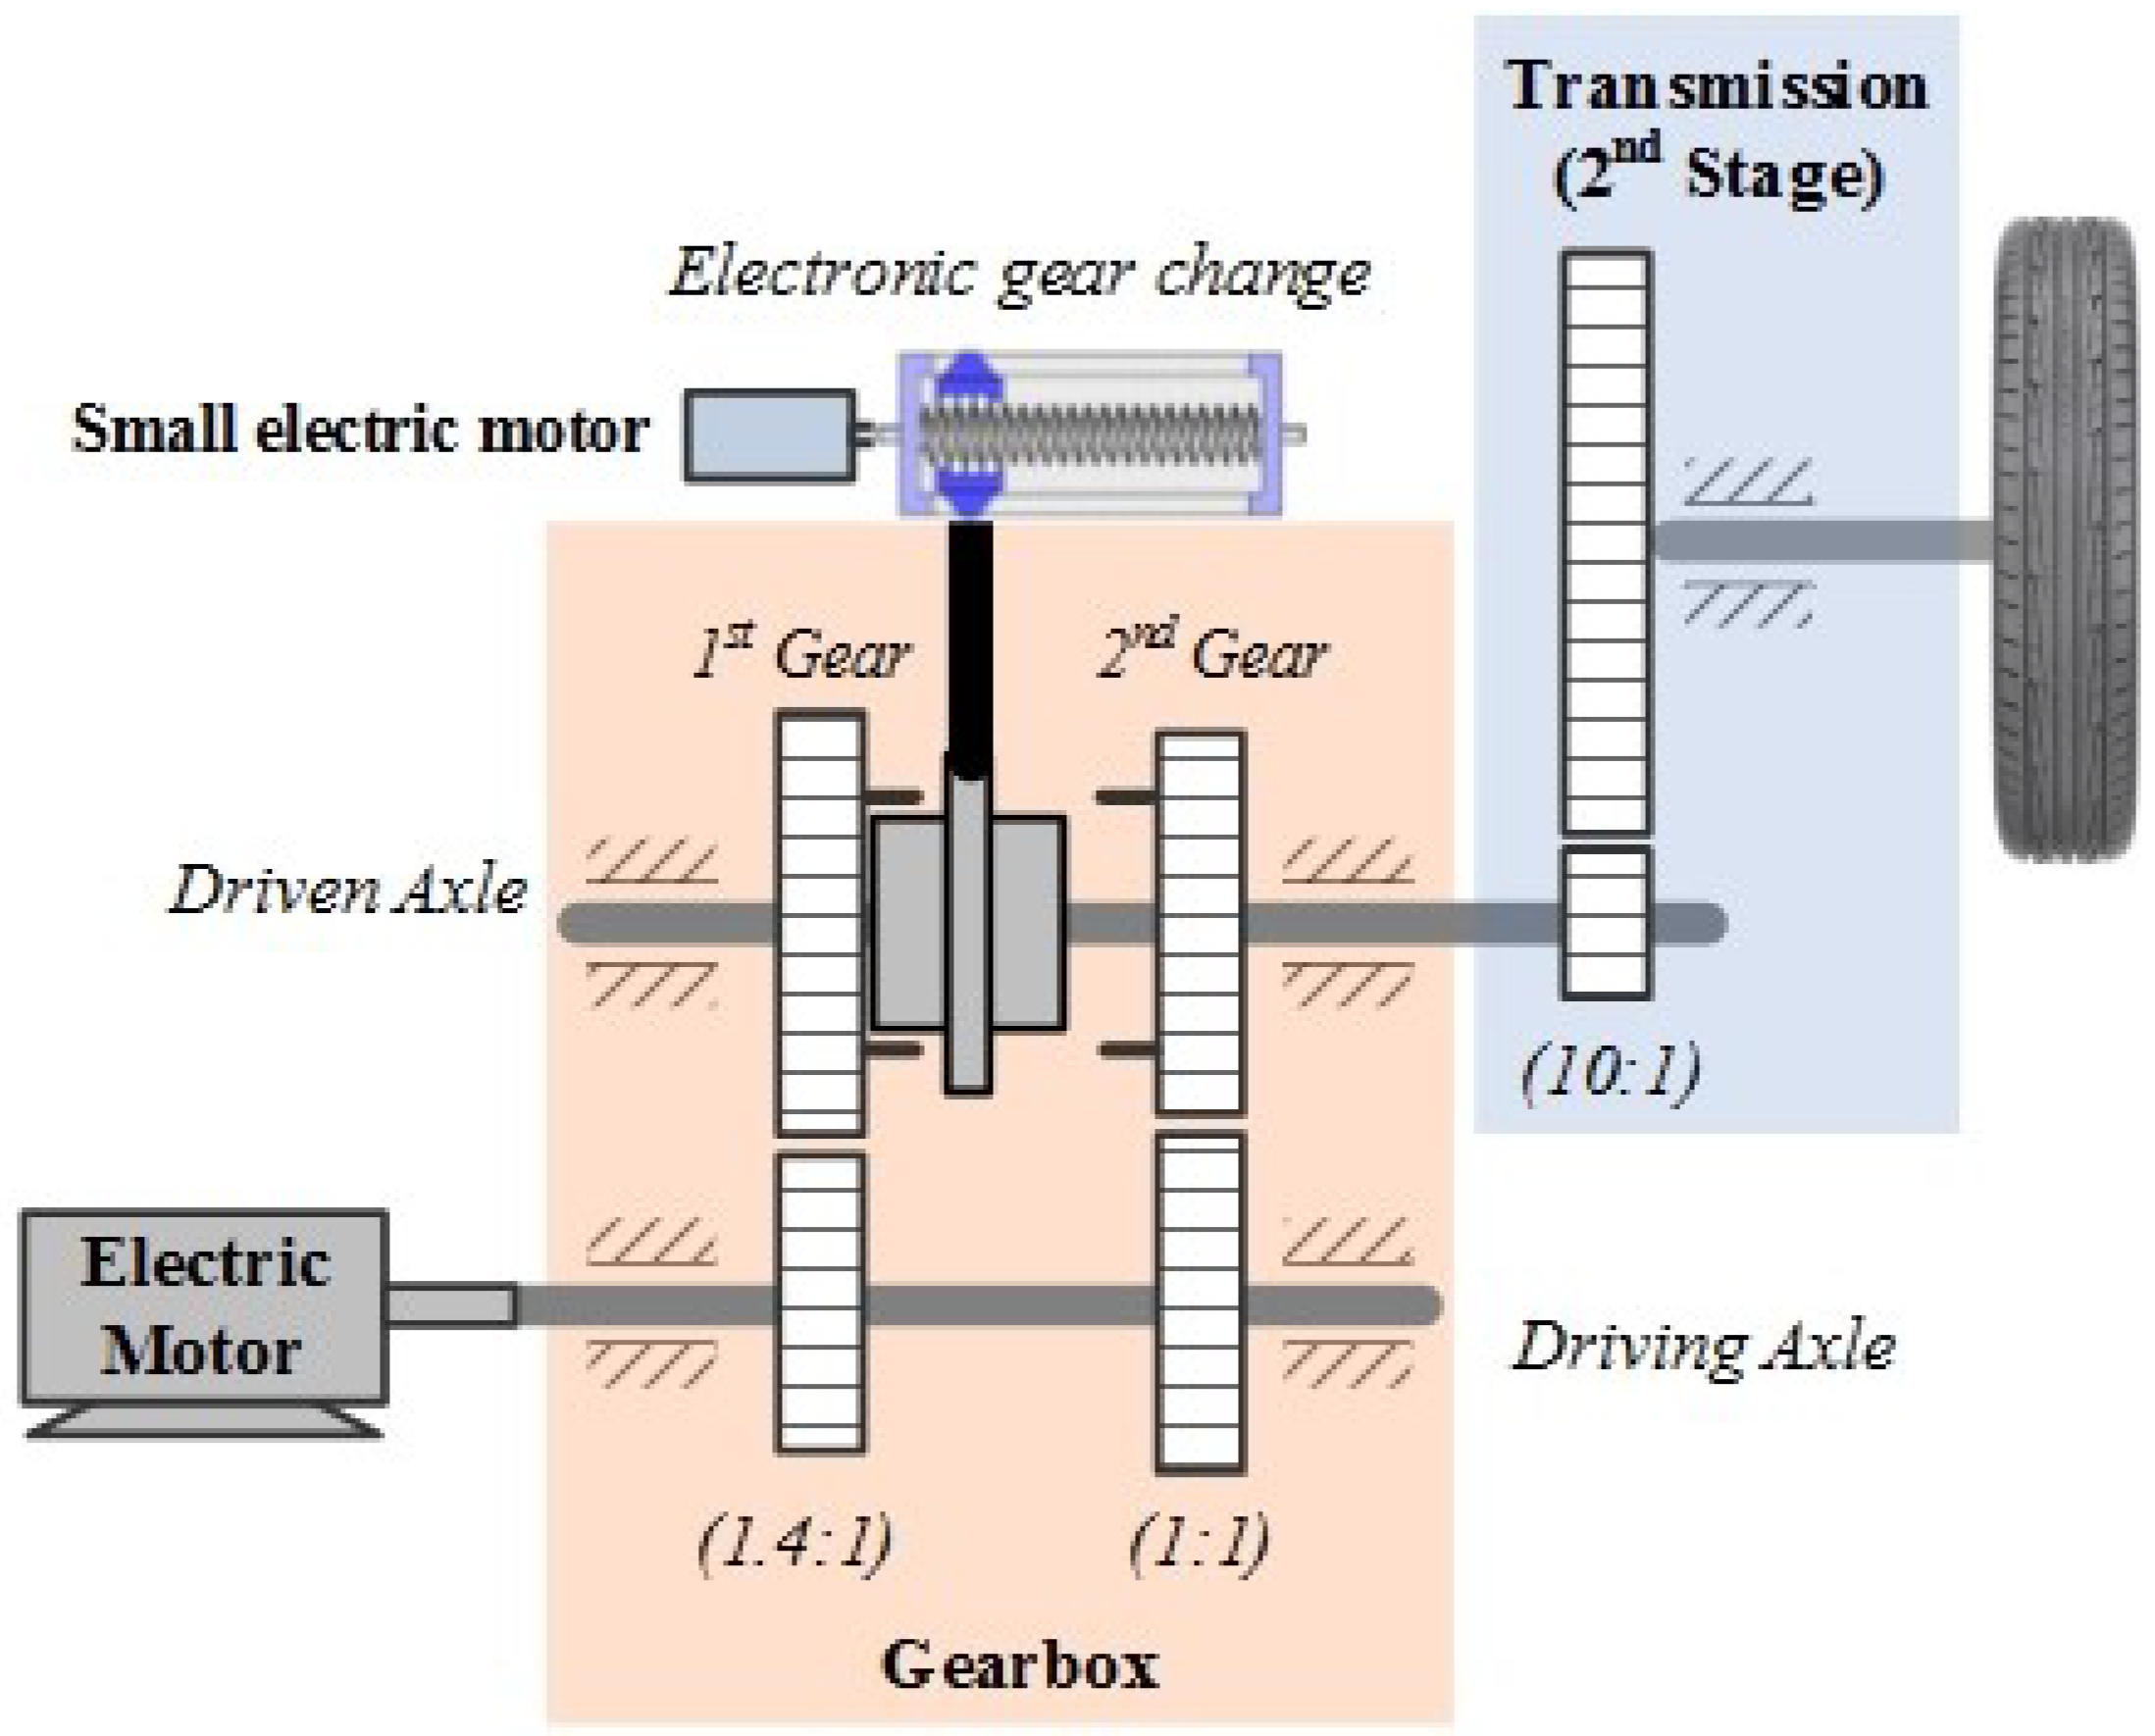
Two different powertrain configurations were tested, (i) a single-stage transmission (Figure 2) and (ii) a 2-speed change gearbox (Figure 3). In both cases the electric motor is powered by a hydrogen fuel cell using at 200 bar. In the first case the transmission system is positioned between the motor and the wheel so that it can provide the needed torque and rpm, and works as a final transmission (transmission ratio 10:1). In the second case, with the installation of the system a two-stage transmission system occurs, while the rest of the powertrain remains unchanged. The second stage (final transmission) is kept exactly the same providing a 10:1 ratio. The first stage (gearbox) provides a gear change with ratios 1.4:1 and 1:1 respectively. Thus, the total transmission ratios are 14:1 (1st gear) and 10:1 (2nd gear), which are mostly setup and used as launch and cruise vehicle driving modes.
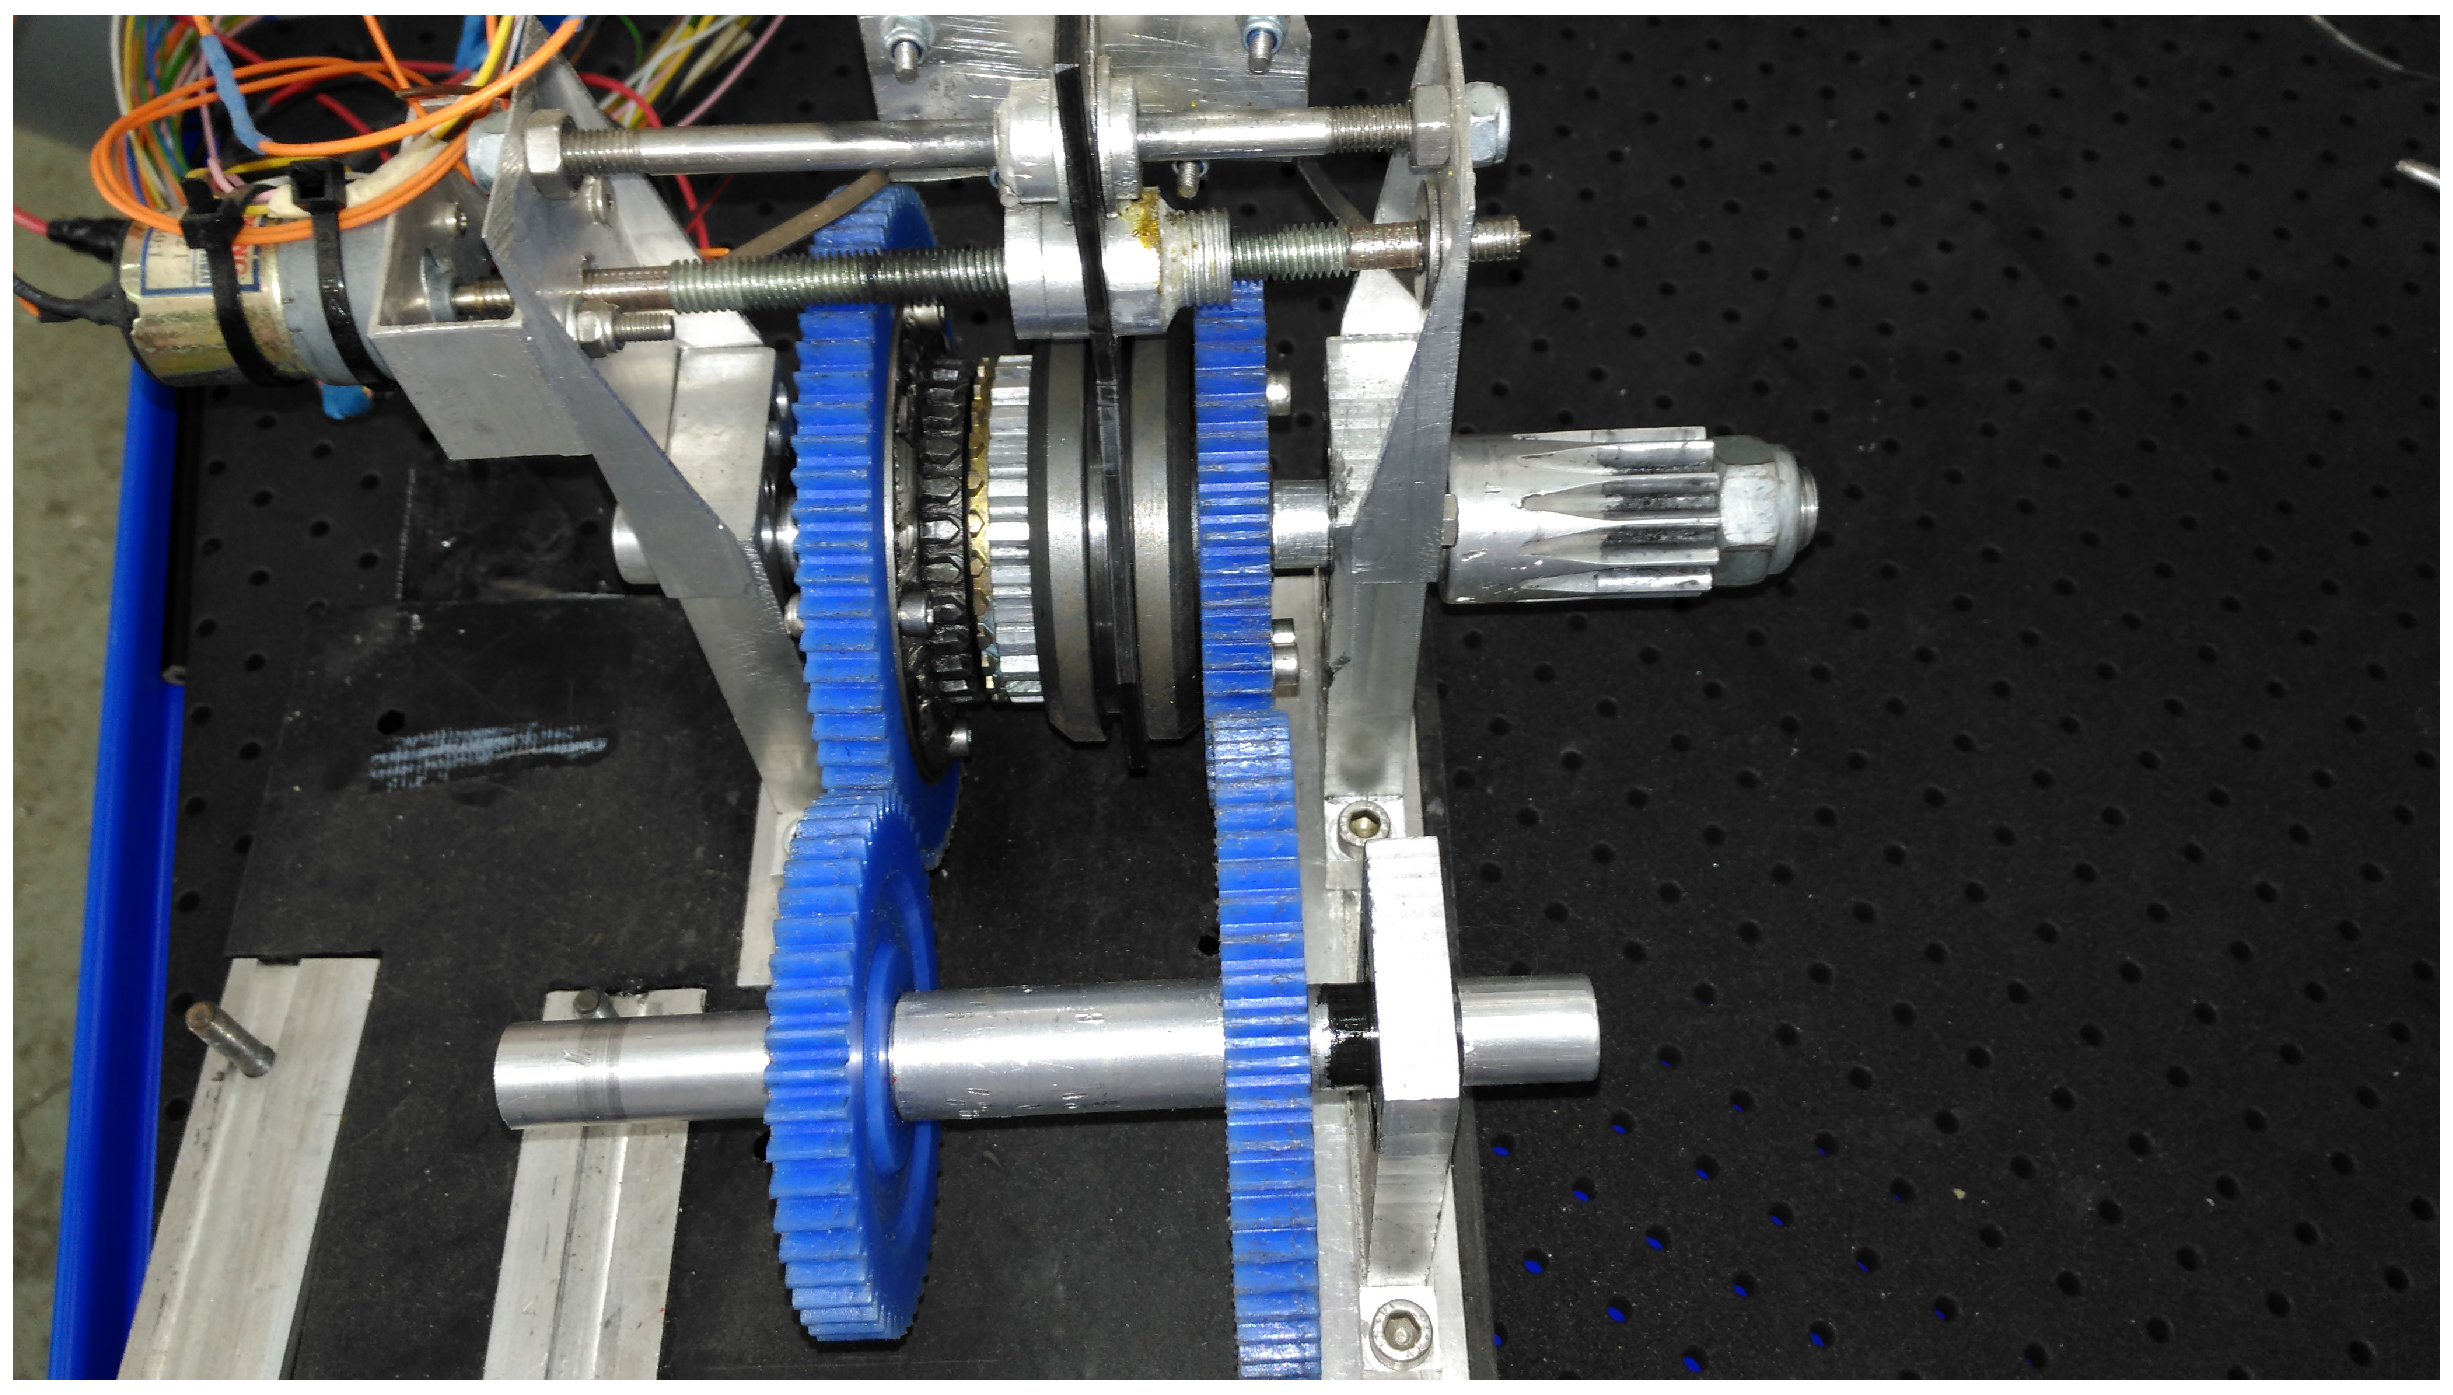
The first stage of the transmission presented is custom built for the configuration and characteristics of the specific testbed vehicle. It is the second version of such a gearbox developed by our research team. The first, introduced in 2014, was integrated in the ER14 vehicle weighing 2.3 Kg and used the exact same gear ratios [24]. The version presented here has been redeveloped, providing higher gear change capabilities, better efficiency and lower weight (Figure 4). A major improvement was in the shifting mechanism providing synchronization capabilities as used in production cars. The synchromesh system consists of two straight-cut gear sets that are constantly “meshed” together and a dog clutch is used for changing gears. Synchro-rings are used in addition to the dog clutch to closely match the rotational speeds of the two sides of the transmission before making a full mechanical engagement. An electronic shifting control is also installed, using a small electric motor to provide linear movement of the dog-clutch to shift between gears, commanded by a switch on driver’s steering wheel. The speed of shifting (related to electric motor rpm) was experimentally proven by testing, so an adequate and efficient operation is accomplished in various speeds of operation. The total gearbox weight is measured at 1.9 Kg, using aluminum alloy material (6063T6) for most parts, except the gears, which are made from plastic.
As mentioned, the use of this gearbox mainly targets lower energy consumption during launch as well as electric motor operation at a higher efficiency region. The construction of the gearbox is based on two gear pairs attached on two parallel axles (Figure 4). The gears are fixed on the first axle (driving axle) and are rotated by the electric motor. On the second axle (driven axle), every gear has a bearing installed that provides a free rotation on the axle. Using the synchronizing mechanism placed between the gears of the second axle, we can change from one gear ratio (1st gear) to another (2nd gear). When no gear is selected, both gears of the second axle can rotate free and thus no power is transferred to the second transmission stage and to the wheel. If the first or second gear is selected by the synchronizing mechanism, then power is transferred to the second stage of the transmission using the corresponding gear ratio. In Figure 5 the custom build gearbox is presented as installed on the prototype vehicle. Using the 2-speed change transmission, the different gear change points occur on different vehicle speeds but for the exactly same gear ratios. Therefore, the main effect is gear change point (speed) contribution, which corresponds to altered motor rpm operation and this leads to a reduced power request.
The efficiency map of the electric motor was not provided by the manufacturer. Therefore, series of experimental testing were conducted in a custom testbed, in order to measure electric motor efficiency at specific loads [12]. In our case, testing targeted vehicle operation at the speed of 25 Km/h, where power demand for the prototype vehicle is 200 W. The custom testbed setup includes: a rotary torque transducer connected to the electric motor axle (input) and to a hydraulic disc brake (output), as well as amperometer and voltmeter measurements from the motor input. The data recorded are:
- Output data from the torque transducer (Motor speed (rpm), Torque (Nm) and Power (Kw)).
- Input data from the power measurements in the input of the electric motor.
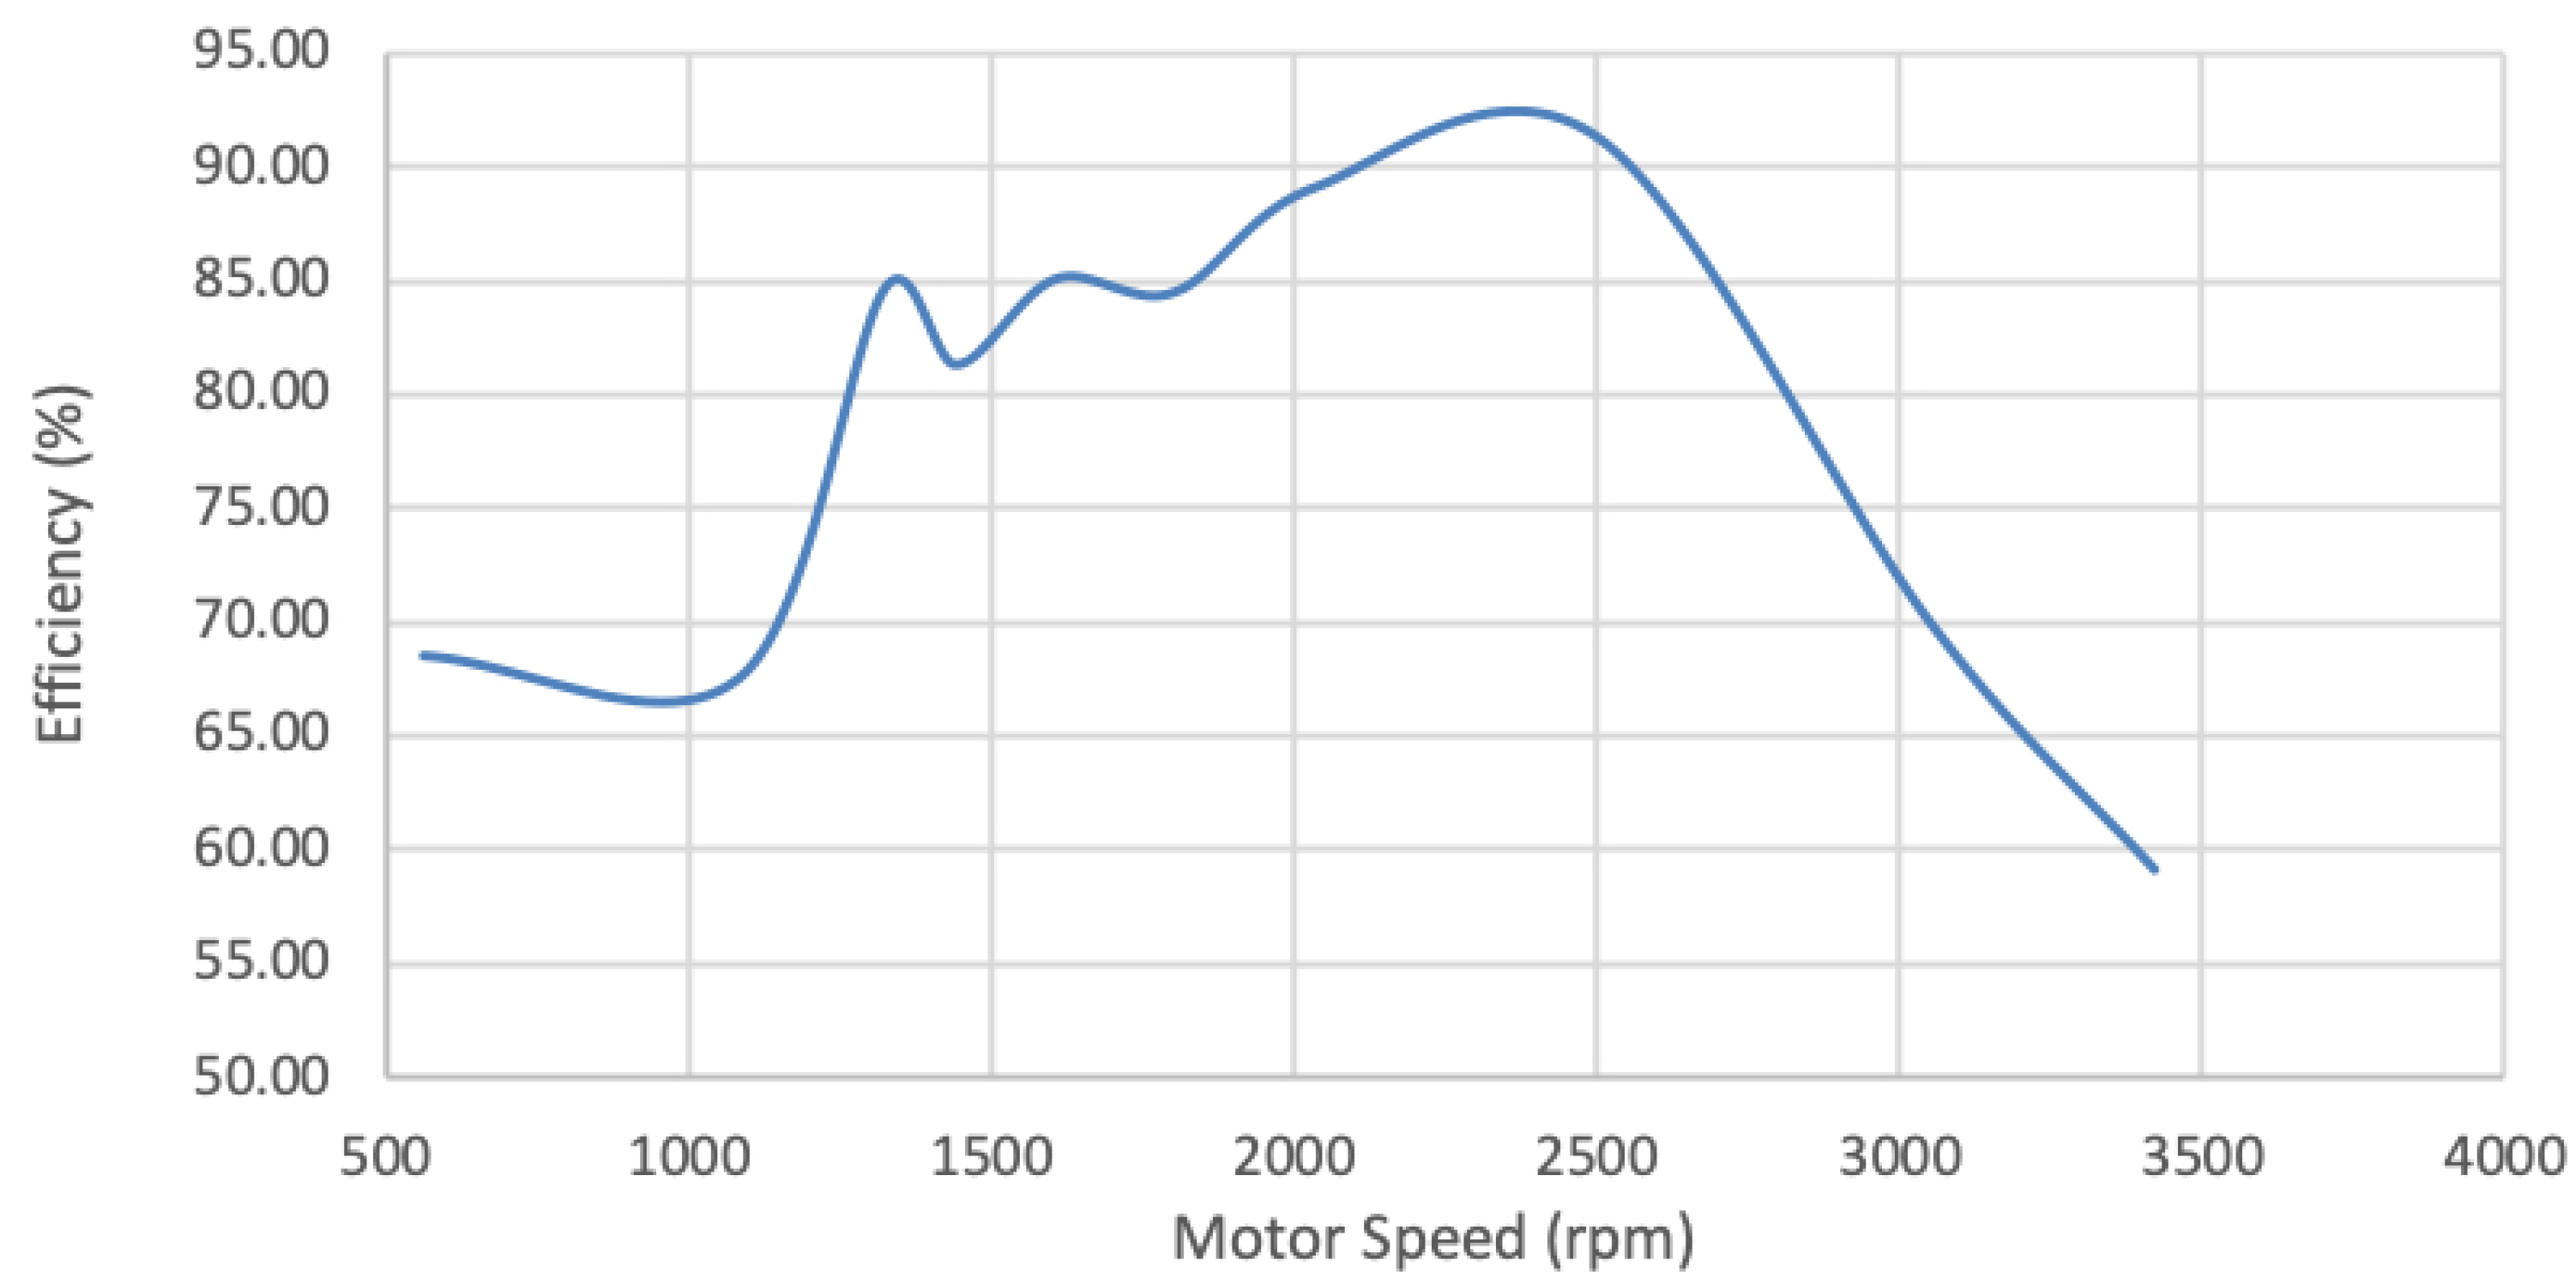
In all measurements, external load is set to 200 W by applying pressure to the hydraulic disc brake and data are recorder every 500 rpm. The results of the motor’s efficiency are presented in Figure 6. As shown, maximum motor efficiency (91.3%) is reached at 2500 rpm. In addition, an optimal rpm range of motor operation is from 2300 to 2500 rpm, where efficiency exceeds 90%.
Motor torque measurements versus motor speed are also presented in Figure 7. The maximum torque found is 4 Nm and drops as motor speed raises. Measurements recorded for a motor speed up to 3500 rpm due to testbed limitations for adequate results.
Regarding the efficiency of the drivetrain, several measurements and assumptions were made. Specifically, the single-stage transmission, consisting of one gear pair, is assumed to have an efficiency of 95%. This efficiency is also used as final transmission efficiency when the 2-speed gearbox or CVT is installed. For the 2-speed transmission, the efficiency is assumed at 95%. Thus in this case a final drivetrain efficiency of 90% is obtained.
For the CVT, extensive experimental testing has been conducted in order to measure the efficiency on a laboratory testbed [8]. The testbed setup is identical to the one used for motor efficiency measurements. Its main components are: (a) a rotary torque transducer measuring motor speed (rpm), Torque (Nm) and Power (Kw), (b) a hydraulic disc brake to apply external loads, (c) a brake handle, to regulate torque, (d) a brushless electric motor providing the input torque, (e) throttle adjustment for motor speed calibration and (f) a laptop for data recording. Measurements are conducted in respect to electric motor maximum torque and best efficiency speed (2500 rpm). Efficiency ranges to a maximum of 93%. As expected, best efficiency is found at higher motor speeds (2500 rpm). In this case the final drivetrain efficiency is calculated as 88.4%.
2.3. On Road Experimental Setup
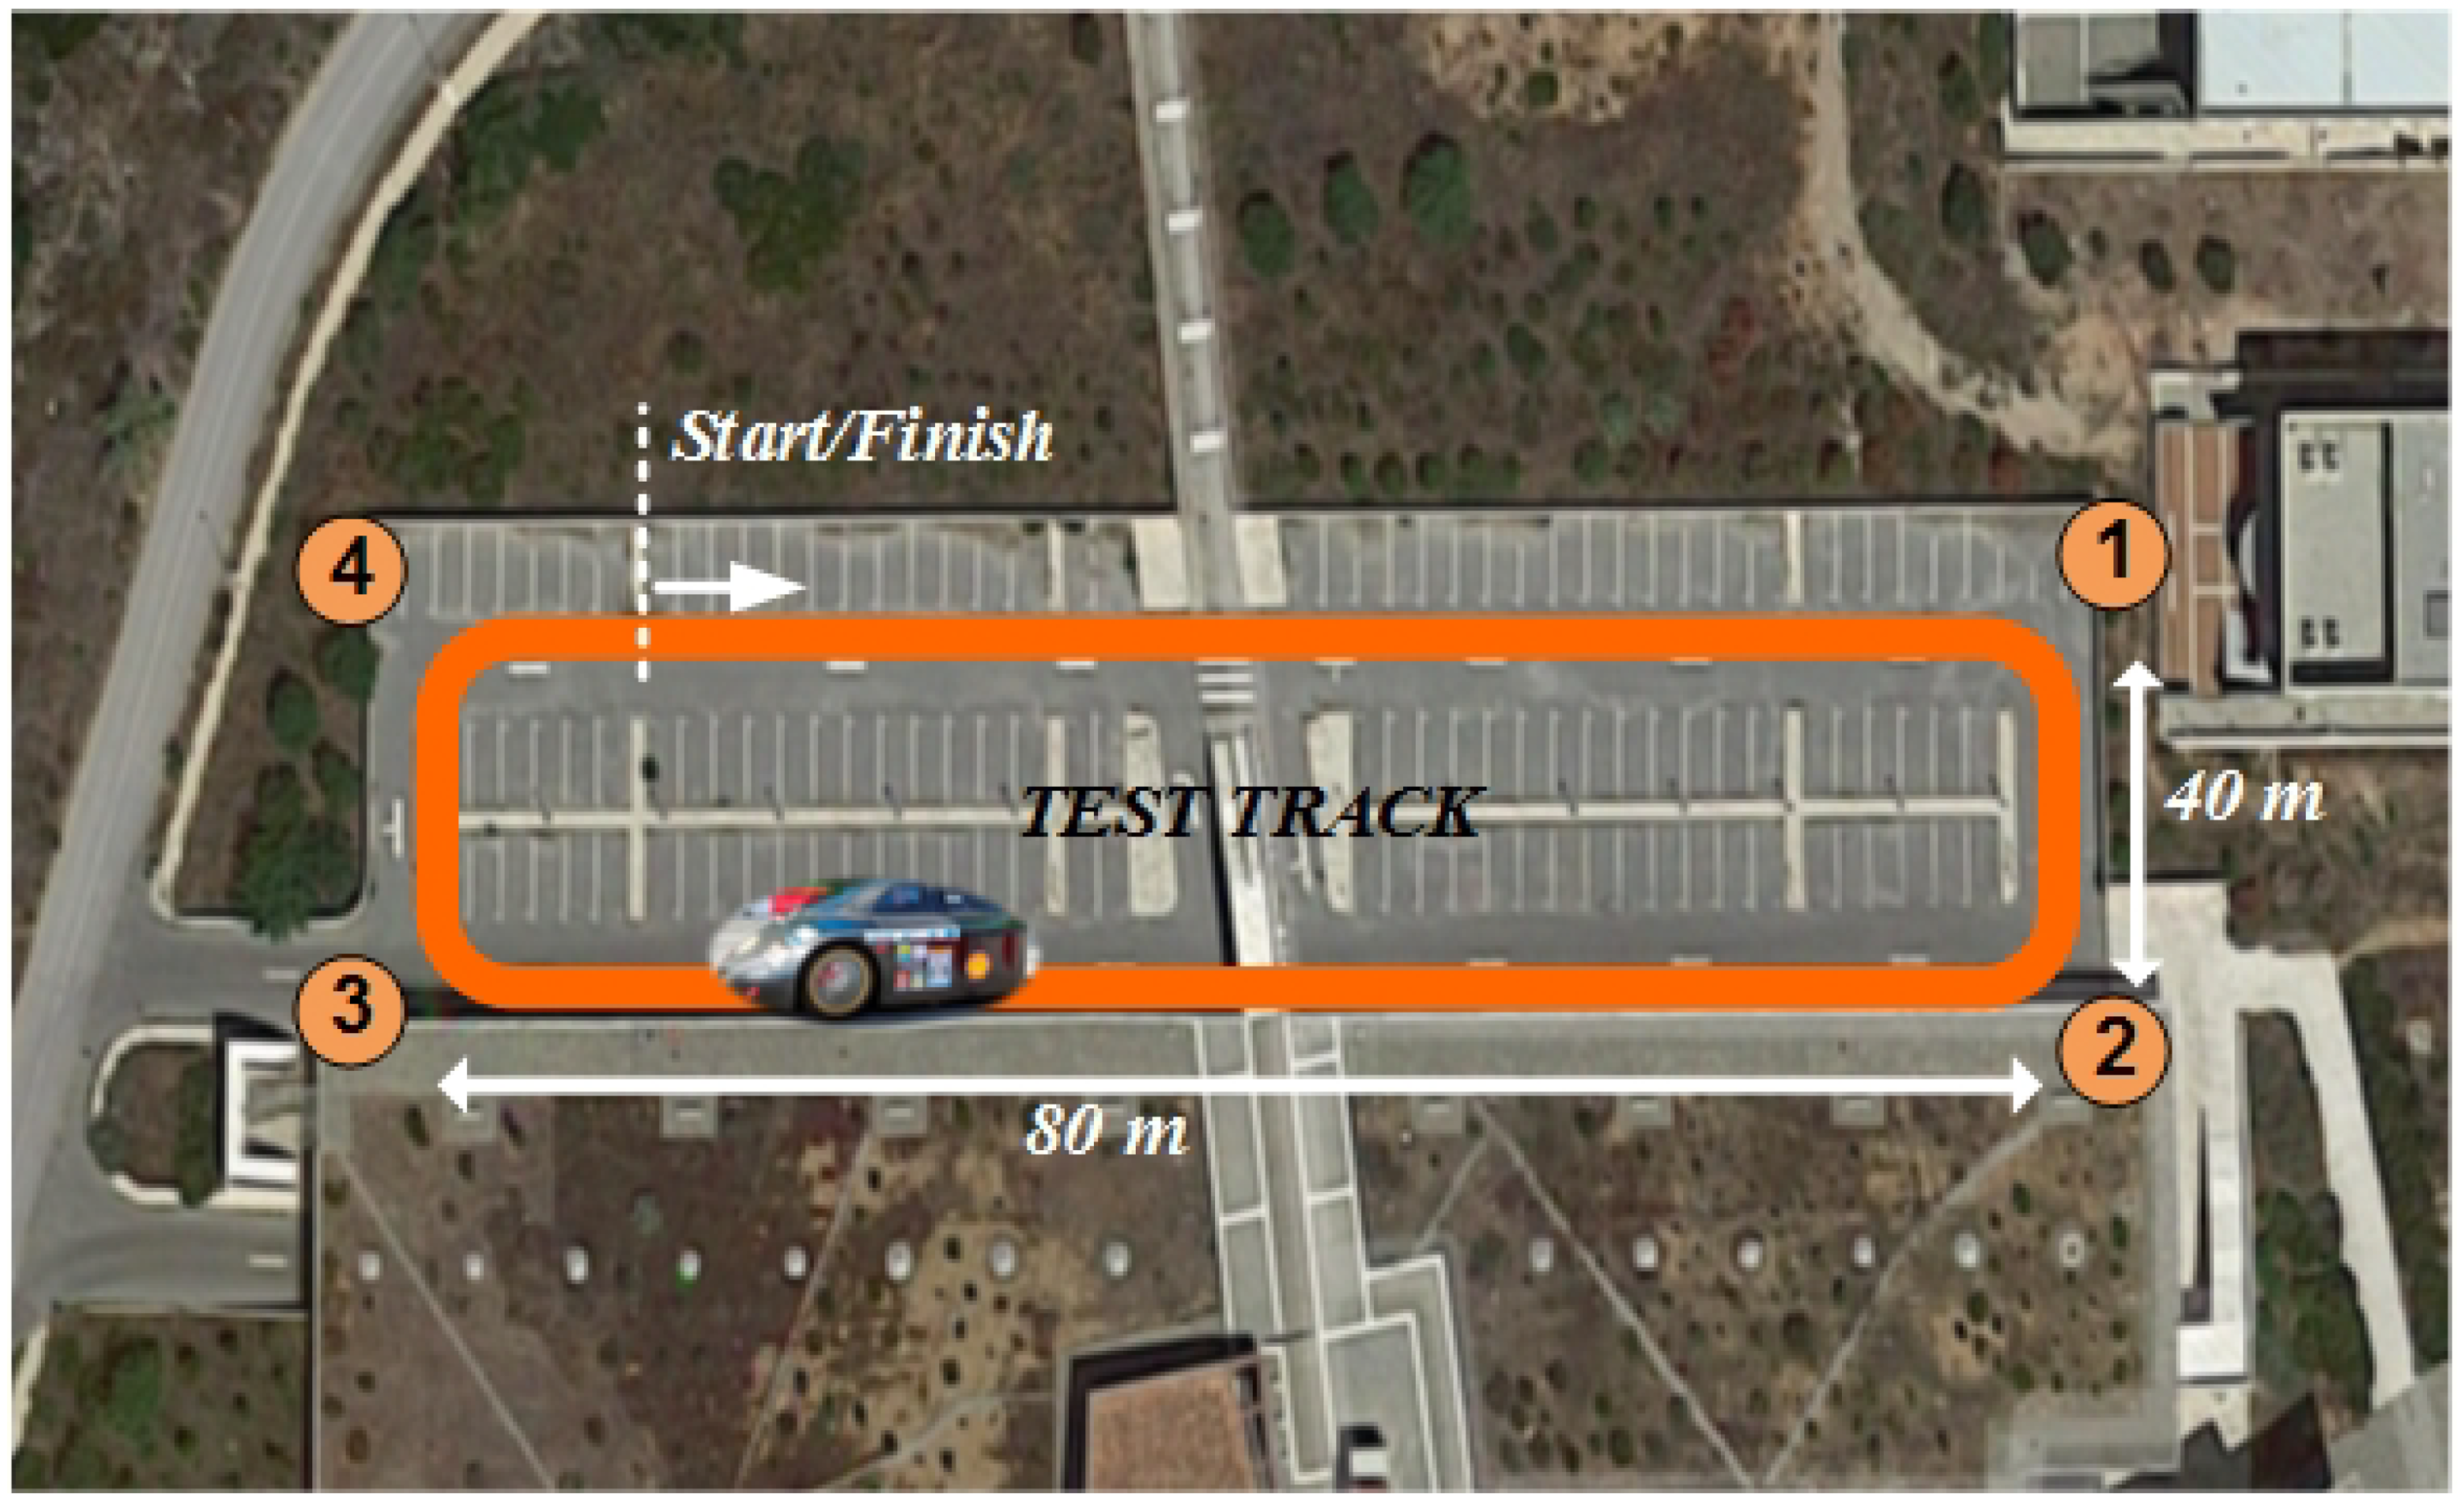
All experiments were conducted on TUC’s campus, in a track with a total length of 240 m (Figure 8), while a full test consisted of two laps (480 m). Initially we performed experiments with the standard setup and then we replicated them using the 2-speed gearbox, in order to compare their respective energy consumption. To perform the aforementioned comparison, in the second case, different gear change speeds were chosen as shift speeds (8, 11, 14, 17 and 20 Km/h). The vehicle was starting 60 m (Figure 8) before the first corner (1). In order to minimize the driver’s intervention and extract unbiased results, the following ruleset was followed:
- Speed limits are set for the first time the car passes from corners (1) and (2), set at 15–17 Km/h. The driver tries to follow this rule at almost constant acceleration.
- Above 22 km/h the vehicle increased its velocity using full throttle, which results in higher energy consumption, without actual interference from the driver.
- Total time to complete the two laps is set to a margin of 79–83 s with a max speed of 30 Km/h. Driver cannot brake to increase lap time but can stop pushing the throttle while cornering in order to adjust his lap timeframe.
2.4. Data Recording
The acquisition of data streams used for evaluation of tests gathered in road conditions consists of a custom data logger, tailored to serve the needs of the TUCer team. The custom data logger device (TUCer logger) records data of power supply voltage and power supply current, with frequency of a sample set every 0.5 s (2 Hz). Voltage and current are measured at the input of the electric motor. The core of the logger is the popular Arduino Uno microcontroller. Voltage measurement is done by a voltage divider. Current measurement by a shunt resistor and an AD623 Instrumentation Amplifier. All inputs are transferred to the Arduino for processing and evaluation. To address the Arduino’s lack of internal memory (for logging purposes), a serial connection (via USB) to a Raspberry Pi is established. The Raspberry Pi receives the data from the Arduino and logs a file for retrieval after the test. For the measurement of hydrogen consumption a flow meter of high accuracy is used (Red-y compact), providing real time measurement of total hydrogen consumption. In every test, measurement of the flow meter is recorded at the start and finish of the two laps. The flow meter is placed at the input of the fuel cell.
3. On Road Testing and Results
Based on the setup and procedures described in detail in Section 2, we measured the power demand (Watt) versus sampling time for different scenarios (Figure 9, Figure 10, Figure 11, Figure 12, Figure 13 and Figure 14). We also recorded and calculated the mean power and total hydrogen consumption, which is proportional to power demand, following a curve according to Fuel Cell specifications [24]. Three different categories of experiments are presented: Single-stage setup testing, 2-speed gearbox setup testing and CVT setup testing, respectively.
3.1. Tests on Single-Stage Setup
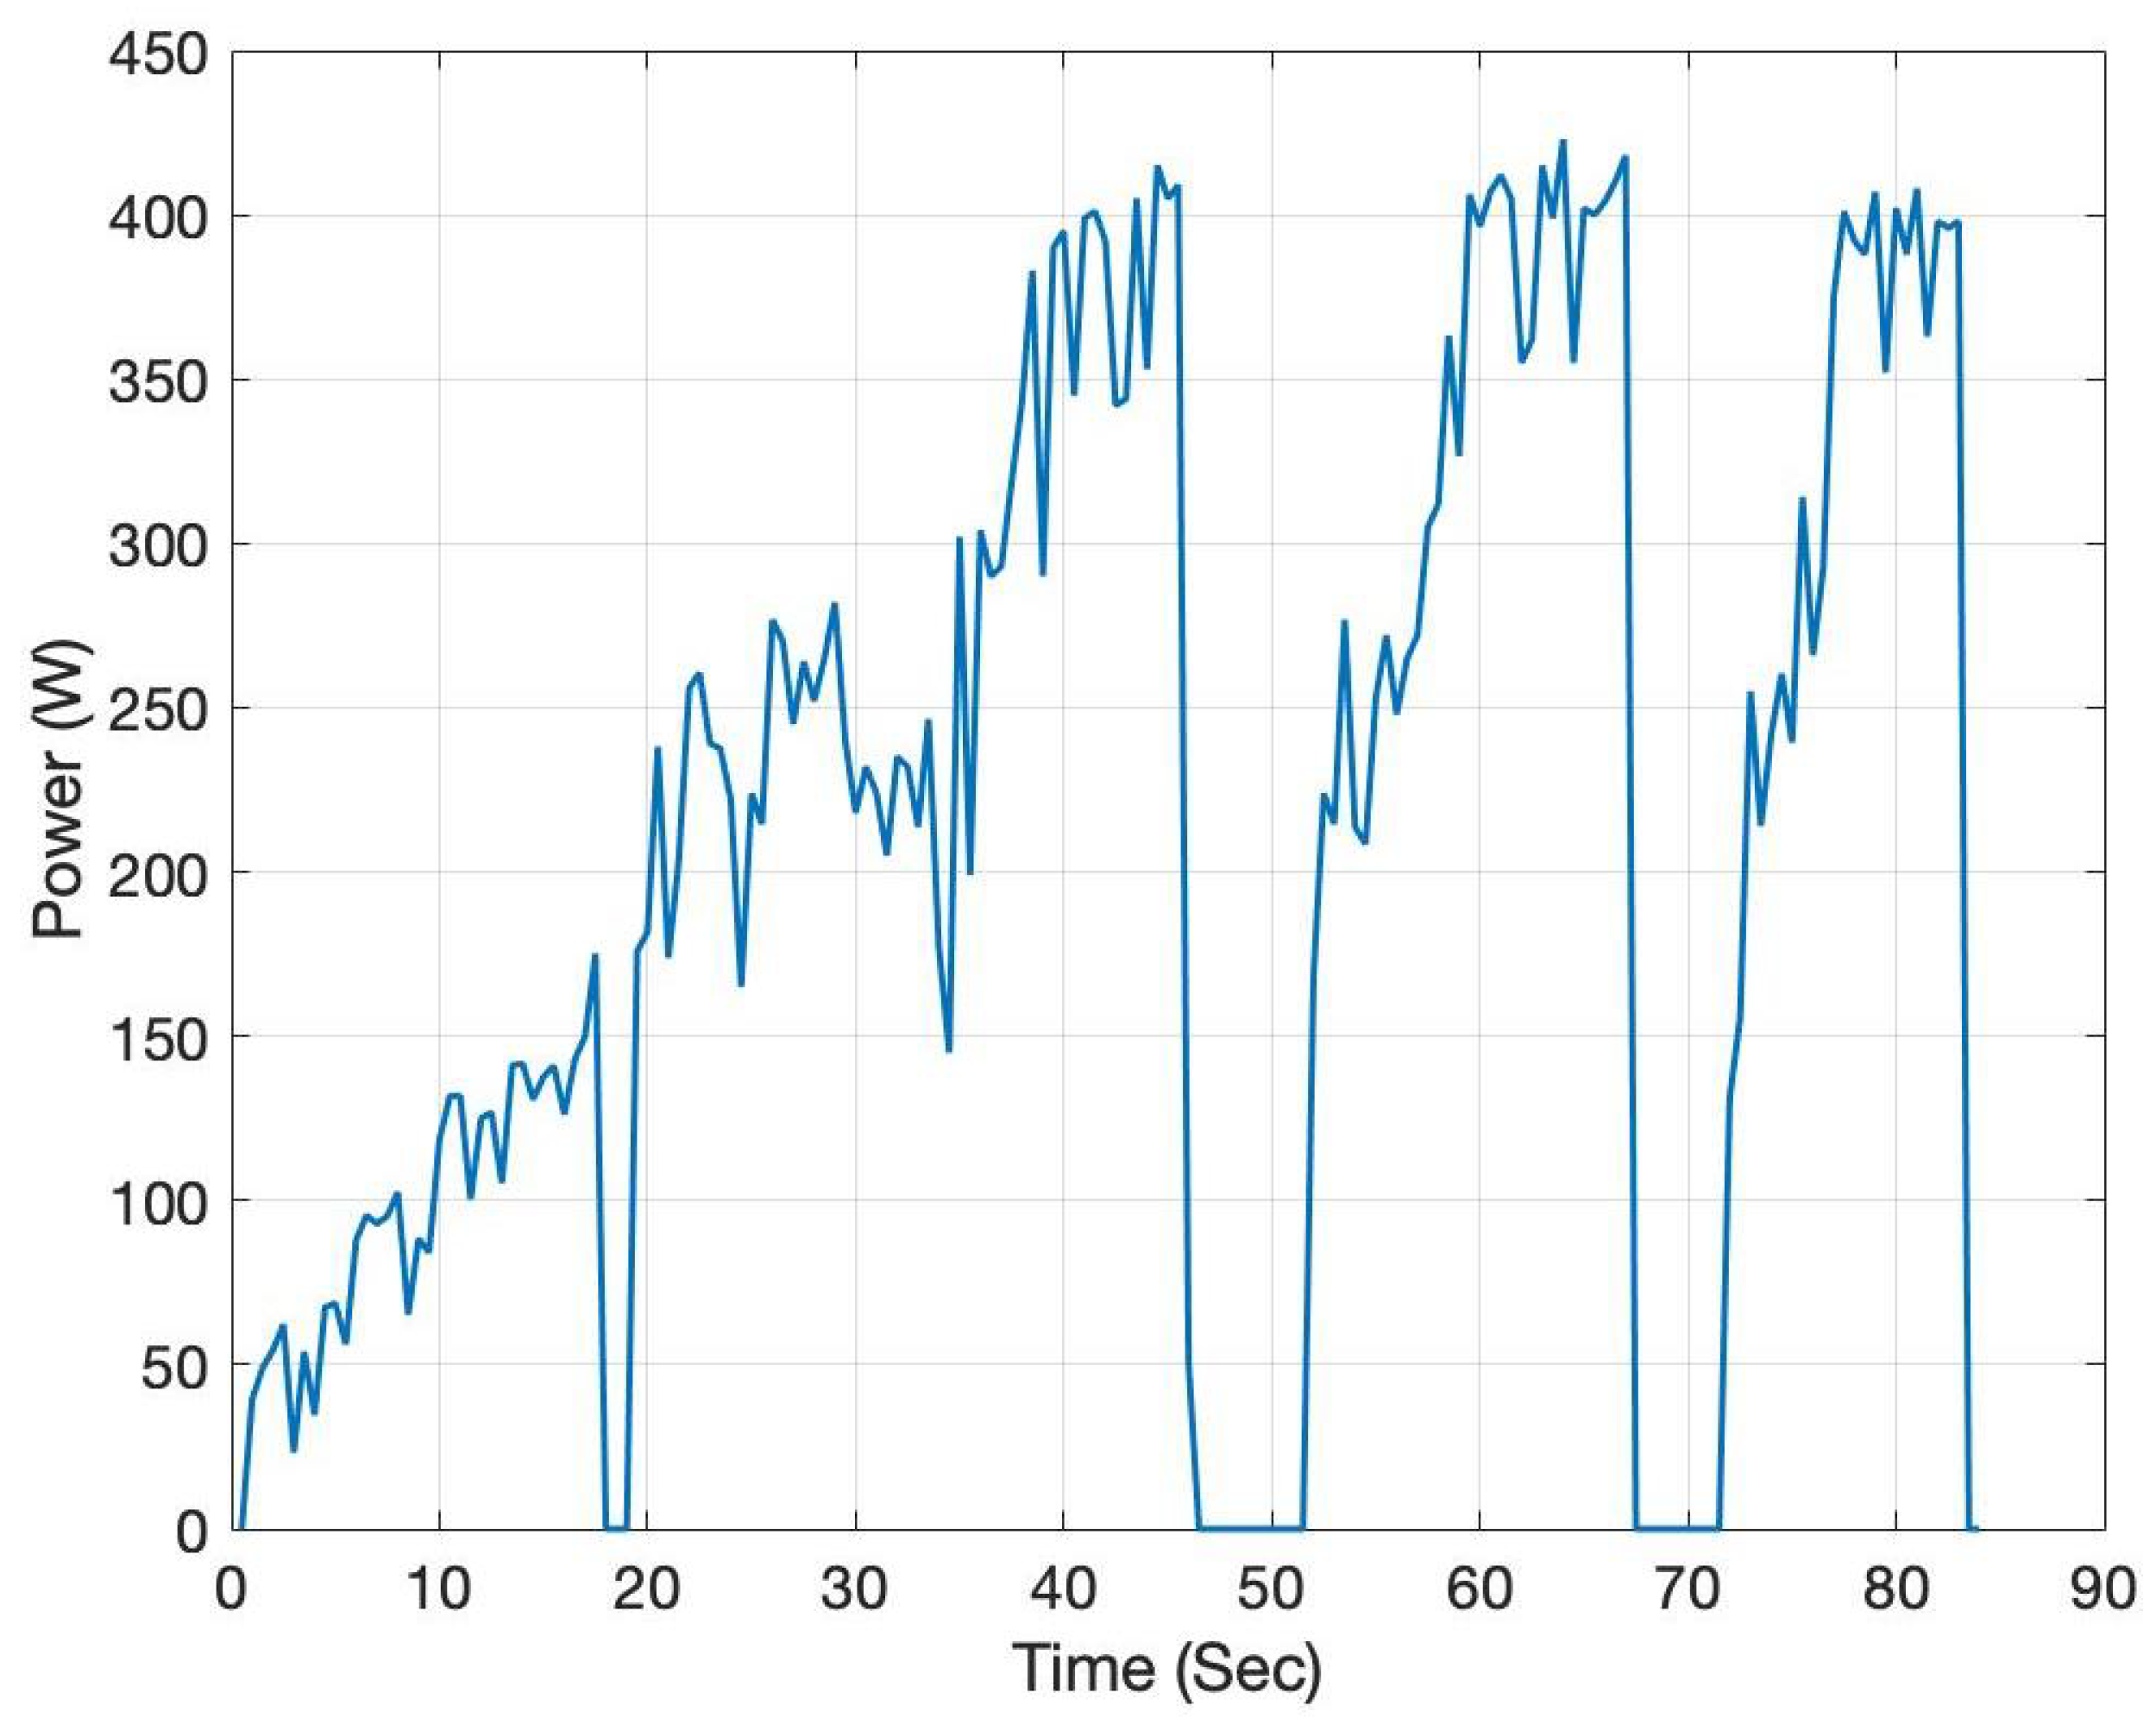
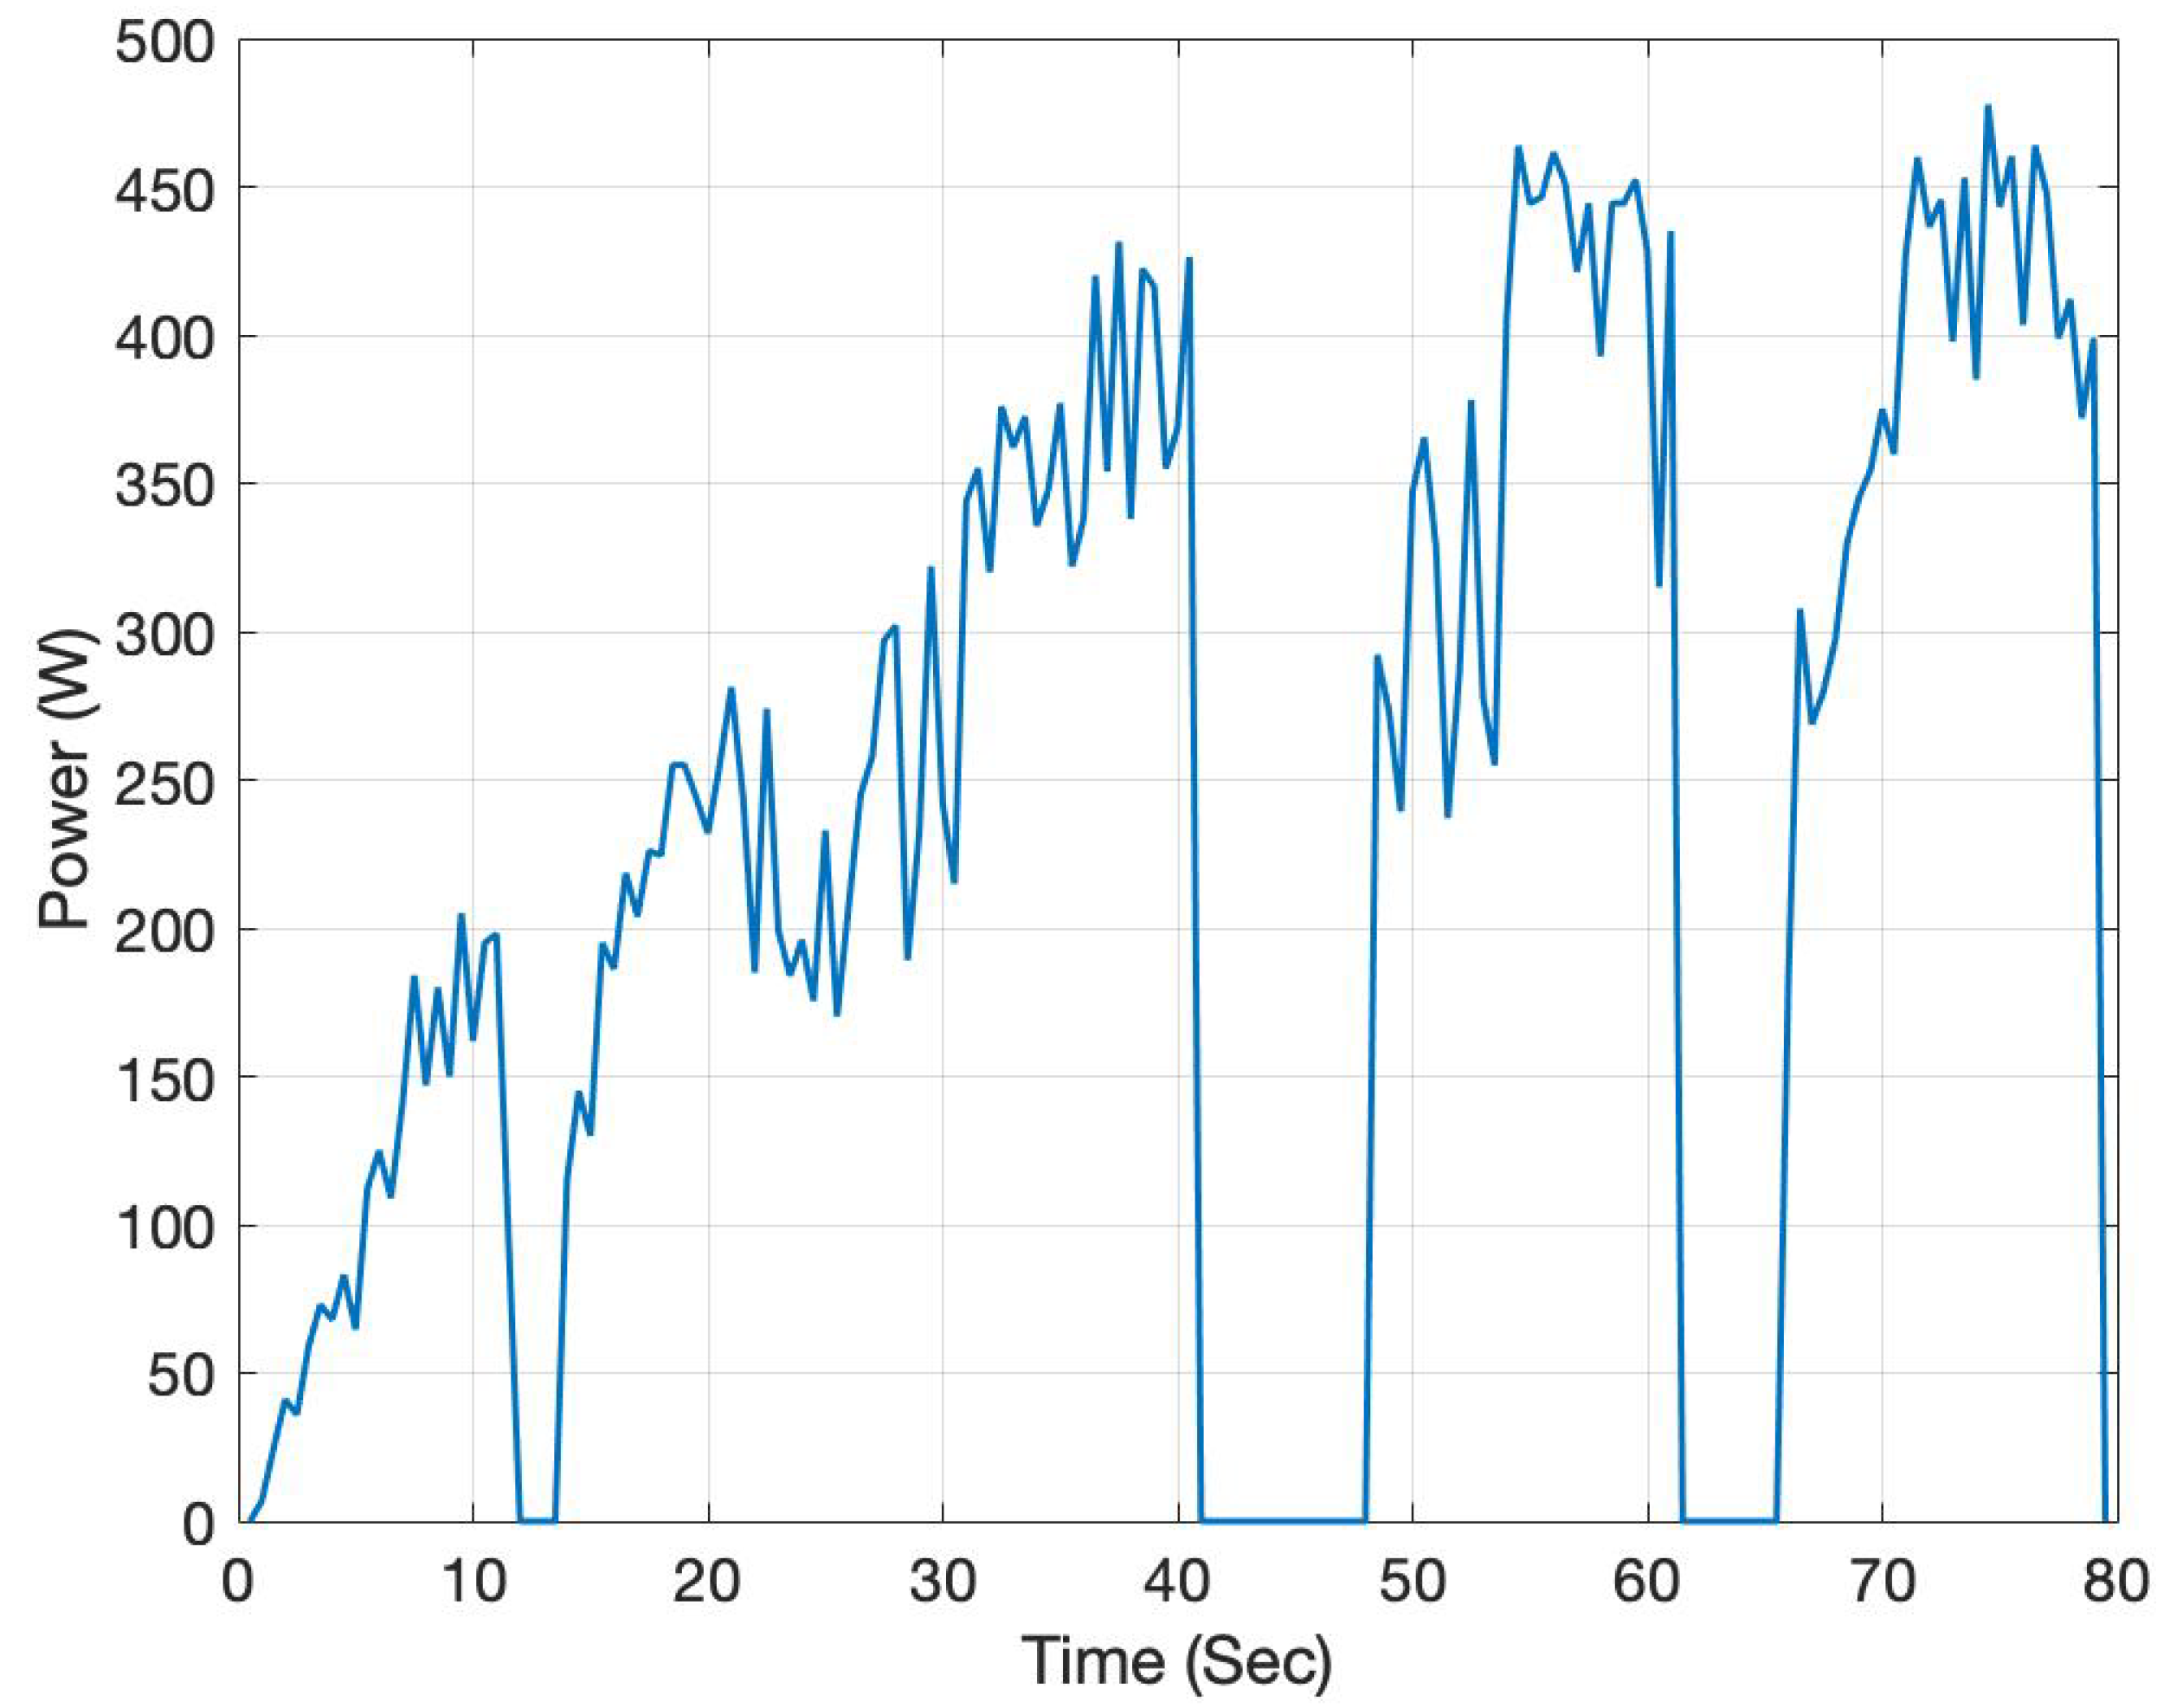
The first scenario concerns the standard powertrain configuration and after conducting experiments as described in detail in Section 2, we calculate the power demand presented in Figure 9. During cornering the power is minimized, where the driver stops pushing the throttle but without braking. On the other parts of the track power demand reaches 400 W. The consumption was measured at 4.43 lt and mean power demand was calculated at 213.45 W. The total time on track was 83 s and the maximum speed reached was 29.8 Km/h.
3.2. Tests on Two-Speed Gearbox Setup
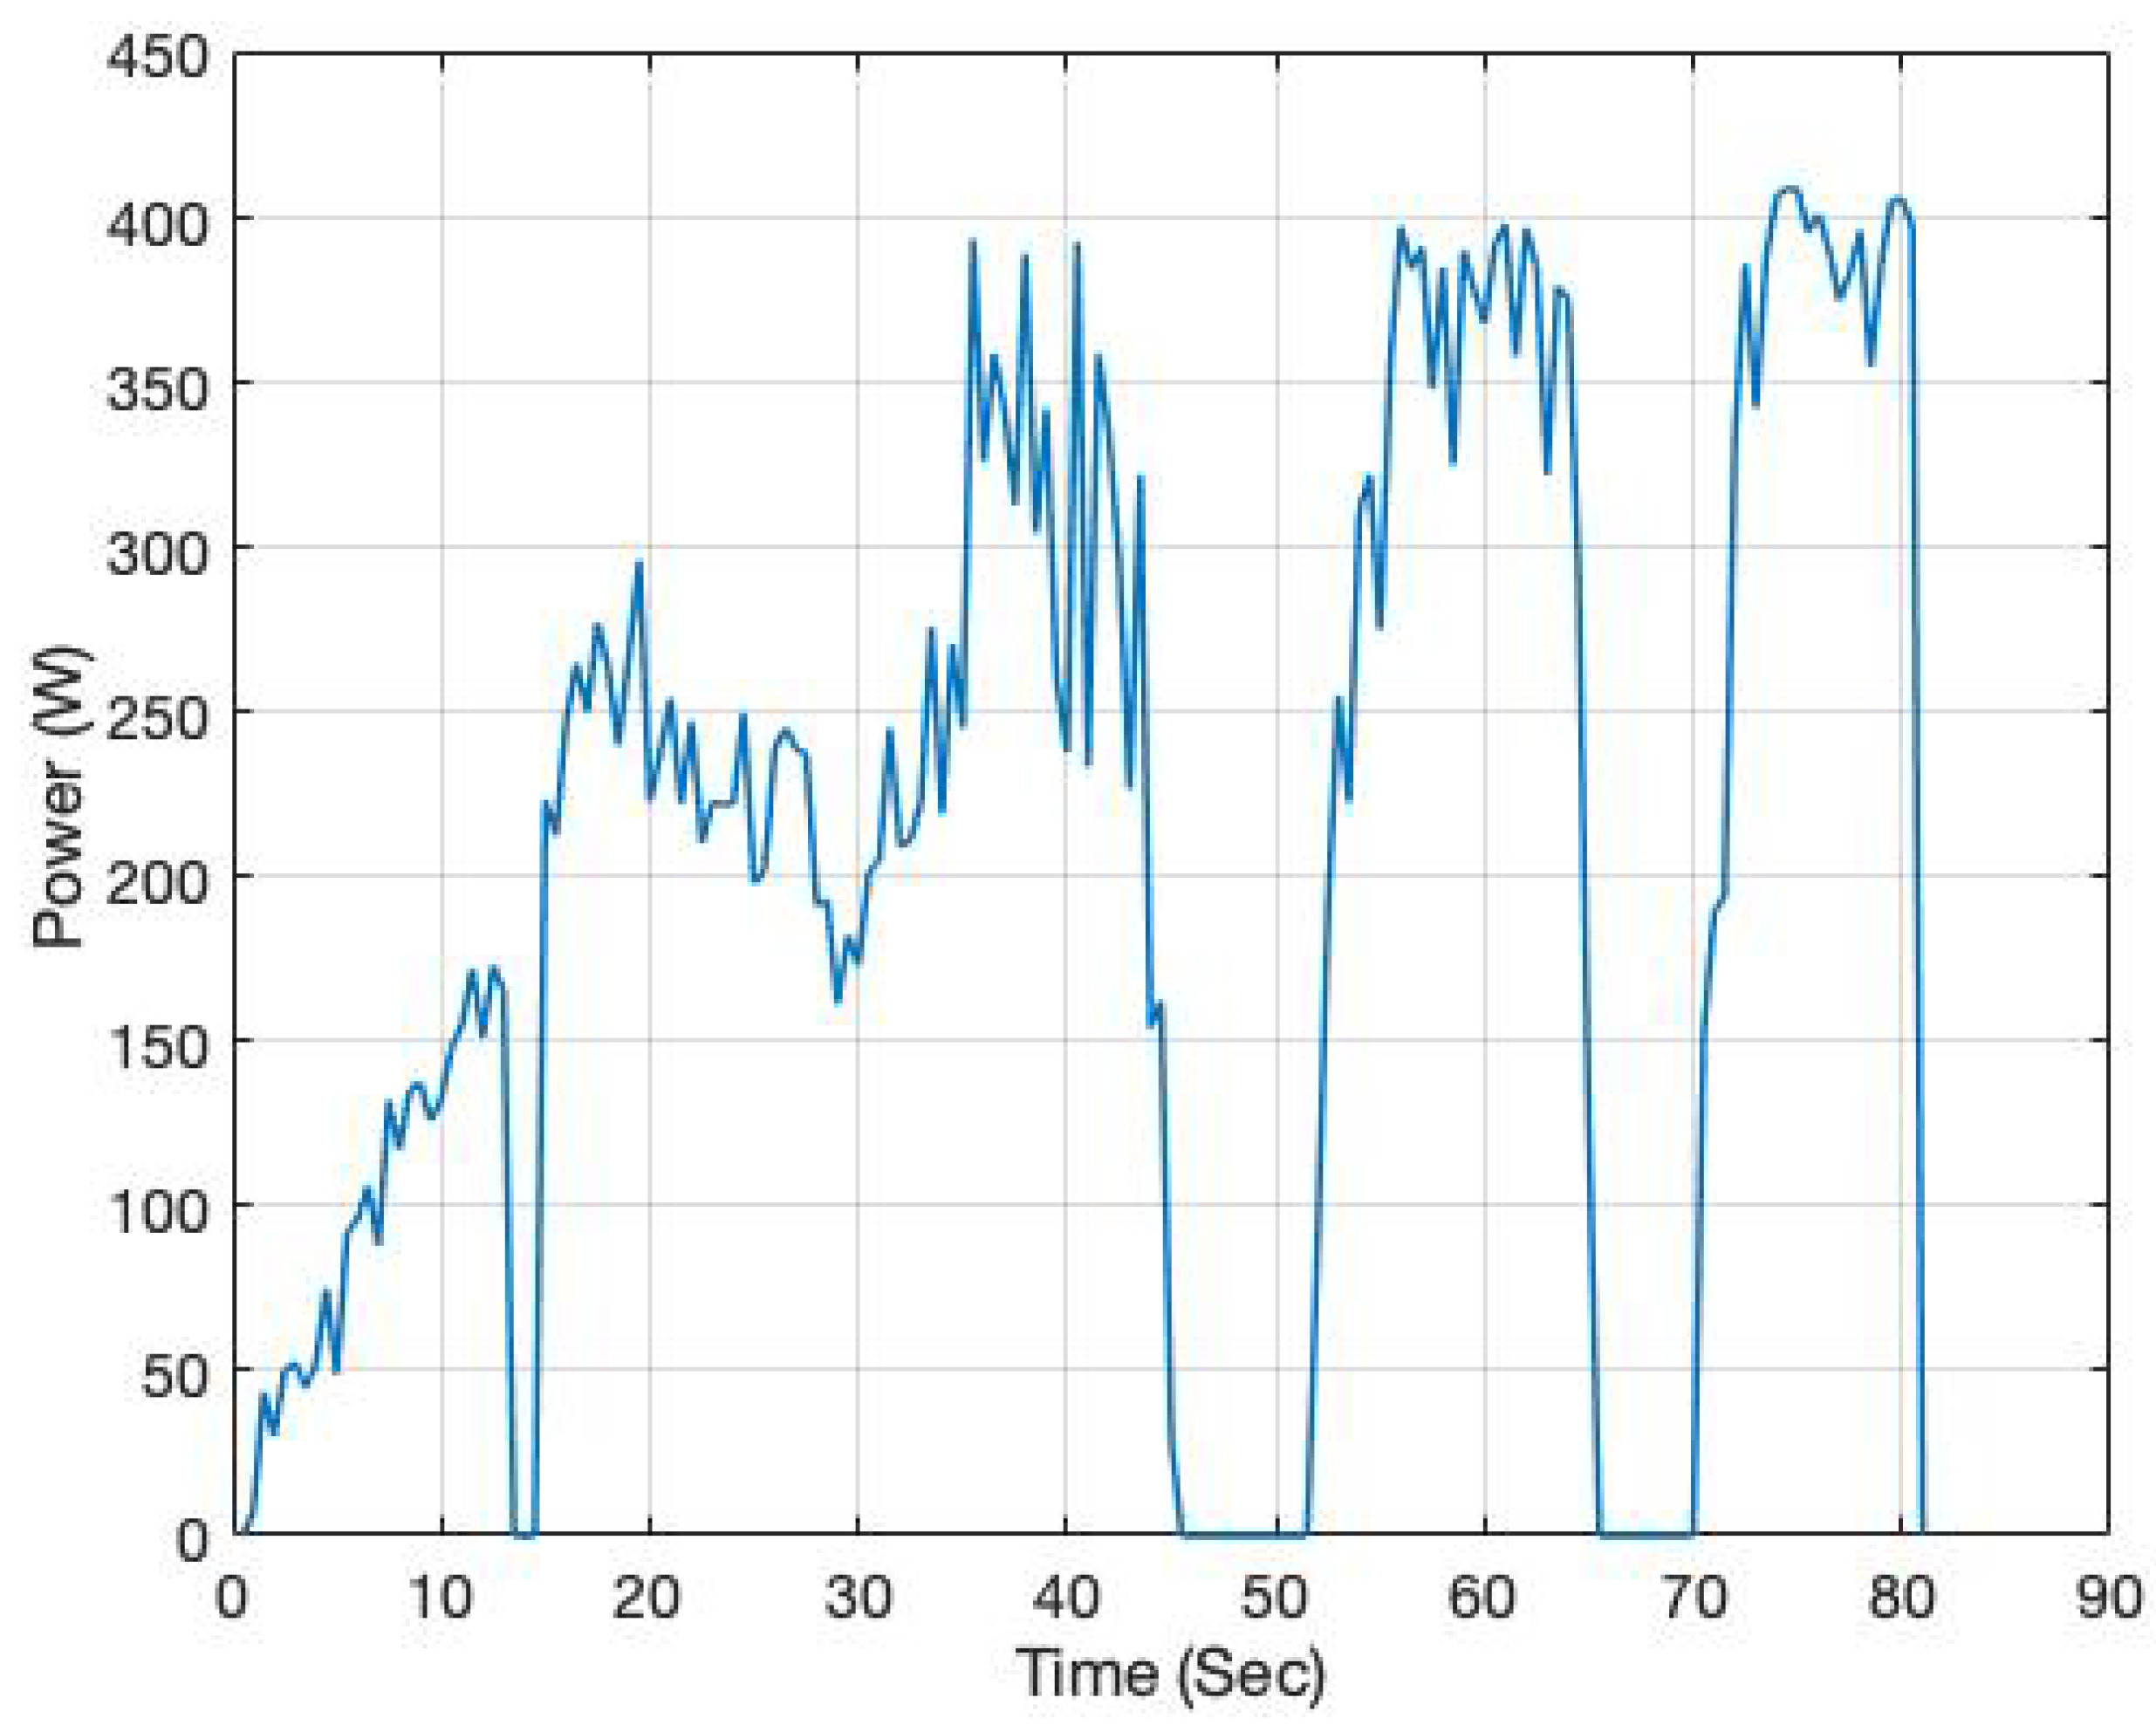
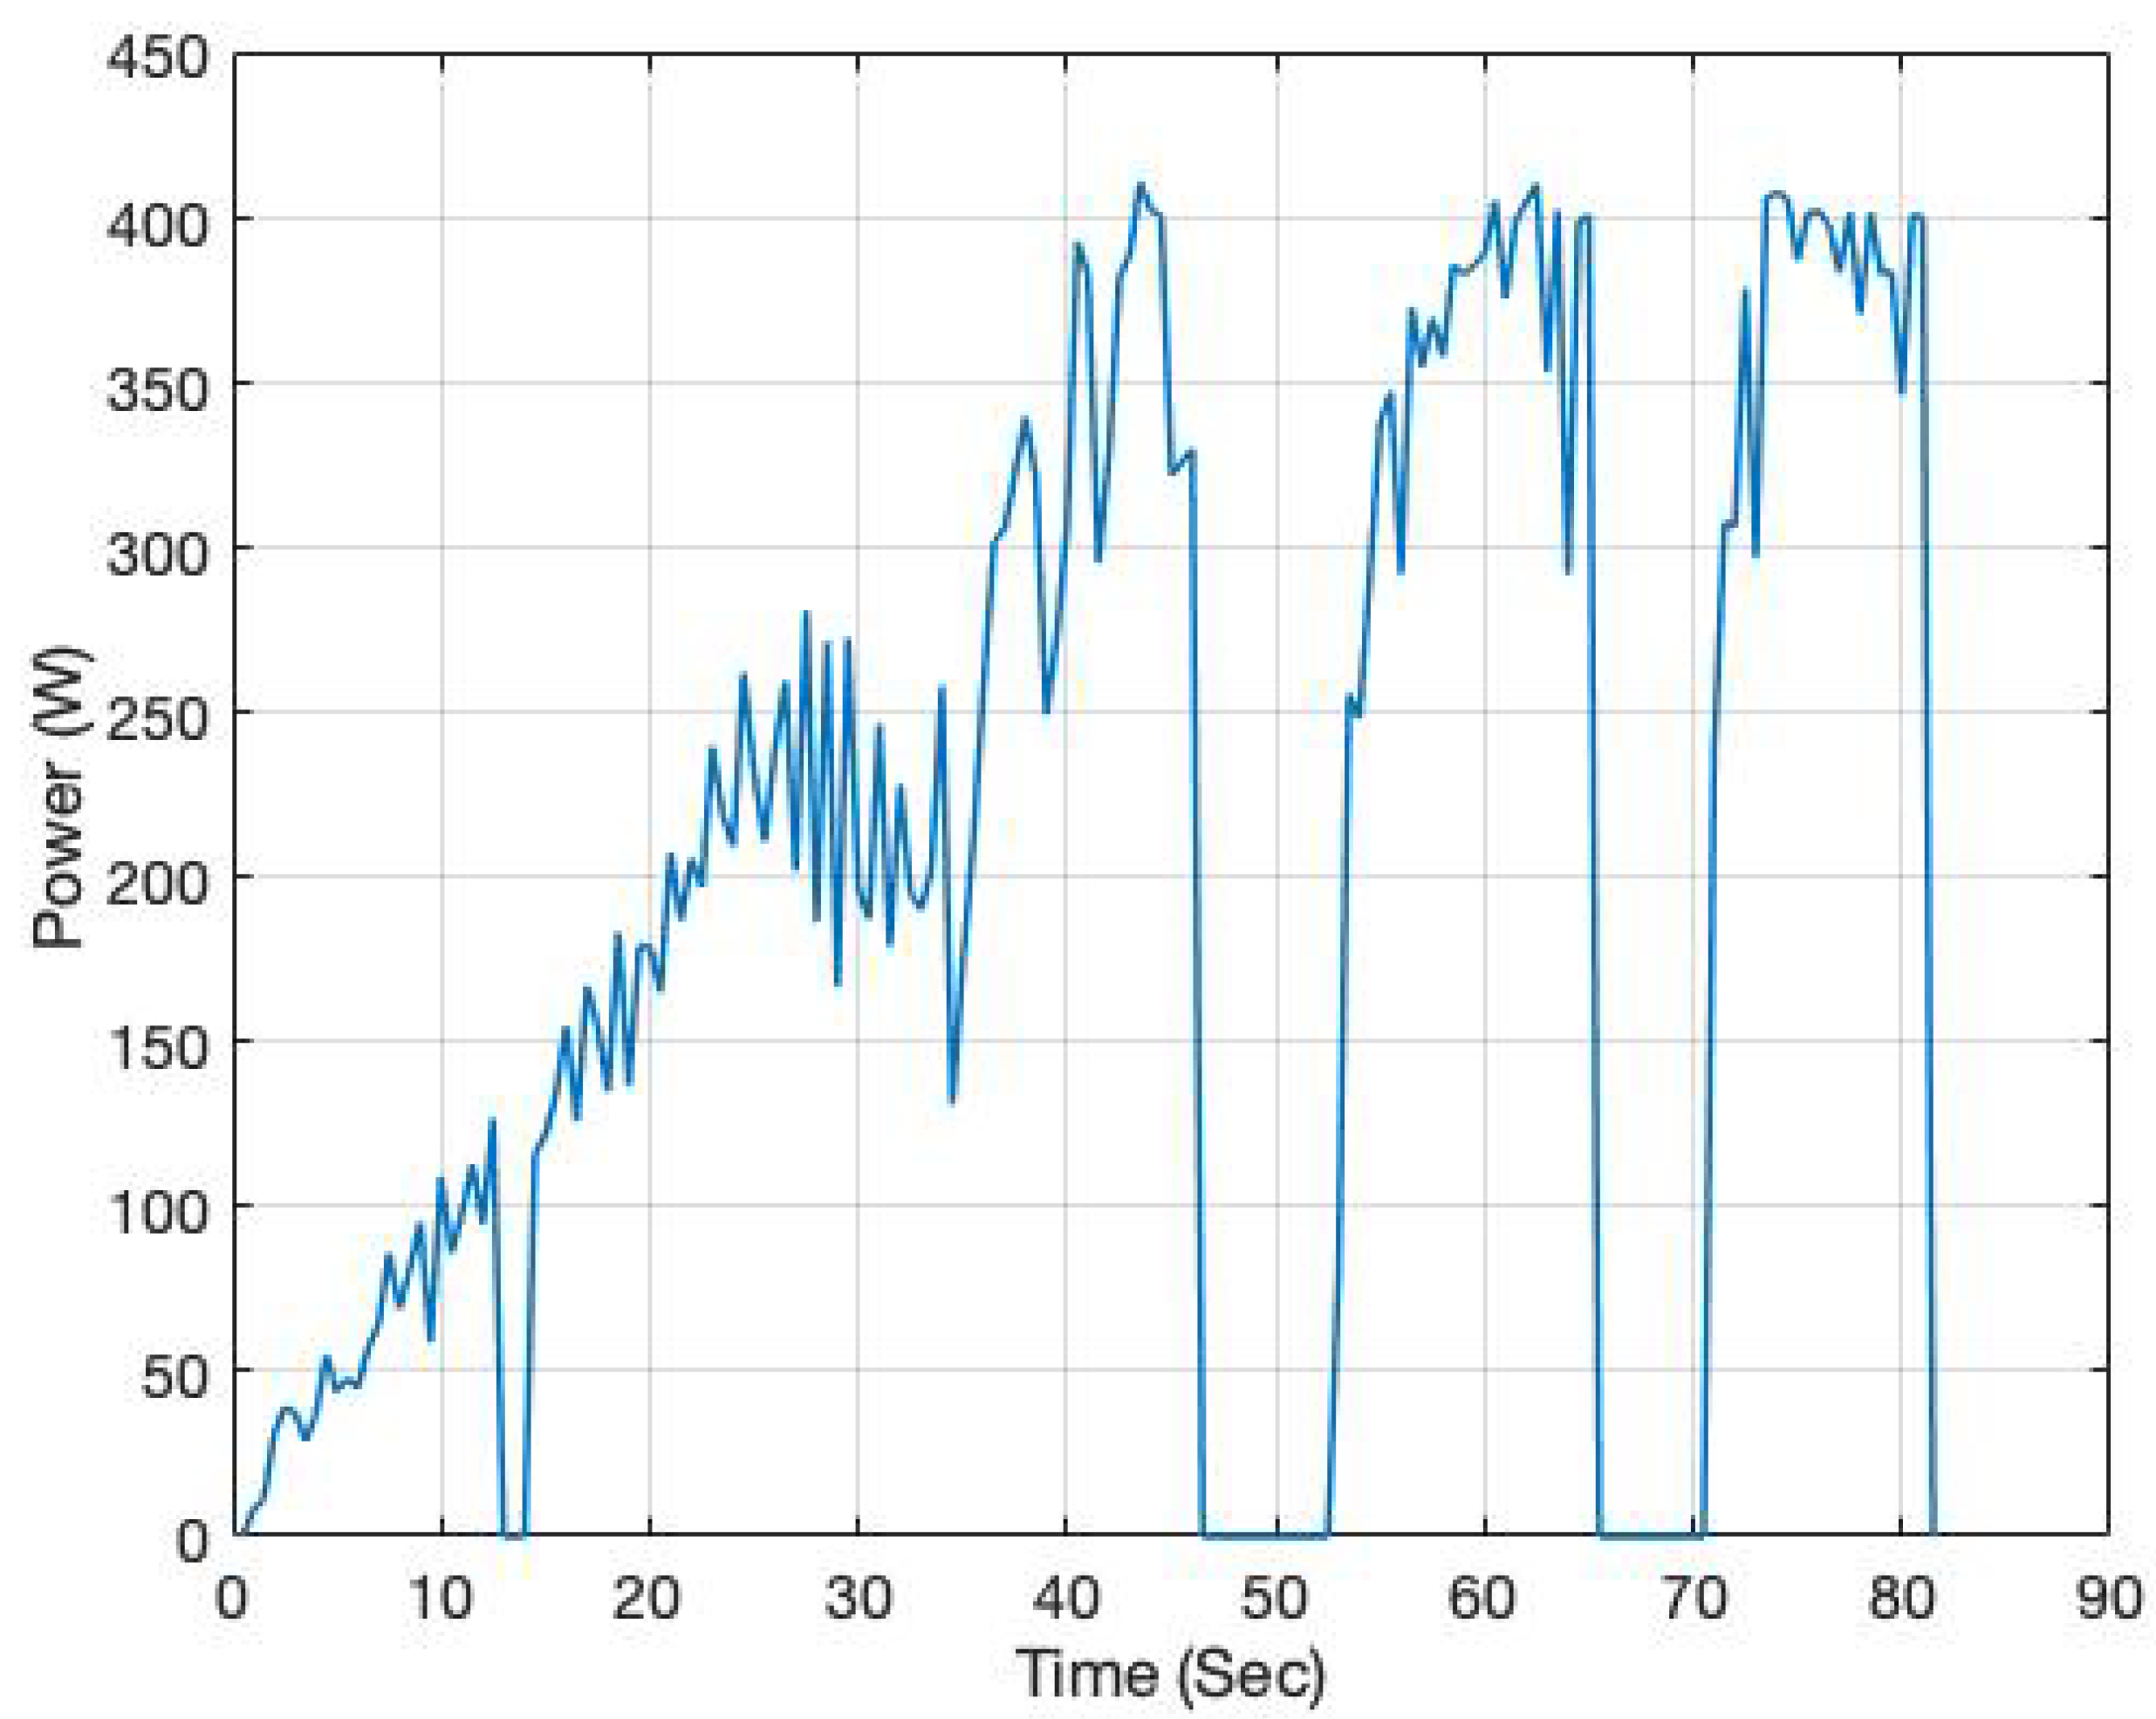
The second scenario concerns the two-speed gearbox, where the main differentation is the gear shift speed, which has a significant impact on the testbed’s performance. For assessment purposes gear change from 14:1 to 10:1 is set at five different vehicle speeds (8, 11, 14, 17 and 20 Km/h) during launch. The scope of this procedure is to asses the impact of gear shift, at different speeds, to energy consumption (Table 2).
Using the gearbox provides higher acceleration which corresponds to less time to reach the first corner (compared to single-stage) and total time in track is found between 80–81 s for both laps. Maximum speed reached was 29.2–30 Km/h. As so, the vehicle’s performance is almost the same in terms of speed inside the track, but it is clear that gearbox use can achieve lower track time. The results are presented in Figure 10, Figure 11, Figure 12, Figure 13 and Figure 14 whereas the minimum energy consumption is at 11 km/h gear change speed ( consumption: 4.28 lt, mean power demand: 205.38 W), followed by 8 km/h gear change as second best ( consumption: 4.37 lt, mean power demand: 210.12 W). Above 11 km/h gear shift speed, mean power demand is higher. Compared to single stage transmission results ( consumption: 4.43 lt, mean power demand: 213.45 W), correspond to 3.4% consumption reduction and 3.8% lower mean power demand.
3.3. On Road Testing of a Prototype CVT
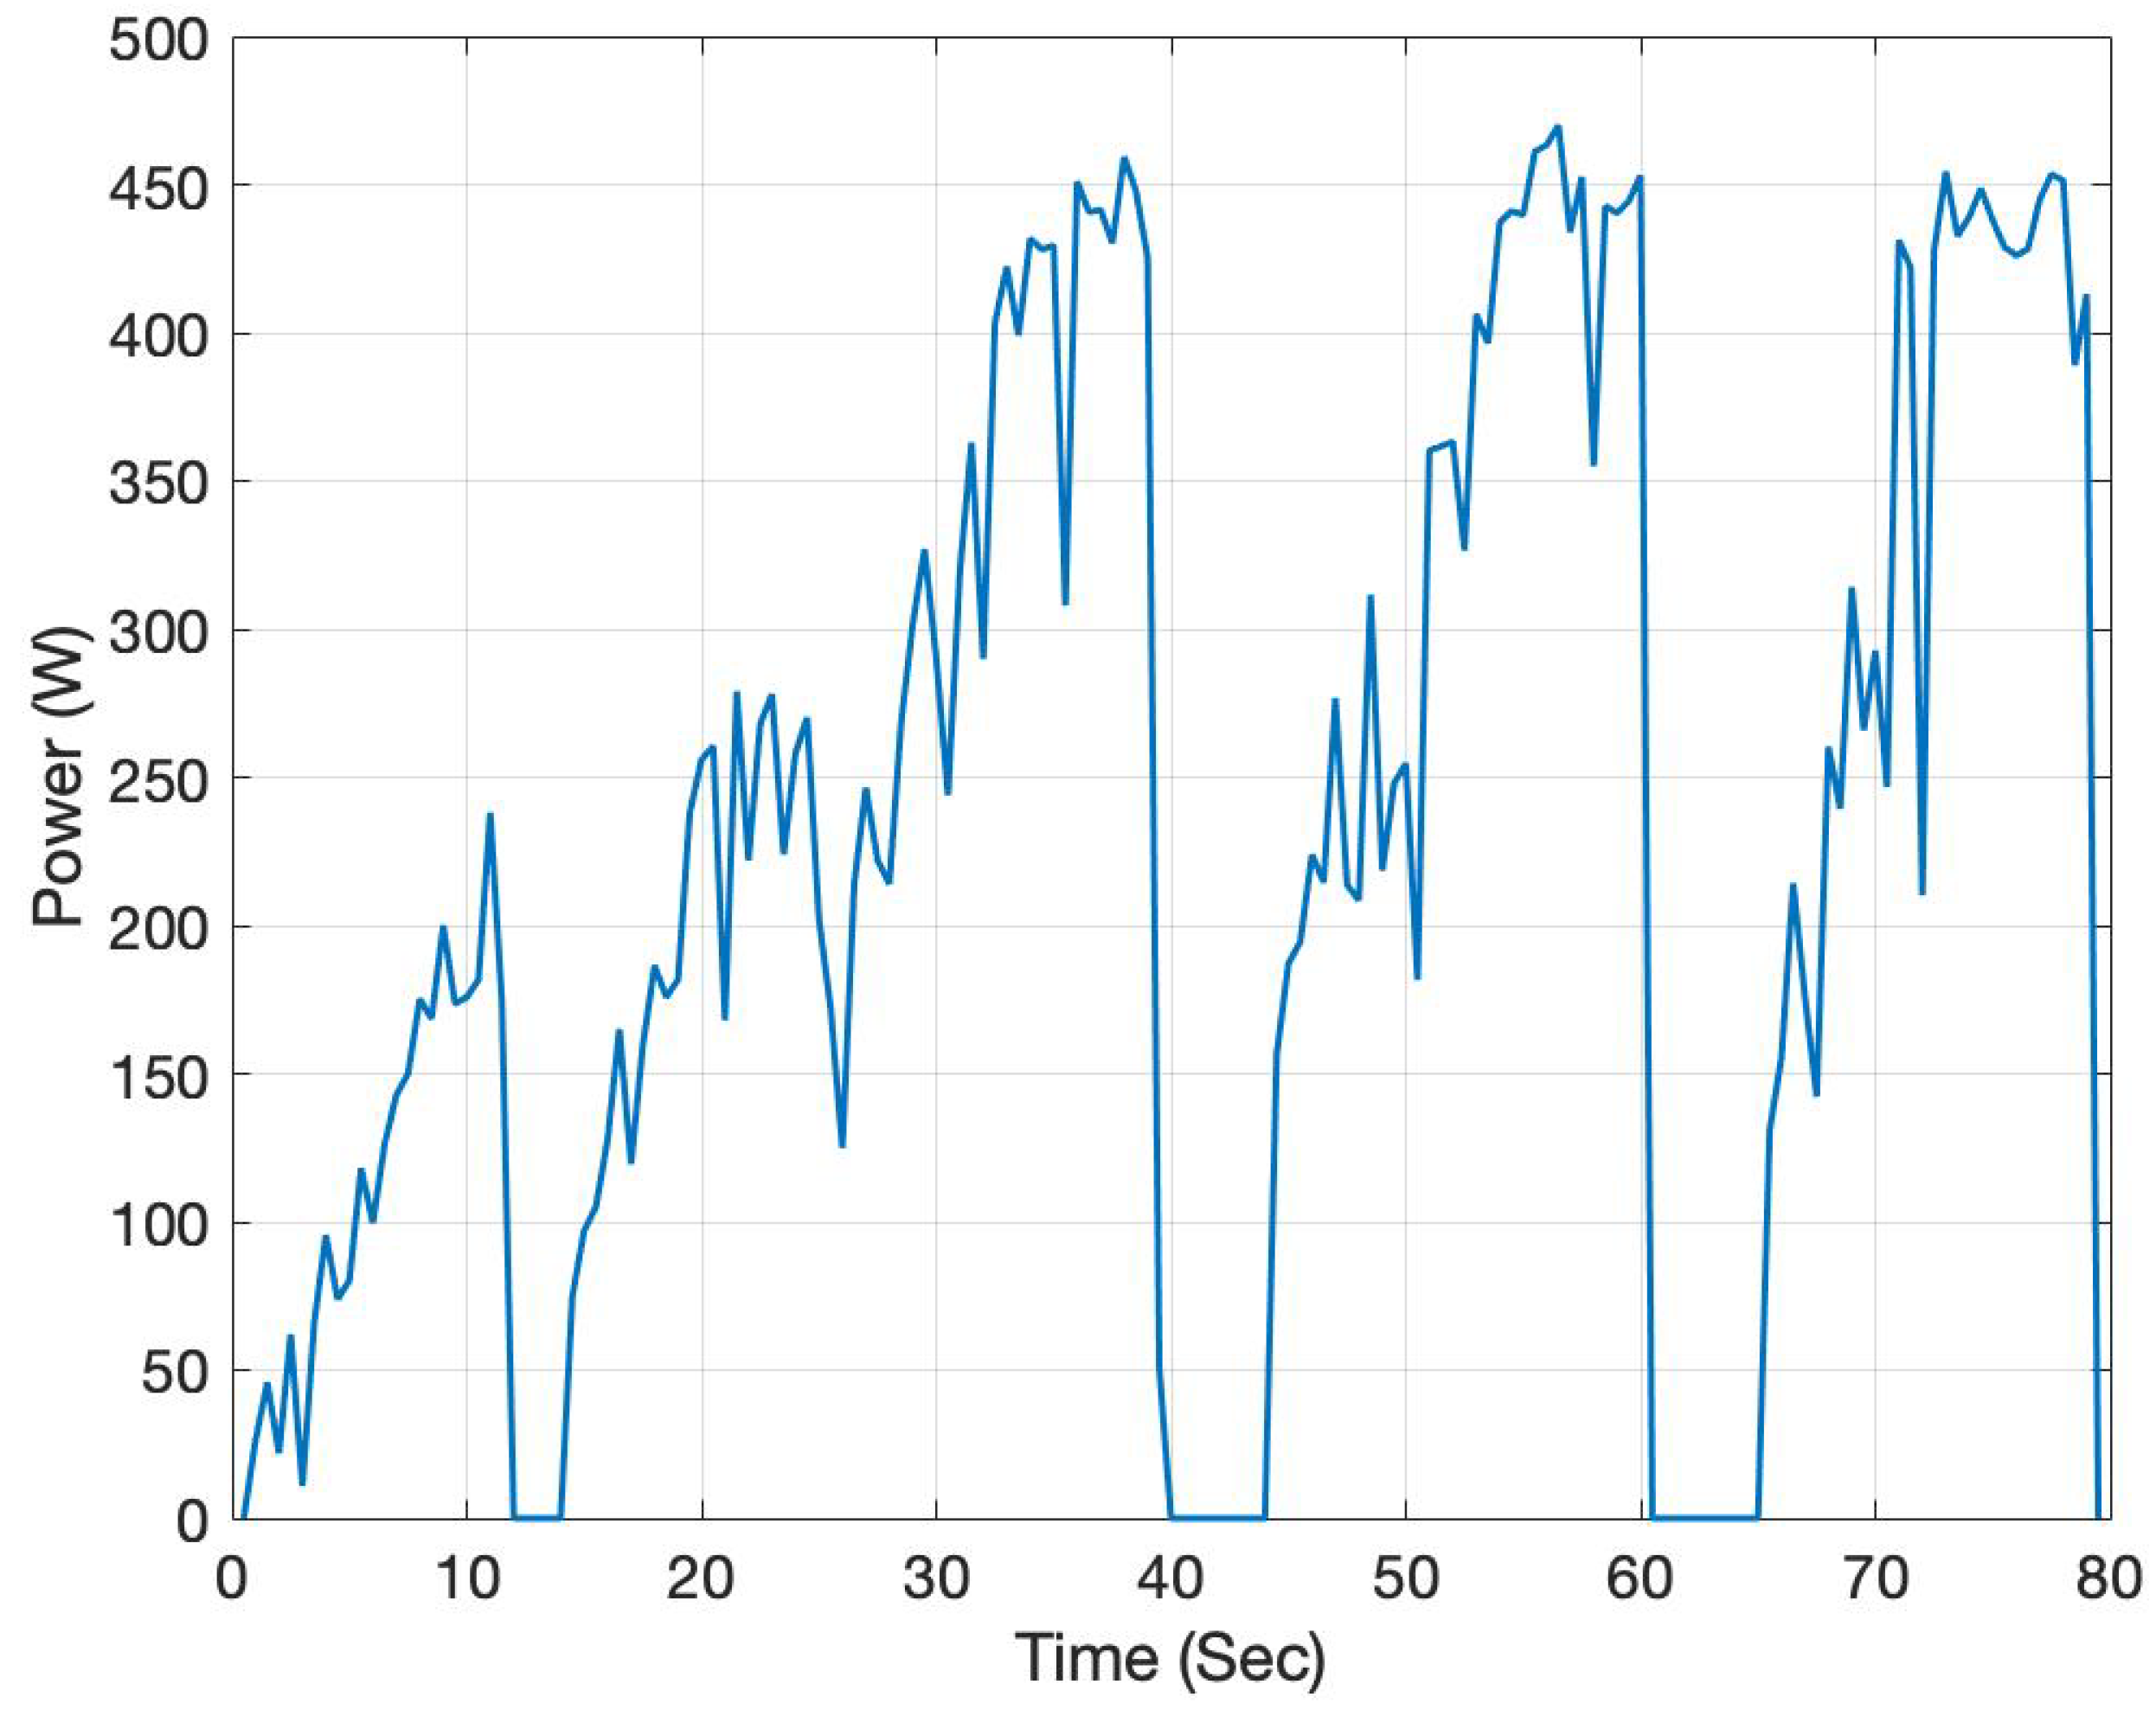
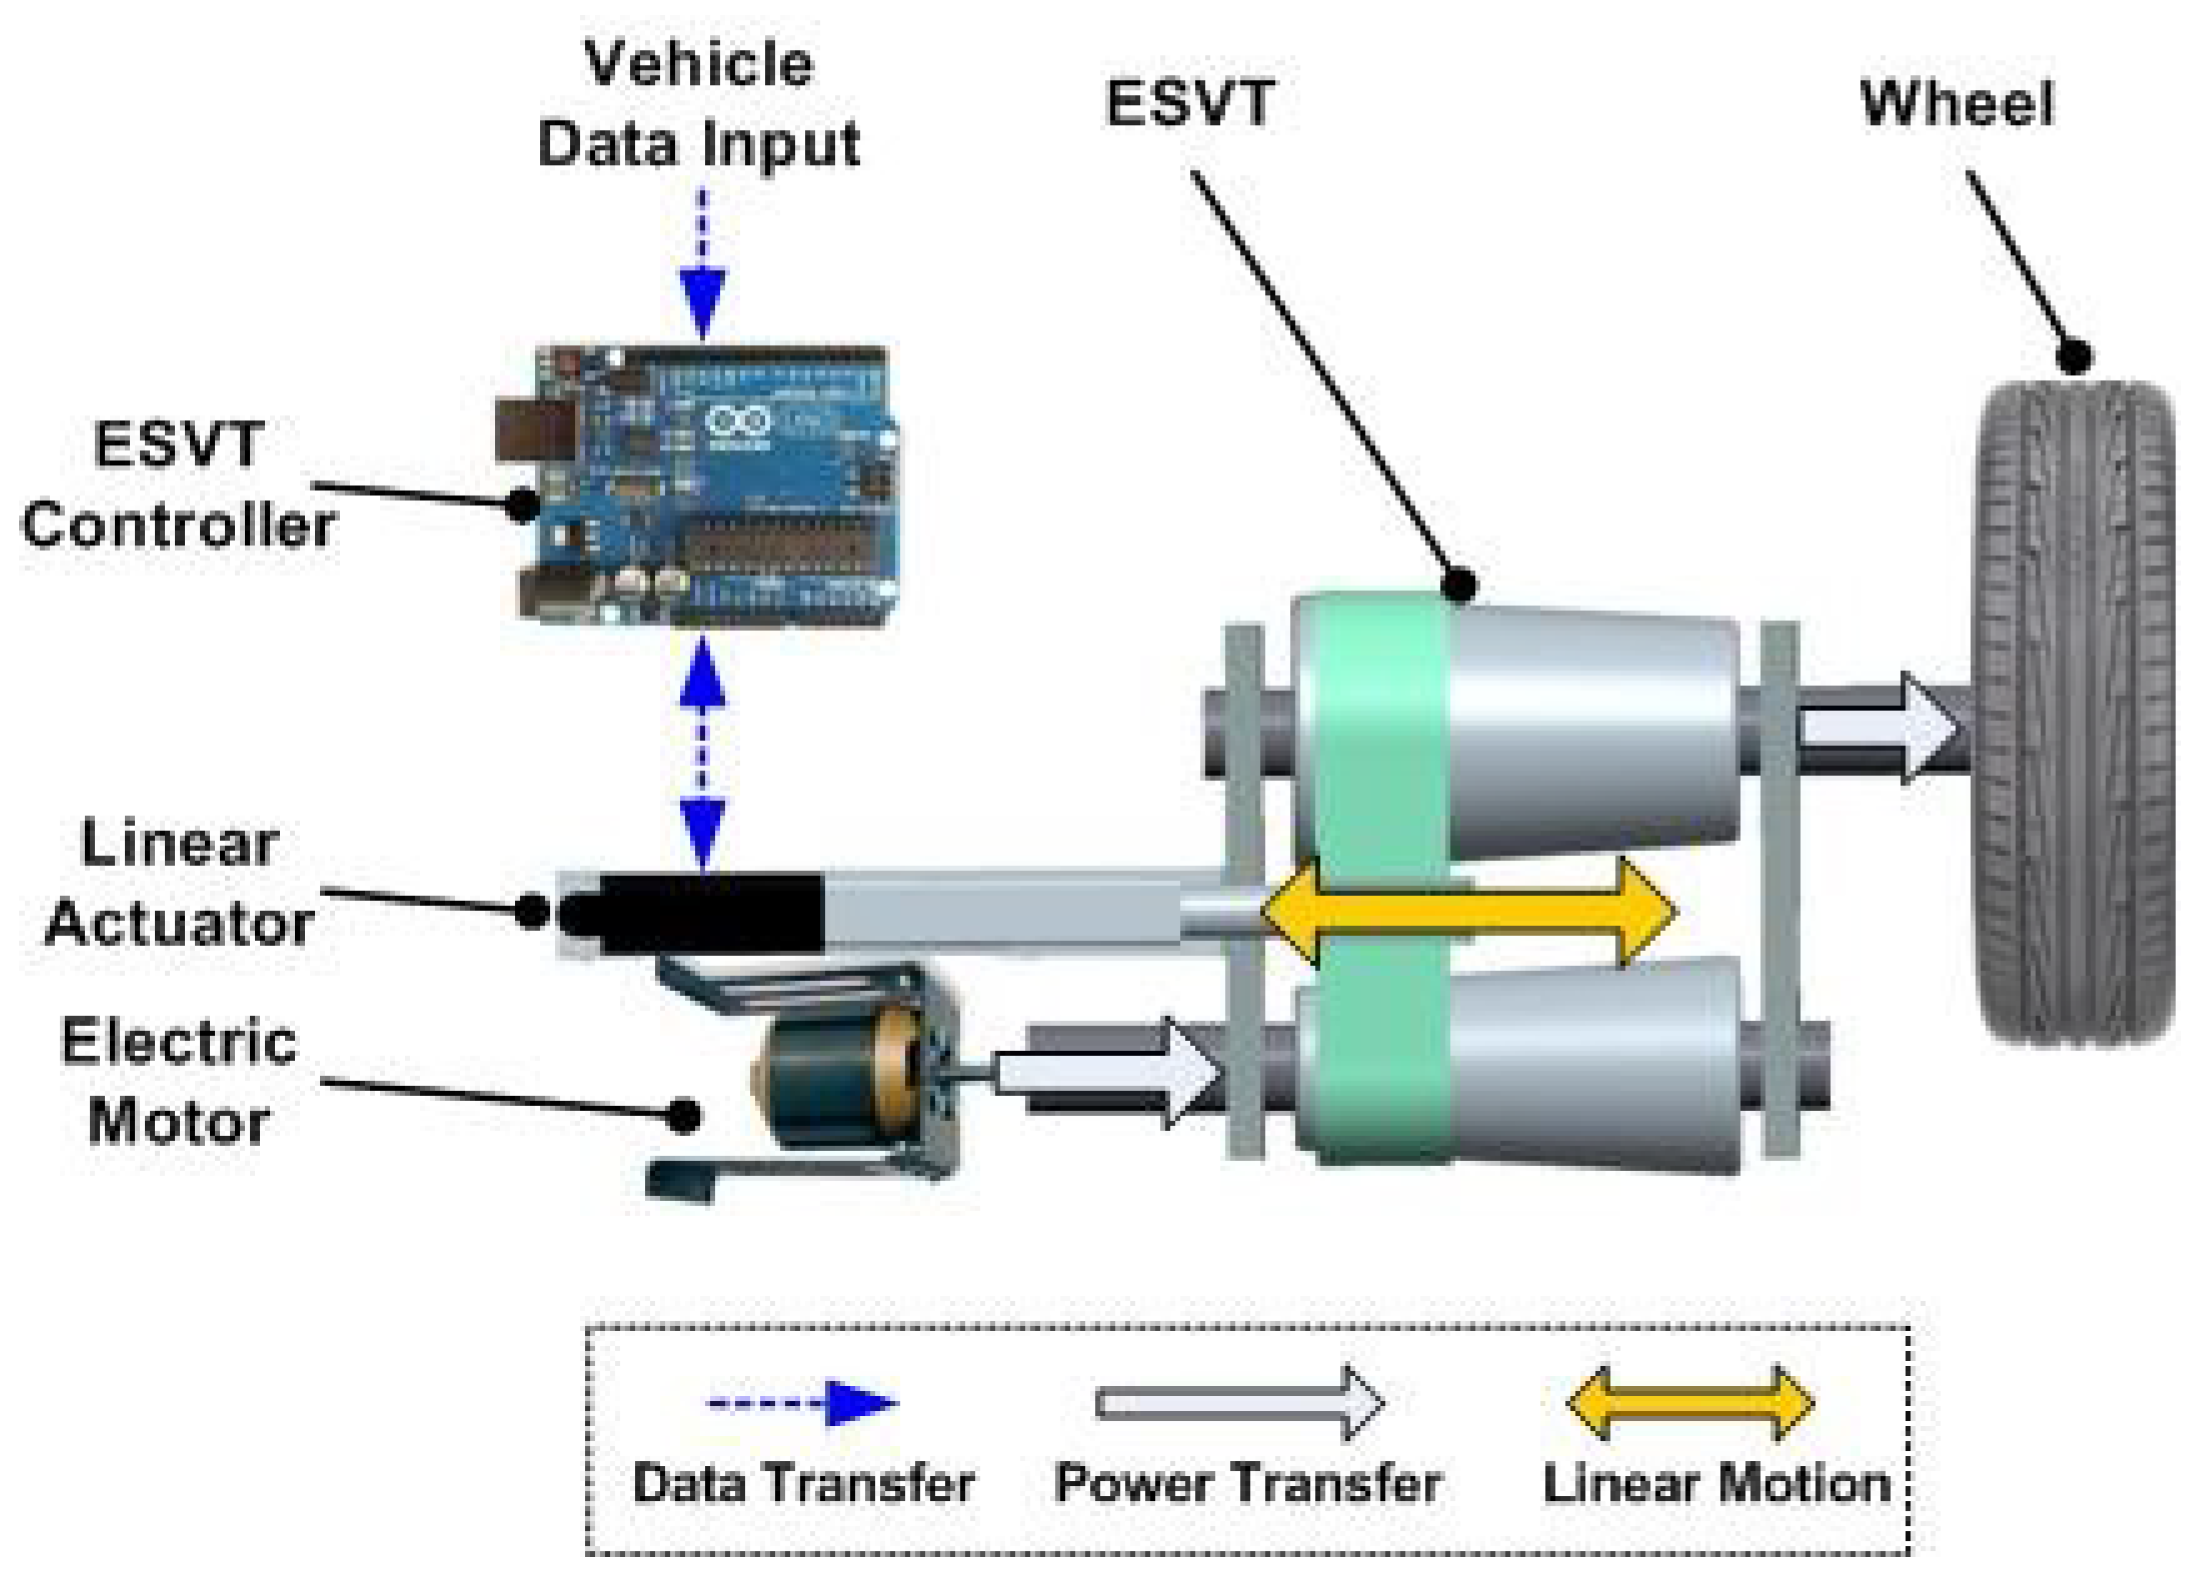
The prototype CVT transmission used was named as an Electronic Shift Variable Transmission (ESVT) and was installed on the ER12 prototype urban vehicle build by TUC Eco Racing team (Technical University of Crete). It is equipped with a real time electronic control of ratio change according to motor rpm, in order to achieve higher motor efficiency and lower energy consumption on a driving cycle. Its operation targets higher traction force thus there is lower consumption at vehicle launch and electronically shifted variable gear ratios ranging from 1.5 to 1 at higher speeds, resulting in electric motor operation in a better efficiency region. In addition to a fixed secondary gear, results to a final drive of 15:1 to 10:1. It is used to compare results of ESVT use versus a single-stage transmission on the same vehicle [8]. A schematic diagram of the ESVT main components is shown in Figure 15.
Experimental results included a test case where the prototype vehicle operated in similar conditions (single lap test) at the same test area (Figure 8). Testing was performed initially without the ESVT and subsequently with it. The vehicle was accelerated at full throttle to obtain comparable results with limited driver intervention. The overall hydrogen consumption was lower using the ESVT (4.3% improvement). As already discussed, according to our literature review simulation results of CVT versus single stage transmissions showed 5–12.4% reduction on energy consumption for specific driving cycles. Since our experimental results show a 4.3% reduction in consumption for just one lap (corresponding to just one launch), it can be assumed that a very good correlation to simulation results exists.
3.4. Results Evaluation
There are several insights extruded by the experimental results presented. Regarding vehicle performance, the vehicle can achieve higher acceleration using the gearbox, corresponding to slightly lower time needed to complete the two laps in track. As shown in the comparison of Figure 9, Figure 10, Figure 11, Figure 12, Figure 13 and Figure 14, the single stage transmission needs 83 s to complete the test, while the 2-speed gearbox times vary between 80–81 s. Time up to corner (1)–(2) is lower in every case of the 2-speed transmission. It was highlighted that hydrogen consumption can be reduced up to 3.4% (No gearbox: 4.43 lt , 2-speed gearbox: 4.28 lt ), and mean power demand up to 3.8%. Even though this percentage seems low, it must be noted that tests conducted included just one launch during the laps. The same experimentation in a city driving cycle where often stop & go are necessary, may lead to further reduction of the energy consumption.
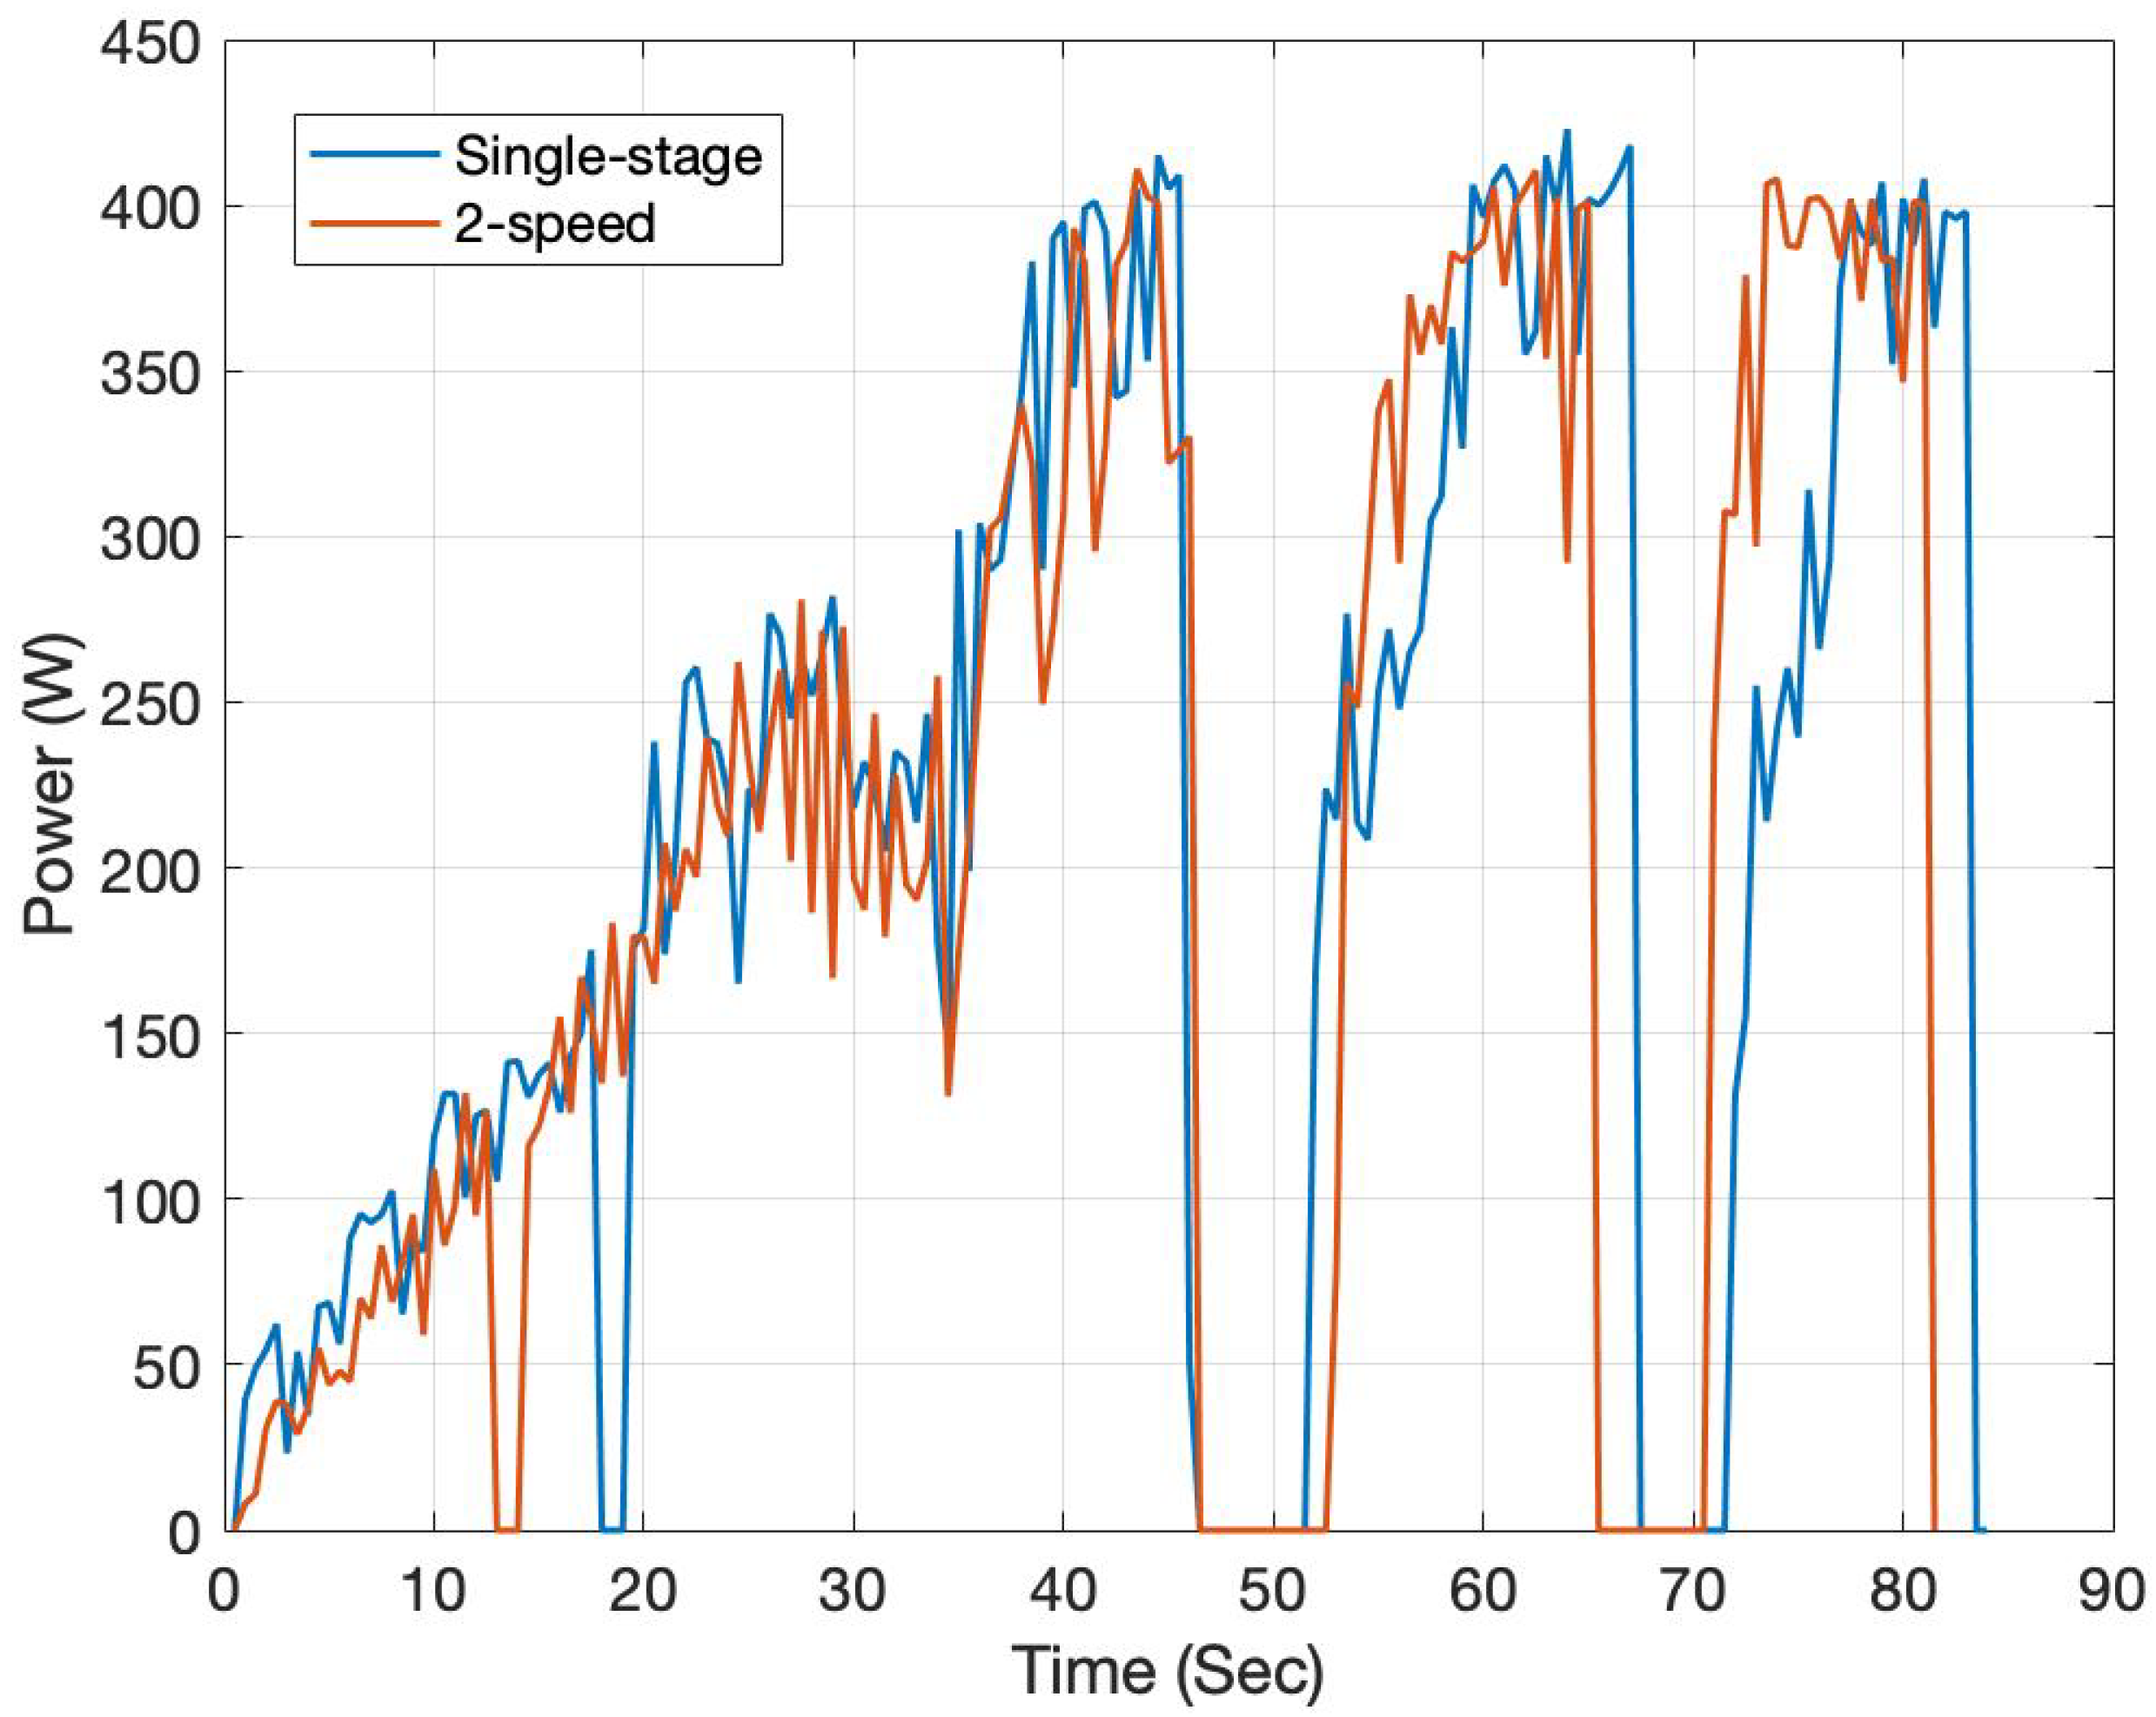
Another key finding was that gear change speed significantly impacts the energy consumption of an electric vehicle, and it can be reduced up to 4% or raised up to 11% (Table 2). As shown in Figure 16, there is lower energy demand on launch acceleration, but increased energy consumption in higher gear change speeds, since high electric motor rpm (in first gear) corresponds to motor poor efficiency region. In high vehicle speeds (with full throttle), increased power demand is found mainly due to gearbox losses. According to the above, a 2-speed gearbox can provide lower energy consumption but depends heavily on gear shift strategy. On the other hand, better vehicle performance is achieved.
Finally, the experimental results presented are compared to the simulated results found in literature [6,19,20]. It should be noted that to the best of our knowledge, there is no equivalent usage of on road testing with different transmission types and a detailed comparison of their effect. As so, according to literature, simulation results reveal that in a city driving circle, the energy consumed energy is reduced by 3.2–11% using a 2-speed versus single stage transmission. In our experimental results, 3.8% reduction is found in a 2-lap test. Thus, higher reduction should be expected for a city driving cycle that has more stop and go stages.
Regarding the CVT use, literature simulations indicated gains on energy consumption up to 12.5% for specific driving cycles. Our experimental results (using a prototype electronically controlled CVT) presented 4.3% energy reduction compared to single stage results, for just one lap test, so very good correlation to simulation results exists. It should be noted though that CVT drawbacks should be accounted for, such as weight, complexity and power losses.
All the above-mentioned conclusions point out that multiple stage transmissions use in electric vehicles can be an important factor to achieve lower energy consumption.
4. Conclusions
The on-road testing of different transmission using a custom electric testbed, powered by hydrogen fuel cell, is presented. The different configurations included a Standard Powertrain setup and Gearbox setup and a prototype 2-speed gearbox. We explored their performance as well as the effect of different gear change at different speeds. Experimental results showed that a 2-speed gearbox can provide lower energy consumption (up to 3.8%) but depends heavily on gear shift strategy. As such, gear change speed is of great importance and should be optimized to reach even higher levels of energy consumption reduction. Experimental results using a prototype electronically controlled CVT were also presented, indicating 4.3% energy reduction compared to single stage results, for just one lap test. All the experimental results presented for different transmissions use are compared to the simulated results found in literature. A good correlation is found regarding the use of single-stage, 2-speed and CVT transmissions.
Future work will be focused on new on road experiments that will reduce the driver’s influence on results. This can be achieved by using the new platforms developed by the TUCER team, where throttle control can be defined either as a standard input of predefined values or using speed control over the track. Finally, simulation results will be provided based on the specific vehicle dynamic simulation, but validated through experimental testing, providing adequate results over different driving cycles.
Author Contributions
P.S. performed the original conceptualization, investigation, developed the methodology and contributed to the original manuscript writing. N.C.T. supervised the research effort and reviewed and edited the manuscript. L.D. formally analyzed the data, validated the experimental results and contributed to the original manuscript writing and editing. E.S.K. dealt with data curation and reviewed and edited the manuscript.
Funding
This work has been partially funded by the TUC’s internal project ”TUC Eco Racing team”.
Conflicts of Interest
The authors declare no conflict of interest.
References
- Chatelain, A.; Erriquez, M.; Mouliére, P.Y.; Schäfer, P. What a Teardown of the Latest Electric Vehicles Reveals about the Future of Mass-Market EVs; Technical Report; McKinsey: New York, NY, USA, 2018. [Google Scholar]
- Miller, J. Hybrid electric vehicle propulsion system architectures of the e-CVT type. IEEE Trans. Power Electron. 2006, 21, 756–767. [Google Scholar] [CrossRef] [Green Version]
- Ehsani, M.; Gao, Y.; Emadi, A. Modern Electric, Hybrid Electric, and Fuel Cell Vehicles: Fundamentals, Theory, and Design; Power Electronics and Applications; CRC Press: New York, NY, USA, 2009. [Google Scholar]
- Kluger, M.A.; Long, D. An Overview of Current Automatic, Manual and Continuously Variable Transmission Efficiencies and Their Projected Future Improvements; SAE Technical Paper Series; SAE International: Warrendale, PA, USA, 1999; Volume 1259. [Google Scholar]
- Spanoudakis, P. Design and Tuning of Operational Parameters for a Prototype Transmission System. Ph.D. Thesis, Technical University of Crete, Chania, Greece, 2013. [Google Scholar]
- Holdstock, T. Investigation Into Multiple-Speed Transmissions for Electric Vehicles. Ph.D. Thesis, University of Surrey, Guildford, UK, 2014. [Google Scholar]
- Bottiglione, F.; Pinto, S.D.; Mantriota, G.; Sorniotti, A. Energy Consumption of a Battery Electric Vehicle with Infinitely Variable Transmission. Energies 2014, 7, 8317–8337. [Google Scholar] [CrossRef] [Green Version]
- Spanoudakis, P.; Tsourveloudis, N.C. On the efficiency of a prototype Continuous Variable Transmission system. In Proceedings of the 21st Mediterranean Conference on Control and Automation, Chania, Crete, Greece, 25–28 June 2013; pp. 290–295. [Google Scholar] [CrossRef]
- Mantriota, G. Fuel consumption of a vehicle with power split CVT system. Int. J. Veh. Des. 2005, 37, 327–342. [Google Scholar] [CrossRef]
- Zhang, Z.; Zuo, C.; Hao, W.; Zuo, Y.; Zhao, X.L.; Zhang, M. Three-speed transmission system for purely electric vehicles. Int. J. Automot. Technol. 2013, 14, 773–778. [Google Scholar] [CrossRef]
- Qin, D.; Zhou, B.; Hu, M.; Hu, J.; Wang, X. Parameters design of powertrain system of electric vehicle with two-speed gearbox. J. Chongqing Univ. 2011, 34, 1–6. [Google Scholar]
- Spanoudakis, P.; Tsourveloudis, N.C. A prototype variable transmission system for electric vehicles: Energy consumption issues. Int. J. Automot. Technol. 2015, 16, 525–537. [Google Scholar] [CrossRef]
- Bingzhao, G.; Qiong, L.; Lulu, G.; Hong, C. Gear ratio optimization and shift control of 2-speed I-AMT in electric vehicle. J. Mech. Syst. Signal Process. 2015, 50, 615–631. [Google Scholar]
- Sorniotti, A.; Pilone, G.L.; Viotto, F.; Bertolotto, S. A novel seamless 2-speed transmission system for electric vehicles: Principles and simulation results. SAE Int. J. Engines 2011, 4, 2671–2685. [Google Scholar] [CrossRef]
- Spanoudakis, P.; Tsourveloudis, N.C.; Koumartzakis, G.; Krahtoudis, A.; Karpouzis, T.; Tsinaris, I. Evaluation of a 2-speed transmission on electric vehicle’s energy consumption. In Proceedings of the 2014 IEEE International Electric Vehicle Conference (IEVC), Florence, Italy, 17–19 December 2014. [Google Scholar]
- Elmarakbi, A.; Morris, A.; Ren, Q.; Elkady, M. Modelling and Analyzing Electric Vehicles with Geared Transmission Systems: Enhancement of Energy Consumption and Performance. Int. J. Eng. Res. Technol. 2013, 2, 1215–1254. [Google Scholar]
- Sorniotti, A.; Subramanyan, S.; Turner, A.; Cavallino, C.; Viotto, F.; Bertolotto, S. Selection of the Optimal Gearbox Layout for an Electric Vehicle. SAE Int. J. Engines 2011, 4, 1267–1280. [Google Scholar] [CrossRef]
- Rinderknecht, S. Electric power train configurations and their transmission systems. In Proceedings of the International Symposium on Power Electronics Electrical Drives Automation and Motion (SPEEDAM), Pisa, Italy, 14–16 June 2010; pp. 1564–1568. [Google Scholar]
- Knödel, U.; Stube, A.; Blessing, U.C.; Klosterman, S. Design and Implementation of requirement-driven electric drives. ATZ Worldw. 2010, 112, 56–60. [Google Scholar] [CrossRef]
- Ren, Q.; Crolla, D.; Morris, A. Effect of transmission design on Electric Vehicle (EV) performance. In Proceedings of the 2009 IEEE Vehicle Power and Propulsion Conference, Dearborn, MI, USA, 7–11 September 2009; pp. 1260–1265. [Google Scholar] [CrossRef]
- Loveday, E. Vocis Says Two-Speed Electric Vehicle Transmission Will Boost Battery Life. Available online: https://www.autoblog.com/2011/08/19/vocis-says-two-speed-electric-vehicle-transmission-will-boost-ba/?guccounter=1 (accessed on 1 December 2018).
- McKeegan, N. Antonov’s 3-Speed Transmission for Electric Vehicles Boosts Efficiency by 15 Percent. Available online: http://www.gizmag.com/antonov-3-speed-transmission-ev/19088/ (accessed on 1 December 2018).
- Kreisel Unveils an Automated 2-Speed Transmission for Electric Cars. Available online: https://electrek.co/2018/09/06/kreisel-automated-2-speed-transmission-electric-cars/ (accessed on 1 December 2018).
- NexaTM Power Module User’s Manual; Ballard Power Systems Inc.: Burnaby, BC, Canada, 2003.
Figure 1.
The prototype testbed vehicle ER16.

Figure 2.
Testbed vehicle standard powertrain configuration.

Figure 3.
Testbed vehicle powertrain configuration with installed gearbox.

Figure 4.
Detailed drawing of 1st and 2nd transmission stages, showing electronically controlled gear change mechanism and corresponding gear ratios.
Figure 4.
Detailed drawing of 1st and 2nd transmission stages, showing electronically controlled gear change mechanism and corresponding gear ratios.

Figure 5.
A view of the custom built prototype 2-speed gearbox.

Figure 6.
Motor’s Efficiency vs. motor speed.

Figure 7.
Motor torque measurements vs. motor speed.
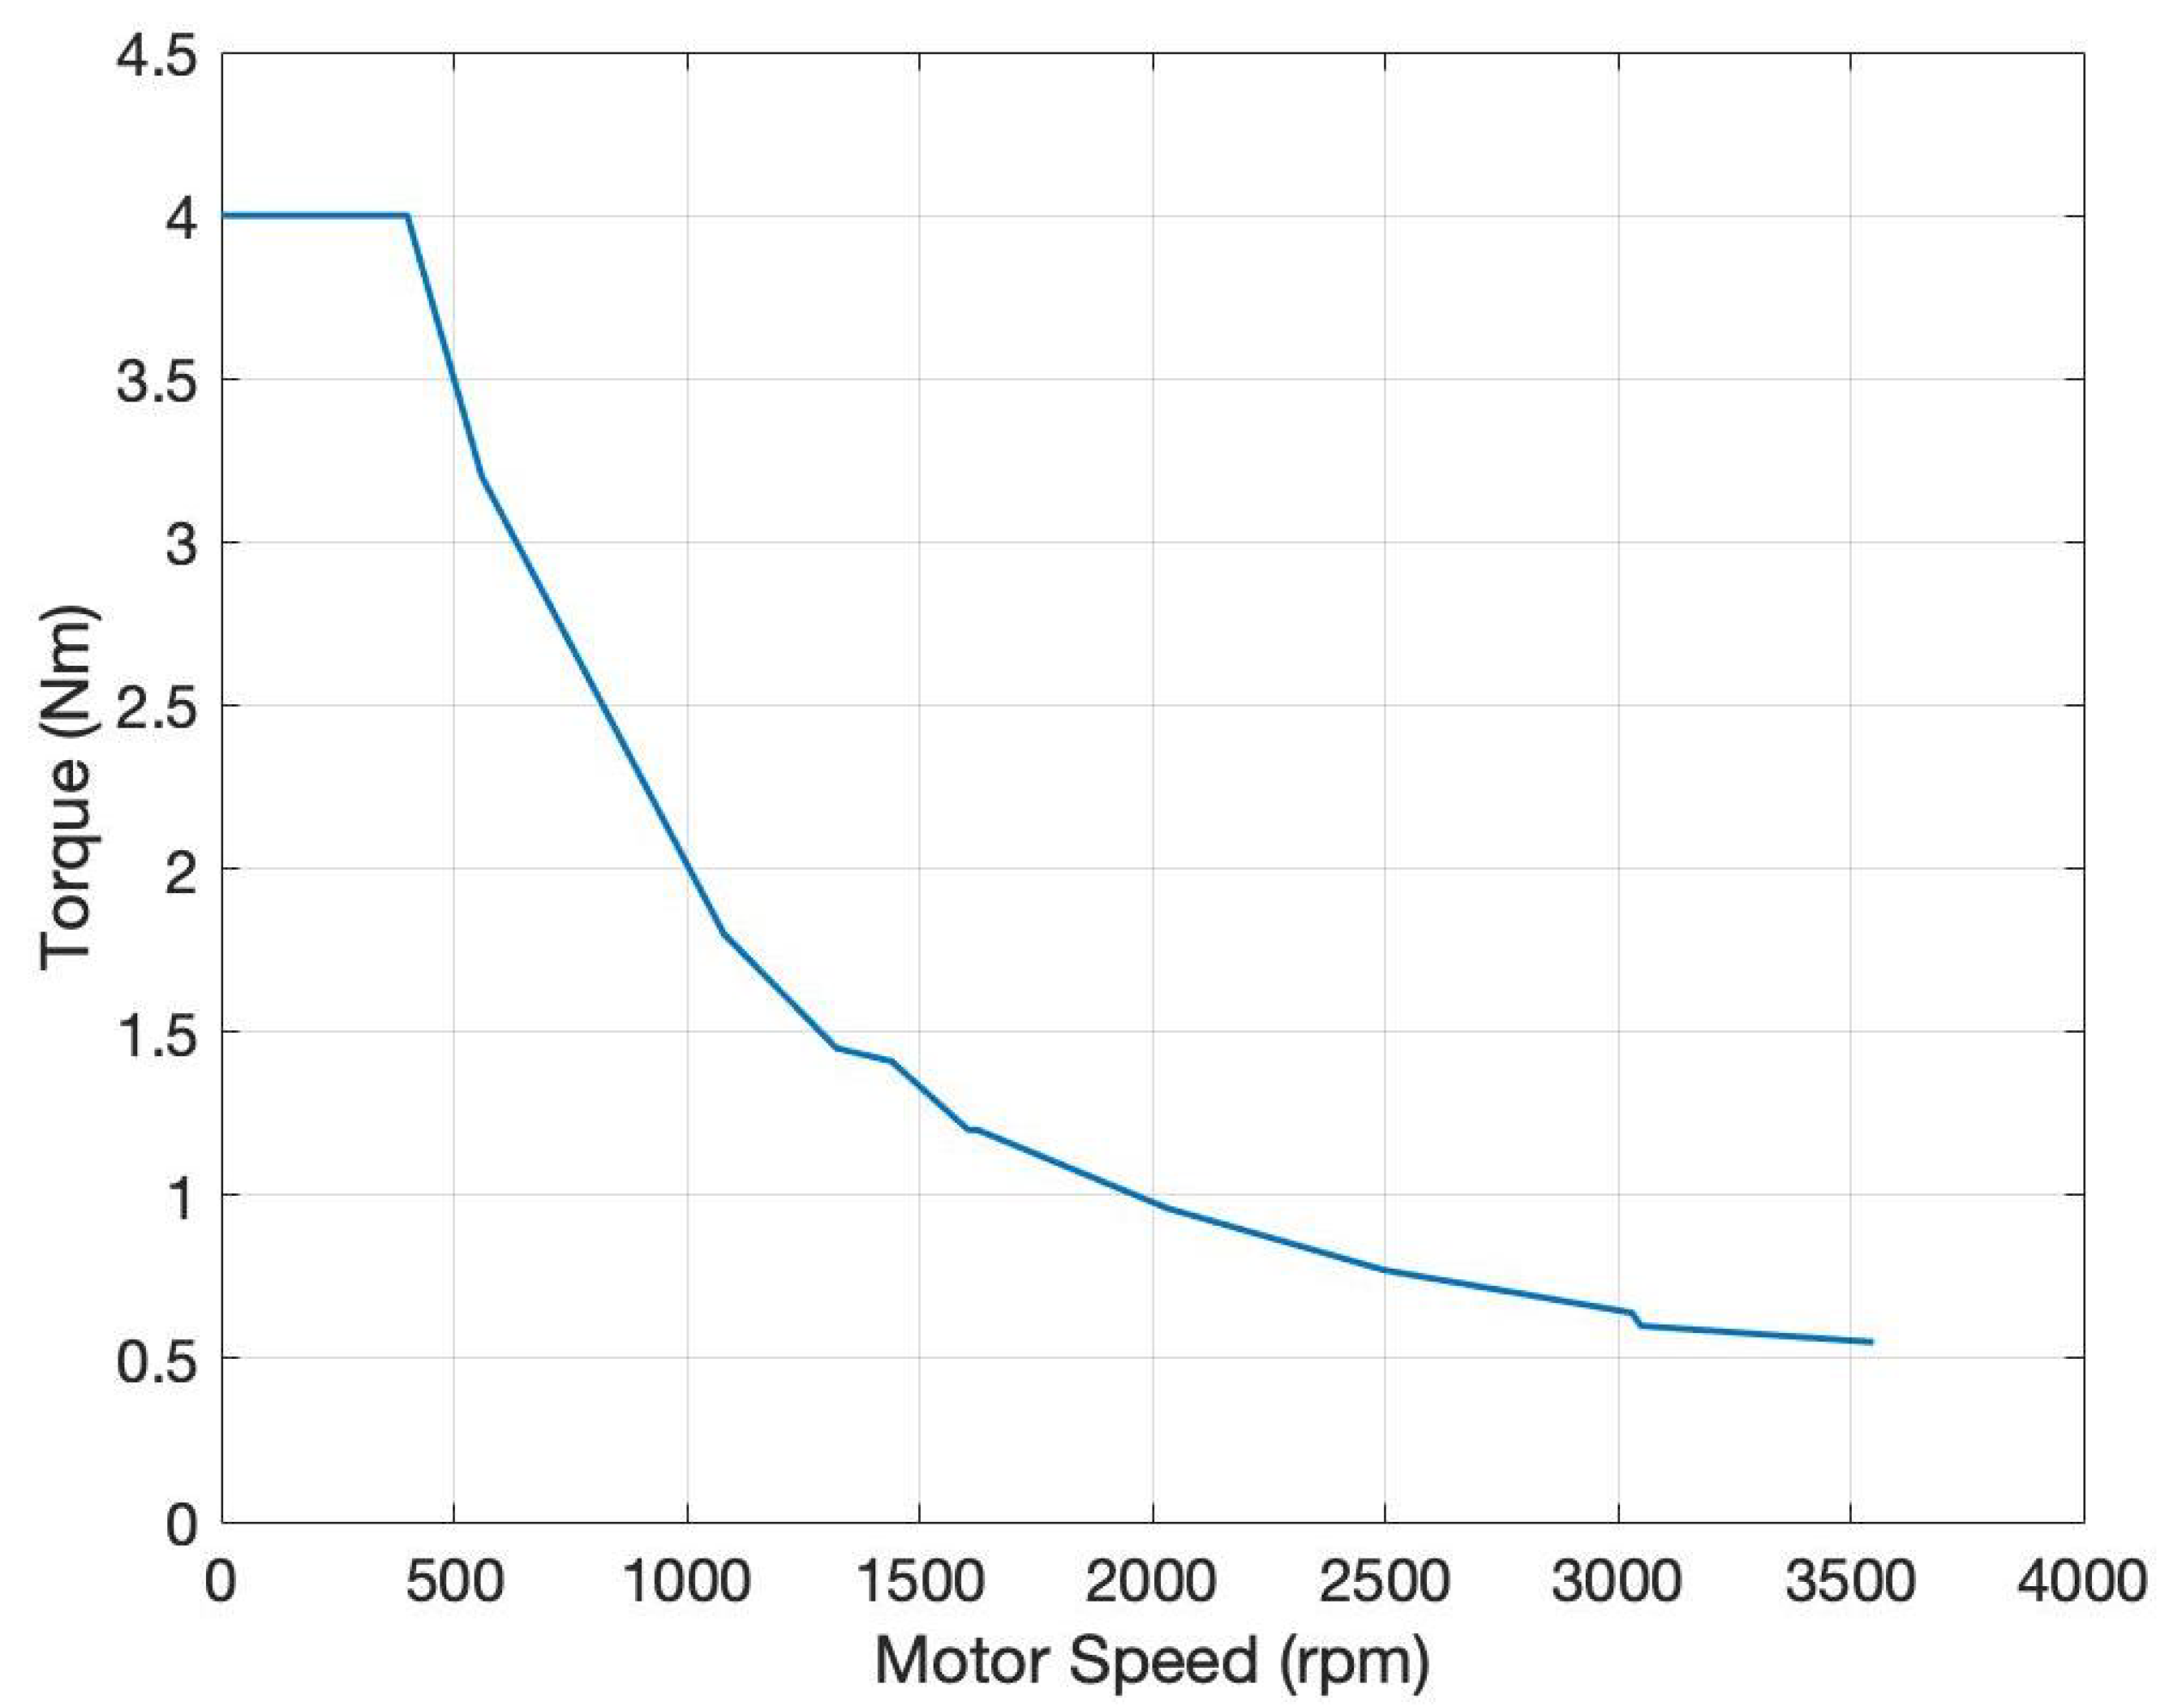
Figure 8.
Test track specifications, used for on road tests.

Figure 9.
Single-stage setup testing.

Figure 10.
Two-Speed gearbox testing (gear change at 8 km/h).

Figure 11.
Two-Speed gearbox testing (gear change at 11 km/h).

Figure 12.
Two-Speed gearbox testing (gear change at 14 km/h).

Figure 13.
Two-Speed gearbox testing (gear change at 17 km/h).

Figure 14.
Two-Speed gearbox testing (gear change at 20 km/h).

Figure 15.
The proposed Electronic Shift Variable Transmission (ESVT) configuration.

Figure 16.
Comparison of power demand of the best gear change speed (11 Km/h) for a 2-speed gearbox setup versus a single-stage transmission.
Figure 16.
Comparison of power demand of the best gear change speed (11 Km/h) for a 2-speed gearbox setup versus a single-stage transmission.


Table 1.
Testbed Vehicle Specification.
| Characteristic | |
|---|---|
| Chassis | Aluminum alloy |
| Body | Carbon fiber |
| Motor | Brushless electric motor |
| Max Motor Torque | 4 Nm |
| Max Motor rpm | 4000 rpm |
| Power Source | fuel cell, 1.2 KW |
| Dimension | 2.5 × 1.25 × 1 m (L × W × H) |
| Weight | 77 Kg/79 Kg (with gearbox) |
| Max Vehicle Speed | 37 Km/h |
Table 2.
Impact of gear change at different vehicle speeds.
| Gear Change Speed (Km/h) | Mean Power Demand (W) | (lt) |
|---|---|---|
| 8 | 210.12 | 4.37 |
| 11 | 205.38 | 4.28 |
| 14 | 221.32 | 4.49 |
| 17 | 232.09 | 4.58 |
| 20 | 235.82 | 4.62 |
© 2019 by the authors. Licensee MDPI, Basel, Switzerland. This article is an open access article distributed under the terms and conditions of the Creative Commons Attribution (CC BY) license (http://creativecommons.org/licenses/by/4.0/).
Share and Cite
MDPI and ACS Style
Spanoudakis, P.; Tsourveloudis, N.C.; Doitsidis, L.; Karapidakis, E.S. Experimental Research of Transmissions on Electric Vehicles’ Energy Consumption. Energies 2019, 12, 388. https://doi.org/10.3390/en12030388
AMA Style
Spanoudakis P, Tsourveloudis NC, Doitsidis L, Karapidakis ES. Experimental Research of Transmissions on Electric Vehicles’ Energy Consumption. Energies. 2019; 12(3):388. https://doi.org/10.3390/en12030388
Chicago/Turabian StyleSpanoudakis, Polychronis, Nikolaos C. Tsourveloudis, Lefteris Doitsidis, and Emmanuel S. Karapidakis. 2019. "Experimental Research of Transmissions on Electric Vehicles’ Energy Consumption" Energies 12, no. 3: 388. https://doi.org/10.3390/en12030388
Note that from the first issue of 2016, this journal uses article numbers instead of page numbers. See further details here.