Analysis of Energy Storage Implementation on Dynamically Positioned Vessels


1
Faculty of Maritime Studies, University of Rijeka, Studentska 2, 51000 Rijeka, Croatia
2
Faculty of Engineering, University of Rijeka, Vukovarska 58, 51000 Rijeka, Croatia
*
Author to whom correspondence should be addressed.
Energies 2019, 12(3), 444; https://doi.org/10.3390/en12030444
Submission received: 28 November 2018
/
Revised: 29 January 2019
/
Accepted: 30 January 2019
/
Published: 30 January 2019
(This article belongs to the Special Issue 100% Renewable Energy Transition: Pathways and Implementation)
Abstract
:Blackout prevention on dynamically positioned vessels during closed bus bar operation, which allows more efficient and eco-friendly operation of main diesel generators, is the subject of numerous studies. Developed solutions rely mostly on the ability of propulsion frequency converters to limit the power flow from the grid to propulsion motors almost instantly, which reduces available torque until the power system is fully restored after failure. In this paper, a different approach is presented where large scale energy storage is used to take part of the load during the time interval from failure of one of the generators until the synchronization and loading of a stand-by generator. In order to analyze power system behavior during the worst case fault scenario and peak power situations, and to determine the required parameters of the energy storage system, a dynamic simulation model of a ship electrical power system is used. It is concluded that implementation of large scale energy storage can increase the stability and reliability of a vessel’s electrical power system without the need for the reduction of propulsion power during a fault. Based on parameters obtained from simulations, existing energy storage systems were evaluated, and the possibility of their implementation in the maritime transportation sector was considered. Finally, an evaluation model of energy storage implementation cost-effectiveness was presented.
1. Introduction
Dynamic positioning (DP) is used for the automatic control of a vessel’s position when performing exploitation tasks such as underwater drilling, cable laying, building offshore constructions, etc. The movement of modern DP vessels is controlled by means of a complex system consisting of filters, observers, controllers, and propeller allocation systems. Many propulsion systems are diesel-electric, meaning that electrical energy is produced by synchronous generators driven by diesel-engines and the speed of electrical propulsion motors is controlled via static frequency converters.
With respect to power system redundancy requirements, DP vessels are divided into three classes: DP 1, DP 2, and DP 3. The power system on DP 1 class vessels does not need to be redundant. For DP 2 class vessels it must be possible to divide the system into two or more sections in such way that at least one section will remain operable after single fault. All requirements for DP 2 class vessels must be applied to DP 3 class vessels, but in addition to that every sub-system should be physically separated and located in different compartments [1].
When the vessel is in DP mode, electrical propulsion generally dominates the total power consumption and requires several diesel generators (DG) running in parallel in order to maintain the stability of the electrical power supply and thus the vessel’s ability to keep its desired position. Maximum efficiency and cost-effectiveness of the electrical power plant is achieved when DGs are running with optimal load (typically between 80% and 90% of the maximum rated power, Pr, for modern medium speed diesel engines). On the other hand, when DGs are running with an optimal load in closed bus bar configuration, the power system becomes more sensitive to step load increase caused by the sudden loss of one or more online generators, which may result in activation of appropriate protection circuits and very likely a partial or total blackout [2].
DP vessels are usually used in demanding and expensive off-shore projects, meaning that such blackouts may have negative, and sometimes even fatal, effects on the realized economic benefits (cutting the underwater cable or pipeline, abortion of drilling operation, etc.). Also, in specific cases (underwater drilling and off-shore oil exploitation) the risk of environmental incidents is significantly increased.
Current solutions for blackout prevention on DP vessels mainly rely on the ability of propulsion frequency converters to cut or reduce energy flow toward the propulsion motor almost instantly, allowing very fast load reduction (FLR) during a fault scenario. The frequency based load shedding (FBLS) method is taken from land based power grids and is activated when the frequency drops below a given set point [3,4]. The event based FLR (EB-FLR) algorithm activates load reduction after the power management system (PMS) receive the signal that one of the online generators has been disconnected from the grid [5]. In the fast phased back system (FPBS), frequency is monitored on every single propulsion unit which significantly reduces the time required for sending and processing information when a fault occurs [6]. The observer based fast load reduction (OB-FLR) algorithm detects the sudden disconnection of online generators by comparing electrical and mechanical torque. Available torque is calculated from available power that is determined by tracking the average acceleration of all online generators [7]. The advanced generator protection (AGP) system relies on parameters that are common to all electrical power systems where the main electrical sources (generator) are connected on the same bus bar. Individual parameters of every online generator are monitored and compared with parameters measured on the common bus bar in order to identify deviations from expected network behavior, and which can be manifested as serious faults in early warnings for potential system failures [8]. Dynamic load prediction (DLP) and dynamic load control (DLC) methods are based on future load prediction and direct communication with the generator control system and DP system in order to minimize sudden load changes by tolerating small changes in the vessel’s position within the allowed tolerances [9].
The above-mentioned methods can significantly increase the availability of the vessel’s electrical power plant, but they are still not able to predict and prevent the possible blackout situations caused by rapidly-developing faults on the main DGs, such as an engine governor fault, automatic voltage regulator (AVR) fault, the sudden trip of the engine, a short circuit, etc. Such faults will most certainly lead to the loss of one or more generator sets from the grid, which will instantly limit the available propulsion torque until the power is fully restored after the failure, which in extreme conditions may affect the vessel’s position, or in some cases initiate blackout of the power system section under the fault. After the loss of one or more generator sets power can be fully restored after stand-by generator sets connect to the grid and take the required load, which should be done in a maximum of 45 s [10], but in practice this time rarely exceed 30 s.
One of the solutions for the stated problem, especially when used in combination with FLR methods, could be using large scale renewable energy storage (ES) during the short periods between the loss of one generator and the synchronization of stand-by generators to the grid, thus preserving the continuity of the electrical power supply. In addition to that, ES can also be used for covering short-term peak loads during operation in rough sea conditions, thus eliminating the need for the often unnecessary starting of stand-by generators.
The idea of ES implementation onboard marine vessels is not new. It has been the subject of research testing on board US Navy ships for many years, mainly related to amortization of peak power up to 250 kW, caused by the electric start and propulsion systems [11,12], and large short term pulsed loads caused by using electromagnetic weapons on future all-electric ships. For example, the flywheel based ES system for an electric gun system would require 800 MJ of stored energy with a total power of 40 MW. A schematic diagram of an electric navy ship power system with integrated ES can be found in [13] (p. 1). Based on the results of navy ship tests, it has been concluded that implementation of ES systems, primarily in the form of flywheels, super capacitors, and lithium-ion batteries, could also be possible on other types of ships in order to increase power plant reliability and lower the amount of greenhouse gas emissions [14,15].
In this work, the possibility of ES application on DP vessels is analyzed from the perspectives of power plant safety, reliability, and economics. The safety and reliability aspect is manifested through the availability of electrical energy (stored in ES) during the starting process of a stand-by generator, which allows continuity of DP operations and maintenance of the desired position. The economic aspect is mainly related to fuel and maintenance costs savings.
First, issues of blackout prevention and the advantages of operation with a closed bus bar are explained. After that, a simulation model of an electrical power system with ES is presented. Based on the simulation results an overview and evaluation of available ES devices is done. Finally, an evaluation model for ES implementation on DP vessels is presented.
2. Closed Bus Bar Operation and Blackout Prevention
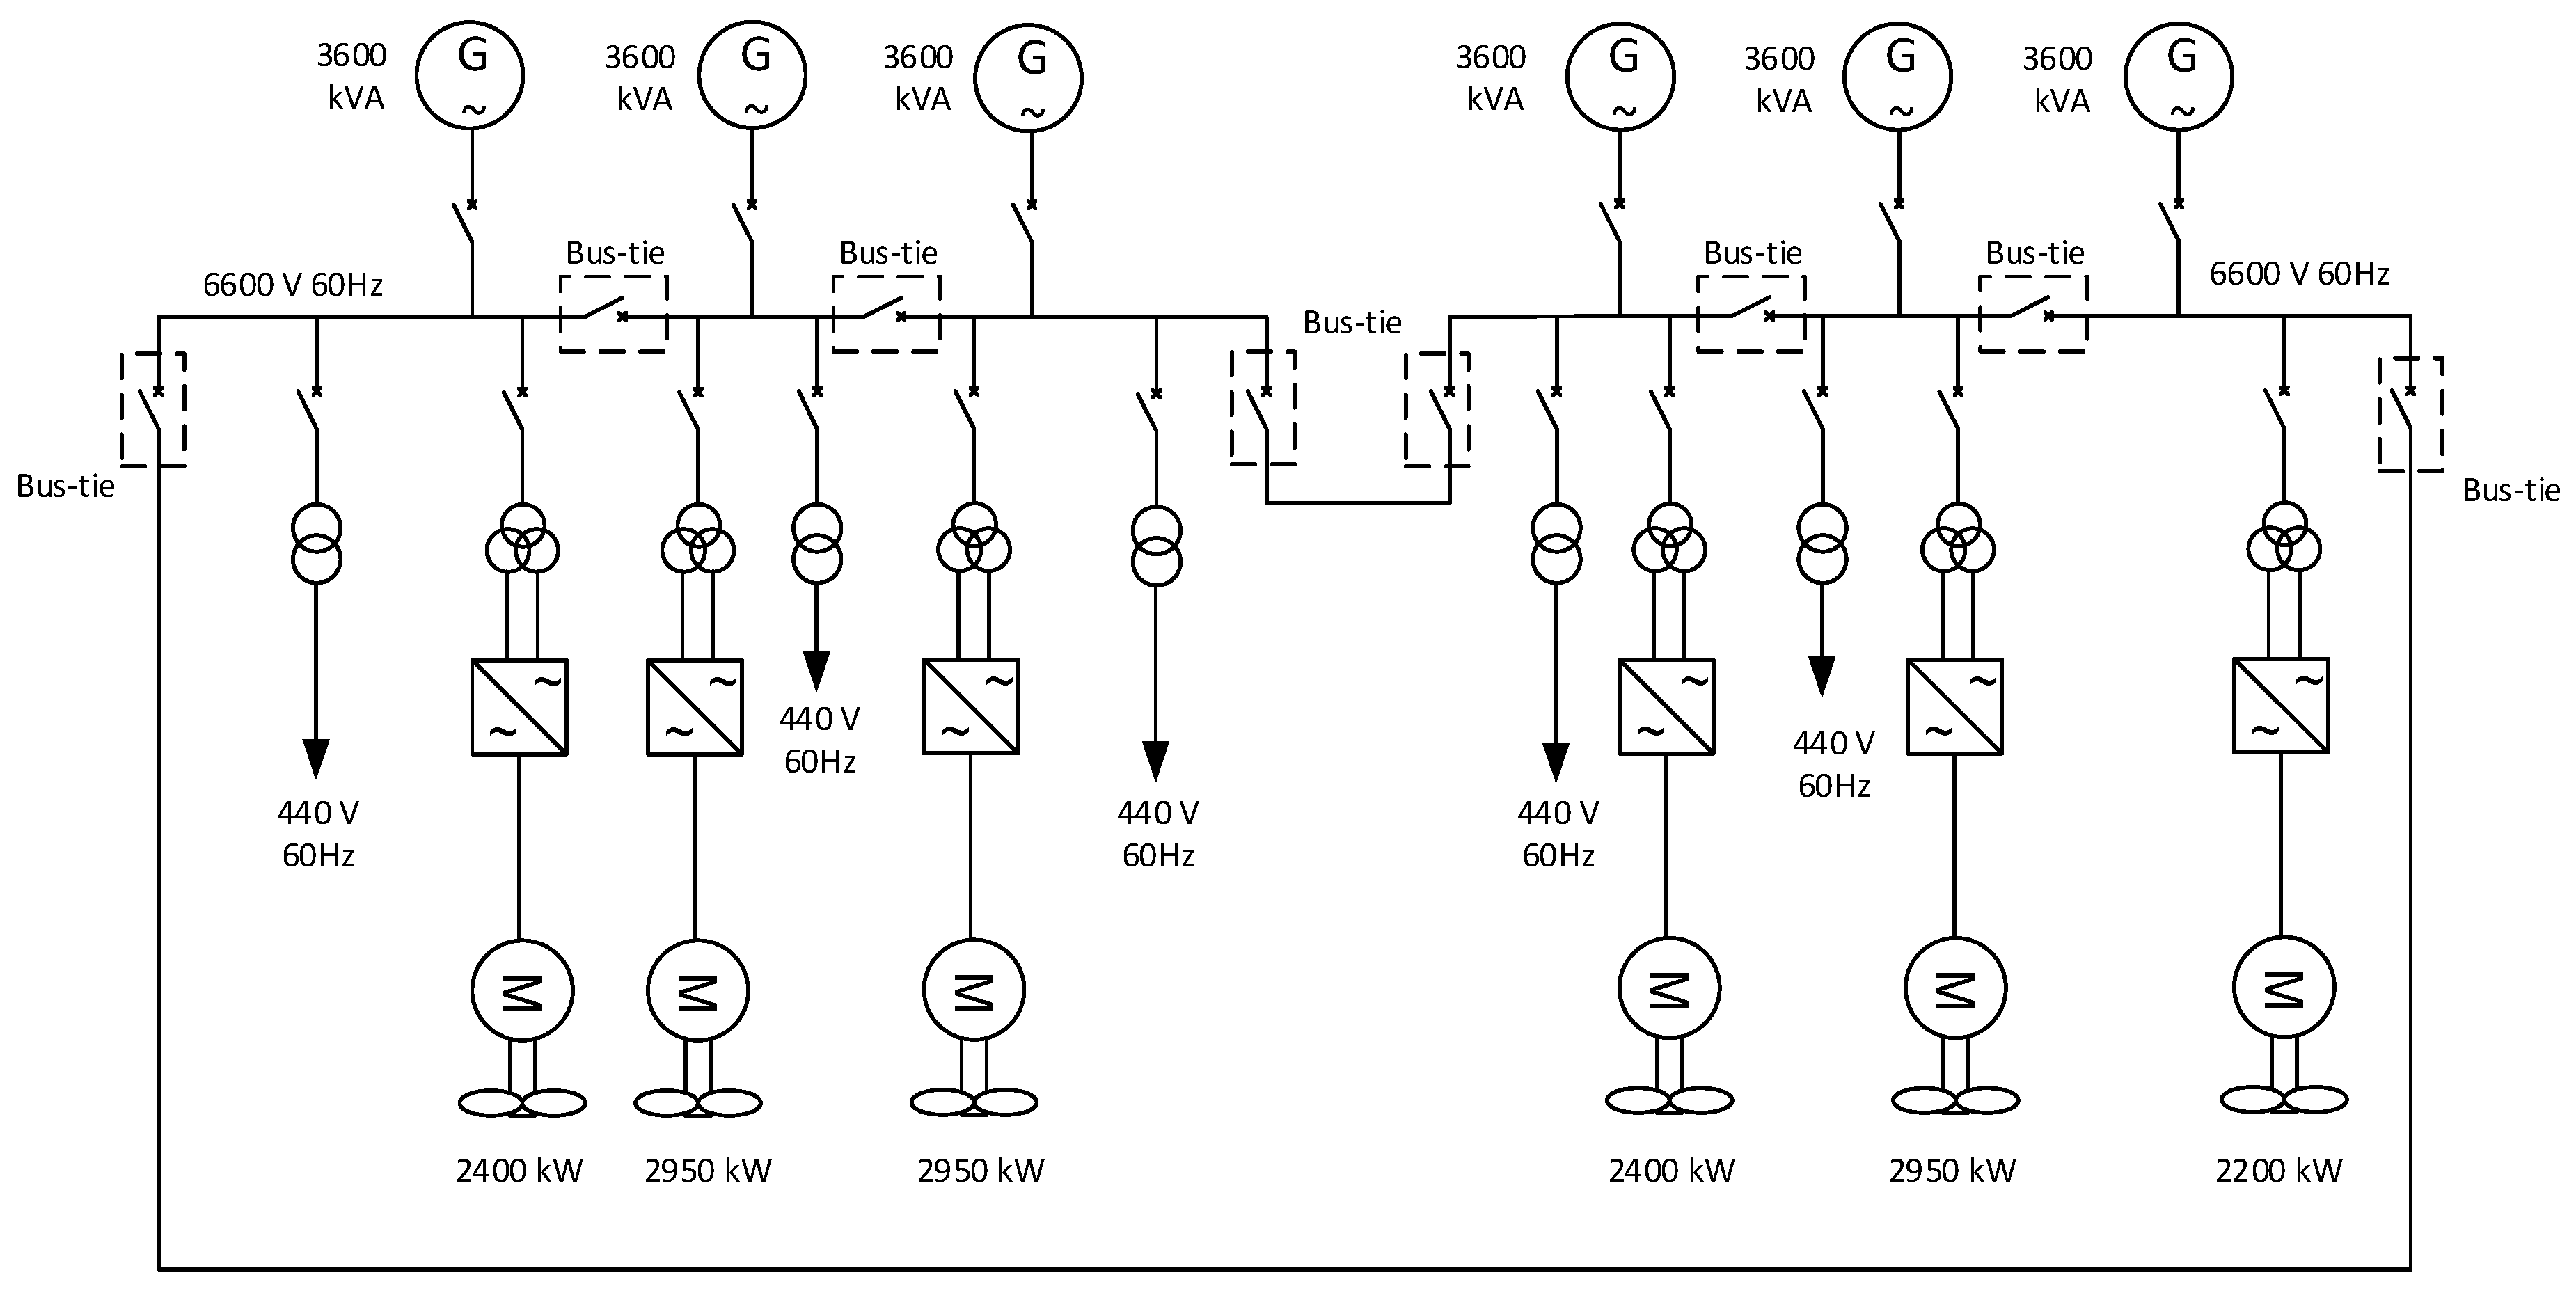
Typical topology of a DP vessel electrical power system is shown in Figure 1. According to class requirements, in case of single fault, the DP vessel must be able to continue its operations without interruption until the remaining methods of holding position are sufficient to overcome external influences [16].
The easiest way to achieve such system integrity is to run the power plant as two (or more) separated systems with open bus-tie breakers [17]. That requires a larger number of generators on the grid than is strictly necessary, so they are running most of the time with a low load (typically 20% to 40% of rated power). This has a negative influence on the economic benefits due to higher fuel consumption, increased greenhouse gas emissions, and more accumulated running hours of diesel engines.
Although this practice is still very common, strict environmental rules and regulations, together with the increase of fuel oil prices, were sufficient incentive for finding an appropriate solution to reduce the risk of system failure during operation with closed bus bars and optimally loaded generators.
The most important challenges for closed bus bar operation are response time and the dynamics of the blackout prevention system, reliability and tolerance to governor and automatic voltage regulator (AVR) faults, power transients, and operation in extreme weather conditions [18,19].
The control algorithms of a vessel’s power management system (PMS) must be able to distinguish short-term transients associated with daily operations and those associated with real faults, without compromising the integrity and security of the power plant. Depending on the current electrical consumption, PMS performs the automatic start and stop of DGs in order to prevent possible blackout situations, trying at the same time to ensure the optimal load on generators. In the event of a blackout, the PMS must automatically re-establish the electrical power supply for normal operation [20].
Class rules typically require DGs to start from stand-by, synchronize, and begin load sharing in a maximum time of 45 s [10]. This means that the PMS system has to anticipate possible load changes in advance, and start additional DGs before overloading the engines. During sudden and unexpected faults, primarily on diesel engines, it is practically impossible to prevent blackout situations without a sufficient power reserve on generators connected to the grid, which is ensured by limiting maximum DG load to a safe value, depending on the current conditions.
To determine safe DG power limits for closed bus bar operation it is assumed that all DGs have the same power ratings, operate in equal load mode, and are capable of taking 55% of the nominal power step load increase without activating under a frequency trip. Although it is not explicitly required by class level, it should be emphasized that generator sets on ships are usually allowed to take a maximum of 110% load during failure. Therefore, the safe DG load limit PDGmax relative to DG rated power Pr during closed bus bar operation for different numbers of online generators N can be expressed as:
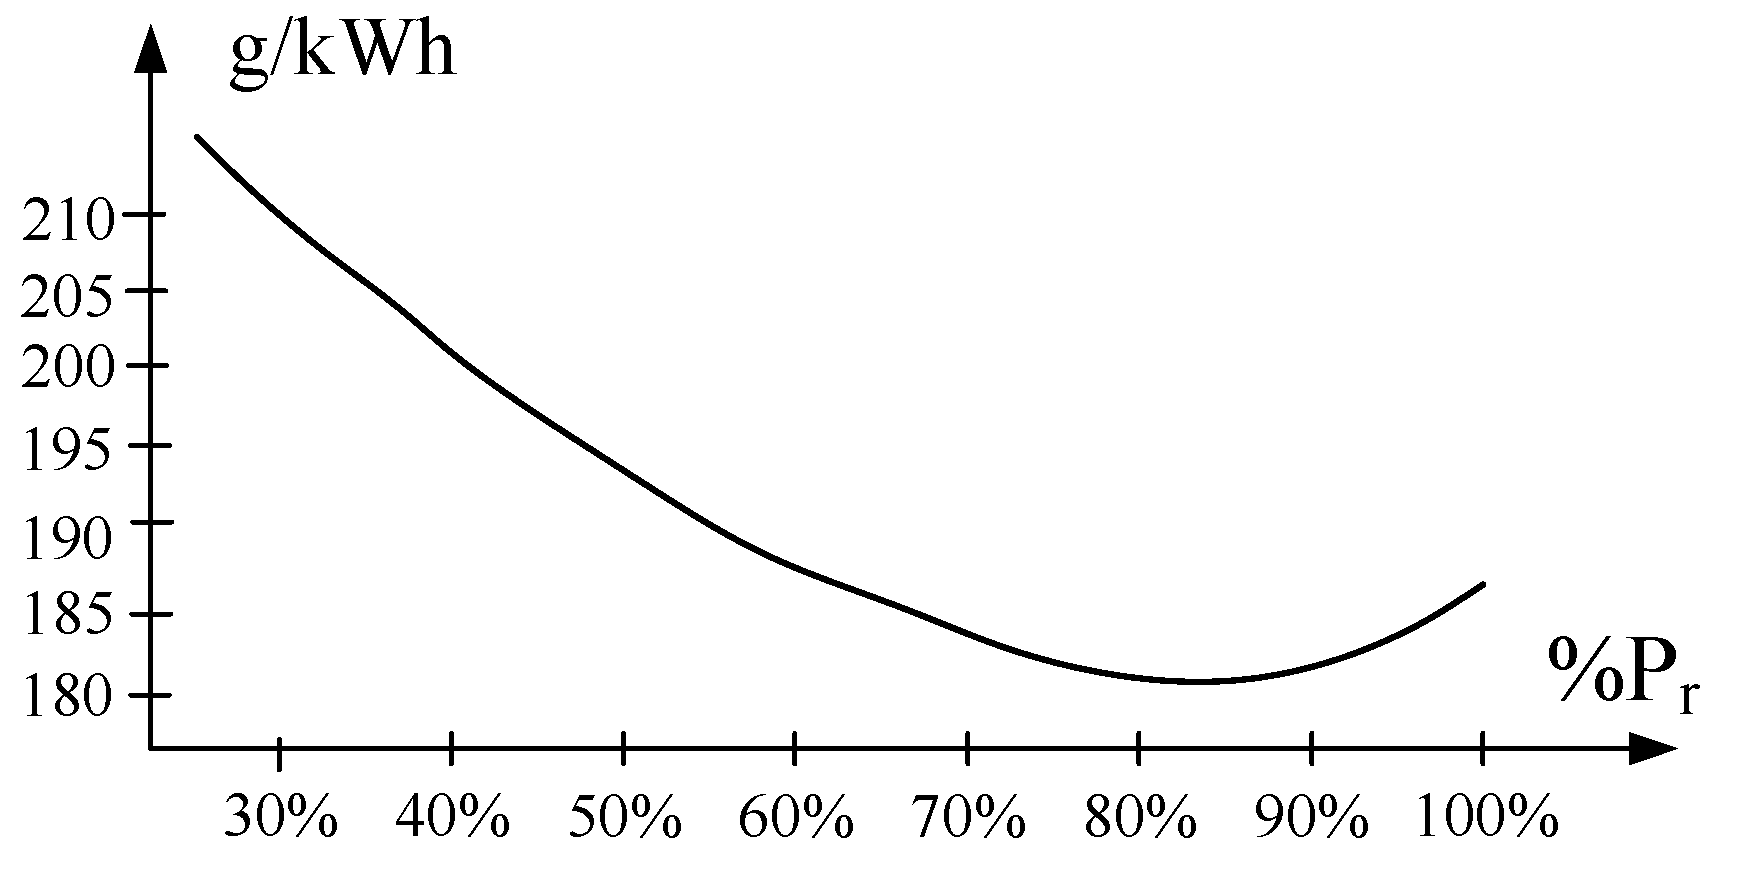
A specific fuel consumption curve for a typical medium speed diesel engine is shown in Figure 2. It shows how many grams of fuel are needed for production of 1 kWh of energy for different diesel engine loads which are expressed as a percentage of rated power. It can be seen that the lowest fuel consumption is when the diesel engine is loaded between 80% and 90% of its rated power.
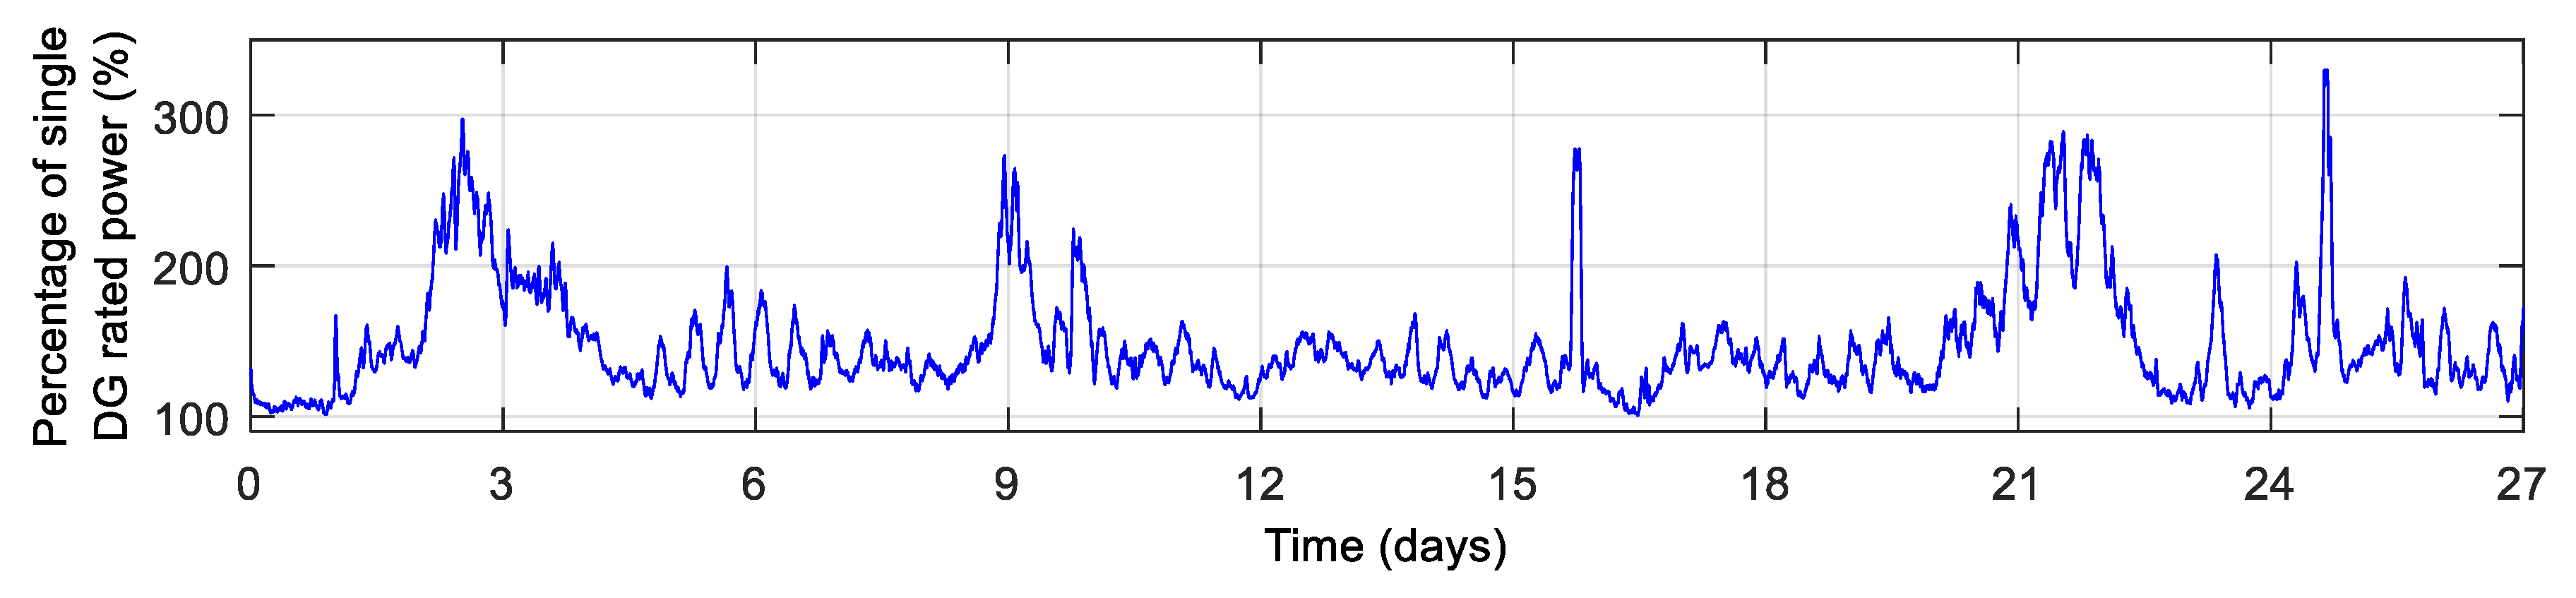
Figure 3 shows the electrical power consumption trend of a DP pipe laying vessel during a 27-day period that has been recorded by the authors. Sampling time is 1 second. Total load is scaled and presented as a percentage of a single generator rated power.
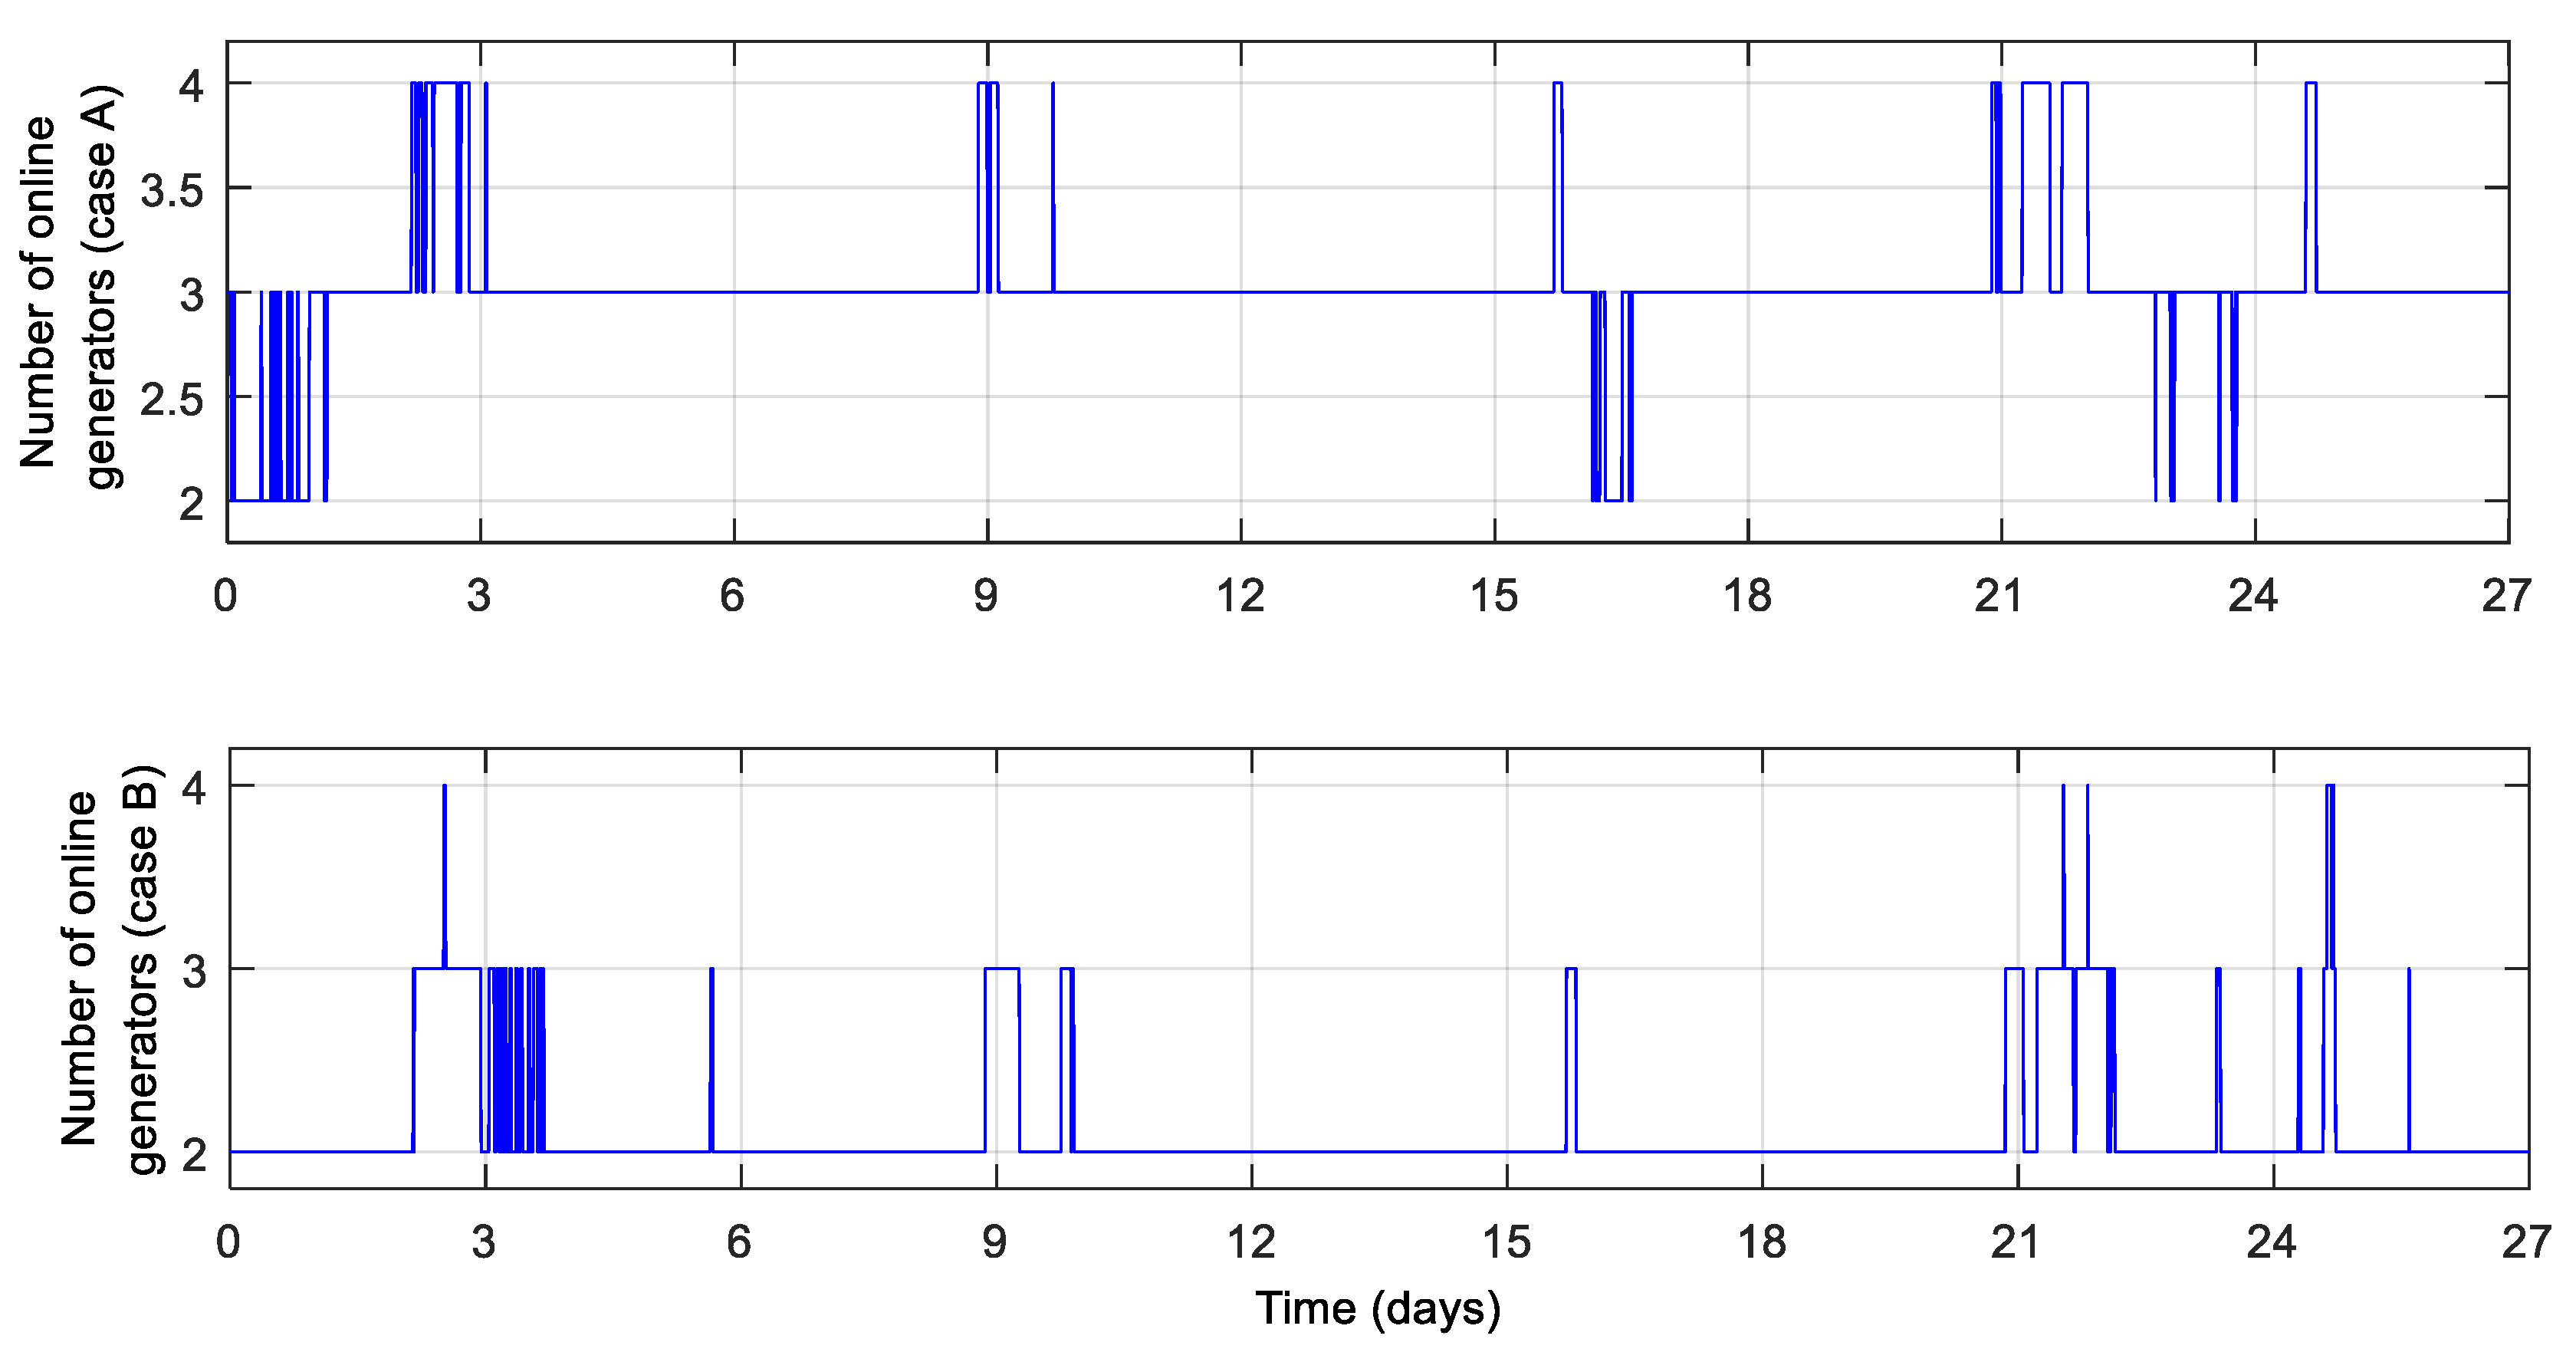
Based on data from Figure 3, DG utilization has been simulated for two different cases:
- Case A: the stand-by DG will start according conditions defined in (1),
- Case B: the stand-by DG will start if PDGmax ≥ 0.9Pr.
The results of the simulation are presented in Figure 4. In case A, most of the time three DGs were online and a total of 1930 DG running hours were accumulated. In case B, the number of running hours was reduced to 1353, for a total reduction of 29.9%.
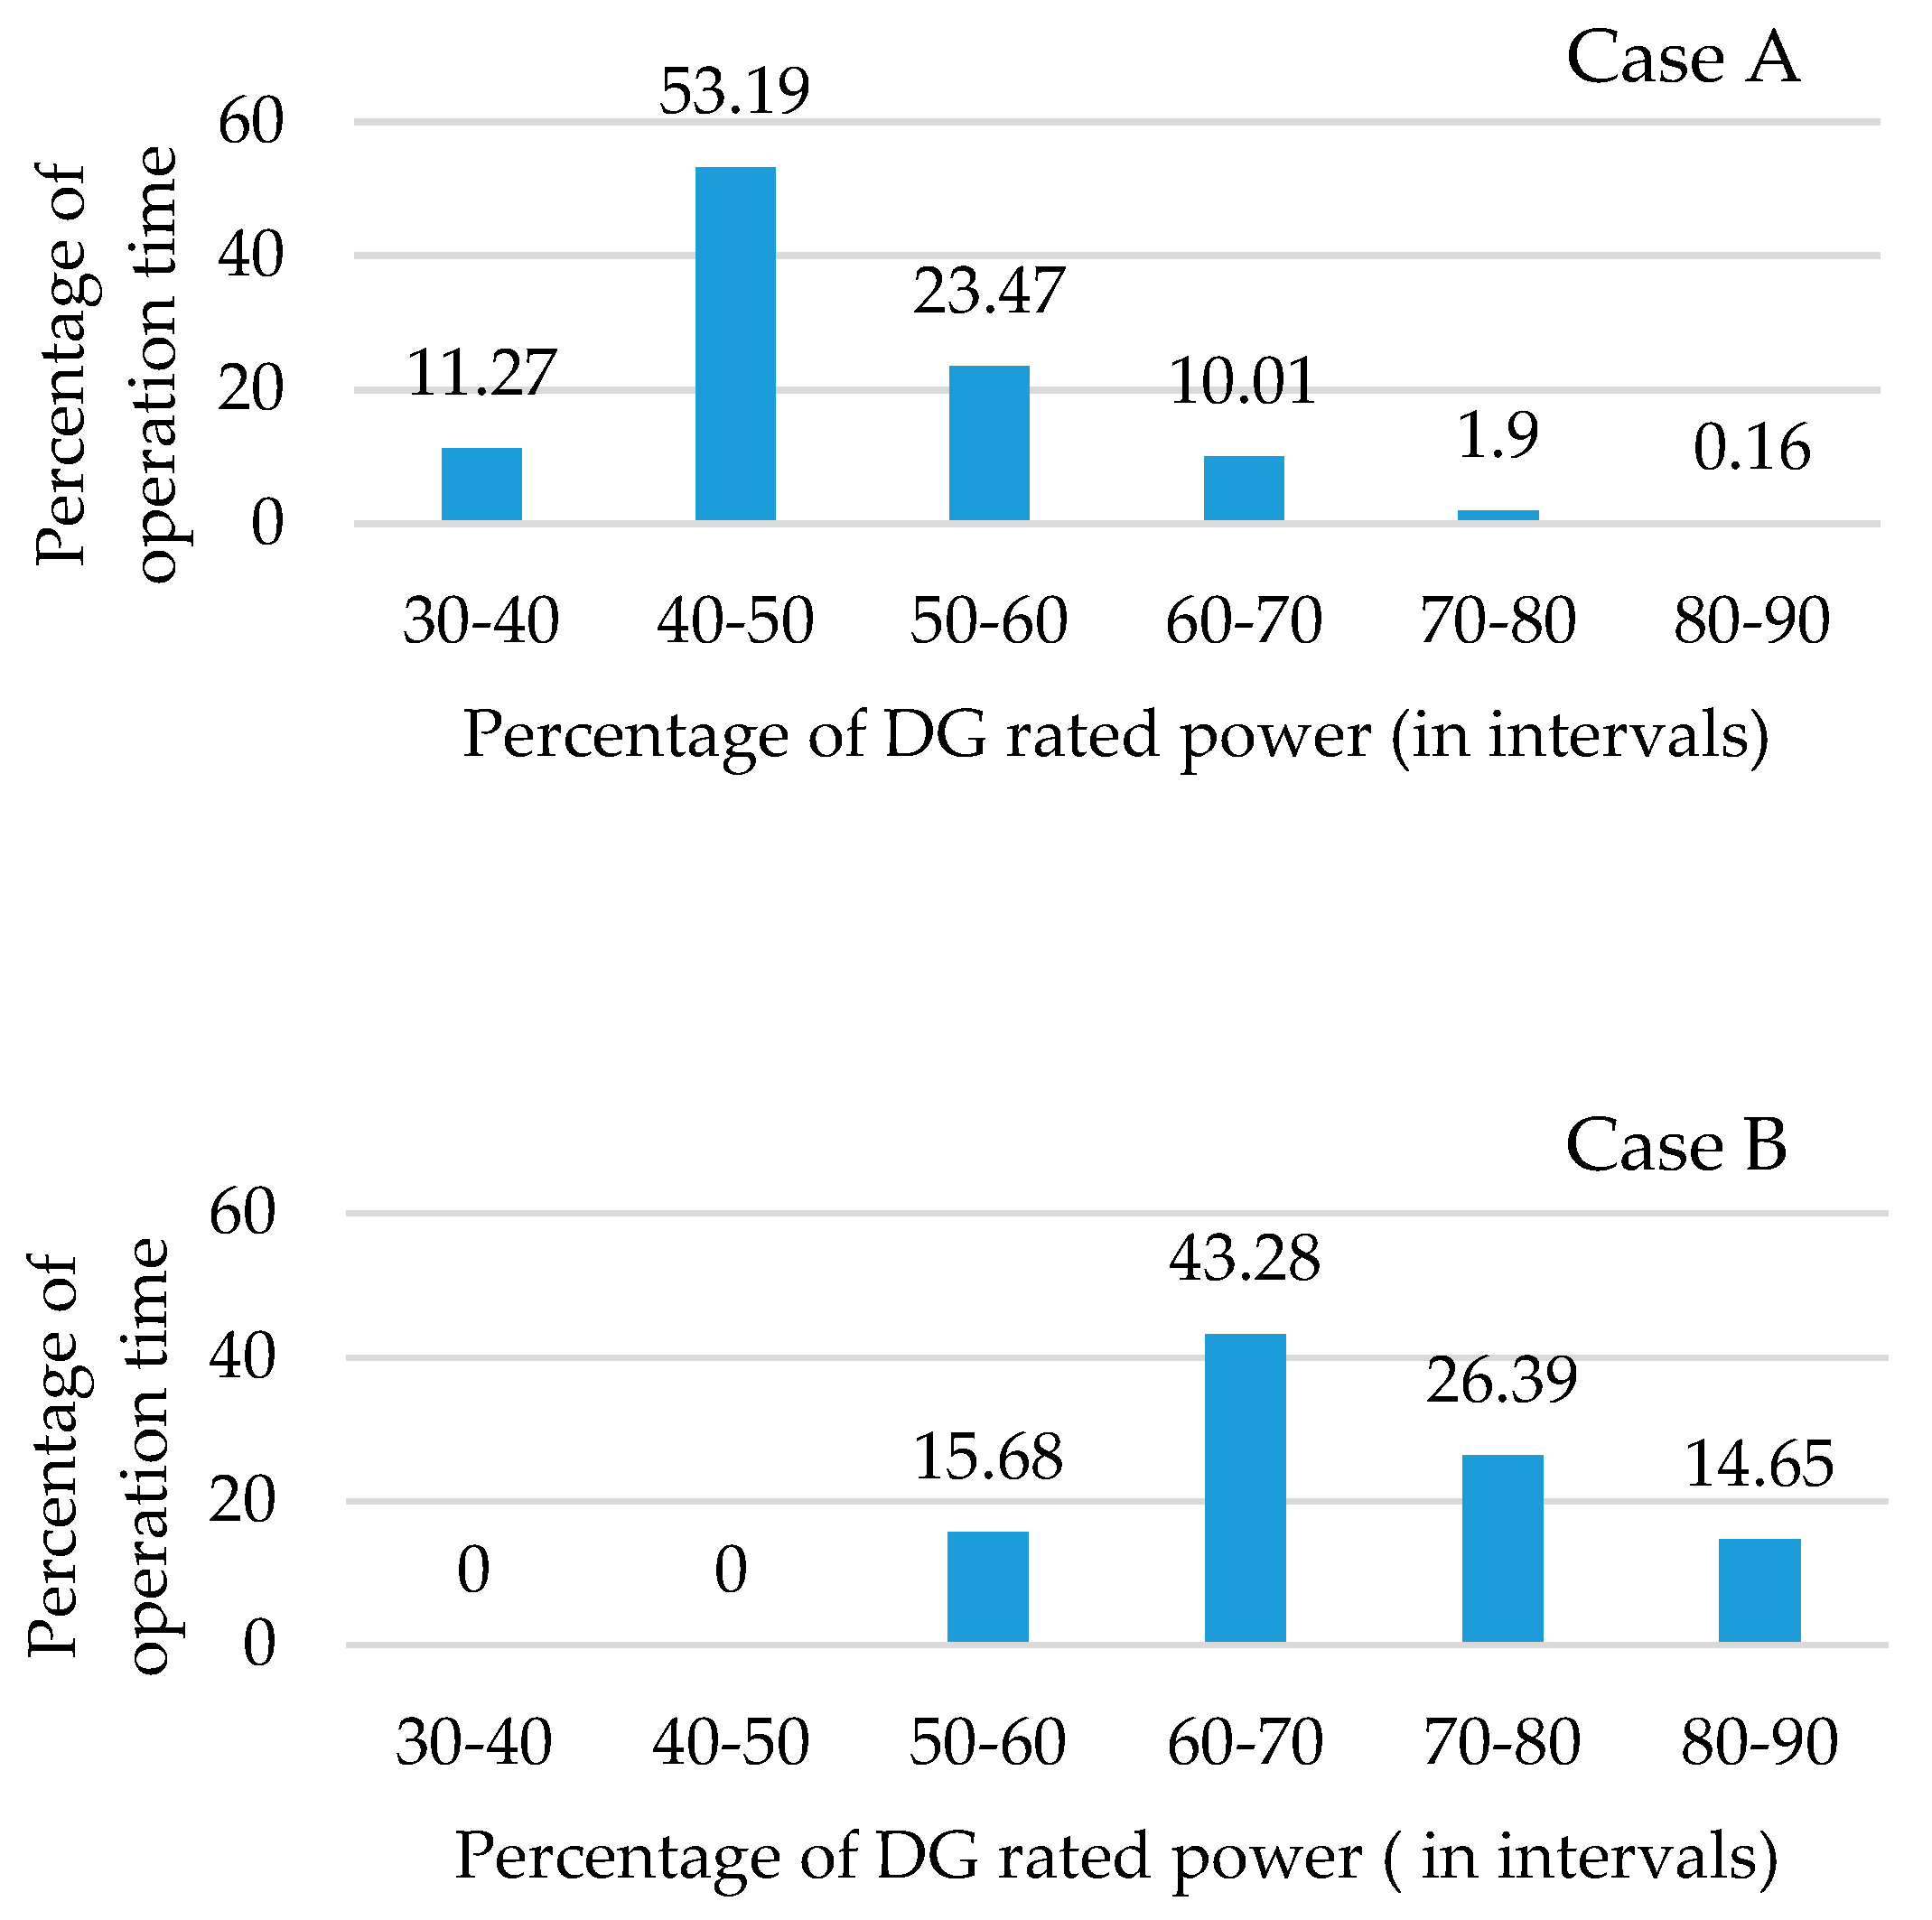
It is also interesting to compare DG utilization to specific fuel consumption. From Figure 5, it can be seen that most of the time DGs are running in the interval of 60% to 90% of diesel engine rated power, which corresponds to an area of low specific fuel consumption in Figure 2.
From the presented results, it can be concluded that a significant reduction of fuel and maintenance costs can be achieved when DGs are allowed to run with nominal loads and closed bus bar operation, but in order to prevent safety risks adequate blackout prevention methods must be implemented.
One of the solutions that may be used to achieve the aforementioned objectives is the implementation of large scale energy storage, which is analyzed in this work.
3. Simulation Model of an Electrical Power System with ES
Since there is no reference DP vessel in service with a large scale ES system integrated in the electrical power plant, it is impossible to carry out any practical tests in line with the objectives of this work. For that reason, an appropriate simulation model for each system component that must be taken into account when evaluating the ES application was developed in Simulink.
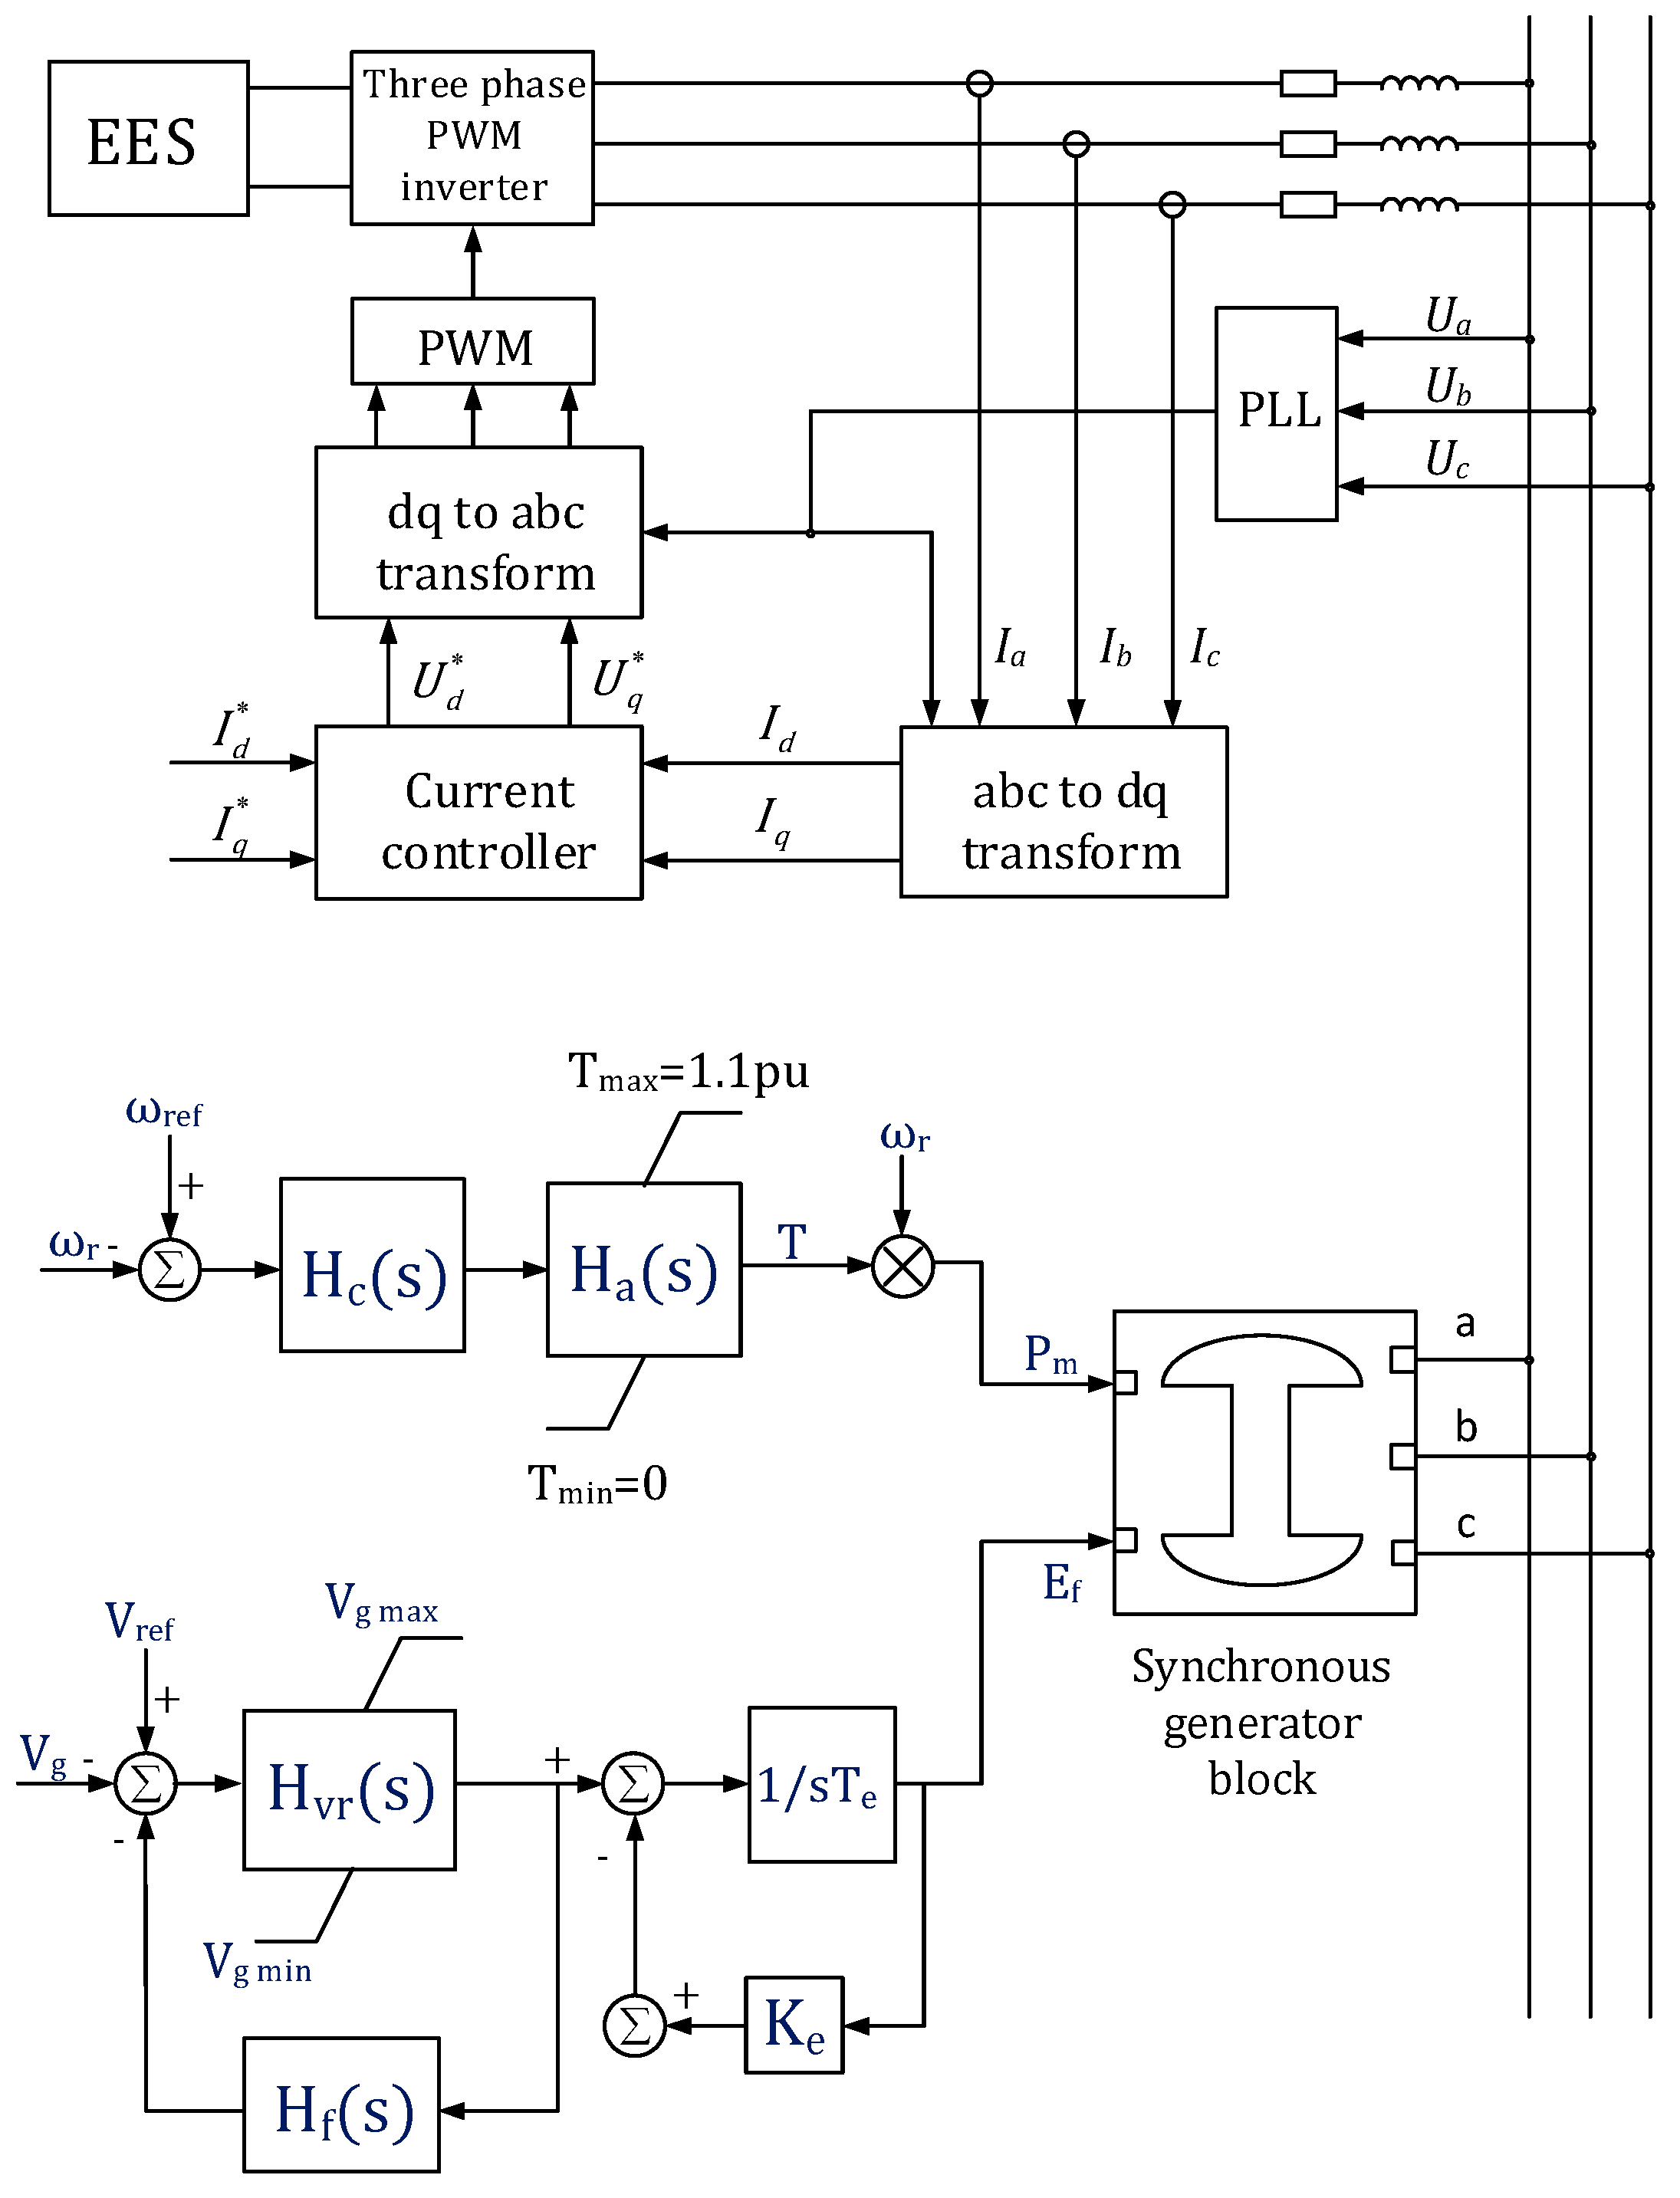
A model of the DP vessel electrical power system with ES is shown in Figure 6. The aim of the presented model is to determine specific parameters required for technical analysis and selection of an appropriate ES device, such as required capacity, power and energy density, response time, speed of discharge, etc.
Therefore, ES is modeled as a DC voltage source connected via a bi-directional power converter with the possibility of active and reactive power control.
The diesel generator model consists of a synchronous generator block, a governor block, and a voltage regulator block. The standard fifth order model of a synchronous generator is used. It is assumed that all three phase voltages at generator terminals are equal and balanced, and only the fundamental harmonic is present in the air gap field (the influence of high order harmonics is neglected).
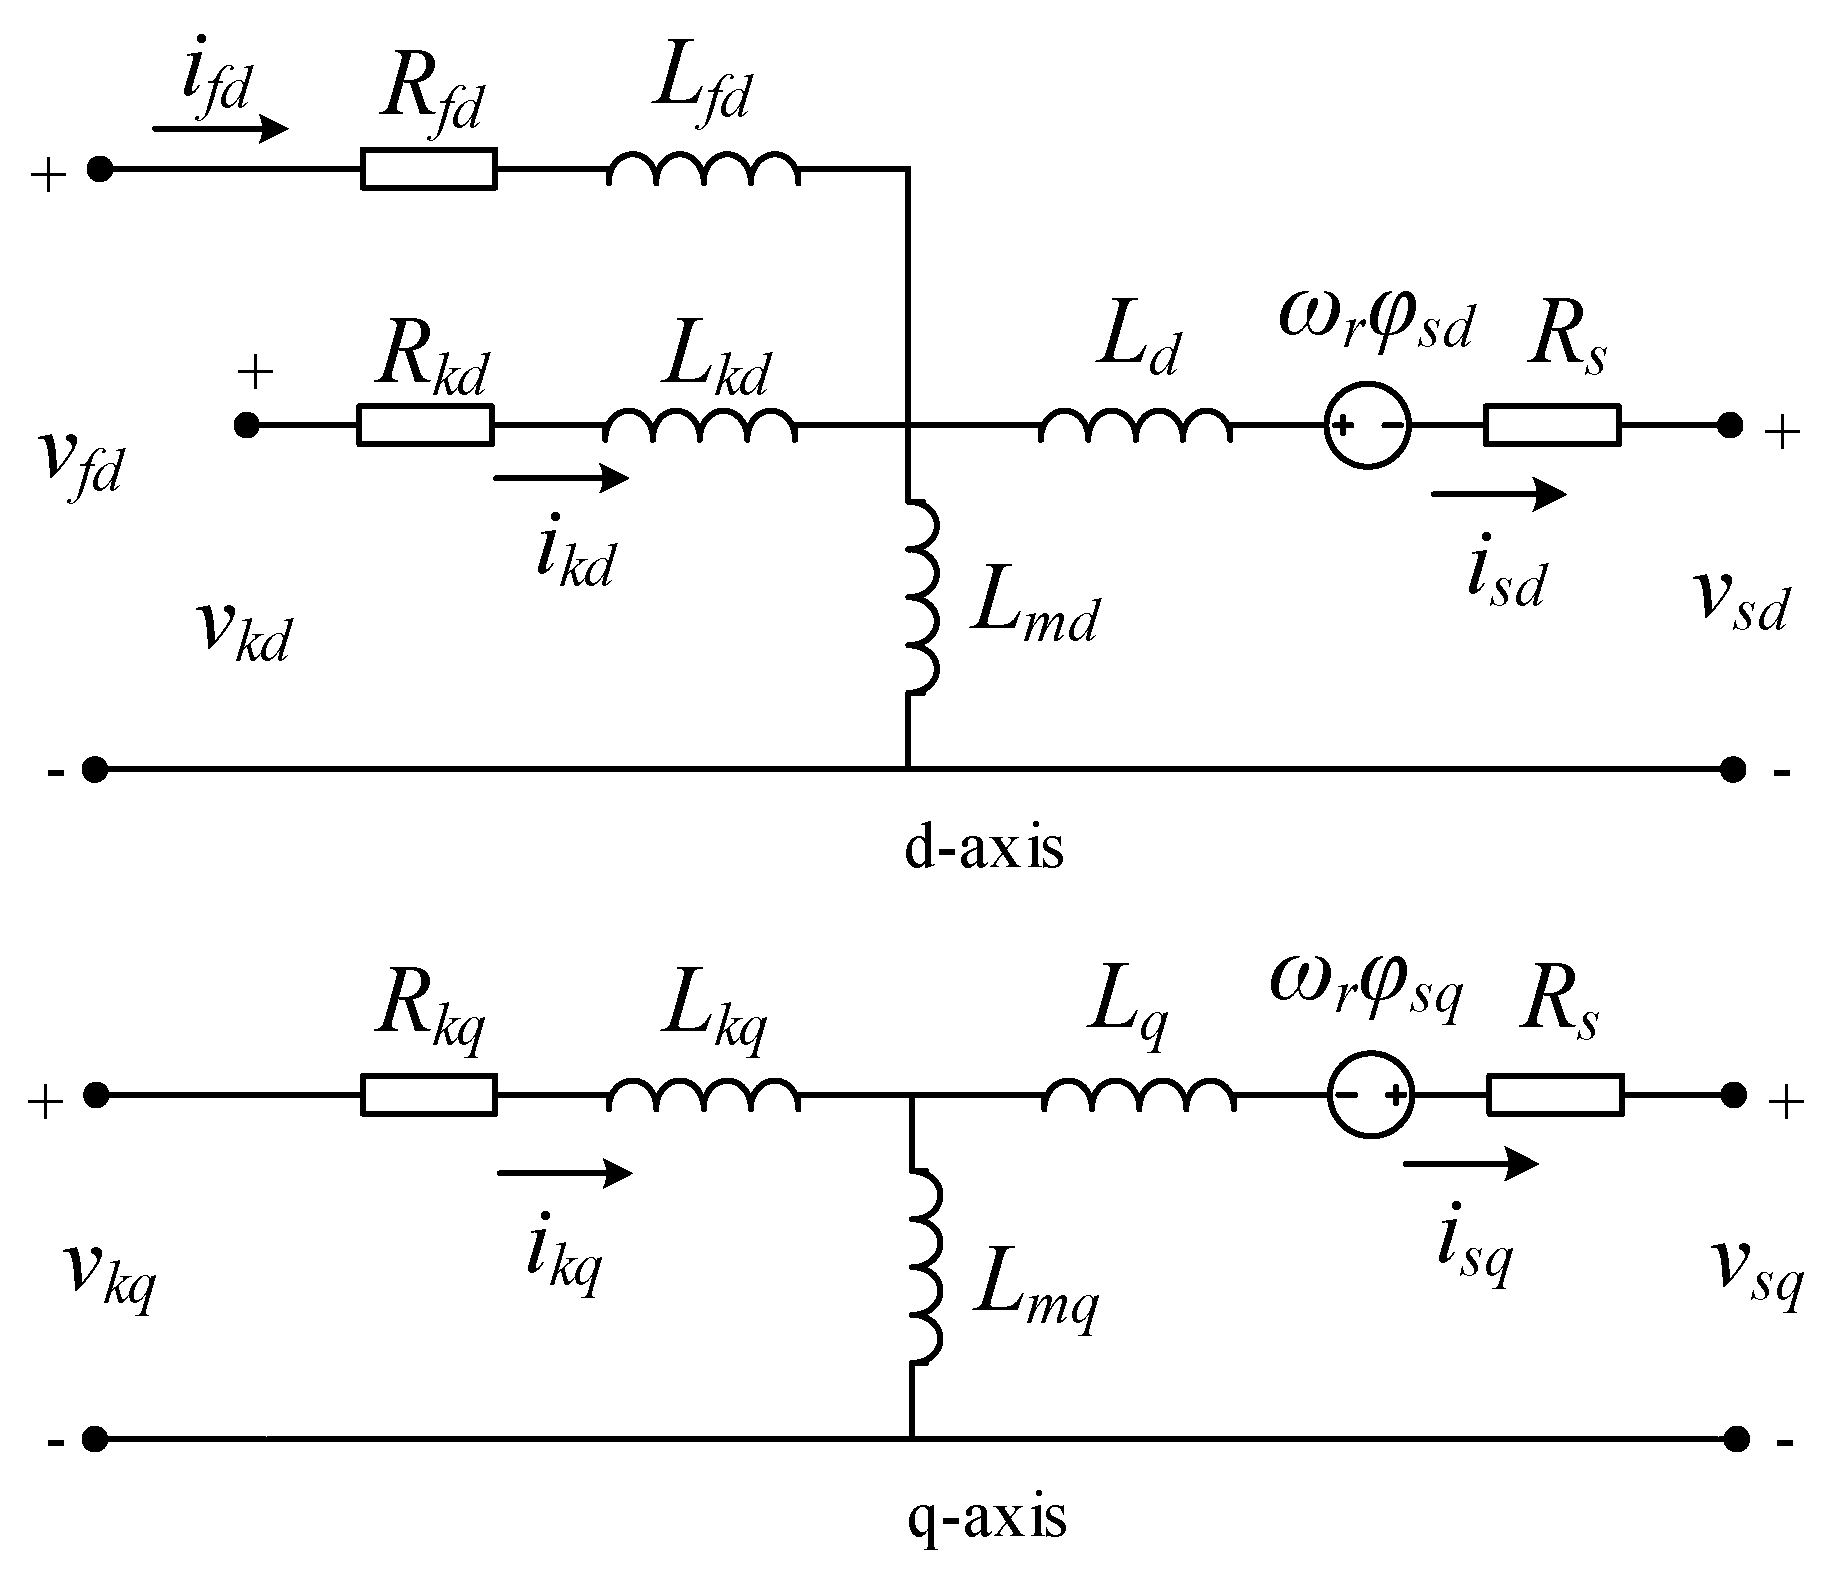
An equivalent circuit of a synchronous generator block in a dq reference frame is shown in Figure 7.
Variables in Equations (2) and (3) are defined as follows: v, voltage; i, current; φ, magnetic flux; L, inductance; R, resistance; and ω, angular velocity. Subscripts are: d, d axis; q, q axis; s, stator; r, rotor; f, field winding; k, damper winding; and m, mutual inductance.
The equation of motion of a diesel generator rotor is [22]:
where Tm, Tem, and Tf are externally applied mechanical torque, electromagnetic torque developed by the diesel generator, and frictional torque in Nm, respectively, p is the generator pole number, ωr is the rotor angular speed in rad/s, and J is the moment of inertia in kgm2.
The generator speed reference value ωref is compared with the actual generator speed ωr. The error signal is fed to the input of the controller modeled as a second order system with the transfer function:
where Kp is gain and t1c, t2c, and t3c are controller time constants. The actuator transfer function is:
where t1a, t2a, and t3a are actuator time constants [23].
The output of the actuator represents the prime mover mechanical torque which is limited to 110% of rated power, according the class requirements. Torque signal is multiplied by ωr in order to get the required mechanic power Pm used in the synchronous generator model. Generator voltage Vg is compared with its reference value Vref and the signal difference is the input of the voltage regulator with transfer function:
where Kvr is gain and tvr is the voltage regulator time constant. In order to prevent oscillations of Vg, the following damping filter is used:
Kf is gain and t1f, t2f, and t3f are filters time constants. The exciter is a modeled PI controller with time constants te and gain Ke [24].
Active and reactive power in a rotating dq reference frame can be expressed as:
where Ud and Uq are voltages at the point of common coupling (PCC) and Id and Iq are inverter currents [25].
Phase locked loop (PLL) is used for synchronizing the inverter output voltage with the ship’s electrical power grid [26]. The output of the current controller is:
where U*d, U*q, I*d, and I*q are d and q components of the inverter reference voltage and current.
The presented model can be applicable for any type of vessel, not only DP ones, because it allows parallel connection of DG and ES units in various topologies. The conditions for ES utilization can be set in PMS according the specific vessel requirements (e.g. blackout prevention, peak shaving, and maneuvering operation).
In a common bus bar configuration with m equally loaded DG units online, the step load increase ∆Ps on each remaining generator after one DG loss is:
where Ptotal(m) is the total instantaneous electrical consumption when m DGs are online (before fault). The maximum step load increase ∆Ps max is usually given by the diesel engine manufacturer or can be arbitrarily set in PMS. For stable operation of an electrical power plant it is required that ∆Ps ≤ ∆ Psmax in all possible fault conditions, which affects the amount of required spinning reserve for safe operation and consequently the safe DG continuous load Psafe(m). In order to run DG units at the desired (near optimum) load and taking into account that DG can supply 110% of rated power in an emergency situation, the minimum required ES output power PES for Psafe(m) = Pdes is:
where Pdes is the desired DG load set by operator.
It is realistic to assume that once the PES is determined for the worst case scenario, which according to (13) is one DG loss when m = 2, such ES can cover all expected load variation with respect to required power, including compensation of short term peak power demands. However, maximum ES utilization time depends only on its capacity which has to be determined by simulation for any scenario of interest.
Required ES capacity in the term of stored energy can be determined by integrating the power supplied by ES (Pes) over the time interval from the ES activation (t1) to the end of the discharge process (t2).
4. Model Parameters
Standard synchronous generator parameters that are usually available in generator data sheets and are used in the presented model are the main reactances Xd and Xq, generator leakage reactance Xl, transient reactances Xd’and Xq’, subtransient reactances Xd’’and Xq’’, stator resistance Rs, generator mechanical time constant Tm, time constants for subtransient state Td’’and Tq’’, and constant of inertia H. Equations which relate the standard parameters with variables in (2) and (3) can be found in [21] (pp. 302–304). Simulation parameter settings used in the proposed model are given in Table 1.
5. Simulation and Results
In order to determine the characteristics of an ES system required for blackout prevention during closed bus bar operation, a time domain simulation was performed.
First, the sudden loss of one generator when two generators are online, each loaded with 85% of their nominal power, was simulated for electrical power systems without and with ES. After that, based on simulation results the required ES capacity was calculated for several diesel generators with different power ratings, covering the most common generator sizes installed on modern DP vessels. Finally, use of ES for peak shaving operation was simulated, using the recorded load profile of an actual DP vessel as a model input.
Electrical protections that may disconnect the generator breakers during the step load increase were set as follows:
- Under frequency protection was set to 90% of the rated frequency with a 5 s time delay.
- Over current protection was set to 120% of the rated current with a 20 s time delay.
- Under voltage protection was set to 70% of the rated voltage with a 2 s time delay.
It was assumed that the stand-by generator was connected to the network and ready for loading within 30 s, which was in accordance with the main DP class requirements. With respect to defined simulation scenarios, the effect of diesel engine turbo lag was ignored and it was assumed that diesel generators were able to take 55% of the rated power in one step. The upper diesel generator load limit was set to 110% of its rated power. Simulation results for the event of one generator loss, when the system was running without ES and with two 3.6 MVA generators online, equally loaded and operating with a 0.8 power factor, are shown in Figure 8.
At t = 3 s, generator 2 was suddenly disconnected from the grid causing the step load increase on generator 1 and its current rose above the over current protection limit. Maximum voltage undershoot was 13.5% of its nominal value.
Although the voltage remained above the under voltage protection limit, it failed to stabilize within ±3% of the nominal value within 1.5 s after the start of the transient, as required by class requirements [10]. The frequency continuously dropped and at t = 10.66 s the under frequency protection disconnected the generator breaker, causing a system blackout.
Results for the same scenario, but now with ES connected to the main bus bar via Pulse Width Modulated (PWM) inverter are shown in Figure 9.
After loss of one generator at t = 3 s, the ES instantly took the load, thus reducing the step load increase on the remaining generator. In order to minimize the amount of electrical energy required from ES, the load on the remaining generator was kept at 110% of the rated power until the stand-by generator was connected to grid. Voltage and frequency transients were significantly reduced with a maximum undershoot of 2.5% and 1.5% of the nominal value, respectively. It should be noted that even if the remaining generator was run with its maximum load, the ES could cover additional load demands up to a certain limit thus increasing the flexibility of the power system.
To determine the maximum required capacity of ES and its key characteristics for a given power system configuration, a worst case scenario must be considered:
- two DGs are running in parallel, each loaded with 95% of nominal power on the common bus,
- at t = 10 s, DG2 is disconnected from the grid due to a sudden failure,
- ES and DG1 instantly take the remaining load, provided that PMS limits the DG1 maximum load to 110% of the rated power and sends the start signal to stand-by DG3,
- DG3 is ready to take the load 30 s after starting with the rate of 0.05 Pr/s.
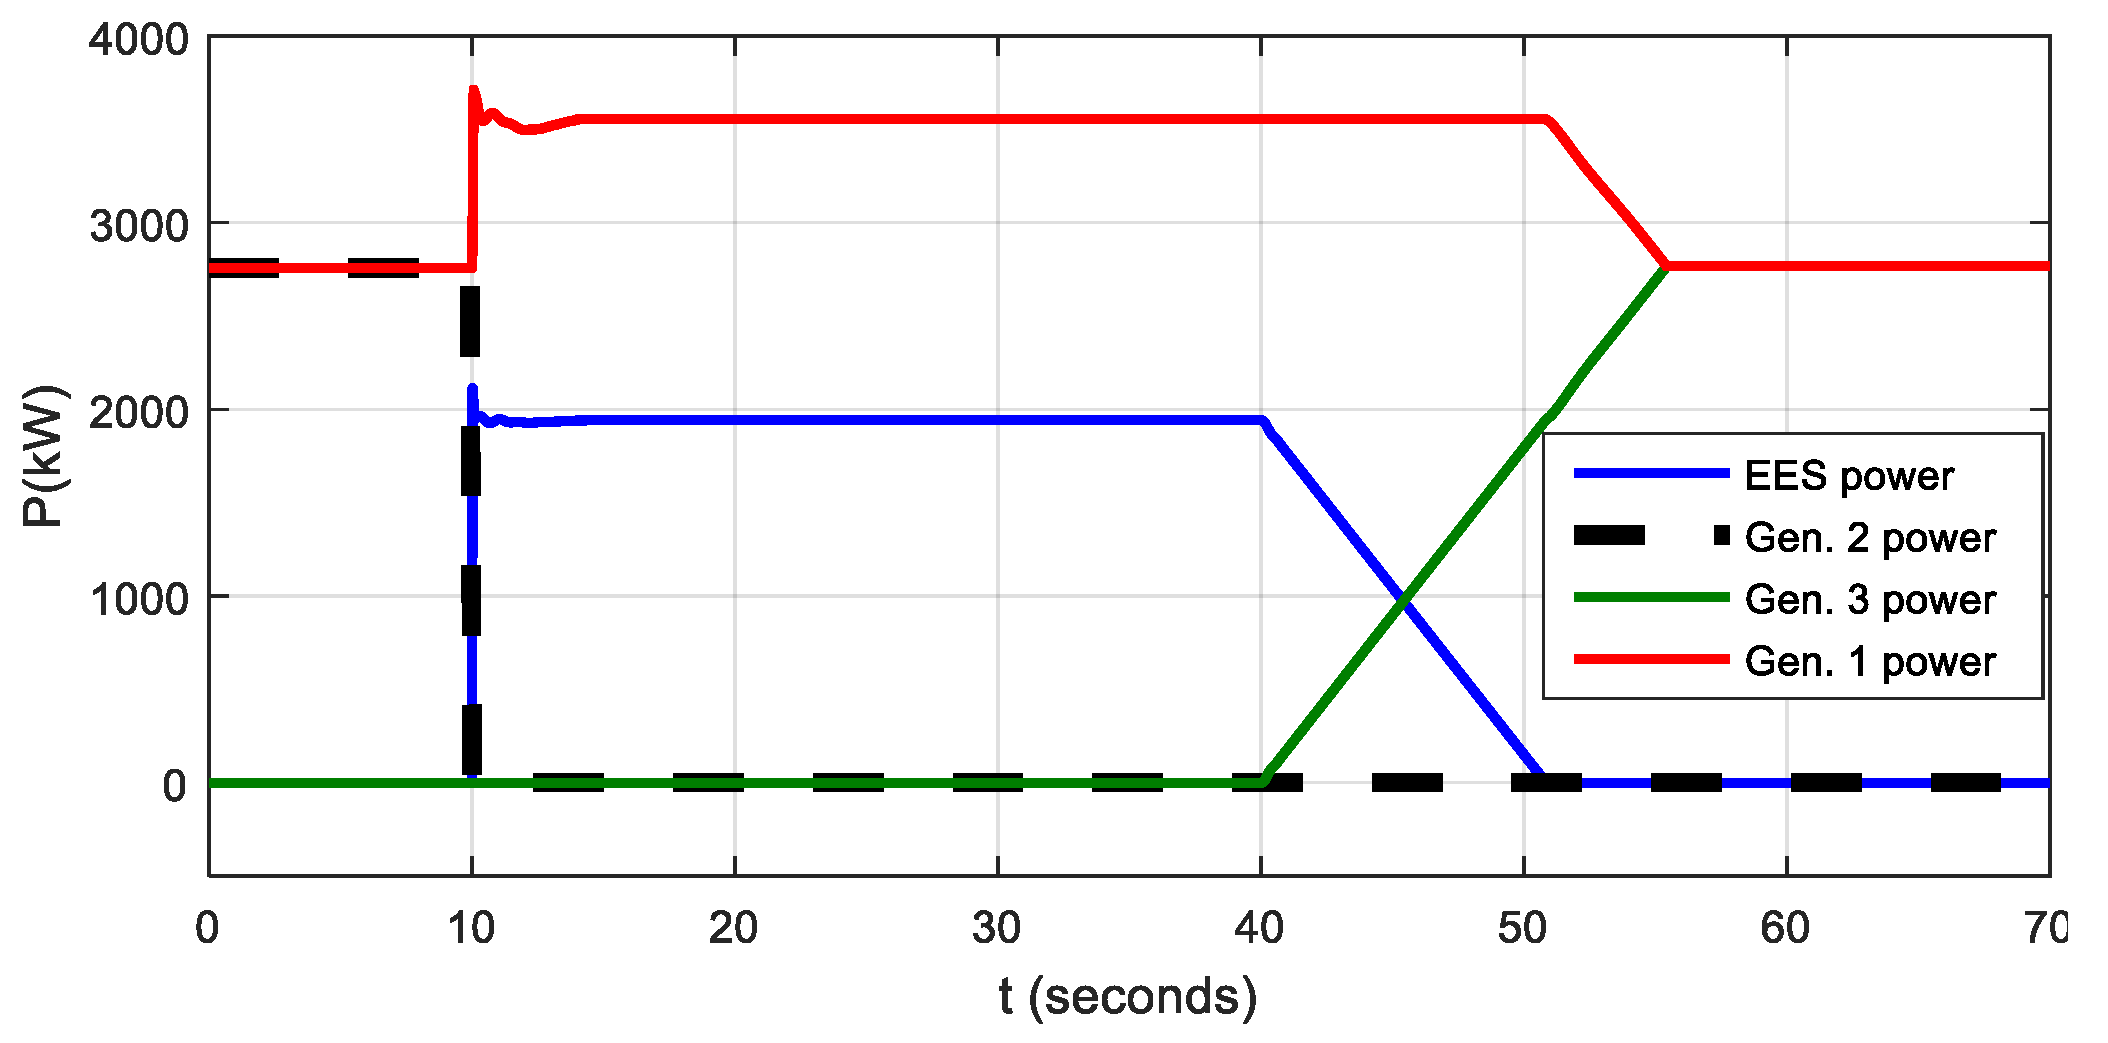
The simulation was performed for single generator power ratings of 2000 kVA, 2300 kVA, 2600 kVA, 3000 kVA, 3300 kVA, 3600 kVA, and 4000 kVA with a rated power factor of 0.8. These power ratings correspond to the most frequently used generator sizes on board average sized DP 2 and DP 3 class vessels. As example simulation scenario for a 3.6 MVA generator is shown in Figure 10, and the same scenario is repeated for other generators.
Simulation results are shown in Table 2.
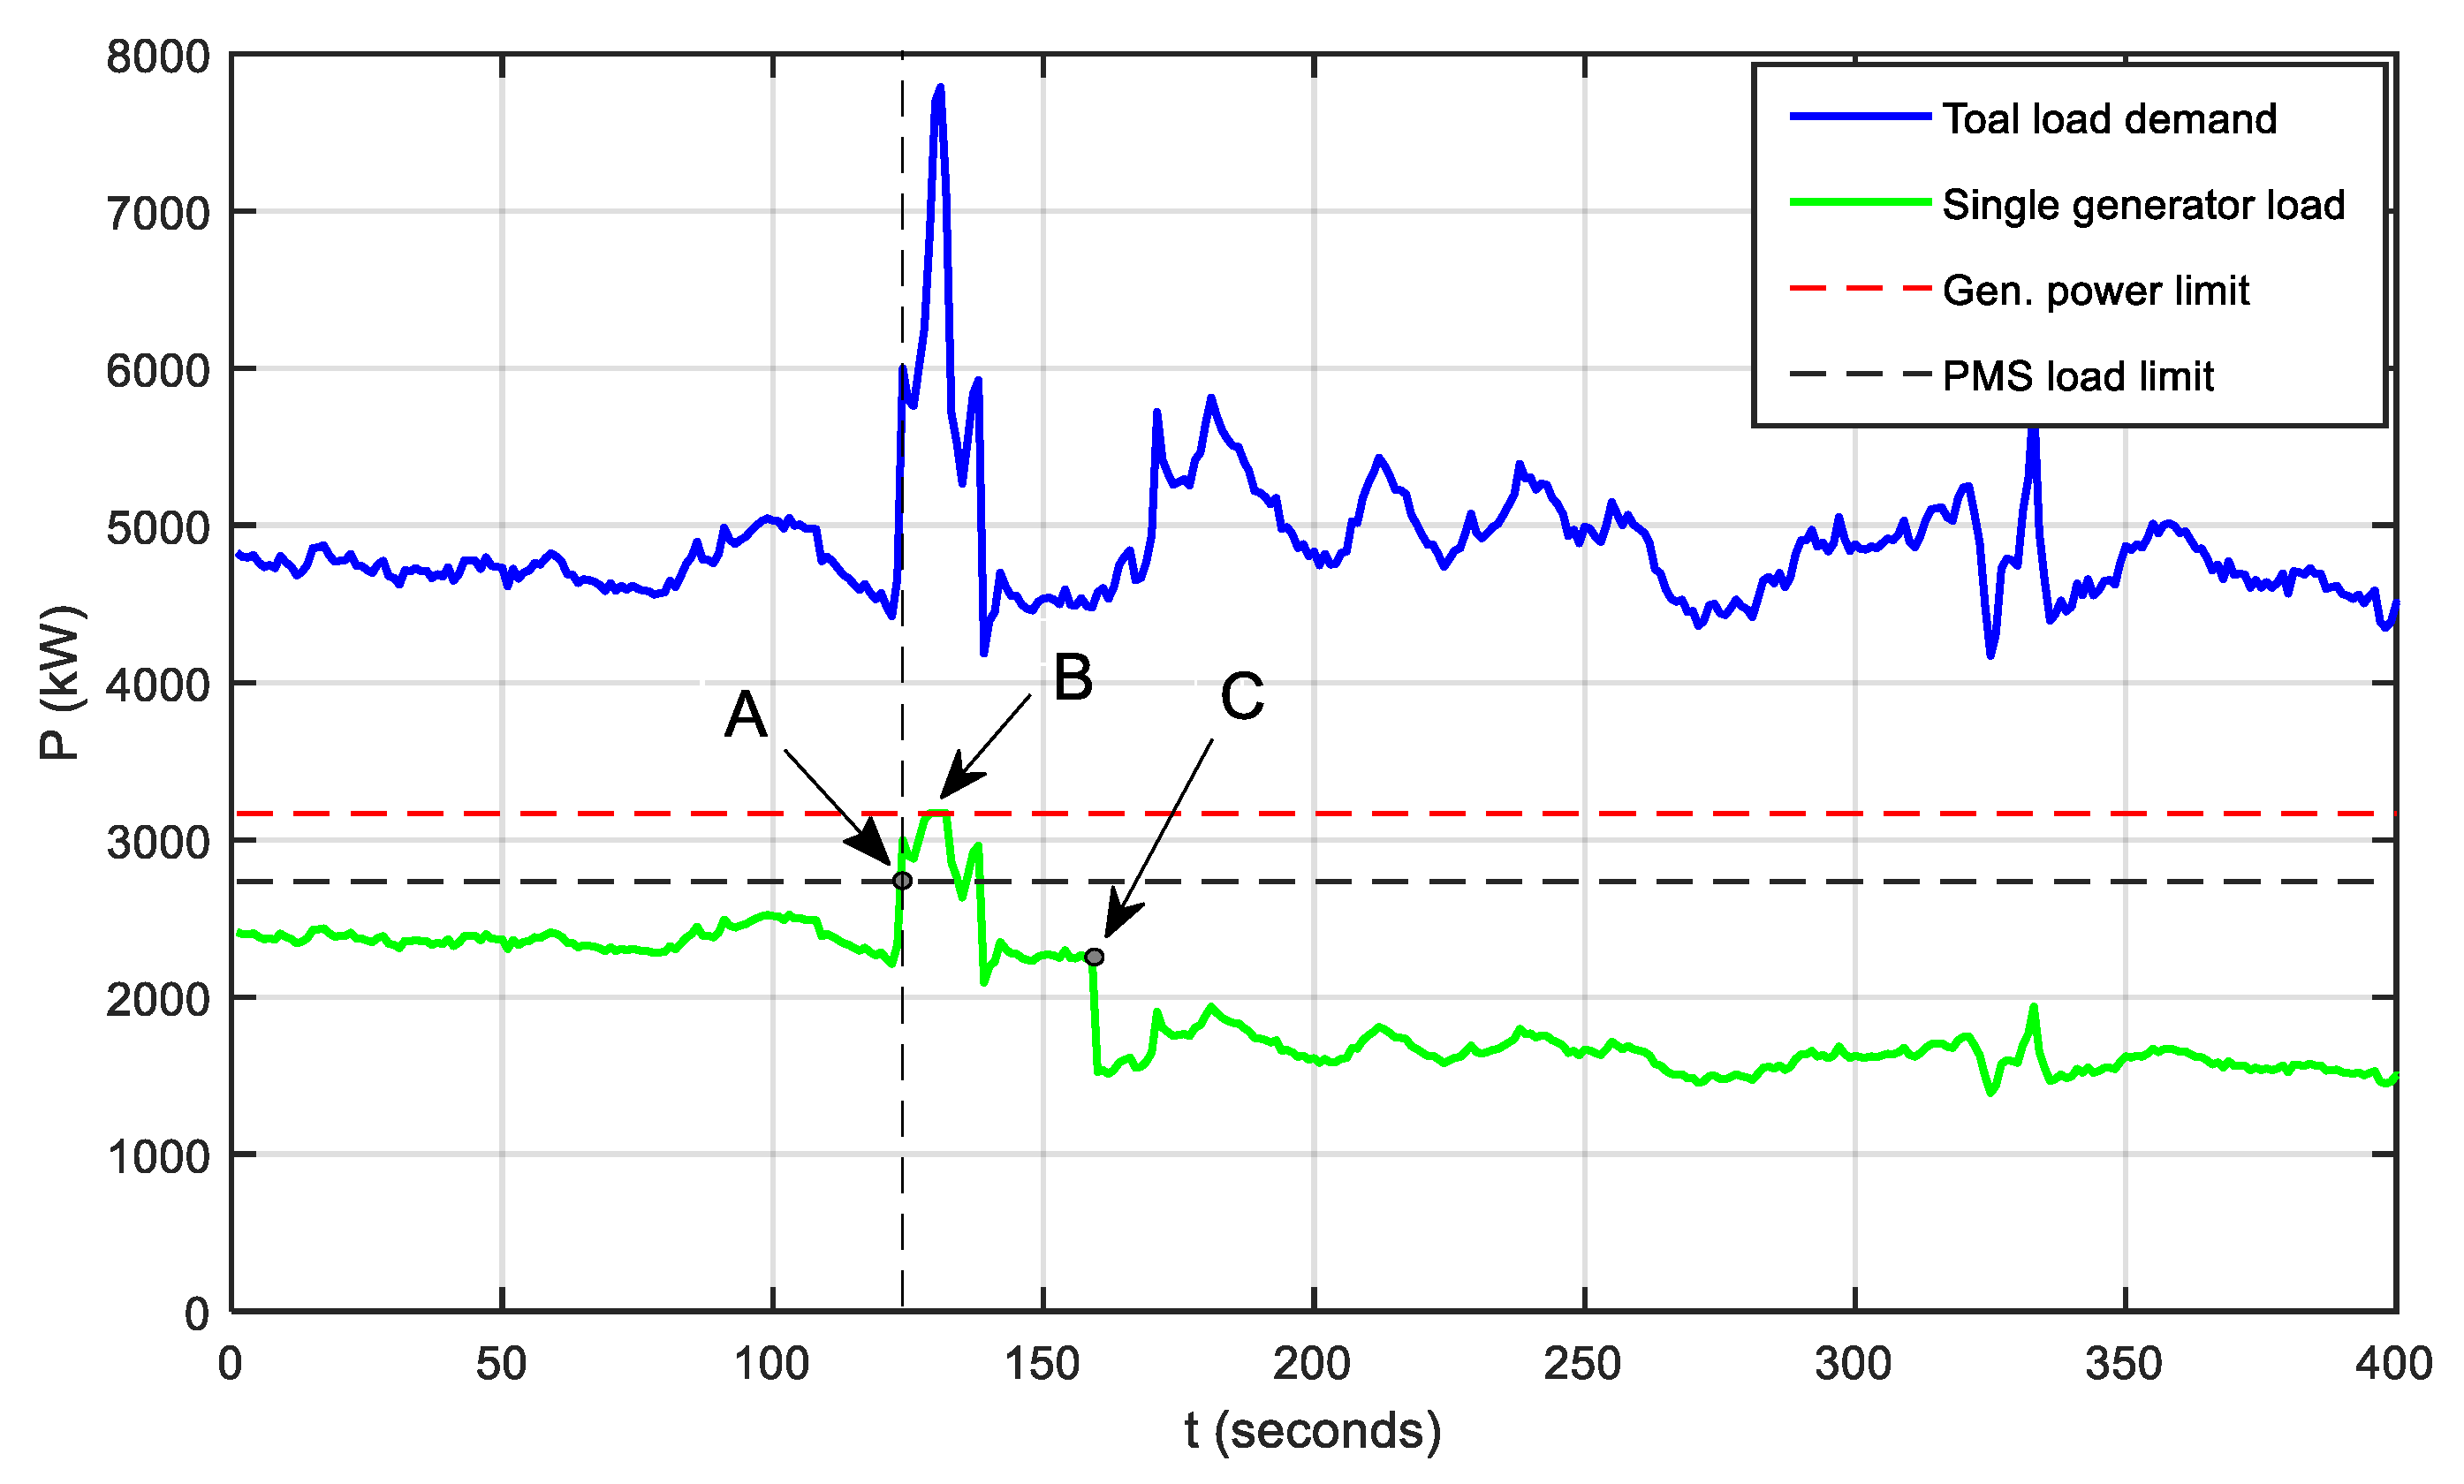
The typical load profile of a DP vessel is characterized by frequent short term load variations which are most often the result of the propulsion system response to stochastic external disturbances (i.e. wind, waves, current). Such power peaks can initiate unnecessary starting of stand-by DG and load shedding/limiting during peak duration. System behavior during a power peak is presented in Figure 11. Two DGs with rated power of 3600 MVA were connected to a common bus bar and operated in equal load mode. The PMS load limit for a single generator was set to 95% of Pr and the maximum power limit to 110% of Pr. The recorded power trend of an actual DP vessel for a duration of 400 s was used in simulation. At t = 122 s a power peak occurred, which caused the load increase on connected DG units above the PMS load limit and initiation of a third DG unit (point A). When load demand exceeded the DG power limit, total available power was limited (point B), which in some cases may affect the vessel’s ability to keep the desired position. Approximately 30 s after the start request, the stand-by DG was connected to the grid and loaded (point C). Now all online DGs were running with lower than optimal load and consequently higher specific fuel consumption and exhaust gas emissions.
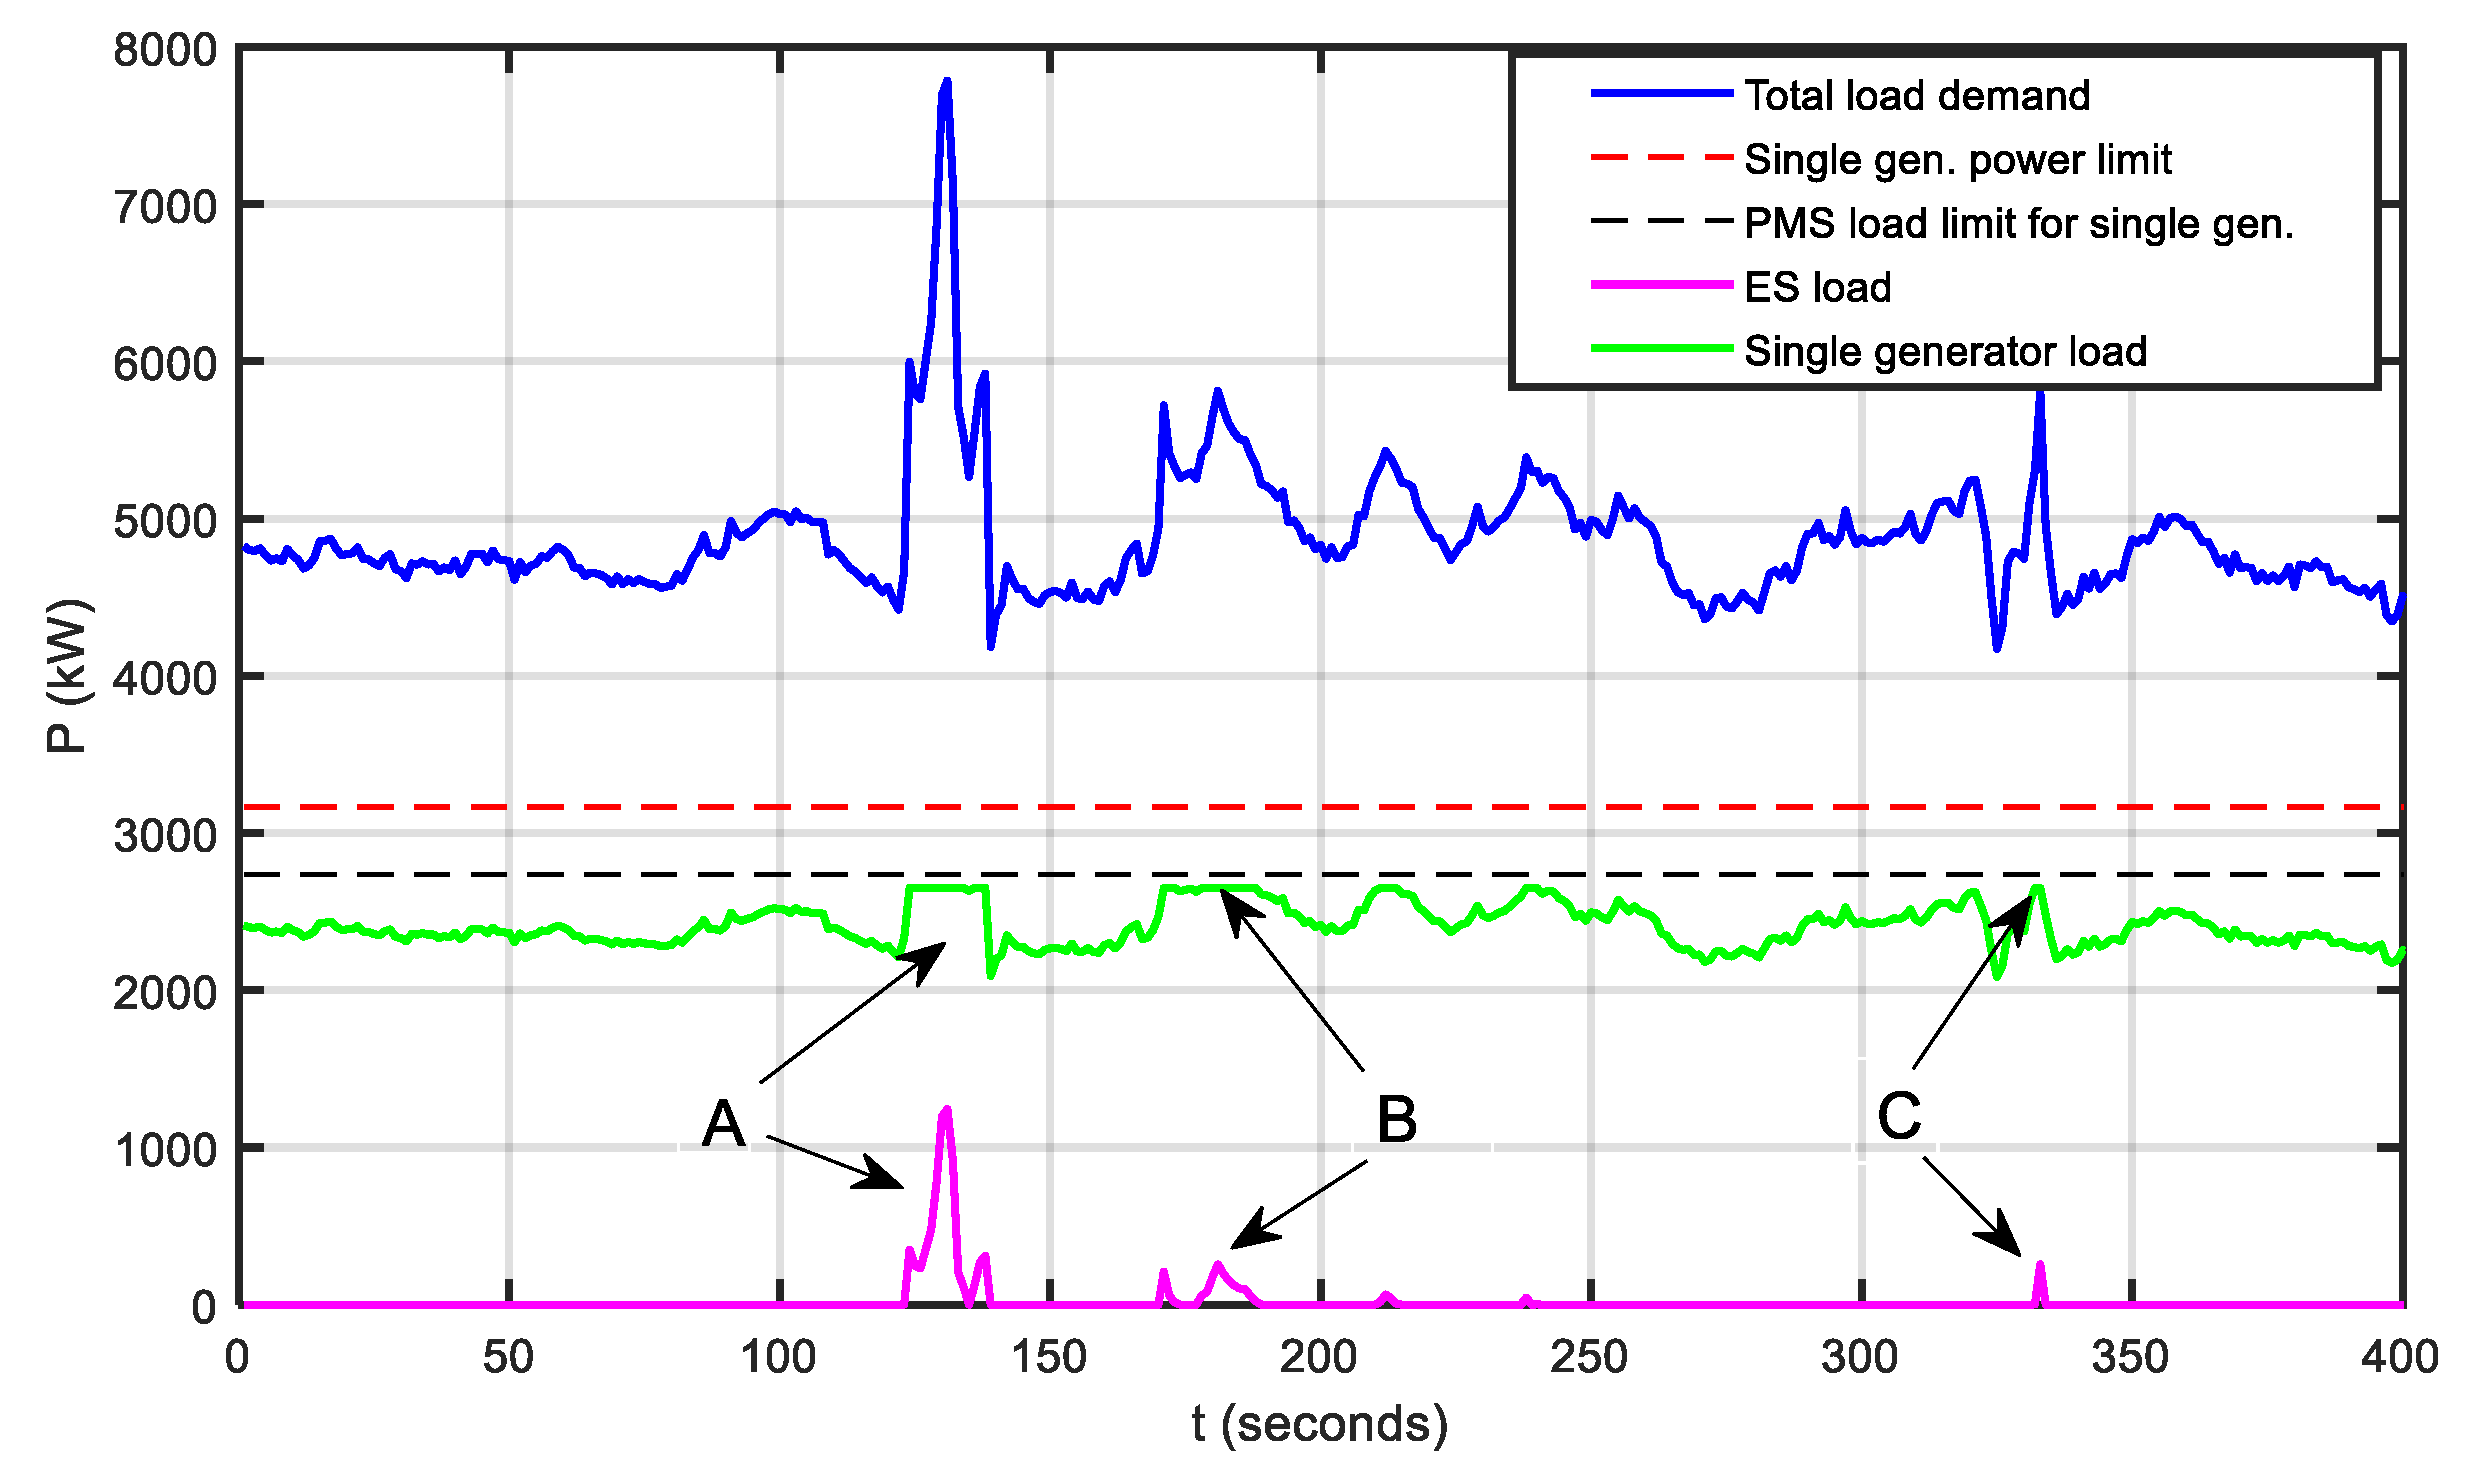
The same scenario, but now with implemented ES, is shown in Figure 12. It can be seen that single DG power was kept under the PMS load limit while the excess load was taken by ES (points A, B, and C). For this particular case, a total of 24.1 kWh of stored energy was consumed. Both online DGs were running near their optimal load and there was no need to start the third DG. It can be concluded that peak shaving with ES has a potential for significant reduction of fuel consumption and DG maintenance costs over longer exploitation periods, especially onboard vessels that operate in harsh environments with frequent propulsion load deviations.
6. ES Utilization Scheme
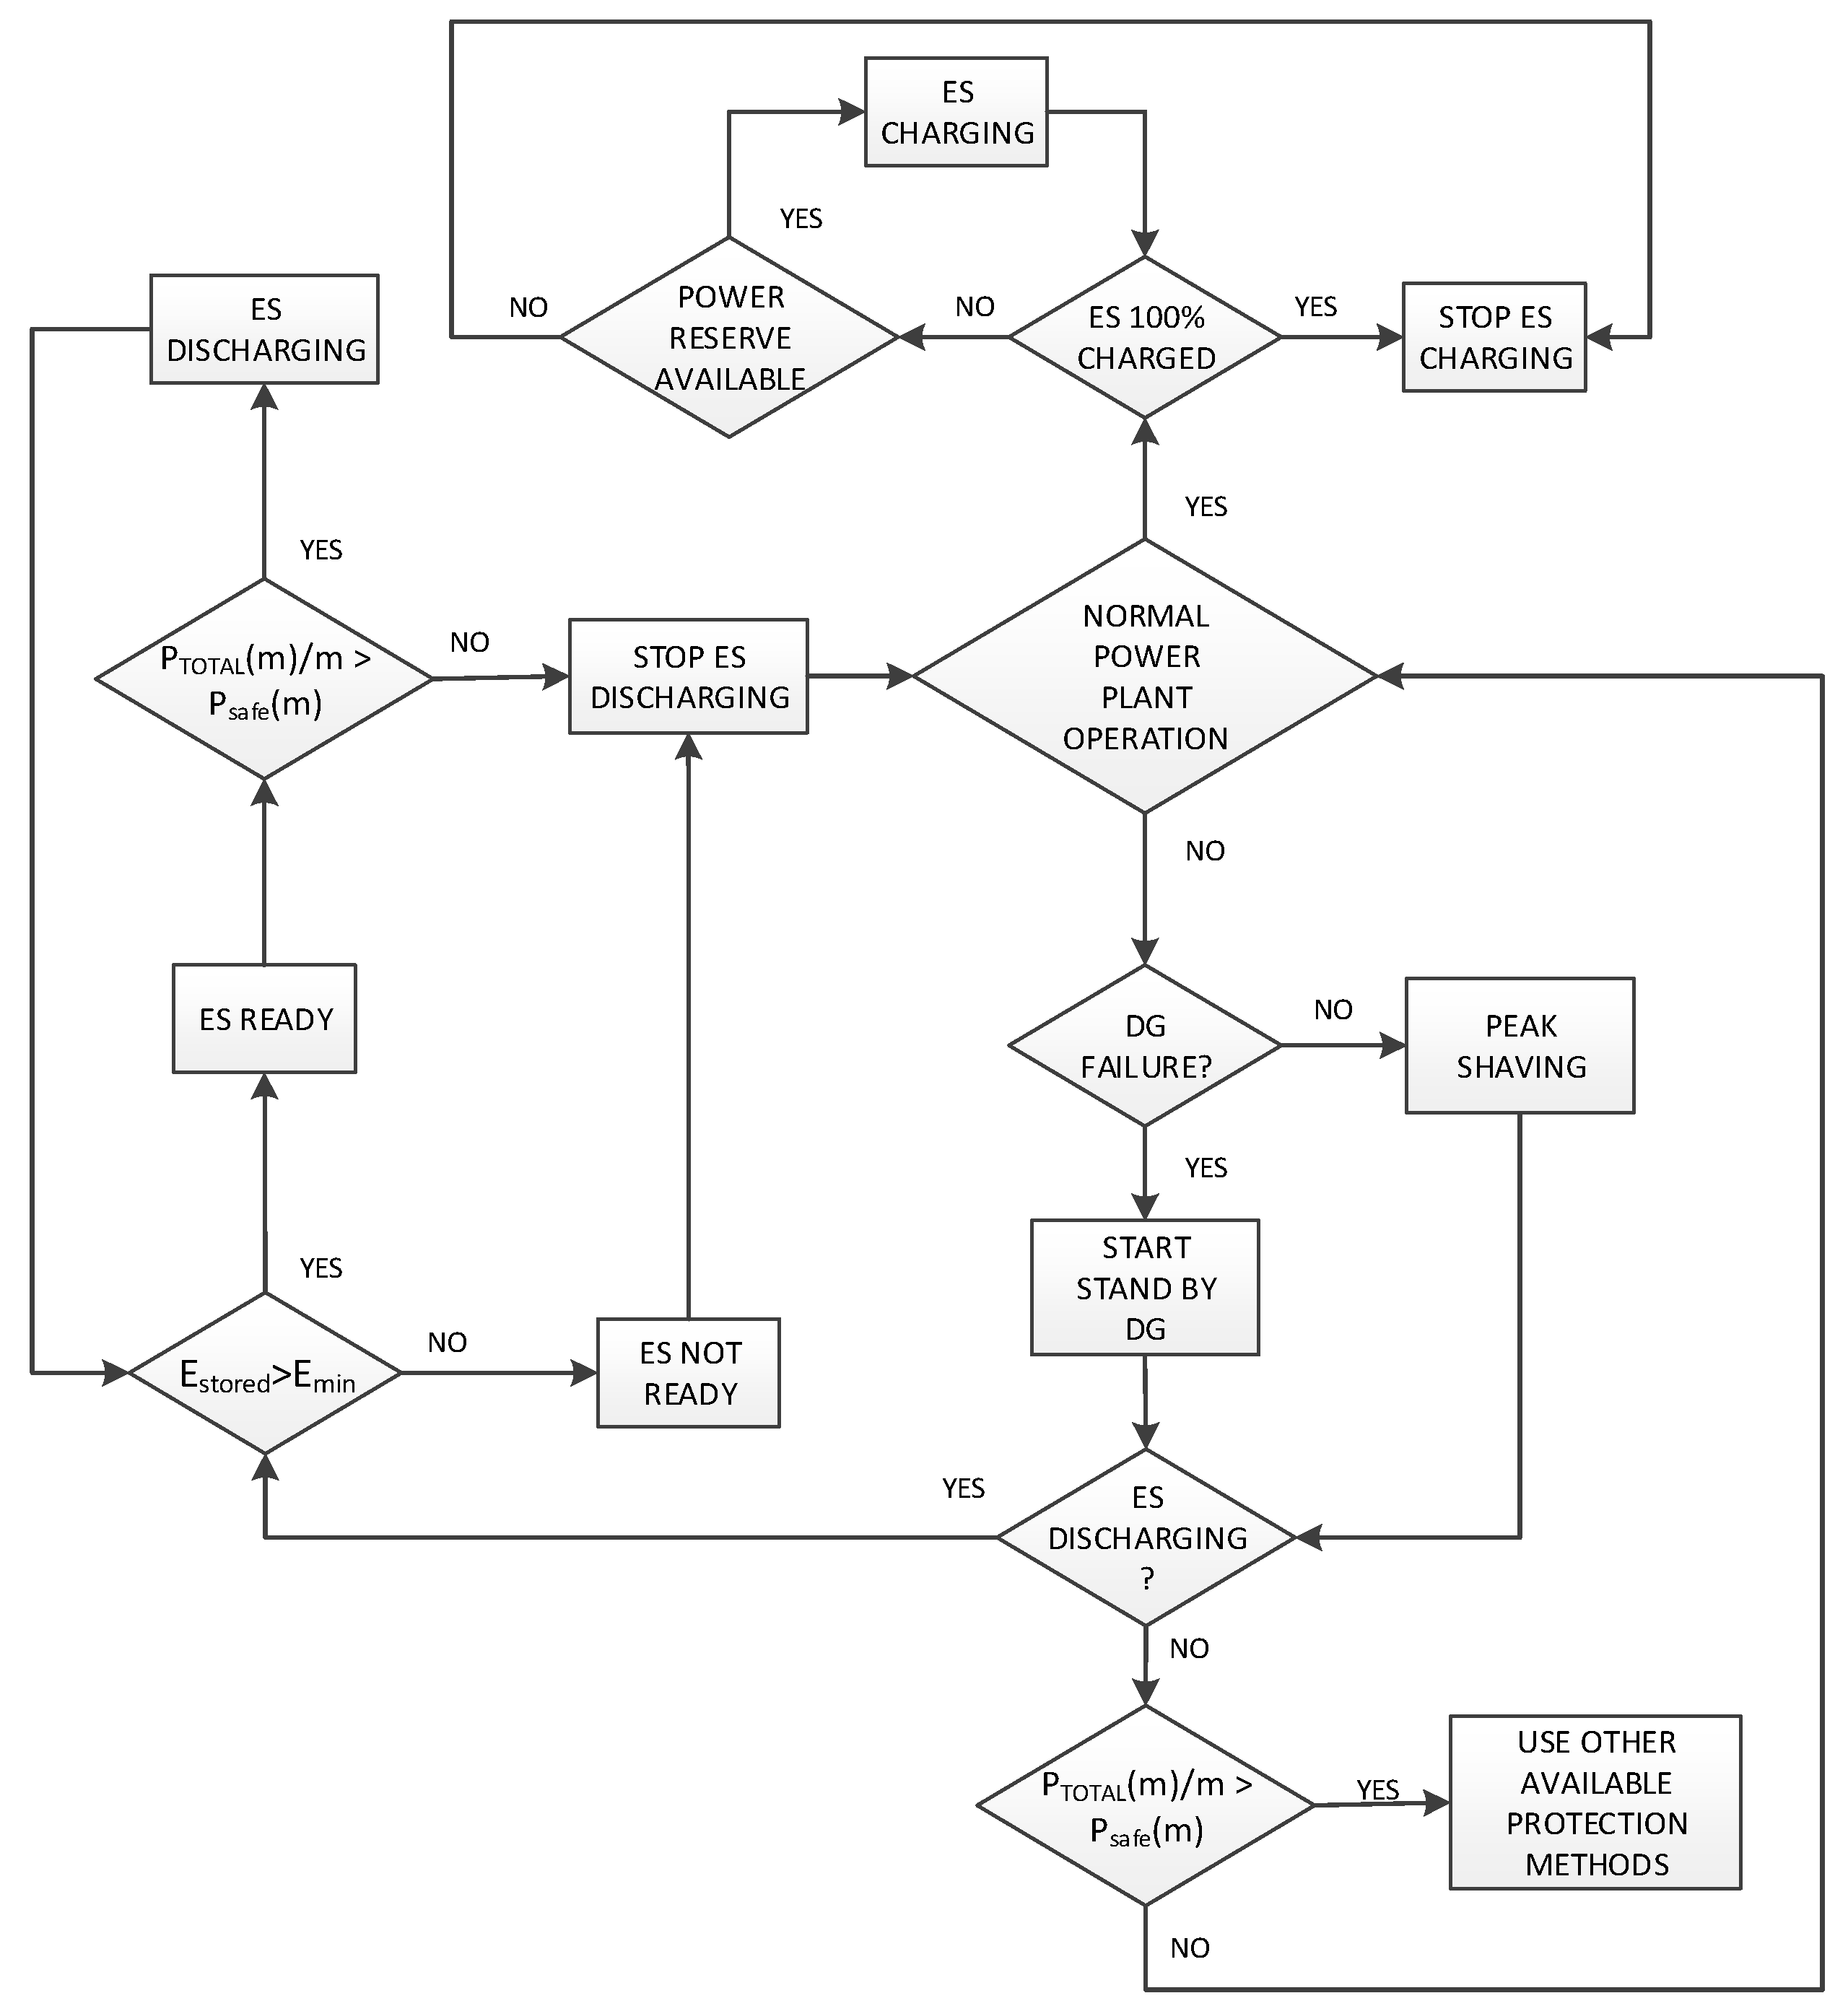
A block diagram of an ES utilization scheme that can be implemented in a PMS system and that allows use of ES in combination with traditional protection methods is shown in Figure 13. It is assumed that ES is always connected to the grid. Energy flow can be in three modes: charging, discharging, and no power flow. The minimum amount of stored energy Emin required for proper function of ES is set according to its type and specifications. The proposed utilization scheme allows use of available spinning reserves for ES charging during periods with lower electrical consumption (i.e. during periods between peak shavings, or to compensate ES idle losses).
ES state of charge (SOC) is constantly monitored during the utilization phase in order to ensure that the amount of stored energy is within a safe operation region (which depends on the ES type and the manufacturer’s recommendations), and also to control the charging process. Charging power and frequency depend on SOC and the available spinning reserve.
When ES is ready for use, total instantaneous electrical consumption is constantly monitored and compared with the safe limit (set in PMS). If total load exceeds the safe limit, ES is instantly connected to the grid and the PMS system checks the status of connected DG units. If all DG units are still online, ES is used for peak shaving. In case of DG unit loss, a stand-by unit is immediately started and ES is used until it is connected to the grid and loaded.
In order to ensure safe operation in all possible conditions, when ES is disconnected from the grid total consumption is again compared to the safe limit. If total load is still above the safe limit (meaning that the fault or power peak is still present and ES is fully discharged) then other standard protection methods must be used, otherwise normal operation is assumed.
7. Overview of Available ES Technologies
Following the presented simulation results, specific requirements for ES are that it must have large specific power and a very fast, almost instantaneous response time to load changes. Specifically, in the considered case, about 85% of stored energy is consumed within the first 30 s after the ES has been connected to the grid. Furthermore the ES must be recharged as soon as possible to at least 90% of its full capacity after the discharging process.
Other important factors to consider are: rated power, charging time, efficient life cycle expressed through the number of complete charging and discharging cycles, efficiency, size and weight.
In this paper, only electrochemical batteries, flywheels, and super capacitors are considered and their key characteristics are summarized in Table 3 [27,28,29,30,31]. Other currently available alternatives would simply be too large and their implementation on board the ship would be technically impossible [32,33].
It can be seen that flywheels and super capacitors show a number of advantages over electrochemical batteries. Their advantages are clearly reflected in those parameters that are crucial for ES application onboard DP vessels. In addition to that, they are both faster and more efficient when absorbing energy from regenerative breaking comparing to electrochemical batteries [34]. Despite the unprecedented advantages, they also have shortcomings, above all a small energy density in kWh/kg, and consequently a larger size, and relatively large self-discharge losses. At the present moment, probably what super capacitors most lack is the ability to realize ES with the required capacities [34].
Small energy density is not as big a problem on ships as it is on land power grids where ES must deliver tens of megawatts over a longer time period (usually 15–20 min). As it can be seen from the simulation results, the required ES capacity for DP vessels is relatively small, averaging 20 kWh, which also reduces their size to somewhat acceptable values.
Excessive self-discharge losses are not such a problem on board DP vessels because both flywheels and super capacitors can be filled very quickly (super capacitors almost instantaneously, and flywheels in a maximum of about 10 s). In addition to that, DP vessels usually have a load profile which constantly alternates between periods with maximum generator load and those with a certain amount of reserve power which can be stored in ES.
At present time, among electrochemical batteries only lithium-ion ones have good enough characteristics and performances that they could be considered as potential ES, but there are still a number of critical safety issues. Namely, in the case of extreme loads, these batteries can discharge the liquid electrolyte through their ventilation openings and may cause ignition. To prevent this, it is necessary to use sophisticated protection methods that are integrated into the battery itself, which significantly increases installation costs.
Considering the availability and maturity of technology together with safety issues, it can be concluded that the flywheel is currently the only rational choice for large scale ES on board DP vessels. Flywheels that can store up to 25 kWh of energy with nominal power up to 400 kW are already available, meaning that several of such units connected in parallel can satisfy the required ES power and capacity [28,35].
Although ES systems based on super condensers and Li-ion batteries still do not meet all the criteria imposed by the specificities of DP vessels, they cannot be a priori rejected as inadequate solutions given the intense efforts invested in their research and development. Next generation of Li-ion batteries which should be available around 2025 will have much higher energy density due to use of NMC81 cathodes and less cobalt content [36], which should result in much smaller and cheaper ES battery packs. It is realistic to expect that the current shortcomings of these two technologies will be overcome in order to compete with the flywheel, or even outmatch it. In support of this, the US Navy is investing considerable resources in the development of Li-ion batteries [37], while super condensers are now being considered as a solution to compensate for peak load in hybrid ship propulsion systems [38].
8. Evaluation Model for ES Implementation on DP Vessels
Accurate data on fuel consumption and maintenance costs can be collected only after a longer period of system exploitation (typically a few years), before and after ES installation. Therefore, systematic recording and collection of exploitation data is of crucial importance for deciding on the installation of ES devices.
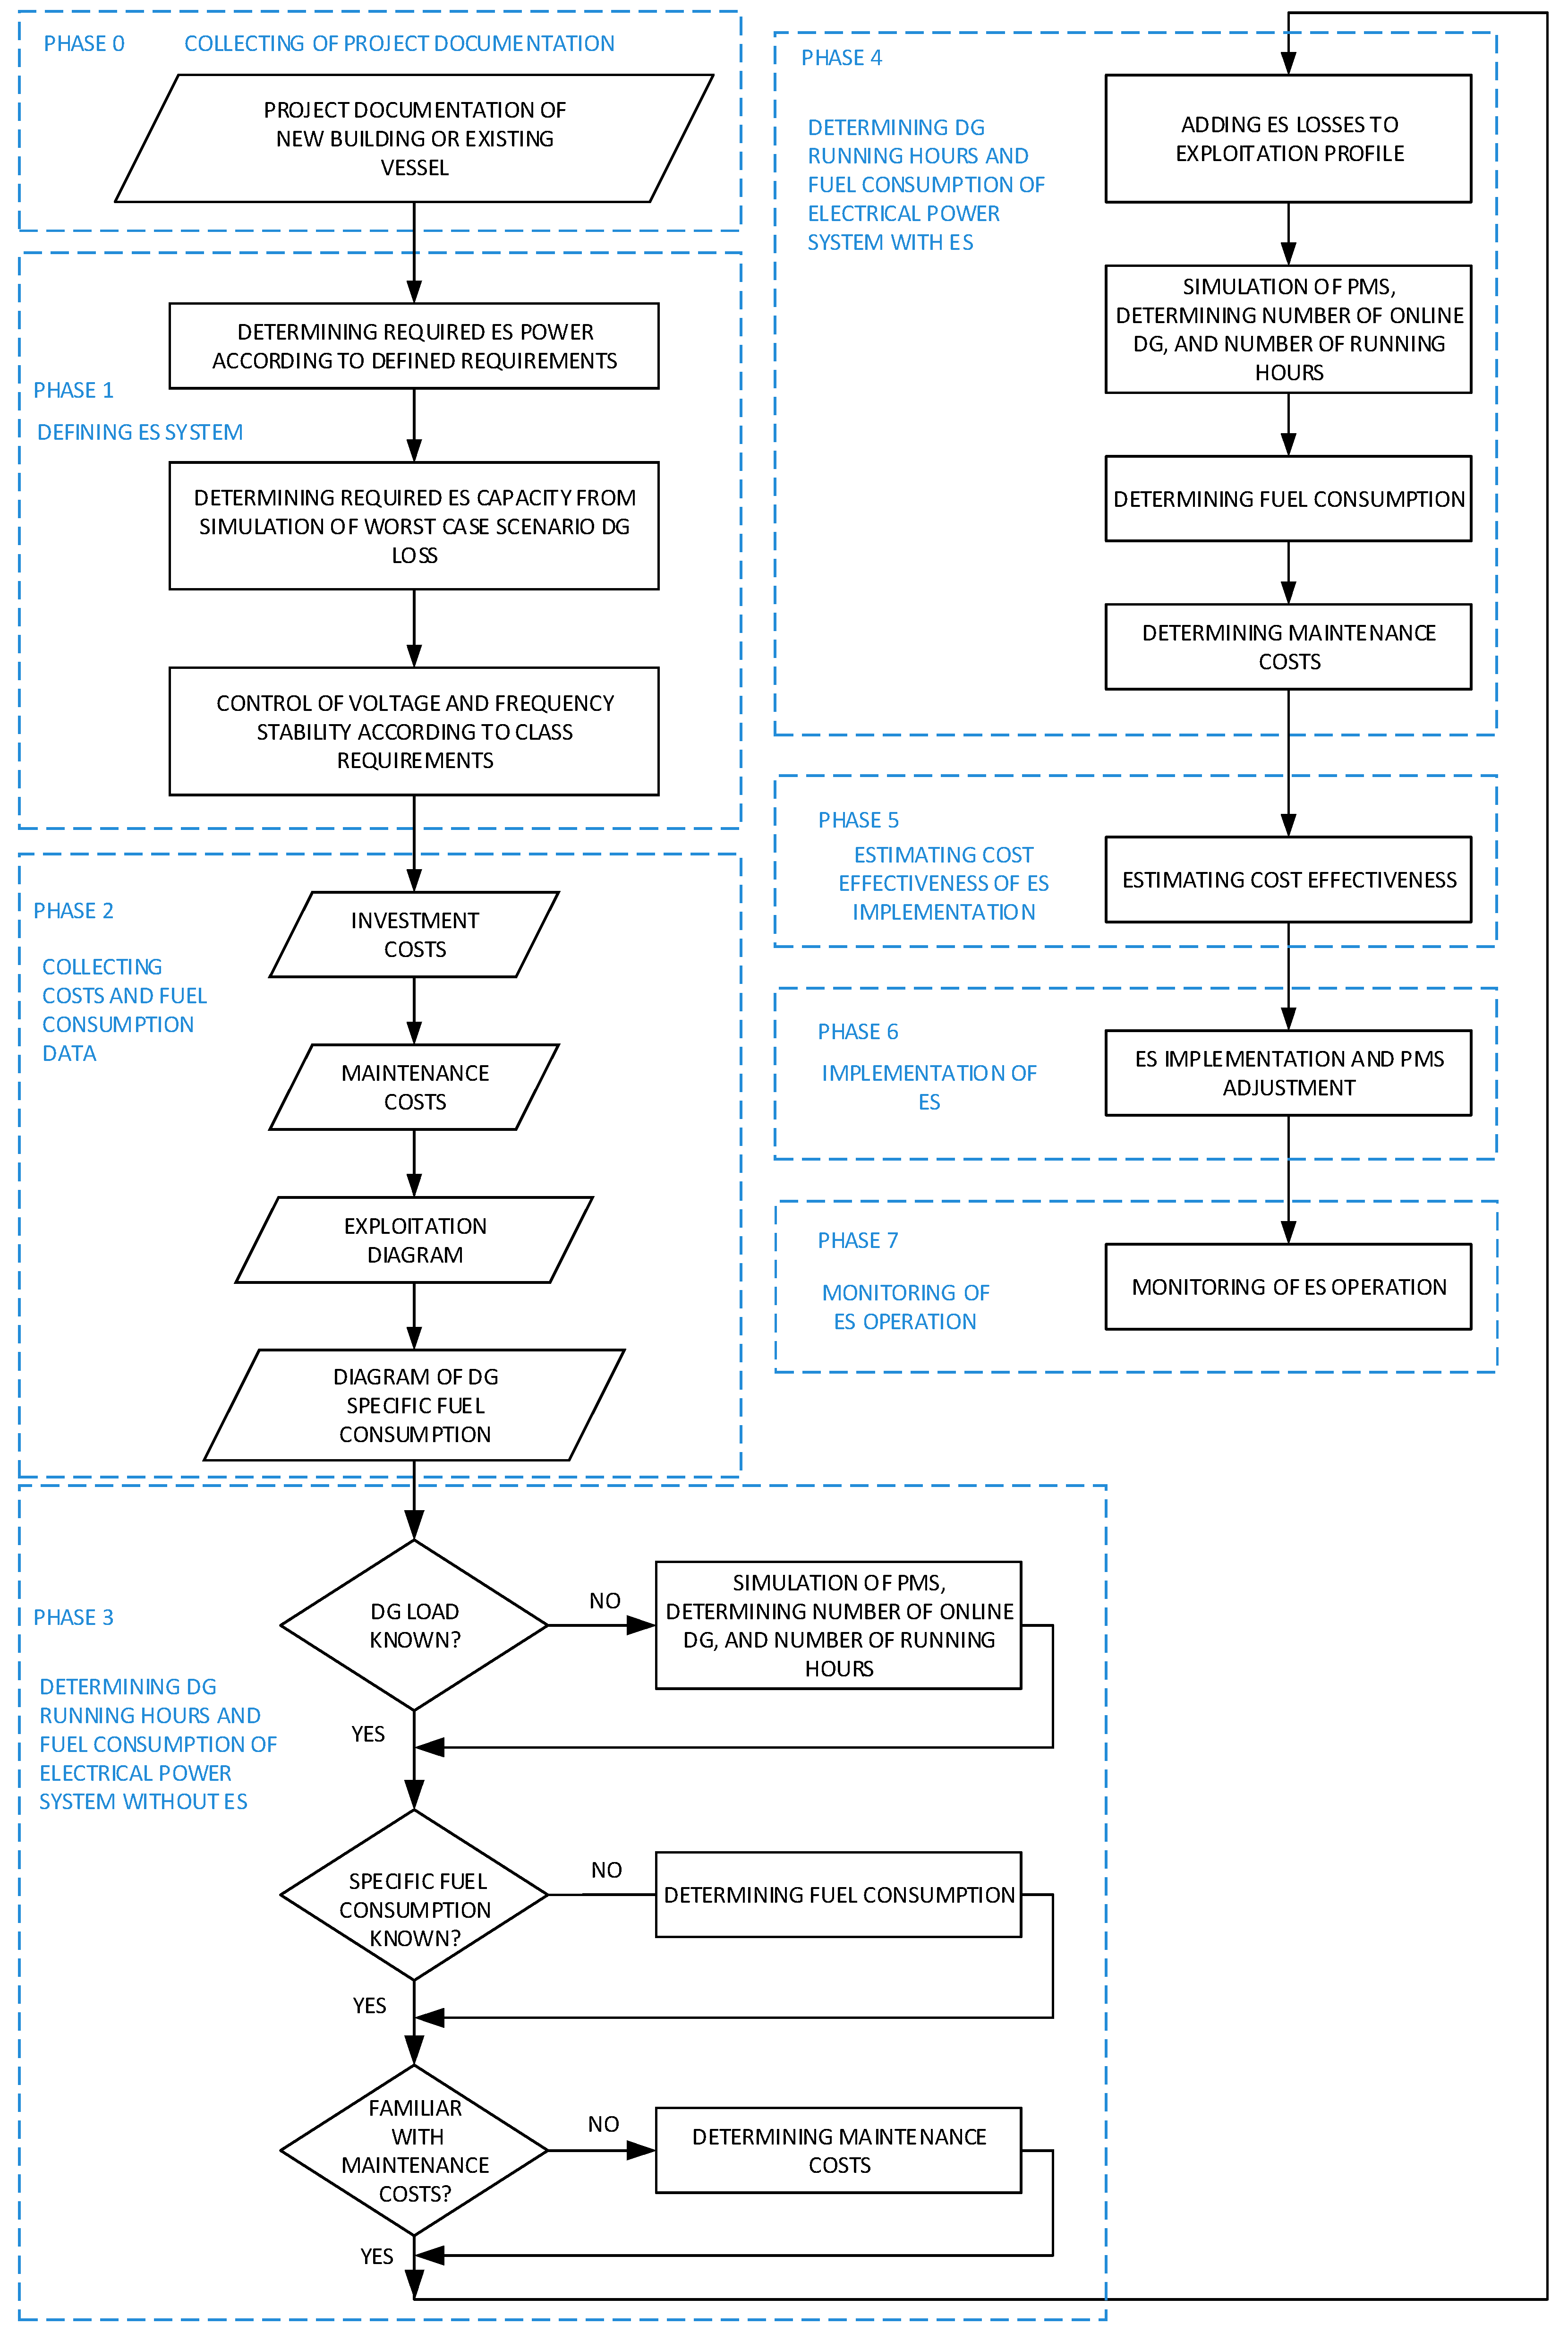
The evaluation model of ES implementation on DP vessels presented in this chapter is based on the knowledge of such data with the purpose of facilitating the calculation of ES implementation cost-effectiveness for ship owners and designers. The block diagram of ES implementation process (Figure 14) is divided in to eight phases.
After collecting project documentation of newly-built or existing vessels, the next step is defining the ES system with the main focus on determining its power and capacity for the worst case scenario that can be expected during its use. For this, it is necessary to develop a simulation model of the electrical power system of the considered vessel and perform appropriate simulations, as presented in Chapters 3 and 4. It is of particular importance to conduct voltage and frequency stability control so that they comply with the class requirements. When the parameters of ES are determined, a suitable solution can be chosen based on the results of comparative analysis of ES systems that meet the requirements of the considered application (Chapter 5).
Once all available data of ES implementation and maintenance costs, as well DGs fuel consumption and maintenance costs, are collected, the estimation of ES cost-effectiveness can be done. In order to facilitate the calculation of fuel consumption from the electrical power consumption data, the DG specific fuel consumption curve (Figure 2) should be accurately approximated by the appropriate mathematical function.
First, it is necessary to determine the number of DG running hours and fuel consumption for the power system without ES. If an individual DG load is known, the calculation of running hours and fuel consumption is performed directly, and if only the total electrical consumption is known, it is necessary to first simulate the operation of the PMS system according to the defined load dependent start and stop tables, and based on the exploitation profile determine the number of DGs online and their individual loads.
In order to calculate the same data for the electrical power system with ES it is necessary to first add ES idle losses to the exploitation profile. From the PMS system simulation, now with the different conditions of starting and stopping DGs allowed by the use of ES, the required values can be determined. When fuel and maintenance costs for systems with and without ES are known, the cost-effectiveness of ES can be estimated. If installation appears to be viable, then the implementation and monitoring phase can begin.
9. Conclusions
In this paper, the possibility of large scale ES implementation on board DP vessels was analyzed. The main focus of this research was to perform analysis of the vessel’s electrical power supply stability during a fault, with and without ES and to determine the required capacity and characteristics of ES. For the purpose of this analysis, a dynamic simulation model of the vessel electrical power system with ES was used. The simulation was performed for the worst case scenario that can theoretically happen during use with closed bus bars. For all simulation scenarios it was assumed that ES was able to replace one generator when it failed, until the stand-by generator was ready to take a load. In addition, system behavior during power peak and peak shaving with ES was simulated.
Simulation results have shown that implementation of ES can increase the stability and availability of the electrical power supply and enable the operation of diesel generators with optimal load when the system is running with a closed bus bar. Furthermore, simulation showed that ES is suitable for use on board DP vessels should have large specific power and an almost instantaneous response time to load changes. Given the current state of technology, the flywheel may be the best solution for implementing large scale ES on board DP vessels. Methodology used in this work can be used as a reference for the design of ship power systems with ES and evaluation of ES cost-effectiveness.
Author Contributions
This work has been done by A.C., D.V., R.P. and J.Ć. The manuscript was written by the first author—A.C.
Funding
This work has been financially supported by University of Rijeka under the Faculty of Maritime Studies projects.
Conflicts of Interest
The authors declare no conflict of interest.
References
- International Marine Contractors Association (IMCA). A Guide to DP Electrical Power and Control Systems; M-206; IMCA: London, UK, 2010. [Google Scholar]
- Settemsdal, S.O.; Haugan, E.; Aagesen, K.; Zahedi, B.; Drilling, S.A. New enhanced safety power plant solution for DP vessels operated in closed ring configuration. In Proceedings of the Dynamic Positioning Conference, Houston, TX, USA, 14–15 October 2014. [Google Scholar]
- May, J.J.; Foss, H. Power Management System for the “Deepwater Horizon” a dynamically positioned all weather semisubmersible. In Proceedings of the Dynamic Positioning Conference, Houston, TX, USA, 17–18 October 2000. [Google Scholar]
- Laghari, J.A.; Mokhlis, H.; Bakar, A.H.; Karimi, M.; Shahriari, A. An intelligent under frequency load shedding scheme for islanded distribution network. In Proceedings of the Power Engineering and Optimization Conference (PEDCO), Melaka, Malaysia, 6–7 June 2012; pp. 40–45. [Google Scholar]
- Lauvdal, T.; Ådnanes, A.K. Power management system with fast acting load reduction for DP vessels. In Proceedings of the Dynamic Positioning Conference, Houston, TX, USA, 17–18 October 2000. [Google Scholar]
- May, J.J. Improving engine utilization on DP drilling vessels. In Proceedings of the Dynamic Positioning Conference, Houston, TX, USA, 16–17 September 2003. [Google Scholar]
- Radan, D. Integrated Control of Marine Electrical Power Systems. Ph.D. Thesis, Norwegian University of Science and Technology, Trondheim, Norway, 2008. [Google Scholar]
- Cargill, S. A novel solution to common mode failures in DP Class 2 power plant. In Proceedings of the Dynamic Positioning Conference, Houston, TX, USA, 9–10 October 2007. [Google Scholar]
- Mathiesen, E.; Realfsen, B.; Brievik, M. Methods for reducing frequency and voltage variations on DP vessels. In Proceedings of the Dynamic Positioning Conference, Houston, TX, USA, 9–10 October 2012. [Google Scholar]
- Det Norske Veritas (DNV). Offshore Stabdard DNV-OS-D201—Electrical Installations; DNV GL: Oslo, Norway, 2011. [Google Scholar]
- McGroarty, J.; Schmeller, J.; Hockney, R.; Polimeno, M. Flywheel energy storage system for electric start and an all-electric ship. In Proceedings of the IEEE Electric Ship Technologies Symposium, Philadelphia, PA, USA, 27 July 2005; pp. 400–406. [Google Scholar]
- Holsonback, C.; Webb, T.; Kiehne, T.; Seepersad, C.C. System-level modeling and optimal design of an all-electric ship energy storage module. In Proceedings of the Electric Machines Technology Symposium, Philadelphia, PA, USA, 22–24 May 2006. [Google Scholar]
- Domaschk, L.N.; Ouroua, A.; Hebner, R.E.; Bowlin, O.E.; Colson, W.B. Coordination of large pulsed loads on future electric ships. IEEE Trans. Magn. 2007, 43, 450–455. [Google Scholar] [CrossRef]
- Tsekouras, G.J.; Kanellos, F.D. Optimal operation of ship electrical power system with energy storage system and photovoltaics: Analysis and application. Trans. Power Syst. 2013, 8, 145–155. [Google Scholar]
- Kanellos, F.D. Optimal power management with GHG emissions limitation in all-electric ship power systems comprising energy storage systems. Trans. Power Syst. 2014, 29, 330–339. [Google Scholar] [CrossRef]
- Det Norske Veritas (DNV). Dynamic Positioning Vessel Design Philosophy Guidelines; DNV GL: Oslo, Norway, 2012. [Google Scholar]
- Garg, K.; Weingarth, L.; Shah, S. Dynamic positioning power plant system reliability and design. In Proceedings of the Petroleum and Chemical Industry Conference Europe Electrical and Instrumentation Applications, Rome, Italy, 7–9 June 2011; pp. 1–10. [Google Scholar]
- Adnanes, A.K. Status and inventions in electrical power and thruster systems for drillships and semi-submersible rigs. In Proceedings of the Dynamic Positioning Conference, Houston, TX, USA, 28–30 September 2004. [Google Scholar]
- Radan, D.; Johansen, T.A.; Sorensen, A.J.; Adnanes, A.K. Optimization of load dependent start tables in marine power management systems with blackout prevention. Trans. Circuits Syst. 2005, 4, 1861–1866. [Google Scholar]
- Sørfon, I. Power Managemenet Control of Electrical Propulsion Systems. In Proceedings of the Dynamic Positioning Conference, Houston, TX, USA, 9–10 October 2012. [Google Scholar]
- Wartsila 32 Product Guide. Available online: https://www.wartsila.com (accessed on 10 October 2018).
- Ong, C.M. Dynamic Simulation of Electric Machinery: Using MATLAB/SIMULINK; Prentice Hall PTR: Upper Saddle River, NJ, USA, 1998. [Google Scholar]
- Luo, L.; Gao, L.; Fu, H. The control and modeling of diesel generator set in electric propulsion ship. Inf. Technol. Comput. Sci. 2011, 2, 31–37. [Google Scholar] [CrossRef]
- IEEE Power Engineering Society. IEEE Recommended Practice for Excitation System Models for Power System Stability Studies; IEEE Power Engineering Society: Piscataway, NJ, USA, 2005. [Google Scholar]
- Khalifa, A.S. Control and Interfacing of Three Phase Grid Connected Photovoltaic Systems. Master’s Thesis, University of Waterloo, Waterloo, ON, Canada, 2010. [Google Scholar]
- Surprenant, M.; Hiskens, I.; Venkataramanan, G. Phase locked loop control of inverters in a microgrid. In Proceedings of the 2011 IEEE Energy Conversion Congress and Exposition, Phoenix, AZ, USA, 17–22 September 2011; pp. 667–672. [Google Scholar]
- Chen, H.; Cong, T.N.; Yang, W.; Tan, C.; Li, Y.; Ding, Y. Progress in electrical energy storage system: A critical review. Prog. Nat. Sci. 2009, 19, 291–312. [Google Scholar] [CrossRef]
- Fuchs, G.; Lunz, B.; Leuthold, M.; Sauer, D.U. Technology Overview on Electricity Storage; ISEA: Aachen, Germany, 2012. [Google Scholar]
- Hadjipaschalis, I.; Poullikkas, A.; Efthimiou, V. Overview of current and future energy storage technologies for electric power applications. Renew. Sustain. Energy Rev. 2009, 13, 1513–1522. [Google Scholar] [CrossRef]
- Nikolaidis, P.; Poullikkas, A. A comparative review of electrical energy storage systems for better sustainability. J. Power Technol. 2017, 97, 220–245. [Google Scholar]
- Luo, X.; Wang, J.; Dooner, M.; Clarke, J. Overview of current development in electrical energy storage technologies and the application potential in power system operation. Appl. Energy 2015, 137, 511–536. [Google Scholar] [CrossRef] [Green Version]
- Donaldson, A.J. Energy Storage—New technologies and new roles. In Proceedings of the Marine Engineer in the Electronic Age, Alexandria, VA, USA, 29–30 April 2002; pp. 237–245. [Google Scholar]
- Hockney, R.; Polimeno, M.; Daffey, K. Flywheel Energy Storage Integration into a Naval Power System. In Proceedings of the Turbo Expo 2006: Power for Land, Sea, and Air, Barcelona, Spain, 8–11 May 2006; pp. 25–33. [Google Scholar]
- Un-Noor, F.; Padmanaban, S.; Mihet-Popa, L.; Mollah, MN.; Hossain, E. A comprehensive study of key electric vehicle (EV) components, technologies, challenges, impacts, and future direction of development. Energies 2017, 10, 1217. [Google Scholar] [CrossRef]
- Bolund, B.; Bernhoff, H.; Leijon, M. Flywheel energy and power storage systems. Renew. Sustain. Energy Rev. 2007, 11, 235–258. [Google Scholar] [CrossRef]
- Mihet-Popa, L.; Saponara, S. Toward Green Vehicles Digitalization for the Next Generation of Connected and Electrified Transport Systems. Energies 2018, 11, 3124. [Google Scholar] [CrossRef]
- Li-Ion Technology for Surface Ships Advanced Energy Storage for New Generation AES. Available online: http://alpha-energy.ru/D/0000009803/EU_Saft_LiIon_Mt_SurfaceShips_32027-2-0409_200904_en.pdf (accessed on 15 October 2018).
- Chen, J.W.; Lindtjørn, J.O.; Wendt, F. Hybrid Marine Electric Propulsion System; ABB: Cary, NC, USA, 2012. [Google Scholar]
Figure 1.
Typical topology of a dynamically positioned (DP) vessel electrical power system.

Figure 2.
Specific fuel consumption of a medium speed diesel engine [21].
Figure 2.
Specific fuel consumption of a medium speed diesel engine [21].

Figure 3.
Electrical power consumption trend of DP vessel.

Figure 4.
Simulation results of diesel generator (DG) utilization.

Figure 5.
DG utilization in respect to fuel consumption.

Figure 6.
Simulation model of ship’s electrical system with energy storage (ES) (block diagram).

Figure 7.
Equivalent circuit of synchronous generator block in a dq reference frame.

Figure 8.
Simulation results for one DG loss without ES.

Figure 9.
Simulation results for one DG loss with ES.

Figure 10.
Simulation scenario for 3.6 MVA generator loss when two DGs are running in parallel, each loaded with 95% of nominal power.
Figure 10.
Simulation scenario for 3.6 MVA generator loss when two DGs are running in parallel, each loaded with 95% of nominal power.

Figure 11.
System behavior during a power peak.

Figure 12.
Power peak shaving with ES.

Figure 13.
ES utilization scheme.

Figure 14.
Block diagram of the ES implementation process.


Table 1.
Simulation parameters settings.
| Synchronous Generator Parameter | |
| Rated power | 3600 kVA |
| Line voltage | 6600 V |
| Frequency | 60 Hz |
| Xd | 1.54 pu |
| Xd′ | 0.29 pu |
| Xd′′ | 0.175 pu |
| Xq | 1.04 pu |
| Xq′′ | 0.175 pu |
| Xl | 0.052 pu |
| Td′ | 3.7 s |
| Td′′ | 0.05 s |
| Tq′′ | 0.05 s |
| Rs | 0.0036 pu |
| H | 1.5 s |
| Speed Regulator Parameters | |
| Regulator gain Kp | 12 |
| Regulator time constants | T1 r = 0.01 s; T2 r = 0.02 s; T3 r = 0.2 s |
| Actuator time constants | T1a = 0.25 s; T2a = 0.009 s; T3a = 0.038 s |
| Mechanical torque limits | Tmin = 0; Tmax = 1.1 pu |
| Voltage Regulator Parameters | |
| Voltage regulator gain Ka | 400 |
| Voltage regulator time constant | T1rn (s) = 0.02 s |
| Output voltage limits | Vgmin = 0; Vg max = 2.2 pu |
| Damping filter gain Kpf | 0.03 |
| Damping filter time constant | T1f = 1 s |
Table 2.
Required ES capacity and power ratings for different DG sizes.
| Generator Power (kVA) | Required ES Capacity (kWh) | Minimum Required ES Power (kW) |
|---|---|---|
| 2000 | 12.44 | 1280 |
| 2300 | 14.31 | 1472 |
| 2600 | 16.18 | 1664 |
| 3000 | 18.67 | 1920 |
| 3300 | 20.53 | 2112 |
| 3600 | 22.42 | 2304 |
| 4000 | 24.89 | 2560 |
Table 3.
Characteristics of considered ES technologies
| Technology | Specific Power (W/kg) | Charge Time | Charge/Discharge Cycles | Efficiency (%) | Power Cost $/kW | Energy Cost $/kWh | Operation and Maintenance Costs S/kW per year |
|---|---|---|---|---|---|---|---|
| Lead Acid | 700 | Slow | ≤1200 | 70–85 | 300–600 | 200–400 | 50 |
| NiCd | 700 | Slow | ≤5000 | 60–70 | 500–1500 | 800–1500 | 20 |
| Li-Ion | 2000 | Slow | ≤8000 | 90–97 | 1200–4000 | 600–2500 | - |
| Super capacitors | 10,000 | Instant | >100,000 | 90–95 | 100–300 | 300–2000 | 6 |
| Flywheel | 5000 | Very fast | >100,000 | 95–99 | 250–350 | 1000–5000 | 20 |
© 2019 by the authors. Licensee MDPI, Basel, Switzerland. This article is an open access article distributed under the terms and conditions of the Creative Commons Attribution (CC BY) license (http://creativecommons.org/licenses/by/4.0/).
Share and Cite
MDPI and ACS Style
Cuculić, A.; Vučetić, D.; Prenc, R.; Ćelić, J. Analysis of Energy Storage Implementation on Dynamically Positioned Vessels. Energies 2019, 12, 444. https://doi.org/10.3390/en12030444
AMA Style
Cuculić A, Vučetić D, Prenc R, Ćelić J. Analysis of Energy Storage Implementation on Dynamically Positioned Vessels. Energies. 2019; 12(3):444. https://doi.org/10.3390/en12030444
Chicago/Turabian StyleCuculić, Aleksandar, Dubravko Vučetić, Rene Prenc, and Jasmin Ćelić. 2019. "Analysis of Energy Storage Implementation on Dynamically Positioned Vessels" Energies 12, no. 3: 444. https://doi.org/10.3390/en12030444
Note that from the first issue of 2016, this journal uses article numbers instead of page numbers. See further details here.