The Influence of Residence Time during Hydrothermal Carbonisation of Miscanthus on Bio-Coal Combustion Chemistry

1
School of Biological and Chemical Engineering, Aarhus University, Hangøvej 2, 8200 Aarhus, Denmark
2
School of Chemical and Process Engineering, University of Leeds, Woodhouse Lane, Leeds, LS2 9JT, UK
*
Author to whom correspondence should be addressed.
Energies 2019, 12(3), 523; https://doi.org/10.3390/en12030523
Submission received: 6 December 2018
/
Revised: 2 February 2019
/
Accepted: 3 February 2019
/
Published: 7 February 2019
(This article belongs to the Special Issue Selected Papers from 26th European Biomass Conference & Exhibition (EUBCE 2018))
Abstract
:Miscanthus was treated by hydrothermal carbonisation in a 2-L batch reactor at 200 °C and 250 °C with residence times ranging between 0 and 24 h to understand the impact of residence time has on the resulting bio-coal combustion chemistry. Increasing the residence time results in dehydration of the bio-coal and increased repolymerisation; however, temperature has the greatest influence on bio-coal properties. After 24 h at 200 °C, bio-coal has similar properties to that of the 250 °C + 0 h bio-coal. After 1 h at 250 °C, the cellulose present in the raw biomass appears to be largely removed. The removal of cellulose and the associated dehydration and repolymerisation results in bio-coal having a ‘coal like’ combustion profile, which exhibits a decreasing reactivity with increasing residence time. At 200 °C + 0 h, 75% of the alkali metal is removed, increasing to 86% with increasing residence time. Further extraction is seen at 250 °C. Phosphorus and sulphur appear to undergo substantial extraction at 200 °C + 0 h but then are reincorporated with increasing residence time. The calcium content increases in the bio-coal with increasing residence time at 200 °C but then reduces after 1 h at 250 °C. Increasing temperature and residence time has been shown to decrease the fuels’ fouling and slagging propensity.
Keywords:
HTC; bio-coal; severity factor; slagging; fouling; corrosion; process chemistry; pulverised fuel; combustion1. Introduction
Hydrothermal carbonisation (HTC) is a thermal conversion process capable of producing sustainable carbonaceous products from biomasses and waste materials. These carbonaceous products can be used in a wide range of applications, including solid fuels [1,2], catalyst supports [3,4], absorbents for environmental remediation [5,6,7] and soil additives [8]. The reaction rates and products from HTC are governed to a large extent by reaction temperature, which governs the extent of hydrolysis, dehydration and polymerisation reactions [9,10] and the onset of the degradation of key components such as cellulose, hemicellulose and lignin [10,11,12,13]. Residence time is another important parameter, with studies in the literature ranging from less than 5 min up to several days. Many studies on the production of bio-coal for combustion applications focus on shorter residence times, for example, 5 min in Reza et al. [13] or 1 h in Smith et al. [2,14,15]. Only limited studies have investigated the effect of residence time on the removal of minerals. This is important as several authors have suggested that HTC may reduce the slagging, fouling and corrosion propensity of the resulting bio-coal, as demonstrated through either alkali metal or ash reductions [2,13,14,15,16,17,18,19,20,21,22].
Shorter residence times have the advantage of increasing reactor throughput, although they can also impose kinetic limitations, preventing aromatisation and repolymerisation [23]. It has been suggested by several authors that HTC is a two-stage process. The initial stage includes predominantly the hydrolysis of the starting biomass, along with dehydration and decarboxylation reactions. These initial reactions are quick, and it is assumed that in many HTC studies, these reactions may have gone to completion by the time the hold temperature is reached [24,25]. The second-stage reactions include the polymerisation and aromatisation of the hydrolysed and dehydrated fragments created in the first stage. The advantage of retaining the reactor at temperature is that it promotes polymerisation and aromatisation of these fragments in the liquid phase, but this can also lead to the precipitation of insoluble salts [9]. Hoekman et al. [24] processed a spruce/fir mix at varying residence times and analysed the acids and sugars present in the process water by ion chromatography, along with the mass yields and energy density of the resulting chars. The results indicate that the sugar content in the process water decreases with increasing residence time. This is associated with an increase in organic acid content; however, overall, the total organic carbon (TOC) in the process water decreases, which is indicative of repolymerisation. Furthermore, despite a small but noticeable decrease in mass recovery, the energy content was shown to increase with residence time. Kruse et al. [26] also demonstrated that an increase in residence time between 180 °C and 250 °C reduces the nitrogen content of the resulting bio-coal for straw, herbaceous agricultural wastes and microalgae. It is generally assumed that longer residence times increase the reaction severity [9]; however, there is a trade-off between the costs associated with retaining a process at temperature (influence on throughput, increased energy costs, etc.) and the product quality.
Several researchers have linked the temperature and pressure conditions as described in Equation (1) into a single term known as the ‘severity factor’ [23,27,28,29]. The severity factor is the logarithm of the reaction ordinate; a reactivity factor developed by Overend and Chornet [30] to characterise hydrolytic depolymerisation processes during wood pulping and similar operations. The principle dictates that similar products can be achieved through either lower reaction temperatures with increased residence times or higher temperatures with lower residence times. The equation is advantageous when predicting hydrolytic depolymerisation processes but becomes limited when you consider the kinetic limitations imposed by aromatisation and polymerisation. Consequently, simply increasing the reaction temperature in order to overcome long residence times may not overcome the need for residence at temperature due to these kinetic limitations [23]. The influence of particle size and solid loading are additional factors that will influence the required residence time, as both diffusion-controlled transport mechanisms during biomass decomposition and condensation polymerisation are likely to govern the overall rate of reaction.
Severity Factor = Log (time (min)) * e [(temp (°C) − 100)/14.75].
In this paper, Miscanthus was hydrothermally carbonised at two temperatures 200 °C and 250 °C, with varying residence times from 0 h to 24 h to understand the impact that increasing the residence time has on the resulting bio-coal chemical composition and its inorganic and combustion chemistry.
2. Materials and Methods
2.1. Materials
Samples of Miscanthus giganteus were obtained from Rothamsed Research having been cultivated at the Wodburn experimental farm in Bedfordshire, UK, (52 01° N 00 36 W) as part of a cultivation trial. The samples were initially cut in a garden shredder followed by further homogenisation in a cutting mill (Retsch, Germany) using a 4-mm grate to a particle size of 0.5–1.0 mm. The samples were then oven dried at 70 °C for 72 h before processing.
2.2. Hydrothermal Carbonisation
HTC was performed in a modified 2000-ml high-pressure batch reactor containing a quartz liner (Parr, USA) at 200 °C and 250 °C with 5 different residence times (0, 1, 4, 8 and 24 h). The residence time is taken as the time from when the centre of the reactor reaches the desired reaction temperature to when the reactor is removed from the heating jacket. The temperature of the reactor was controlled by a thermocouple located on the reactor inner wall and a proportional-Integral-Derivative (PID) heating controller. The PID controller was tuned to prevent heating beyond the desired temperature and to ensure consistent heating profiles. A second thermocouple was located in the centre of the reactor, and these values were taken as the reaction temperature. Pressure and temperature were continually logged throughout the experiment. For each run, a 10% solid loading was used with a combined mass of 1000 grams per run. The quartz liner, mass of biomass and mass of water were weighed before loading the reactor. Once sealed, the air in the reactor was removed by a vacuum pump and the reactor flushed with argon twice before being pre-pressurised to 5 bar with argon. The reactor was then heated to the desired temperature at approximately 5 °C min−1, after which the temperature was maintained for the desired residence time. At the end of the desired residence time, the reactor was removed from the heating jacket and allowed to air cool to room temperature. Once opened, the quartz reactor liner and contents were re-weighed, and any additional moisture inside the reactor was quantified using a pre-weighed tissue paper. The solid and liquid products were separated by filtration under a vacuum using 110-mm qualitative filter paper (Grade 3, Whatman, UK). Any remaining solid sample in the quartz liner was recovered through repeated rinsing of the liner with the process water until the liner was clear of char. The process water yield was subsequently calculated by subtracting the starting mass of the liner and the wet char from the post-run mass of the quartz reactor liner and contents. The gas yield was taken as the starting mass of the liner and contents minus the mass of the liner and contents plus the mass of moisture recovered from the reactor. The bio-coal was allowed to air dry in a ventilated fume cupboard for a minimum of 48 h and then oven dried at 60 °C overnight. Yields are defined as dry bio-coal mass compared with the original dry mass of the unprocessed Miscanthus.
2.3. Analysis
2.3.1. Inorganic Analysis
Prior to analysis, the dried samples were ground and homogenised to below 100 µm in a cryomill (Retsch, Germany). Metal analysis was preformed using atomic absorption spectroscopy (AAS) for the potentially volatile alkali and alkaline earth metals, while the remaining metals, along with phosphorus and silicon, were determined using wavelength dispersive X-ray fluorescence (WD-XRF). For XRF analysis, the samples were ashed in a PID-controlled muffle furnace (Nabertherm, Germany) to a final temperature of 550 °C in accordance with BS EN ISO 18122-2 to minimise volatile metal loss. The ash was then combined with a lithowax binder using a 10:1 ratio and pelletised at 10 tonnes using a laboratory press (Spex, UK). The elemental composition of the ash was then determined by XRF (Rigaku, USA) using the metal oxide method. The carbon content of the ash was determined by CHNS analysis (Thermo Scientific, USA) and used to correct the XRF component list.
For AAS analysis, 0.2 g of the sample were digested using the acid digestion method described in Smith et al. [2]. Then, 10 ml hydrofluoric acid was used to remove the silica, before being taken to dryness and re-digested in 10 ml hydrochloric acid to remove any residual fluorine. A combination of nitric and sulphuric acid was used to remove residual organic material. The AAS was calibrated using standard elemental stock solutions (Spectrosol, UK), and the calibration and extraction efficiency were checked using certified biomass reference materials (Elemental Microanalysis, UK).
Fuel chlorine and sulphur were determined according to BS EN ISO 16994-2 using an oxygen bomb (Parr, USA), distilled water as an aqueous absorption media and ion exchange chromatography (Dionex, USA).
2.3.2. Organic Analysis, Combustion Properties and Ash Measurement
Carbon, hydrogen, nitrogen and oxygen content was measured using a Flash 2000 CHNS-0 analyser (Thermo Scientific, USA). The instrument was calibrated and checked using calibration standards and certified biomass reference materials (Elemental Microanalysis, UK). The residual moisture within the biomass was determined using a moisture oven (Carbolite, UK) at 105 °C under nitrogen in accordance with BS EN ISO 18134-3:2015, and the hydrogen and oxygen values were corrected to account for residual moisture in accordance with ASTM D3180-15, with figures presented on a dry basis (db). The ash content was determined at 550 °C using the methodology described in BS EN ISO 18122:2015. The higher heating value (HHV) was calculated by the Dulong equation (see Equation (2)). Volatile matter and fixed carbon were determined using a thermo-gravimetric analyser (TGA) (Mettler Toledo, Switzerland), where 10 µg of the sample were heated to 900 °C at a ramp rate of 25 °C min-1 in nitrogen, with a hold time at 105 °C and 900 °C before switching to air. Fuel burning profiles were obtained using TGA (Mettler Toledo, Switzerland) by heating 10 µg of sample to 900 °C at 10 °C min−1 and calculating the first derivative of the TGA.
HHV = (0.3383 * % Carbon) + (1.422 * % Hydrogen) – (% Oxygen/8).
2.3.3. Prediction of Slagging and Fouling Propensity
The propensity of the fuels to slag and foul was assessed using the ash fusion test (AFT) and via slagging and fouling indices. The AFT was performed using a Carbolite digital ash fusion furnace in accordance with DD CEN/TS 15370-1:2006. Cylindrical test pieces were formed using a dextrin binder (Sigma-Aldrich, USA), and the ash samples were heated from 550 °C to 1570 °C in an oxidising atmosphere, with an air flow of 50 ml min−1. Images were taken at 5 °C intervals and were subsequently analysed to identify changes in test piece shape, indicative of changes in the ash properties, as described in the standard. The key temperature stages include (i) the beginning of the shrinkage, (ii) sample deformation, (iii) hemisphere and (iv) flow temperature. Temperatures are given to the nearest 10 °C in accordance with the standard. Typically, the deformation temperature is taken as the onset temperature for slag-related issues, with deformation indicative of the ash becoming sticky and the onset of ash removal issues. Lower onset temperatures suggest increased slagging propensity along with potentially increased fouling propensity. The alkali index (AI), bed agglomeration index (BAI) and base to acid ratio (R) are numerical indices based on the ash chemistry. These slagging and fouling indices predict the likelihood of slagging and fouling during combustion, with the equations and key values given in Table 1.
2.3.4. Volatile Component Analysis
Volatile component analysis was carried out using pyrolysis-GCMS (py-GCMS) (CDS analytical, USA; Shimadzu, Japan) using a 60 m 0.25 mm RTX-1701 capillary column (Restek, UK). All the samples were analysed in duplicate at a pyrolysis temperature of 550 °C using a heating rate of 20 °C ms−1, with the pyroprobe configured in trap mode. The samples generated at 250 °C at different residence times were analysed by sequential pyrolysis at temperatures of 250 °C, 400 °C and 600 °C, corresponding to the observed changes in the first derivative weight loss profiles obtained by the TGA proximate and oxidation programs.
3. Results
3.1. Influence of Residence Time on the Bio-Coal Organic Chemistry
The yields, energy density and proximate and ultimate analysis of the bio-coals produced at different residence times are presented in Table 2. The results show for both temperatures that increasing the residence time increases the carbon density, reduces the oxygen density and increases the energy density of the resulting bio-coal, with the highest energy density being observed for HTC 250 + 24 h. The results presented in Table 2 show that the bio-coal produced at 200 °C for 24 h has similar properties to the bio-coal produced at 250 °C for a 0-h residence time. The Van Krevelen diagram shown in Figure 1 plots the moisture corrected H/C and O/C atomic ratios and indicates that a more ‘coal like’ material is obtained after 24 h at 200 °C than after 0 h at 250 °C. This result is consistent with the calculated ‘severity factor’ given in Equation (1).
It is important to recognise that while the energy density increases, the mass yields decrease, predominantly due to the removal of oxygen from within the bio-coal. The results presented in Figure 1 suggest that dehydration is the predominant mechanism for oxygen and hydrogen removal with increasing residence time. The decreasing yield of bio-coal affects the overall energy yield, which is defined as the resulting bio-coal energy multiplied by the mass yield. The results in Table 2 show that for the lower residence times of 0 and 1 h, the energy yields are around 68% and 60% for the 200 °C and 250 °C treatments, respectively. As the residence time increases between 1 and 4 h, the energy yield increases from 68% to around 70% at 200 °C and 60% to 67% at 250 °C, after which it remains relatively constant with increasing residence time for both temperatures. Therefore, for the HTC treatment at 250 °C, there is a larger increase in energy yield associated with increasing the residence time from 0 to 4 h (cf., 60–67%). For the treatment at 200 °C, the overall energy yield is slightly higher, but there is only a small increase in the energy yield observed by increasing residence time from 0 to 4 h (cf., 68–70%).
Increasing the residence time also increases the fixed carbon content of the fuel, as shown in Table 1. The results indicate that the fixed carbon content increases at a higher rate than the mass loss of bio-coal for all the conditions with the exception of HTC at 200 °C at lower residence times of 0 and 1 h (HTC 200 + 0 h and HTC 200 + 1 h). For HTC at 200 °C, the increasing fixed carbon content of the bio-coal indicates increasing condensation and repolymerisation of oligomers and monomers derived from the hydrolysis of hemicellulose and cellulose. These are readily degraded at temperatures of 180 °C and 200 °C, respectively [33]. The lignin content of the bio-coals is closely linked with the amount of fixed carbon in the raw biomass [34] and is likely to remain largely unaltered at 200 °C. As lignin is a cross-linked phenolic polymer, its degradation is expected to occur at temperatures in the range from 230 °C to 260 °C depending on the residence time [11,12,13]. Consequently the lignin fraction in the bio-coals produced at 200 °C is likely to remain relatively intact with possibly only limited removal of the hydroxy, methoxy and alkoxy functional groups associated with its benzene units [35]. Accordingly, based on the literature, the fixed carbon within the low residence time HTC 200 + 0 h bio-coal is likely to be derived predominantly from lignin. With increasing residence time, water insoluble humic substances, often referred to as humins, are formed from the degradation and repolymerisation of cellulose and will make up a greater proportion of the fixed carbon [36]. These humins, once aromatised, produce similar phenolic pyrolysis fragments to those produced from the thermal degradation of lignin [35]. Pyrolysis GCMS of the bio-coals is shown for the 200 °C bio-coals in Figure 2. The results indicate that with increasing residence time, there are increasing concentrations of methyl furans (peaks 1 and 2) generated, which is consistent with humin formation via aldol addition or condensation of hydroxymethylfurfural (5-HMF) and furfural-like compounds [37] prior to further aromatisation [38]. Increasing the residence times also results in increasing concentrations of methyl and ethyl phenols (peaks 5, 21, 23, 25, 26 and 30), which indicate an increase in aromatic structures within the bio-coal. Interestingly, all 200 °C bio-coals contain levoglucosan (peak 38), a pyrolysis product of starch and cellulose [39], indicating that the cellulose has not fully degraded at 200 °C, even after 24 h.
For conversion at 250 °C at different residence times, the py-GCMS results are given in Figure 3. These results indicate a change in chemistry, with the loss of the large levoglucosan peak (peak 38) seen in all the HTC 200 °C, the HTC 250 + 0 h bio-coal and unprocessed feedstock (see Figure 2 and Figure 3). The results imply that the cellulose is predominantly degraded after 1 h at 250 °C (HTC 250 + 1 h) although the presence of small amounts of levoglucosan in HTC 250 + 24 h suggests that even after 24 h processing a small amount of recalcitrant cellulose may still be present. The presence of a large levoglucasan peak in HTC 250 + 0 h implies that while cellulose degrades at and above 200 °C [33], shorter residence times still impose kinetic limitations, preventing its full removal.
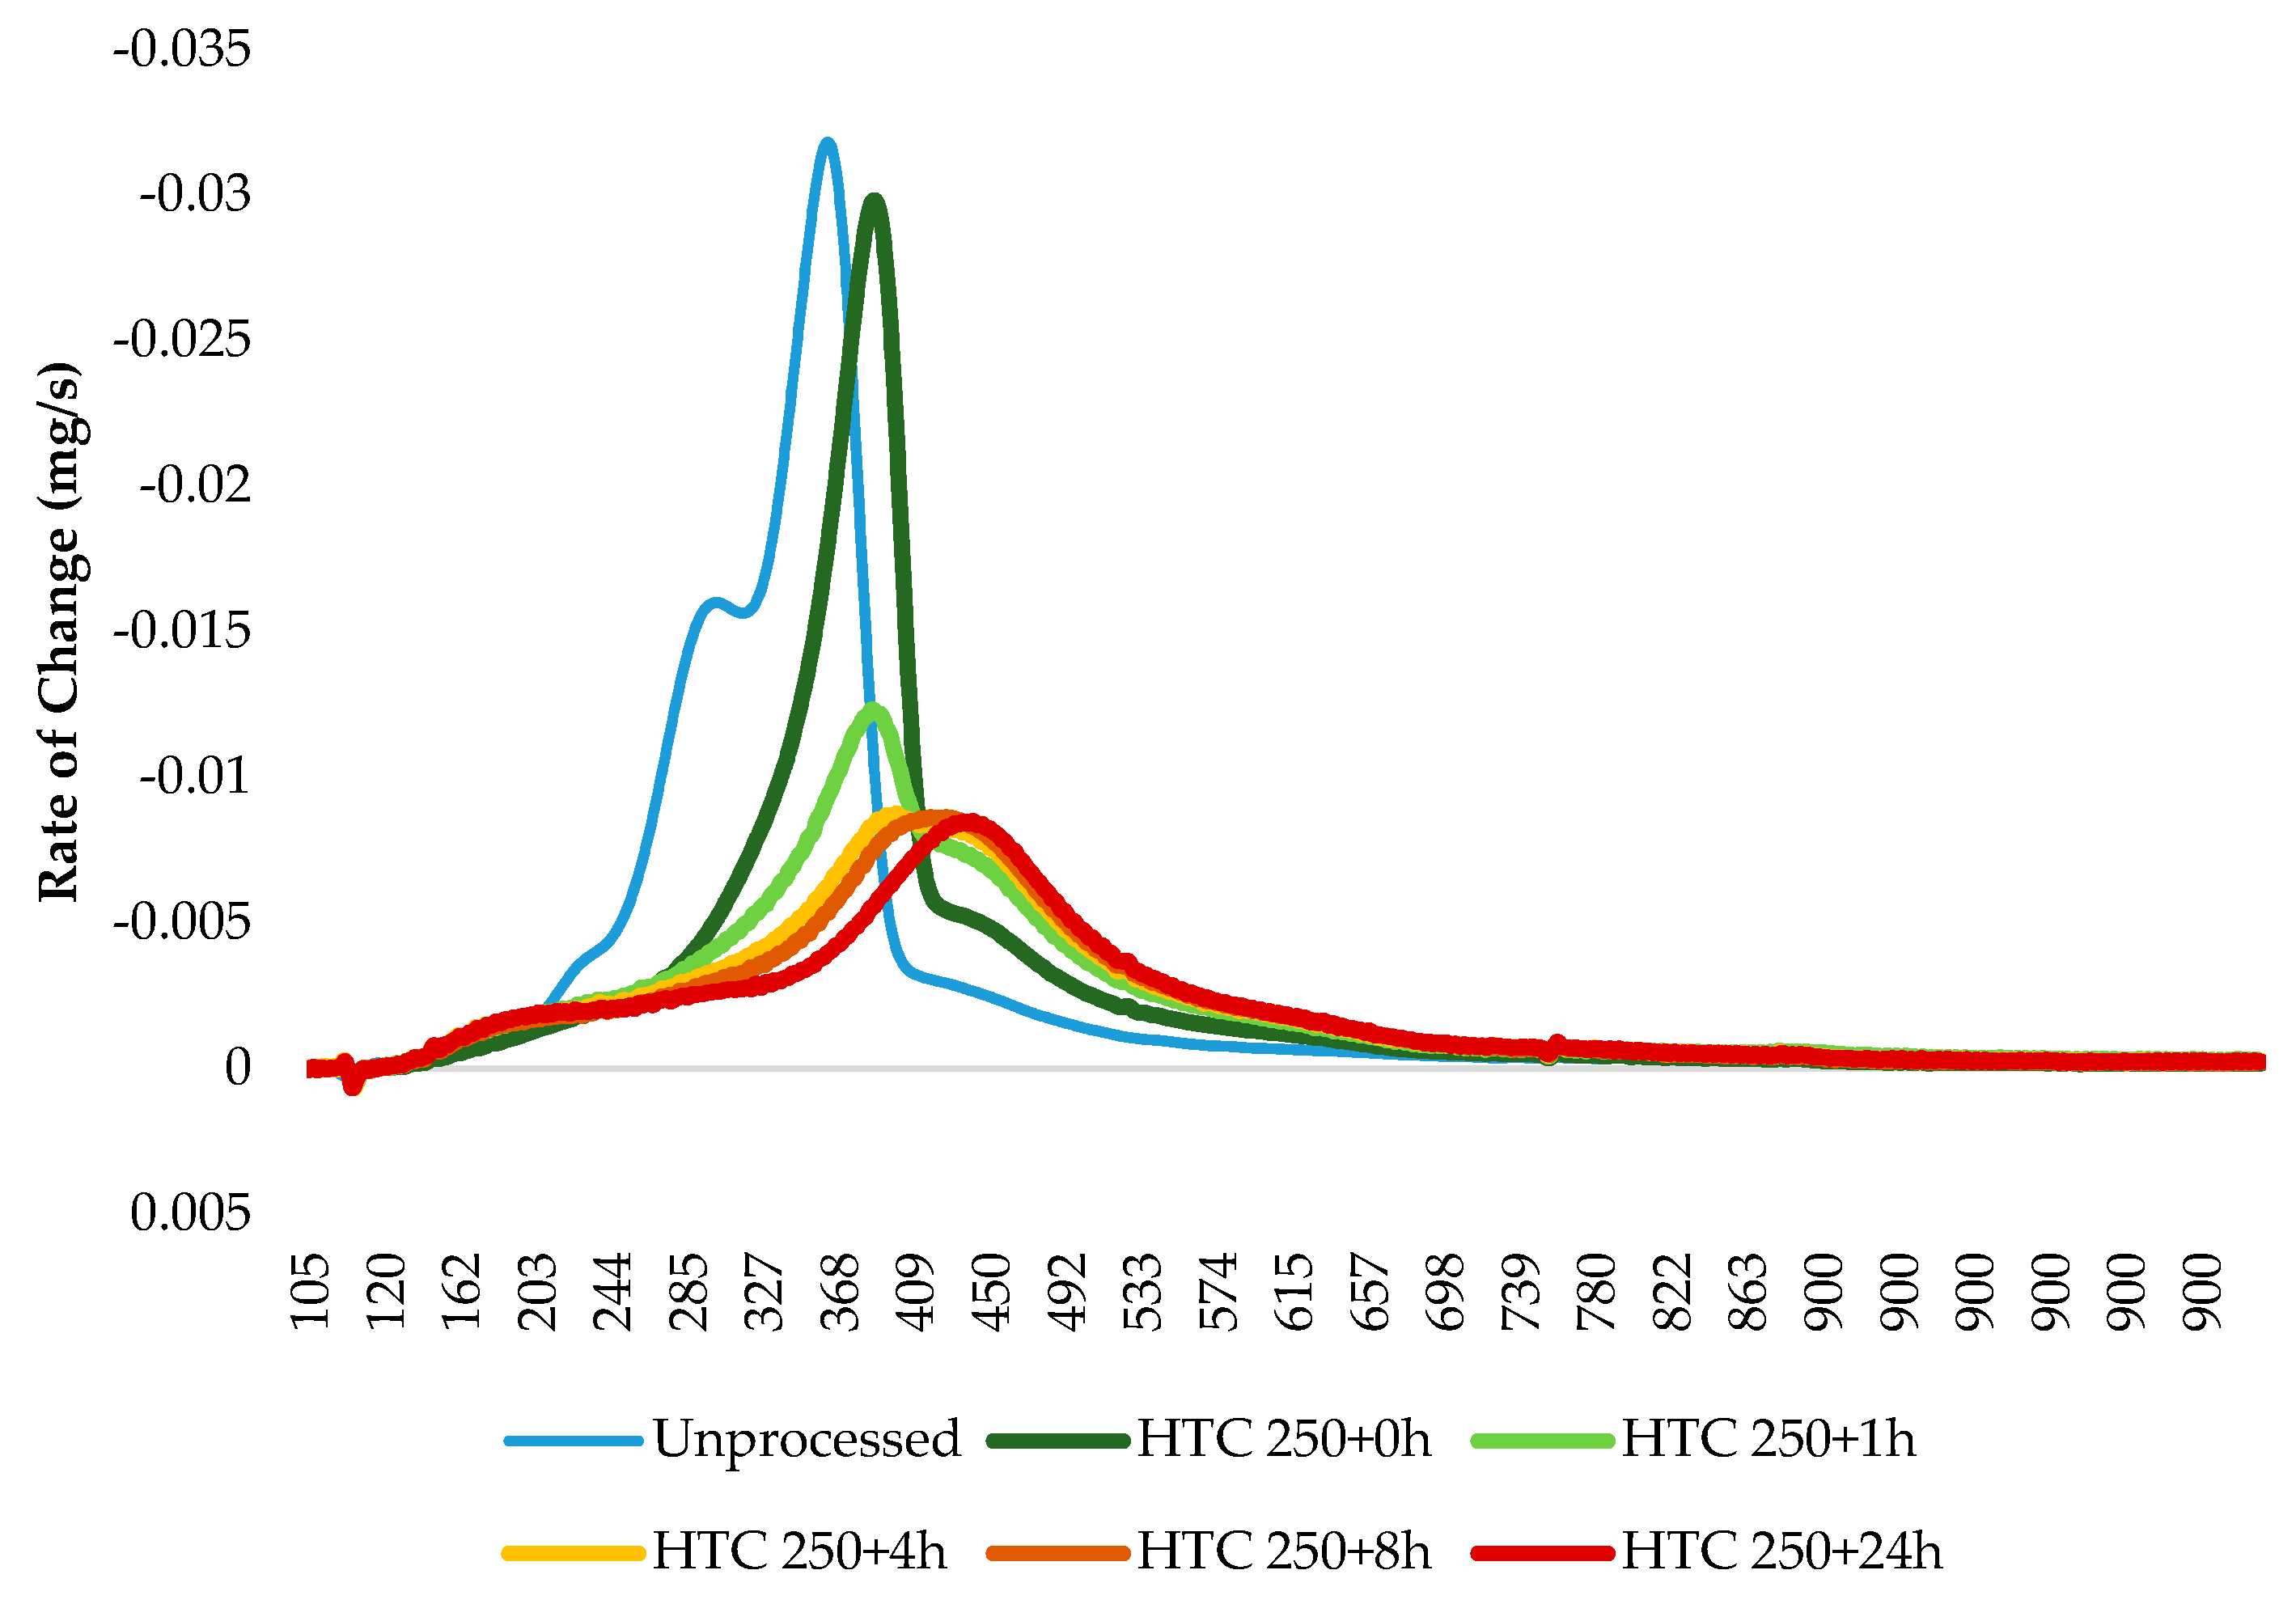
Figure 4 presents the first derivative thermogravimetric (DTG) curve from the pyrolysis of the 250 °C-treated bio-coals generated at different residence times. To better understand the devolatilisation/pyrolysis behaviour, the samples were analysed by multistage sequential pyrolysis using py-GCMS. The sequential pyrolysis results are shown in Figure 5, Figure 6 and Figure 7 for the compounds evolved at 250 °C, 400 °C and 600 °C, respectively. Figure 5 indicates that the compounds desorbed at 250 °C from the raw Miscanthus are significantly different from those from the bio-coals generated at 250 °C. The peaks identified for the bio-coals include methyl-cyclopenten-1-one (peak 6), benzofuran (peak 12) and a series of phenols and methyl-phenols (peaks 13 to 18), while the raw Miscanthus produces methylfurfural (5 methyl-2-furancarboxaldehyde) (peak 11) and ethylguaiacol (4-ethyl-2-methoxy phenol) (peak 19). The phenolic compounds desorbed from the bio-coals are often associated with the thermal decomposition of lignin; however, such compounds are not seen in the py-GCMS chromatograms from the raw Miscanthus until between 400 and 600 °C (see Figure 7). This would suggest that these phenolic fragments originate from hydrolysed lignin, liberated by the hydrothermal process. Alternatively, they could be derived from aromatised and repolymerised material generated in the hydrothermal process, such as humin products from aldol addition or condensation of 5-HMF and furfural [37]. With increasing residence time, the phenolic compounds also appear to change, with the more functionalised phenols, such as methyl-propyl phenol (peak 21) and vanillin (phenolic aldehyde) (peak 24) present after shorter residence times reducing, with a corresponding increase in phenol (peak 13), methyl phenol (peak 14), cresol (peak 17) and ethyl phenol (peak 18).
Figure 6 shows the volatile organic fragments evolved by py-GCMS between 250 °C and 400 °C for the raw biomass and the HTC bio-coals generated at 250 °C at different residence times. While there are some common compounds in all of the chromatograms, for example phenol (peak 16), 2-methoxy phenol (peak 17), 2,3-dihydro benzofuran (peak 21), 4 hydroxy-3-acetophenone (peak 22) and 2,6 dimethyl phenol (peak 24); generally, the raw Miscanthus has a different fragment profile to the bio-coal. HTC 250 + 0 h displays some common peaks with the raw Miscanthus (acetic acid (peak a), isobutylacetic acid (peak d), 2-methoxybutenol (peak e), pyrolidethylamine (peak f), propanediol (peak g), furfural (peak h), furanmethanol (peak i), cyclopentanone (peak 11) and levolglucosan (peak o)), as well as the phenolic and furfural peaks associated with 250 °C bio-coals with longer residence times. The desorption of compounds common with raw Miscanthus and HTC 250 + 0 h but not present in 250 °C bio-coals with longer residence times, would suggest that the HTC 250 + 0 h bio-coal is only partially carbonised and is still undergoing hydrolysis. The presences of cyclopentanone (peak 11) in HTC 250 + 1 h and absence in the bio-coals with longer residence times indicates that the bio-coal is still undergoing aromatisation after one hour. With increasing residence time, the results show a reduction in methyl furan and dimethyl furans present in HTC 250 + 0 h and HTC 250 + 1 h and an increase in aromatisation forming methyl and ethyl phenols (peaks 5, 21, 23, 25, 26 and 30). These furanic compounds are likely dehydrated fragments derived from recalcitrant cellulose still undergoing hydrolysis after an hour residence time. The reduction in furanic compounds and increase in phenols with increasing residence time suggest they are becoming aromatised to the methyl and ethyl phenols, through aldol addition or condensation, keto-enol tautomerism and intermolecular dehydration [37,38] and not replaced due to depletion of cellulose.
The presence of large levoglucasan peaks in the py-GCMS chromatogram at 400 °C and 600 °C shown in Figure 6 and Figure 7 indicate the presence of cellulose within the raw Miscanthus and HTC 250 + 0 h. This analysis would suggest that the larger devolatilisation peaks on the DTG curves, for the raw Miscanthus and HTC 250 + 0 h (shown in Figure 4) will predominantly be due to the decomposition of cellulose for HTC 250 + 0 h and hemicellulose and cellulose in the case of the raw Miscanthus. Table 3 suggests that the alkali metals reduce after HTC and further reduce with increasing residence time. The difference in the peak devolatilisation temperatures between the raw Miscanthus and HTC 250 + 0 h in Figure 4 is most likely due the reduction alkali metal content influencing the temperature the cellulose decomposes [40,41,42,43,44]. The 400 °C and 600 °C py-GCMS data (Figure 6 and Figure 7) indicate that beyond HTC 250 + 4 h, the devolatilisation characteristics of the 4, 8 and 24 h 250°C bio-coals are all similar. The similar decomposition products for the 4, 8 and 24 h 250 °C bio-coals would suggest the increasing peak devolatilisation temperature with increasing residence time, shown in Figure 4, maybe as a result of the removal of calcium, which can also catalyse devolatilisation, albeit to a lesser extent than the alkali metals, as opposed to changes in organic content [44,45,46]. It should be noted that the py-GCMS will not detect gaseous compounds in trap mode, and so, carbon monoxide, carbon dioxide and other gaseous products devolatilised will not be detected but will account for at least part of the weight loss.
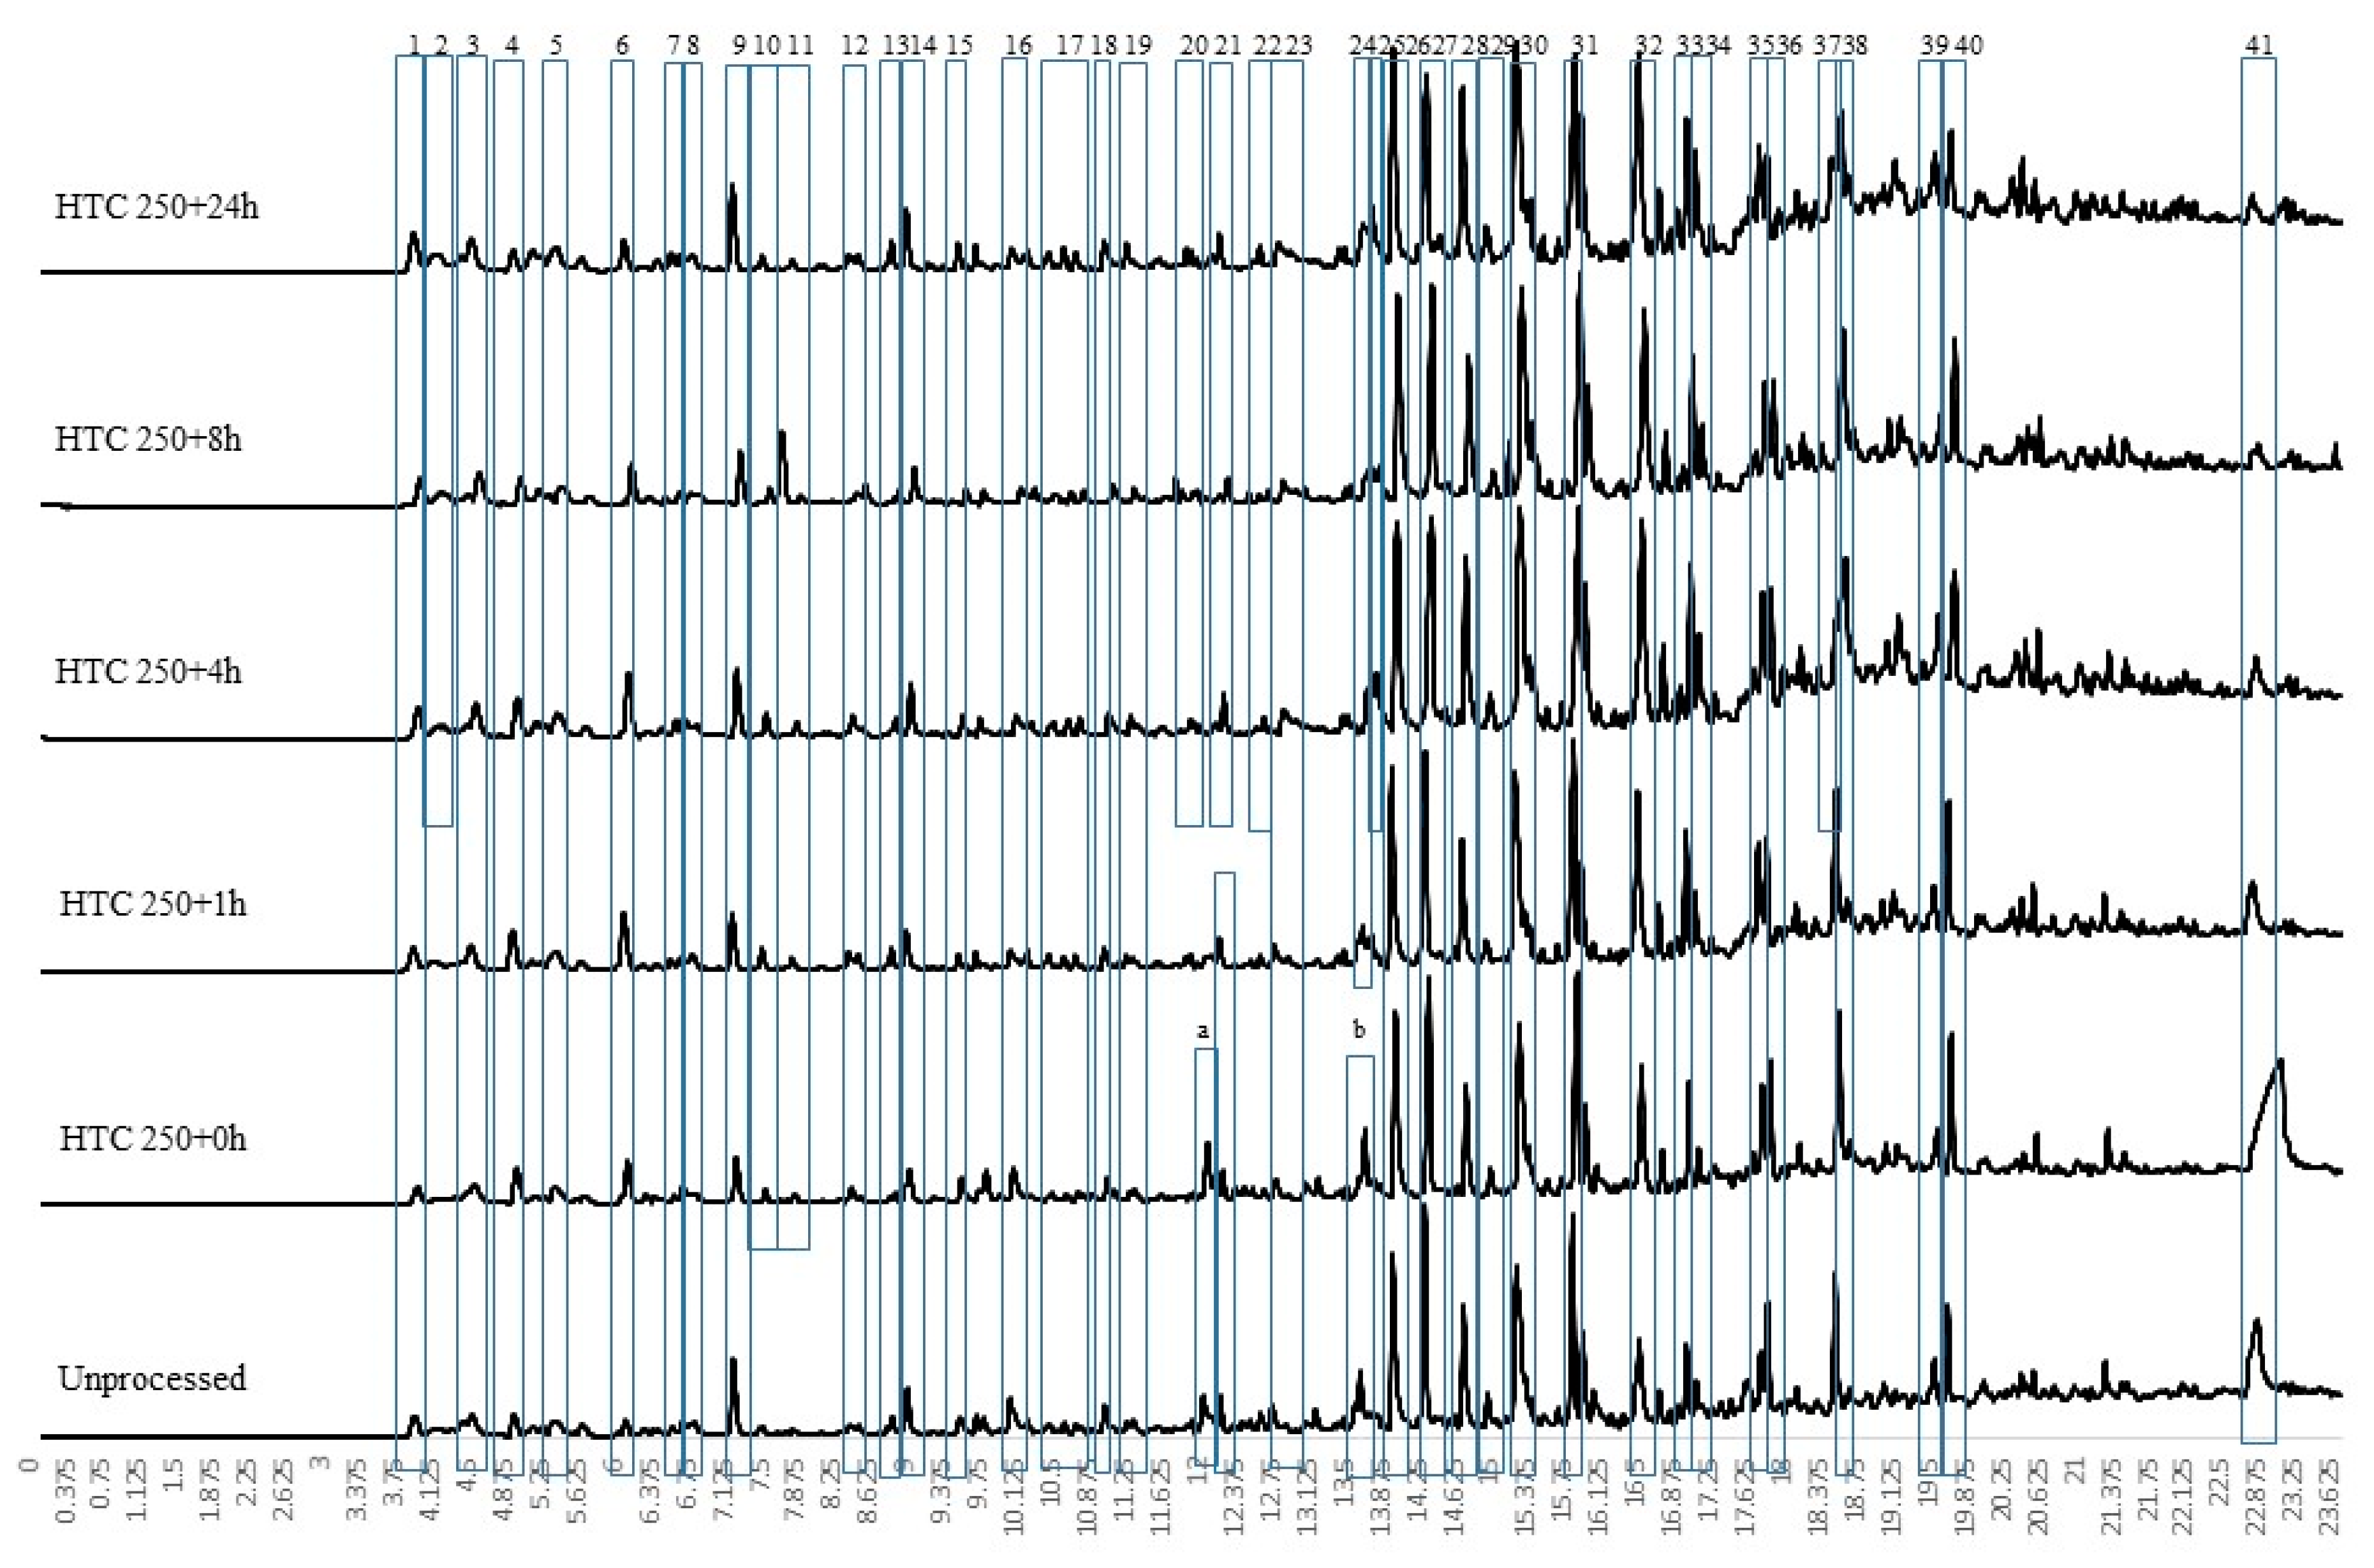
The py-GC-MS fragment profiles for compounds released between 400 °C and 600 °C is shown in Figure 7. At this temperature, the fragments from the lignin fraction within the raw Miscanthus start to devolatilise, and the six profiles look distinctly similar, with largely phenolic compounds evolved. Slight differences include a large levoglucasan peak (peak 41) particularly prevalent for HTC 250 + 0 h and the presence of cyclopentenone (peak a) and hydroxy-3-methyl cyclopenten-1-one (peak b), being present in both raw Miscanthus and HTC 250 + 0 h. For the longer-residence-time samples, there are increasing quantities of benzo-alcohols and phenolic acids formed. While this analysis has been undertaken on Miscanthus, the chemical pathways and fragmentation profiles should be applicable to most lignocellulosic-based biomasses.
3.2. Influence of Residence Time on the Bio-Coal Inorganic Chemistry
The levels of metals, phosphorus, chlorine and sulphur in the resulting bio-coals are presented in Table 3. HTC treatments at 200 °C result in an initial decrease in inorganics shown by a reduction in the ash content (Table 2), reducing from 3.1 wt.% (db) for the raw Miscanthus to 2.4 wt.% (db) for HTC 200 + 0 h. At longer residence times, the ash content does not significantly alter; however, the composition of the ash does change, as shown in Table 3. The main change is an increase in the level of silicon, while the level of potassium continues to decrease with increasing residence time.
Phosphorus is initially extracted into the process water at HTC 200 + 0 h but then re-incorporates into the bio-coal with increasing residence time. The same trend is observed with temperature, with lower temperatures favouring the extraction of phosphorus and higher temperature HTC resulting in the re-incorporation of phosphorus back into the bio-coal. A similar trend is observed for sulphur, while the inverse is shown for chlorine, which is further reduced with increasing residence time. Sulphur is known to be incorporated into hydrothermal carbon via Maillard reactions (albeit not by the Schiff base route) [47,48], which suggest that these Maillard reactions are favoured by longer residence times. Chlorine, on the other hand, exists within biomass in the form of water soluble ionic salts (NaCl, KCl, CaCl2, MgCl2 and ionic chlorides (Cl-)) [49,50], and its removal appears to be dependent on the removal or retention of metal cations.
There is only limited removal of calcium, which is enhanced within the bio-coal. It is possible that the chloride is retained within the bio-coal through association with this calcium. It is also possible that the sodium, potassium and magnesium are forming salts with the organic acids, such as acetate and formate, derived from the decomposition of monosaccharides [51,52]. In this instance, the residual chlorine is being retained through the formation of weak chlorine–hydrogen interactions on the char surface [53]. These results support the findings in Smith et al. [2] and indicate that the reduction in chlorine content during HTC is less than that observed in comparable washing experiments, which reduce chlorine by between 85 % and 100 % removal [54,55,56]. This suggests that there may be other underlying roles for chlorine during HTC. Chlorine is rarely analysed in the HTC literature, as accurate quantification using methods such as XRF are not possible. It is subsequently assumed by authors that during HTC, most of the chlorine within the biomass is extracted, as is demonstrated in washing experiments, but these results would suggest that this is only partly true. Given the importance of chlorine in terms of deposit formation (fouling), corrosion and dioxin formation [57,58], further work on this is required.
Ash stability is an important consideration during combustion as the ash composition influences the tendency of the fuel to slag, foul, corrode and bring about bed agglomeration in fluidised bed reactors [57]. Slagging is a phenomenon brought about though the melting of ash when it is exposed to radiant heat, such as flames in a furnace. Most furnaces are designed to remove ash as a powdery residue, so an ash with a high ash melting temperature is desirable. Low-temperature melting ashes can undergo softening or melting within the furnace, and this can make ash removal difficult, bringing about operational issues. Bed agglomeration is similar to slagging but is an issue specific to fluidised bed furnaces and comes about through high levels of potassium silicates within the ash. These potassium silicates melt and lead to the adhesion of the bed material [59]. For slagging and bed agglomeration, the temperature at which the ash melts and fuses is strongly influenced by the alkali and alkaline metals. Alkali metals act as a flux for alumina-silicate ash, lowering melting temperature, while the alkaline earth metals tend to increase melting temperatures. Fouling is brought about when potassium and sodium, often in combination with chlorine, partially evaporate and form alkali chlorides, which condense on cooler surfaces, such as heat exchangers [57].
The data in Table 3 shows that with increasing residence time, the ash becomes predominantly calcium–silicon based, which should improve ash stability. Similarly, the reincorporation of phosphorus into the char should further increase ash stability. The increased silicon content along with decreased potassium chloride content within the bio-coal should also further reduce the fuels’ fouling propensity, as silicon oxide can also react with potassium chloride forming potassium silicates (see Equation (3)) and abating the formation of gaseous potassium chloride [60,61,62]. This will be further aided by the phosphorus and calcium (see Equation (4)–(6)) [63,64,65]. Consequently the changes in inorganic and heteroatom chemistry with increasing residence time should reduce the fouling and the corrosion propensity of the fuel, increasing efficiency and reducing maintenance [58,66].
SiO2 + 2 KCl + H2O → K2O·SiO2 + 2 HCl(g)
KCl(g) + 2 CaHPO4·2H2O → 2 CaKPO4 + 2 H2O + HCl(g)
4 KCl(g) + 2 CaHPO4·2H2O + O2 → 2 K2PO4 + 5 H2O + 2 CaCl2
K2PO4 + 2CaO → 2 CaKPO4 + O2.
Figure 8 shows the ash transition temperatures of the 200 °C bio-coals with increasing residence time. The results show that as the residence times increase, the deformation temperature increases up to HTC 200 + 8 h. For HTC 200 + 24 h, the ash deformation temperature (and hemisphere and flow temperature) decrease compared with HTC 200 + 8 h. The reduction in the deformation temperature for HTC 200 + 24 h is due to an increase in silicon concentration within the fuel, while the concentration of calcium reduces, altering the silicon-to-calcium ratio and the associated higher ash melting temperatures. The removal of the calcium at longer residence times could be due to the presence of increased formic and acetic acids produced under increasing residence time, with the acid leaching the calcium. This result suggests that with increasing residence time at 200 °C, there is an improvement in fuel slagging propensity, up to a point, after which the organic acids generated within the process lead to the increased removal of calcium and the enhanced stability brought about by the calcium. It is also possible that after 8 hours, the continued dehydration of the bio-coal (see Figure 1) is reducing the oxygen functional groups on which calcium can bind, reducing the residence of calcium within the fuel. It is unclear whether it is these organic acids generated that are catalysing the dehydration of the fuel.
The results for the 250 °C treatments yield similar results to the 200 °C treatments, with the inorganic chemistry similar for HTC 200 + 0 h and HTC 250 + 0 h. Silicon is generally seen to increase with increasing residence time; whereas calcium content remains reasonably constant in the 200 °C treatments, calcium content decreases with increasing residence time in the 250 °C treatments. Organic acid content within the process water increases with time, so it is likely that the increased calcium leaching with time is, in part, due to the extraction by the organic acids created as part of the process [49,50]. The pH of the process water remains relatively stable for all runs, with a pH of 3.3 for 250 °C. This implies that the process water chemistry is buffered against the increasing organic acids. Phosphorus steadily increases with increasing residence time, although there is not the initial decrease seen in the 200 °C treatments, which imply that phosphorus is released on heating and is then reincorporated quickly into the bio-coal. Sulphur remains reasonably stable in the 250 °C treatments, with a slight decrease with increasing residence time. The sulphur content is, however, higher in the 250 °C treatments than in HTC 200 + 24 h, which implies that sulphur released on heating appears to be re-incorporated at 250 °C. Similarly, for the 250 °C treatments, the chlorine content steadily declines with increasing residence time, with the chlorine content slightly higher than the 200 °C treatments. While the chlorine content is slightly higher in the corresponding 250 °C treatments, the fuels’ higher energy content will offset the higher chlorine content.
Figure 8 shows the ash transition temperatures for the 250 °C bio-coals, and similar to the 200 °C bio-coals, the ash fusion temperature increases with increasing residence time. A deformation temperature of 1330 °C was achieved after a 1-h residence at 250 °C, with the equivalent deformation temperature not achieved until between 4 and 8 h at 200 °C. The results suggest that the severity factor given in Equation 1, developed by Overend and Chornet [30] to characterise the hydrolytic depolymerisation of wood, may also apply to the fuels’ slagging propensity. While the 250 °C treatment produces a moderate improvement in deformation temperature and thus the safe combustion temperature, it should be noted that there is a more substantial increase in the hemisphere and flow temperature. This is evident in HTC 250 + 4 h and the subsequent treatments, for the samples reach the furnace limit, at 1570 °C, without melting. This would be beneficial for combustion, as it would mean that even if the ash is exposed to heat exceeding the deformation temperature, ash melting would still be unlikely, further reducing the fuel slagging potential.
Table 3 presents the slagging and fouling indices, which are based on the total alkali content of the fuel [56]. The results given in Table 3 show that the alkali index (AI) predicts probable slagging and fouling. The AI indicate that all the hydrothermally treated fuels should be safe to combust without the issues associated with slagging and fouling. The results indicate that for both the 200 °C and 250 °C HTC bio-coals, the slagging and fouling propensity progressively reduces with increasing residence time. The base to acid ratio (R) indicates a similar trend. The bed agglomeration index (BAI) indicates a progressive improvement in the fuels’ agglomeration behaviour with increasing residence time, but due to the low iron content within the initial biomass and resulting bio-coals, bed agglomeration appears likely. Iron normally accumulates within the bio-coal, and so, bed agglomeration could be overcome through the blending and addition of a higher iron feedstock within the HTC process, increasing the overall iron content within the bio-coal. The Miscanthus used in this study has a relatively high silicon content when compared with other biomass types (see Smith et al. [15]). Silicon will influence the fuels’ propensity to slag, foul and corrode, as discussed, so some caution is needed when applying these findings to low-silicon-containing biomasses, such as willow (Salix spp.). Nonetheless, the observed behaviour of the alkali metals, phosphorus, chlorine, sulphur and calcium should be applicable to most lignocellulosic biomasses.
In the HTC method used, there was no additional washing of the bio-coals, and the bio-coal was filtered from the process water and allowed to dry prior to analysis. The process waters will typically contain metals and chlorides extracted as part of the process, and there is potential for residual metal and chlorine containing process water to be left within the char. Additional leaching of these alkali metals and chlorine maybe possible with the incorporation of an additional washing step post carbonisation. This should further enhance the removal of alkali metals and chlorine and further reduce fouling propensity, if required. The impact of an additional water treatment on the energy content and energy yields has not been assessed in this instance, nor have water treatment options such as anaerobic digestion been considered.
3.3. Influence of Residence Time on the Bio-Coal Combustion Behaviour
HTC bio-coal is considered to be a coal substitute fuel for combustion in coal-powered power plants, as it can enable the utilisation of the existing infrastructure. When doing this, it is important to achieve flame stability to sustain the flame and ensure safe boiler operation [67]. Lignocellulosic biomass contains a higher volatile fraction and a much smaller char fraction than those seen in coals; moreover, 70% of the heat output is associated with volatile combustion for biomass, and 36% of the total heat output is associated with volatile combustion for coal [68]. When burning higher rank coals in pulverised fuel applications, coals undergo heterogeneous ignition, whereby devolatilisation, ignition and combustion of the volatiles and char oxidation/combustion occur almost simultaneously [69]. Biomass, along with high volatile coals, undergoes a process called homogeneous ignition, which begins with the ignition of the volatiles and oxygen close to the particle surface. Once ignited, a gas flame surrounds the particle and prevents oxygen from reaching and igniting the char [69]. This brings about two-phase combustion and may allow the particles to become entrained in the gas stream and move higher in the furnace while burning, bringing about flame instability [70]. In this instance, the rate of burning (flame velocity) may not match the rate of the material feed, and if these are not matched, the flame will either blow off or flash back [67]. Thermo-gravimetric analysis (TGA) is one method originally developed by Babcock and Wilcox for comparing and evaluating fuels and calculating the first derivative thermogravimetric (DTG) curve and enabling easy comparison between burning characteristics [70]. When undertaking this test, five characteristic temperatures are typically interpreted. The first is the volatile initiation temperature where the weight loss begins; the second temperature is peak volatile burn; the third temperature is the char initiation temperature due to the onset of char combustion; the fourth peak is peak char burn temperature; and the fifth is the burn-out temperature where the weight is constant, indicating the completion of combustion [70].
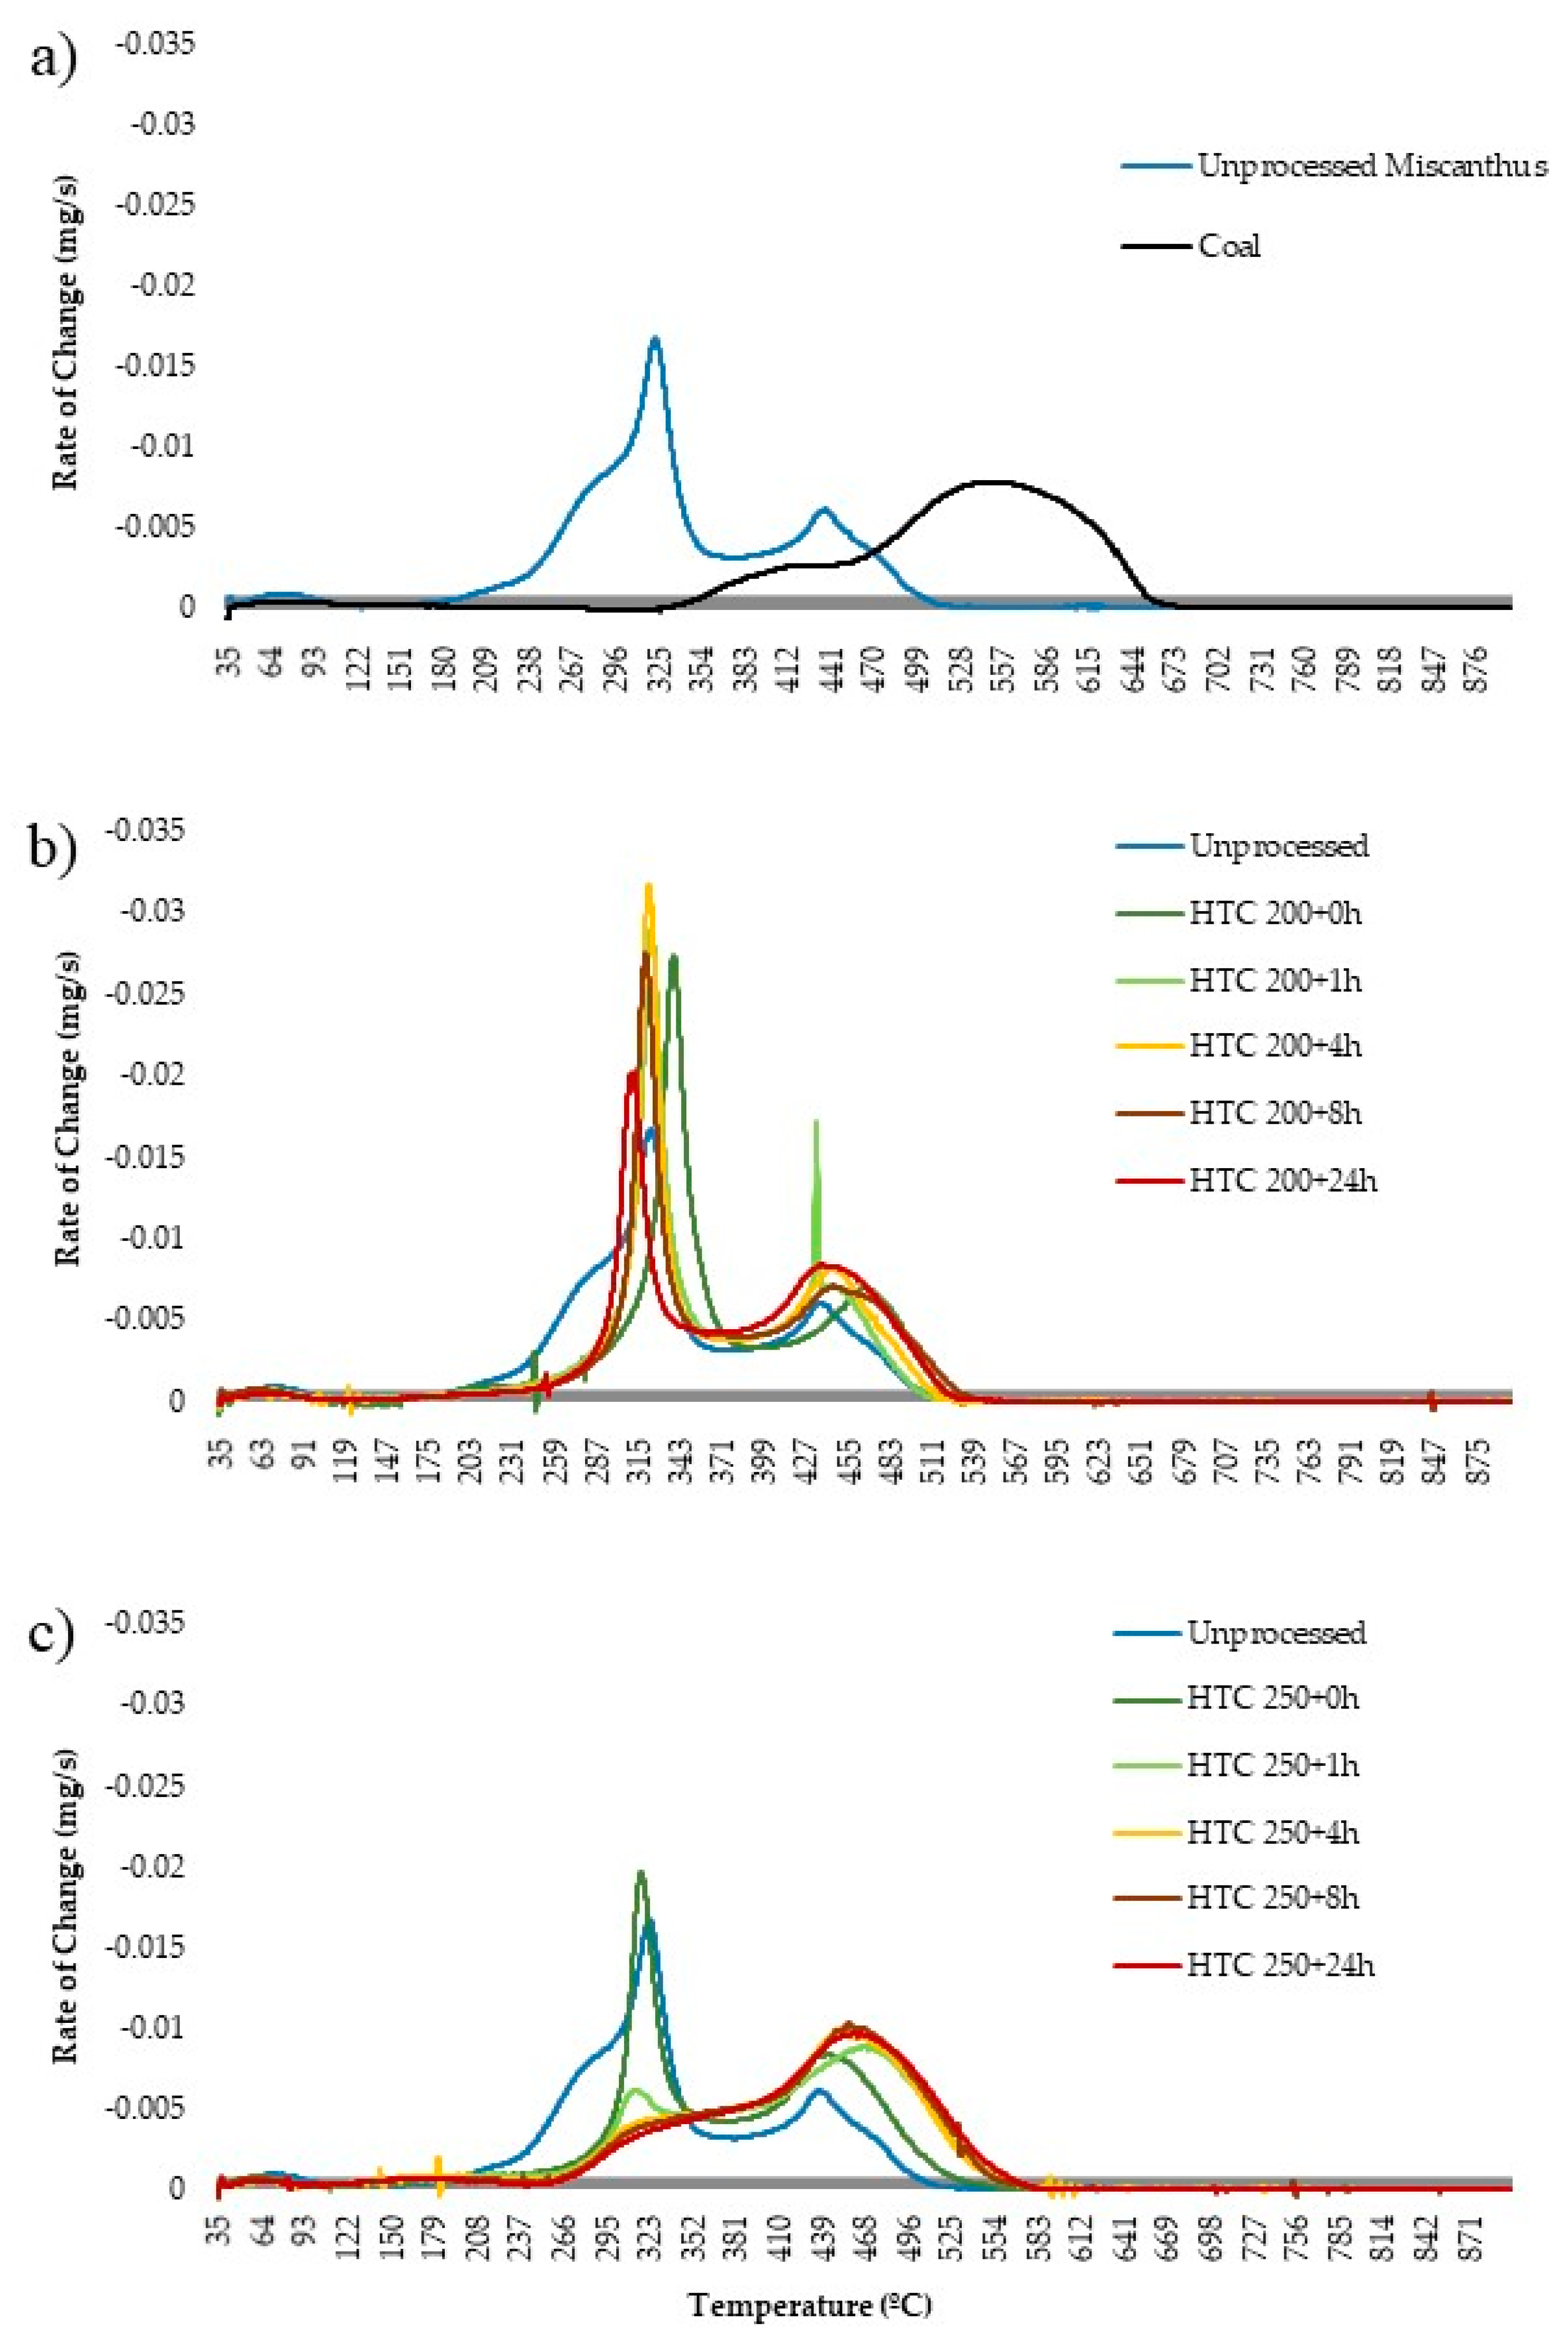
Figure 9b shows the burning profile for the 200 °C hydrothermally treated fuels, while Figure 9a shows the burning profile of the raw Miscanthus and a reference coal for comparison. The first main change is the change in the onset of the volatile initiation temperature, which is delayed from 190 °C to 270 °C, due the removal of hemicellulose in all the treatments [71]. The removal of the alkali metals, which are known to catalyse the decomposition of biomass [40], most likely delay the volatile burn peak temperature and the fixed carbon peak temperature for HTC 200 + 0 h. As residence time increases, the volatile burn peak temperature appears to advance, despite no notable increase in alkali and alkaline earth metals within the fuel, which are known to have significant catalytic influence on devolatilisation [46]. Consequently, the increase in reactivity could be due to changes in the nature of the volatile matter as opposed to a shift in catalytic behaviour. Figure 2 shows that with increasing residence time, there is a change in the composition of the volatile organics evolved, and similarly, Figure 5 shows that hydrothermal treatment results in the formation and volatilisation of 2-methyl phenol, 4-methyl phenol, 4-ethyl phenol, 2,6 dimethyl phenol and vanillin, amongst others, at a pyrolysis below 250 °C.
It should be noted that in the case of the 200 °C bio-coals and raw Miscanthus, the peak temperature is on the volatile burn as opposed to char combustion, seen in the coals and 250 °C bio-coals (excluding HTC 250 + 0 h). Increasing the residence time results in an increase in the onset of char combustion. This fits with the proximate analysis given in Table 2, which shows a decrease in volatile matter and an increase in fixed carbon with residence time. This trend continues with the 250 °C bio-coals shown in Figure 9c. In Figure 9c, the burning profile changes quickly from two distinct volatile and char burn peaks, as seen for HTC 250 + 0 h, to a ‘coal like’ single-stage combustion profile. With increasing residence time, the volatile peak becomes increasingly less distinct, and by HTC 250 + 24 h, the start of the char burn is marked more by an increase in the rate of weight loss as opposed to the commencement of a second peak.
For all the hydrothermally derived fuels, the volatile initiation temperature on the DTC curves are around 270 °C, and the char initiation temperature increases slightly from 380 °C for HTC 250 + 0 h to 390 °C for HTC 250 + 1 h to HTC 250 + 24 h. The inverse is observed for the 200 °C bio-coals. Peak temperature (char burn) also appears to increase from 390 °C for HTC 250 + 0 h to 460 °C for HTC 250 + 4 h to HTC 250 + 24 h. Burnout temperature initially advances from 530 °C observed in the 200 °C bio-coals to 580 °C, which is consistent for HTC 250 + 1 h to HTC 250 + 24 h. The reference coal burns at a higher temperature than that observed for the bio-coal, albeit with a similar burning curve to that of the longer-residence-time 250 °C bio-coal. The volatile initiation temperature is around 325 °C, with the char initiation temperature around 460 °C, a peak temperature around 550°C and a burnout temperature at 650 °C. The lower fuel characteristic temperatures of the 250 °C bio-coals can, nevertheless, be beneficial, as this will promote early ignition of the total fuel mass, especially when co-fired, leading to better and more complete combustion. This early ignition, in turn, can also be beneficial for nitrogen oxide emissions, as it will consume additional oxygen, increasing the fuel-staging effects of low-NOx burners and lowering NOx emissions [70].
It should be noted, that while increasing the severity factor for HTC appears to offer greater flame stability through a more coal-like burning profile, fuel particle size is also an equally important parameter. Flame instability can be further influenced by differences in particle size, as large particle sizes can act as heat sinks, increasing the residence time of the particle before ignition and influencing the balance of heat loss and heat release. For a stable flame in a pulverised coal burner, pulverisation of the fuel to 70% below 75 µm is typically required [67]. The ease in which fuels can be pulverised to 70% below 75 µm is described using the Hardgrove grindability index (HGI) [72]. Coals typically lie between 30 (increased resistance to pulverisation) and 100 (more easily pulverised) on the scale. In Smith et al. [2], a HGI value of 25 was demonstrated for HTC 200 + 1 h Miscanthus, while a HGI value of 150 was demonstrated for HTC 250 + 1 h Miscanthus. This result would suggest that the 200 °C samples should pulverise if burnt in a pulverised fuel plant. Similarly, the HGI will increase with reaction severity due to decomposition, removal and re-polymerisation of the fibrous cellulose that provides strength to the biomass. An HGI of 25 represents a fuel that can pulverise in a similar manner to that of a high-resistance coal. An HGI of 150 would imply that the fuel will easily pulverise, and there should be limited issues with flame stability. The lower volatile initiation temperature of the bio-coals would, to a certain extent, allow for larger particle diameter, as heat loss due to the greater heat sink brought about through the larger particle would be balanced by the earlier heat release when using an appropriate system [2]. The findings of this section should be applicable to most lignocellulosic-based biomasses.
4. Conclusions
Miscanthus was hydrothermally carbonised at 200 °C and 250 °C with varying residence times from 0 to 24 h to better understand the influence residence time has on the inorganic and combustion chemistry of bio-coal derived from lignocellulosic biomasses. Increasing residence severity brings about increased dehydration of the fuel, although temperature is the more important variable, with the HTC 200 + 24 h having similar properties to that of the HTC 250 + 0 h bio-coal. After 1 h, the 250 °C bio-coal continues to dehydrate, with evidence of repolymerisation of hydrothermally derived aromatics being observed at increased residence time. By 1 h, most of the cellulose has decomposed at 250 °C, although levoglucosan is observed in small quantities at 24 h using analytical pyrolysis.
The dehydration, repolymerisation and cellulose removal at 250 °C brings about a more ‘coal like’ combustion profile, with decreasing reactivity with increasing residence time. This should aid combustion in existing pulverised coal power plants. Alkali metals are extracted at low residence times and appear to further decrease with increasing residence time. Phosphorus and sulphur appear to undergo substantial extraction at HTC 200 + 0 h but are re-incorporated with increasing residence time. Fuel chlorine is reduced with increasing residence time. Silicon content increases within the bio-coal with increasing severity, while calcium appears to reduce within the 250 °C bio-coals after 1 h and is thought to be linked to organic acid leaching. Increasing the reaction severity brings about a decrease in fuel fouling and slagging propensity, as demonstrated by the ash fusion test and various slagging and fouling indices.
Overall, the results suggest that in order to get complete dehydration and aromatisation of a lignocellulosic biomass, operating temperatures around 250 °C are required. At 250 °C, residence times in excess of 1 h and up to 4 h are required to fully hydrolyse the feedstock and enable polymerisation and aromatisation reactions to near completion. Increasing the reaction temperature above 250 °C may reduce the required residence time, but residence at temperature may still be required to enable the polymerisation and aromatisation reactions to go to completion.
Author Contributions
Conceptualisation, A.M.S. and A.B.R.; Methodology, A.M.S.; Validation, A.M.S.; Formal Analysis, A.M.S.; Investigation, A.M.S.; Resources, A.B.R.; Data Curation, A.M.S.; Writing—Original Draft Preparation, A.M.S.; Writing—Review & Editing, A.M.S. and A.B.R.; Visualisation, A.M.S.; Supervision, A.B.R.
Funding
This research was funded by the Engineering and Physical Sciences Research Council (EPSRC) Doctoral Training Centre in Low Carbon Technologies (EP/G036608/1).
Acknowledgments
The authors would like to thank Ian Shield and Carly Whittaker from Rothamsted Research for the supply of Miscanthus and would also like to thank Simon Lloyd, Meryem Benohoud and Adrian Cunliffe from University of Leeds for their technical assistance.
Conflicts of Interest
The authors declare no conflicts of interest.
References
- Liu, Z.; Quek, A.; Kent Hoekman, S.; Balasubramanian, R. Production of solid biochar fuel from waste biomass by hydrothermal carbonization. Fuel 2013, 103, 943–949. [Google Scholar] [CrossRef]
- Smith, A.M.; Whittaker, C.; Shield, I.; Ross, A.B. The potential for production of high quality bio-coal from early harvested Miscanthus by hydrothermal carbonisation. Fuel 2018, 220, 546–557. [Google Scholar] [CrossRef]
- Joo, J.B.; Kim, Y.J.; Kim, W.; Kim, P.; Yi, J. Simple synthesis of graphitic porous carbon by hydrothermal method for use as a catalyst support in methanol electro-oxidation. Catal. Commun. 2008, 10, 267–271. [Google Scholar] [CrossRef]
- Li, L.; Wang, Y.; Xu, J.; Flora, J.R.V.; Hoque, S.; Berge, N.D. Quantifying the sensitivity of feedstock properties and process conditions on hydrochar yield, carbon content, and energy content. Bioresour. Technol. 2018, 262, 284–293. [Google Scholar] [CrossRef] [PubMed]
- Fernandez, M.E.; Ledesma, B.; Román, S.; Bonelli, P.R.; Cukierman, A.L. Development and characterization of activated hydrochars from orange peels as potential adsorbents for emerging organic contaminants. Bioresour. Technol. 2015, 183, 221–228. [Google Scholar] [CrossRef] [PubMed]
- Sun, K.; Tang, J.; Gong, Y.; Zhang, H. Characterization of potassium hydroxide (KOH) modified hydrochars from different feedstocks for enhanced removal of heavy metals from water. Environ. Sci. Pollut. Res. 2015, 22, 16640–16651. [Google Scholar] [CrossRef] [PubMed]
- Xue, Y.; Gao, B.; Yao, Y.; Inyang, M.; Zhang, M.; Zimmerman, A.R.; Ro, K.S. Hydrogen peroxide modification enhances the ability of biochar (hydrochar) produced from hydrothermal carbonization of peanut hull to remove aqueous heavy metals: Batch and column tests. Chem. Eng. J. 2012, 200–202, 673–680. [Google Scholar]
- Puccini, M.; Ceccarini, L.; Antichi, D.; Seggiani, M.; Tavarini, S.; Hernandez Latorre, M.; Vitolo, S. Hydrothermal Carbonization of Municipal Woody and Herbaceous Prunings: Hydrochar Valorisation as Soil Amendment and Growth Medium for Horticulture. Sustainability 2018, 10, 846. [Google Scholar] [CrossRef]
- Funke, A.; Ziegler, F. Hydrothermal carbonization of biomass: A summary and discussion of chemical mechanisms for process engineering. Biofuelsbioprod. Biorefining 2010, 4, 160–177. [Google Scholar] [CrossRef]
- Hashaikeh, R.; Fang, Z.; Butler, I.S.; Hawari, J.; Kozinski, J.A. Hydrothermal dissolution of willow in hot compressed water as a model for biomass conversion. Fuel 2007, 86, 1614–1622. [Google Scholar] [CrossRef]
- Pastor-Villegas, J.; Pastor-Valle, J.F.; Rodríguez, J.M.M.; García, M.G. Study of commercial wood charcoals for the preparation of carbon adsorbents. J. Anal. Appl. Pyrolysis 2006, 76, 103–108. [Google Scholar] [CrossRef]
- Libra, J.A.; Ro, K.S.; Kammann, C.; Funke, A.; Berge, N.D.; Neubauer, Y.; Titirici, M.M.; Fühner, C.; Bens, O.; Kern, J.; et al. Hydrothermal carbonization of biomass residuals: A comparative review of the chemistry, processes and applications of wet and dry pyrolysis. Biofuels 2011, 2, 71–106. [Google Scholar] [CrossRef]
- Reza, M.T.; Lynam, J.G.; Uddin, M.H.; Coronella, C.J. Hydrothermal carbonization: Fate of inorganics. Biomass Bioenergy 2013, 49, 86–94. [Google Scholar] [CrossRef]
- Smith, A.M.; Ross, A.B. Production of bio-coal, bio-methane and fertilizer from seaweed via hydrothermal carbonisation. Algal Res. 2016, 16, 1–11. [Google Scholar] [CrossRef]
- Smith, A.M.; Singh, S.; Ross, A.B. Fate of inorganic material during hydrothermal carbonisation of biomass: Influence of feedstock on combustion behaviour of hydrochar. Fuel 2016, 169, 135–145. [Google Scholar] [CrossRef]
- Volpe, M.; Goldfarb, J.L.; Fiori, L. Hydrothermal carbonization of Opuntia ficus-indica cladodes: Role of process parameters on hydrochar properties. Bioresour. Technol. 2018, 247, 310–318. [Google Scholar] [CrossRef]
- Mäkelä, M.; Kwong, C.W.; Broström, M.; Yoshikawa, K. Hydrothermal treatment of grape marc for solid fuel applications. Energy Convers. Manag. 2017, 145, 371–377. [Google Scholar] [CrossRef]
- Lane, D.J.; Truong, E.; Larizza, F.; Chiew, P.; de Nys, R.; van Eyk, P.J. Effect of Hydrothermal Carbonization on the Combustion and Gasification Behavior of Agricultural Residues and Macroalgae: Devolatilization Characteristics and Char Reactivity. Energy Fuels 2017. [Google Scholar] [CrossRef]
- PetroviĿ, J.; PerišiĿ, N.; MaksimoviĿ, J.D.; MaksimoviĿ, V.; KragoviĿ, M.; StojanoviĿ, M.; LauševiĿ, M.; MihajloviĿ, M. Hydrothermal conversion of grape pomace: Detailed characterization of obtained hydrochar and liquid phase. J. Anal. Appl. Pyrolysis 2016, 118, 267–277. [Google Scholar] [CrossRef]
- Bach, Q.-V.; Tran, K.-Q.; Skreiberg, Ø. Accelerating wet torrefaction rate and ash removal by carbon dioxide addition. Fuel Process. Technol. 2015, 140, 297–303. [Google Scholar] [CrossRef]
- Broch, A.; Jena, U.; Hoekman, S.; Langford, J. Analysis of Solid and Aqueous Phase Products from Hydrothermal Carbonization of Whole and Lipid-Extracted Algae. Energies 2014, 7, 62–79. [Google Scholar] [CrossRef]
- Benavente, V.; Calabuig, E.; Fullana, A. Upgrading of moist agro-industrial wastes by hydrothermal carbonization. J. Anal. Appl. Pyrolysis 2015, 113, 89–98. [Google Scholar] [CrossRef]
- Hoekman, S.K.; Broch, A.; Felix, L.; Farthing, W. Hydrothermal carbonization (HTC) of loblolly pine using a continuous, reactive twin-screw extruder. Energy Convers. Manag. 2017, 134, 247–259. [Google Scholar] [CrossRef]
- Hoekman, S.K.; Broch, A.; Robbins, C. Hydrothermal carbonization (HTC) of lignocellulosic biomass. Energy Fuels 2011, 25, 1802–1810. [Google Scholar] [CrossRef]
- Mosteiro-Romero, M.; Vogel, F.; Wokaun, A. Liquefaction of wood in hot compressed water: Part 1—Experimental results. Chem. Eng. Sci. 2014, 109, 111–122. [Google Scholar] [CrossRef]
- Kruse, A.; Koch, F.; Stelzl, K.; Wüst, D.; Zeller, M. Fate of Nitrogen during Hydrothermal Carbonization. Energy Fuels 2016, 30, 8037–8042. [Google Scholar] [CrossRef]
- Garrote, G.; Domínguez, H.; Parajó, J.C. Hydrothermal processing of lignocellulosic materials. Holz Als Roh- Und Werkst. 1999, 57, 191–202. [Google Scholar]
- Roos, A.A.; Persson, T.; Krawczyk, H.; Zacchi, G.; Stålbrand, H. Extraction of water-soluble hemicelluloses from barley husks. Bioresour. Technol. 2009, 100, 763–769. [Google Scholar] [CrossRef] [PubMed]
- Kim, D.S.; Myint, A.A.; Lee, H.W.; Yoon, J.; Lee, Y.-W. Evaluation of hot compressed water pretreatment and enzymatic saccharification of tulip tree sawdust using severity factors. Bioresour. Technol. 2013, 144, 460–466. [Google Scholar] [CrossRef]
- Overend, R.P.; Chornet, E. Fractionation of lignocellulosics by steam-aqueous pretreatments. Philos. Trans. R. Soc. London. Ser. A Math. Phys. Sci. 1987, 321, 523–536. [Google Scholar] [CrossRef]
- Jenkins, B.; Baxter, L.; Miles, T. Combustion properties of biomass. Fuel Process. Technol. 1998, 54, 17–46. [Google Scholar] [CrossRef]
- Bapat, D.; Kulkarni, S.; Bhandarkar, V. Design and Operating Experience on Fluidized Bed Boiler Burning Biomass Fuels with High Alkali Ash; American Society of Mechanical Engineers: New York, NY, USA, 1997. [Google Scholar]
- Peterson, A.A.; Vogel, F.; Lachance, R.P.; Fröling, M.; Antal, M.J., Jr.; Tester, J.W. Thermochemical biofuel production in hydrothermal media: A review of sub-and supercritical water technologies. Energy Environ. Sci. 2008, 1, 32–65. [Google Scholar] [CrossRef]
- Demirbaş, A. Relationships between lignin contents and fixed carbon contents of biomass samples. Energy Convers. Manag. 2003, 44, 1481–1486. [Google Scholar] [CrossRef]
- Haenel, M.W. Recent progress in coal structure research. Fuel 1992, 71, 1211–1223. [Google Scholar] [CrossRef]
- Kei-ichi, S.; Yoshihisa, I.; Hitoshi, I. Catalytic Activity of Lanthanide(III) Ions for the Dehydration of Hexose to 5-Hydroxymethyl-2-furaldehyde in Water. Bull. Chem. Soc. Jpn. 2001, 74, 1145–1150. [Google Scholar]
- Patil, S.K.R.; Lund, C.R.F. Formation and Growth of Humins via Aldol Addition and Condensation during Acid-Catalyzed Conversion of 5-Hydroxymethylfurfural. Energy Fuels 2011, 25, 4745–4755. [Google Scholar] [CrossRef]
- Sevilla, M.; Fuertes, A.B. The production of carbon materials by hydrothermal carbonization of cellulose. Carbon 2009, 47, 2281–2289. [Google Scholar] [CrossRef]
- Lakshmanan, C.M.; Hoelscher, H.E. Production of Levoglucosan by Pyrolysis of Carbohydrates. Pyrolysis in Hot Inert Gas Stream. Prod. Rd 1970, 9, 57–59. [Google Scholar]
- Saddawi, A.; Jones, J.M.; Williams, A. Influence of alkali metals on the kinetics of the thermal decomposition of biomass. Fuel Process. Technol. 2012, 104, 189–197. [Google Scholar] [CrossRef]
- Huang, H.Y.; Yang, R.T. Catalyzed Carbon–NO Reaction Studied by Scanning Tunneling Microscopy and ab Initio Molecular Orbital Calculations. J. Catal. 1999, 185, 286–296. [Google Scholar] [CrossRef]
- Backreedy, R.I.; Jones, J.M.; Pourkashanian, M.; Williams, A. Modeling the reaction of oxygen with coal and biomass chars. Proc. Combust. Inst. 2002, 29, 415–421. [Google Scholar] [CrossRef]
- Jones, J.M.; Darvell, L.I.; Pourkashanian, M.; Williams, A. The role of metals in biomass char combustion. In Proceedings of the European Combustion Meeting, Louvain-la-Neuve, Belgium, 3–6 April 2005. [Google Scholar]
- Backreedy, R.I.; Jones, J.M.; Pourkashanian, M.; Williams, A. Burn-out of pulverised coal and biomass chars. Fuel 2003, 82, 2097–2105. [Google Scholar] [CrossRef]
- Kannan, M.P.; Richards, G.N. Gasification of biomass chars in carbon dioxide: Dependence of gasification rate on the indigenous metal content. Fuel 1990, 69, 747–753. [Google Scholar] [CrossRef]
- Stojanowska, G.; Jones, J. Influence of added calcium on thermal decomposition of biomass, lignite and their blends. Arch. Combust. 2006, 26, 91. [Google Scholar]
- Titirici, M.-M. Sustainable Carbon Materials from Hydrothermal Processes; John Wiley & Sons: Hoboken, NJ, USA, 2013. [Google Scholar]
- Wohlgemuth, S.-A.; Vilela, F.; Titirici, M.-M.; Antonietti, M. A one-pot hydrothermal synthesis of tunable dual heteroatom-doped carbon microspheres. Green Chem. 2012, 14, 741–749. [Google Scholar] [CrossRef]
- Marschner, H.; Marschner, P. Marschner’s Mineral Nutrition of Higher Plants; Academic Press: Cambridge, MA, USA, 2012. [Google Scholar]
- Korbee, R.; Kiel, J.; Zevenhoven, M.; Skrifvars, B.; Jensen, P.; Frandsen, F. Investigation of biomass inorganic matter by advanced fuel analysis and conversion experiments. In Power Production in the 21st Century: Impacts of Fuel Quality and Operations; United Engineering Foundation Advanced Combustion Engineering Research Center: Snowbird, UT, USA, 2001. [Google Scholar]
- Antal, M.J.; Mok, W.S.L.; Richards, G.N. Mechanism of formation of 5-(hydroxymethyl)-2-furaldehyde from d-fructose and sucrose. Carbohydr. Res. 1990, 199, 91–109. [Google Scholar] [CrossRef]
- Jin, F.; Zhou, Z.; Moriya, T.; Kishida, H.; Higashijima, H.; Enomoto, H. Controlling Hydrothermal Reaction Pathways To Improve Acetic Acid Production from Carbohydrate Biomass. Environ. Sci. Technol. 2005, 39, 1893–1902. [Google Scholar] [CrossRef] [PubMed]
- Domazetis, G.; James, B.D. Molecular models of brown coal containing inorganic species. Org. Geochem. 2006, 37, 244–259. [Google Scholar] [CrossRef]
- Deng, L.; Zhang, T.; Che, D. Effect of water washing on fuel properties, pyrolysis and combustion characteristics, and ash fusibility of biomass. Fuel Process. Technol. 2013, 106, 712–720. [Google Scholar] [CrossRef]
- Saddawi, A.; Jones, J.M.; Williams, A.; Le Coeur, C. Commodity fuels from biomass through pretreatment and torrefaction: Effects of mineral content on torrefied fuel characteristics and quality. Energy Fuels 2012, 26, 6466–6474. [Google Scholar] [CrossRef]
- Miles, T.R.; Miles, T., Jr.; Baxter, L.; Bryers, R.; Jenkins, B.; Oden, L. Alkali Deposits Found in Biomass Power Plants: A Preliminary Investigation of Their Extent and Nature. Volume 1; National Renewable Energy Lab.: Golden, CO, USA; Miles (Thomas R.): Portland, OR, USA; Sandia National Labs.: Livermore, CA, USA; Foster Wheeler Development Corp.: Livingston, NJ, USA; California Univ.: Davis, CA, USA; Bureau of Mines: Albany, OR, USA; Albany Research Center: Albany, OR, USA, 1995. [Google Scholar]
- Koppejan, J.; Van Loo, S. The Handbook of Biomass Combustion and Co-Firing; Routledge: London, UK, 2012. [Google Scholar]
- Riedl, R.; Dahl, J.; Obernberger, I.; Narodoslawsky, M. Corrosion in fire tube boilers of biomass combustion plants. In Proceedings of the China International Corrosion Control Conference, Beijing, China, 1999. [Google Scholar]
- Grimm, A.; Skoglund, N.; Boström, D.; Ohman, M. Bed agglomeration characteristics in fluidized quartz bed combustion of phosphorus-rich biomass fuels. Energy Fuels 2011, 25, 937–947. [Google Scholar] [CrossRef]
- Uberoi, M.; Punjak, W.A.; Shadman, F. The kinetics and mechanism of alkali removal from flue gases by solid sorbents. Prog. Energy Combust. Sci. 1990, 16, 205–211. [Google Scholar] [CrossRef]
- Kyi, S.; Chadwick, B.L. Screening of potential mineral additives for use as fouling preventatives in Victorian brown coal combustion. Fuel 1999, 78, 845–855. [Google Scholar] [CrossRef]
- Llorente, M.J.F.; Arocas, P.D.; Nebot, L.G.; García, J.E.C. The effect of the addition of chemical materials on the sintering of biomass ash. Fuel 2008, 87, 2651–2658. [Google Scholar] [CrossRef]
- Steenari, B.-M.; Lundberg, A.; Pettersson, H.; Wilewska-Bien, M.; Andersson, D. Investigation of Ash Sintering during Combustion of Agricultural Residues and the Effect of Additives. Energy Fuels 2009, 23, 5655–5662. [Google Scholar] [CrossRef]
- Gilbe, C.; Öhman, M.; Lindström, E.; Boström, D.; Backman, R.; Samuelsson, R.; Burvall, J. Slagging Characteristics during Residential Combustion of Biomass Pellets. Energy Fuels 2008, 22, 3536–3543. [Google Scholar] [CrossRef]
- Lindström, E.; Sandström, M.; Boström, D.; Öhman, M. Slagging Characteristics during Combustion of Cereal Grains Rich in Phosphorus. Energy Fuels 2007, 21, 710–717. [Google Scholar] [CrossRef]
- Wang, L.; Hustad, J.E.; Skreiberg, Ø.; Skjevrak, G.; Grønli, M. A Critical Review on Additives to Reduce Ash Related Operation Problems in Biomass Combustion Applications. Energy Procedia 2012, 20, 20–29. [Google Scholar] [CrossRef]
- Su, S.; Pohl, J.H.; Holcombe, D.; Hart, J.A. Techniques to determine ignition, flame stability and burnout of blended coals in p.f. power station boilers. Prog. Energy Combust. Sci. 2001, 27, 75–98. [Google Scholar] [CrossRef]
- Williams, A.; Jones, J.; Ma, L.; Pourkashanian, M. Pollutants from the combustion of solid biomass fuels. Prog. Energy Combust. Sci. 2012, 38, 113–137. [Google Scholar] [CrossRef]
- Yarin, L.P.; Hetsroni, G.; Mosyak, A. Combustion of Two-Phase Reactive Media; Springer Science & Business Media: Berlin, Germany, 2013. [Google Scholar]
- Tillman, D.A.; Duong, D.N.B.; Harding, N.S. Chapter 4—Blending Coal with Biomass: Cofiring Biomass with Coal. In Solid Fuel Blending; Tillman, D.A., Duong, D.N.B., Harding, N.S., Eds.; Butterworth-Heinemann: Boston, MA, USA, 2012; pp. 125–200. [Google Scholar] [CrossRef]
- Yang, H.; Yan, R.; Chen, H.; Lee, D.H.; Zheng, C. Characteristics of hemicellulose, cellulose and lignin pyrolysis. Fuel 2007, 86, 1781–1788. [Google Scholar] [CrossRef]
- Ndibe, C.; Vonk, G.; Yuan, S.; Maier, J.; Scheffknecht, G. Characterizing the Grinding Behavior of Pre-Treated Biomass Fuels for Coal Pulverizer Application. In Proceedings of the 24th European Biomass Conference and Exhibition, Amsterdam, The Netherlands, 6–9 June 2016; pp. 457–465. [Google Scholar] [CrossRef]
Figure 1.
Van Krevelen diagram of the resulting bio-coals from the hydrothermal carbonisation (HTC) of Miscanthus at (i) 200 °C and (ii) 250 °C for increasing residence time (0, 1, 4, 8 and 24 h residence times).
Figure 1.
Van Krevelen diagram of the resulting bio-coals from the hydrothermal carbonisation (HTC) of Miscanthus at (i) 200 °C and (ii) 250 °C for increasing residence time (0, 1, 4, 8 and 24 h residence times).

Figure 2.
Pyrolysis GCMS spectra of volatile organics evolved at 550 °C from bio-coals treated at 200 °C with varying residence times. ((1) 2-methyl furan; (2) 2,5 dimethyl furan; (3) propanediol; (4) toluene; (5) 3-methyl phenol; (6) pentanoic acid; (7) cyclopentanone; (8) butanediol; (9) dimethylpyrazole; (10) 2-furanmethanol; (11) ethylhexaldehyde; (12) 1,3 dimethylcyclopenten-3-one; (13) cyclopentadione; (14) 2-furan carboxadehyde; (15) 1methyl-1-cyclopenten-3-one; (16) furanone; (17) amino-3-pyridinol; (18) 3-methyl cyclopentanedione; (19) phenol; (20) 2-methoxyphenol; (21) 2-methyl phenol; (22) 2-cyclopenten-1-one: (23) 4-methyl phenol; (24) creasol; (25) 4-ethyl phenol; (26) 4-ethyl-2methoxy phenol; (27) dihydrobenzofuran; (28) 4-hydro-3-methyl acetophenone; (29) eugenol; (30) 2,6, dimethoxyphenol; (31) isoeugenol; (32) triethoxybenzene; (33) vanillin; (34) trimethoxytoluene; (35) dimethoxy acetophenone; (36) trimethylacealdehyde; (37) methoxy eugenol; (38) levoglucasan).
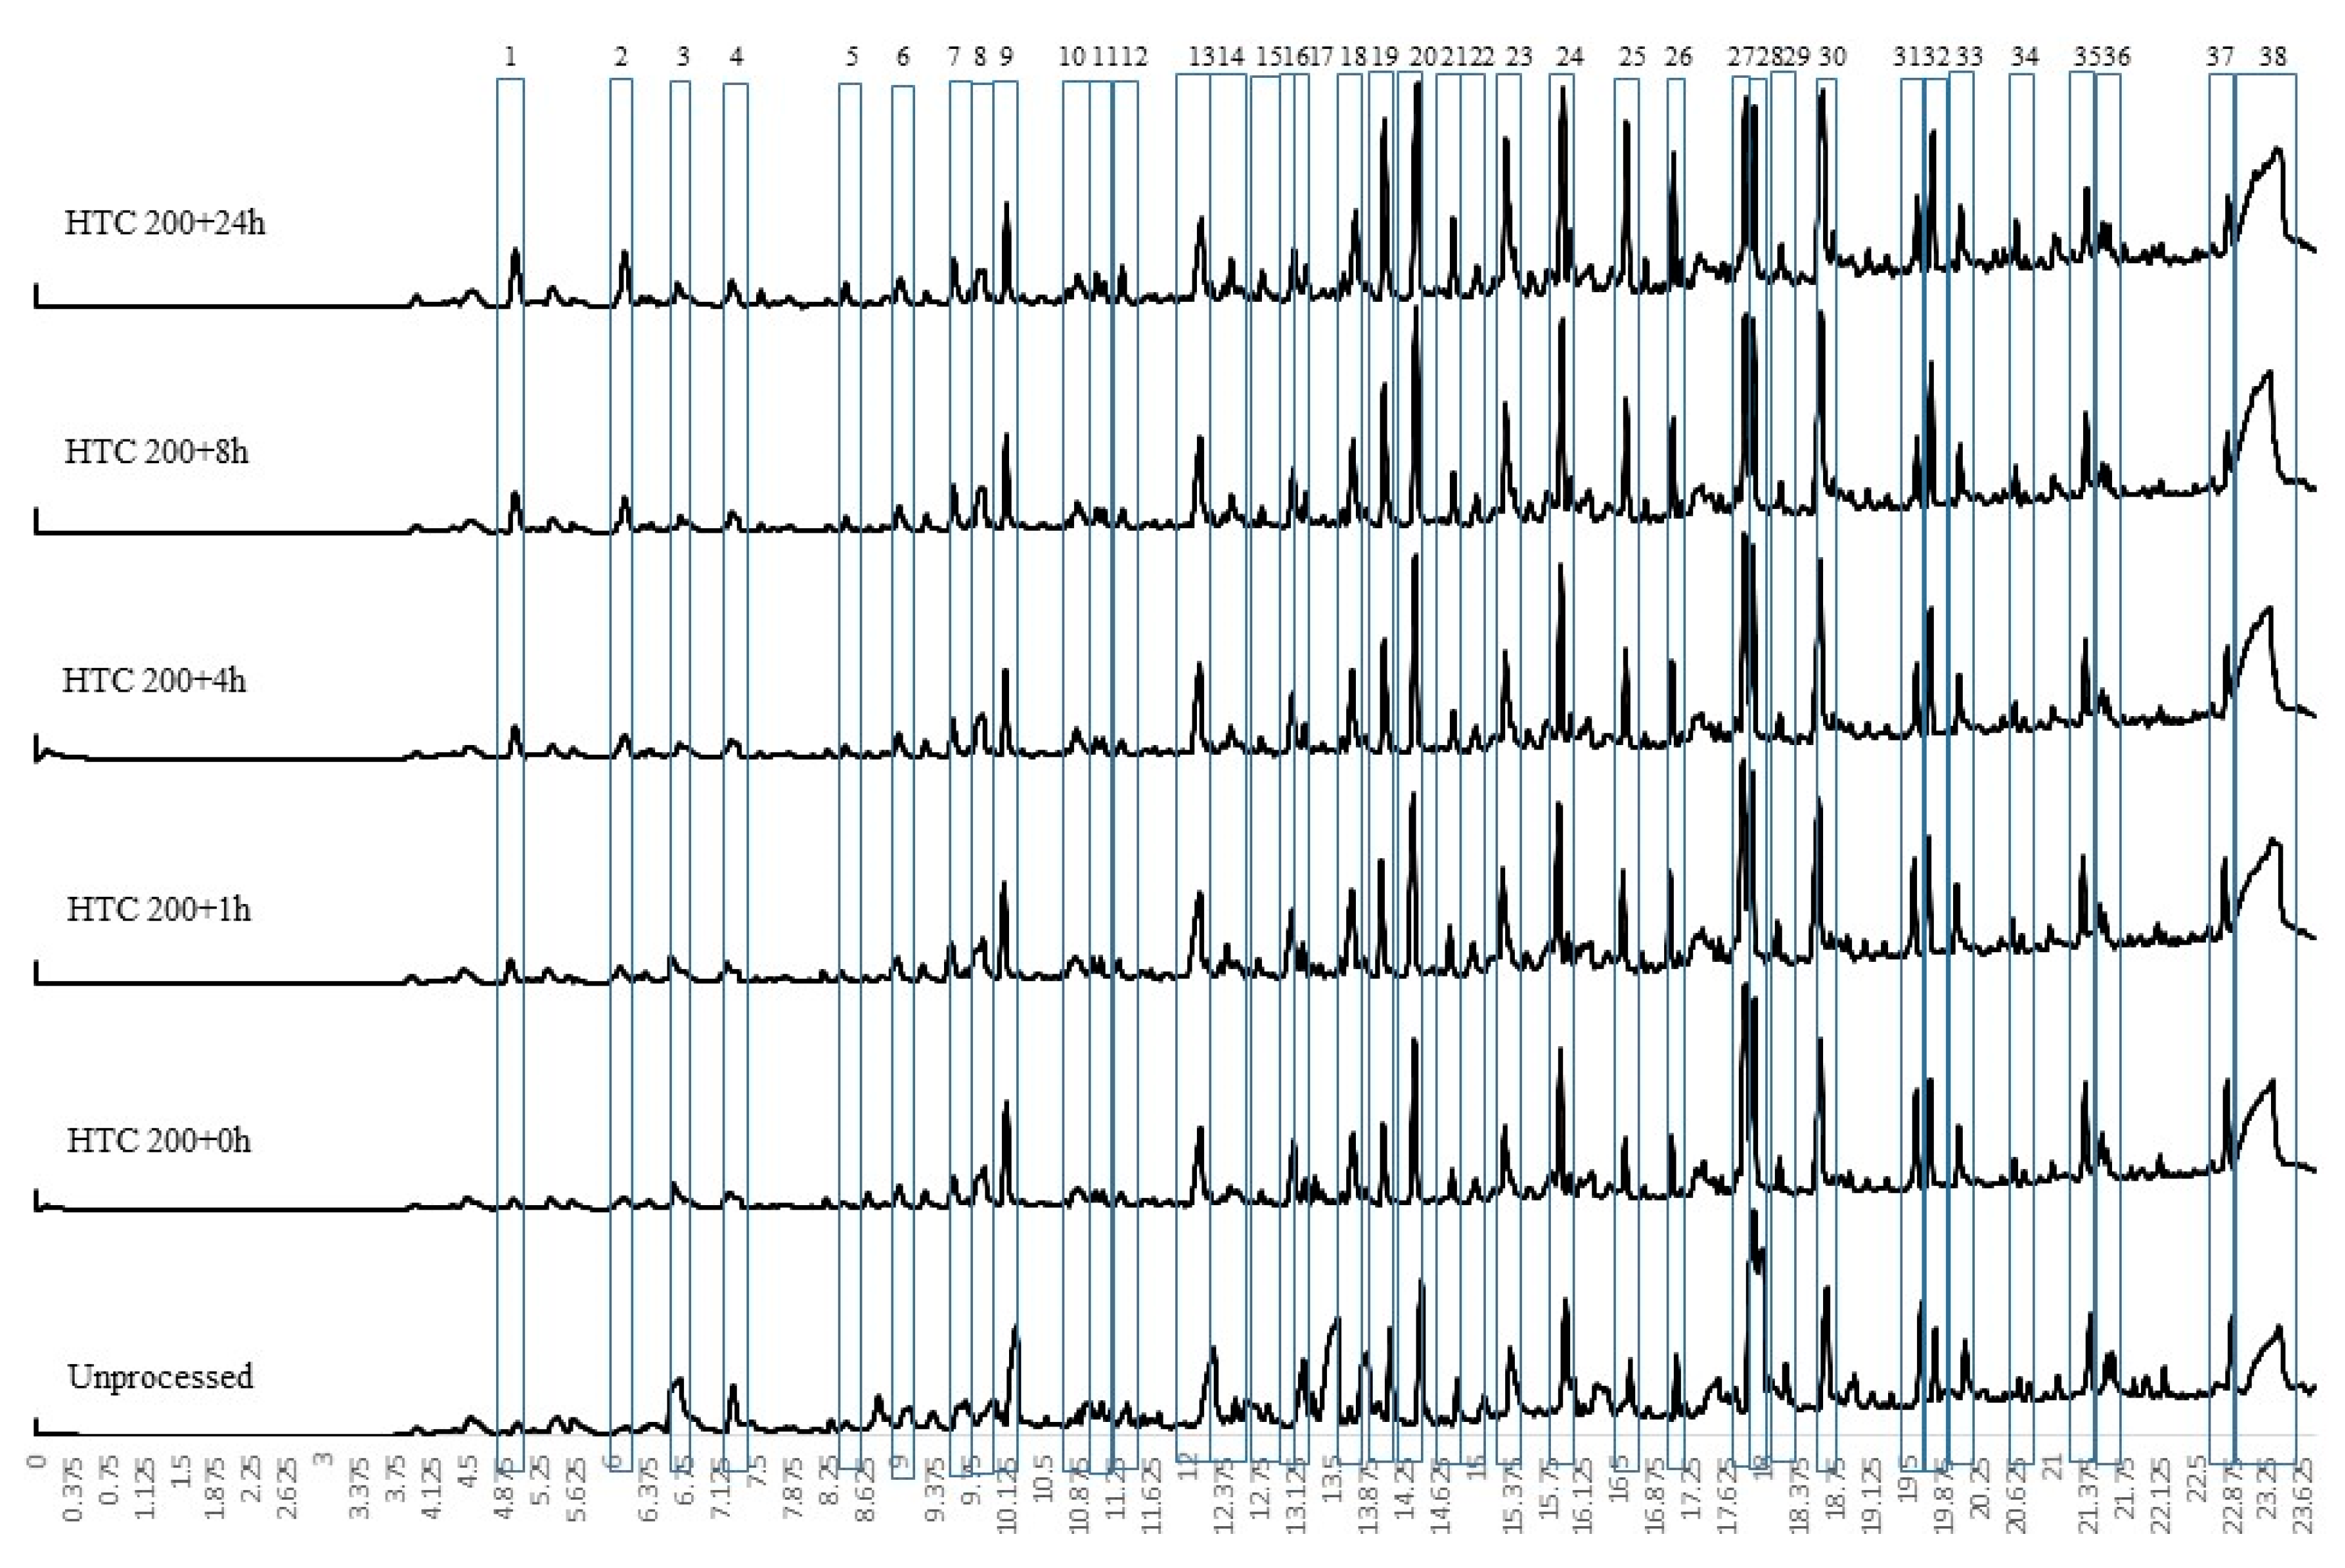
Figure 3.
Pyrolysis GCMS spectra of volatile organics evolved at 550 °C from bio-coals treated at 250 °C with varying residence times. ((1) 2-methyl furan; (2) 2,5 dimethyl furan; (3) propanediol; (4) toluene; (5) 3-methyl phenol; (6) pentanoic acid; (7) cyclopentanone; (8) butanediol; (9) dimethylpyrazole; (10) 2-furanmethanol; (11) ethylhexaldehyde; (12) 1,3dimethylcyclopenten-3-one; (13) cyclopentadione; (14) 2-furan carboxadehyde; (15) 1methyl-1-cyclopenten-3-one; (16) furanone; (17) amino-3-pyridinol; (18) 3-methyl cyclopentanedione; (19) phenol; (20) 2-methoxyphenol; (21) 2-methyl phenol; (22) 2-cyclopenten-1-one; (23) 4-methyl phenol; (24) creasol; (25) 4-ethyl phenol; (26) 4-ethyl-2methoxy phenol; (27) dihydrobenzofuran; (28) 4-hydro-3-methyl acetophenone; (29) eugenol; (30) 2,6, dimethoxyphenol; (31) isoeugenol; (32) triethoxybenzene; (33) vanillin; (34) trimethoxytoluene; (35) dimethoxy acetophenone; (36) trimethylacealdehyde; (37) methoxy eugenol; (38) levoglucasan).

Figure 4.
First derivative thermogravimetric (DTG) for the devolatilisation of bio-coals carbonised at 250 °C with varying residence times.
Figure 4.
First derivative thermogravimetric (DTG) for the devolatilisation of bio-coals carbonised at 250 °C with varying residence times.

Figure 5.
Volatile organics evolved below 250 °C from bio-coals generated at 250 °C with varying residence times. ((1) pentenol; (2) acetic acid; (3) dihydro-dioxin; (4) propanoic acid methyl esther; (5) furfural; (6) 2-methyl-2-cyclopenten-1-one; (7) ethanone; (8) cymene; (9) furancarboxyldehyde; (10) 5 methyl-2-furancaboxaldehyde; (11) dimethoxybutedimine; (12) benzofuran; (13) phenol; (14) 2-methyl phenol; (15) 4-methyl phenol; (16) cresol; (17) 4-ethyl phenol; (18) 4-ethyl-2-methoxy phenol; (19) 2-methoxy-N-N-dymethyl benzoamine; (20) 2-methoxy-4-propyl phenol; (21) 2,6 dimethyl phenol; (22) eugenol; (23) trimethoxybenzene; (24) vanillin; (25) 2-furyl-5-methyl furan; (26) aethallymal; (27) 4-hydroxy-3,5-dimethyoxy benzaldehyde; (28) methoxyeugenol).

Figure 6.
Volatile organics evolved between 250 °C and 400 °C from bio-coals generated at 250 °C with varying residence times. ((1) 2, methyl furan; (2) 2-propenoic acid 2-hydroxy ethyl esther; (3) 2,5 dimethyl furan; (4) toluene; (5) 4 methyl phenol; (6) methyl-3-octyne; (7) dimethoxy butane; (8) cyclohexanol; (9) cyclopenten-1-one; (10) acetylfuran; (11) cyclopentanone; (12) methylcyclopenten-3-one; (13) benzenediol; (14) 3-methyl cyclopentanone; (15) phenol; (16) 2-methyl phenol; (17) 4-methyl phenol; (18) cresol; (19) 4-ethyl phenol; (20) 4-ethyl-2-methoxy phenol; (21) 2,3-dihydro benzofuran; (22) 4 hydroxy-3-acetophenone; (23) eugenol; (24) 2,6 dimethyl phenol; (25) eugenol; (26) 2 dihydro-2-methyl benofuran; (27) isoeugenol; (28) trimethoxybenzene; (29) trymethoxy-5-methyl benzene; (30) acetophenone; (31) dimethoxy phenone; (32) methoxyeugenol; (a) acetic acid; (b) dihydrodioxin; (c) bioxirane; (d) isobutylacetic acid; (e) 2-methoxybutenol; (f) pyrolidethylamine; (g) propanediol; (h) furfural; (i) furanmethanol; (j) furanone; (k) dimethoxybutanamine; (l) cyclopent-1-one; (m) ethyl-2-hydroxy cyclopenten-1-one; (n) dimethyl heptane; (o) levoglucasan).
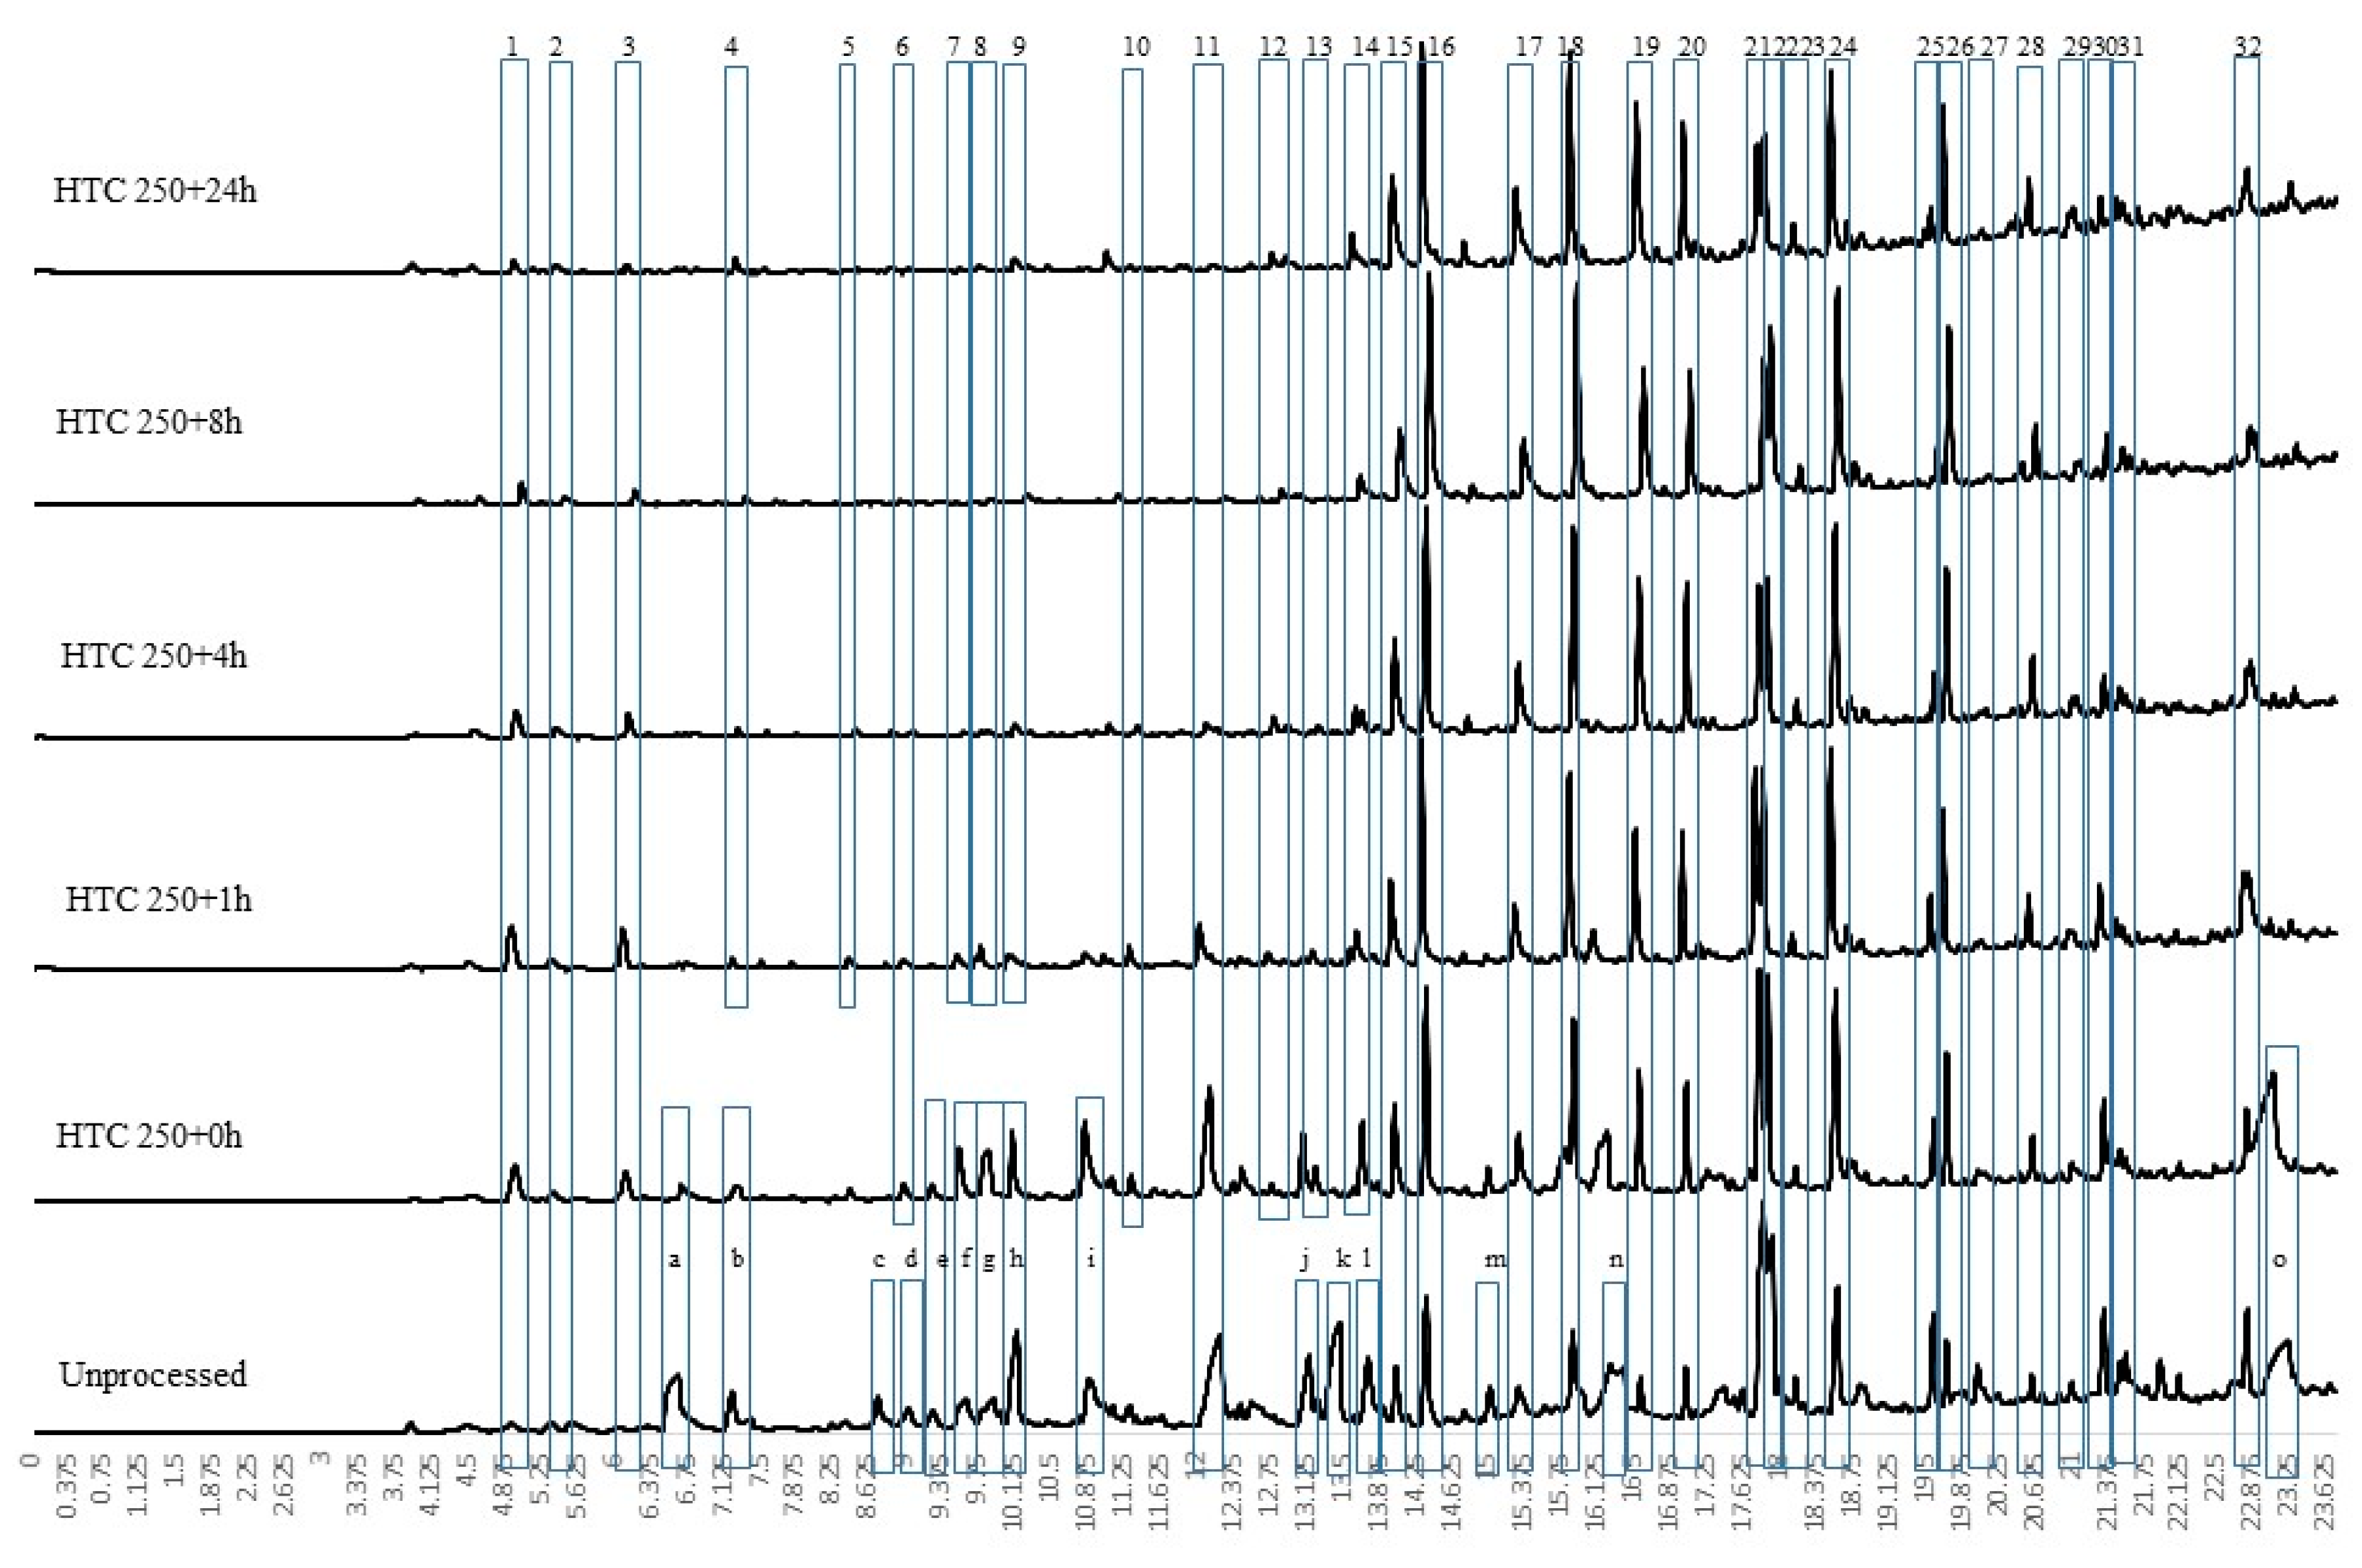
Figure 7.
Volatile organics evolved between 400 °C and 600 °C from bio-coals treated at 250 °C with varying residence times. ((1) Ethylcyclobutane; (2) Pentane; (3) Amino methyl propanol; (4) 2, methyl furan; (5) 2 ethyl butanal; (6) 2,5 dimethyl furan; (7) Valeric acid; (8) Octene; (9) Toluene; (10) Ethanone; (11) Trimethylimidazole; (12) Undecyonic acid methyl esther; (13) Ethylbenzene; (14) Xylene; (15) P-xylene; (16) 2-Cyclopenten-1-one; (17) Methyltoluene spp.; (18) Methyl cyclopentanone; (19) Triethylbenzene; (20) Fumeric acid ethyl esther; (21) Methoxy methyl benzene; (22) Indene; (23) 3-Methylcyclopenten-1-one; (24) 1-ethyl-4-methoxy benzene; (25) Acetonitrile benzene; (26) phenol; (27) 2-methyoxy phenol; (28) 2-methyl phenol; (29) Dimethyl phenol; (30) Cresol; (31) Creasol; (32) 2-ethyl phenol; (33) Ethylguaiacol; (34) 5-ethyl cresol; (35) 2,3 Dihydrobenzofuran; (36) 4-hydoxy-2-methylacetophenone; (37) Dioxybezene; (38) Dimethoxy phenol; (39) Eugenol; (40) Trimethoxybenzene; (41) Levolgucasan; (a) Cyclopentenone; (b) Hydroxy-3-methyl cyclopenten-1-one).

Figure 8.
Ash transition temperatures for (a) HTC at 200°C with varying residence times; (b) HTC at 250°C with varying residence times.
Figure 8.
Ash transition temperatures for (a) HTC at 200°C with varying residence times; (b) HTC at 250°C with varying residence times.

Figure 9.
Derivative thermogravimetric (DTG) burning profiles for: (a) unprocessed Miscanthus and bituminous reference coal (Elemental Microanalysis B2306, batch 203830); (b) Miscanthus hydrothermally treated at 200 °C with varying residence time and (c) Miscanthus hydrothermally treated at 250 °C with varying residence time.


Table 1.
Predictive slagging and fouling indices.
| Slagging/Fouling Index | Expression | Limit | |
|---|---|---|---|
| Alkali Index | AI < 0.17 safe combustion AI > 0.17 < 0.34 probable slagging and fouling AI > 0.34 almost certain slagging and fouling [31] | EQ.3 | |
| Bed Agglomeration Index | BAI < 0.15 bed agglomeration likely [32] | EQ.4 | |
| Base to Acid Ratio | R < 0.5 low slagging risk [32] | EQ.5 |
Table 2.
Yields, energy density and proximate and ultimate analysis of bio-coals derived from differing residence times.
Table 2.
Yields, energy density and proximate and ultimate analysis of bio-coals derived from differing residence times.
| Temperature | Residence | % Dry Basis | HHV MJ/kg | Energy Yield (%) | |||||||
|---|---|---|---|---|---|---|---|---|---|---|---|
| Yield | Nitrogen | Carbon | Hydrogen | Oxygen | Ash | Volatile Matter | Fixed Carbon | ||||
| Unprocessed | 0.7 | 52.2 | 5.2 | 38.7 | 3.1 | 84.5 | 12.3 | 18.2 | |||
| HTC 200 | 0 h | 67 | 0.7 | 51.8 | 5.6 | 39.5 | 2.4 | 80.4 | 16.0 | 18.5 | 68 |
| 1 h | 65 | 0.7 | 53.6 | 5.3 | 38.2 | 2.2 | 77.4 | 18.9 | 18.9 | 68 | |
| 4 h | 64 | 0.7 | 55.3 | 5.5 | 36.0 | 2.4 | 74.7 | 21.7 | 20.1 | 71 | |
| 8 h | 61 | 0.7 | 57.6 | 5.3 | 34.3 | 2.1 | 71.9 | 25.2 | 20.9 | 70 | |
| 24 h | 56 | 0.8 | 61.1 | 5.2 | 30.5 | 2.5 | 65.7 | 31.1 | 22.6 | 70 | |
| HTC 250 | 0 h | 52 | 0.6 | 59.2 | 4.9 | 32.9 | 2.3 | 69.1 | 27.9 | 21.1 | 60 |
| 1 h | 46 | 0.8 | 65.5 | 4.7 | 26.2 | 2.8 | 58.1 | 38.2 | 24.2 | 61 | |
| 4 h | 44 | 0.8 | 71.6 | 4.8 | 20.1 | 2.7 | 53.5 | 42.3 | 27.5 | 66 | |
| 8 h | 43 | 0.8 | 73.4 | 4.7 | 18.6 | 2.5 | 51.7 | 44.1 | 28.2 | 67 | |
| 24 h | 43 | 0.8 | 74.1 | 4.6 | 17.5 | 2.9 | 49.3 | 45.8 | 28.5 | 67 | |
Table 3.
Inorganic and heteroatom analysis of bio-coals derived from differing residence times and the corresponding slagging and fouling indices.
Table 3.
Inorganic and heteroatom analysis of bio-coals derived from differing residence times and the corresponding slagging and fouling indices.
| Temperature | Residence | mg/kg (Dry Basis) | AI | BAI | |||||||||||
|---|---|---|---|---|---|---|---|---|---|---|---|---|---|---|---|
| Na | Mg | Al | Si | P | S | Cl | K | Ca | Mn | Fe | |||||
| Unprocessed | 520 | 920 | 30 | 6890 | 700 | 1130 | 3590 | 3030 | 3530 | 110 | 40 | 0.27 | 0.01 | 0.78 | |
| HTC 200 | 0 h | 100 | 540 | 80 | 6550 | 290 | 690 | 2710 | 1120 | 4060 | 50 | 90 | 0.08 | 0.08 | 0.58 |
| 1 h | 150 | 400 | 70 | 6150 | 350 | 750 | 1760 | 1130 | 2800 | 50 | 120 | 0.08 | 0.09 | 0.49 | |
| 4 h | 120 | 480 | 110 | 6620 | 610 | 970 | 1650 | 900 | 4030 | 70 | 110 | 0.06 | 0.12 | 0.55 | |
| 8 h | 140 | 470 | 60 | 6960 | 670 | 880 | 1370 | 840 | 3780 | 80 | 50 | 0.06 | 0.05 | 0.50 | |
| 24 h | 190 | 470 | 100 | 7610 | 690 | 1170 | 1530 | 740 | 3630 | 60 | 100 | 0.06 | 0.10 | 0.44 | |
| HTC 250 | 0 h | 140 | 440 | 120 | 6320 | 710 | 1290 | 3500 | 920 | 3100 | 70 | 110 | 0.06 | 0.11 | 0.48 |
| 1 h | 90 | 530 | 190 | 7840 | 1150 | 1130 | 1720 | 1040 | 5280 | 80 | 140 | 0.05 | 0.14 | 0.57 | |
| 4 h | 120 | 460 | 120 | 6770 | 1100 | 1230 | 2010 | 890 | 3570 | 80 | 120 | 0.05 | 0.12 | 0.49 | |
| 8 h | 110 | 350 | 110 | 6000 | 1290 | 1020 | 1510 | 650 | 2180 | 90 | 90 | 0.04 | 0.12 | 0.37 | |
| 24 h | 130 | 370 | 140 | 8080 | 1090 | 1070 | 1760 | 850 | 1450 | 70 | 130 | 0.04 | 0.14 | 0.24 | |
© 2019 by the authors. Licensee MDPI, Basel, Switzerland. This article is an open access article distributed under the terms and conditions of the Creative Commons Attribution (CC BY) license (http://creativecommons.org/licenses/by/4.0/).
Share and Cite
MDPI and ACS Style
Smith, A.M.; Ross, A.B. The Influence of Residence Time during Hydrothermal Carbonisation of Miscanthus on Bio-Coal Combustion Chemistry. Energies 2019, 12, 523. https://doi.org/10.3390/en12030523
AMA Style
Smith AM, Ross AB. The Influence of Residence Time during Hydrothermal Carbonisation of Miscanthus on Bio-Coal Combustion Chemistry. Energies. 2019; 12(3):523. https://doi.org/10.3390/en12030523
Chicago/Turabian StyleSmith, Aidan M., and Andrew B. Ross. 2019. "The Influence of Residence Time during Hydrothermal Carbonisation of Miscanthus on Bio-Coal Combustion Chemistry" Energies 12, no. 3: 523. https://doi.org/10.3390/en12030523
Note that from the first issue of 2016, this journal uses article numbers instead of page numbers. See further details here.