Article

Flow Boiling Heat Transfer Characteristics in Horizontal, Three-Dimensional Enhanced Tubes

1
Department of Energy Engineering, Zhejiang University, 38 Zheda Road, Hangzhou 310027, China
2
Department of Mechanical and Electrical Engineering, Qingdao University of Science and Technology, 99 Songling Road, Qingdao 266061, China
3
Department of Mechanical Engineering Technology, State University of New York College at Buffalo, 1300 Elmwood Avenue, Buffalo, NY 14222, USA
*
Authors to whom correspondence should be addressed.
Energies 2019, 12(5), 927; https://doi.org/10.3390/en12050927
Submission received: 10 January 2019 / Revised: 24 February 2019 / Accepted: 2 March 2019 / Published: 10 March 2019

Abstract

:
An experimental investigation was conducted to explore the flow boiling heat transfer characteristics of refrigerants R134A and R410A inside a smooth tube, as well as inside two newly developed surface-enhanced tubes. The internal surface structures of the two enhanced tubes are comprised of protrusions/dimples and petal-shaped bumps/cavities. The equivalent inner diameter of all tested tubes is 11.5 mm, and the tube length is 2 m. The experimental test conditions included saturation temperatures of 6 °C and 10 °C; mass velocities ranging from 70 to 200 kg/(m2s); and heat fluxes ranging from 10 to 35 kW/m2, with inlet and outlet vapor quality of 0.2 and 0.8. It was observed that the enhanced tubes exhibit excellent flow boiling heat transfer performance. This can be attributed to the complex surface patterns of dimples and petal arrays that increase the active heat transfer area; in addition, more nucleation sites are produced, and there is also an increased interfacial turbulence. Results showed that the boiling heat transfer coefficient of the enhanced surface tubes was 1.15–1.66 times that of the smooth tubing. Also, effects of the flow pattern and saturated temperature are discussed. Finally, a comparison of several existing flow boiling heat transfer models using the data from the current study is presented.

1. Introduction

Heat transfer enhancement technologies offer more design options for increasing the thermal efficiency of a heat transfer unit. Nowadays, high-efficiency compact heat exchangers have received significant attention in a wide variety of industrial applications. Evaporators and condensers are the important components of a variety of heating and cooling systems. Hence, high-performance heat exchange pipes with enhanced surface structures need to be designed as the basic element of a heat exchanger. Besides, Thermodynamic characteristics of refrigerants also play a vital role in the flow boiling heat-transfer process. R134A is a widely-used working fluid in refrigerator and automobile air conditioning, and it is recognized as the best substitute for R12. R410A has replaced R22 in many applications and it is a kind of near-azeotropic refrigerant (R32/R125 mixture). The thermophysical properties and environmental protection indexes of R134A and R410A are given in Table 1.
Previously reported studies related to in-tube heat transfer enhancement have been typically passive enhancement techniques, which modify the surface structures, material composition, or fluid type to enhance the two-phase heat transfer performance of a single tube or a tube bundle. In this study, heat transfer enhancement was obtained by using surface-enhanced tubes with surface modifications. Investigations of enhanced tubes with two-dimensional roughness are common in the open literature, such as studies on microfin tubes with small helical internal fins [1,2,3,4,5,6]. However, researches on three-dimensional enhanced tubes are relatively scarce, to the authors’ knowledge.
Kukulka et al. [7] tested the overall thermal characteristics of four types of three-dimensional (3-D) enhanced tubes with staggered dimples and petal arrays. These enhanced surface tubes show superior heat transfer characteristics through the mixed effects of surface structures, which include increased heat transfer areas and interficial turbulence, secondary flow generation, and boundary layer disruption. After that, Kukulka et al. [8,9] experimentally studied the tube-side condensation and evaporation characteristics of flows in these surface-enhanced tubes (namely EHT series tubes). Guo et al. [10] evaluated the evaporation heat transfer of R22/R32/R410A inside a plain tube, a herringbone micro-fin tube and a dimpled tube enhanced by petal-shaped patterns (1EHT). Their results indicate that the 1EHT tube presents good evaporation heat transfer performance for the entire mass flux range, mainly due to the large number of nucleation sites generated by the special surface structures. Li and Chen [11,12] studied the condensation and evaporation characteristics of R410A inside two EHT tubes (2EHT) and one smooth tube. According to their experimental results, an increase of mass flux results in a rise in the heat transfer coefficient and frictional pressure loss. The 2EHT tubes exhibited superior heat transfer performance under the same operating conditions. In addition, the higher evaporation coefficient was found at a relatively low wall superheat. Shafaee et al. [13] discussed the flow boiling characteristics inside smooth and helically dimpled tubes with R600a as the working fluid. Ayub et al. [14] investigated the flow boiling heat transfer of refrigerant R134A in a dimpled tube. In order to create the in-tube annular flow passage, a round plastic rod was inserted in the test tube. The enhanced tube having the rod exhibited the higher heat transfer coefficient three times as that of an equivalent smooth tube. Kundu et al. [15] measured the boiling heat transfer coefficient and pressure loss of R134A and R407C in a 9.52-mm OD smooth tube. Tests were carried out over the mass flux range of 100–400 kg/m2s, with heat fluxes changing from 3 to 10 kW/m2. They found that the flow boiling coefficient raised as the mass flux or heat flux increased. It was also found that the measured coefficient for R134A was higher than that for R407C at the same mass fluxes. Lillo et al. [16] analyzed the flow boiling in a stainless-steel smooth tube with an inside diameter of 6.0 mm using R32 and R410A. They noticed that the evaporating coefficient for R32 was larger than that for R410A under the same test conditions. Greco and Vanoil [17] tested the boiling heat-transfer coefficients of a horizontal smooth tube using different refrigerants (R22, R134A, R507, R404A and R410A). Results indicated an increase in heat transfer coefficient with the increment of saturation temperature and heat flux.
Additionally, the size of channel and flow orientations also play an important role on the flow boiling heat transfer. Li and Wu [18] presented a micro/mini channel criterion for evaporation heat transfer. They reported that saturated-flow boiling characteristics in micro/mini-channels could be different from those in conventional channels. Jige et al. [19] performed an experimental research on flow boiling in small-diameter tubes using refrigerant R32. Their results show that the heat transfer coefficient increases with the decreasing tube diameter. Taking into consideration the effect of tube diameter, Saitoh et al. [20] developed a general correlation for in-tube flow boiling heat transfer by predicting the dry-out quality, which is based on the Chen-type correlation [21]. Recently, Sira et al. [22] studied the flow regimes and evaporation characteristics of R134A in a mini-channel having an internal diameter of 0.53 mm respectively for horizontal and vertical flow orientations. Their results revealed the importance of flow direction. The higher evaporating coefficient can be obtained when the two-phase refrigerant flows towards the vertical downward direction. A summary of previous literature is given in Table 2.
Only a few previous studies exist for flow boiling inside the 3-D enhanced heat transfer tubes that are considered in this research. In contrast to micro-fin tubes, these test tubes are two-layer, two-sided, enhanced surface tubes that are designed using shallow and deep cavities/protrusions, as can be seen in Figure 1. These surface-enhanced tubes, made of copper, can produce more nucleation sites, mainly owing to the petal-shaped cavities/protrusions in staggered arrangement. Specifically, the EHT tube has shallow, petal-shaped cavities in a web-like structure, and staggered deep dimples on the external surface, while the same enhanced patterns are located on the internal surface of the Re-EHT tube. Similarly, both the EHT concave and Re-EHT convex exhibit the dimpled protrusions and raised petal-shaped patterns in staggered rows. As also shown in Figure 1, the primary surface structures (dimple/protrusion) of the EHT tube and the Re-EHT tube have a height of 1.71 mm/1.81 mm and a projection diameter of 4.4 mm/4.0 mm. The pitch of dimple is 9.86 mm with a helix angle of 60°, because of the staggered arrangement of the dimples/protrusions. Using the Nanovea ST400 non-contact profilometer, the EHT tube was found to have a 20% increase in inner surface area compared with the smooth tube, and the Re-EHT tube indicates a 34% surface area increase. Details of these test tubes are listed in Table 3.
The main objective of this work is to experimentally study the heat transfer characteristics of R134A and R410A during flow boiling in two horizontal, surface-enhanced tubes and one smooth tube. In addition, the effects of flow pattern, mass velocity, and saturation temperature on the flow boiling is also analyzed and discussed.

2. Experimental Procedure

2.1. Test Apparatus

The schematic diagram of the test apparatus utilized to evaluate the flow boiling heat transfer characteristics of R134A and R410A inside circular tubes is shown in Figure 2a. It was composed of three closed circuits: (1) a refrigerant circuit, the major component of the test system; (2) a recycled water circuit used to exchange heat with the refrigerant and regulate the outlet vapor quality of the test section by controlling the inlet temperature and mass flow rate of water; and (3) a condensation section, which is used to cool the saturated refrigerant leaving the test tube at a given temperature. The refrigerant circuit comprised of a storage tank, a digital gear pump, a Coriolis mass flow meter, a preheating section, a test section, and several flow regulating valves. Sub-cooling refrigerant in the reservoir was sent to the test system by a gear pump regulated by a frequency converter. An oil separator was used to decrease the mass friction of lubricating oil in the liquid refrigerant. After that, a Coriolis mass flow meter (with a test accuracy of 0.2% of reading) was fixed to monitor the refrigerant mass flux. The inlet vapor quality of the test section can be calculated by measuring the water mass flow rate and water temperatures at the entrance and exit to the pre-heater.
The two-phase refrigerant entered the test section and was evaporated immediately. The water circuit consisted of a thermostatic water bath, a centrifugal water pump, a magnetic flow meter, and several valves. As described in Figure 2b, the test section is a typical horizontal counter-flow-type, double-pipe heat exchanger with a heated length of 2.0 m. Water flowing in the annulus side of the test section provided heat energy for the refrigerant from the preheating section. Water mass flux is measured by a Coriolis mass flow meter with an accuracy of 0.2% of real-time reading. Meanwhile, the inlet and outlet temperatures of refrigerant were measured with Platinum RTD-100 temperature transducers with a testing precision of ± 0.1 °C. In addition, the inlet and outlet absolute pressure of the refrigerant side of the test section were measured by two pressure transducers, and the total pressure loss across the test tube was obtained by a differential pressure gauge. All pressure measure instruments have a test accuracy of 0.075% of the reading. Then, the two-phase refrigerant entered the condensation section, where it was sub-cooled to at least 10 ℃ lower than the given saturated temperature. Lastly, liquid refrigerant was sent into a reservoir tank with a 50-L capacity.
Figure 2c provides the details of a cross-section of the tested tube. The average wall thickness of the enhanced surface tube is 0.6 mm. All the test tubes have the same outside diameter of 12.7 mm, and the maximum inside diameter is 11.5 mm. The outer tube is a smooth copper tube with an inside diameter of 17 mm. Table 3 lists the main dimensional parameters of the two enhanced tubes and one plain tube. To minimize the heat loss to surroundings, the entire test section was insulated in a large PVC circle pipe with an outer diameter of 110 mm. Polyurethane foam (approximately 90 mm thick) was filled into the gap between the PVC pipe and the outer tube to provide an insulation layer. Furthermore, a 10-mm-thick rubber foam was used to tightly wrap the PVC pipe.
To evaluate the heat insulation of the entire test section, two single-phase tests were performed to investigate heat loss using R134A and R410A. Figure 3 illustrates the results of single-phase heat balance measurements for the test section. It can be seen that the deviations between the water-side heat flow rate (Qw,ts) and refrigerant-side heat flow rate (Qref,ts) are lower than 5%. This ensures that the heat loss in the experimental apparatus can be neglected, due to its insignificant influence on the flow boiling heat transfer.

2.2. Experimental Test Conditions

For every test, the refrigerant mass velocities (determined by the actual cross-sectional area of the inner tube, Ac,ref) were varied, while the saturated pressure, water mass flux, inlet, and outlet vapor qualities of the test section were kept constant. The test range of flow boiling conditions are summarized in Table 4. All temperature and pressure signals were stored by a 16-bit 20-channel data collection card, and then the collected data were relayed in real time to a host computer. In order to ensure the steady state conditions, data points were collected over 200 s with 20-s intervals. During this period, the deviations of temperature, pressure, and vapor quality were below 0.1 °C, 5 kPa, and 0.05, respectively.

3. Data Reduction and Uncertainty Analysis

3.1. Data Reduction

In this paper, heat transfer data was reduced in order to calculate the vapor quality, heat flow rate, and evaporation coefficient. For the test section, the water-side heat transfer rate was calculated by the heat balance equation
Q w , t s = c p , w , t s m w , t s ( T w , t s , i n T w , t s , o u t )
Here, cp,w,ts, mw,ts, Tw,ts,in, and Tw,ts,out represent the specific heat of water taken at the mean bulk temperature, the mass flow rate of the recycled water, and the water temperatures at the entrance and exit to the annular channel, respectively. The heat flux q was calculated from Equation (2), by using the inner surface area Ai based on the maximum diameter di:
q = Q w / A i
Vapor quality at the test section inlet, xin, can be determined by the heat energy conservation in the preheating section. The total heat transfer rate in the pre-heater, Qpre, was calculated in Equation (3), and was composed of sensible heat (Qsens) and latent heat (Qlat):
Q p r e = c p , w , p r e m w , p r e ( T w , p r e , i n T w , p r e , o u t ) = Q s e n s + Q l a t
Q s e n s = c p , r e f , p r e m r e f ( T s a t T r e f , p r e , i n )
Q l a t = m r e f h l v x i n
x i n = Q p r e c p , r e f , p r e m r e f ( T s a t T r e f , p r e , i n ) m r e f h l v
where cp,w,pre and mw,pre represent the specific heat and mass flow rate, respectively, of hot water flowing across the pre-heater. In addition, Tw,pre,in, Tw,pre,out, and Tsat are defined as the water temperatures at the preheating section inlet and outlet, and the saturation temperature of refrigerant. Additionally, cp,ref,pre, Tref,pre,in, mref, and hlv are the special heat taken at the mean bulk temperature, inlet temperature, mass flow rate, and latent heat of vaporization of the refrigerant flowing through the pre-heater coils, respectively. As a consequence, the outlet vapor quality of the test section (xout) is defined as follows:
x o u t = x i n + Q w , t s m r e f h l v
The logarithmic temperature difference for a tube-in-tube heat exchanger was calculated using the water and refrigerant temperatures at the inlet and outlet:
L M T D = ( T w , t s , i n T r e f , t s , o u t ) ( T w , t s , o u t T r e f , t s , i n ) l n [ ( T w , t s , i n T r e f , t s , o u t ) / ( T w , t s , o u t T r e f , t s , i n ) ]
Here, Tref,ts,in and Tref,ts,out represent the refrigerant temperatures at the test section inlet and outlet, respectively. Assuming no fouling thermal resistance, the tube-side evaporating coefficient (hi) can be calculated using the following correlation:
h i = 1 A i [ L M T D Q w , e x p 1 h o A o ln ( d o / d i ) 2 π L k ]
where k is the thermal conductivity of wall material, and ho is the water-side heat transfer coefficient. It is worth noting that Ao is the external surface area, decided by the nominal outside diameter (do).
Gnielinski [23] presents a classical correlation that is widely used to predict the single-phase heat transfer coefficient for smooth tubing or annuli. This correlation is applicable for 3000 < Rew < 5 × 10⁶ and 0.5 < Prw < 2000:
h o = ( f / 2 ) ( Re w 1000 ) Pr w 1 + 12.7 ( f / 2 ) 0.5 ( Pr w 2 / 3 1 ) ( μ b u l k μ w a l l ) 0.14 k w d w
The dynamic viscosity ratio, (μbulkwall)0.14, can be evaluated using the average value of the bulk temperatures of water and inner wall. The results show the property differences in this study to be no more than 1%. In addition, dw is the water-side hydraulic diameter, which is equal to the inside diameter. The fanning friction factor (f) can be determined from the Petukhov correlation [24] given by Equation (11). For a smooth tube, the range of application of the prediction correlation is 3000 < Rew < 5 × 10⁶:
f = ( 1.58 ln Re w 3.28 ) 2
Since the internal and external surfaces of the EHT tubes are rough, due to the special surface structures, and the Gnielinski correlation [23] only applies to the smooth tubing, a water-side heat transfer enhancement factor C, decided by the Wilson plot method [25], was utilized to modify the Gnielinski correlation [23]. In fact, the factor C is the heat transfer coefficient ratio of the enhanced surface tubes to an equivalent plain tube. Then, the overall thermal resistance of the double-pipe heat exchanger for enhanced tubes can be calculated by following equation:
1 C h o = 1 U d o d i h i d o ln ( d o / d i ) 2 k
where U is the overall heat transfer coefficient of the test section.
At a given large mass flow rate of refrigerant, the inner thermal resistance and the wall thermal resistance can be considered as a constant value. Therefore, the water-side/shell-side heat transfer coefficient (ho) can be determined by varying the temperature and mass flux of the recycled water.
As depicted in Figure 4, the Wilson plot tests were done using the data points of refrigerants R134A and R410A. The water-side heat transfer enhancement factor C can be calculated directly by applying a linear regression method. It is found that the term C is only related to the special surface structures, and does not depend on the working fluid. According to the experimental results, the appropriate value of C is 2.70 for the EHT tube and 2.29 for the Re-EHT tube. This heat transfer enhancement is attributed to the dimples/protrusions on the tube wall. Something else to note is that all thermodynamic properties of R134A and R410A were obtained from REFPROP 9.1 software [26].

3.2. Experimental Uncertainty Analysis

The measurement error strongly depends on the flow boiling conditions and the accuracy of the thermocouples, pressure gauges and flowmeter. Uncertainties in the measured and calculated parameters were estimated by an error-delivering algorithm, as described in Moffat [27]. According to previously published papers, the relative uncertainty (UR) of the experimental parameter can be calculated using the following equation:
U R = [ i = 1 n ( R X i U ( X i ) ) 2 ] 1 / 2
The relative error of the heat transfer rate supplied by the hot water flowing in the annulus side, U(Qts), can be calculated from the energy conservation in the test section:
U ( Q t s ) = 2 ( m w , t s ) m w , t s 2 + 2 ( T w , t s , i n ) + 2 ( T w , t s , o u t ) ( T w , t s , i n T w , t s , o u t ) 2
Then, Equation (15) gives the relative uncertainty of the refrigerant mass velocity U(Gref):
U ( G r e f ) = 2 ( m r e f ) m r e f 2 + 4 2 ( d i ) d i 2
As a result, the measurement uncertainty in boiling heat-transfer coefficient can be expressed in the following form:
U ( h r e f ) = U 2 ( R ) + U 2 ( A i )
with
R = L M T D Q t s + 1 h w A o + l n ( d o / d i ) 2 π L k w a l l
where R is the overall thermal resistance and LMTD is the logarithmic mean temperature difference. Besides, kwall is the thermal conductivity of the wall material.
On the basis of the previous results in open literature, the Gnielinski correlation [23] usually leads to a deviation of up to 10%. Table 5 gives a summary of the experimental uncertainties of the measured and calculated parameters. The results indicate that the maximal error of the in-tube heat transfer coefficient is estimated to be 8.34%. Thus, the test system is proven to be reliable and stable.

4. Results and Discussion

4.1. Single-Phase Heat Transfer

Figure 5 shows the experimental Nusselt number (Nu) of R134A during flow boiling in the two enhanced tubes and one smooth tube, versus the Reynolds number (Re). Results indicate that the Nusselt number of the Re-EHT tube is about 34% higher than that of the smooth tube, and the EHT tube exhibits an impressive 50% increase in Nusselt number. The enhancement of the heat transfer characteristics can be attributed to the stronger interfacial turbulence effect and boundary layer disruption caused by the protrusions/dimples and staggered petal arrays. The solid line represents the Nu-Re curve of the smooth tube predicted by the Dittus-Boelter correlation [28], and the dashed line represents the predictions provided by the Gnielinski correlation [23]. As a result, both the two widely-used single-phase heat transfer models show well-accepted predictive ability, showing a maximum deviation error of 10%.

4.2. Flow Pattern Analysis

The Wojtan et al. [29] flow pattern map has been widely used for boiling flow heat transfer in horizontal smooth tubes. Figure 6 shows the predicted flow pattern in this study for R134A and R410A, at Gref = 100 kg/m2s, Tsat = 6 °C, and di = 11.5 mm. Obviously, it can be inferred that the main flow regimes are slug flow, stratified-wavy flow, intermittent flow, and annular flow. In the smooth tube tested, the flow patterns are the slug flow and stratified-wavy flow, using R134A and R410A as the working fluid at low mass fluxes. When Gref > 150 kg/m2s, the intermittent low and annular flow will occur according to the flow pattern map in the vapor quality range of 0.2–0.8. The local dry-out could appear as the mass velocity and vapor quality increases, when Gref > 200 kg/m2s and x > 0.9. Similar to the results reported in [4,16,29], evaporating coefficients tend to decrease with the increment of the vapor quality. For the boiling heat transfer process, nucleate boiling is dominant in the low-quality region, while the contribution of convective boiling increases as the mass velocity increases. Intermittent and annular flow patterns are usually considered as the optimal heat transfer patterns due to the smaller internal thermal resistance caused by the thin liquid film. The transition vapor quality from intermittent flow to annular flow, xIA, can be determined by the Kattan-Thome model [30] and is given by:
x I A = { [ 0.34 1 / 0.875 ( ρ v ρ l ) 1 / 1.75 ( μ l μ v ) 1 / 7 ] + 1 } 1
As a result, the transition quality xIA is 0.316 for R134A and 0.404 for R410A. For R134A, flow boiling in a horizontal smooth tube, slug flow, and stratified-wavy flow dominate the flow boiling condition over the mass flux range of 70–150 kg/m2s. In this case, intermittent flow and annular flow may appear only in the high-quality region. For the case of R410A, the flow mechanism will be dominated by slug flow and stratified-wavy flow when Gref is less than 140 kg/m2s, while annular flow and intermittent flow occur at higher vapor quality values when Gref > 140 kg/m2s.
For the EHT and Re-EHT tubes, there is no available information of flow pattern map from the previous studies. A flow pattern analysis that predicts the flow boiling inside the enhanced tubes was made. When compared to smooth tubing, the transition from intermittent flow to annular flow is expected to happen at a lower vapor quality, while the transition line between stratified-wavy flow and annular flow trends to appear at lower mass velocities and vapor qualities. The primary dimples/protrusions and secondary petal arrays on the heated surface can pull the liquid film to distribute around the circumference, and force the bubbles to move towards the center of the tube. Previous studies [1,2,31] have reported flow boiling flow patterns of horizontal micro-fin tubes. It was found that the intermittent-to-annular-flow transition quality is lower than that of the smooth tube under the same operating conditions. The earlier transition of flow regimes in the micro-fin tube is mainly due to the liquid droplet entrainment effect of spiral mini-channels on the inner wall. Mashouf et al. [32] carried out a visualization study to observe evaporation flow patterns of R600a in horizontal dimpled and smooth tubes. At the same mass flux, the flow pattern transition in the dimpled tube occurred at a lower vapor quality in comparison with the equivalent smooth tube. It can be concluded that the dimples/protrusions are beneficial to the decrease of transition quality. Moreover, it is inferred that the intermittent/annular flow regimes dominate the entire test range for R134A and R410A flow boiling in the enhanced tubes. In a future study, a visualization observation will be performed to determine the flow patterns of working fluid in the EHT enhanced tubes.

4.3. Flow Boiling Heat Transfer Coefficient

Flow boiling heat transfer characteristics of R134A and R410A inside the three test tubes were evaluated. Figure 7 depicts the measured heat transfer coefficient and heat flux as a function of mass velocity at a saturation temperature of 6 °C. Experimental results indicate that the evaporating coefficients increase with a rise in mass flux. The greater vapor velocities enhance the convective boiling heat transfer with the increasing shear stress on the gas-liquid interface and inner wall, and the reduced liquid film thickness. In addition, the interaction between the dimples/protrusions and liquid film near the tube wall also enhances the heat transfer coefficient. Consequently, the boiling heat transfer coefficient increases with the increasing mass flux.
Compared to the smooth tube, the evaporation coefficients of enhanced tubes are significantly higher. As indicated in Figure 7a, the heat transfer coefficient of the EHT tube is about 1.25–1.32 times that of the tested smooth tube, for mass velocities varying from 70–150 kg/m2s, and 1.58–1.66 times that of the Re-EHT tube. Dimples/protrusions generate periodic vortexes, continue to separate the boundary layer, and enhance the turbulence between the fluid and wall surface. The strong gas-phase shear stress caused by the low gas-phase viscosity may drive liquid droplets into the vapor, thereby generating flow separation and mixing. Moreover, these enhanced surface structures produce more nucleation sites, causing higher boiling heat transfer coefficients than those found in a smooth tube. These reasons result in a higher heat transfer coefficient for the EHT tube. However, the Re-EHT tube shows a superior heat transfer performance under the same mass flux conditions. This higher efficiency is partially attributed to the larger internal surface area. On the other hand, the surface tension also plays a vital role in thinning the film thickness in the dimpled tubes. As a consequence, the heat transfer enhancement of 3-D surface structures of the Re-EHT tube is more efficient than that of the EHT tube.
A comparison of evaporation heat transfer coefficients of R410A between the tested enhanced and smooth tubes are shown in Figure 7b. The heat transfer enhancement ratio of the EHT tube to the smooth tube is in the range of 1.15–1.28, and 1.45–1.65 times for the Re-EHT tube. It can be seen from Figure 7 that the measured coefficient of R134A is lower than that of R410A at the same mass flux. This phenomenon can be explained by the fact that the liquid-phase thermal conductivity and latent heat of R410A are larger when compared with R134A. Additionally, R410A has the higher imposed heat flux compared to R134A. Steiner and Taborek [33] used the onset of a nucleate boiling (ONB) criterion to develop a correlation for predicting the minimum heat flux to achieve the ONB during in-tube evaporation:
q O N B = 2 σ T s a t h c b r ρ v h l v
In view of the fact that the minimum heat flux at ONB for R410A is lower than that for R134A, owing to the larger latent heat of vaporization, the importance of nucleate boiling heat transfer for R410A case exceeds that for R134A case in the present study. Therefore, the heat transfer coefficient of the Re-EHT tube raises rapidly with the increasing mass flux. This can be explained by the fact that the forced convective boiling component is more and more important, and that high mass flux induces liquid entrainment, thereby weakening the thermal resistance. In order to avoid sub-boiling in the entrance section of test tube, the inlet vapor quality was maintained at 0.2. Besides, the vapor outlet quality was controlled to 0.8 to prevent local dry-out in the exit section.

4.4. Effect of Saturation Temperature on Flow Boiling Heat Transfer Characteristics

Figure 8 compares the effect of saturated temperature on the average flow boiling coefficients for a constant inlet quality of 0.2 and outlet quality of 0.8, over the mass flux range of 80–200 kg/m2s, with heat flux varying between 16 and 35 kW/m2. Tests were conducted at two different saturation temperatures (6 °C and 10 °C). Under the same flow boiling conditions, the heat transfer curve of the Re-EHT tube is higher than that of the EHT tube and the smooth tube. On other hand, these results indicate that the boiling heat transfer coefficients measured at a saturated temperature of 6 °C are higher than those at Tsat = 10 °C under the boiling conditions. The weakened wall shear stress and gas-liquid interfacial stress may be responsible. In addition, the vapor-phase density increases with an increase in saturation temperature, which leads to a lower vapor velocity. Furthermore, the liquid-phase heat conductivity decreases as the saturated temperature increases. This leads to a rise in internal thermal resistance. For these reasons, a lower saturation temperature is beneficial for the boiling heat-transfer coefficient. Lima et al. [34] also observed the similar experimental results that higher heat transfer coefficients were found at lower saturation temperatures.

4.5. Evaluation of Flow Boiling Heat Transfer Correlations

Figure 9 shows the comparison of experimental data and predicted values calculated by four well-known correlations (Liu and Winterton [35], Gungor and Winterton [36], Kandlikar [37], and Wojtan et al. [38]). Table 6 summarizes the detailed parameters of these correlations [35,36,37,38]. Table 7 lists the deviations between the experimental and predicted results by adopting the mean absolute error (MAE) and mean relative error (MRE), which are given by
M A E = 1 N i = 1 N | h e x p h c a l h e x p | × 100 %
M R E = 1 N i = 1 N ( h e x p h c a l h e x p ) × 100 %
where N is the total number of experimental data points. In addition, hexp is the experimental heat transfer coefficient and hcal is the calculated value by using the prediction correlations.
The Gungor and Winterton model [36] tends to over-estimate the experimental results, with a mean absolute error of 42.26% and mean relative error of −45.43%; the Kandilkar correlation [37] also exhibits a larger predictive error. Thus, the Gungor and Winterton correlation [36] and the Kandilkar correlation [37] are not applicable for our experiments. In fact, the refrigerant used in this study is different from those used in the study of Kandilkar [37], where working fluids only include the water, R11, R12, R22, R113, R114, R152, ethylene glycol, and nitrogen. Better agreement can be presented by the prediction correlation of Wojtan et al. [38] and Liu and Winterton [35]. Both of the correlations could predict 80% of experimental data points within a ±30% error band. The Wojtan et al. correlation [38] was built based on the mathematical analysis of the liquid film thickness (δ) and dry-out angle (θdry). The convective boiling heat transfer coefficient (hcb) was developed from the Dittus–Boelter model [28] by replacing Rel and dh with Reδ and δ. The Liu and Winterton correlation [35] was based on the first general model developed by Chen [21] for saturated boiling heat transfer, by considering the force convective term and nucleate boiling term. This correlation is valid for flow boiling heat transfer in channels with the hydraulic diameters in the range from 2.95 to 32 mm.
h t p = E h c b + S h n b
Here, htp is the two-phase heat transfer coefficient, E is the enhanced factor, S is suppression factor, and hnb is the nucleate boiling component. It is noticed that the prediction correlation still cannot accurately estimate the boiling heat transfer coefficient for the present study, since it ignores the effect of the surface roughness (Rp).
Based on the Liu and Winterton correlation [35], Cooper [39] developed a nucleate boiling heat transfer correlation, by considering the effect of surface roughness on the interfacial turbulence and nucleation sites. The modified term is given by
h n b = 55 P r 0.12 0.2 lg R p ( lg P r ) 0.55 M 0.5 q 0.67
For the smooth tube, the surface roughness Rp is considered to be in the range 0.3–0.4 µm, due to the higher flatness. For the enhanced tubes tested, the three-dimensional surface roughness is in the range of 1.5–2.5 µm for the EHT tube, and 6–7 µm for the Re-EHT tube.
A comparison of the predictions of the modified correlation and experimental data are shown in Figure 10. All data points of the enhanced and smooth tubes tested are predicted within a ±10% error band. The modified correlation may not entirely be suitable for all test conditions. For example, the effects of tube diameter and effective heated length need to be examined further to enlarge the application range of the modified correlation.

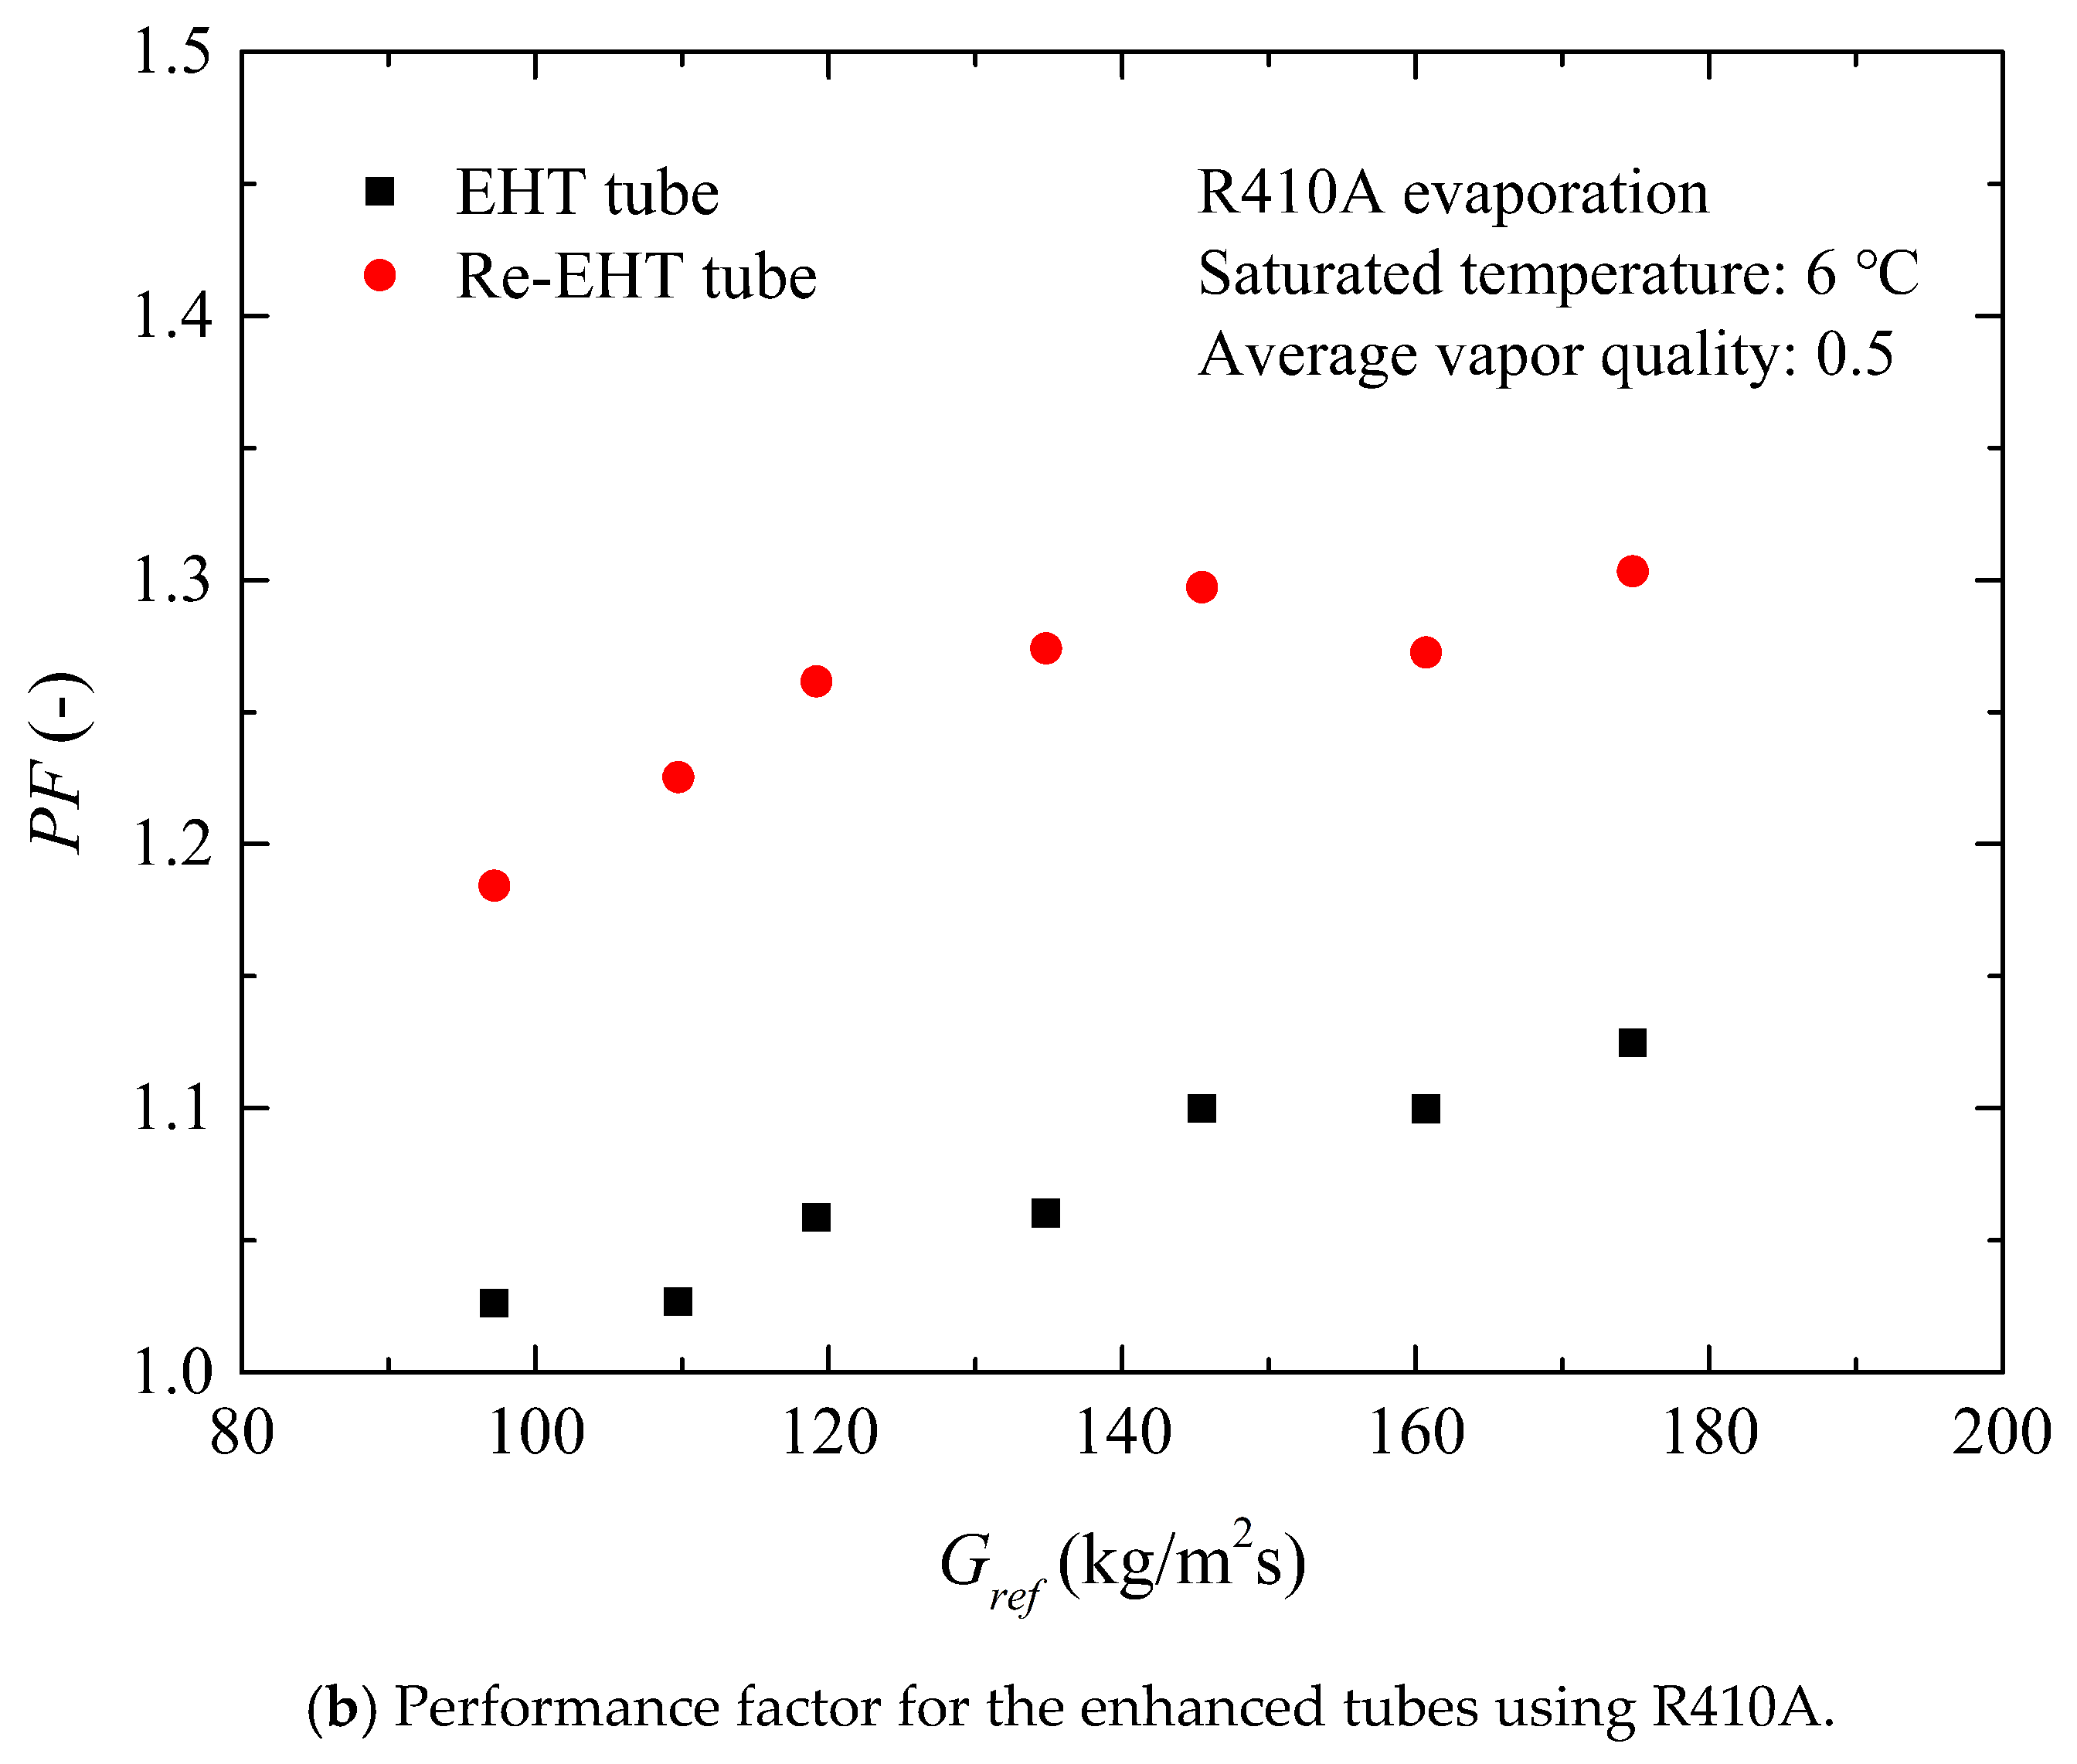
4.6. Performance Factor

On account of the fact that the actual internal surface areas of the tested tubes were different, a performance evaluation factor (PF) was adopted to evaluate the thermal efficiency of the enhanced tubes, which can be written as
P F = h e h s A s A e
where hS and AS are the heat transfer coefficient and the actual inner surface area of the smooth tube. Similarly, he and Ae represent the evaporating coefficient and internal surface area of the enhanced tubes, respectively.
Figure 11a details the variation of the performance factor of R134A during flow boiling in the EHT and Re-EHT tubes with mass flux. Over the entire test range, the PF values of the enhanced tubes are kept steady. The performance factor values are about 15% for the EHT tube and 30% for the Re-EHT tube. Different from the results of R134A case, the PF value of R410A case increases as the mass flux increases at first, and then gradually tends to be flat when Gref > 150 kg/m2s. In summary, the PF values of the EHT and Re-EHT tubes are larger than unity, showing a good heat transfer performance.

5. Conclusions

An investigation on the flow boiling of refrigerants R134A and R410A in two enhanced surface tubes and one smooth tube was carried out. The effects of flow pattern, mass flux, and saturation temperature on the boiling heat transfer were discussed. A comparison between experimental data and predictions calculated by several existing correlations for in-tube evaporation was conducted. The main conclusions can be summarized as follows:
  • Intermittent/annular flows could be the major flow patterns over the entire experimental range for R134A and R410A flow boiling in the enhanced tubes in this study (as shown in Wojtan et al.’s map [29]).
  • The boiling heat transfer coefficients increase with the increasing mass flux. Two enhanced tubes present better heat transfer performance than the smooth tube. This can be attributed to the complex two-layer surface structures of enhanced tubes. The dimples/protrusions enhance the in-tube heat transfer by increasing heat transfer surface area, promoting the interfacial turbulence, providing more nucleation sites and destroying the boundary layer.
  • An increase in heat transfer coefficient is found at a lower saturation temperature, in view of the fact that the gas-liquid interfacial and wall shear stresses are weakened as the saturation temperature increases.
  • Boiling heat transfer coefficients are evaluated using the four widely-used correlations. The correlations of Wojtan et al. [38] and Liu and Winterton [35] show a good predictive ability. Considering the effect of the surface roughness, an optimization model was presented, which can predict all data points within a ± 10% error band.
  • The enhanced tubes showed a good performance factor. Hence, the dimples/protrusions and petal arrays are the effective surface structures for enhancing the tube-side evaporation. The Re-EHT tube has the largest potential for boiling heat-transfer enhancement.

Author Contributions

Conceptualization, Z.-C.S. and D.J.K.; data curation and investigation, Z.-C.S., W.L. and X.M.; methodology and formal analysis, W.L. and D.J.K.; project administration, L.M.; resources and visualization, D.J.K.; funding acquisition, W.L. and L.-X.M.; writing—original draft preparation, Z.-C.S. and X.M.; writing—review and editing, D.J.K. and Z.-C.S. All authors read and approved the final manuscript.

Funding

This work was supported by the National Science Foundation of Zhejiang Province (LY19E060004).

Conflicts of Interest

The authors declare no conflict of interest.

Nomenclature

Accross sectional area, m2
Aiinner surface area of test tube, m2
Aoouter surface area of test tube, m2
BoBoiling number, [-]
cpspecific heat, J/(kg·K)
Cenhancement factor, [-]
Coconvective number, [-]
diinner diameter of test tube, m
doouter diameter of test tube, m
dhhydraulic diameter, m
Eenhancement factor, [-]
fFanning friction factor, [-]
FrFroude number, [-]
Gmass flux, kg/(m2s)
hheat transfer coefficient, W/(m2·K)
hlvlatent heat of vaporization, J/kg
kthermal conductivity, W/(m·K)
Ltube length, m
LMTDlogarithmic mean temperature, K
mmass flow rate, kg/s
Mmolecular weight, g/mol
Pwwetted perimeter, m
PFperformance factor, [-]
PrPrandtl number, [-]
Prreduce pressure, [-]
Qheat transfer amount, W
qheat flux, W/m2
rbubble radius, m
Rpsurface roughness, m
ReReynolds number, [-]
Ssuppression factor, [-]
Ttemperature, K
Utotal heat transfer coefficient, W/(m2·K)
xvapor quality, [-]
xIATransition quality from intermittent flow to annular flow, [-]
XttMartinelli parameter, [-]
Greek symbols
σsurface tension, N/m
μdynamic viscosity, Pa·s
θangle, [º]
ρdensity, kg/m3
εvoid fraction, [-]
δliquid film thickness, m
Subscripts
aveaverage
calcalculation
cbconvective boiling
drydry-out
eenhanced
expexperiment
iinner
ininlet
lliquid phase
latlatent heat
nbnucleate boiling
oouter
ONBonset of nucleate boiling
outoutlet
prePreheating section
refrefrigerant
ssmooth
satsaturated
senssensible heat
tptwo-phase
tstest section
vvapor phase
walltube wall
wwater

References

  1. Yu, M.H.; Lin, T.K.; Tseng, C.C. Heat transfer and flow pattern during two-phase flow boiling of R-134a in horizontal smooth and microfin tubes. Int. J. Refrig. 2002, 25, 789–798. [Google Scholar] [CrossRef]
  2. Spindler, K.; Müller-Steinhagen, H. Flow boiling heat transfer of R134a and R404A in a microfin tube at low mass fluxes and low heat fluxes. Heat Mass Transf. 2009, 45, 967–977. [Google Scholar] [CrossRef]
  3. Rollmann, P.; Spindler, K. New models for heat transfer and pressure drop during flow boiling of R407C and R410A in a horizontal microfin tube. Int. J. Therm. Sci. 2016, 103, 57–66. [Google Scholar] [CrossRef]
  4. Padovan, A.; Col, D.D.; Rossetto, L. Experimental study on flow boiling of R134a and R410A in a horizontal microfin tube at high saturation temperatures. Appl. Therm. Eng. 2011, 31, 3814–3826. [Google Scholar] [CrossRef]
  5. Celen, A.; Çebi, A.; Ahmet, S.D. Experimental investigation of flow boiling heat transfer characteristics of R134a flowing in smooth and microfin tubes. Int. Commun. Heat Mass Transf. 2018, 93, 21–33. [Google Scholar] [CrossRef]
  6. Wu, Z.; Wu, Y.; Sundén, B.; Li, W. Convective vaporization in micro-fin tubes of different geometries. Exp. Therm. Fluid Sci. 2013, 44, 398–408. [Google Scholar] [CrossRef]
  7. Kukulka, D.J.; Smith, R.; Fuller, K.G. Development and evaluation of enhanced heat transfer tubes. Appl. Therm. Eng. 2011, 31, 2141–2145. [Google Scholar] [CrossRef]
  8. Kukulka, D.J.; Yan, H.; Smith, R.; Li, W. Condensation and evaporation characteristics of flows inside three dimensional Vipertex enhanced heat transfer tubes. Chem. Eng. Trans. 2017, 61, 1777–1782. [Google Scholar]
  9. Kukulka, D.J.; Smith, R.; Li, W.; Zhang, A.; Yan, H. Condensation and evaporation characteristics of flows inside Vipertex 1EHT and 4EHT small diameter enhanced heat transfer tubes. Chem. Eng. Trans. 2018, 70, 13–18. [Google Scholar]
  10. Guo, S.P.; Wu, Z.; Li, W.; Kukulka, D.J.; Sundén, B.; Zhou, X.P.; Wei, J.J.; Simon, T. Condensation and evaporation heat transfer characteristics in horizontal smooth, herringbone and enhanced surface EHT tubes. Int. J. Heat Mass Transf. 2015, 85, 281–291. [Google Scholar] [CrossRef]
  11. Li, W.; Chen, J.X.; Zhu, H.; Kukulka, D.J.; Minkowycz, W.J. Experimental study on condensation and evaporation flow inside horizontal three dimensional enhanced tubes. Int. Commun. Heat Mass Transf. 2017, 80, 30–40. [Google Scholar] [CrossRef]
  12. Chen, J.; Li, W. Local flow boiling heat transfer characteristics in three-dimensional enhanced tubes. Int. J. Heat Mass Transf. 2018, 121, 1021–1032. [Google Scholar] [CrossRef]
  13. Shafaee, M.; Mashouf, H.; Sarmadian, A.; Mohseni, S.G. Evaporation heat transfer and pressure drop characteristics of R-600a in horizontal smooth and helically dimpled tubes. Appl. Therm. Eng. 2016, 107, 28–36. [Google Scholar] [CrossRef]
  14. Ayub, Z.H.; Ayub, A.H.; Ribatski, G.; Moreira, T.A.; Khan, T.S. Two-phase pressure drop and flow boiling heat transfer in an enhanced dimpled tube with a solid round rod insert. Int. J. Refrig. 2017, 75, 1–13. [Google Scholar] [CrossRef]
  15. Kundu, A.; Kumar, R.; Gupta, A. Heat transfer characteristics and flow pattern during two-phase flow boiling of R134a and R407C in a horizontal smooth tube. Exp. Therm. Fluid Sci. 2014, 57, 344–352. [Google Scholar] [CrossRef]
  16. Lillo, G.; Mastrullo, R.; Mauro, A.W.; Viscito, L. Flow boiling of R32 in a horizontal stainless steel tube with 6.00 mm ID. Experiments, assessment of correlations and comparison with refrigerant R410A. Int. J. Refrig. 2018. [Google Scholar] [CrossRef]
  17. Greco, A.; Vanoli, G.P. Flow-boiling of R22, R134a, R507, R404A and R410A inside a smooth horizontal tube. Int. J. Refrig. 2005, 28, 872–880. [Google Scholar] [CrossRef]
  18. Li, W.; Wu, Z. A general criterion for evaporative heat transfer in micro/mini-channels. Int. J. Heat Mass Transf. 2010, 53, 1778–1787. [Google Scholar] [CrossRef]
  19. Jige, D.; Sagawa, K.; Inoue, N. Effect of tube diameter on boiling heat transfer and flow characteristic of refrigerant R32 in horizontal small-diameter tubes. Int. J. Refrig. 2017, 76, 206–218. [Google Scholar] [CrossRef]
  20. Saitoh, S.; Daiguji, H.; Hihara, E. Correlation for boiling heat transfer of R-134a in horizontal tubes including effect of tube diameter. Int. J. Heat Mass Transf. 2007, 50, 5215–5225. [Google Scholar] [CrossRef]
  21. Chen, J.C. Correlation for boiling heat transfer to saturated fluids in convective flow. Ind. Eng. Chem. Process Des. Dev. 1966, 5, 322–329. [Google Scholar] [CrossRef]
  22. Saisorn, S.; Wongpromma, P.; Wongwises, S. The difference in flow pattern, heat transfer and pressure drop characteristics of mini-channel flow boiling in horizontal and vertical orientations. Int. J. Multiph. Flow 2018, 101, 97–112. [Google Scholar] [CrossRef]
  23. Gnielinski, V. New equations for heat and mass transfer in turbulent pipe and channel Flow. Int. Chem. Eng. 1976, 16, 359–368. [Google Scholar]
  24. Petukhov, B.S. Heat transfer and friction in turbulent pipe flow with variable physical properties. Adv. Heat Transf. 1970, 6, 503–564. [Google Scholar]
  25. José Fernández-Seara Francisco, J.; Uhía Sieres, J.; Campo, A. A general review of the Wilson plot method and its modifications to determine convection coefficients in heat exchange devices. Appl. Therm. Eng. 2007, 27, 2745–2757. [Google Scholar] [CrossRef] [Green Version]
  26. Lemmon, E.W.; Huber, M.L.; Mclinden, M.O. NIST Standard Reference Database 23, Reference Fluid Thermodynamic and Transport Properties—REFPROP, Version 9.0, Standard Reference Data Program; National Institute of Standards and Technology: Gaithersburg, MD, USA, 2010.
  27. Moffat, R.J. Describing the uncertainties in experimental results. Exp. Therm. Fluid Sci. 1988, 1, 3–17. [Google Scholar] [CrossRef] [Green Version]
  28. Dittus, F.W.; Boelter LM, K. Heat transfer in automobile radiators of the tubular type. Int. Commun. Heat Mass Transf. 1985, 12, 3–22. [Google Scholar] [CrossRef]
  29. Wojtan, L.; Ursenbacher, T.; Thome, J.R. Investigation of flow boiling in horizontal tubes: Part I—A new diabatic two-phase flow pattern map. Int. J. Heat Mass Transf. 2005, 48, 2955–2969. [Google Scholar] [CrossRef]
  30. Kattan, N.; Thome, J.R.; Favrat, D. Flow boiling in horizontal tubes. Part 1—development of a diabatic two-phase flow pattern map. J. Heat Transf. 1998, 120, 140–147. [Google Scholar] [CrossRef]
  31. Singh, A.; Ohadi, M.M.; Dessiatoun, S. Flow boiling heat transfer coefficients of R-134a in a microfin tube. J. Heat Transf. 1996, 118, 497–499. [Google Scholar] [CrossRef]
  32. Mashouf, H.; Shafaee, M.; Sarmadian, A.; Mohseni, S.G. Visual study of flow patterns during evaporation and condensation of R-600a inside horizontal smooth and helically dimpled tubes. Appl. Therm. Eng. 2017, 124, 1392–1400. [Google Scholar] [CrossRef]
  33. Steiner, D.; Taborek, J. Flow boiling heat transfer in vertical tubes correlated by an asymptotic model. Heat Transf. Eng. 1992, 13, 43–69. [Google Scholar] [CrossRef]
  34. Lima RJ, D.S.; Jesús Moreno Quibén Thome, J.R. Flow boiling in horizontal smooth tubes: New heat transfer results for R-134a at three saturation temperatures. Appl. Therm. Eng. 2009, 29, 1289–1298. [Google Scholar] [CrossRef]
  35. Liu, Z.; Winterton RH, S. A general correlation for saturated and subcooled flow boiling in tubes and annuli, based on a nucleate pool boiling equation. Int. J. Heat Mass Transf. 1991, 34, 2759–2766. [Google Scholar] [CrossRef]
  36. Gungor, K.E.; Winterton, R.H.S. A general correlation for flow boiling in tubes and annuli. Int. J. Heat Mass Transf. 1986, 29, 351–358. [Google Scholar] [CrossRef] [Green Version]
  37. Kandlikar, S.G. A general correlation for saturated two-phase flow boiling heat transfer inside horizontal and vertical tubes. J. Heat Transf. 1990, 112, 219–228. [Google Scholar] [CrossRef]
  38. Wojtan, L.; Ursenbacher, T.; Thome, J.R. Investigation of flow boiling in horizontal tubes: Part II—Development of a new heat transfer model for stratified-wavy, dryout and mist flow regimes. Int. J. Heat Mass Transf. 2005, 48, 2970–2985. [Google Scholar] [CrossRef]
  39. Cooper, M.G. Saturated nucleate pool boiling: A simple correlation. Inst. Chem. Eng. Symp. Ser. 1984, 86, 785–792. [Google Scholar]
Figure 1. The external surface structure of the (a) EHT tube and (b) Re-EHT tube.
Energies 12 00927 g001aEnergies 12 00927 g001b
Figure 2. Schematic diagram of the (a) experimental system, (b) test section, (c) cross-section of the test section.
Energies 12 00927 g002
Figure 3. Heat balance measurements for single-phase flow in the smooth tube.
Energies 12 00927 g003
Figure 4. Test results of Wilson plot [23] of the (a) EHT tube and (b) Re-EHT tube.
Energies 12 00927 g004
Figure 5. Variation of Nusselt number with Reynolds number for single-phase heat transfer in two enhanced tubes and one smooth tube.
Energies 12 00927 g005
Figure 6. Flow pattern map of Wojtan et al. [29] for flow boiling in a smooth tube with an inside diameter of 11.5 mm.
Energies 12 00927 g006aEnergies 12 00927 g006b
Figure 7. Comparison of flow boiling heat transfer coefficient and heat flux between enhanced and smooth tubes using (a) R134A and (b) R410A.
Energies 12 00927 g007
Figure 8. The effect of saturated temperature on the evaporating heat transfer in the test tubes.
Energies 12 00927 g008
Figure 9. Evaluation of four heat transfer correlations for evaporation heat transfer in the tube.
Energies 12 00927 g009aEnergies 12 00927 g009b
Figure 10. Evaluation of the modified correlation for the boiling heat transfer coefficient of the tested tubes.
Energies 12 00927 g010
Figure 11. Performance factor versus mass flux for boiling heat transfer in the enhanced tubes using (a) R134A and (b) R410A.
Energies 12 00927 g011aEnergies 12 00927 g011b
Table 1. Thermophysical and environment properties of refrigerants R134A and R410A.
RefrigerantR134A
(Pure Refrigerant)
R410A
(Near-Azeotropic Refrigerant)
CompositionC2H2F4R32, R125, 50/50 (weight percent)
ASHRAE safetyA1A1
ODP00
GWP14302100
Molecular10272.6
Pc (kPa)40664950
Tc (°C)101.172.5
Saturation Properties of Refrigerants
Tsat6 °C6 °C10 °C
Psar (kPa)361.98965.291088.4
Pr (-), Psar/Pc0.0890.1950.220
ρl (kg/m3)1274.71145.41128.4
ρv (kg/m3)17.7236.3541.177
μl (Pa·s)2.47 × 10−41.50 × 10−41.43 × 10⁻⁴
μv (Pa·s)1.09 × 10−51.25 × 10−51.27 × 10⁻⁵
kl (W/m·K)0.0890.1000.097
Prl3.7531.1832.315
σ (N/m)0.010600.008130.00753
hlv (kJ/kg)194219213
Table 2. Summary of previously published studies on evaporation inside a tube.
AuthorsTubedo (mm)RefrigerantG (kg/m2s)q (kW/m2)x (-)
Yu te al. [1]Smooth tube/Micro-fin tube10.7R134A163–4082.2–560.1–0.9
Spindler and Müller-Steinhagen [2]Micro-fin tube9.52R134A/R404A25–1501–150.1–0.7
Rollmann and Spindler [3]Micro-fin tube9.52R407C/R410A25–3001–200.1–1.0
Padovan et al. [4]Micro-fin tube7.69R134A/R410A80–60014–83.50.1–0.99
Celen et al. [5]Smooth tube/Micro-fin tube9.52R134A190–381100.2–0.77
Wu et al. [6]Micro-fin tube5.00R22/R410A100–6205–310.1–0.8
Kukulka et al. [8]1EHT tube/3EHT tube12.7R410A80–180-0.2–0.9
Kukulka et al. [9]1EHT tubes/4EHT tube9.52R410A160–390-0.2–0.8
Guo et al. [10]Smooth tube/Herringbone micro-fin tube/1EHTtube12.7R22/R32/R410A50–15013.9–360.1–0.9
Li and Chen [11,12]Smooth tube/2EHT tube12.7R410A60–175-0.1–0.9
Shafaee et al. [13]Smooth tube/Helical dimpled tube9.45R600a155–47015.80–0.8
Ayub et al. [14]Enhanced dimpled tube19.05R134A80–2002.5–150.12–0.72
Kundu et al. [15]Smooth tube9.52R134A/R407C100–4003–100.1–0.9
Lillo et al. [16]Smooth tube6.00R32146–5072.4–41.20.02–0.99
Greco and Vanoli [17]Smooth tube6.00R22/R134A/R507C/R404A/R410A36011–210–1
Jije et al. [19]Horizontal small-diameter tube1.00/2.20/3.50R3250–6005–400–1
Saitoh et al. [20]Horizontal circular mini-channel1.75R134A200–10001–830–1
Sira et al. [22]Horizontal and vertical mini-channels1.00R134A250–8201–600.1–0.9
Table 3. Details of the test tubes.
Tube TypeEHT TubeRe-EHT TubeSmooth Tube
Inside diameter of inner tube di (mm)11.5
Outside diameter of inner tube do (mm)12.7
Average wall thickness (mm)0.6
Height of dimple/protrusion (mm)1.711.81-
Projection diameter (mm)4.44.0-
Dimpled/protruded pitch (mm)9.869.86-
Helix angle, deg6060-
Ratio of actual heat transfer area, AE/AS1.201.341
Inside diameter of outer tube Di (mm)17.0
Tube length L (m)2.0
Tube materialCopper
Thermal conductivity (W/m2·K)379
Table 4. Experimental conditions.
ParametersRange
RefrigerantR134AR410A
Saturation temperature Tsat, (°C)6
Refrigerant mass velocity G, (kg/m2s)70–200
Heat flux q, (kW/m2)10–40
Inlet vapor quality xin0.2
Outlet vapor quality xout0.8
Table 5. Uncertainties of measured and calculated parameters.
Measured ParametersUncertainty
Diameter±0.05 mm
Length±0.5 mm
Temperature±0.1 K
Pressure, range: 0–5000 kPa±0.075% of full scale
Differential pressure, range: 0–50 kPa±0.075% of full scale
Refrigerant mass flow rate, range: 0–120 kg/h±0.2% of reading
Water mass flow rate, range: 0–600 kg/h±0.2% of reading
Calculated ParametersUncertainty
Mass velocity G, (kg/m2s)±1.17%
Heat flux q (kW/m2)±2.64%
Vapor quality x±3.96%
Heat transfer coefficient h (W/m2K)±8.34%
Table 6. Details of four existing correlations for evaporation heat transfer.
AuthorCorrelation
Liu and Winterton [35] h t p = [ ( E h c b ) 2 + ( S h n b ) 2 ] 0.5 , h c b = 0.023 Re l 0.8 P r l 0.4 k l d h
E = [ 1 + x Pr l ( ρ g ρ l 1 ) ] 0.35 , Re l = G d h μ l
h n b = 55 P r 0.12 ( log 10 P r ) 0.55 M 0.5 q 0.67 , S = ( 1 + 0.055 E 0.1 Re l 0.16 ) 1
Gungor and Winterton [36] h t p = E h l + S h n b , h l = 0.023 Re l 0.8 P r l 0.4 k l d h
h n b = 55 P r 0.12 ( log P r ) 0.55 M 0.5 q 0.67 , E = 1 + 24000 B o 1.16 + 1.37 ( 1 X t t ) 0.86
S = 1 1 + 1.15 × 10 6 E 2 Re l 1.17 , X t t = ( 1 x x ) 0.9 ( ρ v ρ l ) 0.5 ( μ l μ v ) 0.1 , B o = q G h l v
Kandlikar [37] h t p = M A X ( h c b , h n b )
h c b = [ 1.136 C o 0.9 ( 25 F r l ) 0.3 + 667.2 B o 0.7 ] h l
h n b = [ 0.6683 C o 0.2 ( 25 F r l ) 0.3 + 1058 B o 0.7 ] h l
h l = 0.023 R e l 0.8 P r l 0.4 k l d i , F r l = G 2 g d i ρ l 2 , B o = q G h l v , C o = ( 1 x x ) 0.8 ( ρ v ρ l ) 0.5
Wojtan et al. [38] h t p = θ d r y h v + ( 2 π θ d r y ) h w e t 2 π , h v = 0.023 R e v 0.8 P r v 0.4 k v d i
h w e t = [ ( h c b ) 3 + ( h n b ) 3 ] 1 / 3 , h n b = 55 P r 0.12 ( log P r ) 0.55 M 0.5 q 0.67
h c b = 0.0133 R e δ 0.69 P r l 0.4 k l d i , R e δ = 4 G δ ( 1 x ) μ l ( 1 ε ) , δ = π d ( 1 ε ) 2 ( 2 π θ d r y )
s l u g / i n t e r m i t t e n t / a n n u l a r : θ d r y = 0
s l u g s t r a t i f i e d   w a v y   f l o w : θ d r y = θ s t r a t x x I A [ ( G w a v y G ) ( G w a v y G s t r a t ) ] 0.61
s t r a t i f i e d w a v y   f l o w : θ d r y = θ s t r a t [ ( G w a v y G ) ( G w a v y G s t r a t ) ] 0.61
Table 7. Prediction accuracy of the heat transfer correlations.
CorrelationsMAE (%)MRE (%)
Liu and Winterton [35]18.841.98
Gungor and Winterton [36]42.26−45.43
Kandlikar [37]30.00−27.97
Wojtan et al. [38]23.81−15.83
Modified correlation3.640.85

