Article

Harmonisation of Coolant Flow Pattern with Wake of Stator Vane to Improve Sealing Effectiveness Using a Wave-Shaped Rim Seal

Department of Mechanical Engineering, Graduate School, Chung-Ang University, 84 Heukseok-ro, Dongjak-gu, Seoul 06974, Korea
*
Author to whom correspondence should be addressed.
Energies 2019, 12(6), 1060; https://doi.org/10.3390/en12061060
Submission received: 27 December 2018 / Revised: 8 March 2019 / Accepted: 10 March 2019 / Published: 19 March 2019
(This article belongs to the Special Issue Small-Scale Energy Systems with Gas Turbines and Heat Pumps)

Abstract

:
The rim seal of the gas turbine is intended to protect the material of the turbine disk from hot combustion gases. The study of the rim seal structure is important to minimise the coolant flow and maximise the sealing effect. In this paper, a wave-shaped rim seal for stator disks is proposed and its effect is confirmed by numerical analysis. To characterise the flow phenomena near the wave-shaped rim seal, a simplified model of the wave-shaped rim seal (Type 1 model), which excludes the rotor blade and stator vane, is analysed and compared with the conventional rim seal. Then, through analysis of the wave-shaped rim seal geometry (Type 2 model), which includes the rotor blade and stator vane, a reduction in egress and ingress flow was observed owing to the wave-shaped rim seal, and the sealing effectiveness on the stator disk of turbine was increased by up to 3.8%. Implementation of the wave-shape geometry in the radial seal is a novel choice for turbine designers to consider in future for better-performing and more-efficient turbines.

1. Introduction

To increase the thermal efficiency of the gas turbine, the inlet temperature of the gas needs to be increased [1]. However, hot gas reduces the turbine’s lifespan, owing to thermal loading and fatigue failure of the turbine material. In preceding gas turbine studies, it was revealed that the cause of the ingress flow (hot mainstream gas) and egress flow through the wheelspace is the pressure difference near the interface between the mainstream gas path and the wheelspace [2] (Figure 1a). When passing through the mainstream gas path, the flow is affected by the wake of the stator vanes and rotor blades (Figure 1b(i)), causing non-axisymmetric variations in velocity and pressure (Figure 1b). In contrast, the pressure distribution in the wheelspace is relatively constant in the circumferential direction compared to that in the mainstream flow, resulting in a pressure difference between the two regions (Figure 1b(ii)). In modern gas turbines, the coolant flow is injected into the wheelspace to cool the turbine disk material and block the incoming hot gases (Figure 1a). However, there are two drawbacks to this approach. Since the coolant flow is bled from the compressor of the gas turbine system, the net efficiency of the gas turbine is reduced. In addition, the egress of the coolant flow through the gap between the stator and rotor disks interferes with the mainstream flow, and this deteriorates the aerodynamic performance. Therefore, the maximisation of cooling and sealing effects, while minimising coolant flow in gas turbines, has long been an important topic for engineers.
Basic studies have been conducted regarding the rotational flow in the wheelspace between the rotor and stator disks [3,4,5]; this was further developed into research on the ingress/egress of the flow through the wheelspace and how to minimise it. A mathematical method, called the orifice model, was devised to predict the minimum coolant flow required to prevent the ingress flow [6]. In addition, other methods, such as flow visualisation [7,8], gas concentration measurement [9,10] and computational fluid dynamics (CFD) [11,12], have been performed for studies on gas turbine disk design to minimise ingress/egress flows. When engineers design a gas turbine disk, a structure called a ‘rim seal’ is created around the disk to guide the flow between the wheelspace and the mainstream gas path (Figure 1a).
In the maximisation of cooling and sealing effects with a minimum coolant flow rate, there have been various concerns regarding the shape of the rim seal. Many studies are related to the deformation of the two-dimensional shape on the meridional section of the rim seal. Initial rim seal studies found that the sealing effect of the radial clearance seal was better than that of the axial clearance seal study [13]. A double radial clearance seal was then proposed and its performance verified [9,14]; this double radial clearance seal evolved into a study of the rim seal geometry called angel wings that divide the wheelspace into a trench cavity and a buffer cavity [15,16]. Additional studies were conducted to characterise the tendency of the flow around the rim seal according to the flow conditions (such as coolant flow rate, rotational Reynolds number, and rotational speed of the disk) [17] and the shape parameter of the rim seal [8,18]. Recently, a study was reported on the performance of a rim seal with an inner cavity and a rib structure added to the rotor side [19], and with two buffer cavities that attenuate the circumferential pressure asymmetries of the flow introduced from the mainstream gas path [20]. In contrast, a number of three-dimensional modified rim seals have been proposed. The protrusion attached to the rotor side of the wheelspace prevents ingestion of the mainstream flow by increasing the swirl ratio of the flow inside the wheelspace [21,22]. Similarly, a honeycomb-like rim seal geometry that promotes the sealing effect was also reported [23]. These studies on the three-dimensional shape of the rim seal are limited to the rotor-side rim seal, and contrarily, studies on the three-dimensional shape parameter of the stator rim seal are rare.
In this paper, a novel wave-shape geometry of the stator radial seal is proposed, which considers the three-dimensional shape parameter of the stator rim seal to improve the performance of the rim seal. The inner surface of the stator radial seal is formed to have a different radius along the circumference so that a wave-like cavity is created inside the stator radial seal (Figure 1c). Numerical analyses were performed for both the conventional and wave-shaped rim seal geometries, and the pressure distribution and velocity results are compared and discussed in detail. Sealing effectiveness and the ingress/egress flow structure are also confirmed by applying the flow condition of the coolant flow containing CO2 gas in the simulation.

2. Materials and Methods

The analyses were conducted on two types of geometry (Figure 2a). Type 1 does not consider the stator vane and rotor blade to enable investigation of the sole effect of the rim seal geometries on flow dynamics, and the coolant flow channel is also omitted to save computational time. Type 2 considers the stator vane and rotor blade and includes the coolant flow channel to confirm the sealing effect of the wave-shaped rim seal geometry in the turbine.

2.1. Geometries

Most geometric dimensions used in this study are based on an experimental turbine at Arizona State University [24]. The outer radius of the disks is 195.7 mm, and the height of the mainstream gas path is 22.9 mm. The axial chord length of the rotor blade and stator vane is 31.8 mm and 48.3 mm, respectively, and the pitch of both the rotor blades and stator vanes is 59.2 mm. The tip clearance between the blade tip and the shroud is neglected. The profile of the stator vane and rotor blade consisted of profile points obtained from the midspan figure published in reference [24] using a data points extraction software (Engauge Digitizer, ver. 9.5, © 2014 Mark Mitchell). The axial gap between the rotor and stator disks is 16.5 mm. The axial clearance between the inner seal of the stator disk, located 153.2 mm from the axis of rotation, and the rotor disk is 2.5 mm (Figure 2b). The radial clearance seal has an axial overlap of 2 mm and a radial clearance of 2 mm. The length of the stator and rotor radial seals are 7.1 mm and 11.4 mm, respectively (Figure 2b). The coolant flow channel inlet located in the middle of the turbine has a radius of 19.1 mm. In the conventional rim seal, the radial clearance between the rotor and stator radial seals is constant at 2 mm (Figure 2c(i)). In contrast, in the wave-shaped rim seal, the stator radial seal is designed to have a wave-shape (green region in Figure 2c(ii)). At the ridge of the wave-shape, the gap is 3 mm, and the ridge is located at the same circumferential position as the trailing edge of the stator vane (Figure 2c(ii)). The gap at the troughs at both ends of the wave-shape is 1 mm (Figure 2c(ii)). A total of four geometries were used for the analysis (Figure 2d,e): Type 1 conventional rim seal (Type 1 C), Type 1 wave-shaped rim seal (Type 1 W), Type 2 conventional rim seal (Type 2 C), and Type 2 wave-shaped rim seal (Type 2 W). To save computation time, the geometry of a 360/22° sector model, including one stator vane and one rotor blade, was used for the analysis of a Type 2 turbine with 22 stator vanes and 22 rotor blades (Figure 2a). The 360/22° sector model was also applied to Type 1 (Figure 2a). To create the geometries, the BladeGen and DesignModeler programs of ANSYS 17.0 (Ansys, Inc., Canonsburg, PA, USA) were used.

2.2. Numerical Method and Boundary Conditions

Transient simulations were performed to predict the flow around the rim seal, which is dominated by time-dependent turbulent flow. A shear-stress transport (SST) k-ω model was used as the viscous model to accurately calculate the turbulent flow near the rim seal, considering the effect of the boundary layer formed on the wall of the narrow gap of the rim seal. The species transport model was applied to confirm the patterns of the egress and ingress flow, and the sealing effectiveness defined in terms of CO2 gas concentration. The detailed mathematical formulas for SST k-ω model and species transport model are provided in ‘Supplementary Materials’. ANSYS FLUENT 17.0, a commercial CFD tool, was used for the numerical analyses in this study. To generate the grid of the computational domain, ANSYS ICEM CFD 17.0 was used. The hexahedral grids were applied to all geometries. The same number of grids was used for the conventional rim seal and wave-shaped rim seal of each type (Figure 3a,b). In the wave-shaped rim seal, the radial seal grid number is the same as that of the conventional rim seal. However, as the radial gap changes owing to the wave shape of the wave-shaped rim seal, the grid becomes dense in the ridge region and sparse in the trough region. In the remaining parts of the wave-shaped rim seal, the same grid as that used for the conventional rim seal is used. In Type 1, the axial clearance, between the stator radial seal and the rotor wall, contains 53 cells and the radial clearance, between the stator radial seal and rotor radial seal, contains 48 cells (Figure 3c). There are 59 cells in the axial clearance between the rotor radial seal and the stator wall (Figure 3c). This is the same in Type 2. There are 49 and 84 cells in the circumferential direction in Type 1 and Type 2, respectively; this is because Type 2 contains stator -vanes and rotor blades. A total of 1,111,810 and 5,441,981 elements were used for Type 1 and Type 2, respectively. To predict the boundary layer formed on the stator vane and rotor blade, the widely used ‘O-grid’ scheme was applied to generate grids around these parts in Type 2 (Figure 3d). The values of y+ are under five in the overall geometry; however, more refined grids (y+ < 1) were used in the vicinity of the rim seal to predict the boundary layer accurately. A grid independence test was performed for the Type 1 W geometry. The appropriate grid density was determined based on the static pressure distribution in Line 1, located in the stator disk region inside the stator radial seal with the wave shape (Figure 4). The test was performed for the three different grid number cases (grid #1: 1.9 × 10⁵, grid #2: 1.1 × 10⁶, and grid #3: 3.3 × 10⁶). The normalised angle, ζ (θ/θp), is defined as the angular position (θ) divided by the periodic angle (θp ≈ 16.36°) (Figure 4). Grids #2 and #3 exhibit almost the same Pstatic profile, whereas grid #1 has meaningfully different values. Therefore, the grid density and structure of grid #2 were applied to all models in this study (Figure 3).
Because the high-temperature environment inside the gas turbine is difficult to replicate in the laboratory, we also used CO2 gas concentration measurements instead of high-temperature gas; this method has been employed often in both experimental [17,24] and numerical studies [23]. Our CFD model also used a mixture of air and CO2 as the working fluid. The boundary conditions used in our models are based on the turbine experiments performed at Arizona State University [24], which are as follows. The mass flow rate of the mainstream flow was 0.11444 kg/s and contained only air, and the coolant flow at 0.24833 × 10⁻³ kg/s mass flow rate contained CO2 gas at a mass fraction of 0.057. The outflow pressure condition was 97.5 kPa (absolute pressure). The rotating speed of rotor part was set to 2400 rpm. The periodic condition, with a (360/22)° (≈ 16.36°) periodic angle of both the rotor part and stator part, was applied.
The time step was approximately 3.5 × 10⁻⁴ s for Type 1, and 3.5 × 10⁻⁵ s for Type 2, which is the time required for the rotor part to rotate by 5° (for Type 1) and 0.5° (for Type 2); note that the Type 2 geometry includes blades, but needs a more refined time step. The most important parameter with which to evaluate the rim seal performance in our study must be related to the mass fraction of CO2, which stabilised after 2500 time steps for Type 1 models (Figure 5a) and 700 time steps for Type 2 models (Figure 5b). For the analysis of Type 1, the CO2 data of the 5544th time step (when the stator and rotor parts were aligned in the initial position, shown in Figure 2a, Type 1) were used. In Type 2, the results of the 933rd–965th time steps were used; this time step period is the time required for the rotor to rotate a periodic angle of 360/22° (≈16.36°).

3. Results and Discussion

Highly complex three-dimensional unsteady flow was found near the rim seal. The flow is affected by various flow dynamic issues, such as wake flow occurring near the stator vane [2], unsteady flow created by the rotor blade [23], and coolant flow, which were considered and achieved in Type 2 models (Figure 2). However, it is necessary to observe the sole influence of the wave-shaped rim seal geometry. Analysis of the Type 1 model, which excludes the stator vane and rotor blade (Figure 2), was preceded as a supportive model.

3.1. Type 1 (without Blade and Vane)

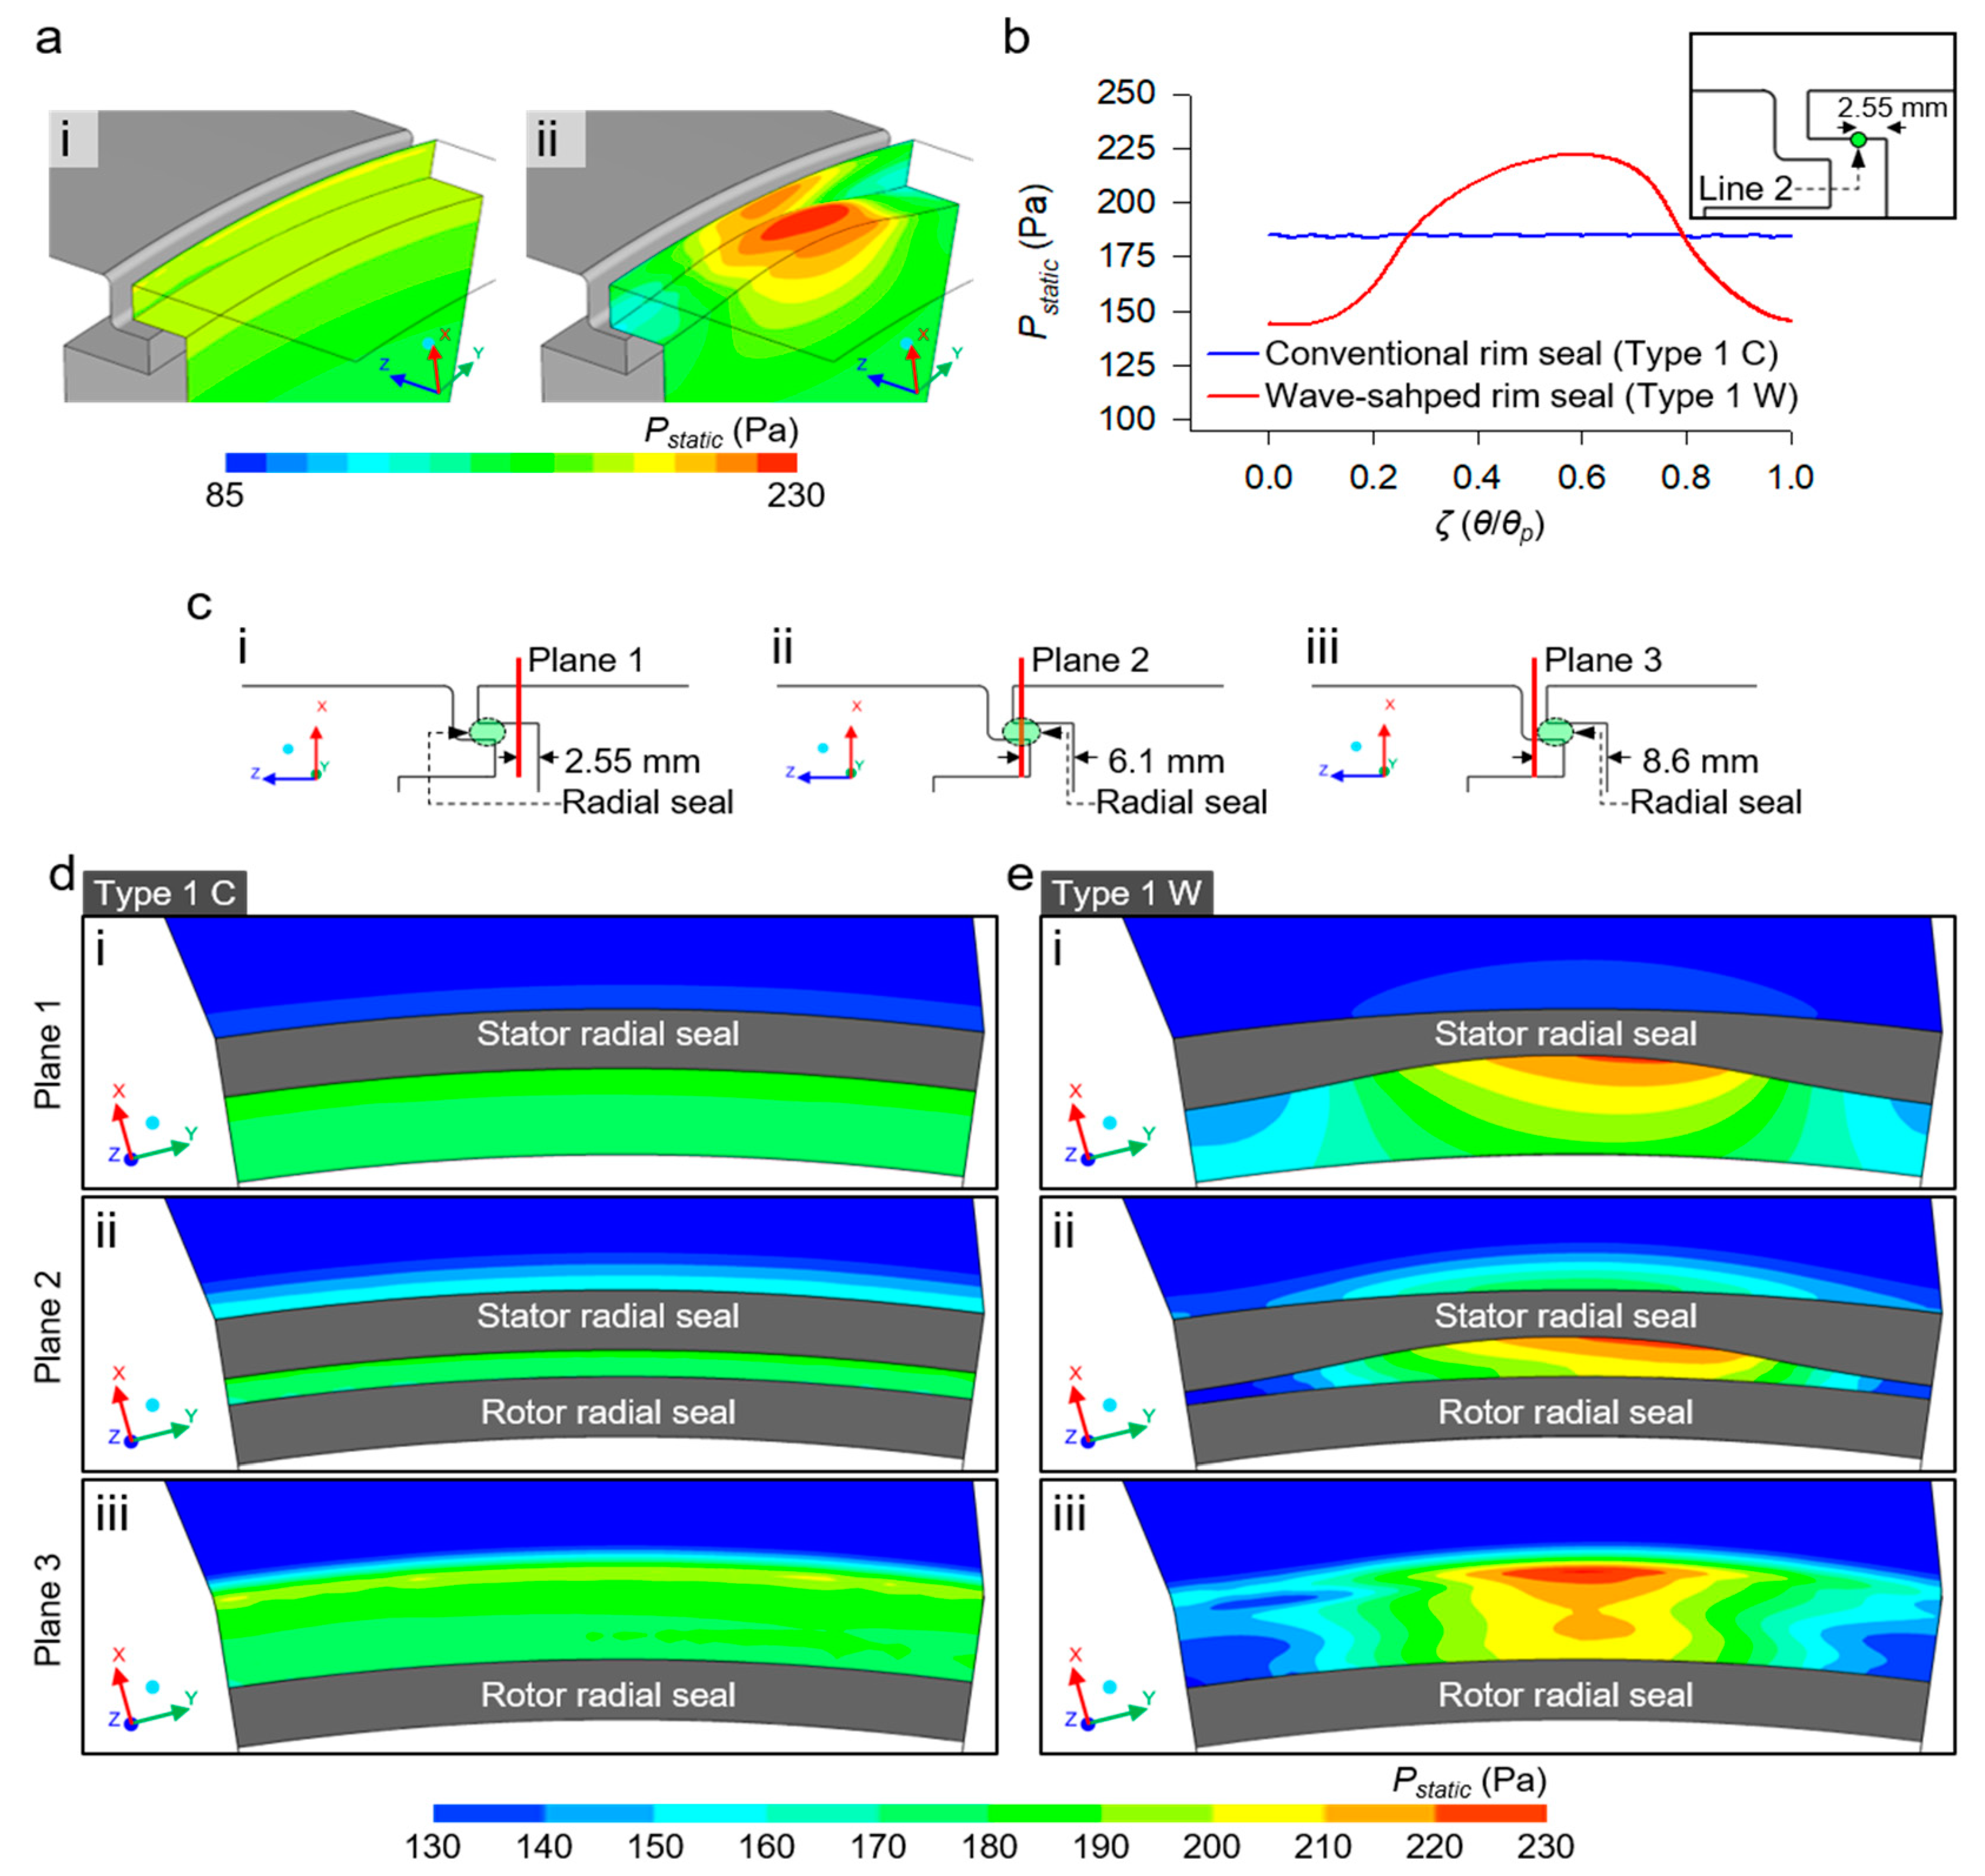
The most unique resultant effect of the wave-shaped rim seal is the uneven pressure distribution in the radial seal region (Figure 6a(ii)). A higher Pstatic forms around the ridge of the wave shape of the stator radial seal inner surface, even though there is no effect of the pressure field produced by the stator vane or rotor blade. It should be noted that the stator vane and rotor blade are not considered in Type 1 C, and thus there is an even pressure distribution (Figure 6a(i)). This tendency is confirmed by the comparison of the static pressure distributions at Line 2 (green point, Figure 6b), located on the inner surface of the stator radial seal of both the conventional and wave-shaped rim seals. In Line 2 of the conventional rim seal (Type 1 C), a uniform Pstatic formed at approximately 184.58 Pa (average Pstatic), in Line 2 of the wave-shaped rim seal (Type 1 W), a maximum Pstatic of 221.84 Pa formed at ζ = 0.57 near the wave ridge and a minimum Pstatic of 143.60 Pa was confirmed ζ = 0.06 in the vicinity of the wave trough (Figure 6b); this is a greater than ± 20% pressure difference to Type 1 C.
For more detailed observation of the rim seal pressure profiles, Planes 1, 2, and 3 were set up at the cross-sections located at 2.55 mm, 6.1 mm, and 8.6 mm from the stator disk, respectively (Figure 6c), where the coolant and mainstream flows merge. In the wheelspace and mainstream path in Type 1 C, a uniform pressure along the circumferential direction was formed regardless of location (Figure 6d). Meanwhile, the uneven pressure distribution in the radial seal of Type 1 W (Figure 6a(ii)) propagates to the mainstream region. In Plane 1 of Type 1 W, high Pstatic was formed around the ridge of the wave shape (Figure 6e(i)) and in the mainstream region. This tendency is shown more clearly in Planes 2 and 3 (Figure 6e(ii,iii)); the peak pressure zone of 230 Pa permeates to the mainstream region (Figure 6e(iii)). In contrast, the counterpart images of Type 1 C (Figure 6d) show even pressure distributions with clearer circumferential boundaries between the rim seal and mainstream region. In Plane 3 of Type 1 C (Figure 6d(iii)) and Type 1 W (Figure 6e(iii)), fluctuating static pressure distributions were observed; this is caused by the rotation of the rotor disk. The pressure profiles on Plane 3 clearly show that the high pressure created in the radial seal invades the mainstream region and can change the mainstream pressure profile near the endwall.
Such dynamic change of the pressure profile found in Type 1 W (Figure 6e) is caused by the velocity distribution in the radial gap. Therefore, the velocity profiles were analysed in detail. In the radial gap, the circumferential velocity (Vcir) is dominant due to the rotation of the rotor. Planes 4, 5, 6, and 7 are the meridional sections at ζ = 0, 0.25, 0.5, and 0.75, respectively (Figure 7a). A high circumferential velocity (>36 m/s) was developed in the vicinity of the rotor disk wall for Type 1 C and Type 1 W (Figure 7b,c). In Type 1 C, the distribution of Vcir is same for Planes 4–7 (Figure 7b). This confirms that the flow pattern and the static pressure distribution (Figure 6d) of Type 1 C have the same uniform characteristics in the circumferential direction (θ-direction). On the contrary, in Type 1 W, different circumferential velocity distributions were formed for each plane (Planes 4–7) (Figure 7c). Different contours of Vcir were formed owing to the gradual change in the radial gap (distance between the stator radial seal and the rotor radial seal) determined by the wave-shaped rim seal geometry. Plane 4 (Figure 7c(i)) is a cross-section through a wave-shape trough and the higher circumferential velocity region (dotted line for >18 m/s) is larger (in terms of area portion) than those in Planes 5–7 (Figure 7c(ii–iv)). The circumferential velocity distribution is determined by the interplay between the rotor-side and stator-side walls. Unlike in Type 1 C (Figure 7b), the radial gap of Type 1 W (Figure 7c) changes continuously in the circumferential direction, and the interplay of the boundary layers of the two walls (stator and rotor walls) dynamically affect the Vcir distribution. As the radial gap widens, the region where Vcir is below 18 m/s (dashed line for <18 m/s) also widens (Figure 7c(i–iii)). Contrarily, as the radial gap narrows (in Plane 6), the area where Vcir < 18 m/s decreases, as shown in Figure 7c(iv). It is now important to observe how the velocity in the radial seal in Type 1 W modifies the static pressure profile. The area-averaged static pressure (Pave,static) and area-averaged circumferential velocity (Vave,cir) in the radial seal (Figure 8a(i), green) were calculated (Figure 8). The values of Pave,static and Vave,cir at ζ = 0, 0.25, 0.5, 0.75, and 1 (Figure 8a(ii)) show almost constant lines for both Pave,static (≈ 176.88 Pa) and Vave,cir (≈ 24.63 m/s) for Type 1 C (Figure 8b,c). However, in Type 1 W, the wave-shaped rim seal model, the peak Pave,static (≈ 207.36 Pa) formed near the ridge of the wave shape (ζ = 0.5) where the lowest Vave,cir (≈ 22.56 m/s) was formed, whereas the lowest Pave,static (≈ 119.39 Pa) and highest Vave,cir (≈ 26.77 m/s) were formed in the trough (ζ = 0, 1) (Figure 8b,c).
In summary for Type 1 W, the rotation of the rotor disk in the radial seal is the main driver of the flow, and the greater the distance from the rotor disk, the lower the Vave,cir. Therefore, near the ridge region with the wide radial gap of the wave-shaped rim seal, it forms a lower flow velocity than the velocity of the trough region, which causes the formation of high pressure near the ridge and low pressure near the trough. For Type 1 models, it is shown that the pressure distribution in the radial seal (Figure 6) can be controlled/designed. The rim seal prevents egress and ingress flows (Figure 1), and the pressure distribution downstream of the stator vane is strongly related to egress and ingress flows (Figure 1b). By controlling the pressure distribution in the radial seal through the wave-shaped rim seal geometry, it is expected that the egress and ingress flows can also be controlled.

3.2. Type 2 (with Blade and Vane)

Type 2 models include the stator vane and rotor blade geometries, and thus, exhibit fluid dynamic effects on egress and ingress flows. This section describes how the wave-shaped rim seal contributes to improving the sealing effect by reducing the egress and ingress flows. First, the Type 2 C model (conventional rim seal with blade and vane) was validated by comparing the simulation results with the referenced experimental result [24]. The absolute pressure (Pabs) distributions at the endwall 1 mm downstream of the stator vane (red point, Figure 9a(i)) and a point 186.95 mm from the axis of rotation (Figure 9a(i), blue point) were calculated. The calculated data at the red and blue points in Figure 9a(i) are plotted in ii and iii, respectively. In the referenced experimental result [24], asymmetric variations and uniform pressures were observed in the mainstream path and wheelspace, respectively (Figure 9a(ii)). Since these two different pressure distribution patterns significantly influence the development of ingress and egress flow near the rim seal [2], these two pressure patterns were simulated and analyzed in our CFD models (Figure 9a(iii)). The referenced experimental results show that the peak of the pressure distribution in the mainstream path was measured at ζ = 0.53 near the stator vane trailing edge, and the pressure intersection point of the two pressure patterns was observed at 0.33 < ζ < 0.4 and 0.66 < ζ < 0.73 (Figure 9a(ii)). In the CFD model, the peak pressure in the mainstream path was located at ζ = 0.56, and the points at which the two pressure patterns intersected were observed at ζ = 0.33 and ζ = 0.68, which are similar to the experimental results. However, there is a discrepancy in the pressure values predicted from the CFD model and the referenced experimental data. This is due to the inevitable inaccuracies that occur during the extraction of the stator vane and rotor blade geometry from reference [24] as described in Materials and Methods. Nevertheless, the observed pressure distribution trends of the CFD model are consistent with the experimental results, which supports the results and claims of this study.
Another important observation factor, the sealing effectiveness (εc) of CO2 gas, is determined by the following equation [23]:
εc = (ClCh)/(CcCh)
where εc is the sealing effectiveness, Cl the local mass fraction of CO2, Ch the mass fraction of CO2 at the mainstream flow inlet, Cc the mass fraction of CO2 at the coolant flow inlet. According to the radial position (r/R; r is the radial distance from the axis of the turbine and R is the disk radius) of the stator disk, both the experimental and CFD results show a similar tendency that εc decreases as the coolant passes through the inner seal (r/R = 0.78) and approaches the mainstream path (Figure 2b). Pressure distribution and sealing effectiveness comparisons exhibit a similar tendency in the CFD and experimental results.
The pressure distribution near the radial seal in the Type 2 models is considerably different from that in the Type 1 models because the mainstream flow passing the rotor blade and stator vane creates a disturbed pressure profile. Pressure patterns in the wheelspace are affected by the pressure distribution near the leading edge of the rotating rotor blade; this is observed at an interval of 4° rotation (= 8 time steps) of the rotor part (Figure 10a–c). During this process, the wave-shape geometry plays an important role in determining the pressure contours in the wheelspace. In detail, in the region of the Type 2 C radial seal, at Planes 1–3 (defined as in Figure 6c), the migration of pressure distribution was observed through the static pressure contour (Figure 10a–c(i)). The low pressure region represented by a white star migrated in the direction of rotation, and the next low pressure region (white point in Figure 10c(i)) was revealed after the existing low pressure (white star in Figure 10c(i)) had almost passed. A high-pressure region was formed between the two low pressure regions represented by the white circle and the star (Figure 10c(i)). Further, it is observed that the pressure profile shifted in Type 2 W, and near the ridge of radial seal, alternating high pressure and low pressure formed with a period corresponding to the rotation of the rotor blade (high pressure–Figure 10a(ii); low pressure–Figure 10b(ii); and high pressure–Figure 10c(ii) were found at the ridge). When the high pressure passed near the radial seal ridge (Figure 10a), in Plane 3, the area represented by a dashed line (> −1.4 × 10⁻³ Pa) for Type 2 W (Figure 10a(ii)) was formed larger (15.4%) than that in Type 2 C (Figure 10a(i)); the area for Type 2 W and Type 2 C was 0.15 × 10⁻³ and 0.13 × 10⁻³ m2, respectively. When the low pressure passed near the radial seal ridge (Figure 10b), in Plane 3, the area represented by a dashed line (< −2.1 × 10⁻³ Pa) for Type 2 C was 4.49 × 10⁻⁵ m2 (Figure 10b(i)), while the whole area (of Plane 3) was greater than −2.1 × 10⁻³ Pa for Type 2 W (Figure 10b(ii)). In Figure 10c, the high pressure passed near the ridge of wave shape again; the area marked with a dashed line (> −1.4 × 10⁻³ Pa) for Type 2 W was 4.55 × 10⁻⁵ m2 (Figure 10c(ii)), while the whole area (of Plane 3) was below −1.4 × 10⁻³ Pa for Type 2 C (Figure 10c(i)). In summary, it is thus confirmed that the mainstream interplay changes the overall pressure profile near the rim seal; however, the increase in pressure near the ridge of the wave-shape geometry is constantly observable in both Type 1 W and Type 2 W. Therefore, the wave-shaped rim seal geometry contributes to the pressure profile by enhancing the performance of the rim seal.
The new pressure distribution profile created by the wave-shaped rim seal has the beneficial effect of decreasing the egress and ingress flow. Egress and ingress flow occur at the interface between the mainstream region and wheelspace owing to the pressure difference. For Type 2 W, the modified pressure field in the radial seal weakens the strength of the egress and ingress flow. The radial velocity component of egress and ingress flows, Veg and Vin, in the interface between the mainstream path and wheelspace, respectively, were measured, while the rotor blade rotated by 16° (933rd–965th time steps in the simulation), which is equivalent to the approximate periodic angle (360/22°) (Figure 10d). It should be noted that the maximum values of Veg (; Vmax,eg) and Vin (; Vmax,in) change in each time step owing to the location change of the rotor (Figure 10d). Therefore, their averages over the 933rd–965th time steps were used; the detailed reason for using this range of time steps is addressed in the Methods section. The average of Vmax,eg for the 933rd–965th time steps was 38.13 m/s in Type 2 W, which is 1.12% lower than the 38.56 m/s average of Vmax,eg of Type 2 C. The average of Vmax,in for the same time steps was 32.41 m/s in Type 2 W, which is 2.67% lower than the 33.30 m/s average of Vmax,in of Type 2 C. This result means that the egress and ingress flow in Type 2 W is weaker than in Type 2 C. The stability of egress and ingress flow is expressed as the standard deviation of the velocity at each time step. The standard deviation of Vmax,eg was 9.77 in Type 2 C, and 7.21 in Type 2 W. The standard deviation of Vmax,in was 4.81 in Type 2 C, and 4.31 in Type 2 W. Lower standard deviations in Type 2 W imply that the egress and ingress flows are more stable and steady, and that the fluctuation of radial flow in this region is suppressed in Type 2 W. For a representative sample, the comparison of radial velocity contours in the interface is plotted in Figure 10e, which shows the reduction in egress and ingress flow due to the wave-shaped rim seal. The wave-shaped rim seal (Type 2 W) is thus useful to enhance the aerodynamic performance by reducing the egress and ingress flows and unwanted interaction between the mainstream and coolant flows.
The degree of protection of the disk by the coolant flow was measured by comparing the mass fractions of CO2 (CCO2) on the surfaces of the rotor and stator disks for both the Type 2 C and W models (Figure 11a–d) according to the position of the rotor blade at an interval of 4° rotation of the rotor part (i–iv in Figure 11a–d). The CCO2 contour of the rotor disk is described in Region A (near the mainstream path) and Region B (near the rotor radial seal) (marked in Figure 11a(i)). In Region A, the cyan region (0.009 < CCO2 < 0.018 in Figure 11a,b(i–iv)) represents the egress flow path on the rotor disk side. In both Type 2 C and Type 2 W (Figure 11a,b, respectively), the coolant flow joins the mainstream path through the space between the rotor blades, because the high pressure near the leading edge of rotor blade (as shown in Figure 10) prevents the coolant flow from being directed near the leading edge of the rotor blade. Through comparison of the cyan areas between Type 2 C and W in Region A, it was observed that a higher CCO2 distribution was generated in Type 2 C (Figure 11a) than in Type 2 W (Figure 11b); this implies that a stronger egress flow is formed near the rotor disk of Type 2 C. In Region B, the red area (CCO2 > 0.045) is higher for Type 2 W (Figure 11b) than Type 2 C (Figure 11a). Through this comparison of the CCO2 contour patterns of Region B, where the rotor radial seal is located, for Type 2 C and Type 2 W, it was confirmed that the wave-shaped radial seal of Type 2 W improves the degree of protection of the rotor disk from the mainstream flow. This sealing effect improvement also appeared clearly on the surface of the stator disk (Figure 11c,d). In both Region A and Region B on the stator disk (marked in Figure 11c(i)), a higher CCO2 distribution was formed in Type 2 W than in Type 2 C. This also implies that the surface of the Type 2 W stator disk is better protected by the coolant flow than that of Type 2 C (Figure 11c,d). On the inner surface of the stator radial seal (green surface in Figure 2) of Type 2 C, the green region (0.018 < CCO2 < 0.027, Figure 11c) migrated depending on the location of the rotor blade (Figure 11c(i–iv)). However, in Type 2 W, this green region (0.018 < CCO2 < 0.027, Figure 11d) formed near the ridge of the wave-shaped radial seal and maintained its position despite the rotation of the rotor blade (Figure 11d(i–iv)). The change in CO2 concentration distribution in Type 2 W is suppressed compared to that in Type 2 C, in accordance with the above-mentioned results (Figure 10d), which show that the implementation of the wave rim seal has an effect on suppressing the fluctuation of pressure and velocity.
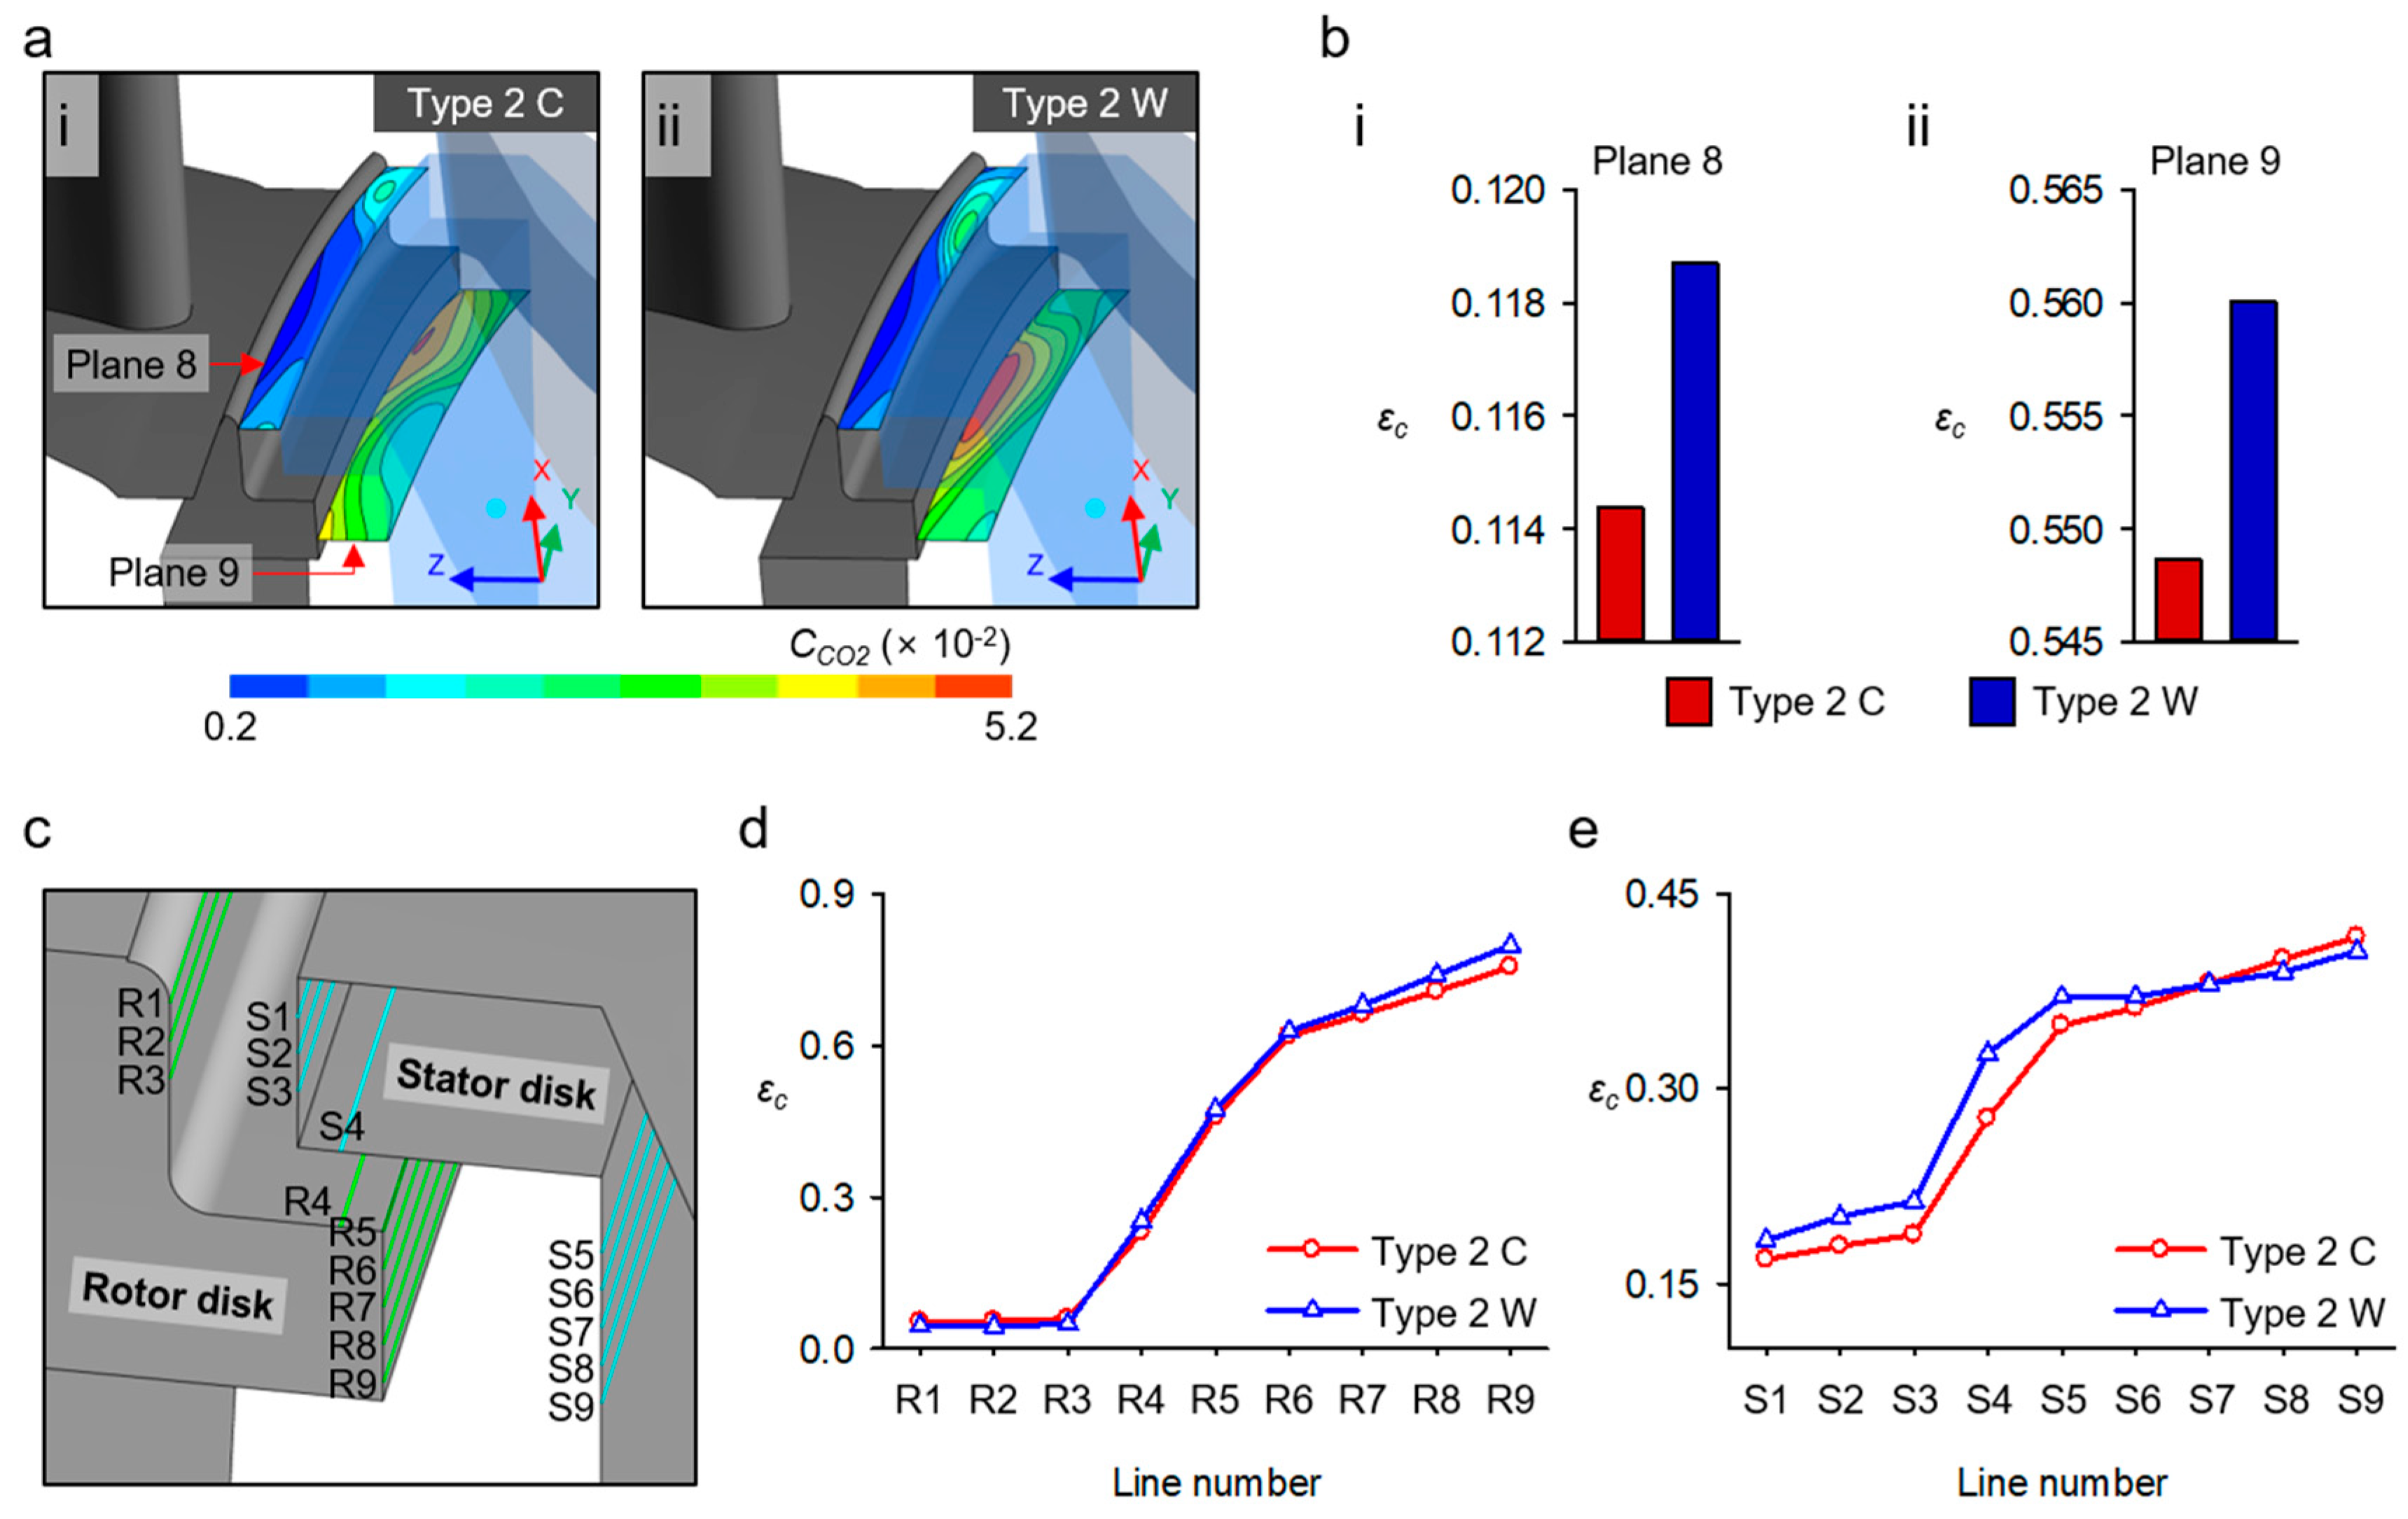
Finally, the sealing effectiveness was quantitatively analysed. In Planes 8 and 9 (marked in Figure 12a(i)), the CCO2 was higher in Type 2 W (Figure 12a(ii)) than in Type 2 C (Figure 12a(i)). The sealing effectiveness in Planes 8 and 9 was calculated by Equation (1) using the average value of CCO2 calculated as the rotor blade rotates by 16° (933rd–965th time steps in the simulation), which is equivalent to an approximate periodic angle of (360/22°) (Figure 12b). Similar to the tendency observed in the comparison of CCO2 contours between Type 2 C and Type 2 W (in Figure 12a), in both Planes 8 and 9, the sealing effectiveness in Type 2 W was found to be higher than that in Type 2 C (Figure 12b). In Plane 8, the sealing effectiveness was 0.114 in Type 2 C and 0.119 in Type 2 W; the sealing effectiveness in Type 2 W was improved by 3.8% compared to Type 2 C (Figure 12b(i)). In Plane 9, the sealing effectiveness was 0.549 in Type 2 C and 0.560 in Type 2 W; the sealing effectiveness in Type 2 W was improved by 2.09% compared to Type 2 C (Figure 12b(ii)). An additional analysis was performed to quantify the coolant flow effectiveness in the rim seal space; the lines of R1–9 (green lines on the rotor disk in Figure 12c) and S1–9 (cyan lines on the stator disk in Figure 12c) were used to calculate εc on the walls of the rotor and stator disks. The average CCO2 values of the 933rd–965th time steps were used again for this analysis. On the rotor disk, in both Type 2 C and Type 2 W, it was observed that the sealing effectiveness was increased by the radial seal, and this tendency also appeared on the stator disk (Figure 12d,e). However, in R4–9 on the rotor disk, the sealing effectiveness of Type 2 W was higher than that of Type 2 C, and the difference in sealing effectiveness between Type 2 C and Type 2 W increased gradually with distance from the mainstream path (Figure 12d). R9 shows the biggest difference, where the sealing effectiveness in Type 2 W improved by 5.7% compared to Type 2 C. On the stator disk, the improvement in sealing effectiveness in Type 2 W was observed in S1–6, near the mainstream path (Figure 12e); this means that the protection of the stator disk by the wave-shaped radial seal in Type 2 W is improved in the region near the mainstream path. S4 shows the biggest difference between Type 2 C and Type 2 W, and the sealing effectiveness in Type 2 W improved by 17% compared to Type 2 C.
In this study, the analysis was performed on two tracks. The Type 1 model, which is the ideal model (no stator and rotor included), useful for understanding the fluid dynamic characteristics of the wave rim seal, was first analyzed to clearly quantify the effect of the wave rim seal. Then a more realistic model, the Type 2 model, with stator vanes and rotor blades included was performed to evaluate the role of the wave rim seal in highly complex unsteady flow caused by the interactions with the rotating stator and rotor blades.

4. Conclusions

In this computational study, a wave-shaped rim seal geometry was proposed for application in stator radial seals. Four rim seal geometries were analysed via CFD to observe the positive effect of the wave-shaped rim seal of the stator side. Two-step sequences of computations were performed; first, to isolate the wave-shape geometry effect on the local flow dynamic change. Type 1 models, in which the stator vane and rotor blade were not included, were simulated to observe the flow around the radial seal of conventional and wave-shape cases. Then, Type 2 models, which include the stator vane and rotor blade, were simulated to show how the wave-shaped rim seal improves its sealing performance. In Type 1 W, flow with high pressure and low velocity was found in the ridge region of the wave-shaped rim seal where the radial gap is maximised, and the faster flow at lower pressure was found in the trough region, where the radial gap is minimised. This pressure distribution near the radial seal of Type 1 W has a similar tendency to the pressure distribution of the mainstream flow (shown in Figure 1b(ii)) formed owing to the wake of the stator vane in the mainstream path of the actual turbine. When the wave-shaped rim seal, which caused the flow phenomenon observed in Type 1 W, was applied to the geometry with the rotor blades and stator vanes (Type 2 W), the radial velocity, i.e., the egress and ingress flow, decreased compared to Type 2 C owing to the change in pressure distribution near the wave-shaped radial seal in the interface between the mainstream path and wheelspace up to 1.12% and 2.67% in the egress and ingress flow, respectively. The CCO2 contour shows that the wave-shaped rim seal geometry induces the coolant flow to better protect the rotor and stator disks and wheelspace. Compared with Type 2 C, Type 2 W has a 5.7% and 17% increase in sealing effectiveness for the rotor and stator disks, respectively.
The proposed wave-shaped rim seal and its positive resultant effect indicate that three-dimensional deformations of the stator radial seal can further improve the sealing effectiveness to control pressure distribution around the rim seal, which is ultimately the overall turbine efficiency. This type of new geometric parameter is useful for future gas turbine design. Further studies on optimising the wave geometric parameters will have better results and a greater impact on the improvement of rim seals.

Supplementary Materials

The following are available online at https://www.mdpi.com/1996-1073/12/6/1060/s1.

Author Contributions

Conceptualization, S.L. and J.Y.P.; Methodology, S.L. and J.Y.P.; Software, S.L. and D.K.; Formal Analysis, S.L. and D.K.; Writing-Original Draft Preparation, S.L.; Writing-Review & Editing, S.L. and J.Y.P.; Supervision, J.Y.P.

Funding

This research was supported by the Korea Institute of Energy Technology Evaluation and Planning (KETEP) funded by the Ministry of Trade, Industry and Energy, Republic of Korea (No.20163010024690), and also supported by the Chung-Ang University Graduate Research Scholarship in 2018 (D.H.K.).

Acknowledgments

The authors would like to thank Senior Researcher Young Sang Kim from Doosan Heavy Industries and Construction for his helpful advice on various aspects of the gas turbine design process.

Conflicts of Interest

The authors declare no conflict of interest.

Nomenclature

CCO2Mass fraction of CO2
CcCoolant flow inlet mass fraction of CO2
ChMainstream inlet mass fraction of CO2
ClLocal mass fraction of CO2
PabsAbsolute pressure, Pa
PstaticStatic pressure, Pa
Pave,staticArea-averaged static pressure, Pa
RDisk radius, m
rRadial distance from rotation axis, m
VcirCircumferential velocity, m/s
Vave,cirArea-averaged circumferential velocity, m/s
VegRadial velocity component of egress flow, m/s
VinRadial velocity component of ingress flow, m/s
Vmax,egMaximum radial velocity component of egress flow, m/s
Vmin,inMinimum radial velocity component of ingress flow, m/s
VradRadial velocity, m/s
εcSealing effectiveness
ζNormalised angle, θ/θp
θAngle, °
θpPeriodic angle, °

References

  1. Razak, A.M.Y. Industrial Gas Turbines: Performance and Operability; Elsevier: Amsterdam, The Netherlands, 2007; ISBN 184569340X. [Google Scholar]
  2. Owen, J.M. Prediction of Ingestion Through Turbine Rim Seals—Part II: Externally Induced and Combined Ingress. J. Turbomach. 2011, 133, 31006. [Google Scholar] [CrossRef]
  3. Batchelor, G.K. Note on a class of solutions of the Navier-Stokes equations representing steady rotationally-symmetric flow. Q. J. Mech. Appl. Math. 1951, 4, 29–41. [Google Scholar] [CrossRef]
  4. Stewartson, K. On the flow between two rotating coaxial disks. In Proceedings of the Mathematical Proceedings of the Cambridge Philosophical Society; Cambridge University Press: Cambridge, UK, 1953; Volume 49, pp. 333–341. [Google Scholar]
  5. Poncet, S.; Chauve, M.-P.; Schiestel, R. Batchelor versus Stewartson flow structures in a rotor-stator cavity with throughflow. Phys. Fluids 2005, 17, 75110. [Google Scholar] [CrossRef]
  6. Owen, J.M.; Pountney, O.; Lock, G. Prediction of Ingress Through Turbine Rim Seals—Part II: Combined Ingress. J. Turbomach. 2012, 134, 31013. [Google Scholar] [CrossRef]
  7. Roy, R.P.; Zhou, D.W.; Ganesan, S.; Wang, C.-Z.; Paolillo, R.E.; Johnson, B.V. The flow field and main gas ingestion in a rotor-stator cavity. In Proceedings of the ASME Turbo Expo 2007: Power for Land, Sea, and Air, Montreal, QC, Canada, 14–17 May 2007; American Society of Mechanical Engineers: New York, NY, USA; pp. 1189–1198. [Google Scholar]
  8. Zhou, D.W.; Roy, R.P.; Wang, C.-Z.; Glahn, J.A. Main gas ingestion in a turbine stage for three rim cavity configurations. J. Turbomach. 2011, 133, 31023. [Google Scholar] [CrossRef]
  9. Bohn, D.; Wolff, M. Improved Formulation to Determine Minimum Sealing Flow—Cw, min—For Different Sealing Configurations; ASME Pap. No. GT2003-38465; The American Society of Mechanical Engineers: New York, NY, USA, 2003. [Google Scholar]
  10. Eastwood, D.; Coren, D.D.; Long, C.A.; Atkins, N.R.; Childs, P.R.N.; Scanlon, T.J.; Guijarro-Valencia, A. Experimental Investigation of Turbine Stator Well Rim Seal, Re-Ingestion and Interstage Seal Flows Using Gas Concentration Techniques and Displacement Measurements. J. Eng. Gas Turbines Power 2012, 134, 82501. [Google Scholar] [CrossRef] [Green Version]
  11. Teuber, R.; Li, Y.S.; Maltson, J.; Wilson, M.; Lock, G.D.; Owen, J.M. Computational extrapolation of turbine sealing effectiveness from test rig to engine conditions. Proc. Inst. Mech. Eng. Part A J. Power Energy 2013, 227, 167–178. [Google Scholar] [CrossRef]
  12. Wang, C.-Z.; Mathiyalagan, S.P.; Johnson, B.V.; Glahn, J.A.; Cloud, D.F. Rim Seal Ingestion in a Turbine Stage From 360 Degree Time-Dependent Numerical Simulations. J. Turbomach. 2014, 136, 31007. [Google Scholar] [CrossRef]
  13. Phadke, U.P.; Owen, J.M. Aerodynamic aspects of the sealing of gas-turbine rotor-stator systems: Part 2: The performance of simple seals in a quasi-axisymmetric external flow. Int. J. Heat Fluid Flow 1988, 9, 106–112. [Google Scholar] [CrossRef]
  14. Phadke, U.P.; Owen, J.M. Aerodynamic Aspects of the Sealing of Gas-Turbine Rotor-Stator Systems: Part 3: The Effect of Nonaxisymmetric External Flow on Seal Performance. Int. J. Heat Fluid Flow 1988, 9, 113–117. [Google Scholar] [CrossRef]
  15. Bunker, R.S.; Laskowski, G.M.; Bailey, J.C.; Palafox, P.; Kapetanovic, S.; Itzel, G.M.; Sullivan, M.A.; Farrell, T.R. An Investigation of Turbine Wheelspace Cooling Flow Interactions With a Transonic Hot Gas Path—Part 1: Experimental Measurements. J. Turbomach. 2011, 133, 21015. [Google Scholar] [CrossRef]
  16. Palafox, P.; Ding, Z.; Bailey, J.; Vanduser, T.; Kirtley, K.; Moore, K.; Chupp, R. A New 1.5-Stage Turbine Wheelspace Hot Gas Ingestion Rig (HGIR)—Part I: Experimental Test Vehicle, Measurement Capability and Baseline Results; ASME Pap. No. GT2013-96020; The American Society of Mechanical Engineers: New York, NY, USA, 2013. [Google Scholar]
  17. Sangan, C.M.; Pountney, O.J.; Scobie, J.A.; Wilson, M.; Owen, J.M.; Lock, G.D. Experimental Measurements of Ingestion Through Turbine Rim Seals—Part III: Single and Double Seals. J. Turbomach. 2013, 135, 51011. [Google Scholar] [CrossRef]
  18. Popovíc, I.; Hodson, H.P. Improving turbine stage efficiency and sealing effectiveness through modifications of the rim seal geometry. J. Turbomach. 2013, 135, 61016. [Google Scholar] [CrossRef]
  19. Moon, M.-A.; Lee, C.-S.; Kim, K.-Y. Effect of a rib on rim seal performance. Int. Commun. Heat Mass Transf. 2014, 59, 130–135. [Google Scholar] [CrossRef]
  20. Scobie, J.A.; Teuber, R.; Li, Y.S.; Sangan, C.M.; Wilson, M.; Lock, G.D. Design of an improved turbine rim-seal. J. Eng. Gas Turbines Power 2016, 138, 22503. [Google Scholar] [CrossRef]
  21. Sangan, C.M.; Scobie, J.A.; Owen, J.M.; Lock, G.D.; Tham, K.M.; Laurello, V.P. Performance of a finned turbine rim seal. J. Turbomach. 2014, 136, 111008. [Google Scholar] [CrossRef]
  22. Liu, D.; Tao, Z.; Luo, X.; Wu, H.; Yu, X. Development of a new factor for hot gas ingestion through rim seal. J. Eng. Gas Turbines Power 2016, 138, 72501. [Google Scholar] [CrossRef]
  23. Li, J.; Gao, Q.; Li, Z.; Feng, Z. Numerical Investigations on the Sealing Effectiveness of Turbine Honeycomb Radial Rim Seal. J. Eng. Gas Turbines Power 2016, 138, 102601. [Google Scholar] [CrossRef]
  24. Balasubramanian, J.H. Experimental Study of Main Gas Ingestion and Purge Gas Egress Flow in Model Gas Turbine Stages; Arizona State University: Tempe, AZ, USA, 2010; ISBN 1124359184. [Google Scholar]
Figure 1. Schematics of the flow phenomenon around the rim seal and the concept of wave-shaped rim seal: (a) Flow phenomenon near the rim seal; (b) Pressure differences causing the egress and ingress flow. (i) Velocity profile of the mainstream flow; (ii) Pressure differences between the mainstream flow and coolant flow, and the expected effect of the wave-shaped rim seal; (c) Schematic view of the wave-shaped rim seal.
Energies 12 01060 g001
Figure 2. Schematics of geometries: (a) Computational domain of Type 1 and Type 2; (b) Dimensions of wheelspace; (c) front view of wheelspace; (i) the conventional rim seal and (ii) the wave-shaped rim seal; (d) inner surface of stator radial seal (green surface) of Type 1; (i) conventional rim seal and (ii) wave-shaped rim seal; (e) inner surface of stator radial seal (green surface) of Type 2; (i) conventional rim seal and (ii) wave-shaped rim seal.
Energies 12 01060 g002
Figure 3. Computational grid. Grid for wheelspace of: (a) Type 1 C and (b) Type 1 W; (c) Enlarged view of grid for radial seal of Type 1 C; (d) Total view of grid for Type 1 and Type 2.
Energies 12 01060 g003
Figure 4. Grid independence test. Line 1 is located 186.95 mm from the axis of rotation on the stator disk region of Type 1 W.
Energies 12 01060 g004
Figure 5. Monitoring of the area average mass fraction of CO2 in green coloured plane to confirm flow stability for (a) Type 1 C and (b) Type 2 C.
Energies 12 01060 g005
Figure 6. Static pressure distribution near the radius of the Type 1 wheelspace. (a) Static pressure contour of stator disk. (i) Type 1 C. (ii) Type 1 W. (b) Static pressure distribution along Line 2 (green point) on the inner surface of the stator radial seal. (c) Position of (i) Plane 1, (ii) Plane 2 and (iii) Plane 3. (d) Static pressure contour in (i) Plane 1, (ii) Plane 2, and (iii) Plane 3 of Type 1 C. (e) Static pressure contour in (i) Plane 1, (ii) Plane 2, and (iii) Plane 3 of Type 1 W.
Energies 12 01060 g006
Figure 7. Circumferential velocity contour in wheelspace of Type 1. (a) Locations of Planes 4, 5, 6, and 7. (b) Circumferential velocity contour in wheelspace of Type 1 C in (i) Plane 4, (ii) Plane 5, (iii) Plane 6 and (iv) Plane 7. (c) Circumferential velocity contour in the wheelspace of Type 1 W in (i) Plane 4, (ii) Plane 5, (iii) Plane 6 and (iv) Plane 7.
Energies 12 01060 g007
Figure 8. Numerical results of static pressure and circumferential velocity in the radial seal region. (a) Measuring plane position; (b) Static pressure distribution; (c) Circumferential velocity distribution.
Energies 12 01060 g008
Figure 9. (a) Absolute pressure distribution. (i) Pressure measurement point of mainstream path (red point) and wheelspace (blue point). (ii) Absolute pressure distribution of experiment [24]. (iii) Absolute pressure distribution of CFD. (b) Sealing effectiveness along the mid-line (green line) of the stator disk.
Energies 12 01060 g009
Figure 10. (ac) Static pressure contours near the radial seal according to the rotation of the rotor blade. (i) Type 2 C. (ii) Type 2 W. (d) Reduction in egress and ingress flow due to the wave-shaped rim seal. (i) Average values of Vmax,eg. (ii) Average values of Vmax,in. (iii) Standard deviations of Vmax,eg. (iv) Standard deviations of Vmax,in. (e) Radial velocity contour at the interface between the mainstream path and wheelspace.
Energies 12 01060 g010
Figure 11. Contour of CCO2 on the surface of the rotor disk of (a) Type 2 C and (b) Type 2 W, and the stator disk of (c) Type 2 C and (d) Type 2 W.
Energies 12 01060 g011
Figure 12. (a) Contour of CCO2 in Plane 8 near the mainstream path, and Plane 9 located adjacent to the rotor radial seal in the wheelspace; (i) Type 2 C and (ii) Type 2 W. (b) Comparison of sealing effectiveness between Type 2 C and Type 2 W in (i) Plane 8 and (ii) Plane 9. (c) Position of R1–9 on the rotor disk and S1–9 on the stator disk. Sealing effectiveness in (d) R1–9 and (e) S1–9.
Energies 12 01060 g012

