1. Introduction
Today, Europe still has a high consumption of fossil fuels, resulting in a dependency on a limited number of countries and in high amounts of greenhouse gas emissions (GHGs) [
1]. Furthermore, annually around €400 billion must be spent in the EU for the import of fossil fuel resources to provide 53% of its energy demand [
1]. These facts suggest a transition in the EU energy sector. The EU heads of state or government agreed on a target of a renewable energy share of at least 27% in Europe by 2030 and EU countries have also agreed on a target of a reduction of greenhouse gas emissions by at least 40% till 2030 compared with 1990 [
1].
To reach these ambitious goals, the potentials of new, renewable, and clean energy sources must be identified and exploited. Nonetheless, the introduction of renewable energies to the current energy system convey several new challenges, of which fluctuation in power production is one of the most pressing issues. Fluctuating wind and solar power have, with hydro power and biomethane, complementary technologies in the renewable energy sector which can decouple energy production and consumption by storing it as kinetic energy in pumped-storage power plants or as biochemical energy e.g., in the gas grid, respectively.
Within these, biomethane (or upgraded biogas) is a gaseous energy carrier, which can be produced from various types of biomass such as energy crops, organic residues, solid organic waste, wastewater, or excrements in biochemical or thermochemical conversion processes. It allows the extremely flexible use as potentially carbon dioxide neutral fuel in the transport sector or as alternative energy carrier with high energy density in the natural gas grid for the production of electrical and thermal energy e.g., in combined heat and power plants. In the future, biomethane can play a growing role in the energy and transport system in Europe and worldwide, due to its positive effects on sustainable and flexible power provision. The unique selling point of biomethane from biochemical conversion processes (anaerobic digestion) is, beside the power or transport fuel generation by using e.g., agricultural residues, the additional option to close biological cycles with the simultaneous fertilizer production from the digestate.
The primary production of biogas in the European Union (data partly estimated) rose from approximately 2.2 Mtoe in 2000 to 16.1 Mtoe in 2016 [
2]. Some authors state that the primary production of biogas in the EU could be increased to 28.8–40.2 Mtoe in 2030 depending on the amount of feedstock deployed and the learning effects achievable [
3]. This means, up to 13.8% of the 27% renewable energy sources target set for 2030 could be generated from biogas [
3]. Nevertheless, several barriers have to be overcome to reach these ambitious EU targets, as (a) the fact that development of renewable energy in general and biogas/biomethane energy in particular is not recognized as a factor within the Act on Energy Efficiency when forecasting energy demand, (b) inefficient support schemes and follow-up regulations (prevention of shut-down of biogas plants after the end of support programs), (c) uncertainties of future perspectives, (d) often no market for the produced heat on decentralized sites and (e) unfavorable taxation policy and administrative processes for biomethane as a fuel in the transport sector in some countries [
3].
Beside the political framework, new research efforts are needed to gain a noticeable cost reduction for biogas upgrading to biomethane [
4]. This is particularly the case for small-scale technologies, which are scarce because of economic drawbacks due to the frequent inability to scale down existing technologies. Hence, supplementary to large-scale technologies, novel small-scale biogas plants—including upgrading solutions—at reasonable prices must be provided and promoted to tap the spatially distributed potentials of organic wastes or residues, e.g., in the agricultural or food production sectors.
The objective of this study was to identify and to assess innovative, small-scale, and not-yet-market-ready technologies along the whole biomethane process chain, starting from substrate pre-treatment, continuing with anaerobic digestion to the upgrading of biogas to biomethane. This means, a technology readiness level (TRL) between 3 and 7 according to the EC definition [
5] was chosen for this assessment. Not only innovative technologies had to be identified, but also indicators for their assessment had to be found in the frame of this work. For this purpose, recently (2016–2018) available data regarding technical, economic and ecological facts about the different small-scale technologies were collected via questionnaires (“Technical Descriptions”) which were filled in close cooperation with the manufactures/technology developers. The evaluation was done solely by the researchers, independently from the developers (data providers) but on the base of their data. More details about the data quality will be given in
Section 2.1. Own practical investigations of all small-scale technologies would have been not feasible in the frame of this study. In different countries, there are different interpretations of “small-scale”. In this context, small-scale was defined in general as less than 200 m
3 raw biogas (Standard Temperature and Pressure, 273.15 K, 101,325 Pa) per hour. Above this scale biogas upgrading to biomethane is more common and economically viable but below this scale biomethane production plants usually show significantly higher upgrading costs [
6]. This comprehensive overview and assessment of present European small-scale, innovative, and non-market-ready technologies for the production of biomethane is an absolute novelty.
2. Materials and Methods
Suitable technologies for the assessment within this study were identified as part of the project Record Biomap via existing contacts, at trade fairs and conferences, through internet research, scientific articles, and personal contacts. For the assessment different indicators were determined. Depending on the type of technology and the availability of data it was decided to structure the assessment into technical, economic, and ecologic indicators, which are described in more detail in the following sub-sections.
The technology assessment includes the three different technology steps: (i) pre-treatment of substrates prior to the biogas process, (ii) anaerobic digestion and (iii) upgrading of the biogas to produce biomethane. Only small-scale technologies, in general with an estimated production of gas less than 200 m3 (Standard Temperature and Pressure) per hour, were included in this study.
For all three technology steps a template for a detailed “Technology Description” was developed which was used for the collection of information and data on the technologies. Where possible, the templates were kept similar for all three steps and differ only for technology specific issues which are unalike for the different steps. Technology developers which were working on small-scale pre-treatment, digestion, or upgrading technologies within the TRL level in the project focus (TRL 3–7) were contacted. Most technology developers have agreed to provide data for their technologies and completed the technology description template. It was possible to obtain the relevant data for most technologies; however, not all data could be gathered because it was either not available or the technology developer has chosen not to disclose all information. The self-developed and filled technology descriptions are available in open access on the author’s project website (
www.biomethane-map.eu), as
Supplementary Materials. Those data form the basis for the assessment as described in this paper.
There are some challenges associated with the assessment of innovative technologies which are still in development and yet not available on the market. One of those challenges is the different development status (TRL) of the assessed technologies, which complicates the comparison. Here, the TRL of the assessed technologies ranges between 3 and 7. TRL 3 stands for “Experimental proof of concept” and TRL 7 stands for “System prototype demonstration in operational environment”, according to the EC definition [
5]. In addition, the data were provided on a different basis. For some technologies it was possible to obtain the data based on the current TRL, for other technologies data were provided based on a future market-ready stage of the technology (either based on test runs of the current technology or, if this was not possible, based on an estimate for the market-ready stage).
Especially for technologies which are currently at an early stage of development not all data were provided, and it is furthermore assumed that for these technologies the data quality is quite uncertain. In addition, when the individual technologies will reach market readiness in the future, they might have improved parameters which makes it challenging to evaluate technologies of these early stages of development.
The technology steps were evaluated separately in this study and were not put together to form (theoretical) value chains, because of the numerous possible combinations due to the three steps and various technologies, which also might not be combinable in practice. The technologies are all different in terms of size and type of substrates for pre-treatment and for digestion technologies. For upgrading of biogas, the technologies are divers in pressure levels, gas qualities etc. and have specific requirements. The results that are obtained by evaluating the single technologies can be used for individual considerations when those are put in relation to existing systems.
The upgrading technologies included in the assessment are mainly technologies which separate the produced biogas, predominantly consisting of CH4 and CO2, into those two fractions. However, regarding current research attempts, it was decided to include two technologies following the power-to-gas (PtG) approach, which can use the biogas as an input stream and convert the carbon dioxide in the biogas to additional methane by adding hydrogen. It is assumed that the hydrogen for the PtG is produced via electrolysis from excess electricity (e.g., from wind power) and reacts with the carbon dioxide to methane. The use of those technologies, namely the processes “Biological Methanation” and “Trickle-bed reactor for methanation”, will lead to the production of additional biomethane compared to the methane content that was included in the biogas stream. They are therefore not directly comparable to the other upgrading technologies.
2.1. Technical Indicators
For all three technology steps (i–iii), the electricity and heat demands were assessed, as those represent the main energy input. For pre-treatment, besides to the energy demand of the technologies, the increase in biogas production was part of the assessment. For the upgrading technologies, the methane content of the produced biomethane, the methane slip and the delivery pressure (product gas pressure of the technologies) were selected in the assessment as technical indicators. The methane slip is the amount of methane which is emitted into the atmosphere due to leakages and within the off-gas of the upgrading unit.
Another aim within the assessment was to highlight the R&D needs of the different technologies as well as any advantages and to what extend self-maintenance by the farmer/operator of the installation would be possible. This information is also included in the technology descriptions. Additionally, when the data were collected,
supplementary information regarding special application areas and bottlenecks of the technology was provided by the expert who collected the data from the technology developer via phone survey, direct contact, or email communication.
Additionally, the information which makes each technology particular was qualitatively assessed so that it may reach a greater target group (i.e., potential end users of the technologies gathered). Each of the technologies found in the research, shared qualitative information beyond the indicators presented before. This information was part of the technology descriptions and included parts such as: under which conditions is the technology application ideal, does it use wet or dry substrate, or also under which temperatures does the technology perform the best, among many other-challenging to assess-factors. These particularities are at the same time the biggest strength, and the Achilles heel of the technologies found.
This information was qualitatively assessed via expert’s opinion—from the research institutes and within the authors of this paper. The assessment was based on the relevance of each technology for a plausible end user, and organized using a mind mapping tool. The results are displayed in
Appendix A. Additional information for the different technologies are included in tabular form in
Section 3.1 and
Appendix B.
2.2. Ecologic Indicators: Calculation of GHG Emissions
Here, the objective was to choose an indicator for the technologies which allows an ecological assessment of all three (i–iii) technology steps. Taking into account the available data and limited resources, it was decided to focus on the GHG emissions associated with the application of the different technologies within the value chain. This means that, e.g., the GHG emissions related to the substrate for biogas production and the logistics are not included. The calculation of GHG emissions was therefore based on the electricity and heat demand of the technologies, which represent the main energy inputs [
7]. Additives or chemicals were not taken into account in the GHG-calculation as quantitative data for both were not available and emission factors are mostly lacking [
8]. For the upgrading technologies, data for the methane slip were included. Due to the early stage of development of most of the assessed technologies, reliable data was hard to obtain and data on these factors are very vague.
The GHG emissions related to each process step (e.g., in kg
CO2-eq/m
3) were calculated by multiplication of the specific value for electricity and heat demand (e.g., in kWh/m
3) with the respective emission factor (e.g., kg
CO2-eq/kWh). It was assumed that electricity would be taken from the grid and heat would be supplied from a wood chip boiler. The emission factor for the EU-electricity mix was taken from [
9], for heat provision it was based on [
8]. For the upgrading technologies, the methane slip was considered and multiplied with the global warming potential for methane provided in [
9].
The GHG emissions related to the demand for electricity and heat (and related to the methane slip in case of upgrading) were summed up to indicate the technology related emissions. These results do not include any emissions from the substrate, nor any upstream or downstream technologies. However, the results can be used to relate the technologies with each other and give an indication for the contribution of the technologies to GHG emissions (or the possibility for emission reductions).
2.3. Economic Indicators
Economic indicators were only calculated for the upgrading technologies. It was decided not to present economic indicators for the pre-treatment as well as the digestion technologies because the data quality for these steps was lower. The reason for this is that those technology steps in our assessment consist of lower TRL-technologies with sometimes very low flow rates. Those data would lead to an imbalanced cost structure, which is not representative for the expected further development of the technologies until market readiness. As cost data were not available for all upgrading technologies, only technologies with available data sets are included in the economic assessment.
The assessment of economic parameters is based on the annuity method according to VDI 2067 [
10] For the calculation, 2016 was chosen as the base year. Further economic parameters and assumptions are stated in
Table 1.
Consumption-related cost includes costs for utilities such as heat, electricity, chemicals, and other substances. For all technologies, only heat and electricity were relevant. Consumption-related costs were calculated using the energy demands and assuming an average price for electricity and heat. An average price for electricity for the industry in Europe during 2015 was taken from [
11]. The average heat price for Europe is based on the year 2015 and taken from [
12].
Operation cost entails maintenance cost (including spare parts and staff for maintenance), personnel cost excluding maintenance, insurance cost, and unforeseen cost. Personnel costs were derived from the staff requirement obtained from the description and multiplied with average costs per hour assumed with 25 €/h. Maintenance costs were provided in the technology description or, if not provided, were assumed to be 2% of the capital costs.
Specific capital costs were provided in the technology descriptions excluding project development, planning, permission, and additional building costs. To take those costs into account as well, a percentage of 10.5% was applied to all capital costs. This percentage was derived from [
13]. Costs for land are not included. The life time of the technologies is between 10 and 20 years and is specified in the technology descriptions. As the upgrading costs were calculated applying the annuity method it is possible to compare technologies with different life times.
The objective of the economic assessment was to give an indication of the costs for the biogas upgrading process step. Hence, it does not represent the full costs for biomethane production. The costs of producing the biogas are not included because the aim is to show the performance of the upgrading technologies. Costs for biogas production largely depend on the substrate, logistics, and digestion technology and were therefore not included here. Capital costs for the biogas upgrading were included via annuity calculation and all other costs (annual costs for electricity, heat, staff, maintenance, etc.) were incorporated using a price-dynamic annuity factor. Finally, total yearly costs divided by the raw biogas throughput gives the upgrading costs in €ct/kWh (related to raw biogas) for the individual upgrading technologies.
The technologies “Biological Methanation” and “Trickle-bed reactor for methanation”, are not included in the cost calculation and were only considered for the technical indicators, because, as explained earlier, they use excess electricity to convert the carbon dioxide in the biogas into additional biomethane by adding hydrogen. Therefore, their biomethane production is higher than the biomethane that was contained in the biogas which means that the specific costs presented in €ct/kWh would not be comparable to the other upgrading technologies.
2.4. Reference Technologies
For all three technology steps a reference was defined based on average data of large-scale, market-ready technologies. The reference technology was chosen from Germany due to the fact that larger-scale technologies of this type are already widely established there. Due to the difference in scale and maturity, the data of the reference cannot be directly compared, but it shows the current average performance from larger-sized, and market-ready technologies.
The value for the reference was included in the respective figures in this paper, e.g., for electricity and heat demand, GHG emissions, maximal increase in biogas production (for pre-treatment), methane content, methane slip, delivery pressure and upgrading costs (for upgrading).
The reference for the pre-treatment technologies was calculated based on unpublished data for a selection of mechanical pre-treatment technologies (e.g., cutting mill, hammer mill, extrusion) with an average flow rate of 15.45 Mg/h and a range from 0.5 to 100 Mg/h. For digestion technologies, the reference was calculated based on data from [
14]. From this, the 700 m
3/h biogas plant was selected as a continuous stirred-tank reactor digesting renewable raw material (60% maize silage, 40% pig manure). The reference for the upgrading technologies was also obtained based on data published in [
14]. For this, an average of the published data for the biogas upgrading plants with a capacity of 700 m
3/h of raw gas (including 2 Pressure-Swing-Adsorption technologies, 1 membrane technology, 1 Polyglycol scrubber, 1 Amine scrubber, 2 pressured water scrubbing technologies) was calculated.
For assessing the GHG emissions of the upgrading technologies, those were compared to natural gas used as biofuel. The emissions associated with natural gas were based on the fossil fuel comparator of 94 g
CO2-eq/MJ (338.4 g
CO2-eq/kWh = 3.38 kg
CO2-eq/m
3)) taken from [
15].
As the investment cost for the reference technologies was given based on the year 2012, the Kölbel/Schulze Index as a price index for the chemical industry published in [
16] was applied for a calculation of capital cost for the year 2016.
3. Results
The results of the technical, ecological, and economical assessment for the three different technology steps: pre-treatment of substrates, anaerobic digestion, and upgrading of biogas to biomethane are shown and discussed in the following sub-chapters. All data for biogas or biomethane in m
3 are standardized (Standard Temperature and Pressure, 273.15 K, 101,325 Pa).
Table 2 shows which assessment was carried out for the technology steps.
3.1. Technical Assessment
In this study, the energy demand represents one key indicator for the technical assessment of the various technologies along the biomethane production chain and for the comparison between the single steps. Especially the electrical energy and—where applicable—the thermal energy demand could be provided by the technology developer in this early TRL of 3 to 7. Other indicators of the technical assessment were specific to the individual technology step.
3.1.1. Substrate Pre-Treatment
There were several studies e.g., on biological, chemical, or physical pre-treatment conducted in the past, mostly in lab-scale. In contrast, the focus of this study is on innovative up-to-date units still under development for full scale but at the lower end. Hence, a limited number of new methods were found.
One biological and six physical pre-treatment technologies were identified within the defined limits of TRL 3 to 7. Not all the technologies assessed provided the requested complete data set.
Table 3 gives an overview of the selected data of the pre-treatment technologies.
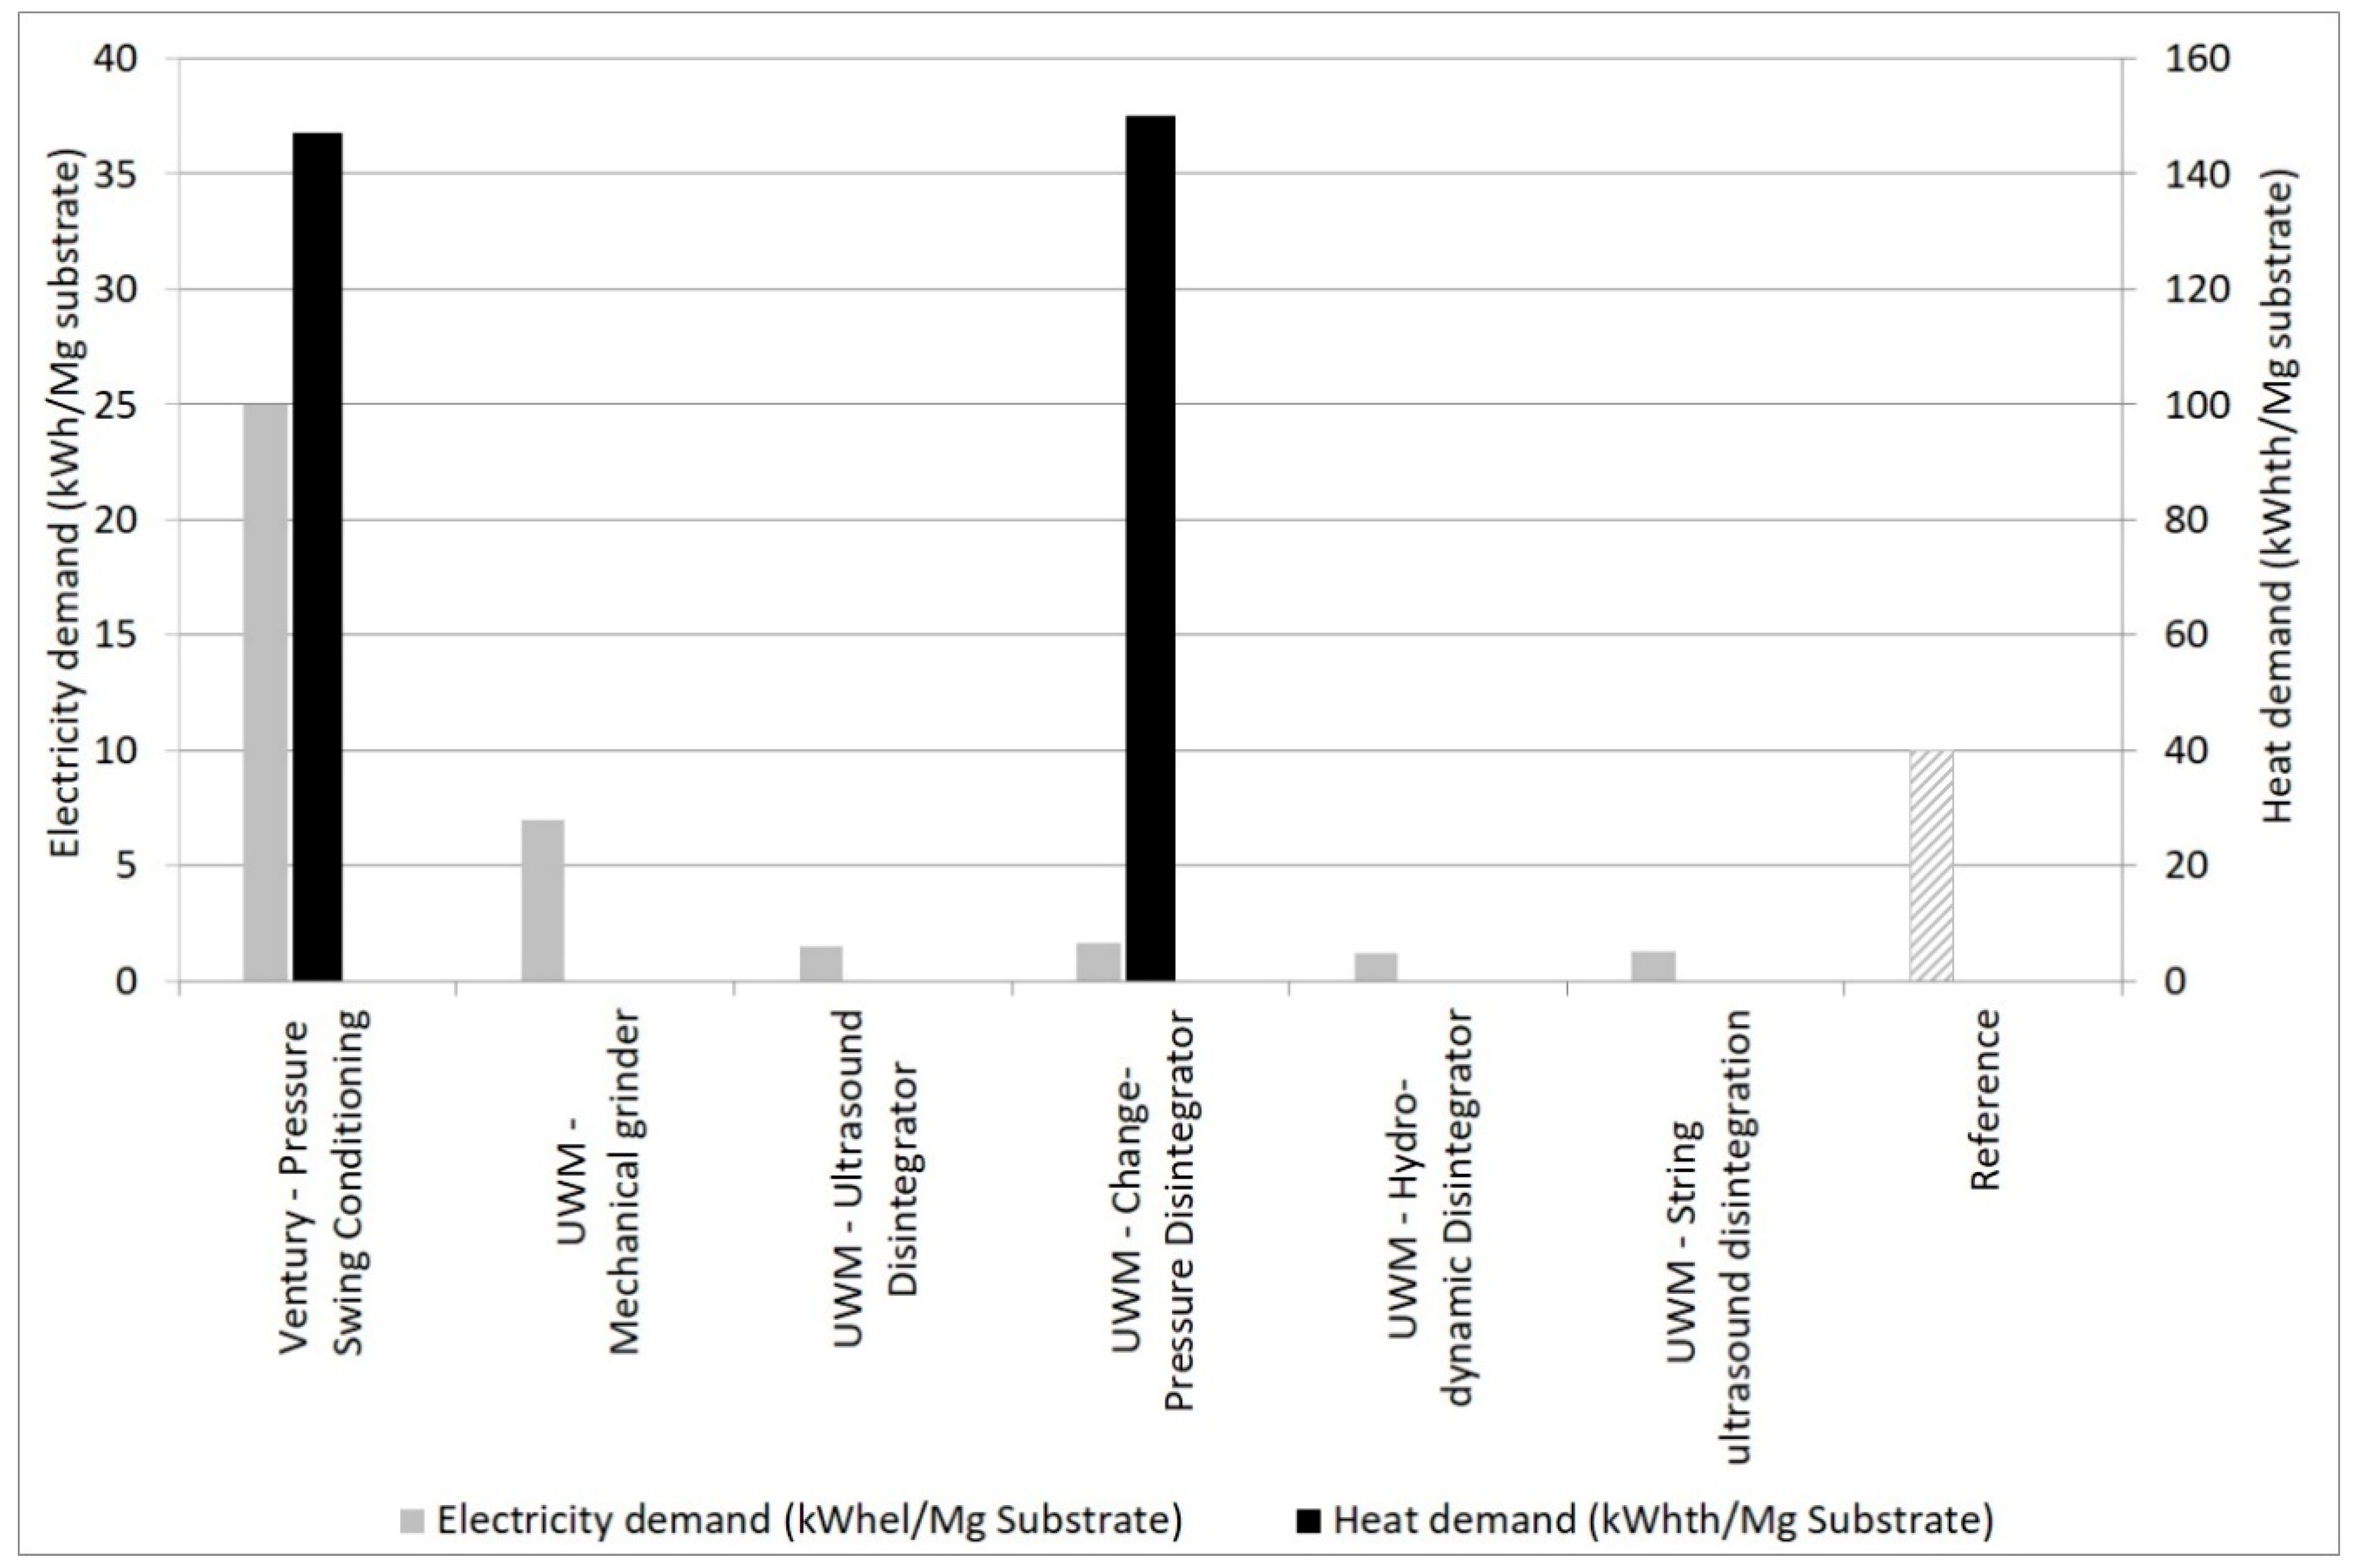
Figure 1 visualizes their specific demand of electricity between 1.2 and 25 kWh
el/Mg substrate (fresh matter), and—where applicable—the demand of heat of 147 and 150 kWh
th/Mg substrate. Hence, without heat recovery these technologies could be inefficient for wet substrates. For example, the energy content of cattle slurry in the biogas process is 140 kWh/Mg substrate (14 m
3/Mg FM [
17]) and of barley straw 1979 kWh/Mg substrate (228 mL/g VS [
18]), respectively.
The flow rate of the selected pre-treatment technologies ranges from 0.012 to 1 Mg/h fresh matter and is comparably low regarding the reference with 15.45 Mg/h. From all considered technologies, the hyperthermophilic fermentation and the pressure swing conditioning are the only ones, which are not limited to one size class, according to developer’s data. The possible range for upscaling for the other technologies is between 0.2 and 1 Mg/h.
Both pre-treatment technologies using pressure changes as their main tool consume more energy than all others. The uniqueness of these technologies, using pressure and heat, imply that they are more feasible with the presence of excess heat in a market-ready stage, or for a demonstration setup. Conversely, this means that if the biogas plant site is lacking excess heat, or is missing a convincing concept of heat recovery, these technologies are rather not recommendable. All other pre-treatment technologies show a much lower electricity or heat demand, including the reference.
The electricity demand of the reference for the pre-treatment technologies was calculated based on unpublished data for a selection of large-scale mechanical pre-treatment technologies with an average flow rate of 15.45 Mg/h fresh matter and is on a slightly higher level than the mechanical grinder.
Just one of these technologies requires, besides a high heat demand, additional large inputs of electricity. However, it offers the largest improvement in biogas production, see below in
Figure 2. Every other investigated technology requires notably less electricity per Mg substrate. The difference in energy consumption is partly a result of the characteristic of the substrate, which can be treated. The ultrasound technology types e.g., are only suitable for liquid substrates, see dry-matter content in
Table 2.
Figure 2 represents the increase on biogas production for all assessed pre-treatment technologies compared to untreated substrate according to the data of the technology developers. The pre-treatment technologies presented values between 14% and 30% increase of biogas production (for one technology an increase of up to 100% was stated). These values are subject to the type and the physical-chemical conditions of the substrates used on each of the technologies as well as their individual references. Additionally, the digestion system coupled to pre-treatment, and its underlying factors such as hydraulic retention time, have a direct influence on the resultant increase in biogas production. Therefore, the increase in biogas production of the pre-treatment technologies depends on many other variables. These variables (i.e., substrate and digestion system) determine the feasibility of implementing these technologies on a market-ready stage, or a demonstration project. Nevertheless, even if their TRL is below 9 and they are small scale, most of the pre-treatment technologies show a comparable increase in biogas production to the large-scale reference, except Pressure Swing Conditioning by Ventury which shows an outstanding high increase.
3.1.2. Anaerobic Digestion
The research for small-scale digestion technologies with a TRL between 3 and 7 revealed 13 digester systems. Most of them can be used for substrates with dry-matter contents of up to or above 10% of the fresh matter.
Table 4 also shows the specific characteristics of the varying technologies and gives an impression of their areas of application (see type of substrate).
The reference for digestion technologies was calculated based on data from [
14]. The 700 m
3/h biogas plant digesting renewable raw material (60% maize silage, 40% pig manure) was chosen.
As shown in
Figure 3, the heat and electricity demand ranges in a wide field and the majority of the small-scale digester technologies shows a higher energy demand than the reference. However, it must be pointed out that these values are highly dependent on the characteristics of the used substrates e.g., their energy density as well as their degradability. Thus, no definite conclusion for the individual digestion technology can be made upon the available data basis. Some technologies show very high specific energy consumptions which are sometimes higher than the energy contained in 1 m
3 biogas (biogas has a calorific value of 5–7.5 kWh/m
3). It is, therefore, expected that for those technologies the energy consumption must be reduced significantly during their further development to become market mature.
A Swedish study [
19] confirms that the energy requirements are specific to the biogas plants and used raw material. The same source gives as an example differences in heat requirements between farm- and large-scale biogas plants due to varying insulation and other technical issues as well as hygienization requirements for different raw materials.
3.1.3. Biogas Upgrading
Eleven biogas upgrading technologies were identified within the defined limits of TRL 3 to 7. Within these, biological, chemical, and physical technologies were covered in this research.
Table 5 gives an overview of the specific parameters such as flow rate (raw gas), ability of integrated H
2S removal as well as possible ranges for upscaling. Regarding the in situ H
2S removal, it has to be kept in mind that depending on the technology, the H
2S is stored in the upgrading material (e.g., active carbon) and thus has to be renewed periodically or is released at a later point and then has to be treated to avoid an emission into the atmosphere. A storage of the upgraded biomethane was not part of the assessment and is usually not part of the technologies.
For the upgrading technologies, the electricity demand is shown in
Figure 4. It ranges from 0.02 to 4 kWh
el/m
3 biogas, for comparison the electricity demand of the reference is 0.21 kWh
el/m
3 biogas. Only two of the assessed technologies require heat (upgrading with algae biomass: 0.2 kWh/m
3 biogas, Trickle-bed reactor for methanation: 0.12 kWh/m
3 biogas). One of the Vacuum Swing Adsorption (VSA) processes requires significantly more electricity than the other processes or the reference. The algal bacterial process and the ash filter are processes with very low electricity demands. This is due to the nature of the processes, whereas e.g., cryogenic processes and especially VSA processes require much more electricity for the compression stages.
The reference for the upgrading technologies was obtained based on data published in [
14]. For this, an average of the published data for the biogas upgrading plants with a capacity of 700 m
3/h of raw gas was calculated. Some of the small-scale technologies are comparable and competitive with the reference on the aspect of energy demand, others have clearly higher demands on the current TRL level. For technologies with a very high electricity demand the overall energy balance could be even negative taking into consideration the calorific value of biogas with between 5–7.5 kWh/m
3. This is e.g., the case for the Biogame VSA Technology with an electricity demand of 4 kWh/m
3.
The delivery pressure values ranging from 1 to 7.5 bar abs, whereas the reference has a value of 5.5 bar abs,
Figure 4. The delivery pressure is of importance due to the later use of the biomethane. Either way, used via injection into the gas grid or supplying a gas filling station, in the most cases the product gas must be compressed to a higher-pressure stage. According to Billig & Thrän 2016, an already high product gas pressure is of advantage here [
20].
Comparing these results to literature, for larger plants than the here evaluated small-scale plants an electricity demand of about 0.2 to 0.3 kWh/m
3 raw biogas was stated in a Swedish report [
21] in 2013, with only one exception for the amine scrubber, which was lower (about 50%).
The subsequent Swedish report [
22] from 2016 stated for full-scale upgrading plants there would be no significant variation in the energy demand between the different biogas upgrading technologies. It highlighted the importance of site-specific requirements in pre- or post-treatment, depending on the site-specific conditions such as type of substrate and the resulting biogas quality, respectively, as well as the product gas standards [
22]. A Dutch study indicates the energy input for the upgrading process with almost 100 MJ/GJ biomethane (assuming a share of about 60% methane in the biogas and a heating value of 10 kWh/m
3 for biomethane this results in roughly 0.6 kWh/m
3 biomethane) [
23].
Regarding small-scale upgrading plants, a high pressure batchwise water scrubbing technology was described in literature from 2013 and it was available on the market with an electricity consumption of 0.4 to 0.5 kWh
el/m
3 of raw biogas [
21]. It included electricity demand for the filling station and further pressurizing to 270 bar(a) [
21]. Furthermore, another small-scale water-scrubbing-based biogas upgrading process showed 0.25 kWh/m
3 and 0.32 kWh/m
3 in the case of grid injection and in the case of transportation fuel, respectively [
24].
Another 2013 market-ready small-scale technology was the rotary coil water scrubber developed by the company Biosling, which has an electricity demand of around 0.15 to 0.25 kWh
el/m
3 raw biogas, depending on the size of the upgrading unit [
21].
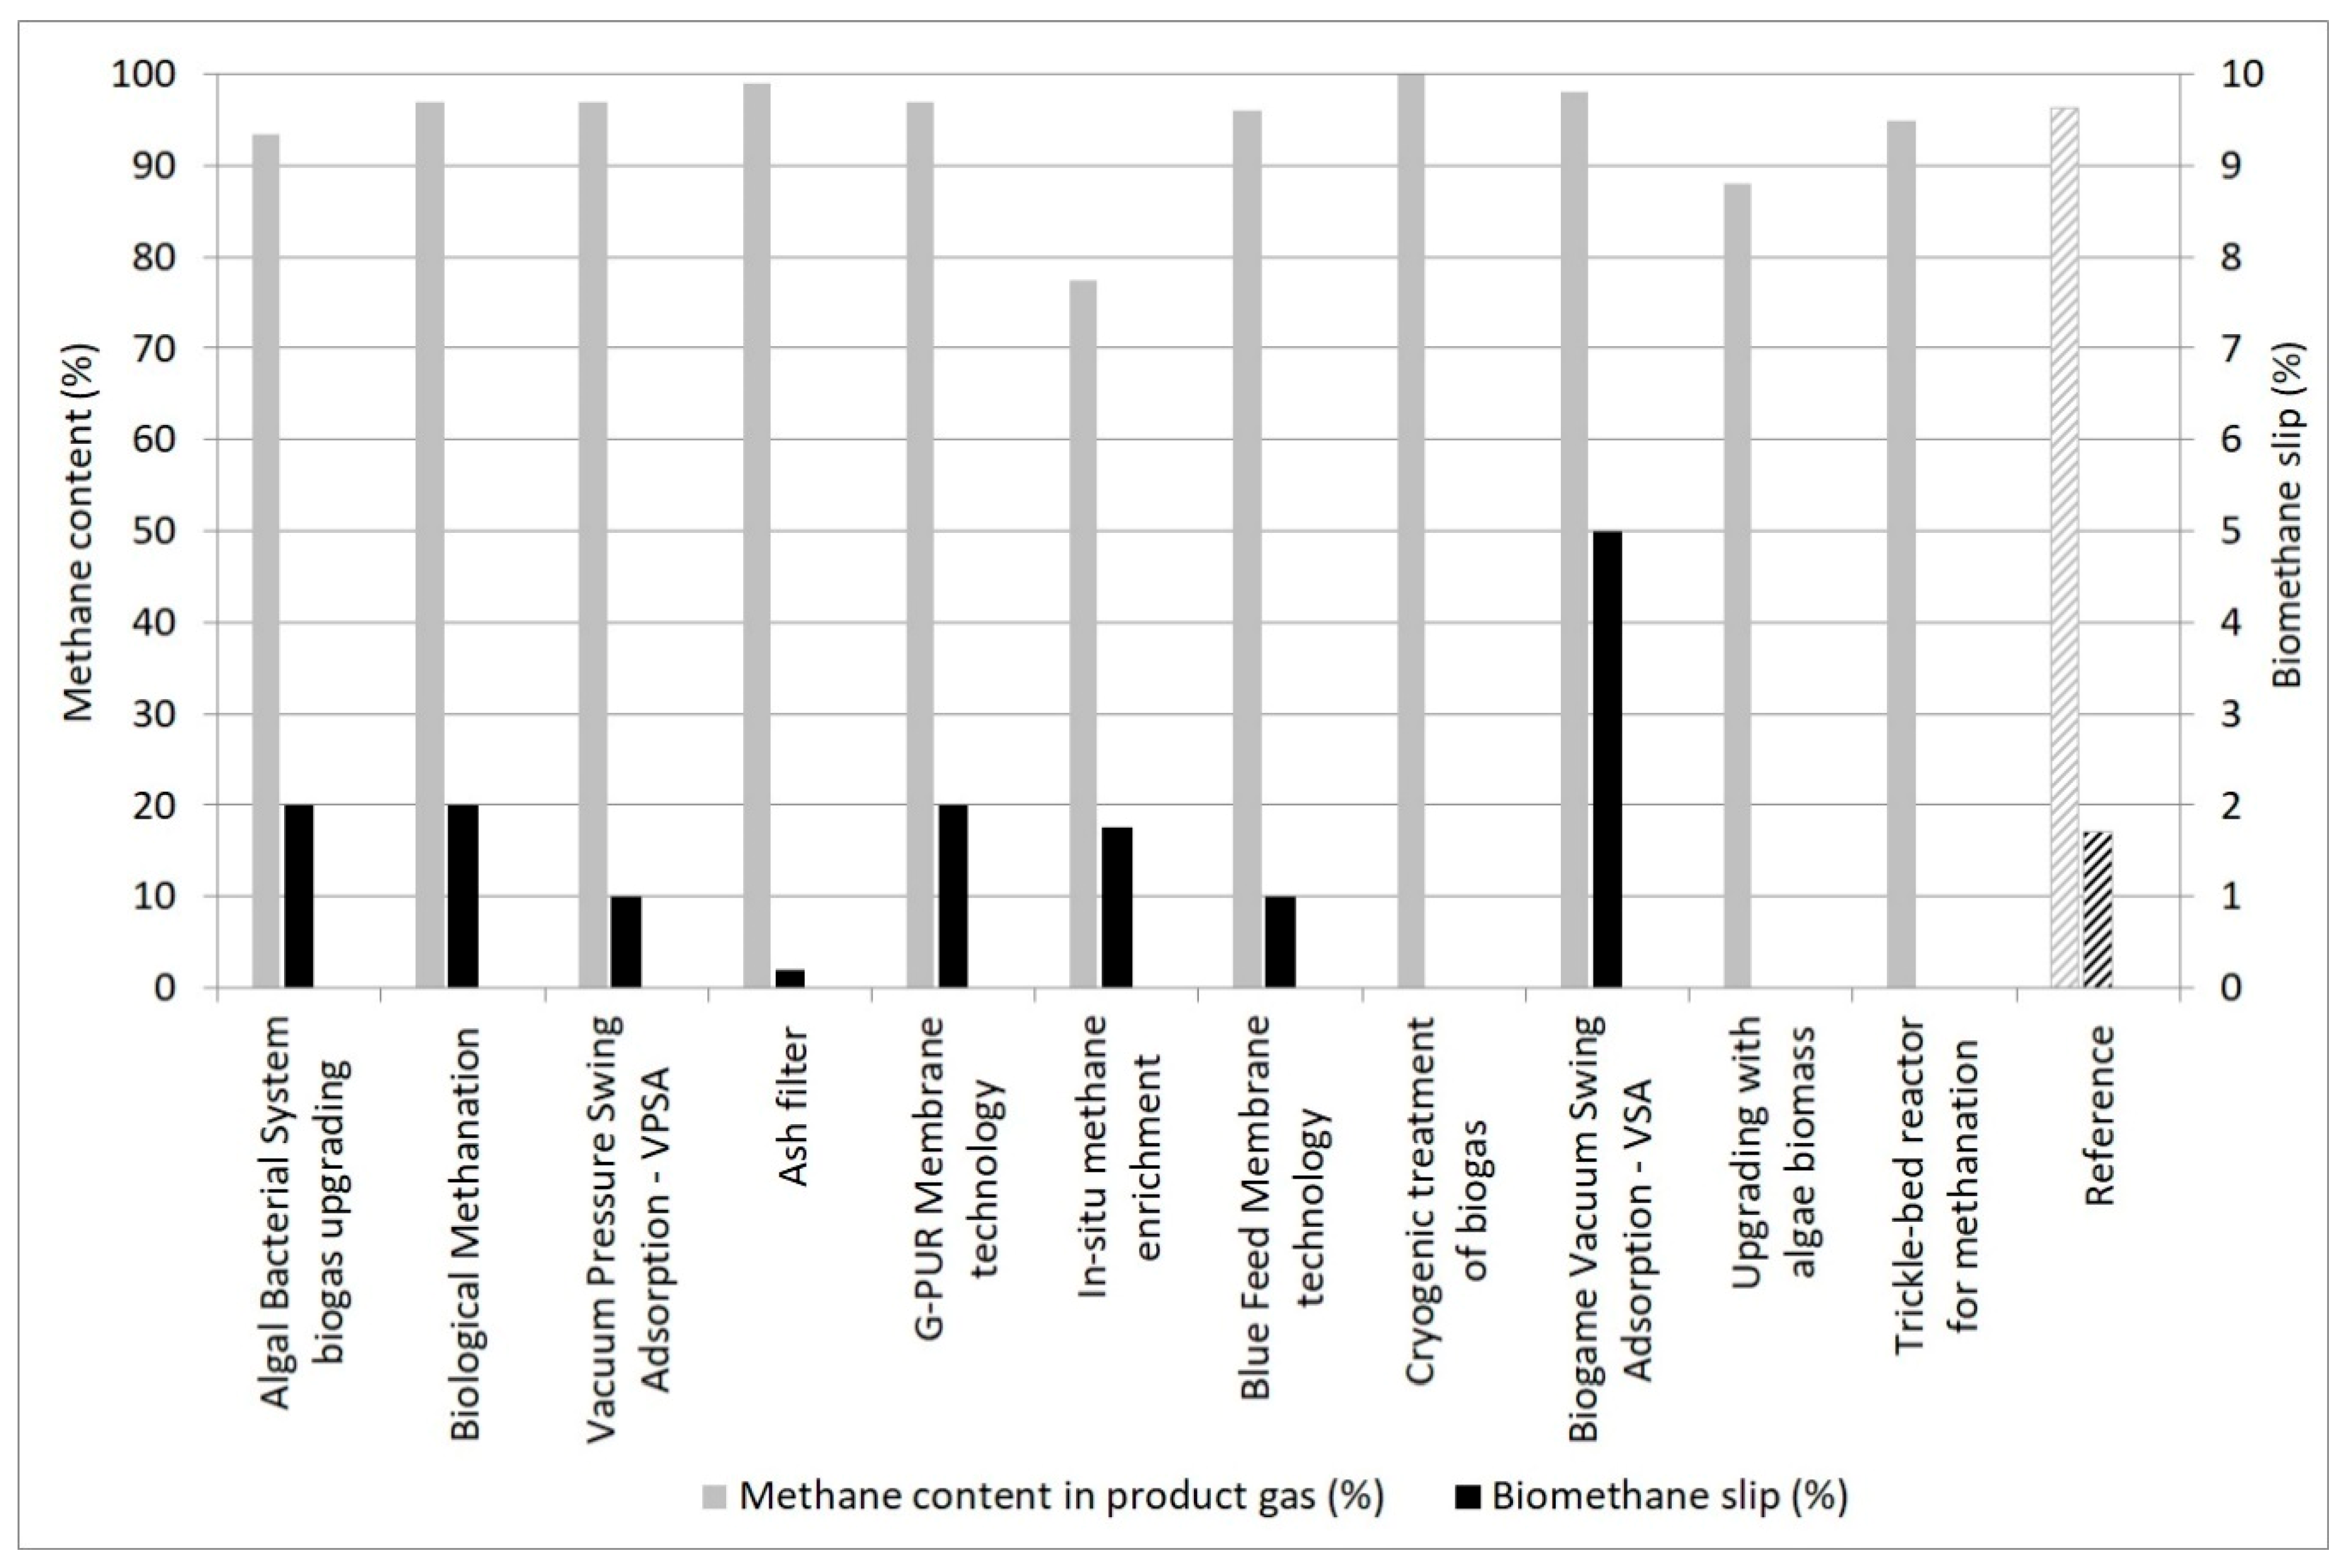
Back to the present study, further technology indicators used are the methane content in the produced biomethane and the maximum biomethane slip (methane emissions from the upgrading process), which are shown in
Figure 5. The methane slip is an essential aspect of the technologies. On the one hand the methane slip means an energy loss via off-gas and on the other hand it has a significant environmental impact (see
Section 3.2.3). Only four of the evaluated technologies can reach a methane slip below 1%. The other technologies will have to reduce the methane slip on their way to market readiness to fulfil the corresponding regulations in most countries.
Regarding the methane content, all technologies produce a gas suitable for the gas grid injection with one exception: the in situ methane enrichment. There, the methane content with in situ methane enrichment reaches about 78% on average. The gas quality can be increased further by e.g., the combination with the ash filter, which enables to get biomethane with up to 99% methane content, which than will be sufficient for gas grid injection, compare [
25] and the EN 16723-1:2016 Norm. The in situ methane enrichment technology was still included in this study as the methane content of 78% might be sufficient as such for some applications already. Furthermore, under certain conditions it may be possible to reach German L-gas specs with this technology. Many vehicles are already approved for and fully capable of running on L-gas.
For the small-scale high pressure batchwise water scrubbing technology the methane slip ranged from 1 to 3% according to literature [
21]. The other 2013 market-ready small-scale technology from the same literature source was the rotary coil water scrubber (company Biosling), which offers a product purity of 94% methane. For better gas quality (>97% methane), an additional step is necessary e.g., a water scrubber, while the methane slip was expected to be around 1% [
21].
3.1.4. Qualitative Technical Assessment
The descriptive technical data gathered in the Technical Descriptions was organized to display information which is relevant for people that could be potential users of the technologies found. Therefore,
Appendix A contains a qualitative user-oriented assessment of the technologies found in the research. It is divided and classified in the technologies relevant for biogas production (to the left), and the ones relevant for biomethane production (to the right) (see
Appendix A). Within the biogas section the graphic shows a division based on the type of substrate a customer–or a user-may have, and proposes both pre-treatment and digestion technologies accordingly. The aim is to give a better overview of the available upcoming equipment to potential users of the technology. Additionally, the article enables a foot path to follow while going deeper into the technology relevant for the user´s own interest (i.e., appraisal of the economic and ecological assessment of the particular technology). On the right side are the biogas upgrading technologies (biomethane) which are classified by more specific customer requirements, such as: climate and temperature, minimum quality requirements, vehicle fuel, etc. On itself, the graphic enables the selection and analysis of an entire biogas value chain to the end-product biomethane. It takes into account key intrinsic production factors and exemplifies that the feasibility of these installations-at small to medium scale-rely on the uniqueness and specialty of each of the biogas and biomethane technologies.
3.2. Ecological Assessment
This part of the assessment shows the GHG emissions caused by the technologies. It must be noted that those represent the emissions caused by the technologies due to their demand for energy and, in the case of upgrading, due to the methane slip. Not included are the emissions caused by material or chemical demand during the operation and emission due to the substrate and upstream processes. The value for the reference technology shows the status quo of market-ready larger-scale units. The GHG emissions of the technologies give an indication if the respective technology offers a potential for a GHG reduction compared to the use of natural gas. Hence, when the respective technology steps are part of a complete value chain (consisting of substrate logistics, pre-treatment, digestion, and upgrading), technologies with lower emissions per step offer a higher potential for a GHG reduction for the product biomethane.
3.2.1. Substrate Pre-Treatment
The GHG emissions associated with the pre-treatment technologies are shown in
Figure 6. This includes emissions due to the consumption of electricity and heat. The GHG emissions range from ~1 to ~12 kg
CO2-eq/Mg substrate, while the major part is caused by the electricity demand. Only 2 out of 6 technologies need heat for the pre-treatment. The majority of the technologies (4 out of 6) show much lower GHG emissions than the reference (~4.5 kg
CO2-eq/Mg substrate), by operating in the same range of increase in biogas production, compare
Figure 2. The mechanical grinder shows slightly lower GHG emissions than the reference and the pressure swing conditioning much higher GHG emissions due to its high energy demand. Compared to the other technologies (including the reference) pressure swing conditioning has the highest increase in biogas production due to pre-treatment, compare
Figure 2.
3.2.2. Anaerobic Digestion
The GHG emissions related to electricity and heat demand for the digestion systems are shown in
Figure 7. As for the pre-treatment systems, electricity is the main driver for the emissions, because it was assumed that for those technologies requiring heat, this would be provided by a wood chip boiler, whose emissions are comparably low (0.43 g
CO2-eqMJ). About half of the assessed technologies incorporate lower GHG emissions than the reference. However, the other technologies contribute to significantly higher emissions due to a high electricity demand. A general statement regarding the GHG emissions over all technologies cannot be expressed due to the high dependency on the type of substrate.
In addition to the emissions related to the supply of the digestion process with process energy also the direct methane emissions from the digestion process are of relevance. This is especially important as the emission of methane is associated with a high CO
2-equivalent. Those emissions are caused by leakages in the digestion process and are generally assumed to be around 1% for the process of biogas production [
7]. For the innovative processes in focus for this paper it was not possible to obtain detailed information and this factor was therefore not included here.
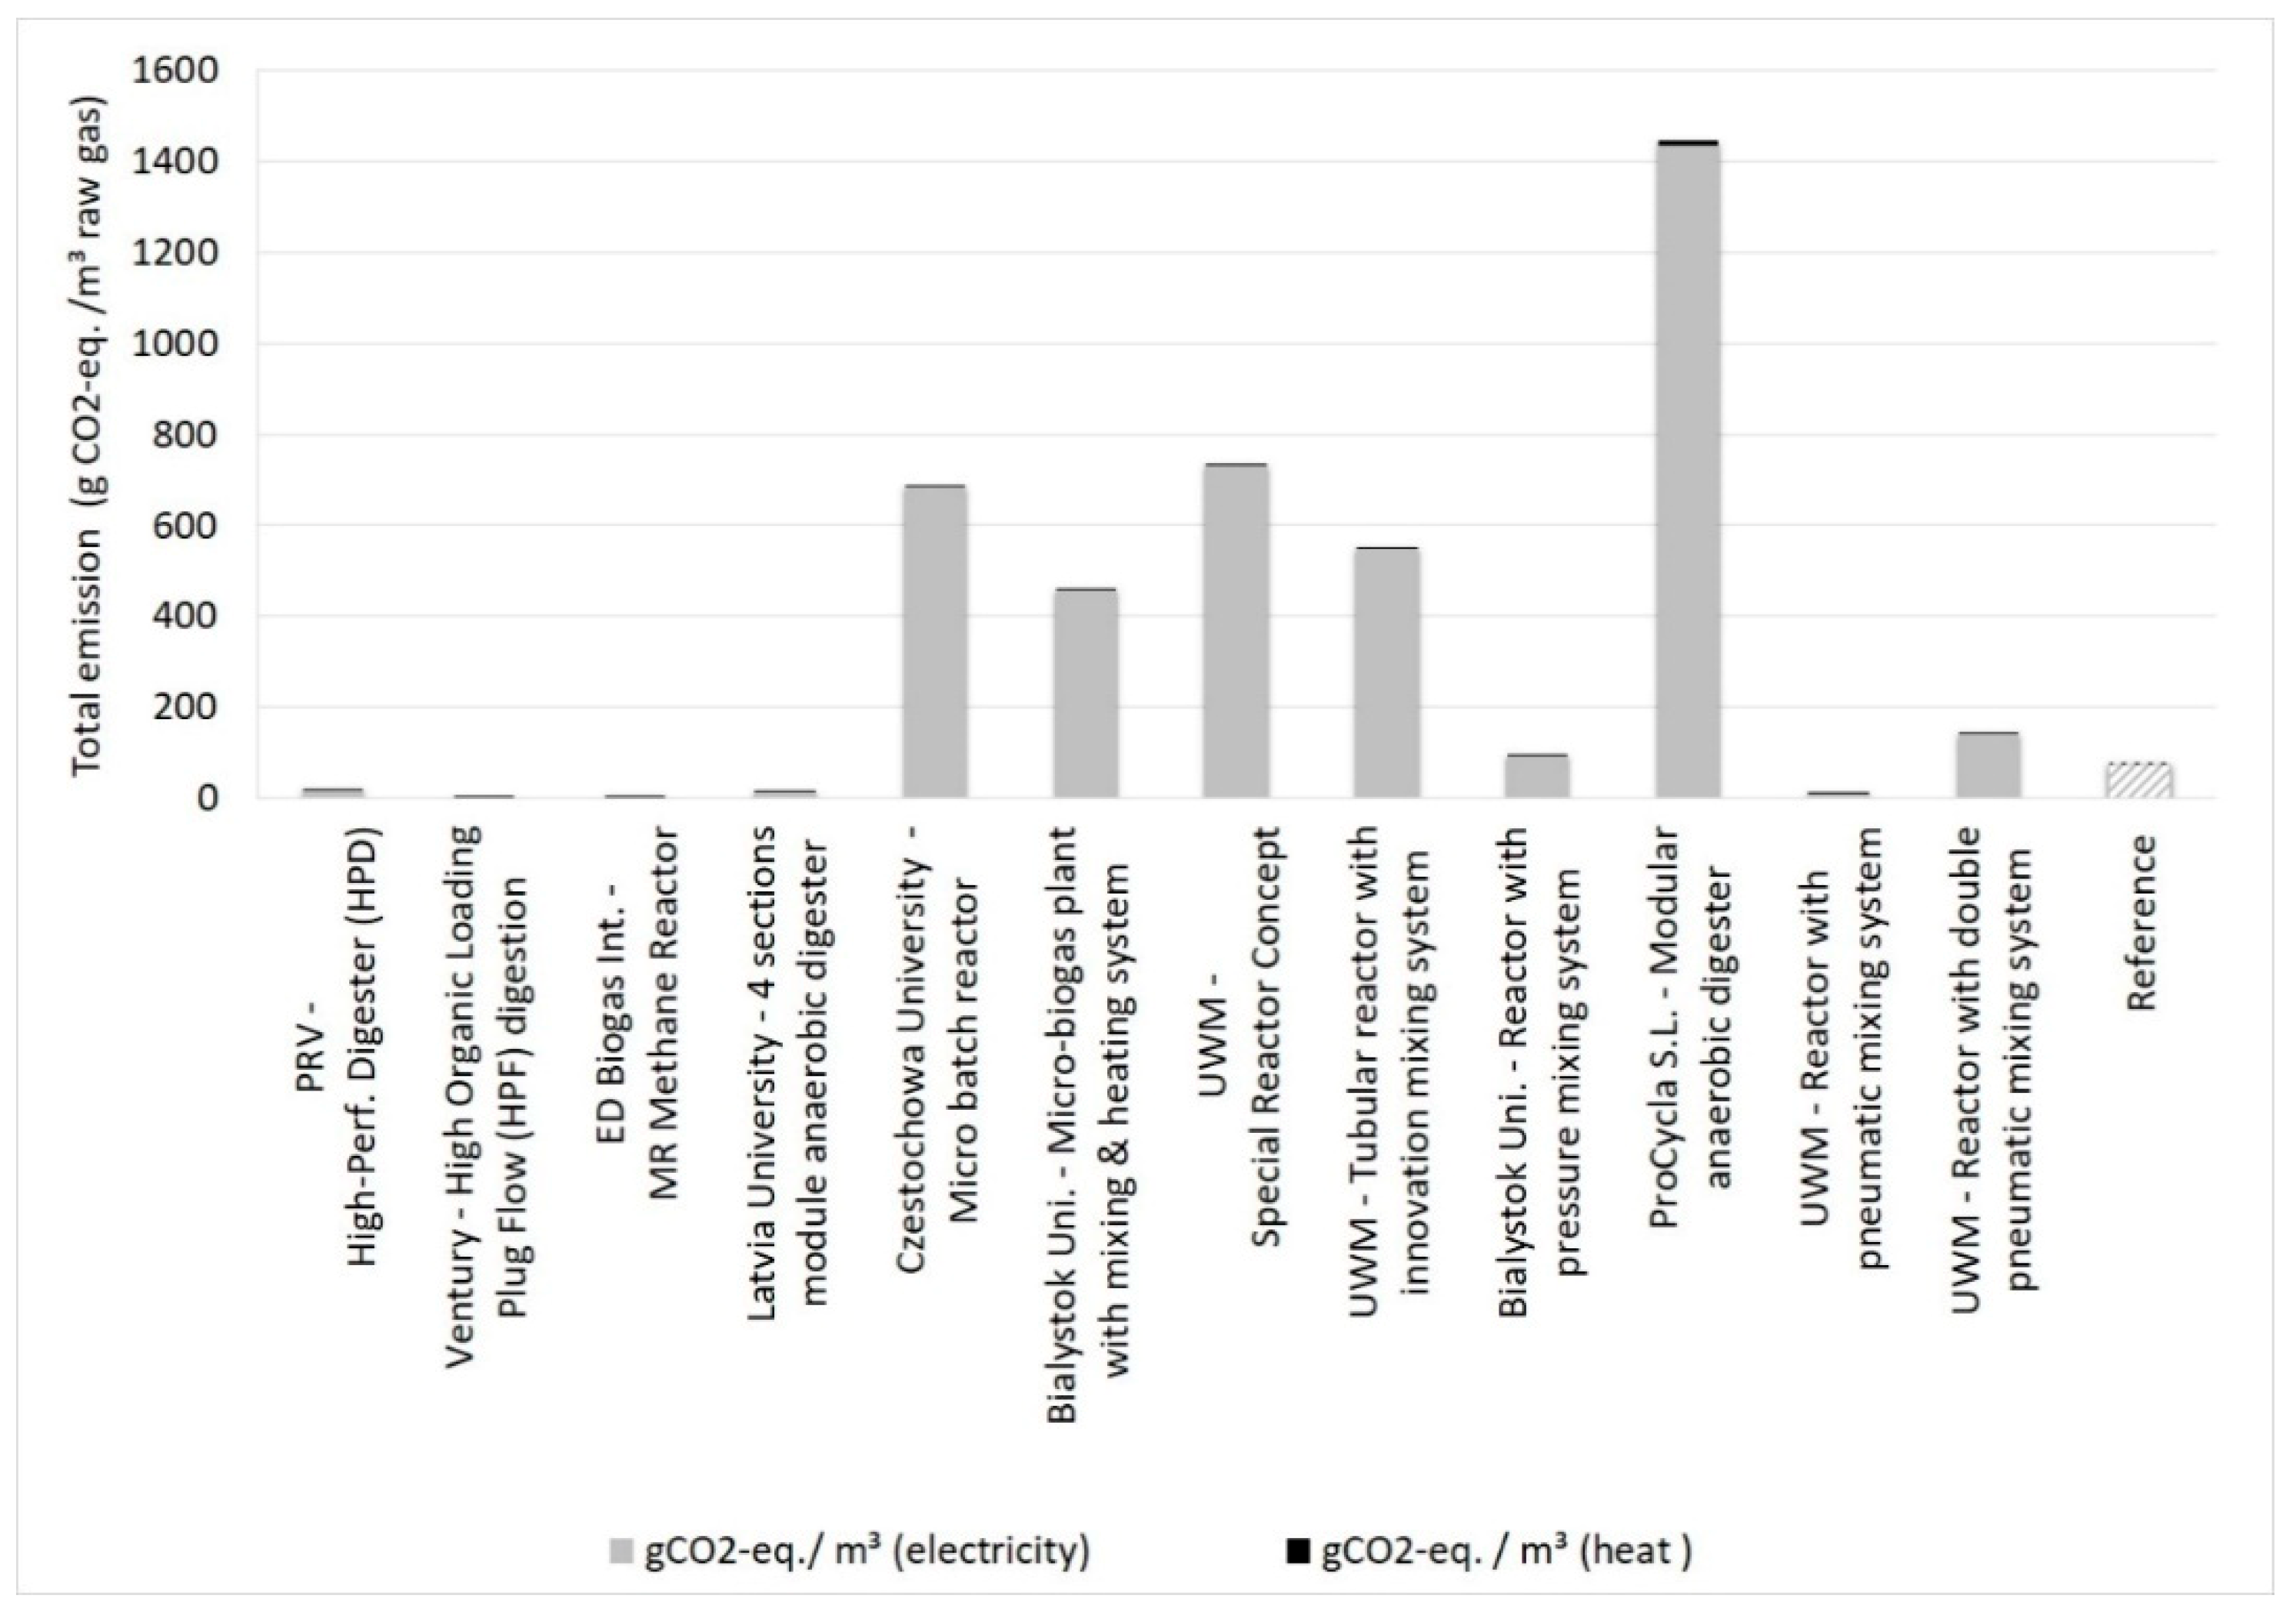
3.2.3. Biogas Upgrading
For the upgrading technologies, the emissions due to the energy demand and the methane slip of the technologies are shown in
Figure 8. It makes clear that for about half of the technologies and the reference the methane slip contributes the most to the GHG emissions. For the other half, the electricity demand is the main contributor. As heat is only required for two of the technologies and this was defined to come from a wood chip boiler, its impact is negligible.
The dashed line represents the EU fossil fuel comparator. The GHG emissions of this comparator for the use of natural gas as fuel are 94 g
CO2-eq/MJ or 3.38 kg
CO2-eq/m
3), according to [
15]. The majority of biogas upgrading technologies are associated with higher emissions compared to the larger-scale reference. This is to a large extent caused by the early stage of the development of the technologies resulting in a high methane slip. In general, the maximum values for the methane slip were provided by the technology developers, which are often above the acceptable level for the regulations in the most European countries. The data for methane slip contributing to the GHG emissions should therefore be handled with care.
The net GHG savings, which can be achieved by using biomethane as a biofuel instead of natural gas can only be calculated when looking at the full value chain (including the emissions associated with the other technology steps and the substrate). However, the figure highlights which upgrading technologies could contribute to higher or lower GHG savings if the emissions related to the upgrading technology itself are in the focus. The technologies with the lowest GHG emissions are the ash filter and the trickle-bed reactor followed by the biological methanation, which have all lower emissions than the reference. The technology with the highest GHG emissions is the VSA using zeolites. The other technologies (except the upgrading with algae biomass) are relatively close to the reference.
A life-cycle assessment for biomethane production for The Netherlands in 2015 [
23] shows the impact of the substrate and the individual steps in the biomethane production pathway on GHG emissions, which is very much depending on the type of feedstock used. It highlights that the digestion and upgrading processes contribute the most to the GHG emissions of the whole value chain [
23]. Another study [
26] compared the GHG emissions for six exemplary pathways for biomethane production using waste streams or substrates especially cultivated for biomethane production. It also showed the influence of considering a digestate credit (for the substitution of mineral fertilizer by digestate) and a slurry credit (for avoided GHG emissions of using slurry). All pathways have resulted in a GHG mitigation potential ranging between a minimum of 51% GHG mitigation using maize silage and catch crops and 202% GHG mitigation (pathway based on 100% slurry; digestate allocation and slurry credit maximum) compared to the fossil comparator for biomethane used as transportation fuel as set in the EU RED [
26].
3.3. Economic Assessment of Upgrading Technologies
The economic evaluation could only be conducted for the biogas upgrading technologies. For the substrate pre-treatment as well as the digestion technologies the economic data were not sufficient for an evaluation.
The economic assessment of the upgrading technologies was carried out by selecting the specific upgrading costs as an indicator. Those costs do not include the costs for biogas production nor for the substrate and are thus just related to the upgrading technology step. This part of the assessment does not include the two technologies which use additional hydrogen from excess electricity to produce additional methane directly from the CO
2 contained in the biogas, due to the reasons explained in
Section 2.
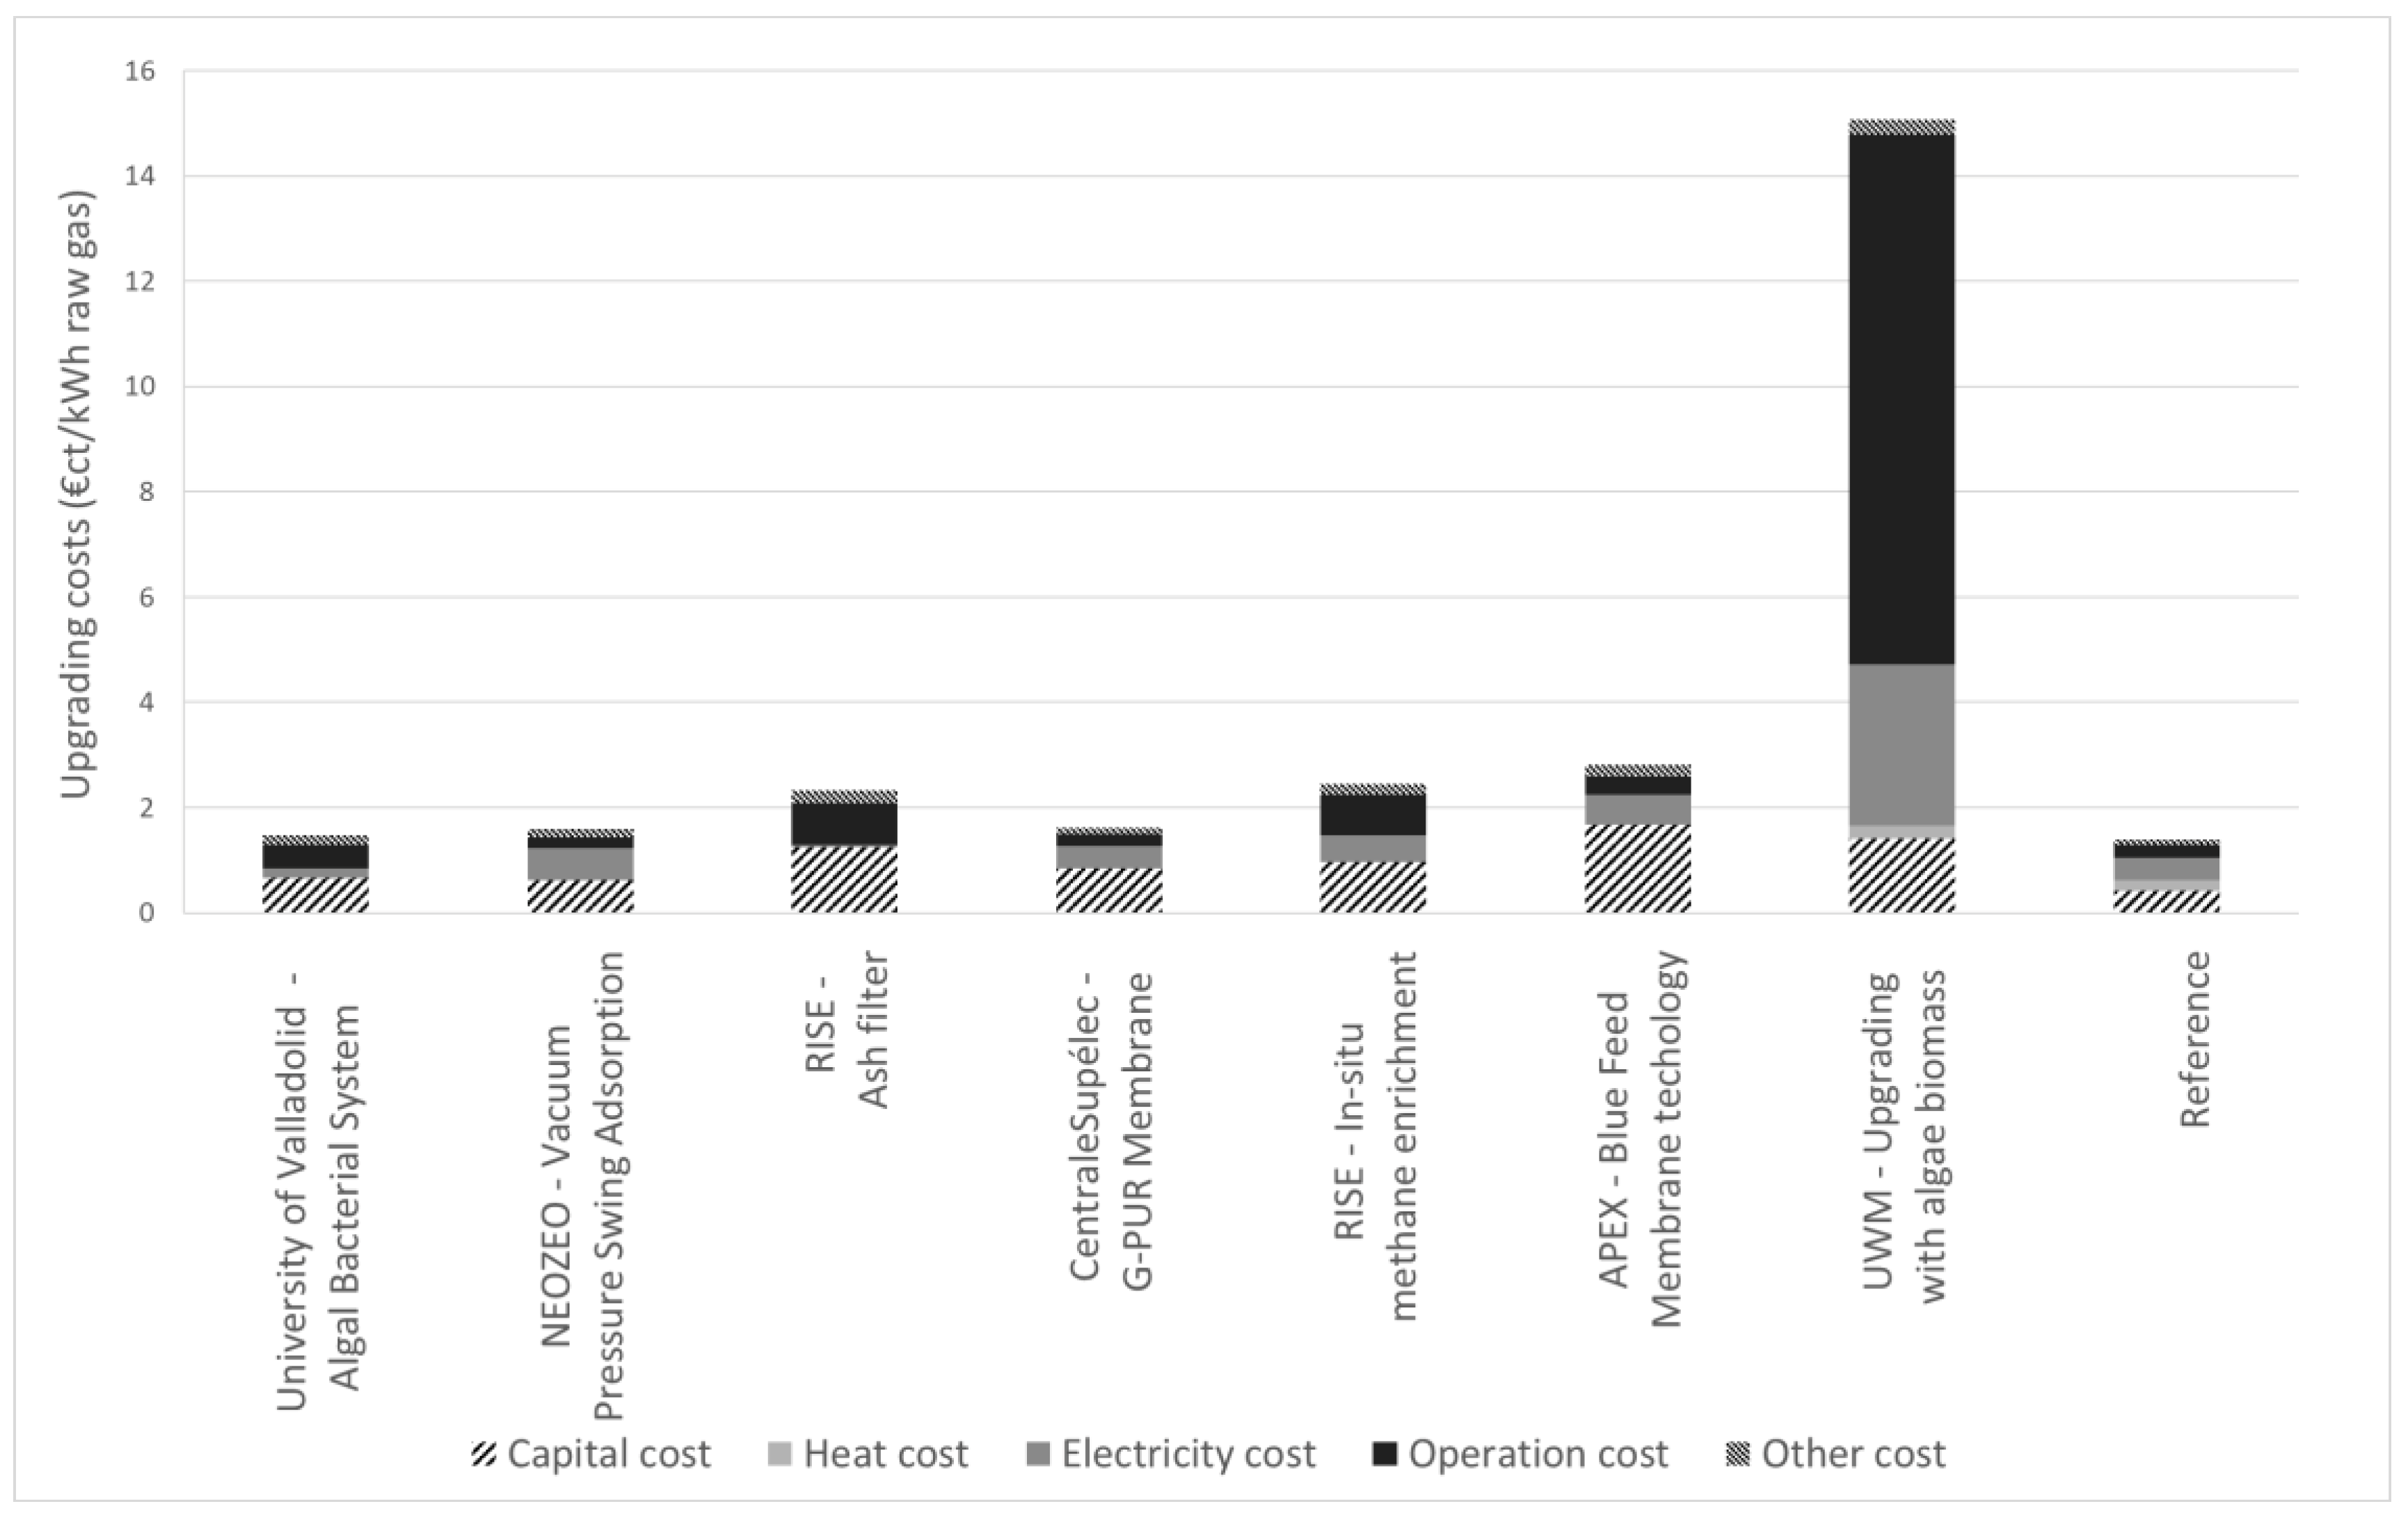
The results (
Figure 9) indicate upgrading costs between 1.5 and 15 €ct/kWh raw biogas. From the 11 evaluated technologies (compare
Table 5), seven could be economically assessed, for the other technologies no sufficient cost data were available and the PtG-technologies were excluded from this assessment as described before.
The capital cost represents the largest share among the total costs (except for one technology). The NeoZeo-Technology has the lowest share of capital cost, whereas for the Apex-Technology the capital cost is the main cost driver. The ash filter has the lowest specific electricity cost and the upgrading with algae biomass the highest. The operation cost includes the costs for maintenance and personnel and are by far the highest for the upgrading with algae biomass. This is because of the very small capacity of this technology and the high personal effort in relation to this, perhaps due to the low TRL of the technology. If only the other technologies are compared, the in situ methane enrichment and the ash filter have relatively high operation costs. In addition, the technology using algae is also the only technology except the reference which has a requirement for heat. In total, three technologies have upgrading costs which are similar to the larger-scale reference with around 1.5 €ct/kWh raw gas. The specific upgrading costs of the other technologies exceed the one from the reference, while the upgrading with algae biomass shows by far the highest upgrading cost with about 15 €ct/kWh. Among the other technologies, Apex shows the highest upgrading costs with 2.8 €ct/kWh, almost twice as high as the reference, which is mainly driven by the high capital cost.
The results show that the upgrading costs of some technologies are already close to those for larger-scale technologies. Upgrading costs in the literature for small-scale market-ready technologies show similar results. Specific cost for biogas upgrading in [
6] for market-ready technologies range between 7.63 €ct/kWh raw gas (for the plant with an upgrading capacity of 40 m
3/h) and 1.57 €ct/kWh raw gas (for the plant with an upgrading capacity of 550 m
3/h). The investigated dataset in [
6] showed upgrading costs for plants between 100 and 125 m
3/h between 4.61 and 2.33 €ct/kWh raw gas. For plants between 200 and 550 m
3/h capacity the same source has provided upgrading costs between 2.38 and 1.57 €ct/kWh raw gas. Also [
27] has investigated specific upgrading costs in 2012, mostly for larger-scale plants. Market-ready small-scale plants with a capacity of around 250–400 m
3/h result in upgrading costs between 2.3 and 1.6 €ct/kWh raw gas. Data from [
14], also based on 2012 for two plants with upgrading capacities of 250 m
3/h give upgrading costs between 2.2 and 2.0 €ct/kWh raw gas.
3.4. Multi-Indicator Assessment of Upgrading Technologies
The main indicators considered in this study are summarized in
Figure 10 for the upgrading technologies (which had cost data available). Those include upgrading costs, GHG emissions and electricity demand (represented by the surface area of the bubble in the figure) of the technologies. Technologies perform best if they are presented in the lower left part of the diagram by a rather smaller bubble. The figure visualizes all technologies on one part of the diagram, except the upgrading with algae biomass. Taking this technology aside it is clear that the ash filter performs best in terms of GHG emissions and electricity demand and is in the medium range among the technologies for upgrading costs. The Vacuum Pressure Swing Adsorption by NeoZeo and the Algal Bacterial System by University of Valladolid are the next best systems in terms of both GHG emissions and costs, quite similar to the reference technology. The system G-PUR has similar costs as the reference but higher emissions. In situ methane enrichment has higher emissions and costs compared to the reference whereas Blue Bonsai indicates higher costs but similar emissions as the reference.
4. Conclusions and Outlook
During the assessment it was noted that technologies which are still in their development stage regularly lack data and may also be subject to changes once the technologies develop further. This makes a detailed assessment difficult. However, this paper summarizes the main indicators that were possible to obtain for the technologies and for the assessment performed. As sources, literature and data directly gathered from the developer´s respective manufactures were compared.
Our research showed that in the sector of pre-treatment most of the investigated technologies have a lower specific electricity demand between 1.2 and 7 kWhel/Mg substrate (fresh matter) paralleled to the reference technology (10 kWhel/Mg substrate), but with a comparatively similar increase in biogas production. This indicates that upcoming technologies are indeed becoming more efficient.
As for digestion technologies, electricity and heat demand depend largely on the particularities of each individual technology. Nevertheless, around 40% of the technologies—which focus on the small scale—presented lower electricity demands compared to the reference one (0.16 kWhel/m3 biogas). However, some pre-treatment and digestion technologies involve a significant amount of heat (up to 150 kWhth/Mg substrate and 8.6 kWhth/m3 biogas respectively). This means that the economic and environmental feasibility of these technologies largely depends on the source of heat, i.e., if it is intelligently used from a source with excess heat (waste heat).
The electricity demand of most upgrading technologies is similar to the reference (0.21 kWhel/m3 raw gas) used. The gas grid connection requirements, usually corresponding to >95–97% methane, are met by most of the technologies. However, the limiting factor for some technologies is the methane slip. This factor varies depending on the technology, and it must be reduced before these are ready for their entry to any market.
Most of the investigated pre-treatment technologies indicate a high GHG saving potential (as their GHG emissions range between 1 and 12 kgCO2-eq/Mg substrate which is for the majority of the technologies lower than for the reference) whereas for the digestion technologies the picture is more divers and technologies will only be able to contribute to a significant GHG saving if their electricity demand can be reduced within their development. As for the upgrading technologies, the methane slip is the main driver in GHG emissions, followed by the electricity demand. However, most of the upgrading technologies show a similar potential for GHG savings as the reference.
The economic indicator that was calculated for the upgrading technologies shows that the upgrading costs, for some of them, are already close to the larger-scale reference—with about 1.5 €ct/kWh raw biogas. It should be noted here again that those costs represent the costs for upgrading associated with the upgrading technology only, and do not include costs for biogas production. The multi-indicator assessment has highlighted that some technologies perform better or similar to the reference in terms of energy demand, GHG emissions, and economics. It is, therefore, expected that the further developments of the promising technologies will lead to a significant impact on the market for small to medium scale biomethane production.
A report within the project Record Biomap (endorser and the background of the present research) which has investigated the regulatory and financial framework conditions in 15 EU countries has concluded that all but one of the studied countries have specific policy targets for reducing fossil fuels in the transport sector while less than half of the countries have any kind of framework for using biomethane as a vehicle fuel [
28].
The research demonstrated that the feasibility of implementation of substrates pre-treatment, anaerobic digestion, and biogas upgrading technologies at the small scale must be increasingly intelligently—and systemically—interlinked with their environment. The success or failure of the entry to market of these technologies is almost always context-specific.

 and
and 


