Article

Impacts of Non-Uniform Border Temperature Variations on Time-Dependent Nanofluid Free Convection within a Trapezium: Buongiorno’s Nanofluid Model

1
Faculty of Pharmacy, University of Medicine and Pharmacy, 400012 Cluj-Napoca, Romania
2
Department for Management of Science and Technology Development, Ton Duc Thang University, Ho Chi Minh City 758307, Vietnam
3
Faculty of Applied Sciences, Ton Duc Thang University, Ho Chi Minh City 758307, Vietnam
4
Department of Applied Mathematics, Babeş-Bolyai University, 400084 Cluj-Napoca, Romania
5
Department of Theoretical Mechanics, Tomsk State University, 634050 Tomsk, Russia
*
Author to whom correspondence should be addressed.
Energies 2019, 12(8), 1461; https://doi.org/10.3390/en12081461
Submission received: 30 January 2019 / Revised: 15 April 2019 / Accepted: 15 April 2019 / Published: 17 April 2019
(This article belongs to the Special Issue Heat Transfer Enhancement)

Abstract

:
The present study develops the influence of inclined border temperature variations on the isotherms, streamlines, and isoconcentrations for unsteady free convection in a trapezoidal region filled with the water-based nanofluid. The considered mathematical nanofluid approach was formulated based on the Buongiorno’s model. The set of governing partial differential equations formulated using non-dimensional primitive variables such as velocity, pressure, temperature, and nanoparticles concentration volume fraction was solved numerically using the finite element method for various magnitudes of control characteristics. It was revealed that control characteristics affected the liquid circulation and energy transport coefficients. The Nusselt number is a growing function of wave number, amplitude, and the Rayleigh number.

1. Introduction

Thermogravitational convective energy transfer is a very significant transport mechanism in technical and natural systems owing to its wide applications in solar collectors, heat exchangers, chemical reactors, and building heating [1,2,3]. It seems that the natural convection within a tilted trapezoidal enclosure filled with a viscous liquid was first studied by Lee [4]. He conducted a computational analysis of this phenomenon to investigate the nature of the circulation and energy transport parameters for various Rayleigh and Prandtl numbers, employing curvilinear coordinates. It was demonstrated that for Ra > 104 and Pr > 0.1, the thermal transmission inside a trapezoidal cavity is a strong function of the enclosure orientation.
Saeid and Yaacob [5] studied the problem of the thermogravitational convection within a square chamber filled with air having non-uniform high and uniform low border temperatures. The paper concludes that the average Nu varied sinusoidally with a growth of the wave parameter and obtained a maximum magnitude for a wide range of temperature differences 103Ra ≤ 106. It was also revealed that the wave parameter for the maximum fluid flow rate corresponded to the maximum thermal transmission rate for low Ra, while for high Ra intensification could be found for different high wave number values. An increase in the amplitude of the hot border temperature function enhanced the mean Nu. De Vahl Davis [1] gave the heat transfer values for the natural convection of air, analyzing air circulation within a differentially-heated square chamber. The purpose of this paper was to define the magnitudes of the stream function at the enclosure center, the fluid flow rate, the mean Nu throughout the chamber, and the mean Nu at the vertical central line of the enclosure. In an excellent paper by Demirdzic et al. [6], a multigrid finite volume method was used to solve four test problems for liquid circulation and energy transport. One of these problems treated the thermal transmission in an inclined parallelogram enclosure of isothermal borders. They found that Nu was higher in the case of higher Prandtl numbers. However, employing Buongiorno’s nanofluid approach, Sheremet et al. [7] studied the thermogravitational convective energy transport of a nanofluid within a porous trapezium. Authors [7] ascertained that the inclusion of nanoparticles could result in strengthening and suppression of the liquid circulation and energy transport in dependence of the considered parameters. Kuyper [8] depicted a numerical study on the free convection of air in differentially heated trapezoidal regions. The impact of the tilt angle on the circulation and Nusselt number was presented.
The liquid circulation within trapezoidal porous enclosures has been analyzed in a series of papers. Thus, Kumar and Kumar [9] studied thermogravitational energy transport inside a porous trapezium by employing the parallel numerical approach. The horizontal borders were thermally insulated, while inclined borders were isothermal at different temperatures. Authors demonstrated that the slope of the side boundaries was an important characteristic for the hydro- and thermodynamic fields. Baytas and Pop [10] examined free convective thermal transmission inside a porous trapezium using the Darcy approach. Authors revealed that up to Ra = 100, the conductive energy transport mode was the major one, and beyond this a complex convective circulation mode was realized at the inclination of 165°. Varol et al. [11,12,13] and Varol [14] also numerically studied the free convection within a porous trapezium. Other investigations on thermogravitational energy transport inside trapeziums have been presented in [15,16,17,18,19].
Note that the low thermal conductivity of conventional energy transport liquids such as engine oil, ethylene, and water is the main reason for the presence of a limit in the development of modern thermal systems. It has been shown using experimental analysis and theoretical studies that the addition of nanoparticles into the host liquid allows the thermal conductivity of the nanofluid to be enhanced, essentially amplifying the energy transport rate. The idea of a nanosuspension was given by Choi [20] to raise a liquid’s thermal conductivity. As a result, an amplification of thermal conductivity improved thermal engineering systems (Wen et al. [21], Godson et al. [22]). The usage of nanofluids can be found in medicine, namely, in the targeted delivery of drugs by smart nanoparticles under external control.
The study of the impacts of non-uniform wall temperature variations in trapeziums has found various practical applications in solar collectors, heat exchangers, heat pipes, and so on. Many useful references concerning nanofluids can be found in interesting books and papers [23,24,25,26,27,28,29,30,31,32,33,34,35].
Natural convection heat transfer and fluid flow have been studied for porous and non-porous medium trapezoidal enclosures, mostly at differentially heated temperature boundary conditions, by many authors (e.g., Varol et al. [12]). Alsabery et al. [36] studied the effects of spatial side-wall temperature variations on the transient natural convection of a nanofluid in a trapezoidal cavity.
However, to our best knowledge, a partially cooled porous trapezoidal enclosure filled with a nanofluid has not yet been considered. The application of a partially cooled boundary condition can be found in the paper by Oztop [37]. Thus, the main objective of this paper was to examine the effects of non-uniform border temperature variations on time-dependent free nanofluid convection within a trapezium: Buongiorno’s nanofluid model.
Nanofluids have been considered for use in industrial processes and engineering fields such as in cooling systems in electronic devices, heat exchangers, nuclear reactors, automotive cooling applications, in the transportation industry (e.g., automobiles, trucks, airplanes), micro-electromechanical systems, electronics and instrumentation, and in biomedical applications (e.g., nano-drug delivery, cancer therapeutics, cryopreservation). Nanofluids have also been widely investigated to enhance solar energy utilization, and have been used as working fluids in solar thermal collectors to absorb the solar radiation. There are also applications in which the presence of nanoparticles induces other desired effects beyond the enhancement of heat transfer. For example, the presence of zinc oxide or titanium dioxide nanoparticles in water has shown inherent antibacterial effects [38].
The main objective of the present investigation was to understand the influence of periodical side-wall temperature variations on the isotherms, streamlines, and isoconcentrations for unsteady natural convection in a trapezoidal chamber filled with a water-based nanofluid.

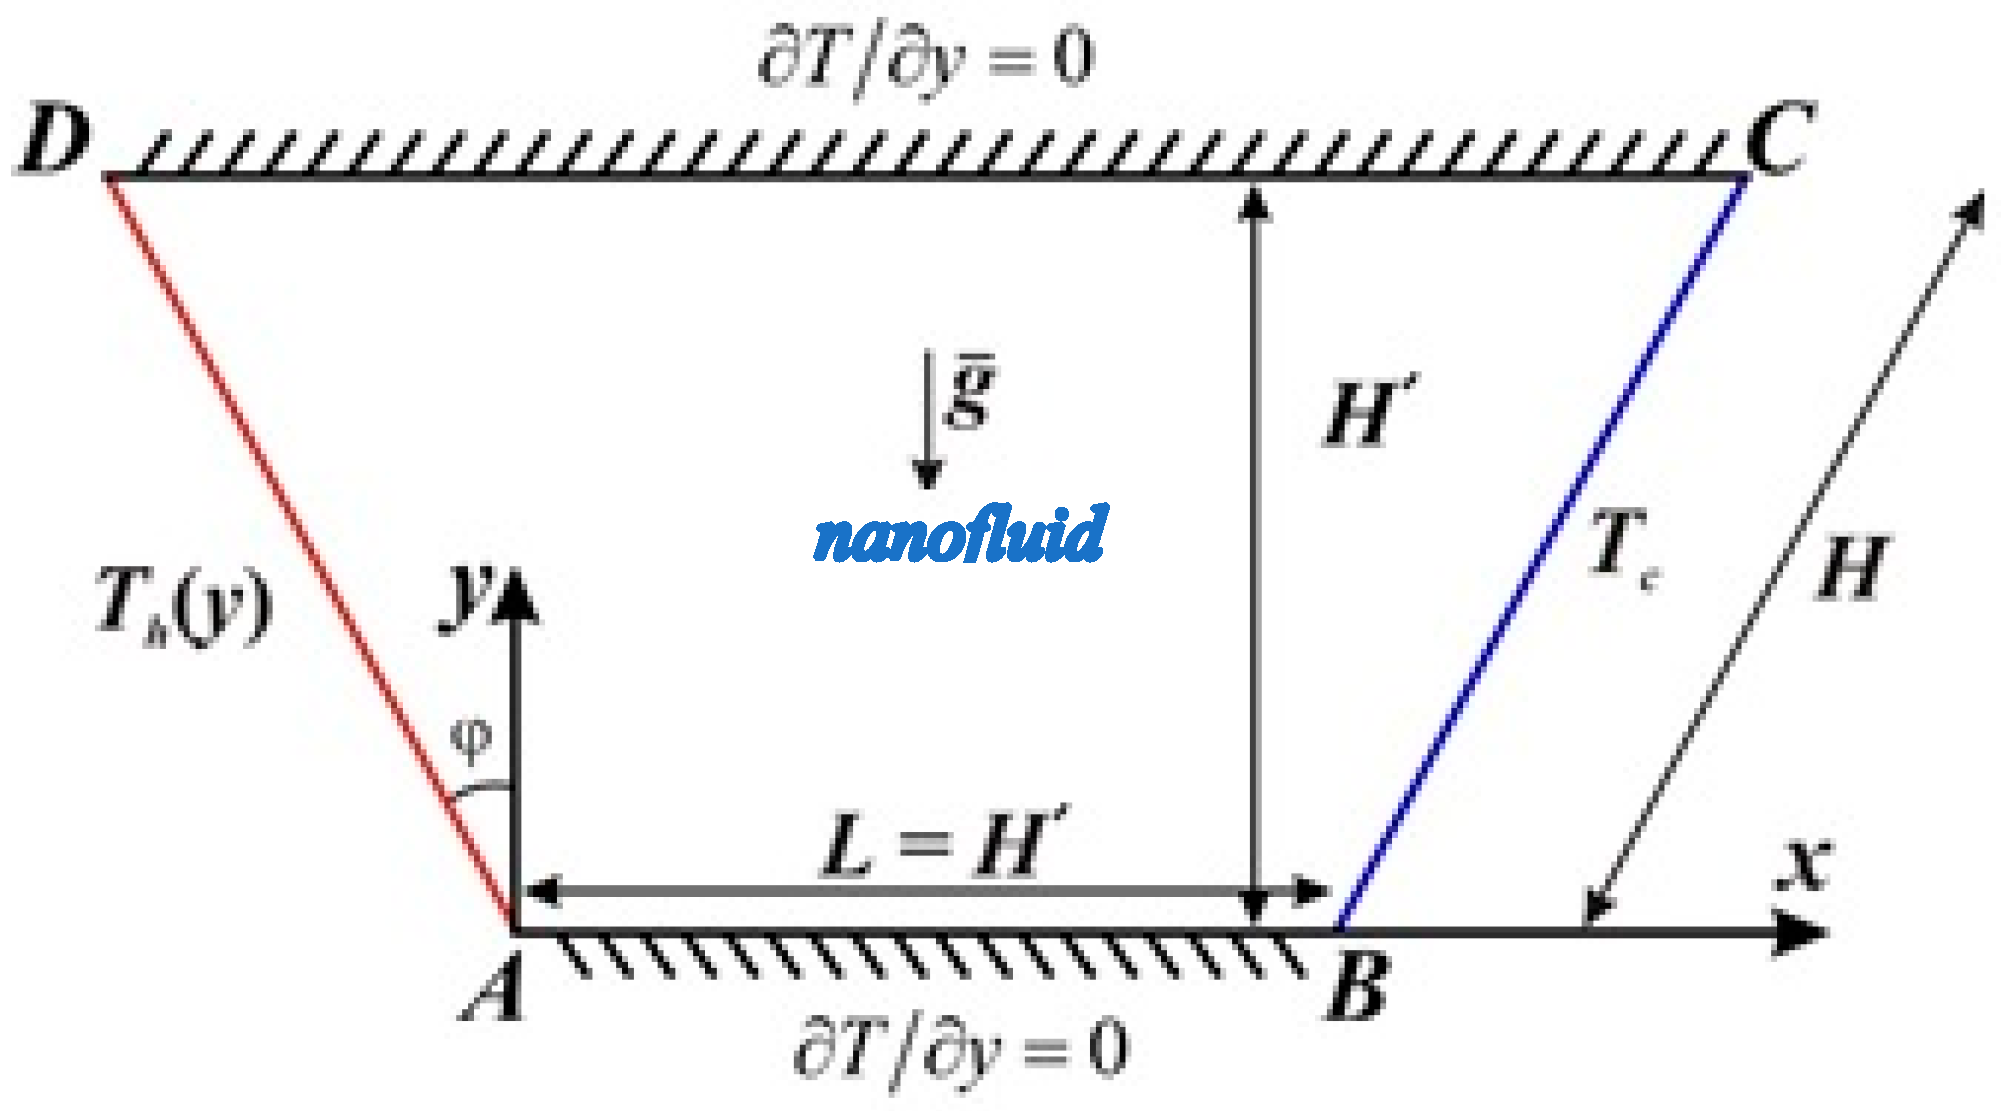
2. Problem Definition

We studied 2D unsteady free convection within a trapezium with length L, depth H′, and height H = H / cos ( φ ) , as illustrated in Figure 1. The left sloping cavity wall was heated non-uniformly, while the right border was isothermal with low temperature Tc. Horizontal boundaries were assumed to be adiabatic. All the walls were assumed impermeable and no slip, and the liquid inside the enclosure was a water-based nanofluid. The usual Boussinesq approach was adopted and the nanofluid characteristics were constant except for the density.
Taking these assumptions into account, the governing equations are given as follows [36,37]:
u x + v y = 0 ,
ρ f ( u t + u u x + v u y ) = p x + μ f 2 u ,
ρ f ( v t + u v x + v v y ) = p y + μ f 2 v + { C ρ p + ( 1 C ) [ ρ f 0 ( 1 β ( T T c ) ) ] } g ,
T t + u T x + v T y = α f 2 T + δ { D B ( C x T x + C y T y ) + ( D T T c ) [ ( T x ) 2 + ( T y ) 2 ] } ,
C t + u C x + v C y = D B 2 C + D T T c 2 T .
Further, we assumed that the temperature of left inclined border had a harmonic behavior about the mean magnitude T ¯ h in the form [5]
T h ( y ) = T ¯ h + ε ( T ¯ h T c ) [ 1 cos ( 2 π κ y L ) ] .
We now define the non-dimensional variables:
τ = α t L 2 ,   X = x L ,   Y = y L ,   U = u L α f ,   V = v L α f ,   P = p L 2 ρ f α f 2 ,   θ = T T c Δ T ,   ϕ = C C 0 ,
where Δ T = T ¯ h T c .
Using these parameters, Equations (1)–(5) can be rewritten in a non-dimensional form:
U X + V Y = 0 ,
U τ + U U X + V U Y = P X + P r ( 2 U X 2 + 2 U Y 2 ) ,
V τ + U V X + V V Y = P Y + P r ( 2 V X 2 + 2 V Y 2 ) R a P r N r ( ϕ 1 ) + R a P r θ ,
θ τ + U θ X + V θ Y = 2 θ X 2 + 2 θ Y 2 + N b ( ϕ X θ X + ϕ Y θ Y ) + N t [ ( θ X ) 2 + ( θ Y ) 2 ] ,
ϕ τ + U ϕ X + V ϕ Y = 1 L e ( 2 ϕ X 2 + 2 ϕ Y 2 ) + N t N b L e ( 2 θ X 2 + 2 θ Y 2 ) ,
with the following non-dimensional boundary conditions:
τ = 0 : u = 0 ,   v = 0 ,   θ = 1 ,   ϕ = 0   within   the   cavity τ > 0 : N b ( cos ( φ ) ϕ X + sin ( φ ) ϕ Y ) + N t ( cos ( φ ) θ X + sin ( φ ) θ Y ) = 0 , U = V = 0 ,   θ = 1 + ε [ 1 cos ( 2 π κ Y ) ]   on   A D τ > 0 : N b ( cos ( φ ) ϕ X sin ( φ ) ϕ Y ) + N t ( cos ( φ ) θ X sin ( φ ) θ Y ) = 0 , U = V = 0 ,   θ = 0   on   B C τ > 0 : N b ϕ Y + N t θ Y = 0 ,   U = V = 0 ,   θ Y = ϕ Y = 0   on   A B   and   C D
The quantities of physical interest, namely the local Nusselt numbers along the inclined borders, can be determined as:
N u h = q f L k = ( θ n ) X = 0 = ( n , θ ) ( n = cos ( φ ) i ¯ sin ( φ ) j ¯ ) = cos ( φ ) θ X + sin ( φ ) θ Y , N u c = q f L k = ( θ n ) X = 1 = ( n , θ ) ( n = cos ( φ ) i ¯ sin ( φ ) j ¯ ) = cos ( φ ) θ X + sin ( φ ) θ Y
Also, the average Nu is
N u h ¯ = 1 s 0 s N u h d s ,   N u c ¯ = 1 s 0 s N u c d s .

3. Solution Technique and Validation

The governing Equations (8)–(12) with corresponding boundary conditions (13) were solved using finite element method in COMSOL 5.2 software, see Reference [39] or [40]. The convergence criterion was the following:
Θ new Θ old Θ new δ .
Here Θ is either the variable u, v, θ, or ϕ, and δ is equal to 10−5. In order to choose the size of the grid, an accuracy test for the mesh sensitivity analysis was performed for Ra = 103, Pr = 7, φ = π/4, κ = 1, ε = 0.5, N t = N b = 0.1 ,   L e = 10 ,   and   N r = 0.1 using grid sets as shown in Table 1. Very good agreement was found between 60 × 60 to 120 × 120 results, and therefore the grid used in this problem was 100 nodes × 100 nodes.
A simplified test problem was chosen for validation, such as Demirdzic et al. [6] on the convective heat transfer within a parallelogram and De Vahl Davis [1] on convective heat transfer inside a square chamber. Table 2 presents very good comparison results for variation of Nu at the heated border with the data of Demirdzic et al. [6] for Ra = 106, Pr = 0.1, Pr = 10, and φ = π/4.
Table 3 shows a very good comparison of Nu variations at the heated border with the data of De Vahl Davis [1].

4. Results and Discussion

The quantities of control characteristics employed to resolve Equations (8)–(12) with additional conditions (13) being the Rayleigh numbers Ra = 104, 105, and 106, Prandtl number Pr = 7, Lewis number L e = 10 , thermophoresis parameter N t = 0.1 , Brownian motion parameter N b = 0.1 , buoyancy-ratio parameter N r = 0.1 , the inclination angles φ = π/6, π/4, π/3, the wave numbers κ = 1, 2, 3, and the amplitudes ε = 0.5, 1.0, 1.5, 2.0. According to Buongiorno [41], the nanoparticles diameter can vary in the range of 1 to 100 nm. Here, the physical properties of the nanoparticles were included in the governed parameters mentioned above. We also mention that all the considered variables of the equations are dependent on the governing parameters mentioned above. Isotherms, streamlines, isoconcentrations, and mean Nu for various quantities of control characteristics are presented in Figure 2, Figure 3, Figure 4, Figure 5, Figure 6, Figure 7, Figure 8 and Figure 9.
Figure 2a–c shows isolines of temperature, stream function, and concentration within the cavity for φ = π/4 and Ra = 104, 105, and 106. For the considered Ra range, the thermal transmission from the heated to cooled border increased. We also saw that with increasing Ra, the convection was dominant and the inclined temperature stratification became horizontal. Due to the non-uniform waveform heating, the isotherm patterns next to the left hot wall appeared in a curved line (κ = 1); near the right cold wall, the isotherm patterns were parallel with the inclined wall; while in the cavity center, the isotherm lines were almost horizontal. It is evident that the wave created by non-uniform warming moved up on the left border. These modifications were due to a significant warming of the left cavity wall and a significant cooling of the right wall of the enclosure. The isotherms level started from 0.05 (left bottom corner), and the difference between each contour level was 0.1. It is also evident that there was a clockwise eddy in the central part and it became elongated with increasing Ra. Further, the boundary layer thickness decreased and the maximum streamline point increased from | ψ max | = 0.0043 for Ra = 104 to | ψ max | = 0.5231 for Ra = 106. The nanofluid circulation rate increased due to the increment in the buoyancy forces of the nanofluid. In Figure 2b,c, it can be observed that a significant motion acceleration took place near the heated border which formed a single vortex in the upper-left corner. This phenomenon characterizes a detachment of the circulation at the upper-left corner. As a result, non-homogeneous nanoparticles distributions could be found. As seen in these figures, the density of isoconcentrations increased next to the hot border with increasing Ra.
Figure 3a–c illustrates isolines of temperature, stream function, and nanoparticles concentrations within the trapezium for φ = π/6 and Ra = 104, 105, and 106. The profiles were almost similar to those mentioned previously. Because a decreasing inclination angle tended to increase the space between isotherms and streamlines, the nanofluid flow rate increased with Ra from | ψ max | = 0.0011 for Ra = 104 to | ψ max | = 0.2457 for Ra = 106, but these values are lower in comparison with the previous case of φ = π/4. Also, the magnitude of velocity decreased in comparison with the precedent case φ = π/4. Cavities closer to a square shape permit the fluid circulation to be distributed more clearly in the enclosure, and only for the third case (Ra = 106) did the boundary layer thicknesses for hot and cold walls increase significantly. The isoconcentrations reflect more homogeneous solid particle distributions with non-homogeneous regions near the borders.
Figure 4a–c presents the impact of Ra (Ra = 104, 105, 106) on temperature, stream function, and concentration isolines for φ = π/3. It is well-known that Ra reflects the impact of the buoyancy force in natural convection problems. Owing to the high inclination angle, the density of the isotherms at the hot and cold boundaries enhanced with Ra. In this case, the intensity of fluid circulation was more significant in comparison with the cases discussed above. This intensification of convective flow grew from | ψ max | = 0.0140 for Ra = 104 to | ψ max | = 0.6967 for Ra = 106. This acceleration of the fluid flow was determined to form a single vortex in the upper-left corner of the streamline starting from the first value of the Rayleigh number. From Figure 4c we can remark on the effect of thermophoresis on the nanoparticles distributions inside the enclosure. Isoconcentrations illustrated more non-homogeneous dispensation for small Ra, and the nanoparticles were distributed along the walls for large Ra.
The undulation parameter can also influence the thermal transmission and liquid circulation inside the cavity. Figure 5a–c depict the influence of this parameter κ = 1, 2, 3 on the considered fields for φ = π/4 and Ra = 106. As the non-uniform heating was applied, the isotherms and nanoparticles were affected considerably. It was observed that the temperature and nanoparticles concentration patterns close to the left sloping wall formed one, two, and three waves. These waves are more clearly highlighted in Figure 6. On the left boundary, the temperature contour appeared with an almost sinuous line. Also, increasing κ to the value of 3 changed the flow motion significantly. For odd values of the wave parameter κ the maximum streamline point was equal and less than for even values of the wave number ( | ψ max | κ = 1 , 3 = 0.52 < | ψ max | κ = 2 = 0.51 ) . The convective center vortex form was affected by κ. A single core formed for κ = 1, became elongate along the horizontal axis for κ = 2 and then this was broken in two for κ = 3. From these figures, we can conclude that the wave number induced a more notable effect on the isotherms and the nanoparticles distributions rather than on the streamlines.
The concentration distribution of the nanoparticles was influenced by the thermophoresis. The thermophoresis force tends to move the nanoparticles in the direction opposite to the temperature gradient. The physical reason for the thermophoretic force is the fact that a nanoparticle receives more net impacts from the liquid molecules from the hot side compared to the cold side. Hence, the particles tend to move from hot to cold. Based on the governing equations, the thermophoretic force is proportional to the temperature gradient of nanoparticles in the liquid.
The zero wave number corresponds to a case with no temperature variation at the hot wall. The increase of the wave number increased the overall area of the wall which is subject to a higher temperature. Hence, it is clear that the increase of the wave number induced a significant effect of the temperature gradient in the nanofluid, and consequently, the concentration distribution of nanoparticles was under the significant influence of the wave number.
When the Rayleigh number was low, the heat transfer was conduction-dominant. In a conduction-dominant regime, the heat transfer is mainly due to diffusion. Hence, as seen in the isotherms for Ra = 104, a smooth and extended temperature gradient can be expected. The increase of the Rayleigh number boosted the effects of convective heat transfer. The convective heat transfer effects are the result of the buoyancy forces. At the wall, although the buoyancy forces were very high, the velocity of the nanofluid was zero due to the no-slip wall effect. However, next to the wall, the nanofluid was free to move, and the velocity of the nanofluid reached a maximum value. The strong motion of the nanofluid removed a considerable amount of heat from the wall and induced significant temperature gradients next to the hot and cold walls. As discussed, the nanoparticle distribution was significantly affected by the temperature gradient due to the thermophoretic force. Hence, the concentration gradients of the nanoparticles next to the hot and cold walls were significant, and the rise of the Rayleigh number boosted the concentration gradient of nanoparticles.
Figure 6 presents the temperature variation along the left sloping wall. It is worth noting that for κ = 1 a single wave with the maximum value for y = 0.7 was evident, and similarly for κ = 2 two waves with the maximum values for y = 0.35 and 1.05 were evident. In the case of κ = 3, three waves with the maximum values for y = 0.25, 0.7, and 1.2 appeared. These sinuous patterns of temperature are also noticeable in Figure 5a and produced time-dependent changes in Nu.
Figure 7 displays the changes in average Nu with time at the heated border. In Figure 6a, the average Nusselt number varied with respect to amplitude ε = 0.2, 0.4, 0.6, 0.8, and 1 when κ = 1. In Figure 6b, the average Nu varied in respect of wave number κ = 1, 2, 3, 4, and 5 when ε = 0.5. In the first case, N u h ¯ increased over time to the maximum magnitude and then reduced to a stationary magnitude and it was a growing function of amplitude. In the second case, N u h ¯ increased in time to a maximum value and then became stationary, but its values had a small increase in respect of wave number.
The zero wave amplitude corresponds to a case with no temperature variation at the hot wall. The increase of the wave amplitude increased the overall temperature difference between the hot and cold walls of the cavity. The higher the temperature difference between the hot and cold walls, the higher the heat transfer rate. Hence, the increase of the wave amplitude increased the heat transfer and the Nusselt number.
As shown in Figure 8, a rise of Ra caused the average Nu to rise considerably. In fact, by growing Ra, the convection thermal transmission was dominant, and it was responsible for the increase in N u h ¯ . It is evident that the average Nu decreased over time for Ra = 103 and 104, but it increased over time for Ra = 105 and 106.
Finally, the impact of the amplitude change on the N u h ¯ is illustrated in Figure 9 for different magnitudes of the wave parameter. It seems that the average Nu was an increasing function of the amplitude. This function had a sinusoidal form with a series of maximum and minimum values becoming a linear function for large values of κ.

5. Conclusions

The present study studied the circulation as well as thermal and mass transmission of a nanofluid within a trapezoidal enclosure subject to a non-uniform hot border temperature. The hot wall temperature was applied in the form of a sine wave with various wave numbers. The governing equations were introduced in the unsteady form to capture the initial states of the heat transfer and nanopartcle distributions. Then, the governing equations were reduced into a dimensionless form to generalize the outcomes. The finite element method was employed. Grid check analysis and validation studies were performed to ensure the accuracy of the results. Nu at the heated border and concentration distribution of nanoparticles in the enclosure were addressed. The impacts of amplitude and wave parameter on the Nusselt number were investigated. The main results were:
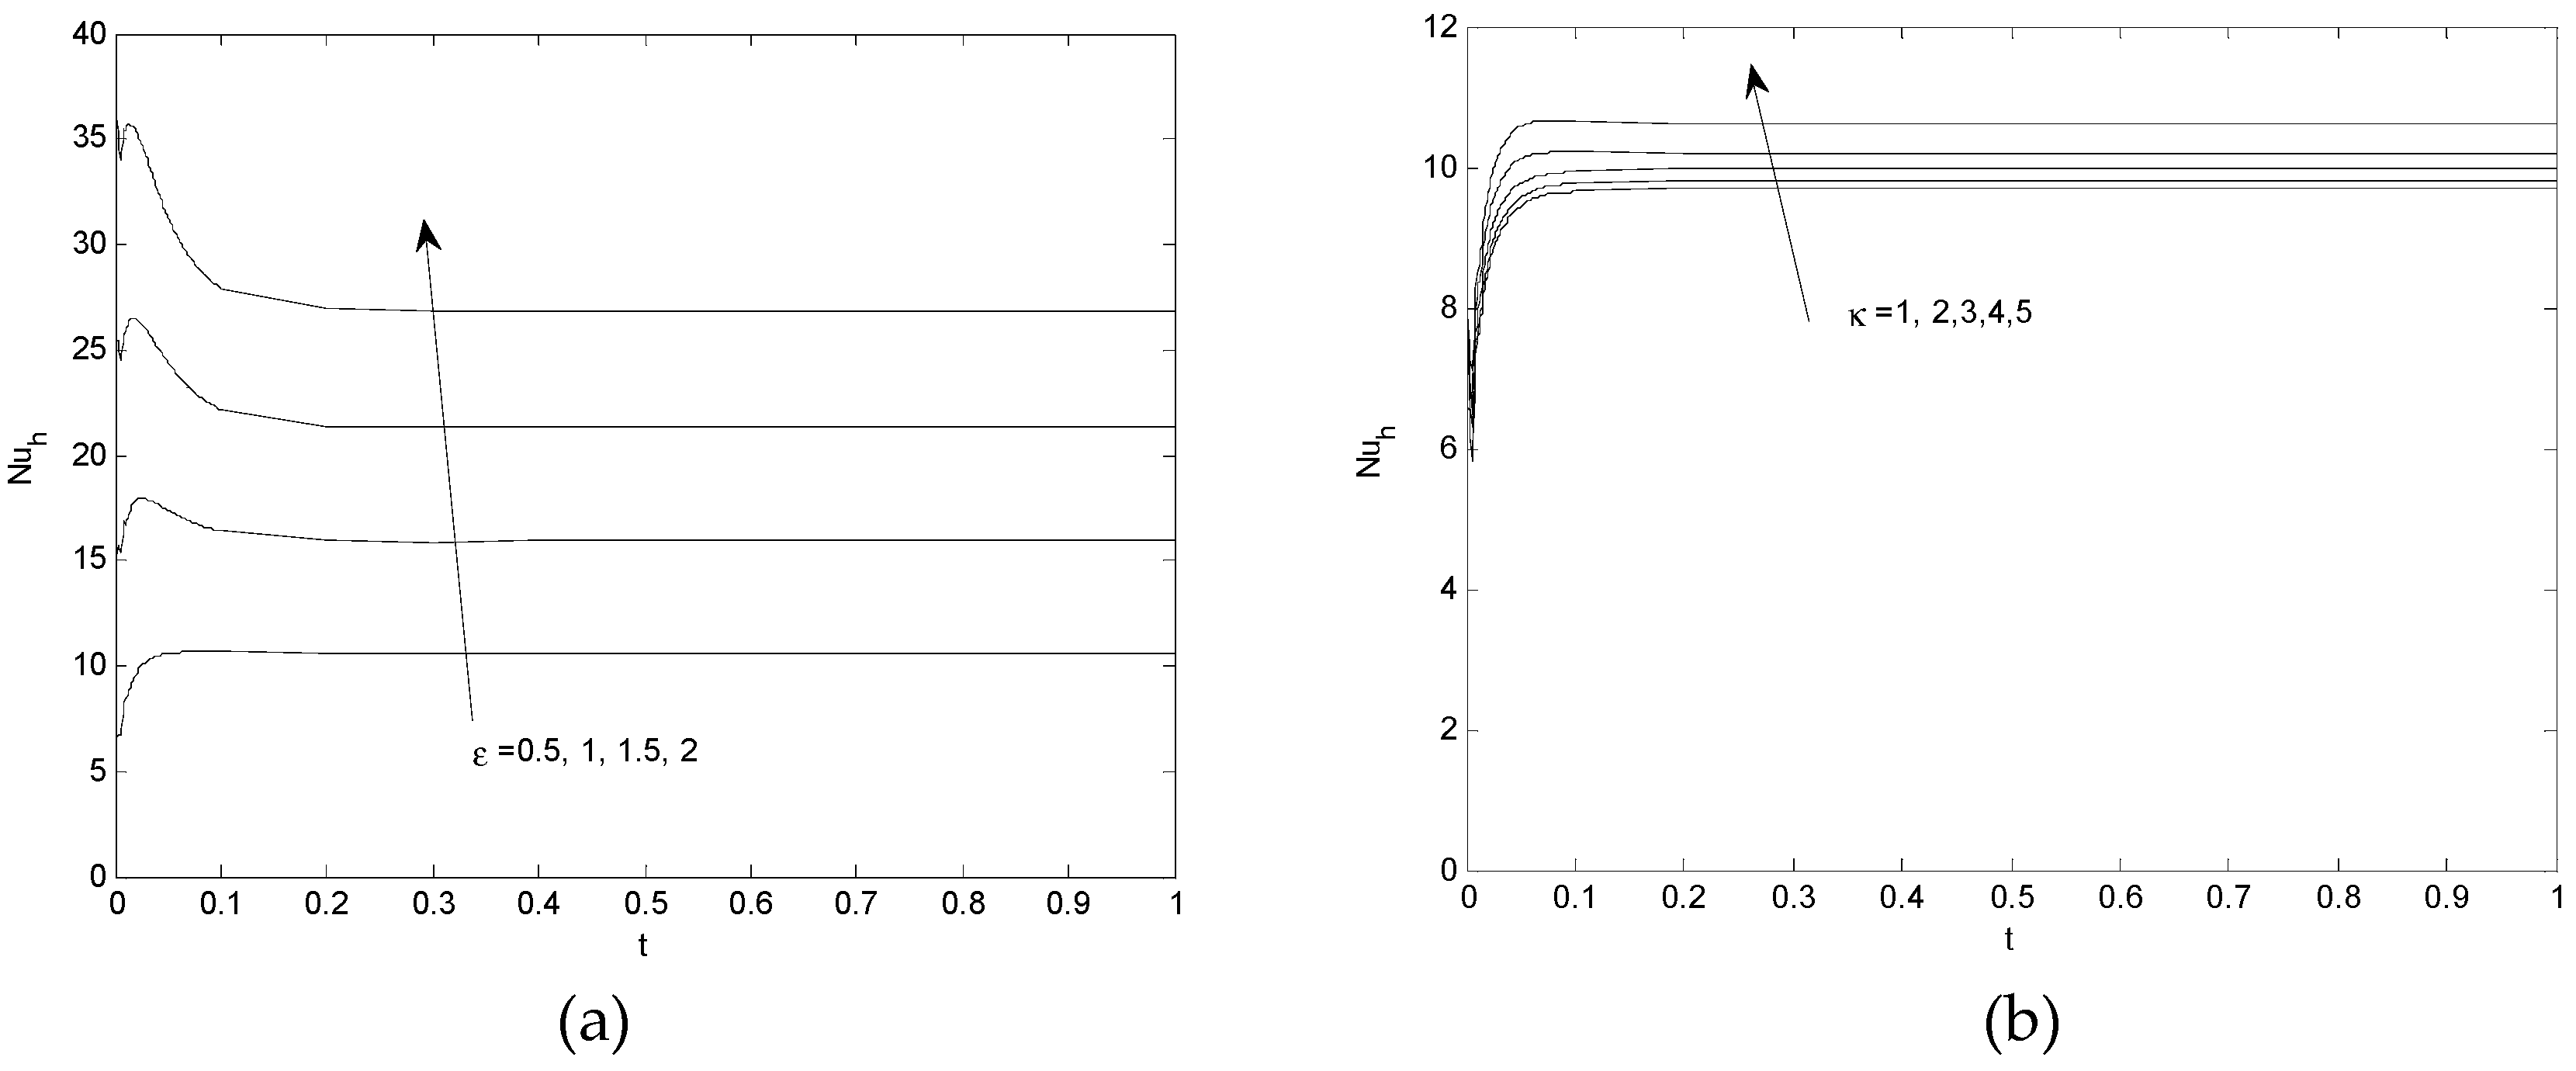
  • The unsteady behavior of the Nusselt number showed one or two enhanced picks at the early stages of natural convection, and then the Nusselt number tended to its asymptotic steady magnitude. The non-dimensional time to obtain the stationary position was of order 10−1.
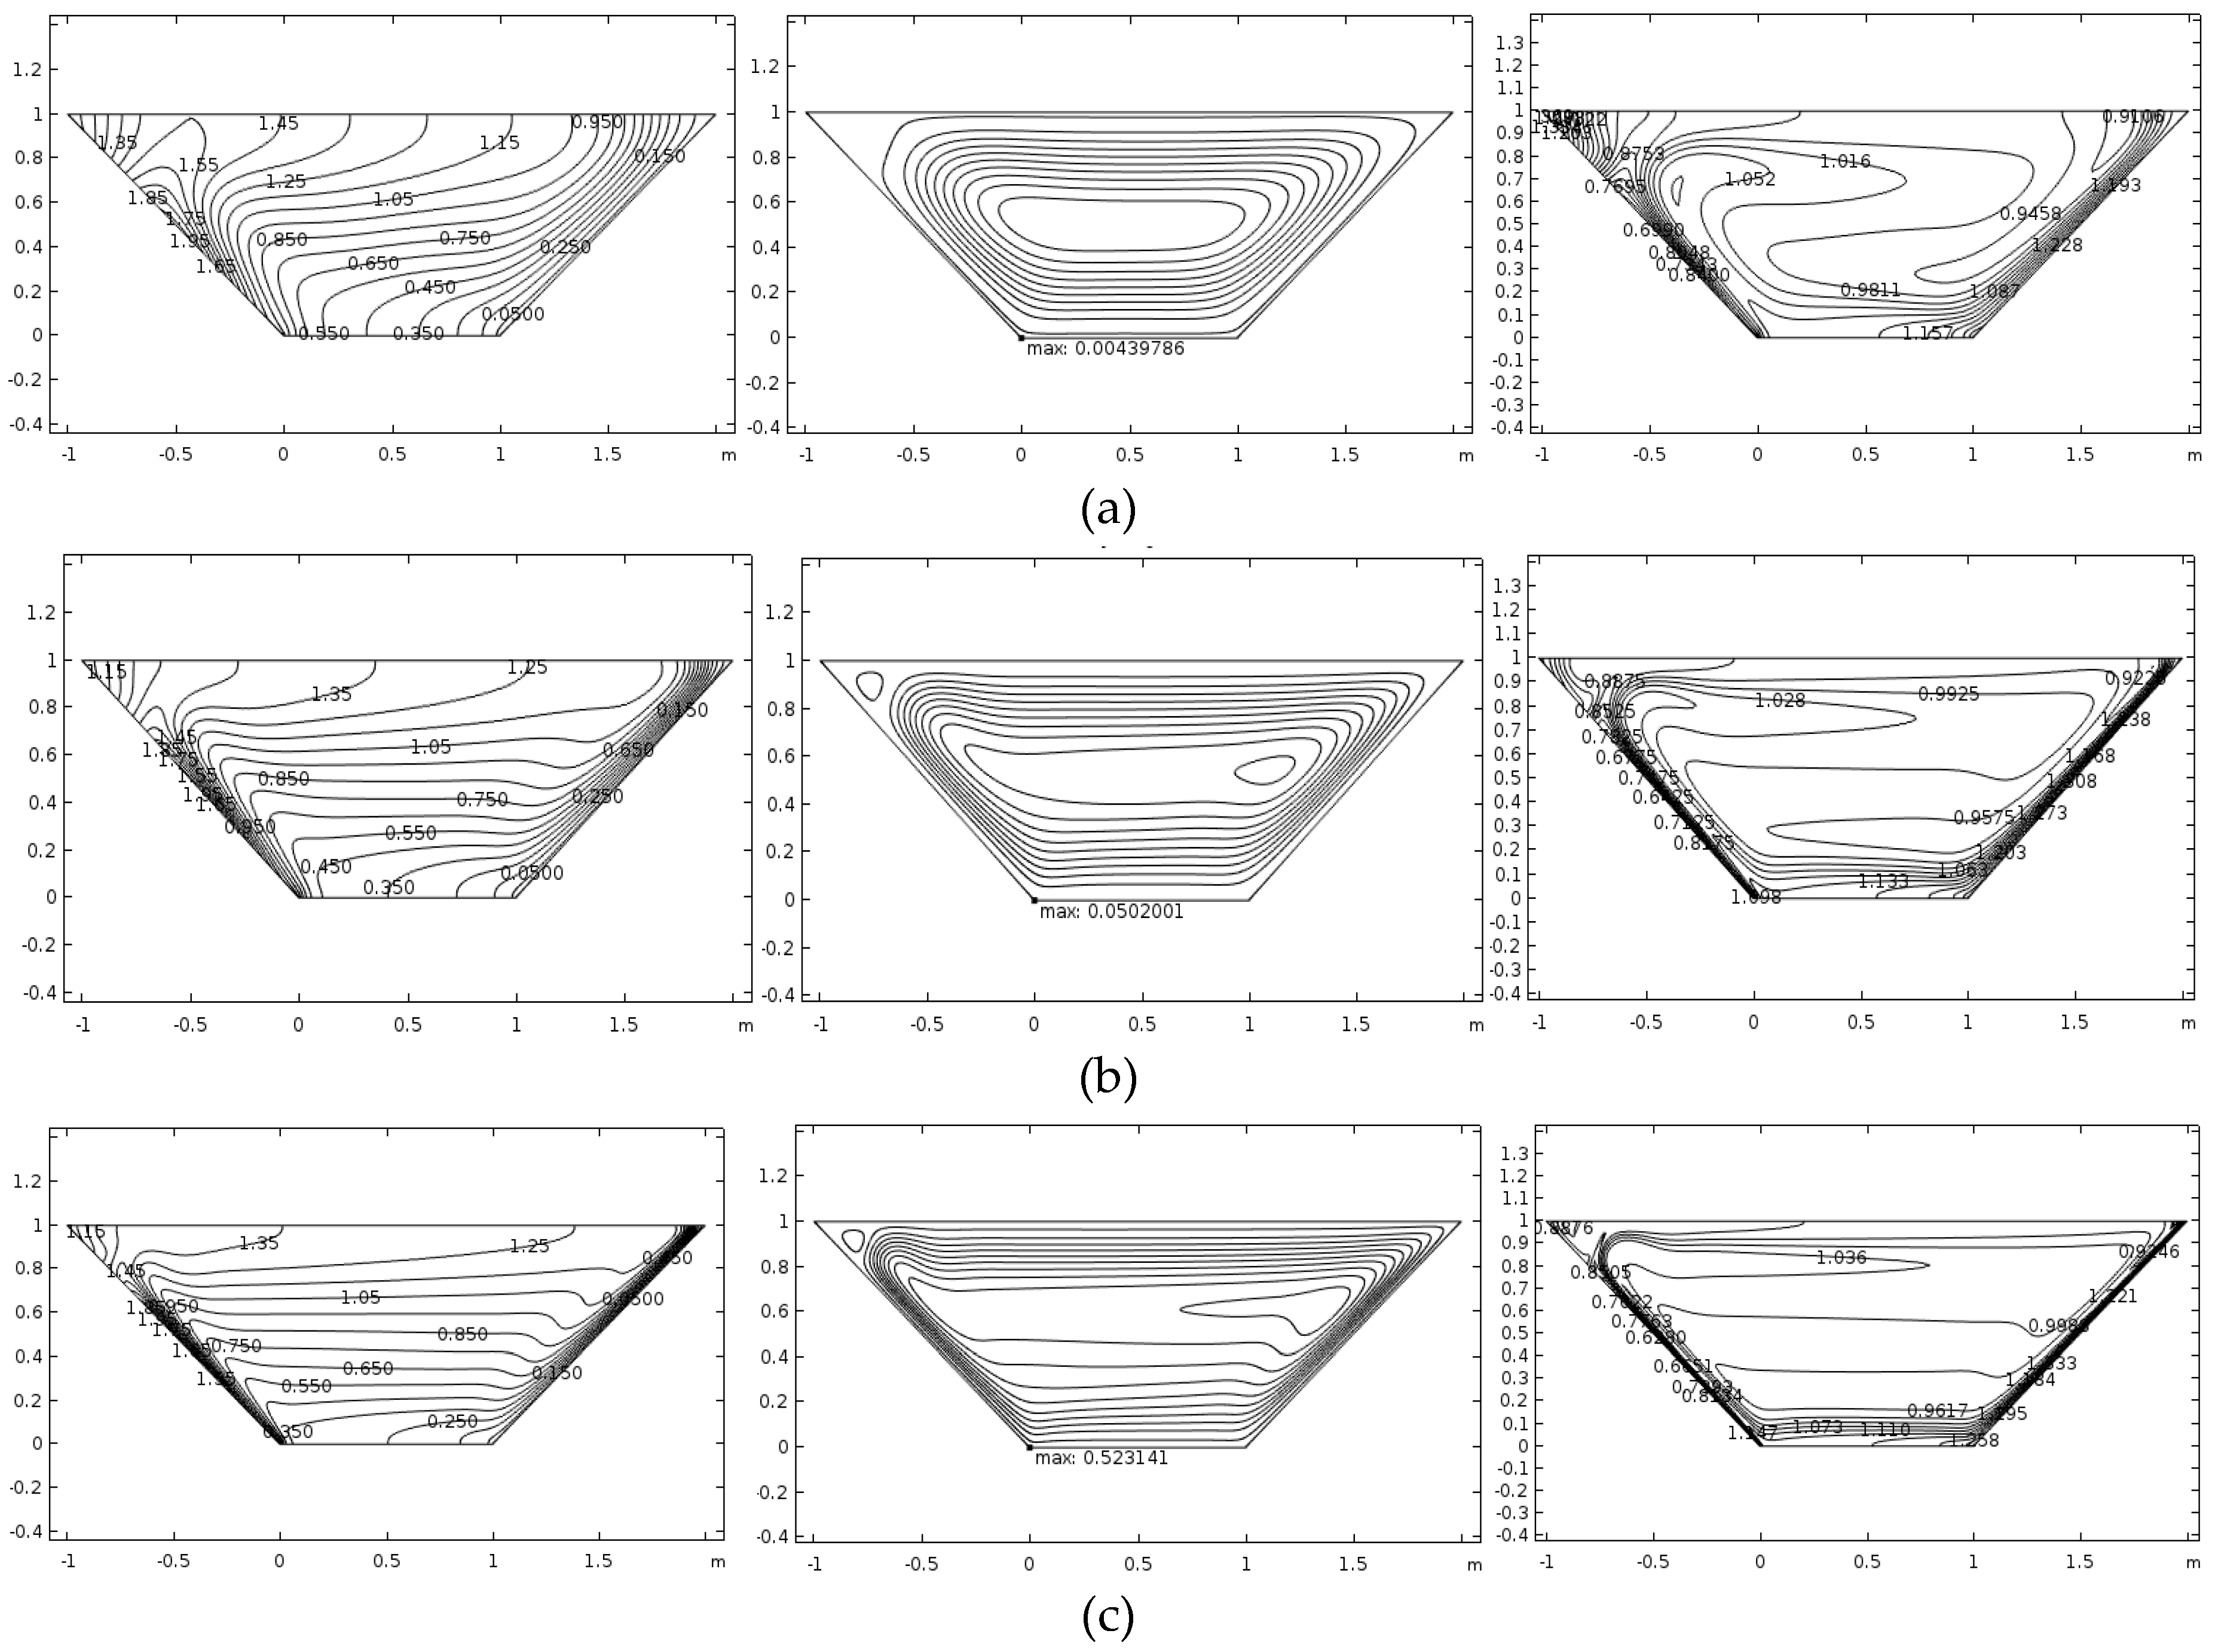
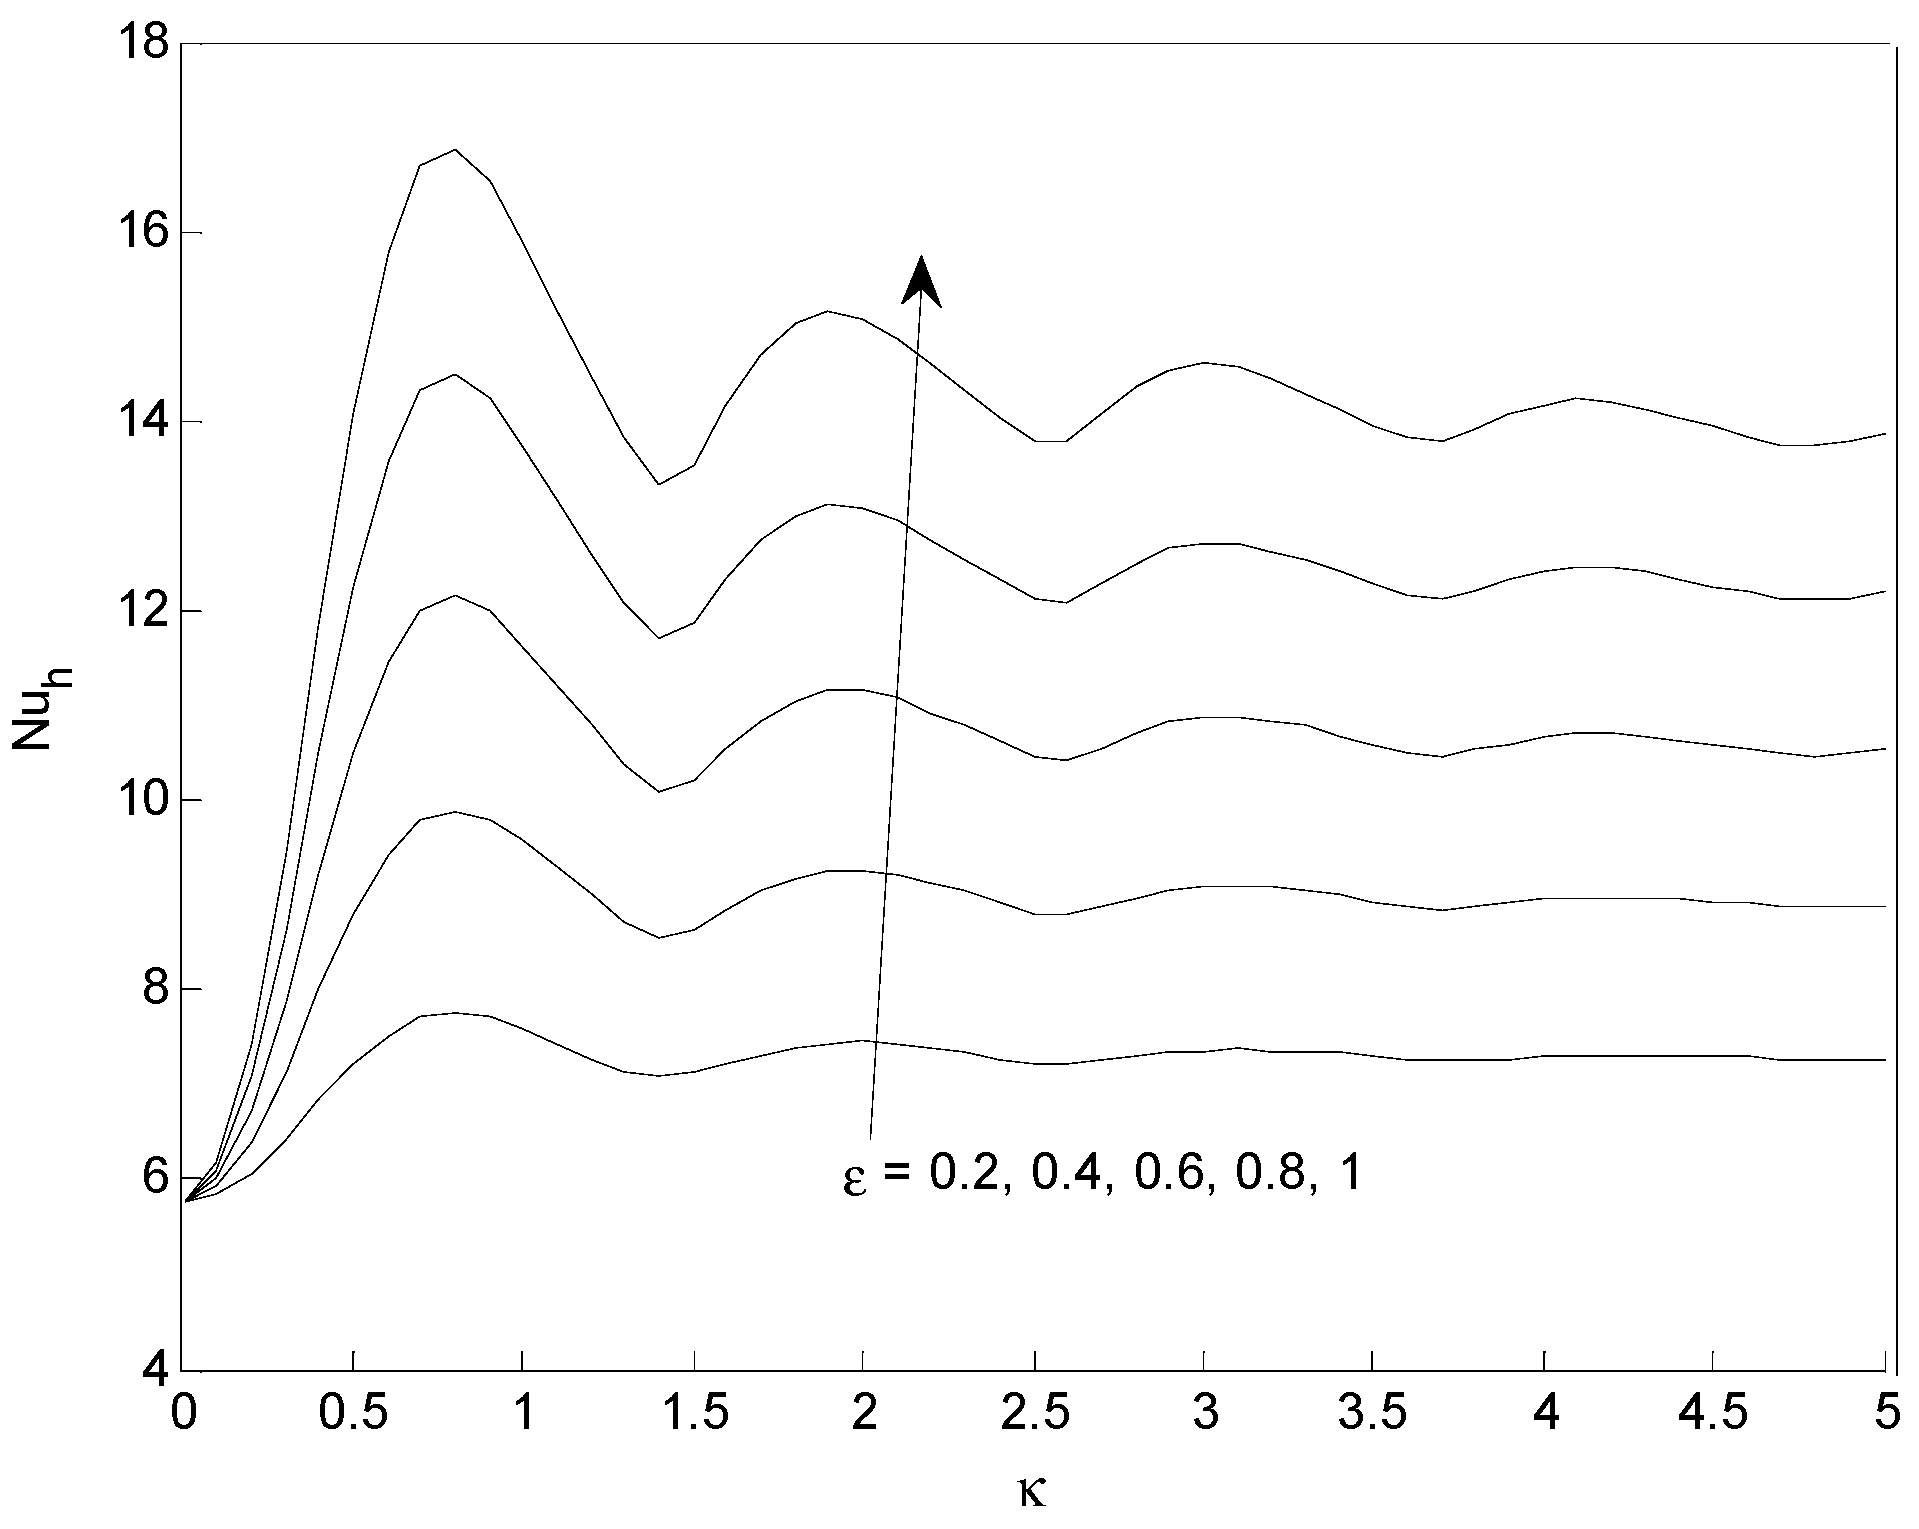
  • The increase in wave amplitude increased Nu. Maximum energy transport occurred for the wave parameter value of about 0.75. The thermal transmission as a function of wave number showed a semi-sinusoidal behavior. However, the general trend of the behavior showed that the growth of the wave number decreased the intensity of energy transport.
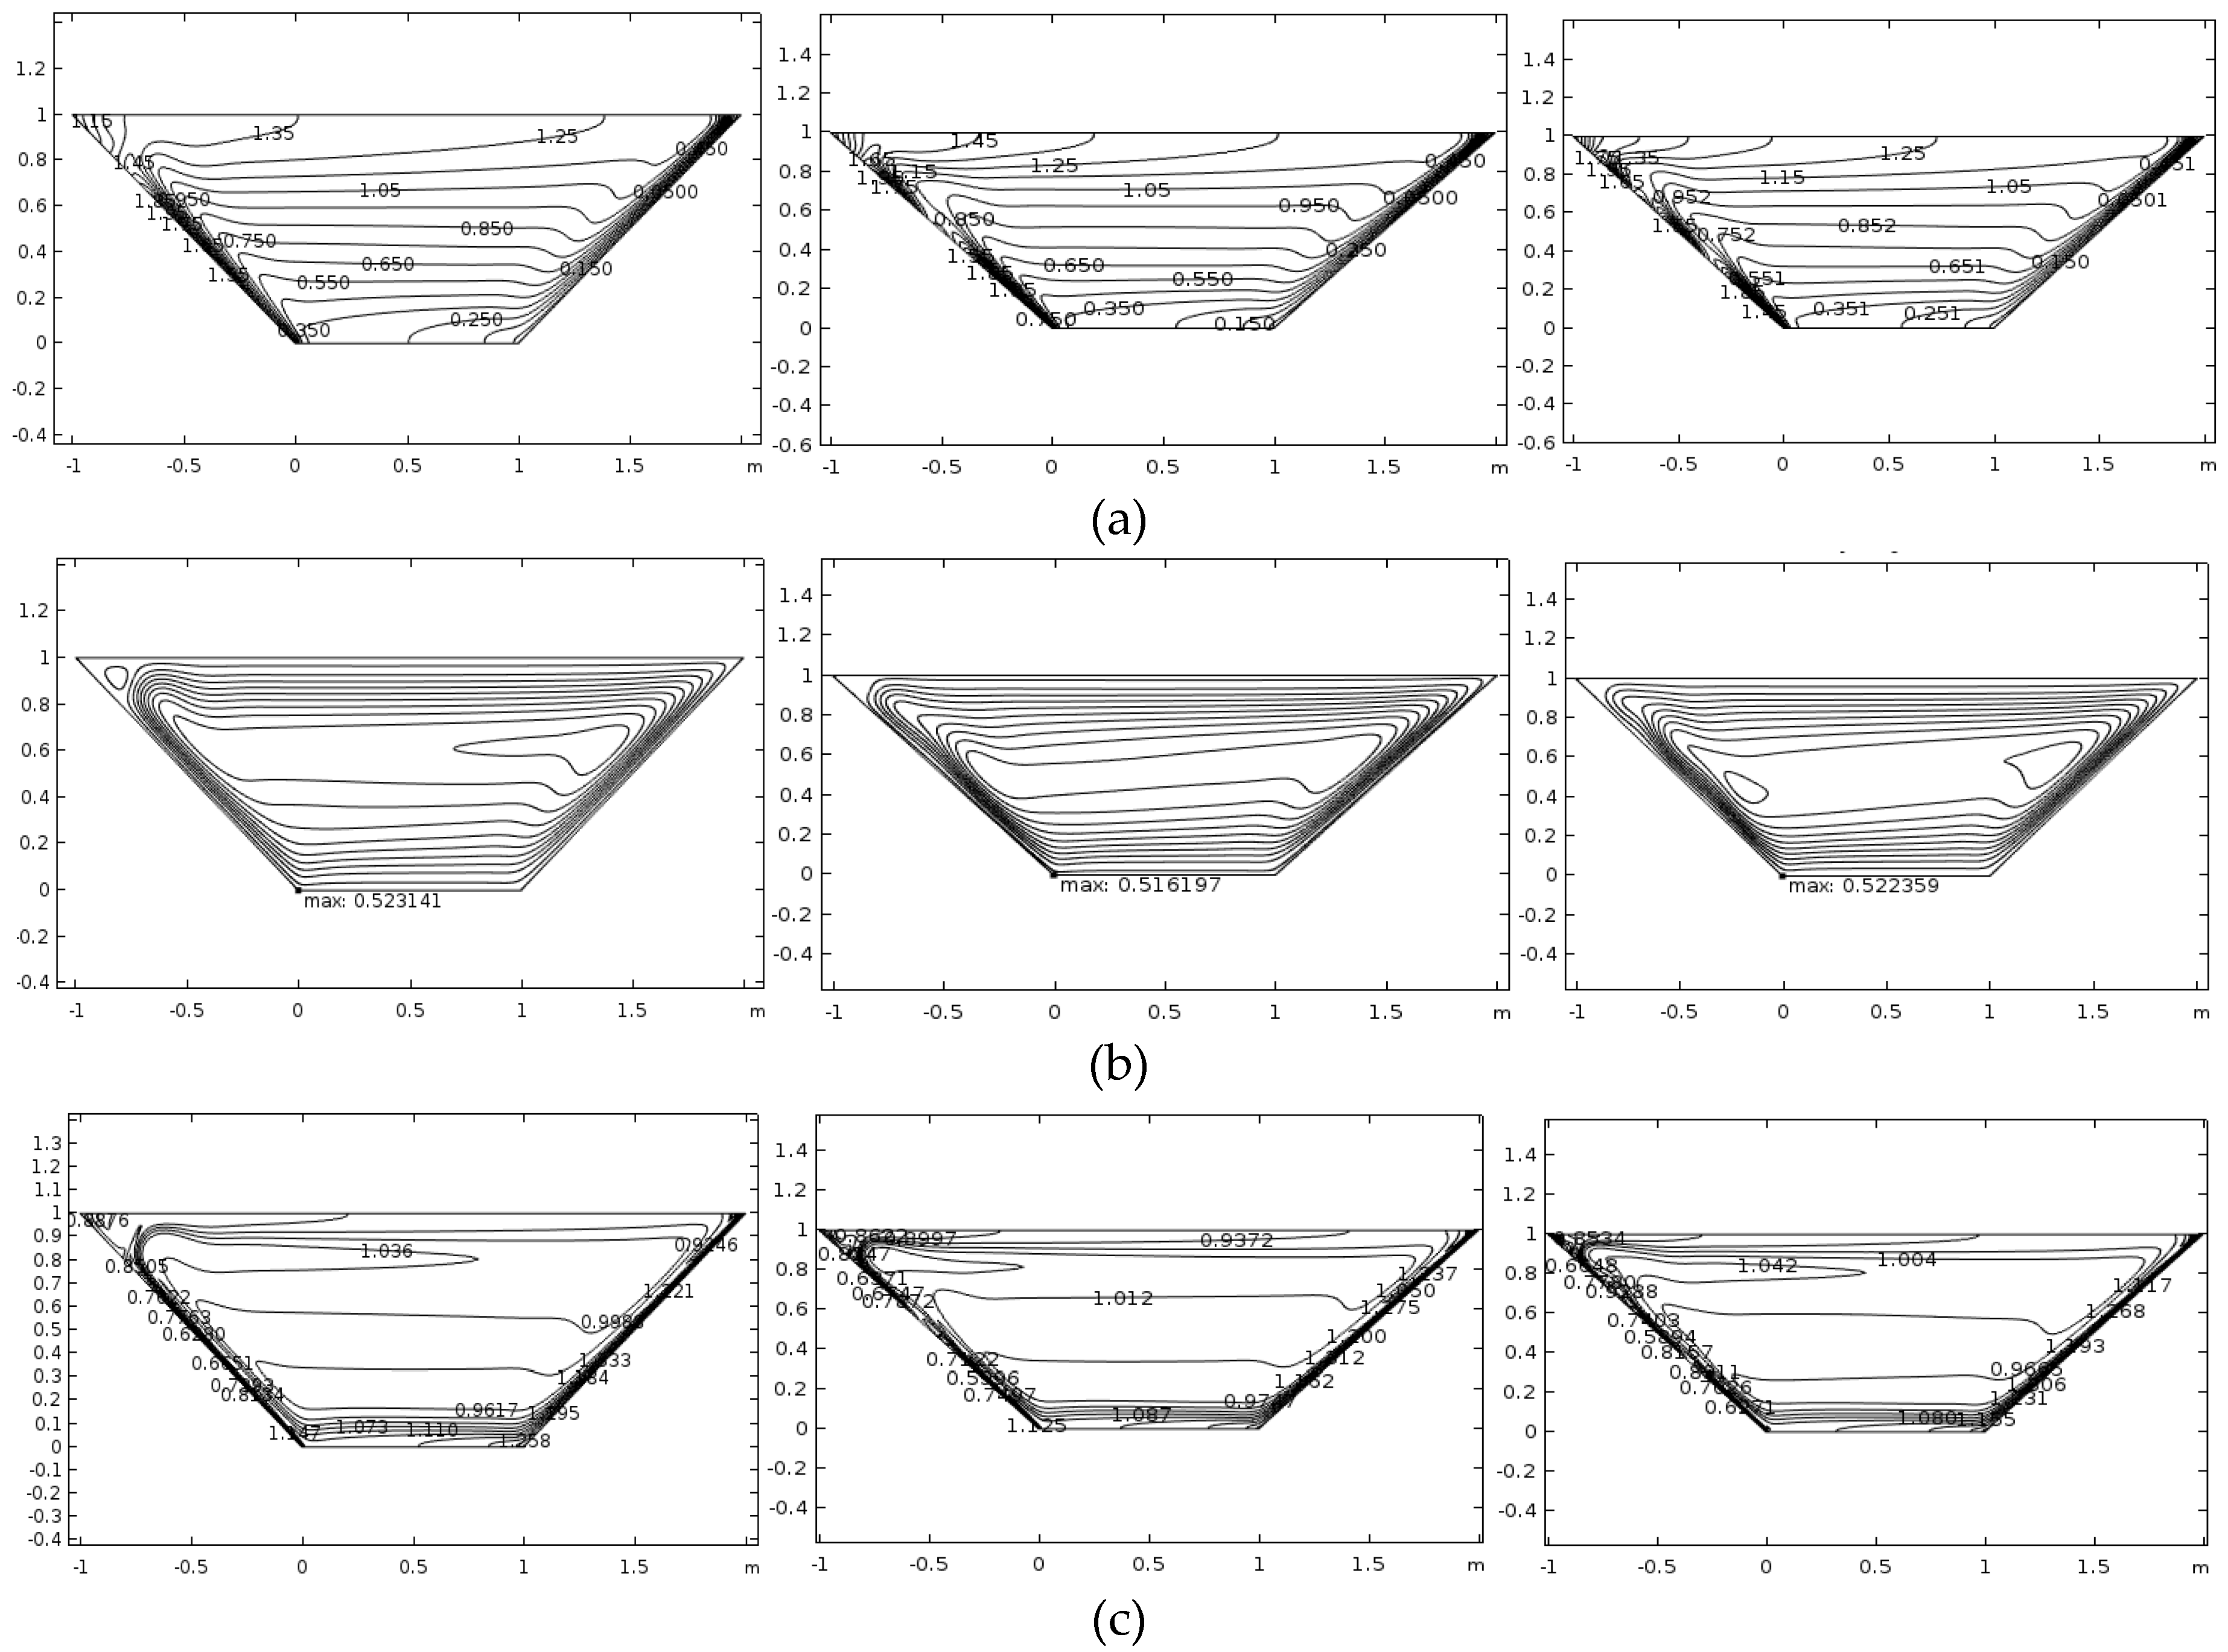
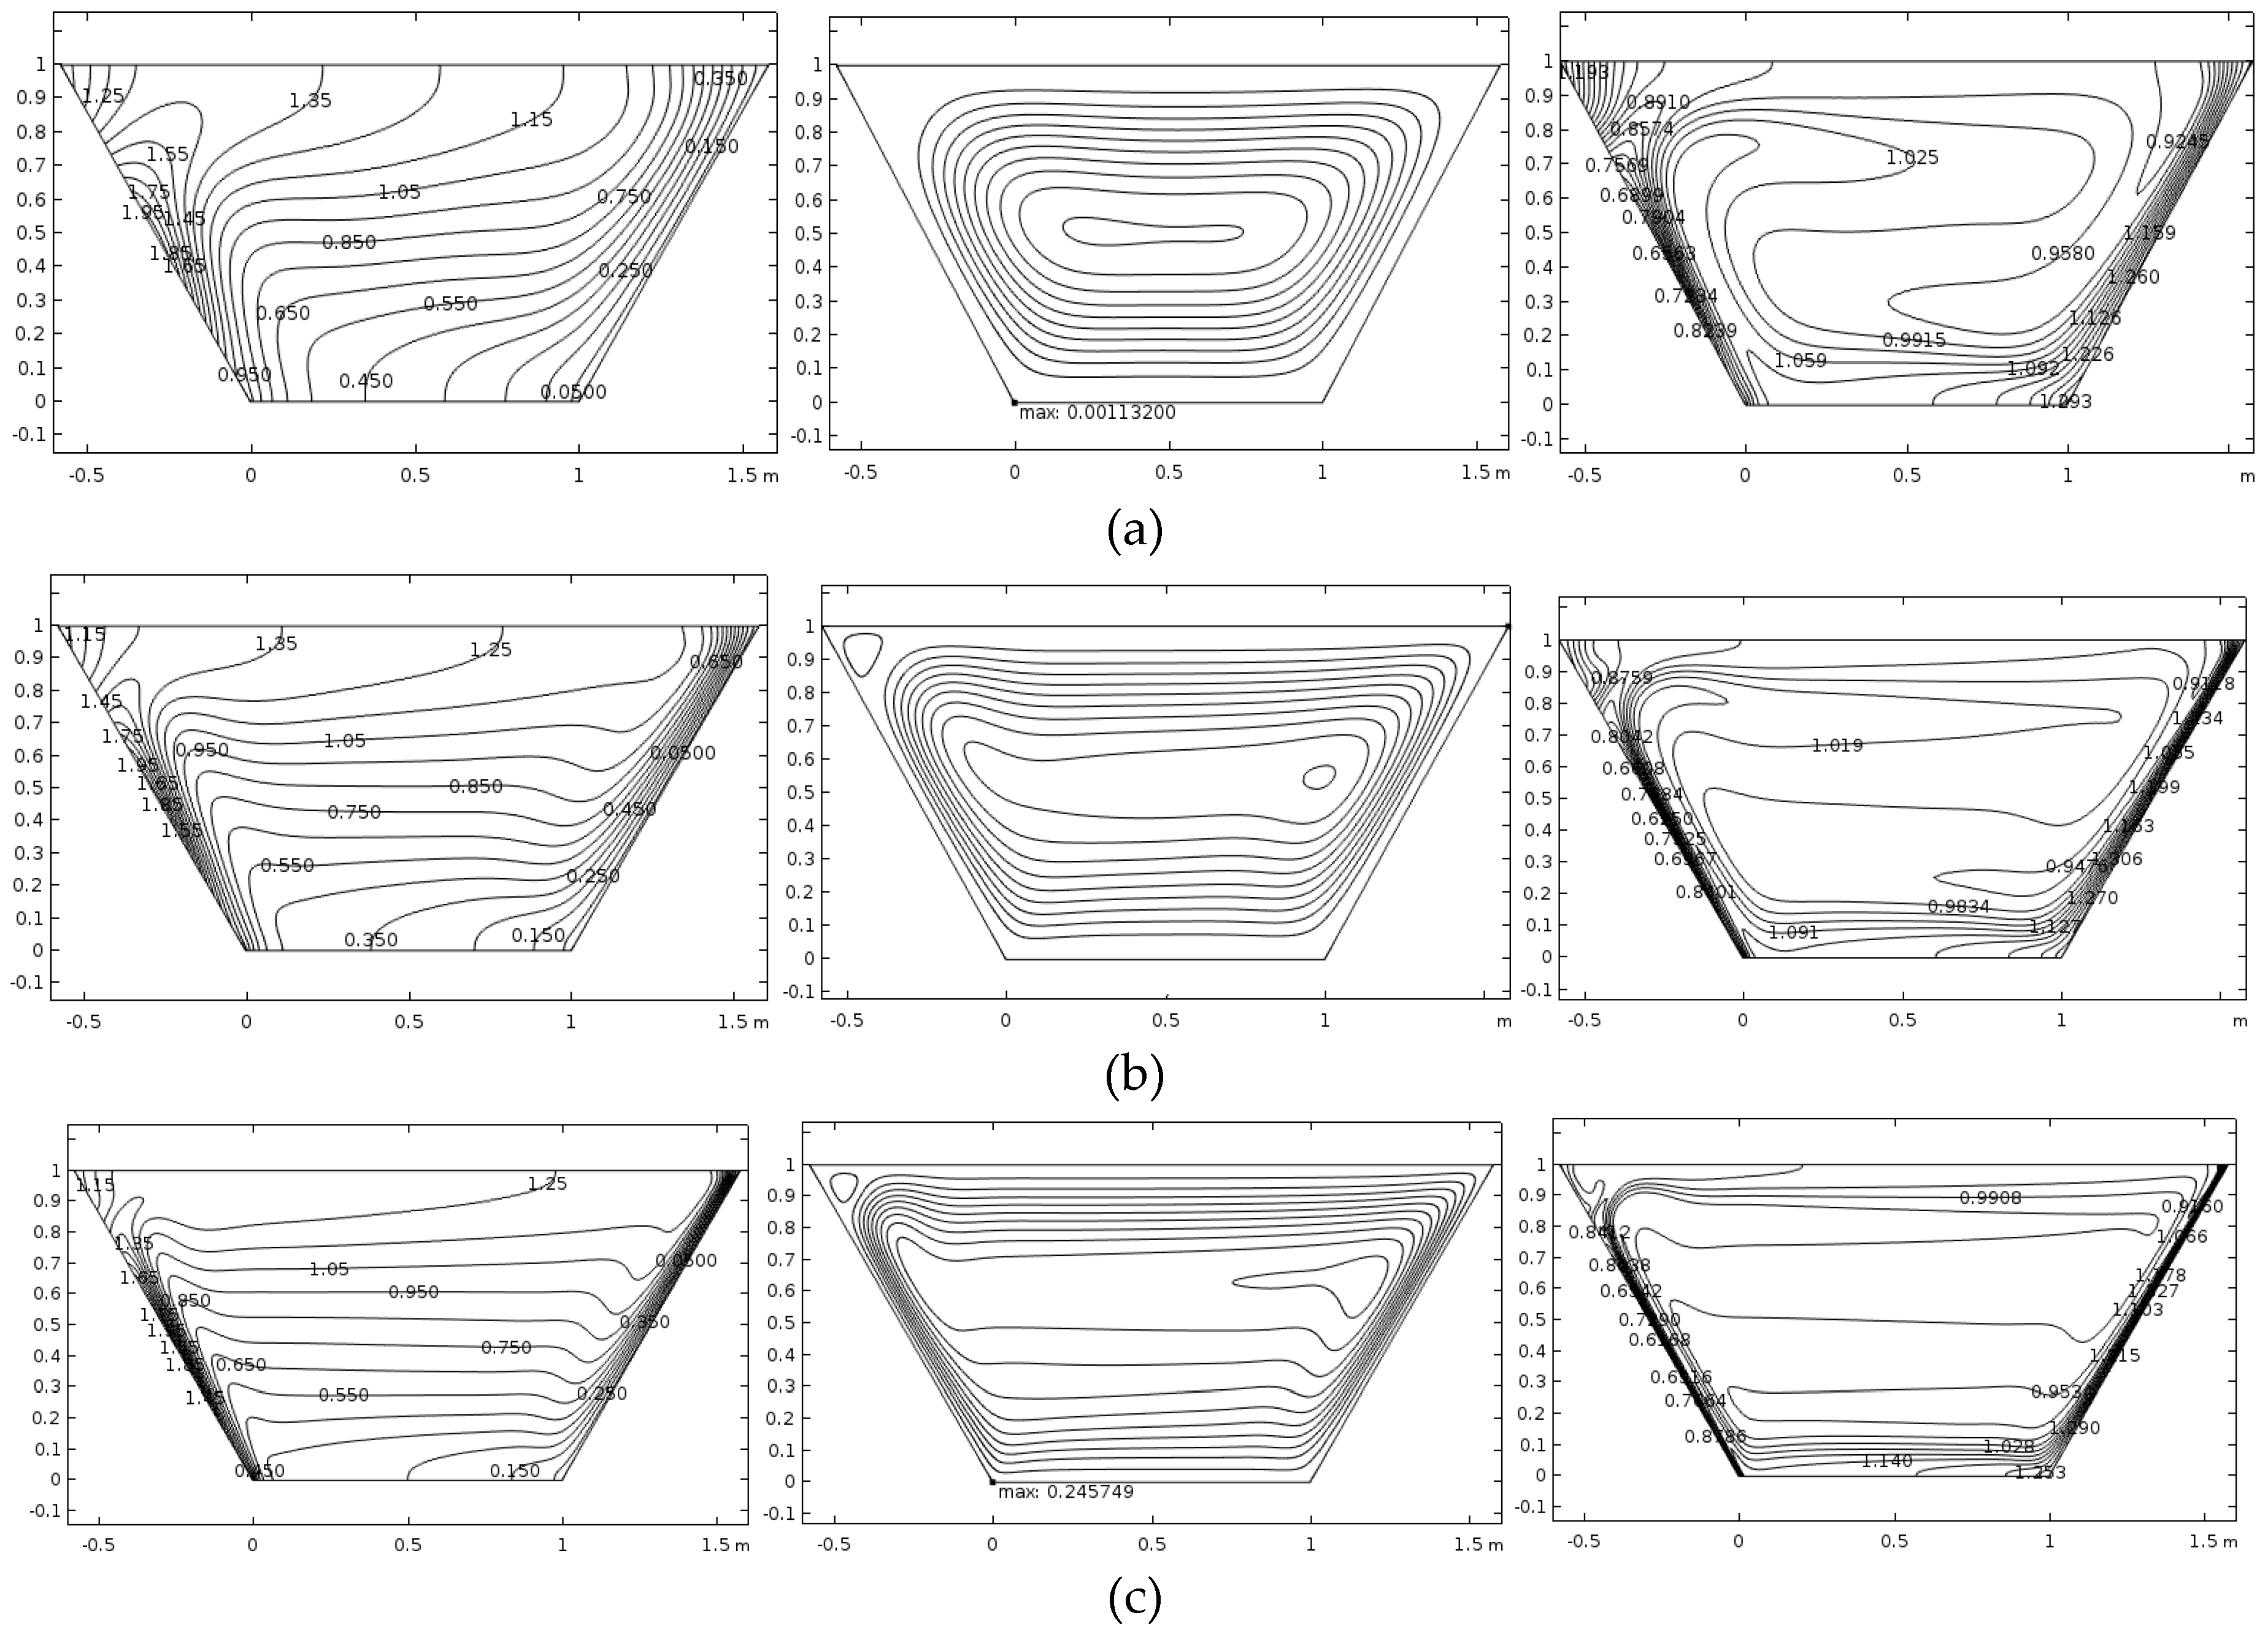
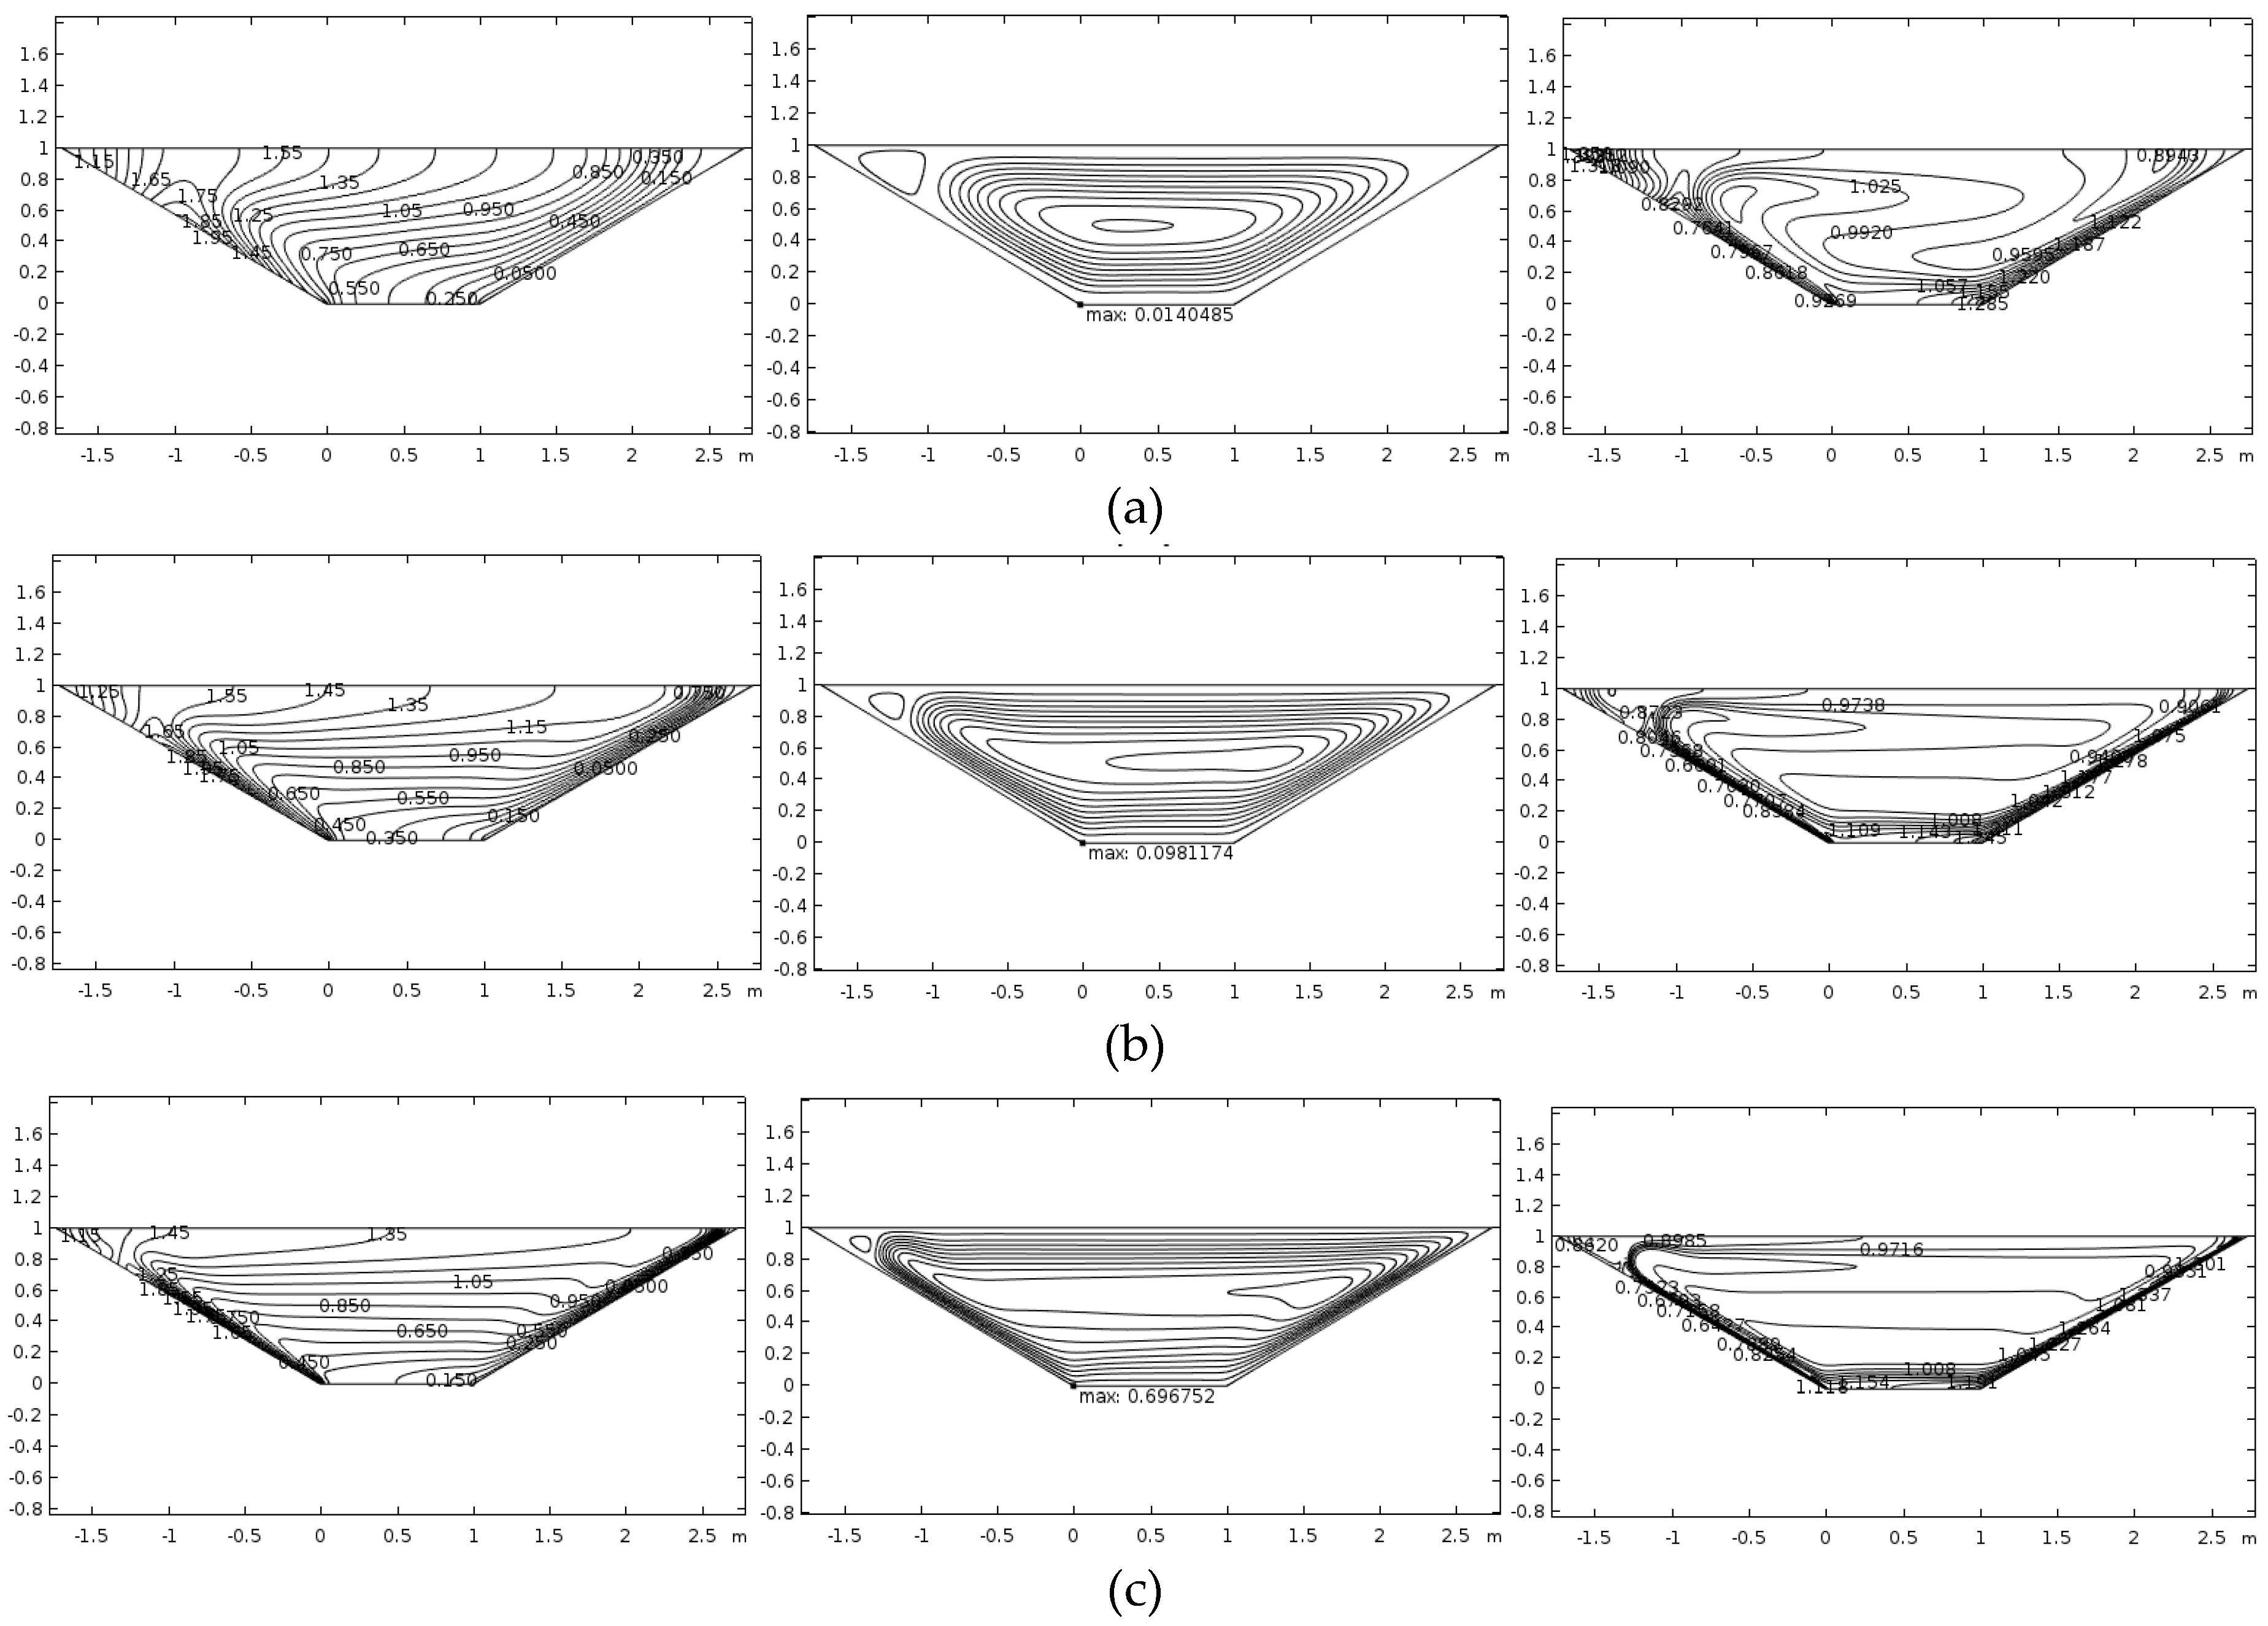
  • The variation of wave number affected the nano-sized particles dispensation in the trapezium. The growth of the wave parameter from 1 to 3 induced concentration peaks in the vicinity of the hot cavity border. The increase in Ra boosted the convection thermal transmission but diminished the effect of wall wave number.
  • When Rayleigh number was low the nanoparticles dispensation was notable inside the trapezoidal domain. However, the rise of Ra shifted the distribution of the nanoparticles toward the cavity walls. The thermophoretic force characterized the motion of nano-sized particles away from the hot border into the central domains of the trapezium.

Author Contributions

I.P. and M.S designed the research; M.G., C.R. and T.G. formulated the mathematical model and computed the numerical results; I.P., M.S., M.G., C.R. and T.G. analyzed the results; C.R. wrote the manuscript. I.P., M.S., M.G., C.R. and T.G. have read and approved this manuscript.

Funding

This research was funded by UEFISCDI, Romania grant number PN-III-P4-ID-PCE-2016-0036 for Cornelia Revnic, Teodor Groşan, and Ioan Pop, by STAR Institute - UBB, Cluj-Napoca, Romania for Mohammad Ghalambaz and by the Ministry of Education and Science of the Russian Federation (Project Number 13.6542.2017/6.7) for Mikhail Sheremet.

Acknowledgments

The author also wishes to thank to the competent Reviewers for their very good comments and suggestions.

Conflicts of Interest

The authors declare no conflict of interest.

Nomenclature

Roman Letters
CNanoparticles volume fraction
C0Reference nanoparticles volume fraction
cpHeat capacity (J⋅kg−1⋅K−1)
DBBrownian diffusion coefficient (m2⋅s−1)
DTThermophoretic diffusion coefficient (m2⋅s−1)
gAcceleration due to gravity (m⋅s−2)
HHeight of the enclosure (m)
HEffective height of the enclosure (m)
kThermal conductivity (W⋅m−1⋅K−1)
LWidth of the enclosure (m)
LeLewis number, L e = α / D B
NbParameter of Brownian motion, N b = δ D B C 0 / α
NrParameter of buoyancy ratio, N r = ( ρ p ρ f ) C 0 / [ ρ β Δ T ( 1 C 0 ) ]
NtParameter of thermophoresis, N t = δ D T Δ T / ( α T C )
NuLocal Nusselt number
N u ¯ Average Nusselt number
pPressure (Pa)
PrPrandtl number, Pr = ν / α
RaRayleigh number, R a = ( 1 C 0 ) g β Δ T L 3 / ( α ν )
tTime in dimensional form (s)
TFluid temperature (K)
TcCooled wall temperature (K)
ThHot wall temperature (K)
u, vVelocity components along the x and y axes in dimensional form (m⋅s−1)
U, VDimensionless velocity components
XDimensionless coordinate
YDimensionless coordinate
x, yDimensional Cartesian coordinates (m)
Greek Symbols
αThermal diffusivity (m2⋅s−1)
βVolumetric thermal expansion coefficient (K−1)
δThermal capacity ratio parameter ( ρ c p ) p / ( ρ c p ) f
μDynamic viscosity (Pa⋅s)
θTemperature in dimensionless form
κWave number of the sinusoidal hot-wall temperature
ρfDensity of the fluid (kg⋅m−3)
ρf0Fluid density at a reference temperature (kg⋅m−3)
ρpDensity of nanoparticles (kg⋅m−3)
( ρ c p ) f Fluid heat capacity (J⋅m−3⋅K−1)
( ρ c p ) p Nanoparticle heat capacity (J⋅m−3⋅K−1)
εAmplitude of the sinusoidal hot-wall temperature
τDimensionless time
ϕRescaled nanoparticles volume fraction

References

  1. De Davis, G.; Jones, I.P. Natural convection in a square cavity: A bench mark numerical solution. Int. J. Numer. Meth. Fluids 1983, 3, 227–248. [Google Scholar] [CrossRef]
  2. Barakos, G.; Mitsoulis, E.; Assimacopoulos, D. Natural convection flow in a square cavity revisited: Laminar and turbulent models with wall functions. Int. J. Numer. Meth. Heat Fluid Flow 1994, 18, 695–719. [Google Scholar] [CrossRef]
  3. Abu-Nada, E.; Masoud, Z.; Oztop, H.F.; Campo, A. Effect of nanofluid variable properties on natural convection in enclosures. Int. J. Therm. Sci. 2010, 49, 479–491. [Google Scholar] [CrossRef]
  4. Lee, T.S. Numerical experiments with fluid convection in tilted nonrectangular enclosures. Numer. Heat Transf. A 1991, 19, 487–499. [Google Scholar] [CrossRef]
  5. Saeid, H.N.; Yaacob, Y. Natural convection in a square cavity with spatial side-wall temperature variation. Numer. Heat Transf. A 2006, 49, 683–697. [Google Scholar] [CrossRef]
  6. Demirdžić, I.; Lilek, Ž.; Perić, M. Fluid flow and heat transfer test problems solutions for non- orthogonal grids: Benchmark. Int. J. Numer. Methods Fluids 1992, 15, 329–354. [Google Scholar] [CrossRef]
  7. Sheremet, M.A.; Groşan, T.; Pop, I. Steady-state free convection in right-angle porous trapezoidal cavity filled by a nanofluid: Buongiorno’s mathematical model. Eur. J. Mech. B/Fluids 2015, 53, 241–250. [Google Scholar] [CrossRef]
  8. Kuyper, R.A.; Hoogendoorn, C.J. Laminar natural convection flow in trapezoidal enclosures. Numer. Heat Transf. Part A 2012, 28, 55–67. [Google Scholar] [CrossRef]
  9. Kumar, B.V.R.; Kumar, B. Parallel computation of natural convection in trapezoidal porous enclosures. Math. Comput. Simul. 2004, 65, 221–229. [Google Scholar] [CrossRef]
  10. Baytas, A.C.; Pop, I. Natural convection in a trapezoidal enclosure filled with a porous medium. Int. J. Eng. Sci. 2001, 39, 125–134. [Google Scholar] [CrossRef]
  11. Varol, Y.; Oztop, H.F.; Pop, I. Numerical analysis of natural convection in an inclined trapezoidal enclosure filled with a porous medium. Int. J. Therm. Sci. 2008, 47, 1316–1331. [Google Scholar] [CrossRef]
  12. Varol, Y.; Oztop, H.F.; Pop, I. Natural convection in right-angle porous trapezoidal enclosure partially cooled from inclined wall. Int. Commun. Heat Mass Transf. 2009, 36, 6–15. [Google Scholar] [CrossRef]
  13. Varol, Y.; Oztop, H.F.; Pop, I. Maximum density effects on buoyancy-driven convection in a porous trapezoidal cavity. Int. Commun. Heat Mass Transf. 2010, 37, 401–409. [Google Scholar] [CrossRef]
  14. Varol, Y. Natural convection in divided trapezoidal cavities filled with fluid saturated porous media. Int. J. Heat Mass Transf. 2010, 37, 1350–1358. [Google Scholar] [CrossRef]
  15. Peric, M. Natural convection in trapezoidal cavities. Numer. Heat Transf. A 1993, 24, 213–219. [Google Scholar] [CrossRef]
  16. van der Eyden, J.T.; van der Meer, T.H.; Hanjalic, K.; Biezen, E.; Bruining, J. Double diffusive natural convection in trapezoidal enclosures. Int. J. Heat Mass Transf. 1998, 41, 1885–1898. [Google Scholar] [CrossRef]
  17. Boussaid, M.; Djerrada, A.; Bouhadef, M. Thermosolutal transfer within trapezoidal cavity. Numer. Heat Transf. A 2003, 43, 431–448. [Google Scholar] [CrossRef]
  18. Papanicolaou, E.; Belessiotis, V. Double-diffusive natural convection in an asymmetric trapezoidal enclosure: Unsteady behavior in the laminar and the turbulent-flow regime. Int. J. Heat Mass Transf. 2005, 48, 191–209. [Google Scholar] [CrossRef]
  19. Hammami, M.; Mseddi, M.; Baccar, M. Numerical study of coupled heat and mass transfer in a trapezoidal cavity. Eng. Appl. Comput. Fluid Dyn. 2007, 1, 216–226. [Google Scholar] [CrossRef]
  20. Choi, S.U.S. Enhancing thermal conductivity of fluids with nanoparticles. In Developments and Applications of Non-Newtonian Flows; Siginer, D.A., Wang, H.P., Eds.; Argonne National Lab.: Lemont, IL, USA, 1995; Volume 231, pp. 99–105. [Google Scholar]
  21. Wen, D.; Lin, G.; Vafaei, S.; Zhang, K. Review of nanofluids for heat transfer applications. Particuology 2009, 7, 141–150. [Google Scholar] [CrossRef]
  22. Godson, L.; Raja, B.; Lal, D.M.; Wongwises, S. Enhancement of heat transfer using nanofluids—An overview. Renew. Sustain. Energy Rev. 2010, 14, 629–641. [Google Scholar] [CrossRef]
  23. Das, S.K.; Choi, S.U.S.; Yu, W.; Pradeep, Y. Nanofluids: Science and Technology; Wiley: Hoboken, NJ, USA, 2008. [Google Scholar]
  24. Nield, D.A.; Bejan, A. Convection in Porous Media, 4th ed.; Springer: New York, NY, USA, 2013. [Google Scholar]
  25. Minkowycz, W.J.; Sparrow, E.M.; Abraham, J.P. (Eds.) Nanoparticle Heat Transfer and Fluid Flow; CRC Press, Taylor & Fracis Group: New York, NY, USA, 2013. [Google Scholar]
  26. Stathis, E.E. Michaelides, Nanofluidics: Thermodynamic and Transport Properties; Springer: Berlin, Germany, 2014. [Google Scholar]
  27. Shenoy, A.; Sheremet, M.; Pop, I. Convective Flow and Heat Transfer from Wavy Surfaces: Viscous Fluids, Porous Media and Nanofluids; CRC Press, Taylor & Francis Group: New York, NY, USA, 2016. [Google Scholar]
  28. Buongiorno, J.; Bang, I.C.; Buongiorno, J.; Venerus, D.C.; Prabhat, N.; McKrell, T.; Townsend, J.; Christianson, R.; Tolmachev, Y.V.; Keblinski, P.; et al. A benchmark study on the thermal conductivity of nanofluids. J. Appl. Phys. 2009, 106, 1–14. [Google Scholar] [CrossRef]
  29. Kakaç, S.; Pramuanjaroenkij, A. Review of convective heat transfer enhancement with nanofluids. Int. J. Heat Mass Transf. 2009, 52, 3187–3196. [Google Scholar] [CrossRef]
  30. Manca, O.; Jaluria, Y.; Poulikakos, D. Heat transfer in nanofluids. Adv. Mech. Eng. 2010, 2010. [Google Scholar] [CrossRef]
  31. Fan, J.; Wang, L. Review of heat conduction in nanofluids. ASME J. Heat Transf. 2011, 133, 1–14. [Google Scholar] [CrossRef]
  32. Mahian, O.; Kianifar, A.; Kalogirou, S.A.; Pop, I.; Wongwises, S. A review of the applications of nanofluids in solar energy. Int. J. Heat Mass Transf. 2013, 57, 582–594. [Google Scholar] [CrossRef]
  33. Sheikholeslami, M.; Ganji, D.D. Nanofluid convective heat transfer using semi analytical and numerical approaches: A review. J. Taiwan Inst. Chem. Eng. 2016, 65, 43–77. [Google Scholar] [CrossRef]
  34. Groşan, T.; Sheremet, M.A.; Pop, I. Heat transfer enhancement in cavities filled with nanofluids. In Advances in Heat Transfer Fluids: From Numerical to Experimental Techniques; Minea, A.A., Ed.; CRC Press, Taylor & Francis: New York, NY, USA, 2017; pp. 267–284. [Google Scholar]
  35. Myers, T.G.; Ribera, H.; Cregan, V. Does mathematics contribute to the nanofluid debate? Int. J. Heat Mass Transf. 2017, 111, 279–288. [Google Scholar] [CrossRef]
  36. Alsabery, A.I.; Chamkhab, A.J.; Salehd, H.; Hashima, I.; Chananee, B. Effects of spatial side-wall temperature variations on transient natural convection of a nanofluid in a trapezoidal cavity. Int. J. Numer. Methods Heat Fluid Flow 2017, 27, 1365–1384. [Google Scholar] [CrossRef]
  37. Oztop, H.F. Natural convection in partially cooled and inclined porous rectangular enclosure. Int. J. Therm. Sci. 2006, 46, 149–156. [Google Scholar] [CrossRef]
  38. Hirota, K.; Sugimoto, M.; Kato, M.; Tsukagoshi, K.; Tanigawa, T.; Sugimoto, H. Preparation of zinc oxide ceramics with a sustainable antibacterial activity under dark conditions. Ceram. Int. 2010, 36, 497–506. [Google Scholar] [CrossRef]
  39. Pepper, D.W.; Heinrich, J.C. The finite element method. In Basic Concepts and Applications with Matlab, Maple and Comsol; CRC Press, Taylor & Francis Group: New York, NY, USA, 2017. [Google Scholar]
  40. Blazek, J. Computational Fluid Dynamics: Principles and Applications; Elsevier: Oxford, UK, 2001. [Google Scholar]
  41. Buongiorno, J. Convective transport in nanofluids. ASME J. Heat Transf. 2006, 128, 240–250. [Google Scholar] [CrossRef]
Figure 1. Analyzed sketch and physical model.
Energies 12 01461 g001
Figure 2. Isotherms, streamlines, and isoconcentrations for Pr = 7, φ = π/4, κ = 1, ε = 0.5, and (a) Ra = 104, (b) Ra = 105, (c) Ra = 106.
Energies 12 01461 g002
Figure 3. Isotherms, streamlines, and isoconcentrations for Pr = 7, φ = π/6, κ = 1, ε = 0.5, and (a) Ra = 104, (b) Ra = 105, (c) Ra = 106.
Energies 12 01461 g003
Figure 4. Isotherms, streamlines, and isoconcentration lines for Pr = 7, φ = π/3, κ = 1, ε = 0.5, and (a) Ra = 104, (b) Ra = 105, (c) Ra = 106.
Energies 12 01461 g004
Figure 5. Isotherms, streamlines, and isoconcentrations for Ra = 106, Pr = 7, φ = π/4, ε = 0.5, and various quantities of wave parameter (a) κ = 1, (b) κ = 2, (c) κ = 3.
Energies 12 01461 g005
Figure 6. Variation of temperature with amplitude along the hot wall for Ra = 106, Pr = 7, φ = π/4, ε = 0.5.
Energies 12 01461 g006
Figure 7. Time profiles of the average Nu for the heated border at Ra = 106, Pr = 7, φ = π/3: (a) various ε and κ = 1; (b) various κ and ε = 0.5.
Energies 12 01461 g007
Figure 8. Time profiles of average Nu with Ra for κ = 1 and ε = 0.5.
Energies 12 01461 g008
Figure 9. Profiles of average Nu with κ and ε for a stationary case at Ra = 106, Pr = 7, φ = π/3.
Energies 12 01461 g009
Table 1. Accuracy test for Ra = 104, Pr = 7, φ = π/4, κ = 1, ε = 0.5, N t = N b = 0.1 ,   L e = 10 ,   N r = 0.1 .
Nodes N u ¯ h
20 × 20 2.7049
40 × 40 2.7065
60 × 60 2.7067
80 × 80 2.7068
100 × 100 2.7069
120 × 120 2.7068
Table 2. Variation of Nu with Pr for Ra = 106 compared with the data of Demirdzic et al. [6].
PrDemirdzic et al. [6]Present
0.15.98495.9829
107.58017.5847
Table 3. Variations of Nu for Ra = 103 and 104 compared with the data of De Vahl Davis [1].
Mesh SizeRaDe Vahl Davis [1]Present
0.0251031.1161.121
0.0251042.2342.306

