Multiple-Criteria Decision-Making for Assessing the Enhanced Geothermal Systems


1
Faculty of Electrical Engineering and Computing, University of Zagreb, Unska 3, 10000 Zagreb, Croatia
2
Département GEOS UniLaSalle, Équipe B2R, 19 rue Pierre Waguet, 60000 Beauvais, France
*
Author to whom correspondence should be addressed.
Energies 2019, 12(9), 1597; https://doi.org/10.3390/en12091597
Submission received: 1 April 2019
/
Revised: 23 April 2019
/
Accepted: 24 April 2019
/
Published: 26 April 2019
(This article belongs to the Special Issue Selected Papers from MEDPOWER 2018—the 11th Mediterranean Conference on Power Generation, Transmission, Distribution and Energy Conversion)
Abstract
:This paper presents the main features of a multiple-criteria decision-making tool for economic and environmental assessment of enhanced geothermal systems projects. The presented holistic approach takes into account important influencing factors such as technical specifications, geological characteristics, spatial data, energy and heat prices, and social and environmental impact. The multiple-criteria decision-making approach uses a weighted decision matrix for evaluating different enhanced geothermal systems alternatives based on a set of criterions which are defined and presented in this paper. The paper, defines and quantifies new criterions for assessing enhanced geothermal systems for a particular site. For evaluation of the relative importance of each criterion in decision making, the weight is associated with each of the listed criterions. The different scenarios of end-use applications are tested in the case study. Finally, in the case study, the data and statistics are collected from real geothermal plants. The case study provides results for several scenarios and the sensitivity analysis based on which the approach is validated. The proposed method is expected to be of great interest to investors and decision makers as it enables better risk mitigation.
1. Introduction
The growing concern around rising energy costs, the dependence on fossil fuels, and the environmental impact of energy supply makes it necessary to find economical and environment-friendly energy alternatives. The largest share in newly-installed power capacities around the world is covered by wind and solar plants. Besides those two renewables, geothermal energy also represents large untapped renewable potential and low environmental impact, especially regarding greenhouse gases emissions. Despite many other advantages, like a reliable, constant baseload electricity or direct heat usage and a small land area footprint, geothermal energy is nowadays still a small contributor to the primary energy consumption. Its worldwide installed capacity is estimated at 12.9 GW [1] and share in total electricity generation of less than 1%. The main reasons are related to the risks and uncertainties of sustained fluid provision from the reservoirs and large upfront costs associated with exploration, well drilling and stimulation [2]. Furthermore, the traditional hydrothermal systems, based on mature and well-known technology, enable the exploitation of mainly high-enthalpy reservoirs, whereas a huge geothermal potential is present in low permeable, low porosity and low to medium enthalpy bedrock. In order to enhance reservoir productivity in low permeable rocks, Enhanced Geothermal Systems (EGS) technology has been developed. The EGS technique consists of creating a fracture system in the targeted geological formation through which geothermal fluid can circulate. Hydraulic and chemical stimulations are used to create these fractures. The thermal energy stored in the hot rock mass gets extracted by circulating the fluid through the reservoir. The circulation of the fluid is obtained with different extraction technologies, among which the most prominent are so-called injector-producer doublets or borehole heat exchangers.
Aside from exploiting the geothermal heat from low permeable bedrock, additional energy can be recovered from thousands of mature or abandoned oil wells. Mature oil fields have been used for production for a long time, but their production has reached its peak and has started to decline. The typical production pattern of most oil producing wells displays an increase of water with time, from 0% initially to a point, typically above 95%, when it is not economic to produce the remaining oil. Mature oil fields account for more than 70% of world’s oil and gas production, and regarding European oil fields, it is expected that wells are nowadays producing much more water than oil, with average water to a fluid ratio of 90% and with temperature up to 90 °C and sometimes higher. This remaining heat is currently usually wasted, as it is simply re-injected into the reservoir for pressure maintenance or sweep purpose. There are several studies concentrating on energy recovery from mature or abandoned oil fields. In Reference [3] a preliminary assessment of the potential for geothermal exploitation of the co-produced water from wells in the Villafortuna-Trecate oil field in Italy was made by comparing three different implementation scenarios for the possible use of the co-produced hot water: direct use district heating (DH), electric power generation through Organic Rankine Cycle (ORC) plant, and co-generation of heat and power. In Reference [4] energy from abandoned oil and gas reservoirs is used by oxidizing the residual oil with the injected air. In Reference [5] a simulation for the determination of geothermal power production from abandoned oil wells by injecting and retrieving a secondary fluid is performed. Technical feasibility study of acquiring geothermal energy from existing abandoned oil and gas wells is conducted in Reference [6]. Computational results indicate that the geothermal energy produced from abandoned wells depends largely on the flow rate of the fluid and the geothermal gradient. Moreover, the results also indicate that the distance of the two proposed wells should not be less than 40 m to avoid their interrelationships. A Poland case study on the usage of abandoned oil and gas wells for recovering geothermal heat is given in Reference [7]. Some important aspects of power generation using the co-produced hot oil and liquid, with temperatures around 120 °C, from Huabei oil field were studied in Reference [8]. Study on the geothermal power generation using abandoned oil wells is done in Reference [9] with isobutane as working fluid. Also, some interesting insights are given regarding how to increase obtained heat. The results in Reference [10] show that it is necessary to consider the oil and gas saturation while estimating geothermal reserve in oil and gas reservoirs. In Reference [11] the Croatian case of the binary power plant installed in Velika Ciglena is described and in Reference [12] the economic feasibility of this power plant is presented. Moreover, the thermodynamic cycle optimization of Velika Ciglena power plant is conducted in Reference [13]. The explorations in Croatia for the national oil company showed a very high temperature of geothermal water in the oil negative well (about 170 °C). Nowadays, the power plant at Velika Ciglena is the largest ORC geothermal power plant in Europe, with design conditions that allow for a 15 MWe installed capacity. The power plant is ORC using the isopentane as a working fluid and an air-cooling system that was chosen for the condensing process. Currently, the plant is producing electricity but there is still enough potential capacity for a DH, for which studies are currently being carried out. Furthermore, in Reference [14] a global review of 18 significant EGS sites and technologies that have been applied in the EU, Japan, South Korea, Australia, and the USA was given. The results from this study show that the site characteristics are a key factor of successful EGS development. It was concluded that for sites suitable for EGS, the local geological conditions (stress field, temperature field, rock composition, the range of existing permeability, reservoir properties, etc.) mostly determining the amount of recovered geothermal heat by means of EGS techniques.
Many previous studies have focused either on economic assessment [15,16] or environmental assessment based on the life cycle environmental impact of geothermal power generation as studied in References [17,18]. A review in Reference [19] presents an analysis of existing software packages for estimating and simulating costs, conventionally used in studying EGS facilities. The focus of the review is the top European software EURONAUT and the US GEOPHIRES package. EURONAUT is implemented based on the studies conducted at the EGS plant in Soultz-sous-Forêts. The root of the program is economic estimation via discontinuous cash flows, and all other calculations are developed as separate modules that can be joined together via various interfaces [19]. GEOPHIRES, however, is a software tool that combines reservoir, wellbore, and power plant models with capital and operating costs, correlations, and financial levelized cost model to assess the technical and economic performance of EGS. This software differs from the Geothermal Energy Technology Evaluation Model (GETEM) [20] and Hot Dry Rock economic model (HDRec) [21], which are two examples of technological/economic models initially used to simulate the operation of EGS plant. The distinction is mainly due to the fact that the currently available packages do not permit the simulation of not only electricity production but also direct-use-heat production and a combined heat and power (CHP) production, which was implemented in GEOPHIRES software.
The rate of geothermal development and implementation has been conditioned not only by mentioned geological conditions, drilling, and stimulation technologies, but also by legal frameworks, and regulative and social constraints. An overview of legislative and socio-economic issues of geothermal energy is available in References [22,23]. More on public and political acceptance issues could be found in Reference [24]. Establishing functional legal frameworks remains a challenge for countries seeking to develop their first geothermal projects to this day.
EGS technology enables exploitation of geothermal energy at a wide range of temperature and on a large geographic scale. However, EGS technology is not yet mature enough to be commercially competitive with other renewable resources. Almost all the EGS pilot plants, currently operating, need to be jointly funded by governments in order to operate or/and develop. Finally, the risks, uncertainties, and costs related to EGS projects mean that it is essential to conduct exhaustive studies involving modelling and simulation of EGS geothermal reservoirs and above-ground power plant facility at any location where it is desired to develop this kind of technology. This requires a holistic approach which should consider different scenarios and various influencing factors, from choosing the right extraction technology to the analysis of the energy prices and market signals. Given the fact that a taken decision will trigger financial consequences over a long period of time, the software for estimating and simulating the costs is an essential tool in order to successfully choose and face an EGS project. This paper presents the concept of such multi-scale Decision-Making Support Tool for Optimal Usage of Geothermal Energy (DMS-TOUGE) and multiple-criteria decision-making (MCDM) matrix that will be fully developed as part of the Horizon 2020 project: Multidisciplinary and multi-context demonstration of EGS exploration and Exploitation Techniques and potentials (MEET, GA No 792037).
The main objective of this work is to present the MCDM matrix and selected weighted criteria used to evaluate and compare different EGS sites and technologies and to demonstrate this MCDM matrix as a means of conducting a rapid preliminary evaluation of the technical and economic feasibility of an EGS project with related environmental and social impact. The MCDM matrix is used in this work for assessment of four different geothermal sites, and by using real data for each of the selected sites the comparison between sites was enabled.
The contribution of this work in relation to other selection matrices is that it provides expanded and detailed criteria related to environmental and social impact giving the necessary emphasis on so far neglected important aspects for successful completion of geothermal projects. Moreover, the novelty of this work is that by combining technical, economic, environmental, and social aspects of geothermal projects, the MCDM presented in this work gives a comprehensive assessment of EGS projects. Namely, since the EGS related projects are high-insensitive investments, for a DM interested in sustainably operate an EGS-plant close to densely populated areas, it is imperative to include many different aspects in techno-economic analysis and decision-making process. It is, however, challenging to predict all possible scenarios and influencing factors. Therefore, the process of developing a DMS-TOUGE and related MCDM matrix is a multiple-stage process. At this stage of the development and modelling process, the tool is intended for an evaluation of an EGS project at early development stage, meaning that a great number of the variables should be approximatively forecasted and estimated. Using optimization, the adequate evaluation of the production for chosen site and technology can be displayed. With progress in time, the tool will be useful for upgrade or extension of an already existing chosen geothermal site. In that case, the DM can provide more detailed information about EGS power plant operating cycle since the plant has already been generating electricity or heat for direct usage.
The rest of paper is organised as follows. Methodology, background, and main components of DMS-TOUGE are explained in Section 2. In the same chapter one of the main component of DMS-TOUGE, the MCDM is presented in more detail. Section 3 describes in detail the MCDM matrix and its criterions used in this paper for the evaluation of different EGS sites. Section 4 describes the case study examples, presents the scenario results, and gives the sensitivity analysis based on these results. The obtained results are discussed. Section 5 concludes the paper and gives the main directions for future development and research.
2. Background
2.1. Decision-Making Support Tool for Optimal Usage of Geothermal Energy (DMS-TOUGE)
The DMS-TOUGE represents a holistic approach for economic and environmental assessment of EGS sites that provides the capability of simultaneous site-specific environmental and economic analysis, among others considering low-enthalpy energy from co-produced hot water during oil fields exploitation. It considers existing infrastructure with possible extension or upgrades, the possible costs of future facilities, co-use/re-use of existing mature or abandoned oil fields boreholes, and other different geological contexts. Furthermore, the DMS-TOUGE will be useful for the decision makers (DM) involved in activities associated with: applications of EGS techniques to currently unexploited reservoir types (such as Variscan orogenic belt) by means of injector-producer doublets, increasing the productivity of existing power plants by reinjection of geothermal fluids with a colder temperature combined with the generation from the small-scale ORC units, and usage of hot fluids from mature and abandoned oil fields for electricity or heat production.
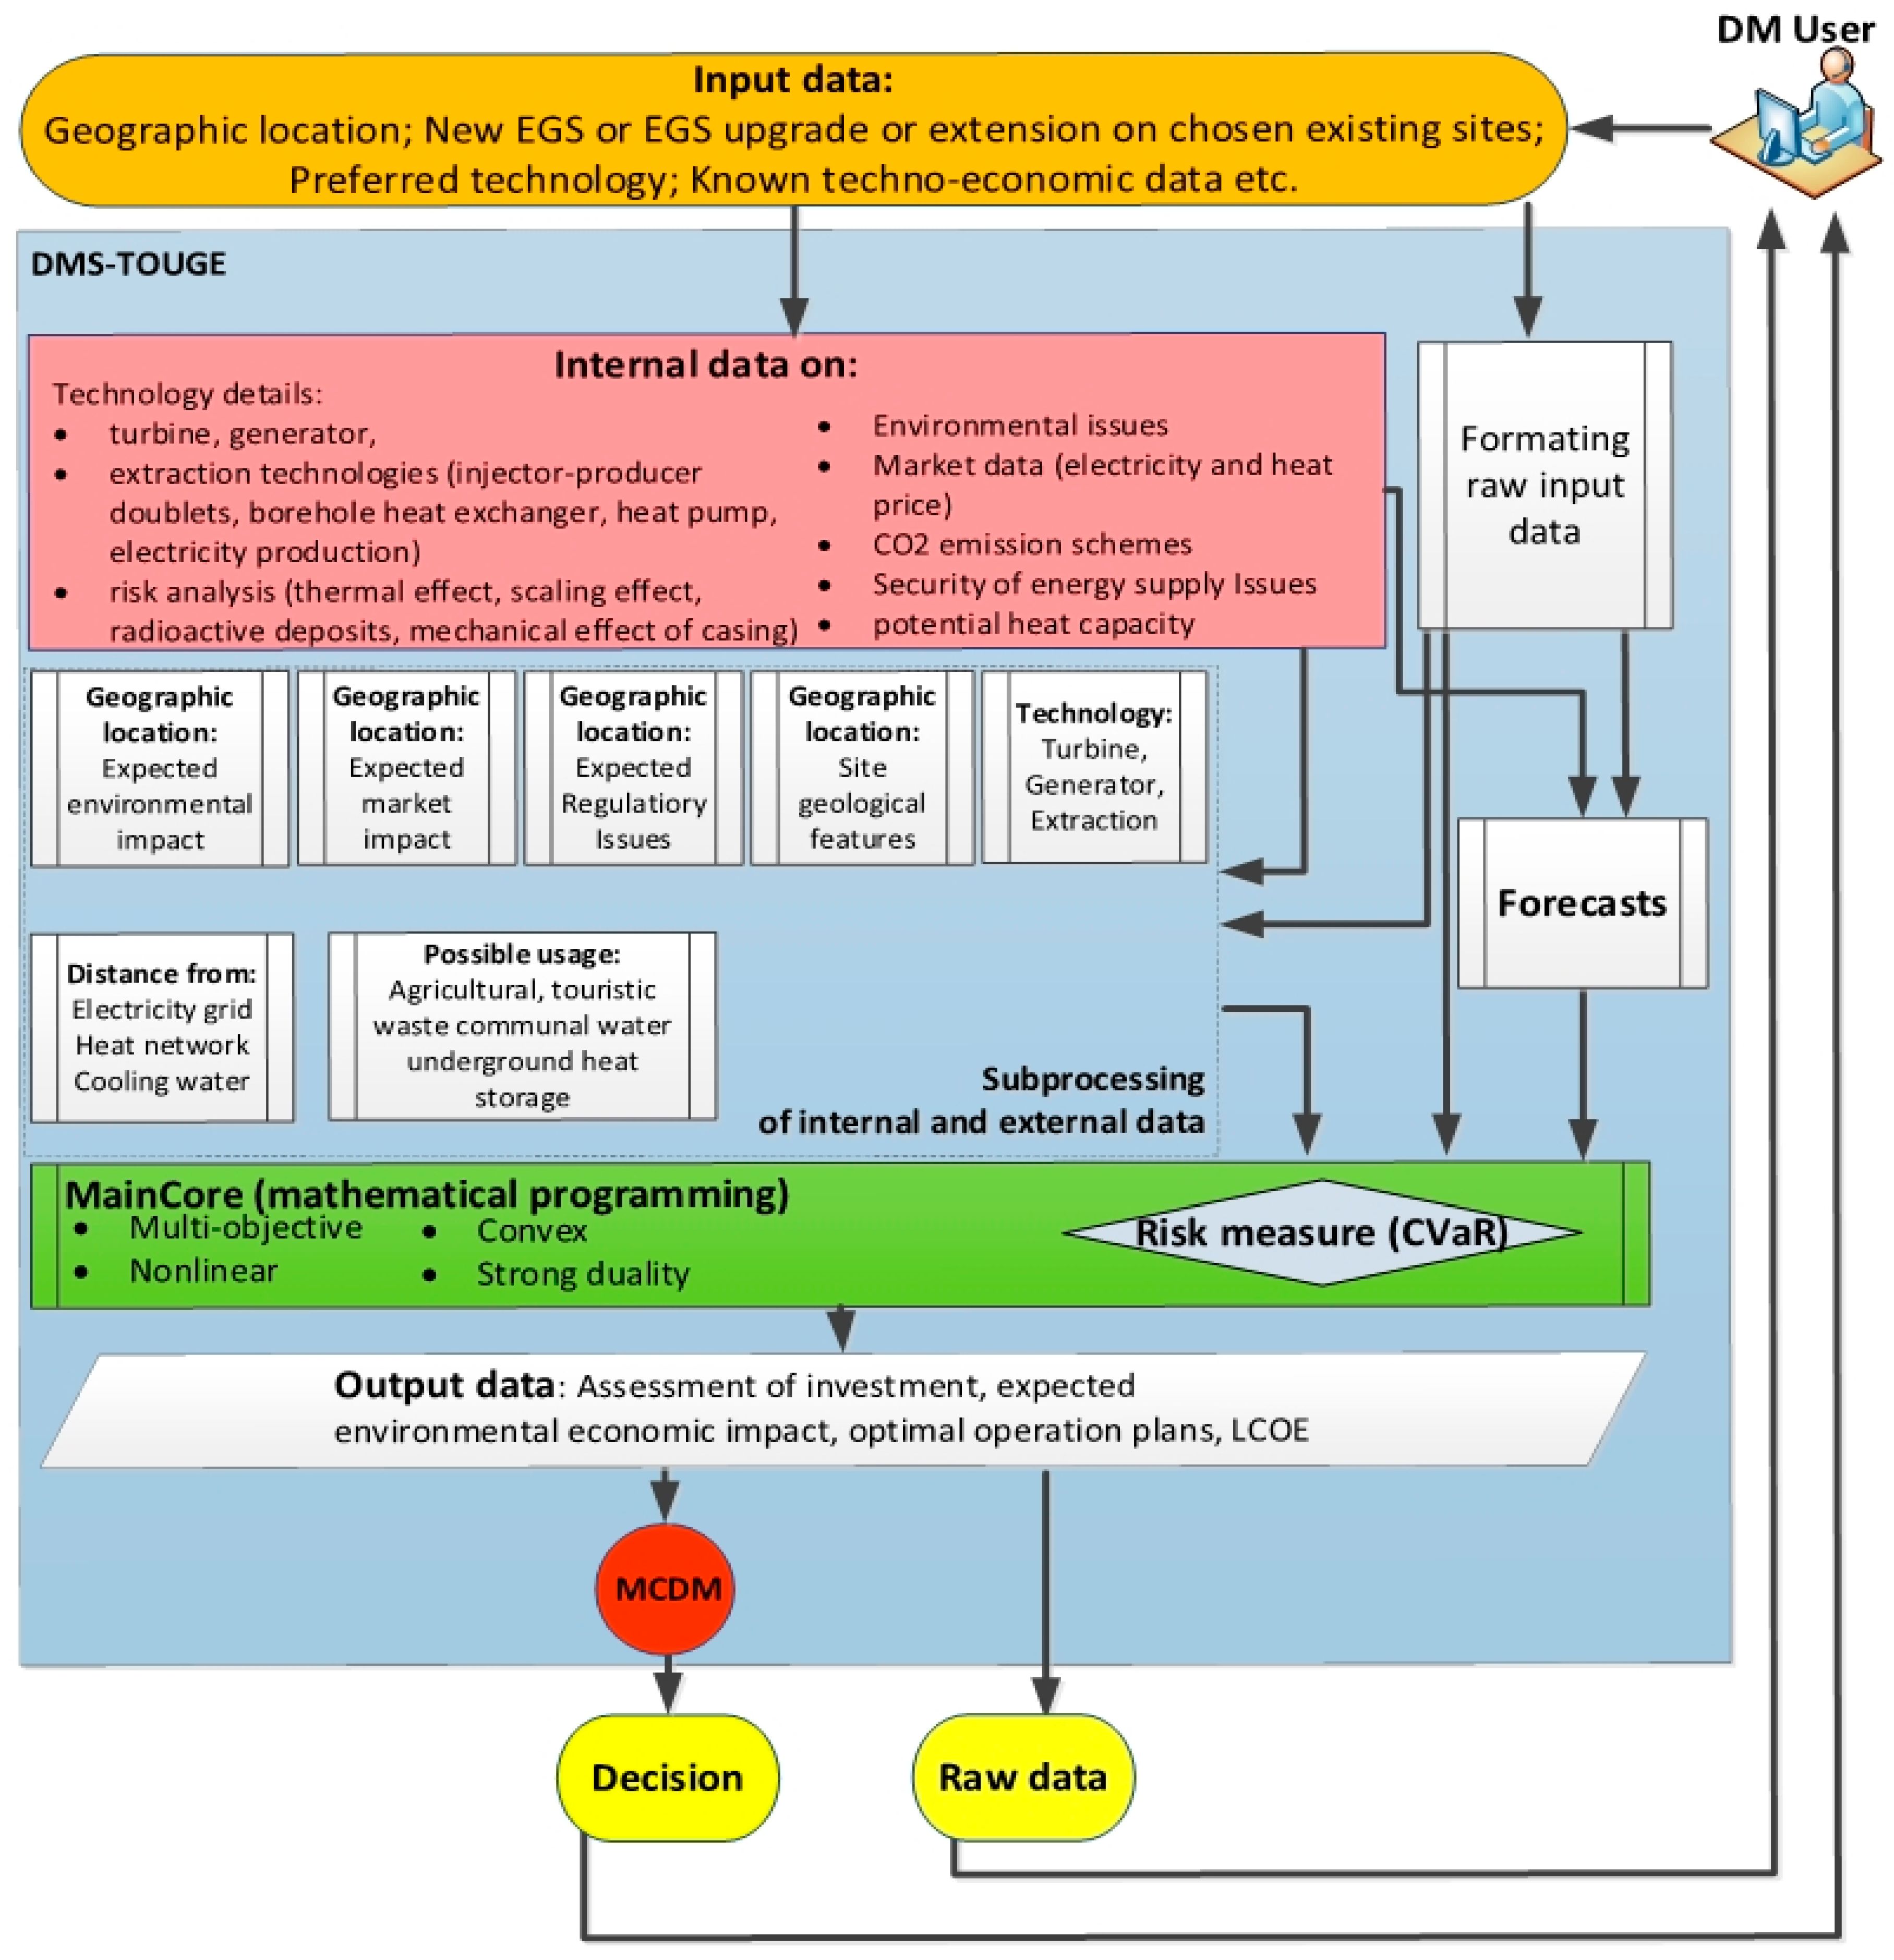
The DMS-TOUGE tool will use both external data entered directly by DM and internal data from database, depending on the quantity and quality of input data entered by a DM, such as: water temperature, geothermal capacity, electricity and heat prices, injection water flow rate values, turbine technology specifications, generator type, heat exchangers, working fluid, type of extraction technology (injector-producer doublets, deep borehole heat exchanger), risk analysis (thermal effect, possible appearance of scaling, radioactive deposits, mechanical evolution of casing) or environmental data (CO2 emission schemes, security of energy supply issues). In order to better anticipate and include future events, different possible scenarios are evaluated and accounted and accordingly the tool can use forecasted data (load, prices, etc.) which can occur over the operation lifetime of EGS technology. Some of the most important environmental (external) factors that are integrated into the tool are: proximity of nearest suitable power system grid and/or nearest suitable district heating system where EGS could be integrated into, proximity and availability of water for water cooling mechanism, possibility for different usage of geothermal energy for agricultural, industrial and district heating needs, and geopolitical environment and relevant legislative framework. The DMS-TOUGE relies on optimization algorithms to value/quantify different technologies. It will be used to quantify environmental and social impacts and calculate system levelized cost of energy (sLCOE) of technology in order to find the best-suited option for a given site. Moreover, when assessing the best-suited option and technology for a given site, malicious and faulty components should be taken into account since, in reality, it is illusory to expect that all components of the geothermal system are functioning without problems. An example of addressing this issue is presented in Reference [25]. Therefore, it is mandatory to include any possible risks involved with different components of the system. As an integral part of the DMS-TOUGE, any possible risks will be analyzed, such as market (price) risks and technical issues: thermal effects, scaling effect, radioactive deposits, and mechanical effect of the casing through the conditional value-at-risk (CVaR) measure [26,27,28]. Technical issues and risk of escalating costs need to be managed and hedged because of the potential damages likely to take place on an operational plant. The DMS-TOUGE will be verified and validated based on the comparison between tool output and real-life expert analyses on existing operating EGS sites and also historical data related to existing EGS sites. Output data of DMS-TOUGE will be available as raw data or in a form of directives and suggestions that are suitable for decision makers and investors. The raw data will be processed by a special subprocess, a separate MCDM, into a decision. The MCDM will be further discussed in Section 3. The schematic depiction of the main features of the DMS-TOUGE is shown in Figure 1. It should be emphasized that DMS-TOUGE as a whole is still in the development phase, and some parts have been modelled, including MCDM described later.
2.2. Geothermal Project Development Phases
The geothermal project development occurs in various phases, with a unique duration of each phase. There is a series of seven key development steps before the actual operation and maintenance phase commences: (i) a preliminary survey, (ii) exploration, (iii) test drilling, (iv) project review and planning, (v) field development, (vi) construction, and (vii) start-up and commissioning. The development of a typical utility size geothermal project will usually take between 5 to 10 years [29], depending on the country’s geological conditions, information available about the resource, institutional and regulatory climate, access to suitable financing, and other factors. All seven-key development steps could be compressed in the first three following phases, followed by the fourth operation and maintenance (O&M) phase:
- Discover and establish a viable resource;
- Develop the project to the point necessary to obtain the power purchase agreement (PPA);
- Complete the project development once the PPA is obtained, and
- Operate the power plant facility.
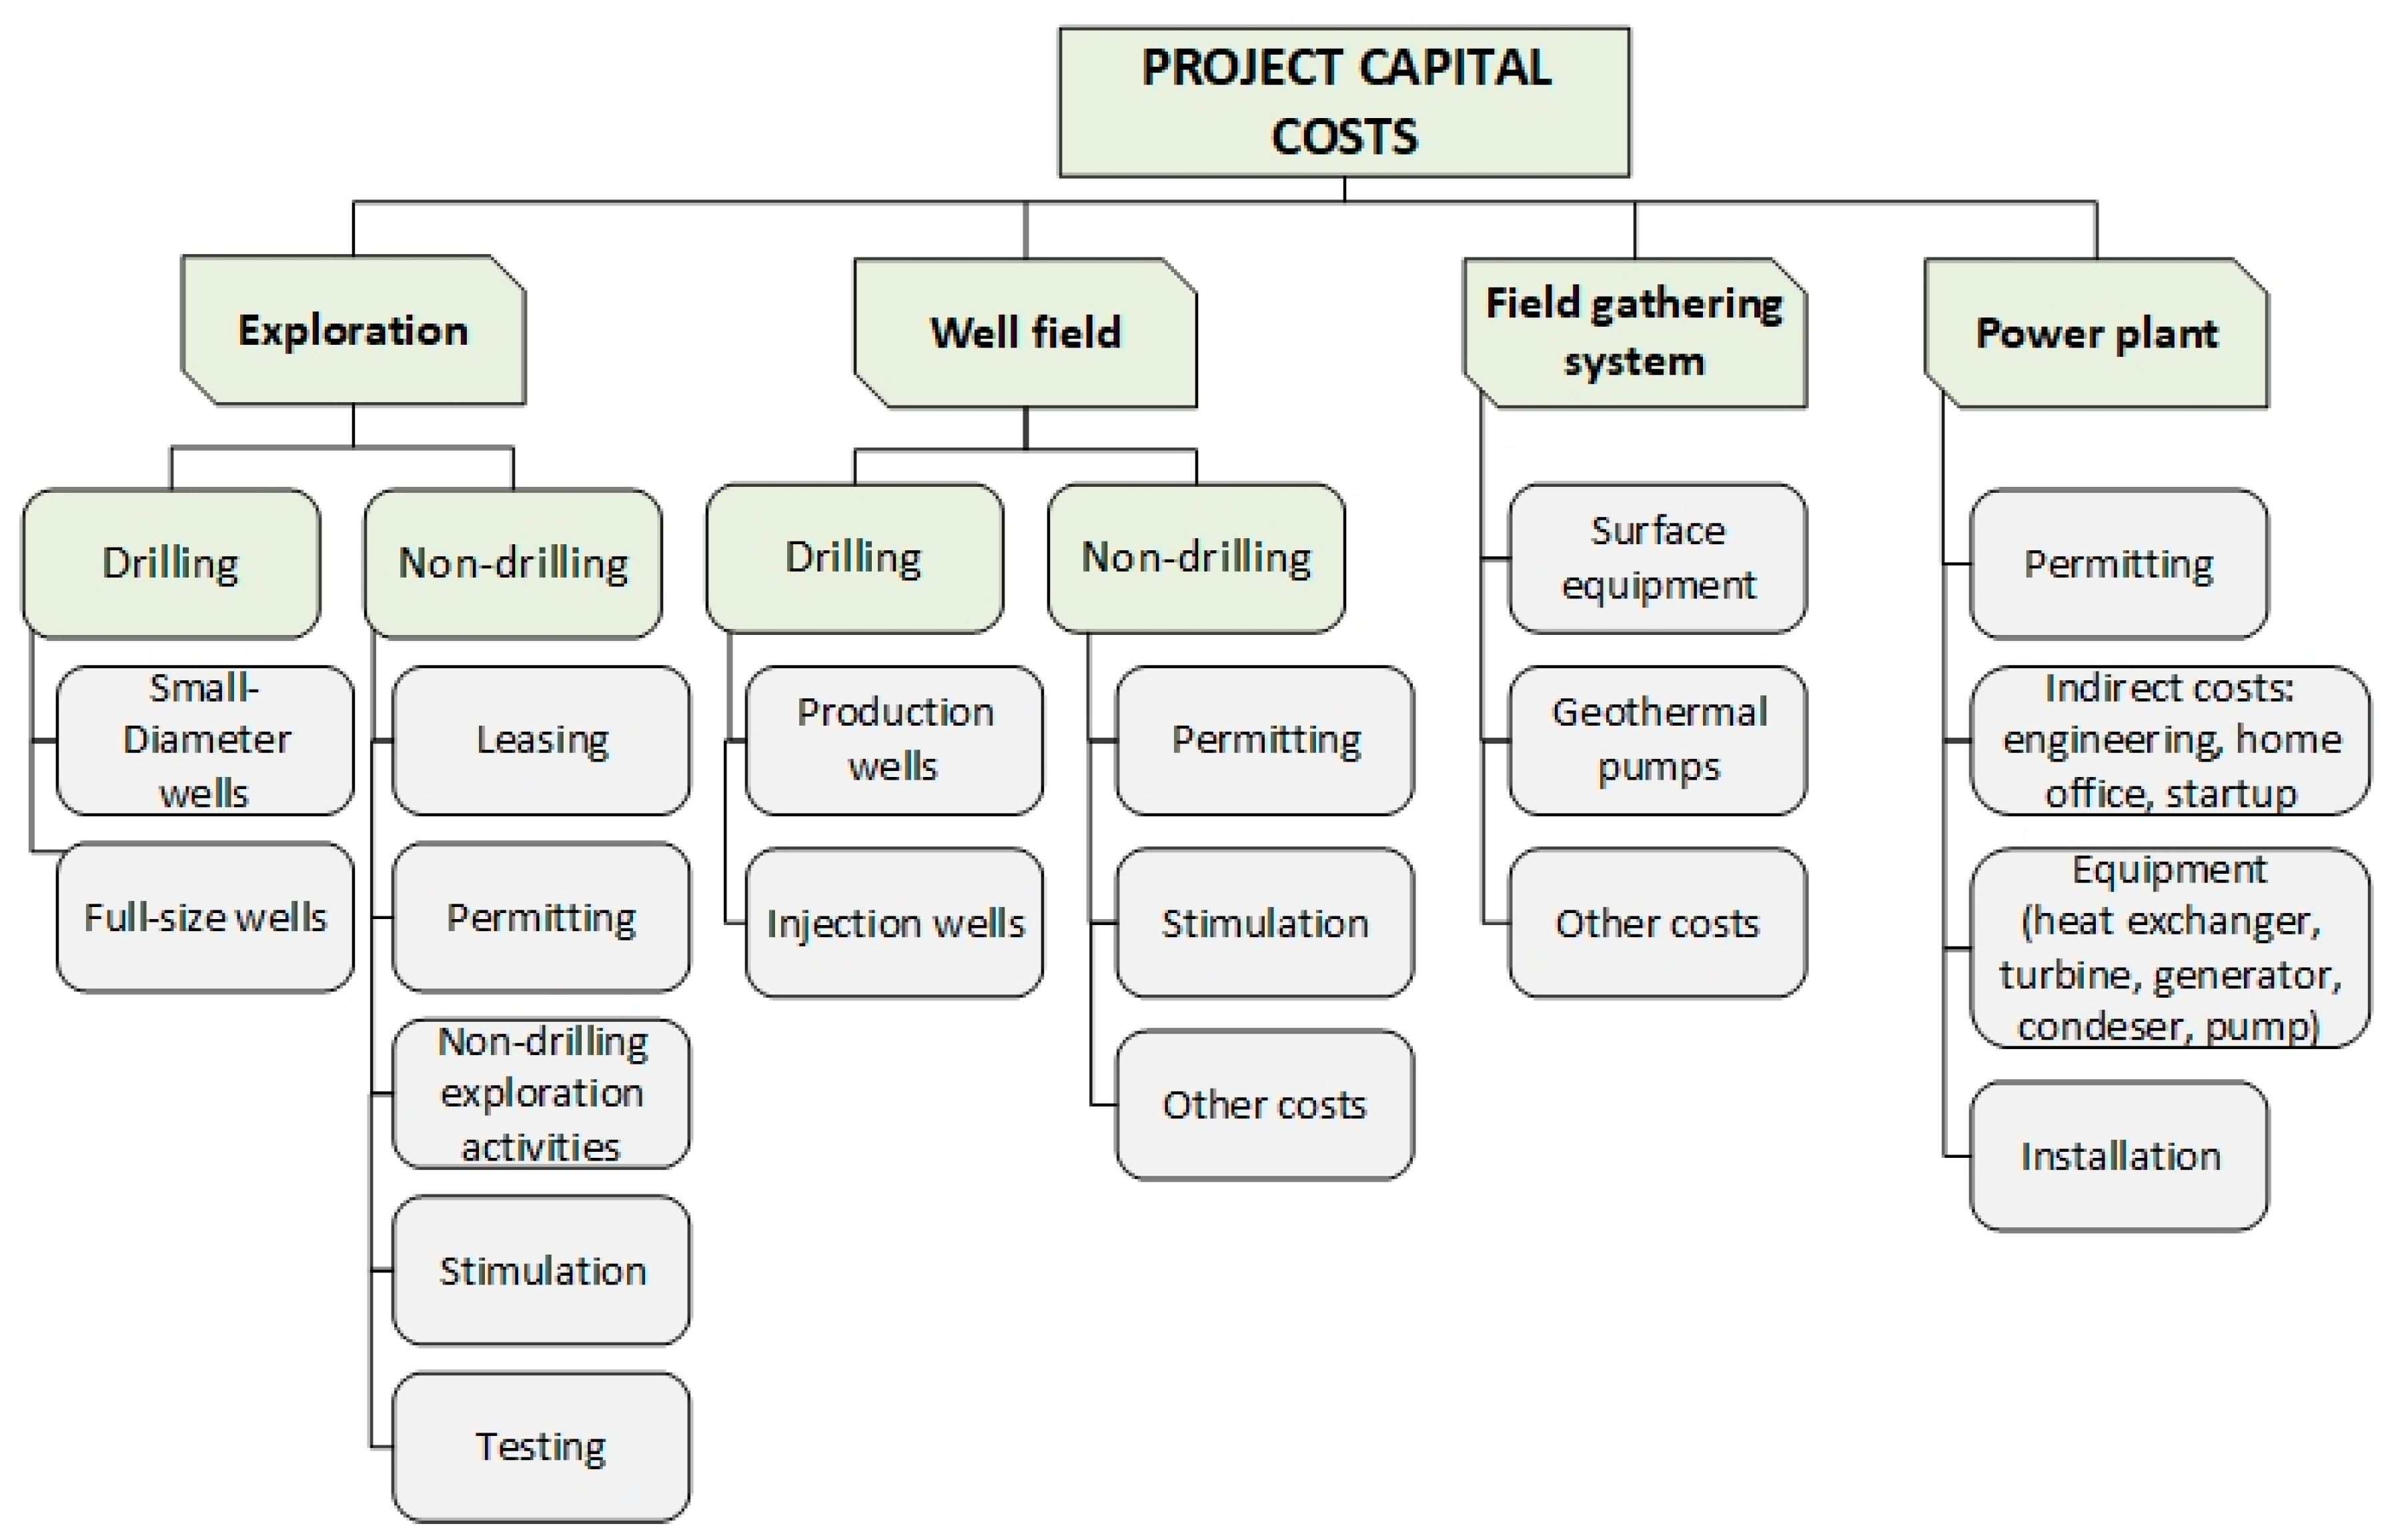
Each phase includes activities and elements that incur different related costs, which in DMS-TOUGE can be estimated or inputted by a decision maker. These costs, along with the estimated power generation over a project’s lifetime, are the basis for the sLCOE calculation for a defined scenario. The number of the activities in each phase, and consequently the capital and O&M costs of the project, depend also on the state of the project, i.e., is it a greenfield project representing a new EGS site or a brownfield project representing an existing EGS site with possible upgrade, or co-production and/or conversion of mature or abandoned oil fields. DMS-TOUGE will be able to calculate necessary costs for sLCOE estimation according to the input data regarding the above-mentioned steps and phases. Capital costs are present in the first three phases, and O&M cost in the fourth phase. All possibly occurring capital costs that will be estimated and calculated with DMS-TOUGE for defined EGS project are summarized in Figure 2. Furthermore, for brownfield project with existing infrastructure the drilling part is omitted and thereby approximately 40–60% of capital expenditure (CAPEX) is avoided, meaning that all the activities related to drilling process depicted in Figure 2. are omitted in that case.
2.3. Extraction Technology
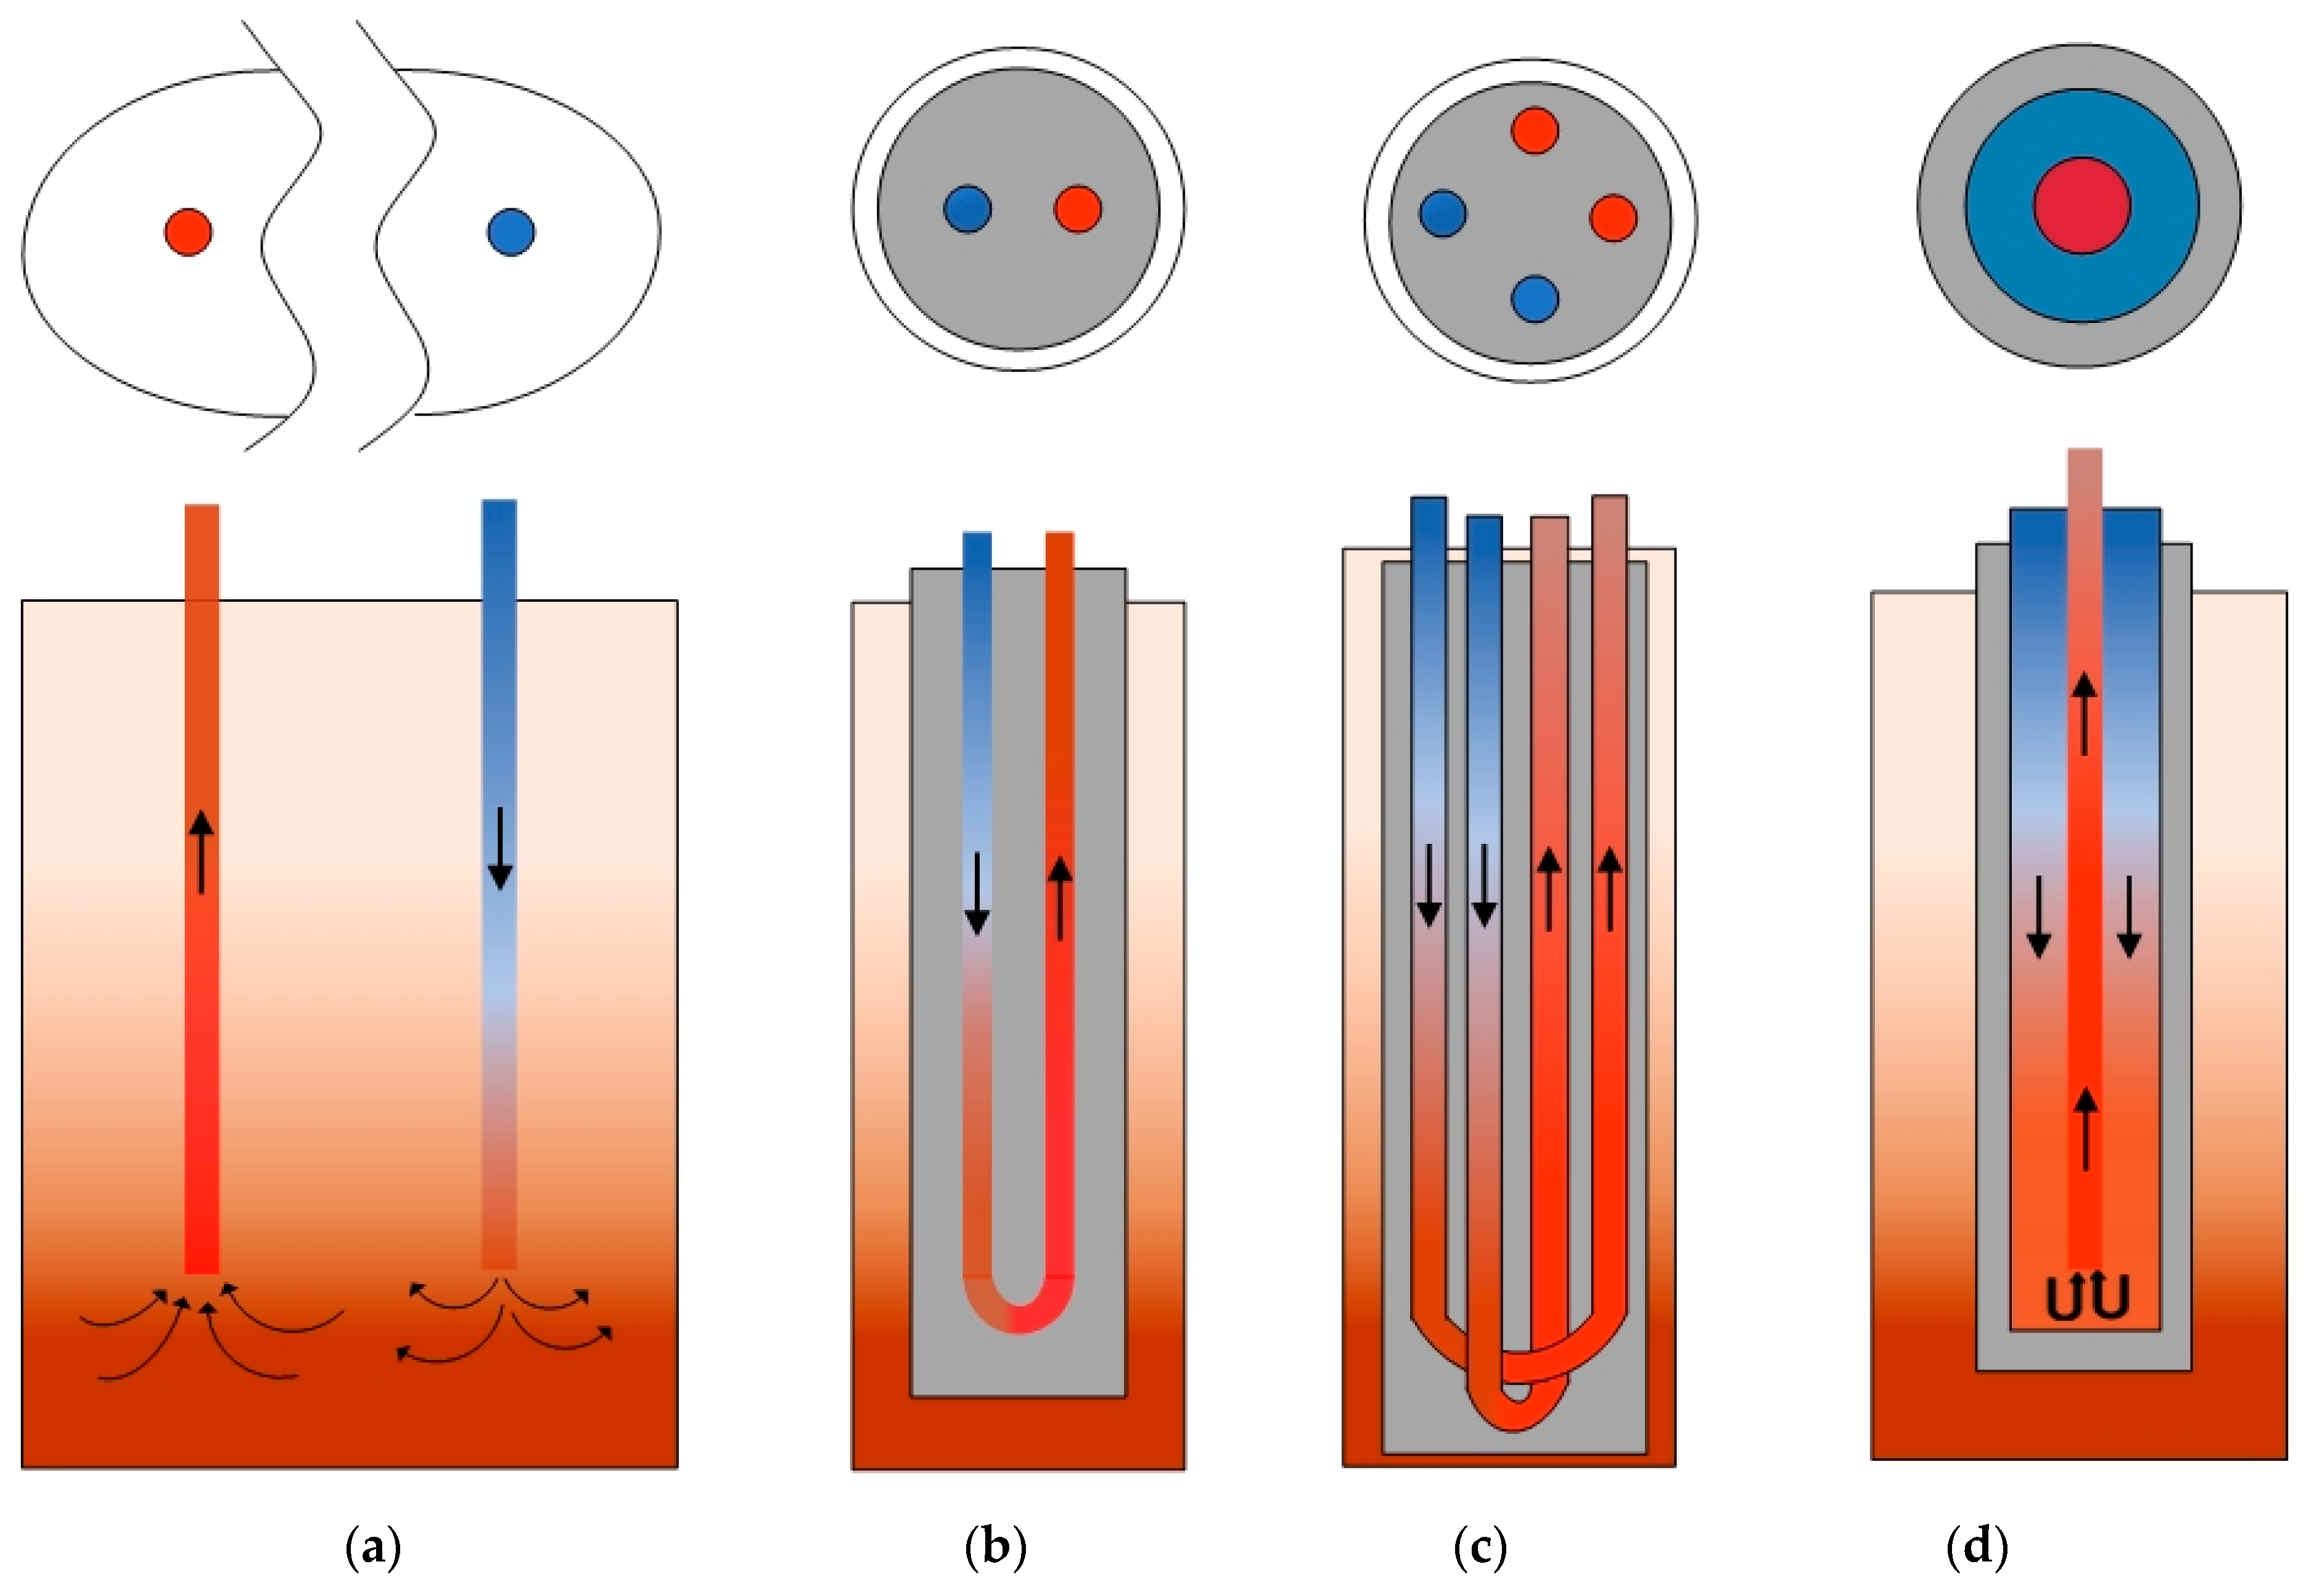
Different extraction technologies need to be compared when assessing EGS sites, such as the producer-injector doublet and deep borehole heat exchanger. The production system, which consists of a production well, a surface heat exchanger, and a reinjection well, with all produced and cooled thermal water, returned to the aquifer is the so-called doublet system (Figure 3a). The production and the reinjection well must be drilled to the same geological horizon, i.e., reservoir. Consequently, the geofluid circulates in a closed loop: from the reservoir through the production well to the heat exchanger and back to the reservoir through reinjection wells. It is worth noting that pumping the fluid back in the reservoir maintains its hydrostatic pressure. (In the reservoir, around the bottom of the injection well, the permanently inflowing cooled water forms a cold front which propagates toward the production well). Borehole heat exchanger for shallower depths consists of single (Figure 3b) or double U-tubes (Figure 3c). In deeper wellbores, the presence of a liner will entail a coaxial-type solution (Figure 3d), which better optimises thermal and hydraulic behaviour. Injection takes place through the annulus and production (or heat delivery) through a centred co-axial pipe.
2.4. Geothermal Facility Arrangement
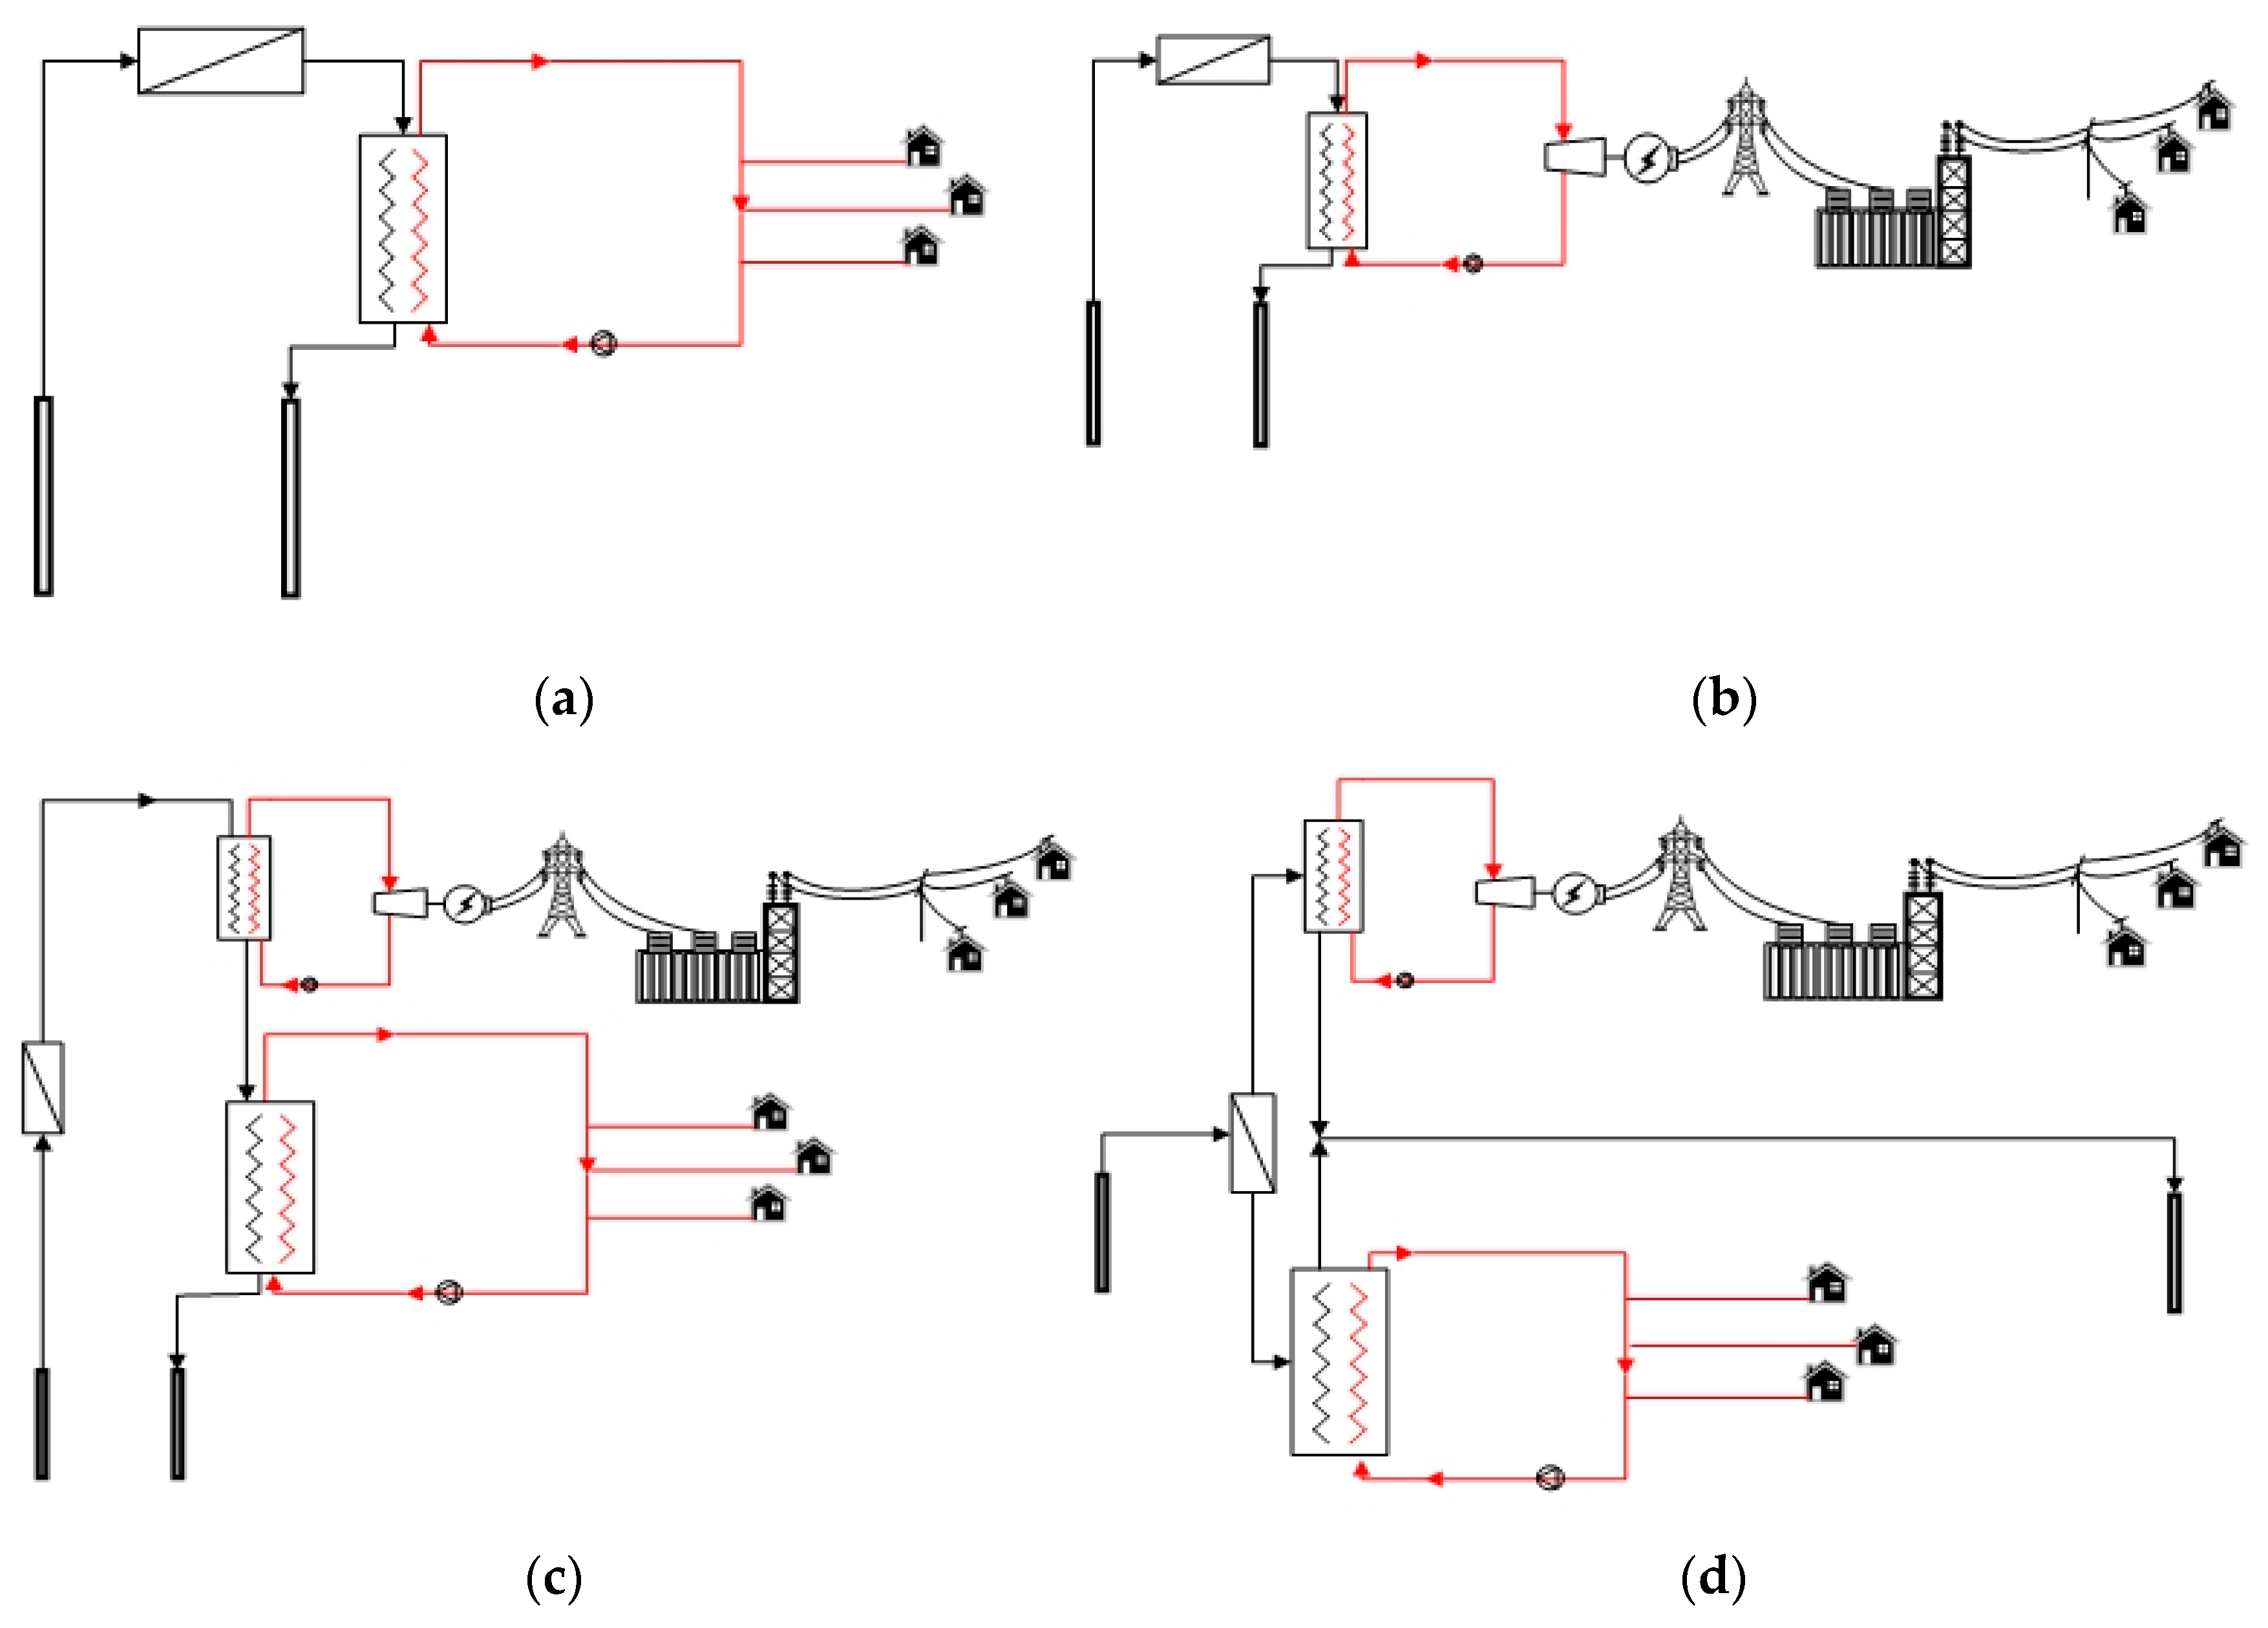
Different end-user options need to be compared with the simulation and optimization of three different end-user scenarios; (i) only direct-use heat production; (ii) only electricity production, and (iii) CHP production. The geothermal heat can be delivered to a nearby DH network and/or power plant via heat exchangers. Figure 4 presents a schematic description of possible end-user options. In the case of direct use option, (Figure 4a) the thermal energy from the geothermal fluid is transferred to the working fluid, usually water or steam, in DH network via heat exchanger. In the case of electricity production, the thermal energy is transferred to the working fluid circulating in the secondary system, ORC, also via heat exchanger, as depicted in Figure 4b. For the third end-user option (CHP) two configurations of the CHP plant are proposed: series and parallel, respectively. For the series configuration (Figure 4c) the brine (geothermal water) delivers the heat to the ORC at a higher temperature and subsequently to the DH system or other direct use application at a lower temperature. The flow rate of the brine is constant and equal for both systems. In the case of the parallel configuration (Figure 4d), geothermal heat is delivered to both the DH system and the ORC at a high temperature but with lower flow rate compared to a series configuration. The selection of the configuration depends on the features of the selected geothermal site and its surrounding, as well as on heat characteristics needed in the connected DH system.
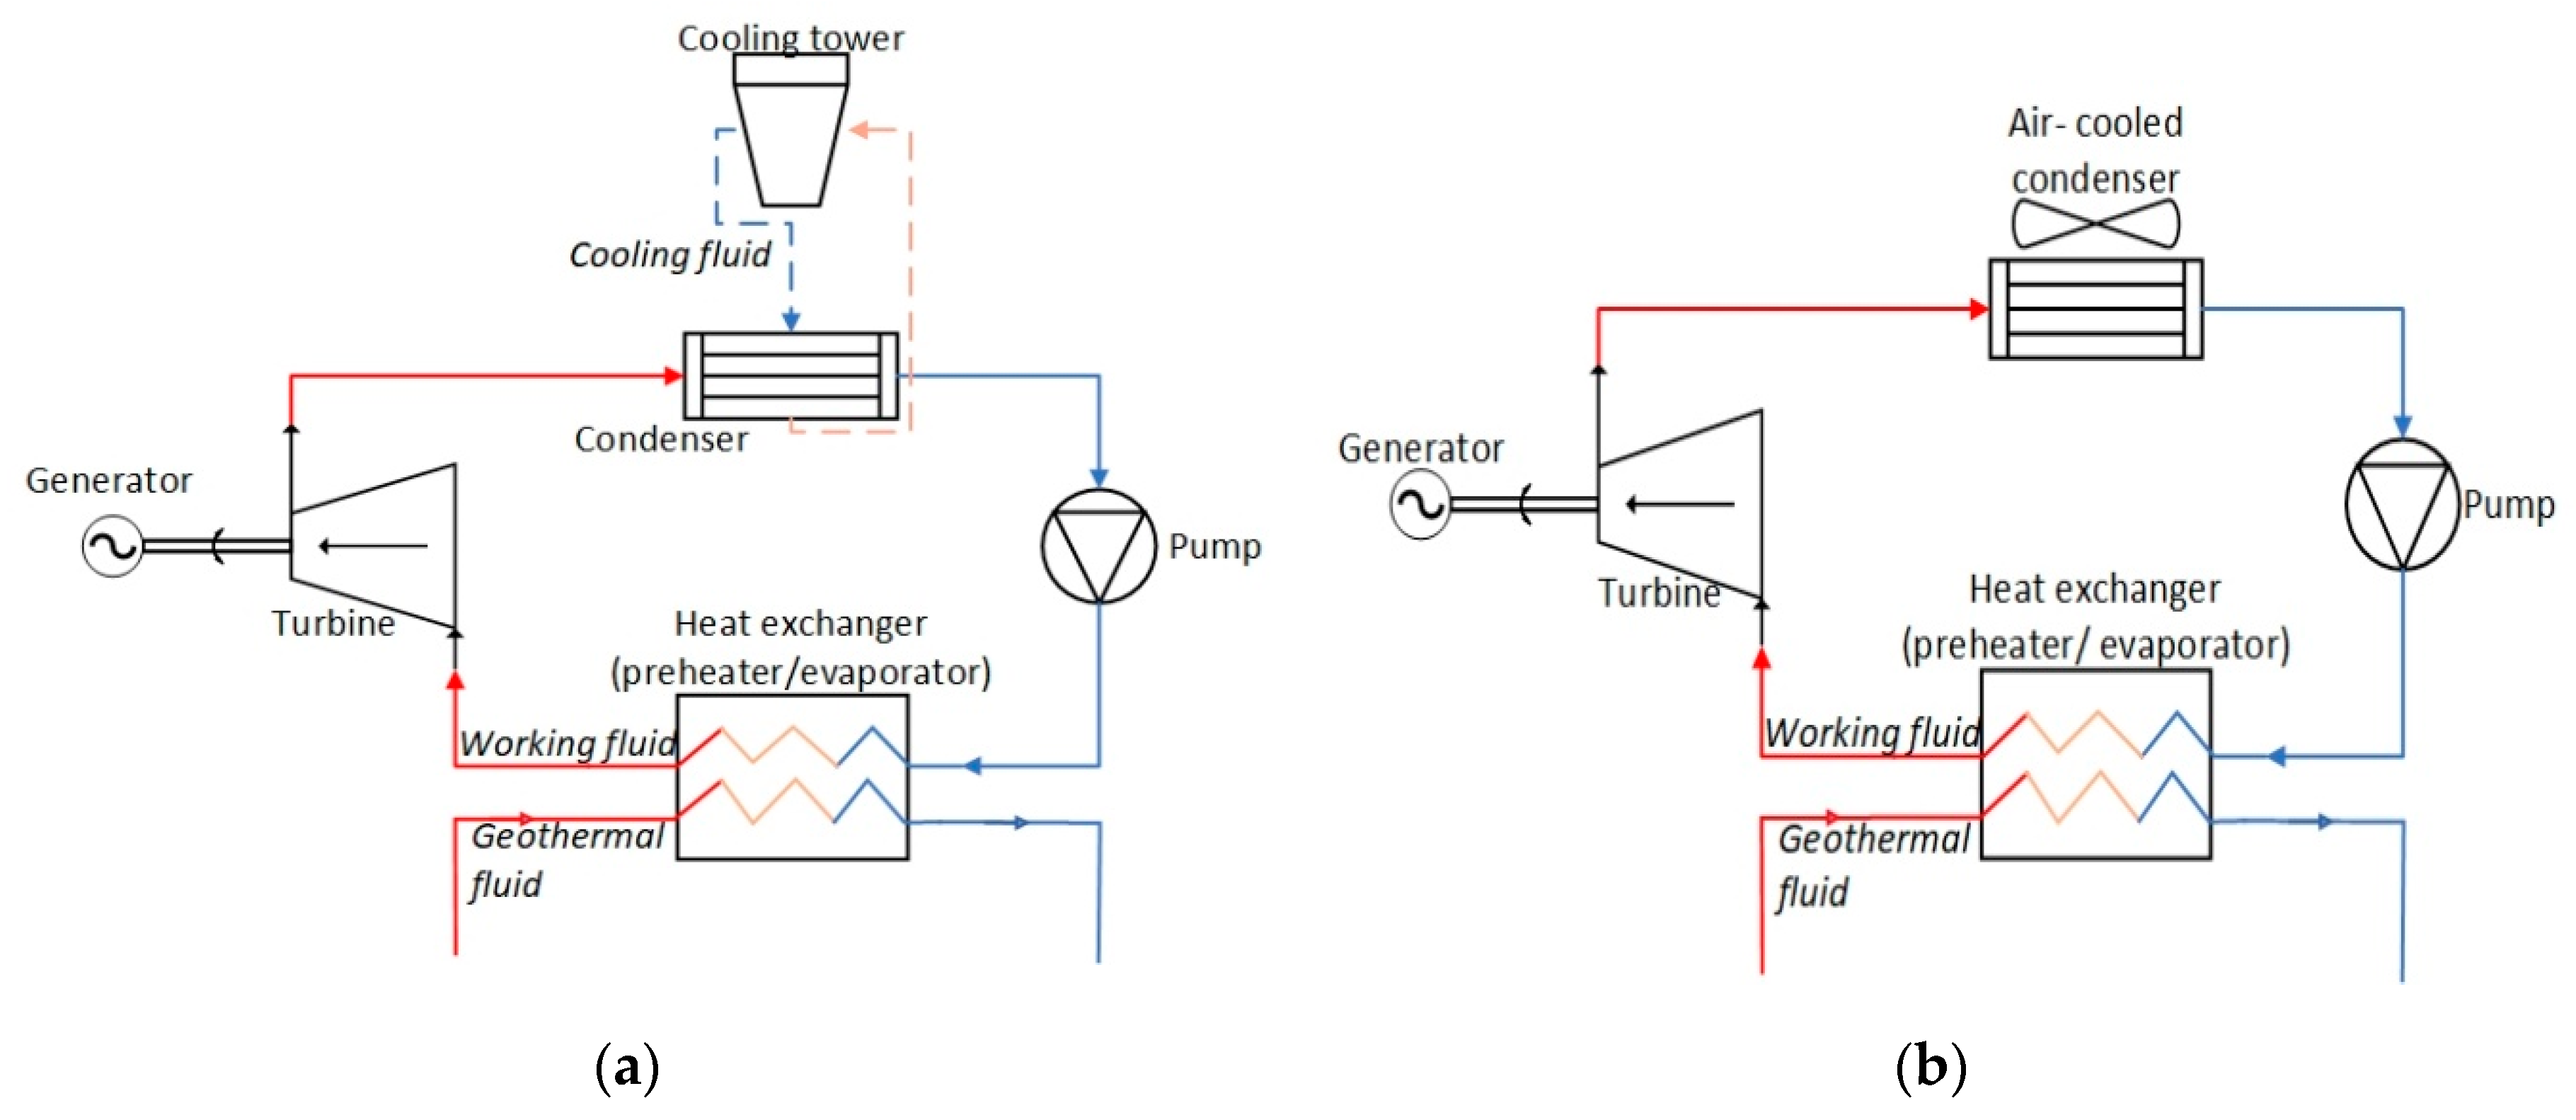
A default power plant type is based on the resource temperature [30] and since the focus of the research are low enthalpy resources, i.e., medium and low-temperature geothermal fields with temperatures of 200 °C and lower, the binary power plants show good performance and therefore will be modelled in DMS-TOUGE. The concept of the binary power plant is based on the ORC. In the ORC system, the fluid flow is divided into four steps. The working fluid is heated up and vaporized in a hot heat exchanger (the evaporator), and at this point, the temperature of the working fluid is the highest. This saturated steam drives the turbine, which enables electricity production by lowering the fluid pressure to its low level. The fluid is then condensed in a cold heat exchanger (condenser) and pumped again into the evaporator, increasing thereby the fluid’s pressure. As for the condensers, the most commonly used heat rejection equipment at binary geothermal power plants are the air-cooled condensers. The use of air eliminates the requirement for makeup water. However, compared to water cooling towers, air-cooled condensers require more space and represent a larger parasitic power load on the plant.
The geothermal fluid, the hot source of the heat, is circulated in another loop on the other end of the evaporator. Therefore, for the binary plants, the major equipment components estimated are turbine-generator, air-cooled condenser, geothermal heat exchangers, and working fluid pumps, as depicted in Figure 5.
3. Multiple-Criteria Decision-Making Analysis
As a subprocess in the DMS-TOUGE, an MCDM analysis will be used and performed using the weighted decision matrix (WDM). For evaluating different EGS options, a set of criterions is defined and presented in this subsection. For evaluation of the relative importance of each criterion in decision making, the weight is associated with each of the listed criterions. Performance, , of option on criterion is arbitrarily defined with a numerical value from 1 to 5, whose higher value means better performance,. Finally, total performance, , of ith EGS option on all criteria, , is assessed by summing all performance values, , multiplied by its weight as defined in Equation (1).
where is the total performance of ith EGS option, , where is a total number of EGS options. The is weight i.e., relative importance in the decision making of criterion, , where is a total number of criteria. The is the performance of option on criterion . To use WDM successfully while assessing EGS options for a specific geothermal site, a set of well-defined criteria is needed. The criteria on which EGS option will be evaluated is listed below in Section 3.1, Section 3.2, Section 3.3, Section 3.4, Section 3.5, Section 3.6, Section 3.7, Section 3.8, Section 3.9, Section 3.10, Section 3.11 and Section 3.12. It should be noted that, although the Equation (1) shows a simple summation, the actual calculation of total performance for a selected site was performed as an average mean of performances of each criterion. Also, in this work every criterion is assumed to have equal relative importance in the decision making. Thereby, all criteria are evaluated assuming all to be equal and valued with 1. It is worth mentioning that the actual range for has not been yet precisely defined, as it is a sensitive part of the MCDM matrix. Therefore, such a range must be chosen that will adequately and meaningfully reflect the relative importance of certain criteria in relation to others. In the future work and through a process of validation and verification of the MCDM matrix and DMS-TOUGE, the discrete sequential values for will be chosen.
3.1. First Criterion: Installed Power,
When considering energy investment, installed power (capacity) is the first and most important parameter [31]. It later determines both costs (CAPEX, OPEX-O&M) and revenues (power output). According to Reference [30], performance of option i on 1st criterion should be determined by ratio in p.u. (ratio of installed power, , of ORC technology in ith option to the reference installed power, , e.g., according to Reference [31] for ORC technology reference installed power ranges from 1 MW to 5 MW depending on site features) (Table 1).
3.2. Second Criterion: Fluid Heat Flow,
Expected heat flow, (W), for the two main extraction technologies, a traditional doublet with fluid extraction and reinjection, and wellbore heat exchanger, a closed loop system, is defined with Equation (2):
where is the fluid flow rate (m3/s), is fluid density (kg/m3), is specific heat capacity of fluid at constant pressure (J/kg·K). is the fluid temperature at the wellhead (°C), is the fluid temperature at the exit of the steam turbine (°C).
Heat flow as a criterion was first proposed in Reference [31] and is used here with modifications in means of corresponding ranges for temperature. The idea is to emphasize the importance of flow rate and temperature of the produced fluid, and the impact of selected technology on flow rate and temperature. Reference [31] proposes criterion, here referred to as the , whose value is based on the ratio between the fluid flow rate, , and flowing temperature at the wellhead, . According to [31] best suited ranges for valuing performance in heat flow criterion are defined by flow rates between 0 m3/h and 100 m3/h and when temperatures are between 80 °C and 160 °C, since those ranges correspond to operative conditions for an ORC plant. For this criterion, the temperature range is modified for the values between 60 °C and 160 °C, since one of the focus of the ongoing H2020 MEET project is to make those temperatures also exploitable (Table 2).
3.3. Third Criterion: Theoretical Maximum Efficiency,
In this paper, the ORC based power plants are proposed for exclusively electricity generation. It is mainly due to the low-to-medium temperature range of the produced geothermal fluid. The thermal efficiency evaluated at the heat exchanger of the conversion plant in such fields is usually less than 10%, and for the binary power plants, according to Reference [32] could be calculated with Equation (3).
where the represents the temperature of the produced fluid at the wellhead in (°C) and is expressed in (%).
However, in case of power plants different from ORC, meaning other types of conversion plants, the thermal exchanged cycle between the two fluids, one circulating in the primary cycle (geofluid) and other circulating in the secondary circle (working fluid), can be assessed using the Carnot’s ideal efficiency. In those cases, the expected theoretical maximum efficiency of conversion, expressed in (%), is evaluated using the Equation (4) as according to Reference [33].
and it depends on the geological site features (the part, where in (K) is the outlet temperature from the borehole at the wellhead), technology and environment features (the part, where in (K) is the inlet temperature at the wellhead). The performance is valued as shown in Table 3. Depending on the end-user option the Equations (3) or (4) are used for assessment of the selected site.
3.4. Fourth Criterion: Geothermal Gradient,
When setting the starting point of the geothermal plant feasibility analysis the geological factors should be considered. The efficiency of the heat transfer through the wellbore is highly dependent on the reservoir’s initial temperature, which is a function of the well depth. Also, high thermal conductivity is required, so that the heat stored in the rocks could be transferred to the wellbore fluid. According to Reference [34], these two influencing factors could be collectively combined and represented with geothermal gradient, (°C/100 m). The paper also suggested a range of geothermal gradient based on measured gradients for several analyzed oil fields across the world, which was taken for evaluating the performance in the geothermal gradient criterion (Table 4).
3.5. Fifth Criterion: The Fluid Temperature at Wellhead,
According to Reference [31] the outlet temperature of the fluid from the wellhead is one of the main features of the geological site. It later determines installed power, technology, efficiency, revenues, and costs. Namely, this criterion has been defined to emphasize the relevance of this temperature, since it has a great impact on the conversion cycle in the power plant. The higher the fluid temperature at the wellhead, the higher the amount of the heat that can potentially be transferred to the secondary working fluid (depending of course on the heat exchanger technology). Performance of option on 5th criterion increases linearly depending on fluid temperature, (Table 5). Here, the focus is on the utilization of temperatures from 60 °C to 160 °C (although upper bound for analyzed geo sites in the scope of this research is expected to be 90 °C) for cases of smart ORC units. This approach is adapted and modified from the work [31].
3.6. Sixth Criterion: Global Efficiency,
Aside from the geological setting and wellbore conditions, the supply of heat or/and electricity is directly related to the performance of the plant energy conversion. Therefore, a global efficiency criterion should be established to evaluate the multi-stage heat (energy) loss within the energy conversion cycle and the impact of the ambient temperature on stored heat (Table 6). According to Reference [33] the total heat loss is addressed by means of coefficients of the different stages of the conversion cycle resulting in an overall evaluation for plant conversion. Equations (5)–(7) defines those coefficients, where Equation (5) represents the heat loss due to Non-Condensable Gases (NCG), where [%] is the estimates of NCG weight, because the presence of NCG can negatively impact the operation of the plant turbine. The Equation (6) represents the parasitic load heat loss, including well pumps, cooling tower, condenser, where is total parasitic load and gross thermal power. Moreover, Equation (7) defines the parasitic loss during the working fluid transport where the is the pipe length in km.
Overall plant efficiency is then calculated according to the Equations (8)–(10), where Equation (8) represents evaluation of the electricity generation, Equation (9) is used to evaluate combined heat-electricity production (CHP), where the second heat exchanger is required to exploit the remaining thermal energy of geothermal water into another district heating fluid, and Equation (10) represents the evaluation of direct usage of heat only in DH systems. Moreover, to measure the operational performance of the turbine and the generator efficiency, and , respectively, were included.
where in the equation related to the CHP represents the efficiency of conversion in ORC for electricity production and is the efficiency of conversion of the remaining heat from the geothermal fluid for direct heat usage.
3.7. Seventh Criterion: Corrosion and Scaling Hazard,
3.8. Eighth Criterion: Distance from Power/Heating Grid,
Construction of power lines and substations for plant connection to the grid imposes significant costs and should be addressed accordingly. Therefore, the distance between the geothermal plant production site and the nearest power and/or district heating system connection point must be addressed. Depending on that distance, (km), the investment costs and also sLCOE vary. Apart from the distance, considering that the grid connection costs are site-specific, there are many other factors that have an impact on the investment costs. Due to the complexity if all the factors were included, the main influencing factor, namely the distance, was taken for the evaluation of the performance . The range is shown in Table 8, finishing with the most favored onsite use, i.e., a very small distance between the plant facility and the connection point.
3.9. Ninth Criterion: Load Factor,
Generally, combined heat and electricity production increases the net efficiency of the power plant, which in turn improves power plant economics. This is even more important in the case of geothermal plants, where thermodynamic efficiencies are typically much lower compared to conventional power plants, due to the lower working fluid temperatures. Considering direct-use systems, heat is only supplied to the process, like greenhouse or district heating, when it is needed. As a result, according to Reference [34], the load factor, , can vary from 15% to 75% depending on the application. Reference [34] examined the costs of the delivered heat as a function of a load factor for U.S. climates. Knowing that industrial applications can have a load factor of 0.30 to 0.75, the space heating only application 0.15 to 0.30, aquaculture 0.50 to 0.80 and greenhouses 0.18 to 0.24, the results showed that the high load factor correlates with lower cost of delivered heat and consequently affects the project’s economic feasibility and sLCOE. As for electricity production, the load factor is typically 0.8 and higher. For combined heat and electricity production, the load factor is higher than in the case of only heat production. Based on forenamed results, the range for performance of alternative is determined and showed in the Table 9.
3.10. Tenth Criterion: sLCOE,
The average cost of the project over the lifetime will be addressed by the sLCOE (system LCOE, depending on the end-user option) in (€C/MWh) which also accounts for the costs of integration. This sLCOE will be calculated from all the available external data provided from DM and/or internal data from the internal database of the DMS-TOUGE, and according to Equation (13). Performance of option i on sLCOE criterion is determined by ratio in p.u. (ratio of sLCOE of ORC technology in ith option to the average market price, , in different forecasts and for different horizons) shown in Table 10.
3.11. Eleventh Criterion: Social Impact,
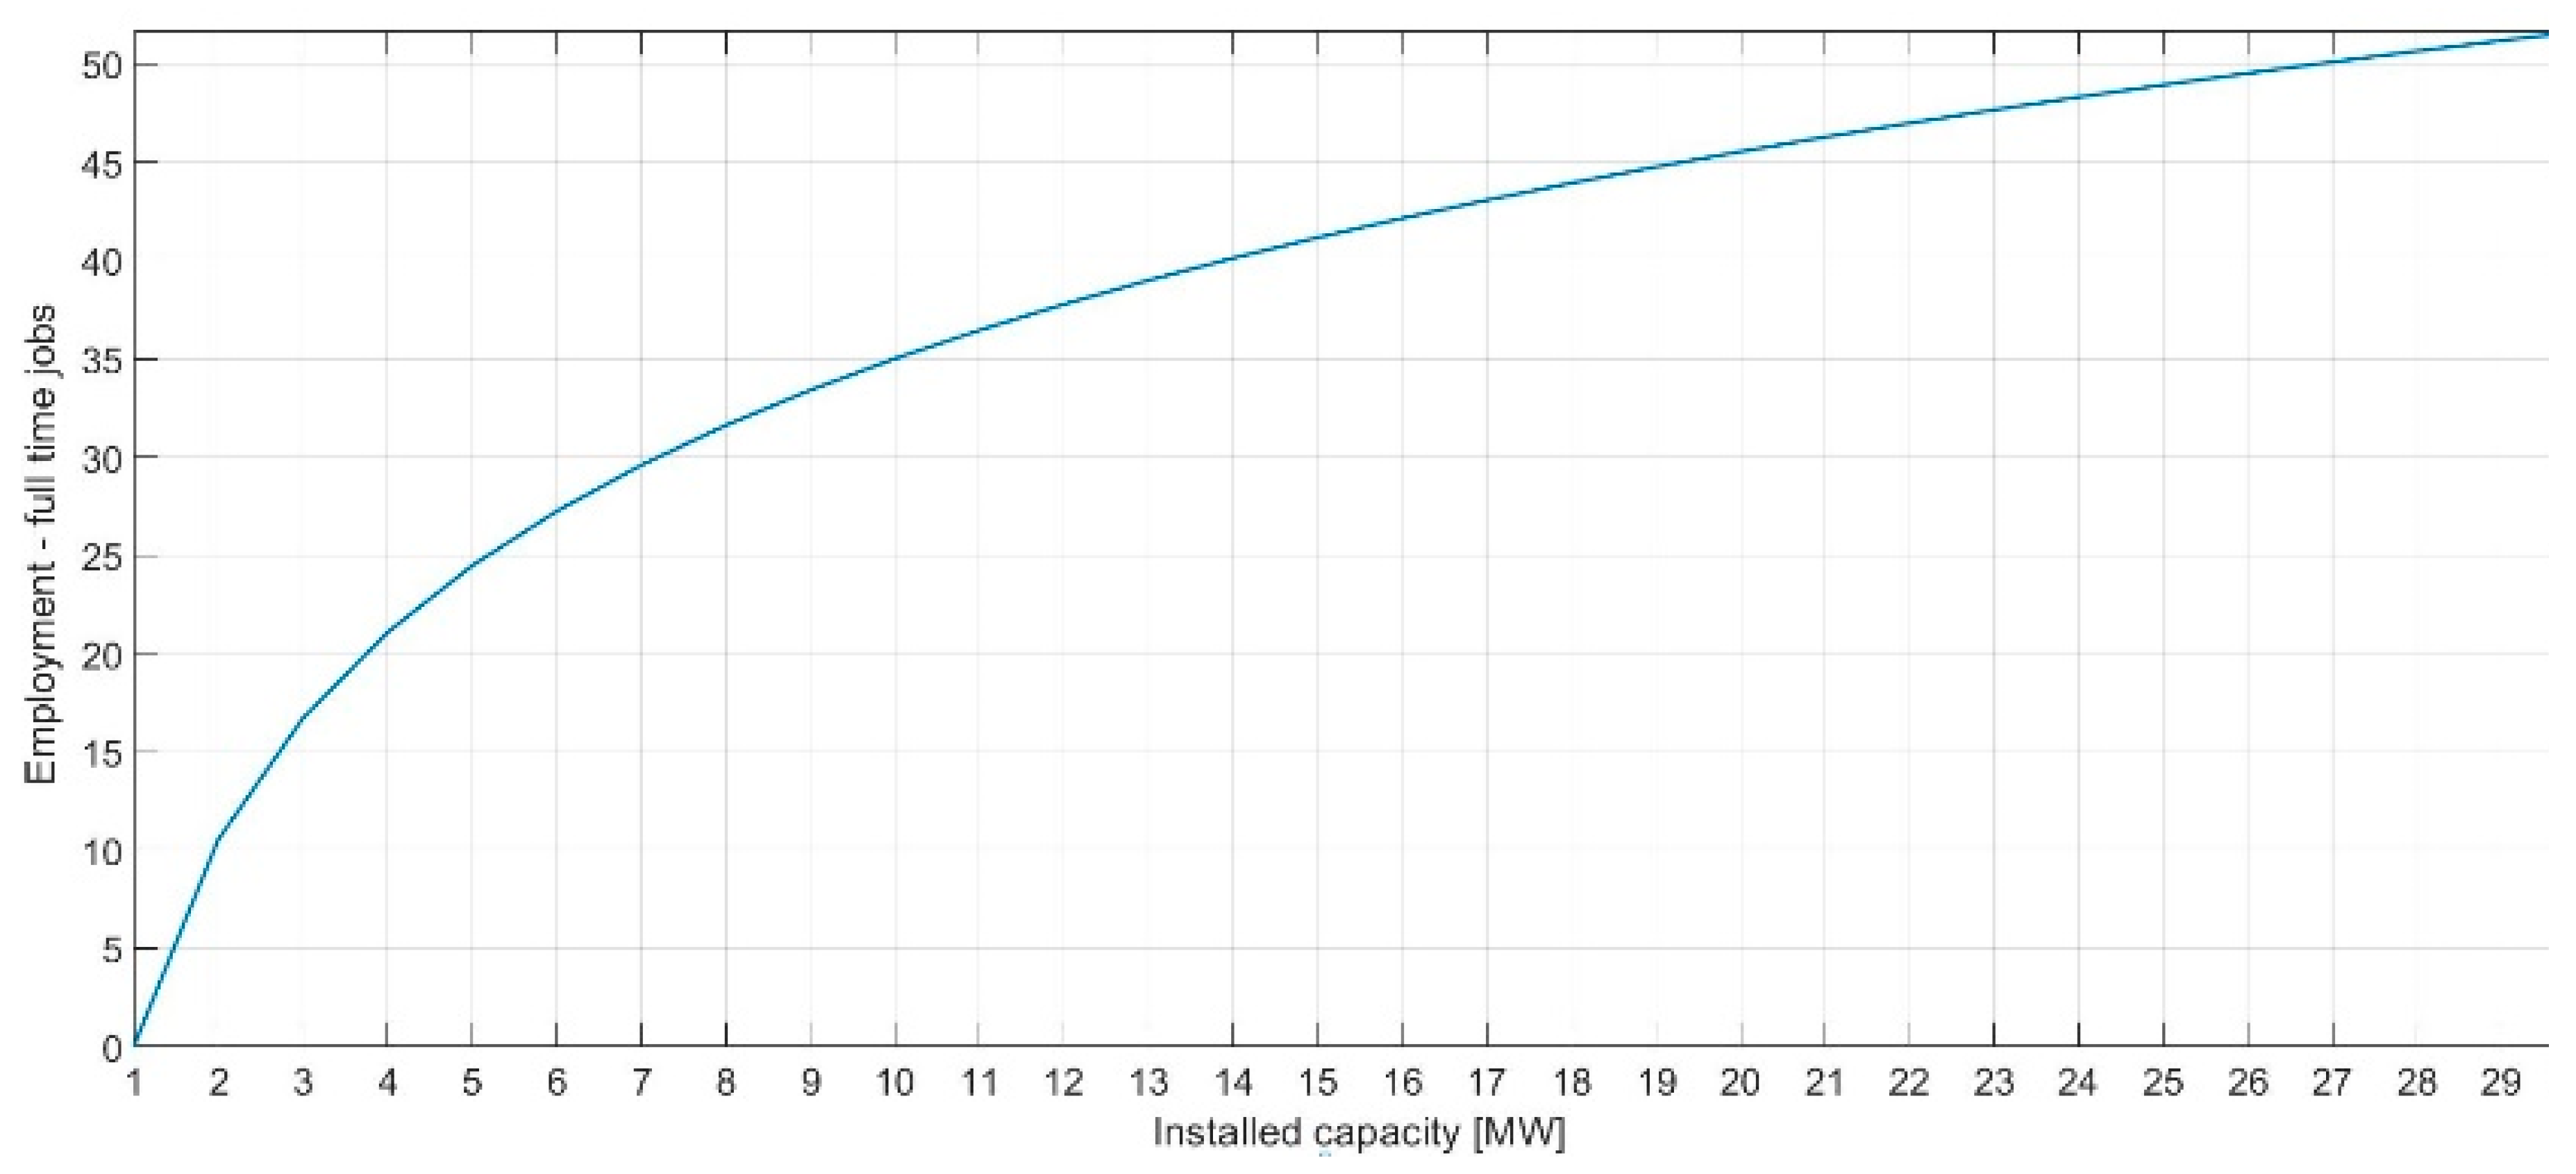
According to Reference [22], the social acceptability is conditioned by the deviation from the regular condition in the area and utility of the affected parties from the project. As geothermal technologies are site-specific (the geology is different all over Europe and knowledge of the local geological setting is essential) and capital-intensive, the needs regarding exploration, resource development, construction, and O&M are covered by the local workforce. According to Reference [35], the costs of social acceptance could be presented as the external costs of a geothermal project. Depending on the site, type, and size of the project the amount of those external costs range, on the average, 0.5–2% and 1.5–4% of the total construction costs, i.e., approximately 17,000–220,000 € and 265,000–7,040,000 €, for direct use and multi-purpose projects, respectively. Moreover, employment potential could be divided into direct, indirect, and induced employment effect and quantified in terms of full-time jobs/MW (FT) and person × years of construction and manufacturing employment (Table 11). Total direct, indirect, and induced employment ratio is a ratio of the installed capacity, , (MW) and full-time jobs calculated from the Equation (11) (shown in Figure 6). Equation (12) represents construction and manufacturing employment (C&M), where those jobs are expressed as full-time positions over one year (person × year) as a function of installed capacity, , (MW). However, those C&M jobs are spread over several years taking into account the development time frame for the new projects. The social impact criterion will be obtained by the average of performances of the following sub-criterions: social acceptance costs of direct use or electricity production sub-criterion, social acceptance costs of combined heat-electricity production sub-criterion, FT employment sub-criterion, C&M employment sub-criterion. Each sub-criterion will be evaluated with a weight in a range from 1 to 5. Figure 5 shows the full-time jobs function as a defined in Equation (11).
3.12. Twelfth Criterion: Environmental Impact,
According to Reference [24], the environmental impact should account for the impact on sustainability, landscape, subsidence, and potentially induced micro-seismicity, and account for the level of noise, atmospheric emissions, potential water contamination, and production of radioactive scaling. The fluid extraction could cause subsidence because of reservoir pressure decline and uplift during borehole drilling activities. This is measured in mm/year of soil decay. Moreover, the pore pressure reduction in production and increase in reinjection operations have been associated with increased induced seismicity, often microseisms of low energy (<2–3 M Richter scale) [31]. According to Reference [36] the ranges for this sub-criterion were assigned. The impact on the landscape is measured as land use intensity (LUI) for installed power in m2/kW, and the range was estimated according to Reference [37]. The noise impact during routine operation is mainly caused by cooling towers and electrical transformers, and according to Reference [38], typical acceptable levels are 71–83 dB at 900 m distance from the facility. When considering atmospheric emissions, closed cycles, such as binary plants, have no gaseous emissions or they are close to zero and so do not contribute to air pollution. Considering objects of interest in this research (Figure 3), the impact on surface waters can be excluded. Groundwater contamination may occur if the casings in reinjection wells should fail, allowing fluid to leak. According to WHO, the range of total dissolved solids (TDS) and pH values was determined for the quantification of this sub-criterion. Radioactivity is mainly caused by interaction between the geothermal fluid and certain formations containing radioactive elements. As emphasized in Reference [39], the content of radionuclides in acidic magmatic rocks is generally higher compared to sedimentary rocks. Furthermore, uranium (U) and thorium (Th) are the most common radioactive elements found in granites. As defined in Reference [39], different types of rocks can contain different radioelements. Therefore, this sub-criterion is defined with the ranges of the forenamed most common radioactive elements but also taking into account the type of the rock – granitic rocks, shales, basaltic rocks, sandstones, and carbonates - in ascending order of the weights. The environmental impact criterion will be obtained by the average of performances of the following sub-criterions shown in Table 12: subsidence sub-criterion, potential seismicity sub-criterion, land use sub-criterion, noise sub-criterion, potential water contamination sub-criterion, and radioactivity sub-criterion. Each sub-criterion will be evaluated with a weight in a range from 1 to 5.
4. Results
In this section, the purpose of the MCDM matrix is discussed and decision-making results are presented. The matrix is used to rank four different geothermal projects for two given end uses mentioned in Section 2.4, only electricity production and direct heat use, respectively. For a successful comparison, the geothermal projects being compared should be targeting the same end use, so that the comparison considers how key technical and economic factors are being utilised. Therefore, the two main scenarios are considered separately for all the projects (four sites in Table 13). In order to be able to execute an overall comparison, all the criterions mentioned in Section 3 are assessed. As stated before, relative importance in the decision making of each criterion is considered equal, meaning each criterion is equally influential on the final decision and therefore is set as 1. Final evaluation of chosen sites that includes all criteria is calculated as the average mean of 12 criterions Moreover, the extraction technology examined in this analysis is doublet producer-injector technology, described in Section 2.3. For the four geothermal sites, the input parameters used for Equations (1)–(12) are presented in Table 13.
These input parameters represent realistic geothermal sites. Some of the observed sites are currently in usage for electricity production, aquaculture, agriculture, and food industry. The observed sites are not in the same geological and environmental area so the MCDM tool could be properly used, because it evaluates and compares different geothermal sites at various geological settings for two scenarios.
4.1. Economic Parameters
The problems encountered with the development of geothermal energy systems are mostly related to the high upfront costs and the related finances. The high upfront costs are usually caused by the costs involved with the drilling of the wells, as mentioned in Section 2.2. The drawback with financing geothermal projects relates to the substantial uncertainties in the performance of the wells. Namely, EGS technology is still in an R&D phase since only a handful of projects have been realized. With estimated CAPEX and OPEX values, the LCOE of each site is calculated (Table 14), according to Equation (13) and passed on to the MCDM matrix. For analysis in this study, 55% of the CAPEX is excluded, since all the selected geothermal sites do not require drilling phase, i.e., the geothermal injector-producer doublet exist. Moreover, CAPEX is represented with specific investment costs in €/MW and OPEX is calculated as the percentage of the CAPEX in the range between 7–20%, depending on the year of operation.
where represents the amount of the electricity or heat produced in the year . represents the discount rate. T is the lifetime of the project.
4.2. First Scenario—Electricity Production Only
This scenario includes the end user option for only electricity production. The results of running the modelled MCDM matrix on the four selected geothermal sites to rank their feasibility according to economic-environment-social assessment are illustrated in Table 15. To estimate each criterion, the parameters from Table 13 and from Table 14 the base case values are used.
4.3. Second Scenario—Heat Production Only
This scenario includes the end user option for only heat production, for direct use applications. The results of running the modelled MCDM matrix on the four selected geothermal sites for this scenario to rank their feasibility according to economic-environment-social assessment are illustrated in Table 16. To estimate each criterion, the parameters from Table 13 and from Table 14 base case values are used. Load factor for specified sites is defined according to the application of the heat and as follows. It is modelled that all the sites use the obtained heat for district heating and accordingly the load factor is set to 0.3.
4.4. Sensitivity Analysis
Sensitivity analysis was carried out to see how the change of independent variables (CAPEX, discount rate, OPEX, lifetime) affects the dependent variable, i.e., system LCOE, under certain conditions. A sensitivity analysis makes it possible to distinguish between high-leverage variables, whose values have a significant impact and low-leverage variables, whose values have minimal impact. Site 1 and scenario of only electricity production were chosen for sensitivity analysis for the system LCOE. Values of observed input parameters used in the sensitivity analysis are shown in Table 17.
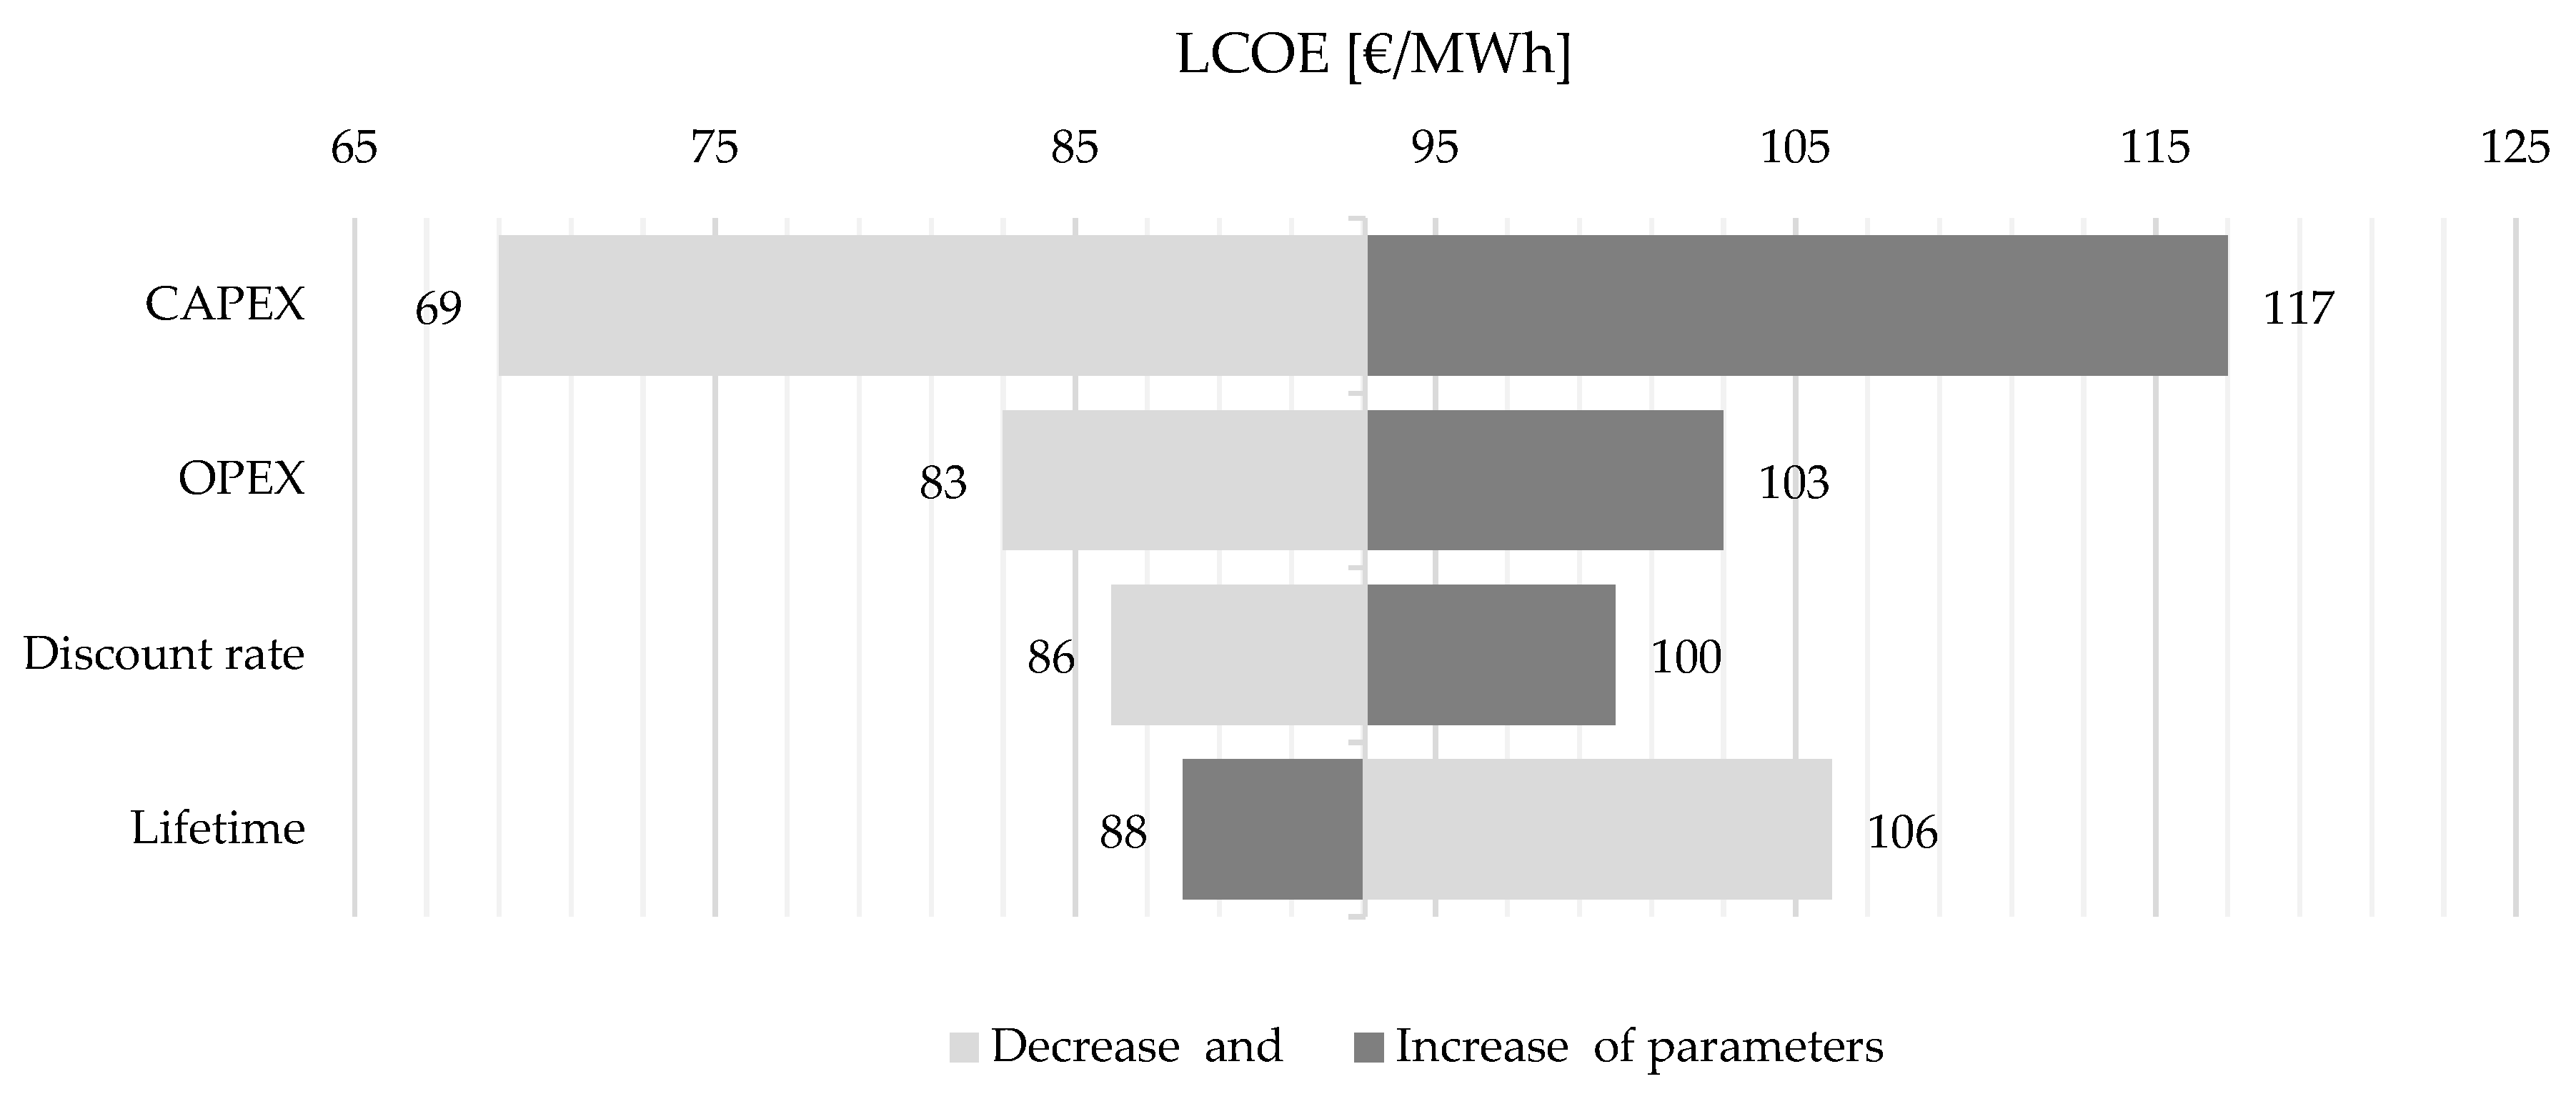
Tornado plot showing the sensitivity of calculated LCOE to changes in a selection of parameters is shown in Figure 7. The central value of the plot represents the calculated LCOE for the base case with the amount of 93 €/MWh. It could be seen that the most influence on system LCOE has CAPEX, followed by OPEX, discount rate and the lifetime of the project, respectively. Lowering the CAPEX, which consist mostly of the drilling costs, is crucial for making the EGS geothermal sites commercially available and competitive with other renewable sources.
4.5. Discussion
The presented MCDM as a subprocess of the DMS-TOUGE will enable a comprehensive understanding of the interaction between economic, geological, social, and technical uncertainty. The analysis conducted in this paper is a first order analysis and will benefit from additional work gained from the MEET project. It is expected that the model will receive several modifications in order to make it more accurate and impactful. As it can be seen from the final evaluation of each site in Table 15, the temperature and the flow rate are one of the most important constraints for development of an EGS project, especially in the case of electricity production only. Site 1 presents the highest temperature of the produced geothermal brine, and the highest flow rate. These conditions lead to the greater installed power at this site, compared to the others, and thereby the largest amount of electricity produced. When comparing the results obtained for two given scenarios of end-use, it is clear that the electricity generation is a better solution for the Site 1, since the final evaluation for this scenario is 3.5, compared to the scenario of heat production with a final evaluation of 3.33. The selected site is built to produce electricity instead of heat. It can be concluded that in most cases, higher reservoir temperature and hence higher temperature at the wellhead are suitable and economically viable for electricity production. Sometimes, specific end-user requirements, for example, heat load for industry regardless of the very expensive pipeline system, may determine final end user application. This can be manipulated by DM via weight factors settings. Moreover, for Site 2 in the scenario of electricity production, the evaluation is 2.83, that is, significantly lower than for the scenario of heat production with evaluation of 3.67. The decision for this site between the two scenarios is in favour of direct use heat production since, as it can be seen from the parameters from Table 13, the inlet temperature, as well as the difference between inlet and outlet temperature, is smaller than that for Site 1 or Site 3. In addition to this, the fluid flow rate for Site 2 is notably lower compared to Site 1 and Site 3. Therefore, the results obtained with the proposed MCDM matrix demonstrate that using low-to-moderate-temperature geothermal resources in the direct-heat applications, given the right conditions, is an economically feasible business as stated in Reference [41]. As stated before, practical results can be altered according to end user needs. For Site 3, the final evaluation for the electricity generation is 3 and 3.5 for the heat production scenario. Although the inlet temperature is quite high, the lowest fluid flow rate of all selected sites affects the final evaluation, especially in the scenario of electricity production. Site 4 has the lowest evaluation of 2.75 in the scenario of electricity generation. Namely, this site has the closest difference between the temperature of the produced geothermal fluid and the injection temperature, leaving thereby a small amount of heat that can be transferred to the secondary working fluid. The smaller the difference between those temperatures, the smaller the amount of produced electricity. However, in the case of the second scenario of heat production, it is visible that this site has a better final performance indicator. Therefore, lower reservoir temperature and a smaller difference between wellhead inlet and outlet temperature are more suitable for direct heat use applications. Social and environmental impact of selected EGS sites are favorable for both scenarios and therefore have high-performance indicators for those criteria. Namely, the installed power of the selected sites imposes modest land-use intensity, considering that technical characteristics of the EGS systems atmospheric emissions are zero. Moreover, selected air-cooled systems do not require additional cooling water, leading to no surface water exploitation. The social impact is positive, since the selected projects are relatively small to medium size projects, and represent more benefits than disadvantages at the local level since the balance between power plant size and local impact and benefits in terms of FT and C&M jobs is established.
5. Conclusions
This paper presents the concept of multi-scale Decision-Making Support Tool for Optimal Usage of Geothermal Energy (DMS-TOUGE) and one of its main features, the multiple-criteria decision-making. These features are used for economic and environmental assessment of enhanced geothermal systems projects. The paper contributes with expanded and detailed criteria related to environmental and social impact giving the necessary emphasis on so far neglected important aspects for successful completion of geothermal projects. Moreover, by combining technical, economic, environmental, and social aspects of geothermal projects, the multiple-criteria decision-making presented in this work gives a comprehensive assessment of enhanced geothermal systems projects. The multiple-criteria decision-making (MCDM) matrix is tested on the case of four operating demonstration geothermal sites where it is used for assessment and comparative analysis. In the application of MCDM matrix, the choice of the weight to assign to the different criterions affects the evaluation of the project. In this work, it is considered that each criterion has equal relative importance in decision making, therefore the weights, , associated with each criterion, are considered identical and are valued with unitary weight. It is, however, important to highlight that the weights assigned to each criterion can vary depending on the DM’s standpoint. Therefore, the results of the final evaluation of the project will vary if a greater weight is assigned to specific criterions according to DM’s assessment. Further steps in tool development are the incorporation of many other relevant decision-making input parameters, not included in the analysis made in this study, testing its capabilities and subsequent verification and validation of the tool. Its proper function is of key importance for work packages and several deliverables of H2020 project such as generation of several layers for mapping (of the main promising European sites where EGS can or should be implemented in a near future) in different resolutions: EU wide layer, layer considering different geologic features, and pilot site layer. The multi-scale Decision-Making Support Tool for Optimal Usage of Geothermal Energy (DMS-TOUGE) will be fully developed as part of the Horizon 2020 project: Multidisciplinary and multi-context demonstration of EGS exploration and Exploitation Techniques and potentials (MEET, GA No 792037). The developed tool will be useful for the decision makers involved in enhanced geothermal system projects associated with applications to nearly unexploited reservoir types (Variscan orogenic belt). This will provide valuable information to decision makers and investors for assessment of enhanced geothermal systems projects considering site-specific environmental, techno-economic and geological features.
Author Contributions
S.R., P.I. and I.R. have contributed to developing the concept, formulation and validation of the methodology. S.R. and P.I. have been involved in the implementation of the problem, and analysis of the results. I.R., T.B. and G.T. have been involved in investigation, supervision and project administration. All the authors are involved in preparing the manuscript.
Funding
This project has received funding from the European Union’s Horizon 2020 research and innovation programme under grant agreement No 792037 and support from Department of Energy and Power Systems of University of Zagreb Faculty of Electrical Engineering and Computing.
Conflicts of Interest
The authors declare no conflict of interest.
References
- IRENA (International Renewable Energy Agency). Renewable Capacity Statistics 2018. Available online: https://www.irena.org/publications/2018/Mar/Renewable-Capacity-Statistics-2018 (accessed on 20 December 2018).
- Beckers, K.F.; Lukawski, M.Z.; Anderson, B.J.; Moore, M.C.; Tester, J.W. Levelized costs of electricity and direct-use heat from Enhanced Geothermal Systems. J. Renew. Sustain. Energy 2014, 6. [Google Scholar] [CrossRef]
- Alimonti, C.; Falcone, G.; Liu, X. Potential for Harnessing the Heat from a Mature High-Pressure- High-Temperature Oil Field in Italy. In Proceedings of the SPE Annual Technical Conference and Exhibition, Amsterdam, The Netherlands, 27–29 October 2014; pp. 3763–3775. [Google Scholar] [CrossRef]
- Zhang, L.; Yuan, J.; Liang, H.; Li, K. Energy from Abandoned Oil and Gas Reservoirs. In Proceedings of the SPE Asia Pacific oil and gas Conference and Exhibition, Perth, Australia, 20–22 October 2008; pp. 404–503. [Google Scholar]
- Davis, A.P.; Efstathios, E.; Michaelides, E. Geothermal power production from abandoned oil wells. Energy 2009, 34, 866–872. [Google Scholar] [CrossRef]
- Bu, X.; Ma, W.; Li, H. Geothermal energy production utilizing abandoned oil and gas wells. Renew. Energy 2012, 41, 80–85. [Google Scholar] [CrossRef]
- Barbacki, A.P. The use of abandoned oil and gas wells in Poland for recovering geothermal heat. In Proceedings of the World Geothermal Congress, Kyzshu-Tohoku, Japan, 28 May–10 June 2000. [Google Scholar]
- Xin, S.; Liang, H.; Hu, B.; Li, K. Electrical Power Generation from Low Temperature Co-Produced Geothermal Resources at Huabei Oilfield. Proceedings Thirty-Seventh Workshop on Geothermal Reservoir Engineering, Stanford, USA, 2012. Available online: https://pangea.stanford.edu/ERE/pdf/IGAstandard/SGW/2012/Xin.pdf (accessed on 26 April 2019).
- Cheng, W.; Li, T.; Nian, Y.; Wang, C. Studies on geothermal power generation using abandoned oil wells. Energy 2013, 59, 248–254. [Google Scholar] [CrossRef]
- Zhang, L.; Liu, M.; Kewen, L. Estimation of Geothermal Reserves in Oil and Gas Reservoirs. In Proceedings of the SPE Western Reginal Meeting, San Jose, CA, USA, 24–26 March 2009. [Google Scholar]
- Guercio, M.; Bonafin, J. The Velika Ciglena Geothermal Binary Power Plant. In Proceedings of the 6th African Rift Geothermal Conference, Addis Ababa, Ethiopia, 2–4 November 2016. [Google Scholar]
- Tipurić, D.; Bruketa, N.; Ćenan, D. Izvodljivost Programa Gospodarske uporabe Geotermalne Energije na Lokaciji Velika Ciglena; Sveučilište u Zagrebu, Ekonomski fakultet Zagreb: Zagreb, Croatia, 2007. [Google Scholar]
- Golub, M.; Kurevija, T.; Koščak-Kolin, S. Thermodynamic cycle optimization in the geothermal energy production. Rud-Geol.-Naft. Zagreb 2004, 16, 81–84. [Google Scholar]
- Lu, S.M. A global review of enhanced geothermal systems (EGS). Renew. Sustain. Energy Rev. 2017, 81, 2902–2921. [Google Scholar] [CrossRef]
- Sanyal, S.K.; Morrow, J.W.; Butler, S.J.; Robertson-Tait, A. Is EGS Commercially Feasible? GRC Trans. 2007, 31. Available online: https://catalog.data.gov/dataset/is-egs-commercially-feasible/resource/6dde9e1b-8cf1-4b4c-96ab-28a8ed25eba9 (accessed on 26 April 2019).
- Sanyal, S.K.; Morrow, J.W.; Butler, S.J.; Robertson-Tait, A. Cost of electricity from enhanced geothermal systems. In Proceedings of the Thirty-Second Workshop on Geothermal Reservoir Engineering, Stanford, CA, USA, 22–24 January 2017. [Google Scholar]
- Clark, C.; Sullivan, J.; Harto, C.; Han, J.; Wang, M. Life cycle environmental impacts of geothermal systems. J. Renew. Sustain. Energy 2013, 5. [Google Scholar] [CrossRef]
- Bayer, P.; Rybach, L.; Blum, P.; Brauchler, R. Review of life cycle environmental effects of geothermal power generation. Renew. Sustain. Energy Rev. 2013, 26, 446–463. [Google Scholar] [CrossRef]
- Olasolo, P.; Juárez, M.C.; Olasolo, J.; Morales, M.P.; Valdani, D. Economic analysis of Enhanced Geothermal Systems (EGS). A review of software packages for estimating and simulating costs. Appl. Therm. Eng. 2016, 104, 647–658. [Google Scholar] [CrossRef]
- Office of Energy Efficiency and Renewable Energy, Geothermal Electricity Technology Evaluation Model (GETEM). Available online: https://www.energy.gov/eere/geothermal/geothermal-electricity-technology-evaluation-model (accessed on 15 October 2018).
- Heidinger, P.; Dornstadter, A.; Fabritius, A. HDR economic modelling HDRec software. Geothermics 2006, 28, 71–683. [Google Scholar] [CrossRef]
- De Jesus, A.C. Environmental benefits and challenges associated with geothermal power generation. In Geothermal Power Generation: Developments and Innovation; R. DiPippo; Woodhead Publishing, 2016; pp. 477–498. [Google Scholar] [CrossRef]
- Cataldi, R. Social Acceptability of Geothermal Energy: Problems and Costs. 1997, pp. 343–351, Ankara. Available online: https://www.geothermal-energy.org/pdf/IGAstandard/ISS/2001Romania/cataldi.pdf (accessed on 26 April 2019).
- Popovski, K. Political and Public Acceptance of Geothermal Energy. IGC2003. Reykjavík, Iceland, September 2003. Available online: https://orkustofnun.is/gogn/unu-gtp-report/UNU-GTP-2003-01-03.pdf (accessed on 26 April 2019).
- Shang, Y. Resilient Multiscale Coordination Control against Adversarial Nodes. Energies 2018, 11, 1844. [Google Scholar] [CrossRef]
- Rockafellar, R.T.; Uryasev, S. Conditional value-at-risk for general loss distribution. J. Bank. Financ. 2002, 26, 1443–1471. [Google Scholar] [CrossRef]
- Ilak, P.; Rajšl, I.; Đaković, J.; Delimar, M. Duality Based Risk Mitigation Method for Construction of Joint Hydro-Wind Coordination Short-Run Marginal Cost Curves. Energies 2018, 11, 1254. [Google Scholar] [CrossRef]
- Ilak, P.; Krajcar, S.; Rajšl, I.; Delimar, M. Pricing Energy and Ancillary Services in a Day-Ahead Market for a Price-Taker Hydro Generating Company Using a Risk-Constrained Approach. Energies 2014, 7, 2317–2342. [Google Scholar] [CrossRef]
- Gehringer, M.; Loksha, V. Geothermal Handbook: Planning and Financing Power Generation (English). ESMAP technical report; no. 002/12. 2012. Available online: https://www.esmap.org/sites/esmap.org/files/DocumentLibrary/FINAL_Geothermal%20Handbook_TR002-12_Reduced.pdf (accessed on 7 January 2019).
- Mengying, L.; Noam, L. Comparative Analysis of Power Plant Options for Enhanced Geothermal Systems (EGS). Energies 2014, 7, 8427–8445. [Google Scholar] [CrossRef]
- Soldo, E.; Alimonti, C. From an oilfield to a geothermal one: use of a selection matrix to choose between two extraction technologies. In Proceedings of the World Geothermal Congress 2015, Melbourne, Australia, 19–25 April 2015. [Google Scholar]
- Moon, H.; Zarrouk, S.J. Efficiency of geothermal power plants: A worldwide review. In Proceedings of the New Zealand Geothermal Workshop 2012, Auckland, New Zealand, 19–21 November 2012. [Google Scholar]
- AL-Mahrouqi, J.; Falcone, G. An Expanded Matrix to Scope the Technical and Economic Feasibility of Waste Heat Recovery from Mature Hydrocarbon Fields. In Proceedings of the 41st Workshop on Geothermal Reservoir Engineering, Stanford, CA, USA, 22–24 February 2016. [Google Scholar]
- Rafferty, K. Industrial Processes and the Potential for Geothermal Applications. Report. GHC Bulletin: Oregon, 2003. Available online: https://oregontechsfstatic.azureedge.net/sitefinity-production/docs/default-source/geoheat-center-documents/quarterly-bulletin/vol-24/art21683ee4362a663989f6fff0000ea57bb.pdf?sfvrsn=8b258d60_4 (accessed on 26 April 2019).
- Cataldi, R. Social Acceptability of Geothermal Energy: Problems and Costs. EC International Geothermal Course. Oradea, Romania, 2001; pp. 343–351. Available online: https://www.geothermal-energy.org/pdf/IGAstandard/ISS/2001Romania/cataldi.pdf (accessed on 26 April 2019).
- Zang, A.; Oye, V.; Jousset, P.; Deichmann, N.; Gritto, R.; McGarr, A.; Majer, E.; Bruhn, D. Analysis of induced seismicity in geothermal reservoirs—An overview. Geothermics 2014, 52, 6–21. [Google Scholar] [CrossRef]
- Johansson, T.B.; Patwardhan, A.; Nakicenovic, N. Gomez-Echeverri, Land-use and Energy Systems. In L. Global Energy Assessment: Toward a Sustainable Future; Cambridge University Press: Cambridge, UK, 2012; pp. 232–234. [Google Scholar]
- DiPippo, R. Geothermal energy Electricity generation and environmental impact. Energy Policy 1997, 19, 798–807. [Google Scholar] [CrossRef]
- Johnson, S. Natural radiation. Va. Miner. 1991, 37, 9–16. [Google Scholar]
- Zongjun, G.; Yonggui, L.; Yaun, G. The Principle of Density Differences Drive Geothermal Water to Move and the Short-Range Recharge Model of Geothermal Water in Hilly Area. In Proceedings of the Thirty-Ninth Workshop on Geothermal Reservoir Engineering PROCEEDINGS, Stanford, CA, USA, 24–26 February 2014. [Google Scholar]
- Lund, J.W. Direct Utilization of Geothermal Energy. Energies 2010, 3, 1443–1471. [Google Scholar] [CrossRef]
Figure 1.
Schematic description of the main processes in Decision-Making Support Tool for Optimal Usage of Geothermal Energy (DMS-TOUGE).
Figure 1.
Schematic description of the main processes in Decision-Making Support Tool for Optimal Usage of Geothermal Energy (DMS-TOUGE).

Figure 2.
Capital costs included in Decision-Making Support Tool for Optimal Usage of Geothermal Energy (DMS-TOUGE) determination of a system levelized cost of energy (sLCOE).
Figure 2.
Capital costs included in Decision-Making Support Tool for Optimal Usage of Geothermal Energy (DMS-TOUGE) determination of a system levelized cost of energy (sLCOE).

Figure 3.
Extraction technologies: (a) producer-injector doublet, (b) borehole heat exchanger single U-tube, (c) borehole heat exchanger double U-tube, (d) coaxial borehole heat exchanger.
Figure 3.
Extraction technologies: (a) producer-injector doublet, (b) borehole heat exchanger single U-tube, (c) borehole heat exchanger double U-tube, (d) coaxial borehole heat exchanger.

Figure 4.
Schematic description of the possible end-user options: (a) direct use, (b) only electricity production, (c) combined heat and power (CHP)–series configuration, (d) CHP–parallel configuration.
Figure 4.
Schematic description of the possible end-user options: (a) direct use, (b) only electricity production, (c) combined heat and power (CHP)–series configuration, (d) CHP–parallel configuration.

Figure 5.
Schematic diagram of a basic binary cycle geothermal power plant: (a) water-cooled condenser and (b) air-cooled condenser.
Figure 5.
Schematic diagram of a basic binary cycle geothermal power plant: (a) water-cooled condenser and (b) air-cooled condenser.

Figure 6.
Total employment – full-time jobs function depending on the installed capacity of the project
Figure 6.
Total employment – full-time jobs function depending on the installed capacity of the project

Figure 7.
Tornado plot showing the sensitivity of the calculated levelized cost of energy (LCOE) to changes in a selection of parameters.
Figure 7.
Tornado plot showing the sensitivity of the calculated levelized cost of energy (LCOE) to changes in a selection of parameters.


Table 1.
Performance values for 1st criterion.
| Ratio (p.u.) | |||||
|---|---|---|---|---|---|
| 1 | 2 | 3 | 4 | 5 |
Table 2.
Performance values for 2nd criterion.
| Ratio | |||||
|---|---|---|---|---|---|
| 1 | 2 | 3 | 4 | 5 |
Table 3.
Performance values for 3rd criterion.
| Efficiency of Conversion for ORC Plant (%) | |||||
| 1 | 2 | 3 | 4 | 5 | |
| Efficiency of Conversion for Other Cases (%) | |||||
| 1 | 2 | 3 | 4 | 5 |
Table 4.
Performance values for 4th criterion.
| Geo.gra. (°C/100 m) | |||||
|---|---|---|---|---|---|
| 1 | 2 | 3 | 4 | 5 |
Table 5.
Performance values for 5th criterion.
| Temp. (°C) | |||||
|---|---|---|---|---|---|
| 1 | 2 | 3 | 4 | 5 |
Table 6.
Performance values for 6th criterion.
| Global Efficiency | |||||
|---|---|---|---|---|---|
| 1 | 2 | 3 | 4 | 5 |
Table 7.
Performance values for 7th criterion.
| LSI | |||||
|---|---|---|---|---|---|
| 1 | 2 | 3 | 4 | 5 |
Table 8.
Performance values for 8th criterion.
| Distance (km) | |||||
|---|---|---|---|---|---|
| 1 | 2 | 3 | 4 | 5 |
Table 9.
Performance values for 9th criterion.
| Load Factor | |||||
|---|---|---|---|---|---|
| 1 | 2 | 3 | 4 | 5 |
Table 10.
Performance values for 10th criterion.
| Ratio | |||||
|---|---|---|---|---|---|
| 1 | 2 | 3 | 4 | 5 |
Table 11.
Performance values for 11th criterion.
| Social Acceptance Costs of Direct Use or Electricity Production | |||||
| 1 | 2 | 3 | 4 | 5 | |
| Social Acceptance Costs of Combined Heat – Electricity | |||||
| 1 | 2 | 3 | 4 | 5 | |
| Employment FT | |||||
| 1 | 2 | 3 | 4 | 5 | |
| Employment C&M | |||||
| 1 | 2 | 3 | 4 | 5 | |
| Total Social Impact | |||||
| 1 | 2 | 3 | 4 | 5 |
Table 12.
Performance values for 12th criterion are defined according to values available in References [31,36,37,38,39].
| 1 | 2 | 3 | 4 | 5 | |
| Potential Seismicity PGV (cm/s) PGA (cm/s2) | |||||
| 1 | 2 | 3 | 4 | 5 | |
| Land Use (m2/kW) | |||||
| 1 | 2 | 3 | 4 | 5 | |
| Noise (dB) | |||||
| 1 | 2 | 3 | 4 | 5 | |
| Potential Water Contamination TDS (mg/L); (pH) | |||||
| 1 | 2 | 3 | 4 | 5 | |
| Radioactivity (ppm) | |||||
| 1 | 2 | 3 | 4 | 5 | |
| Total Environmental Impact | |||||
| 1 | 2 | 3 | 4 | 5 |
Table 13.
Input parameters for the multiple-criteria decision-making (MCDM) matrix for four selected geothermal sites.
Table 13.
Input parameters for the multiple-criteria decision-making (MCDM) matrix for four selected geothermal sites.
| Parameter | Unit | Site 1 | Site 2 | Site 3 | Site 4 |
|---|---|---|---|---|---|
| L/s | 83.33 | 20 | 5.5 | 77.1 | |
| °C | 170 | 80 | 140 | 80 | |
| °C | 70 | 32 | 70 | 40 | |
| Geothermal gradient | °C/100 m | 6.18 | 6.1 | 3 | 6 |
| Number of wells | No. | 1 | 1 | 1 | 1 |
| J/kgK | 4185.5 | 4185.5 | 4185.5 | 4185.5 | |
| Corrosion and scaling | LSI | 1.5 | 0.5 | 0.5 | 0.5 |
| kg/m3 | 897.3 | 971.76 | 925.9 | 971.76 | |
| % | 6.18 | 6.1 | 3 | 6 | |
| % | 76.47 | 62.5 | 78.57 | 53.33 |
1 Density of the geothermal water changes with the temperature according to Reference [40].
Table 14.
Economic parameters used for levelized cost of energy (LCOE) calculations.
| Parameter | Unit | Value |
|---|---|---|
| Specific costs | €/MW | 4,500,000; 6,750,000 1; 9,000,000 |
| OPEX | €/MWh | 10; 20 1; 30 |
| % | 6; 7 1; 8.7 | |
| years | 20; 30 1; 40 | |
| MWh (annual) | Calculated 2 |
1 Base case values are used in the base case scenario, left values represent decreased and right values increased values compared to the base case scenario that is used in the sensitivity analysis; 2 The annual produced electricity or heat is calculated as a product of Equation (2) and (3) or Equation (4).
Table 15.
Ranking of the selected geothermal sites in this study for electricity production.
| Criterion | Site 1 | Site 2 | Site 3 | Site 4 |
|---|---|---|---|---|
| 4 | 1 | 1 | 1 | |
| 1 | 2 | 4 | 1 | |
| 3 | 1 | 2 | 1 | |
| 5 | 5 | 3 | 5 | |
| 5 | 2 | 4 | 2 | |
| 1 | 1 | 1 | 1 | |
| 1 | 4 | 4 | 4 | |
| 4 | 5 | 4 | 5 | |
| 5 | 5 | 5 | 5 | |
| 3 | 3 | 3 | 3 | |
| 5 | 5 | 5 | 5 | |
| 5 | 5 | 5 | 5 | |
| Final | 3.5 | 2.83 | 3 | 2.75 |
Table 16.
Ranking of selected geothermal sites in this study for heat production.
| Criterion | Site 1 | Site 2 | Site 3 | Site 4 |
|---|---|---|---|---|
| 4 | 5 | 4 | 4 | |
| 1 | 2 | 3 | 1 | |
| 5 | 5 | 5 | 5 | |
| 5 | 5 | 3 | 5 | |
| 5 | 2 | 4 | 2 | |
| 4 | 4 | 4 | 4 | |
| 1 | 4 | 4 | 4 | |
| 3 | 4 | 3 | 4 | |
| 2 | 2 | 2 | 2 | |
| 1 | 1 | 1 | 1 | |
| 4 | 5 | 4 | 5 | |
| 5 | 5 | 5 | 5 | |
| Final | 3.33 | 3.67 | 3.5 | 3.5 |
Table 17.
The sensitivity of the system levelized cost of energy (LCOE) to input parameters.
| Input Parameter | Unit | Decrease | Base | Increase |
|---|---|---|---|---|
| CAPEX | €/MW | 4,500,000 | 6,750,000 | 9,000,000 |
| Discount rate | % | 6 | 7 | 8 |
| OPEX | €/MWh | 20 | 30 | 40 |
| Lifetime | years | 20 | 30 | 40 |
© 2019 by the authors. Licensee MDPI, Basel, Switzerland. This article is an open access article distributed under the terms and conditions of the Creative Commons Attribution (CC BY) license (http://creativecommons.org/licenses/by/4.0/).
Share and Cite
MDPI and ACS Style
Raos, S.; Ilak, P.; Rajšl, I.; Bilić, T.; Trullenque, G. Multiple-Criteria Decision-Making for Assessing the Enhanced Geothermal Systems. Energies 2019, 12, 1597. https://doi.org/10.3390/en12091597
AMA Style
Raos S, Ilak P, Rajšl I, Bilić T, Trullenque G. Multiple-Criteria Decision-Making for Assessing the Enhanced Geothermal Systems. Energies. 2019; 12(9):1597. https://doi.org/10.3390/en12091597
Chicago/Turabian StyleRaos, Sara, Perica Ilak, Ivan Rajšl, Tena Bilić, and Ghislain Trullenque. 2019. "Multiple-Criteria Decision-Making for Assessing the Enhanced Geothermal Systems" Energies 12, no. 9: 1597. https://doi.org/10.3390/en12091597
Note that from the first issue of 2016, this journal uses article numbers instead of page numbers. See further details here.