Article

Evaluation of Effectiveness of CO2 Sequestration Using Portland Cement in Geological Reservoir Based on Unified Pipe-network Method

1
State Key Laboratory for Geo-mechanics and Deep Underground Engineering, China University of Mining and Technology, 1 Daxue Road, Xuzhou 221116, China
2
Institute for Structural Mechanics, Ruhr University Bochum, Universitätsstraße 150, 44801 Bochum, Germany
3
Geotechnical & Structural Engineering Research Center, Shandong University, Jinan 250061, China
4
School of Civil and Transportation Engineering, Hebei University of Technology, 5340 Xiping Road, Beichen District, Tianjin 300401, China
*
Authors to whom correspondence should be addressed.
Energies 2020, 13(2), 387; https://doi.org/10.3390/en13020387
Submission received: 29 October 2019 / Revised: 12 December 2019 / Accepted: 17 December 2019 / Published: 13 January 2020
(This article belongs to the Special Issue Computational Methods of Multi-Physics Problems Ⅱ)

Abstract

:
In this paper, we first recapitulate some basic notions of the CO 2 sequestration and numerical model. Next, a mixed model is employed into the CO 2 sequestration framework, for simulating CO 2 geological sequestration processes. The last part of the paper makes extensions to evaluation of the effectiveness of CO 2 sequestration with respect to atmospheric pressure, formation temperature, the initial reactant concentration, fracture aperture, and fracture dip. The results show that reactive Portland cement has a great impact on the effectiveness of CO 2 sequestration, while the proposed mixed model is robust in simulation.

1. Introduction

Anthropogenic emissions of carbon dioxide (CO 2 ) lead to global warming, and many other serious problems, i.e., extreme weather and disease, wreak havoc. Considering both the cost and efficiency of the storage methods, CO 2 geological sequestration is regarded as a effective way to reduce the release of CO 2 to the atmosphere. However, specific conditions are required to construct the reservoir of CO 2 , one of which is an impermeable seal overlying the reservoir. Hence, some measures should be implemented due to the the existence of discrete fracture networks. As one of the most effective methods, using CO 2 -reactive or CO 2 -consuming solution to form precipitation clogging the voids of the formation to reduce the porosity and hydraulic conductivity of the rock and minimize CO 2 emission have been developed [1,2,3,4,5]. Thus, it’s very important to evaluate the effectiveness of CO 2 sequestration using portland cement in geological reservoir.
Portland cement will react with CO 2 when water is present and form carbonation [6]. Carbonation is associated with the changes in the flow and transport properties and will cause to a loss of hydraulic and diffusion properties [6,7,8,9,10,11].The change of porosity in porous medium are typically caused by the mineral alteration processes. During chemical or physical process, clogging of porous media due to mineral precipitation can lead to a reduction of the effective porosity and hydraulic conductivity. In addition, different reaction rates will cause local concentration gradients and different transport path in connected pores, which are strongly dependent upon pore-scale heterogeneity [12,13]. Researchers have experimentally investigated the effect of microstructure changes on permeability and porosity due to dissolution or precipitation at the pore scale [14,15,16]. These studies found that the reaction rates are strongly related with the pore-scale conditions [17,18,19]; moreover, the spatial distribution of total reaction rates in the pore space is non-uniform [20,21,22,23,24]. Nonetheless, while the experimental results propose some reasonable connection between porosity and permeability, they are not transferable on the long term since the experiments can only be lasted for several months, furthermore, reactive transport codes for predicting the evolution process are not experimentally accessible in space and time [25,26,27,28].
For simulating the geochemical processes in long-term period of CO 2 sequestration, numerical methods [29,30,31], including finite difference method (FDM) [32,33], finite element method (FEM) [34,35,36,37], finite volume method (FVM) [38], smoothed particle hydrodynamics(SPH), lattice Boltzmann methods (LBM), have been proposed to solving the energy, momentum and concentration conservation equations [39]. With these methods, many studies are carried out, for insurance, Luo [40] et al. and Tartakovsky [24] et al. simulate the reactive transport and precipitation process in porous media and analyzed the effective reaction coefficients and mass transfer coefficients [17,41,42]. Parmigiani et al. [43] used LBM to simulate the multipahse reactive transport and reaction process in the random pore media and studied the spatial distribution of each phase. However, it is arduous for computer programming that requires a considerable use of parallel computing approaches and it is difficult to add the constant-pressure boundary conditions.
Most numerical models assume that CO 2 is evenly released into the aquifer, and neglect the influence of fractures on CO 2 sequestration. However, the permeability of fractures are much larger than the rock matrix, which should be treated as channels in fractured porous media for fluid flow and reactive transport [44,45]. The fractures are significant in prediction of CO 2 leakage evolution and distribution. Research has been presented on the simulation of fractured model, i.e., Bigi et al. [46] build a fractured model to study the CO 2 emission through fracture networks by establishing the Analogue Models. Lee [47] investigated CO 2 injection process in fractured formation. Pan et al. [48] analyzed the initial 2D caprock failure induced by geologic carbon sequestration. They all emphasize the importance of fractures on the CO 2 leakage. The discrete models are regarded as an effective tool to understand the release of CO 2 . However, most of the models were generally simulated within 2D domains due to the computational complexity and demand. Although 2D models are useful to analyze the CO 2 sequestration in fractured rock, they are not able to fully represent a geological formation with all its complexities, so they cannot accurately capture the CO 2 release and distribution.
The present study aims to simulate the CO 2 sequestration in the 3D domain considering the existence of fracture networks in the caprock. This process couples the process of fluid flow, reactive solute transport and chemical reaction. The unified pipe-network method (UPM) [49,50,51,52] is employed for its simpleness in the simulation of mass/energy-transport in 3D fractured rock matrix. The fluid pressure, reactive solute concentration and chemical reaction rate are assigned to each node. With this methodology, the Darcy scale model and the pore-scale model can be solved together. The UPM solves the coupled transport equations one after another and transfers the field states among different physical/chemical fields back and forth, avoiding strong coupled description of the multi-fields such as [53,54,55,56,57]. Moreover, the simulations of crack initiation and propagation are not considered, avoiding complex models presented in such as [58,59,60,61,62,63,64,65,66]. The UPM transforms 3D complicated fractures and porous medium into 1D artificial connected pipes in domain space and it uses the equivalent pipe networks to simulate the mass/energy transport processes within a 3D fractured porous medium. The properties of pipes are obtained according to the geometrical, hydraulic and transport properties of the corresponding fractures and rock matrices. Thus, the 3D fractures with arbitrary geometric parameters can be established and embedded into the rock matrix.
Some basic assumptions of this model need to be firstly clarified as: (1) CO 2 sequestration can be regarded as a single phase flow process, as the gas phase is assumed to be immobile and is considered as a fixed species neglecting the two-phase flow effects [67]; (2) the gaseous carbon dioxide CO 2 is converted into reactive liquid CO 2 and then analyze the transport of the dissolved CO 2 and the precipitation process of minerals without considering the CO 2 dissloution; (3) the distribution of pore in the porous medium is regarded to be uniform.
In this paper, we will first review some basic concepts in CO 2 sequestration and grouting seepage prevention, and in mixed modeling. Next, we will employ the mixed model to simulate the CO 2 sequestration in the 3D domain considering the existence of fracture networks, where we investigate a number of factors that can critically affect the performance of mixed model in CO 2 sequestration. A contribution on how to apply mixed model to sequestrating CO 2 follows in Section 4. Variation of CO 2 concentration, Si concentration, and porosity are considered. Conclusions drawn from this simulation are presented in Section 5.

2. Methodology

2.1. Description of the Reactive Transport Code

In this paper, we consider a simplified chemical model to analyze the process of reactant transport in porous medium, while the chemical model can be described with two aqueous chemical species and one solid phase as:
A ( a q ) + B ( a q ) C ( s ) ,
where a q stands for aqueous species, and s refers to solid phase. Equation (1) is a precipitation reaction in which the aqueous A ( a q ) reacts with aqueous B ( a q ) , generating the precipitate C ( s ) .
The incompressible saturated fluid flow in porous media and fractures can be described by a mass balance equation:
t ( ϕ τ ρ ) + · ( ρ 1 μ K τ · P ) = ρ q ,
where τ is a term to express the matrix and fracture, respectively ( τ = m represents matrix and τ = f represents fracture); ϕ is the porosity; K is the intrinsic permeability tensor (m 2 ); ρ is the fluid density (kg m 3 ); μ is the fluid viscosity (Pa·s); P is the fluid pressure (Pa); and q is the source term. Assuming that the fracture is smooth and parallel and the fluid flow obeys the cubic law, the intrinsic permeability for fracture can be estimated as k f = a 2 / 12 , where a is the fracture aperture (m) [68].
The governing equation of transport of aqueous chemical species in rock matrix and fracture are established based the advection-diffusion equation [4]:
t ( ϕ τ C ) + u · C = · ( ϕ τ D τ · C ) + r ,
where C is the concentration of the solute (mol m 3 ); u is the reactant solution velocity vector (m s 1 ); D τ is the molecular diffusion–dispersion coefficient of the chemical reactor (m 2 s 1 ); r is the total reaction rate (mol m 3 s 1 ); r < 0 represents the dissolution; and r > 0 represents the precipitation.
The precipitation growth in this model is described by surface reaction. The reaction of A ( a q ) and B ( a q ) on the surface of precipitation node causes the consumption of chemical reactant species in the pore and the growth of mineral product. The reaction kinetics at fluid-solid interface is expressed as [69]:
D A ( a q ) C A ( a q ) n = 0 i f   C A ( a q ) C B ( a q ) < K c k r ( 1 K e q C A ( a q ) C B ( a q ) ) i f   C A ( a q ) C B ( a q ) K c ,
D B ( a q ) C B ( a q ) n = 0 i f C A ( a q ) C B ( a q ) < K c k r ( 1 K e q C A ( a q ) C B ( a q ) ) i f C A ( a q ) C B ( a q ) K c ,
where k r is the reaction rate constant (mol m 2 s 1 ) ; K e q is the equilibrium constant for reaction (m 6 mol 2 ); and K c is a threshold for denoting the mineral growth barrier on the surface of C ( s ) (mol 2 m 6 ). The total reaction rate can be expressed as:
r = A k r ( 1 K e q C A ( a q ) C B ( a q ) ) ,
where A is the specific reactive surface area (m 2 m 3 rock).
The reaction rate constant k r in Equations (4) and (5) is influenced by temperature, and the value at random temperature T ( K ) can be calculated via the Arrhenius equation as [70,71]:
k r = k 25 exp [ E a R ( 1 T 1 298.15 ) ] ,
where k 25 is the rate constant at 25 C (mol m 2 s 1 ); E a is the activation energy (J mol 1 ); and R is the gas constant (J mol 1 K 1 ).
Precipitation of minerals leads to a increase of solid phase. The volume fraction of minerals β is updated by [41,72]:
β t = V m A k r ( 1 K e q C A ( a q ) C B ( a q ) ) ,
where V m is the molar volume (m 3 mol 1 ).
The change of volume fraction of solid phase due to precipitation directly causes the variation of porosity of rock matrix as [73]:
ϕ m = ϕ 0 m i = 1 N m β i ,
where ϕ 0 m is the initial matrix porosity and N m represents the total mineral product.
Change of intrinsic permeability [74] and specific surface area [75] for the rock matrix is related to the porosity and can be estimated as:
K m K 0 m = ( ϕ m ϕ c m ϕ 0 m ϕ c m ) n ,
A A 0 = ( 1 ϕ m 1 ϕ 0 m ) 2 3 ,
where K 0 m is the initial intrinsic porosity tensor for matrix; A 0 is the initial specific surface area; ϕ c m is a “critical” porosity in which the matrix permeability approaches to zero; and n is a power law exponent.

2.2. UPM Model for Solute Transport

The Unified Pipe-Network Method based on the Control Volume Finite Element (CVFE) is proposed by Ren [49,50,76,77]; for a detailed description of this model, see [78,79]. In the UPM frame, the above mentioned two governing equations for both rock matrix and fractures are discretized as:
( ϕ i τ V i τ ρ ) t + ρ j = 1 n i K i j τ ( P i P j ) = ρ Q s i ,
( ϕ i τ V i τ C i ) t + j = 1 n i D i j τ ( C i C j ) + j = 1 n i Q i j ( C i + C j 2 ) + k r A V i τ ( 1 K e q C A ( a q ) C B ( a q ) ) = 0 ,
where P i and P j are the pressures at node i and j; and C i and C j are the concentrations for nodes i and j, respectively; ϕ i m is the porosity of node i; V i is the control volume of node i; the subscript n i is the total number of connected pipes; K i j m is the equivalent conductance coefficient of pipe i j ; and Q s i is the source term of node i. Q i j is the flow rate of pipe i j .
The equivalent conductance coefficient of matrix pipe and fracture pipe i j can be expressed, respectively, as (the detailed derivation of these coefficient can be found in Appendix A and Appendix B):
K i j m = A o c 1 f c 2 K i m l i j μ ,
K i j f = A o f K i f l i j μ = l o f a 3 l i j μ ,
where A o c 1 f c 2 is the area of the face o c 1 f c 2 ; A o f is the area of the face o f ; and l i j is the length of pipe i j . Similarly, the effective diffusion coefficient can be calculated as:
D i j m = ϕ i m A o c 1 f c 2 D i m l i j ,
D i j f = ϕ i f A o f D i f l i j = ϕ i f l o f D i f a l i j .

2.3. Calculation of Chemical Reaction

In the current chemical precipitation process, the total reaction rate r is controlled by the concentration of both A ( a q ) and B ( a q ) , which are two unknowns at the governing equation. In order to simplify the algorithm, a semi-explicit solution is used in this method to solve the total reaction rate. For the irreversible reaction A ( a q ) + B ( a q ) C ( s ) , the reaction rate r can also be defined as proposed by Poskozim [80]:
r = d C c d t = d C A d t = d C B d t .
The average reaction rate is calculated as:
r · Δ t = ( r ( t ) + r ( t + Δ t ) 2 ) · Δ t ,
where Δ t is the time step ( s ) . It is assumed that the average reaction rate can be regarded as the reaction rate at the next time step when the time step is little enough. Combined with Equations (18) and (19), the reaction rate at the next time step is expressed:
r ( t + Δ t ) = A k r ( 1 K e q C A a q ( t + Δ t ) C B a q ( t + Δ t ) ) = A k r ( 1 K e q ( C A a q ( t ) r ) ( C B a q ( t ) r ) ) .
Based on the Newton–Raphson method, the accurate total reaction rate r can be obtained.

3. Validation

In this section, we first present the validation for the UPM-based chemical reaction module in porous medium. The simulation results of the homogeneous chemical reaction D ( a q ) + M ( a q ) P ( a q ) are contrasted with analytical solutions of reaction in a free fluid. Moreover, additional models in the above UPM-based mix model (fluid flow problem and hydraulic-transport coupling problem) have been validated in [78,79]. Due to the quasi-implicit method used in our model, a convergence test is conducted to consider the influence of time step on the final results. The effects of operational factors (atmospheric pressure and reactive temperature), materials factors (reactant concentration), and geometry factors (fracture aperture and fracture dip) are discussed in a sensitivity analysis, thereby analyzing the influence of precipitation on the whole reaction.

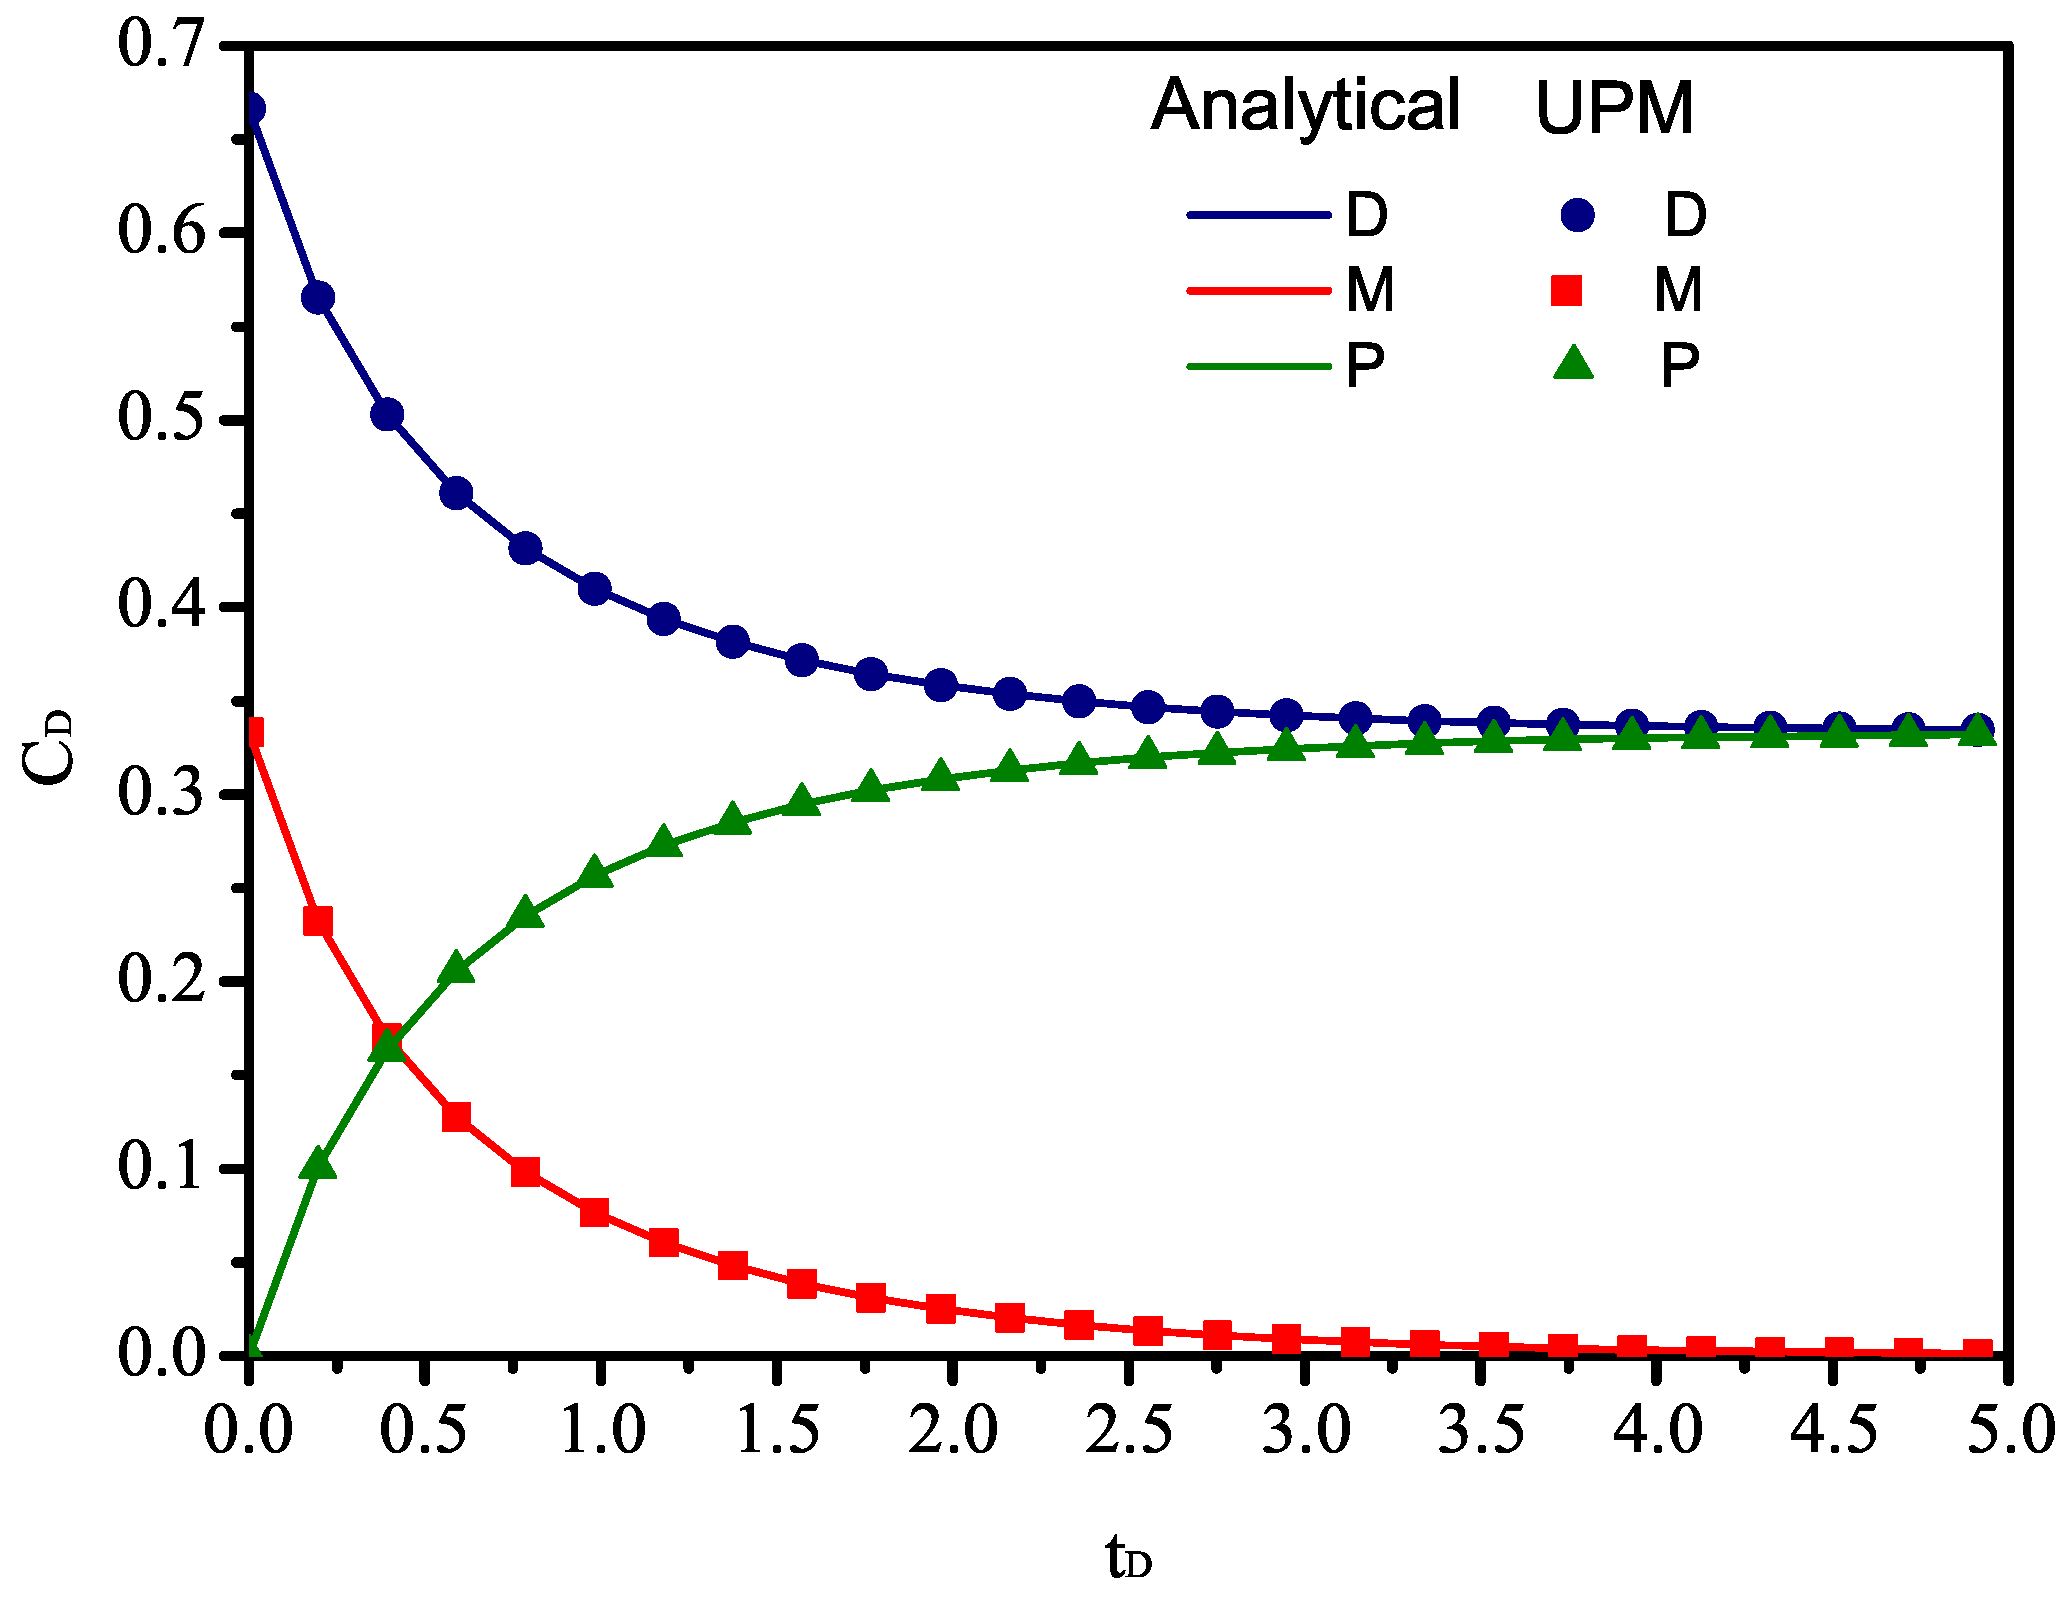
3.1. Homogeneous Reaction in Porous Media

For the homogeneous reaction D ( a q ) + M ( a q ) P ( a q ) , the total reaction rate can be written as [72]:
r = κ C D C M ,
where κ is the homogeneous reaction rate constant (m 3 mol 1 s 1 ). The analytical solutions for the concentration of species D and M in a batch system given by [81] are:
C D = Δ C D M · C D 0 C M 0 · e κ t Δ C D M [ C D 0 C M 0 · e κ t Δ C D M 1 ] ,
C E = Δ C D M [ C D 0 C M 0 · e κ t Δ C D M 1 ] ,
where C D 0 and C M 0 represents the initial concentration of reactant D and M, respectively; Δ C D M is a constant and defined as Δ C D M = C D 0 C M 0 .
In this comparison model, C D 0 is 3.65 × 10 12 mol/m 3 , and C M 0 is 1.78 × 10 12 mol/m 3 . Two dimensionless parameters (the dimensionless time t D = κ t Δ C D M and the dimensionless concentration C D = C C D 0 + C M 0 ) are defined. Figure 1 compares the variations in concentrations of reactant and product obtained by analytical results and simulation results. It shows that the aforementioned method has a high degree of accuracy in predicting the change in concentration.

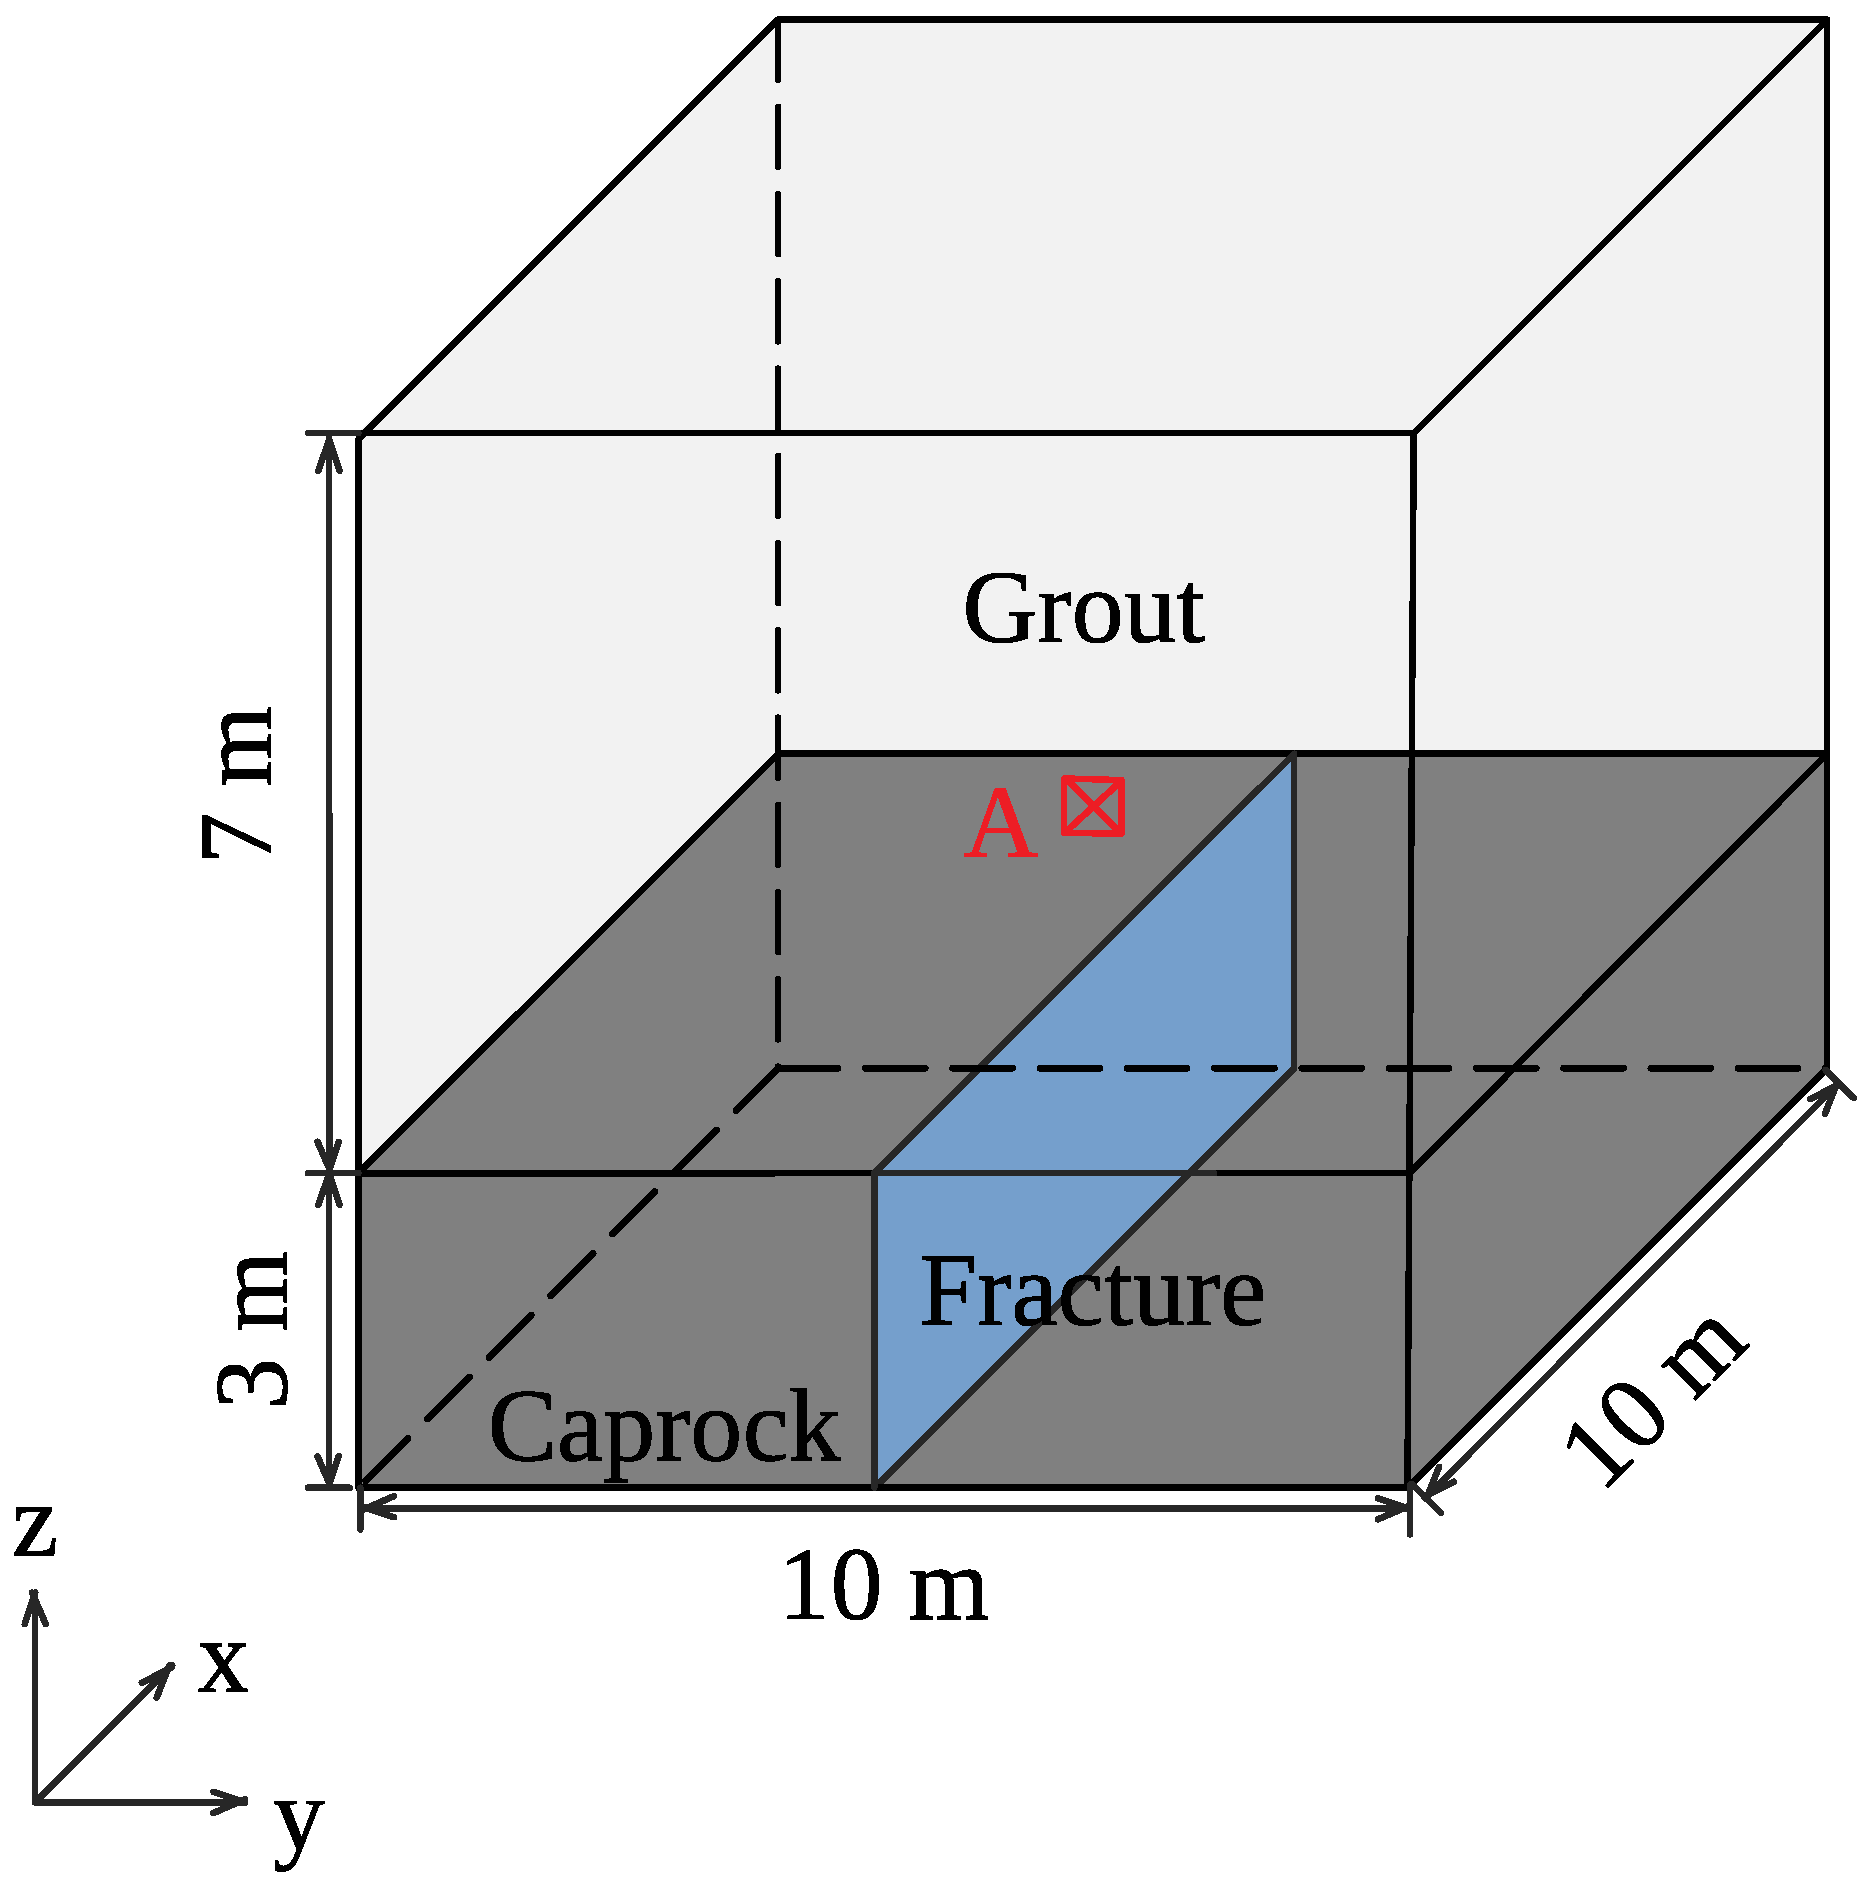
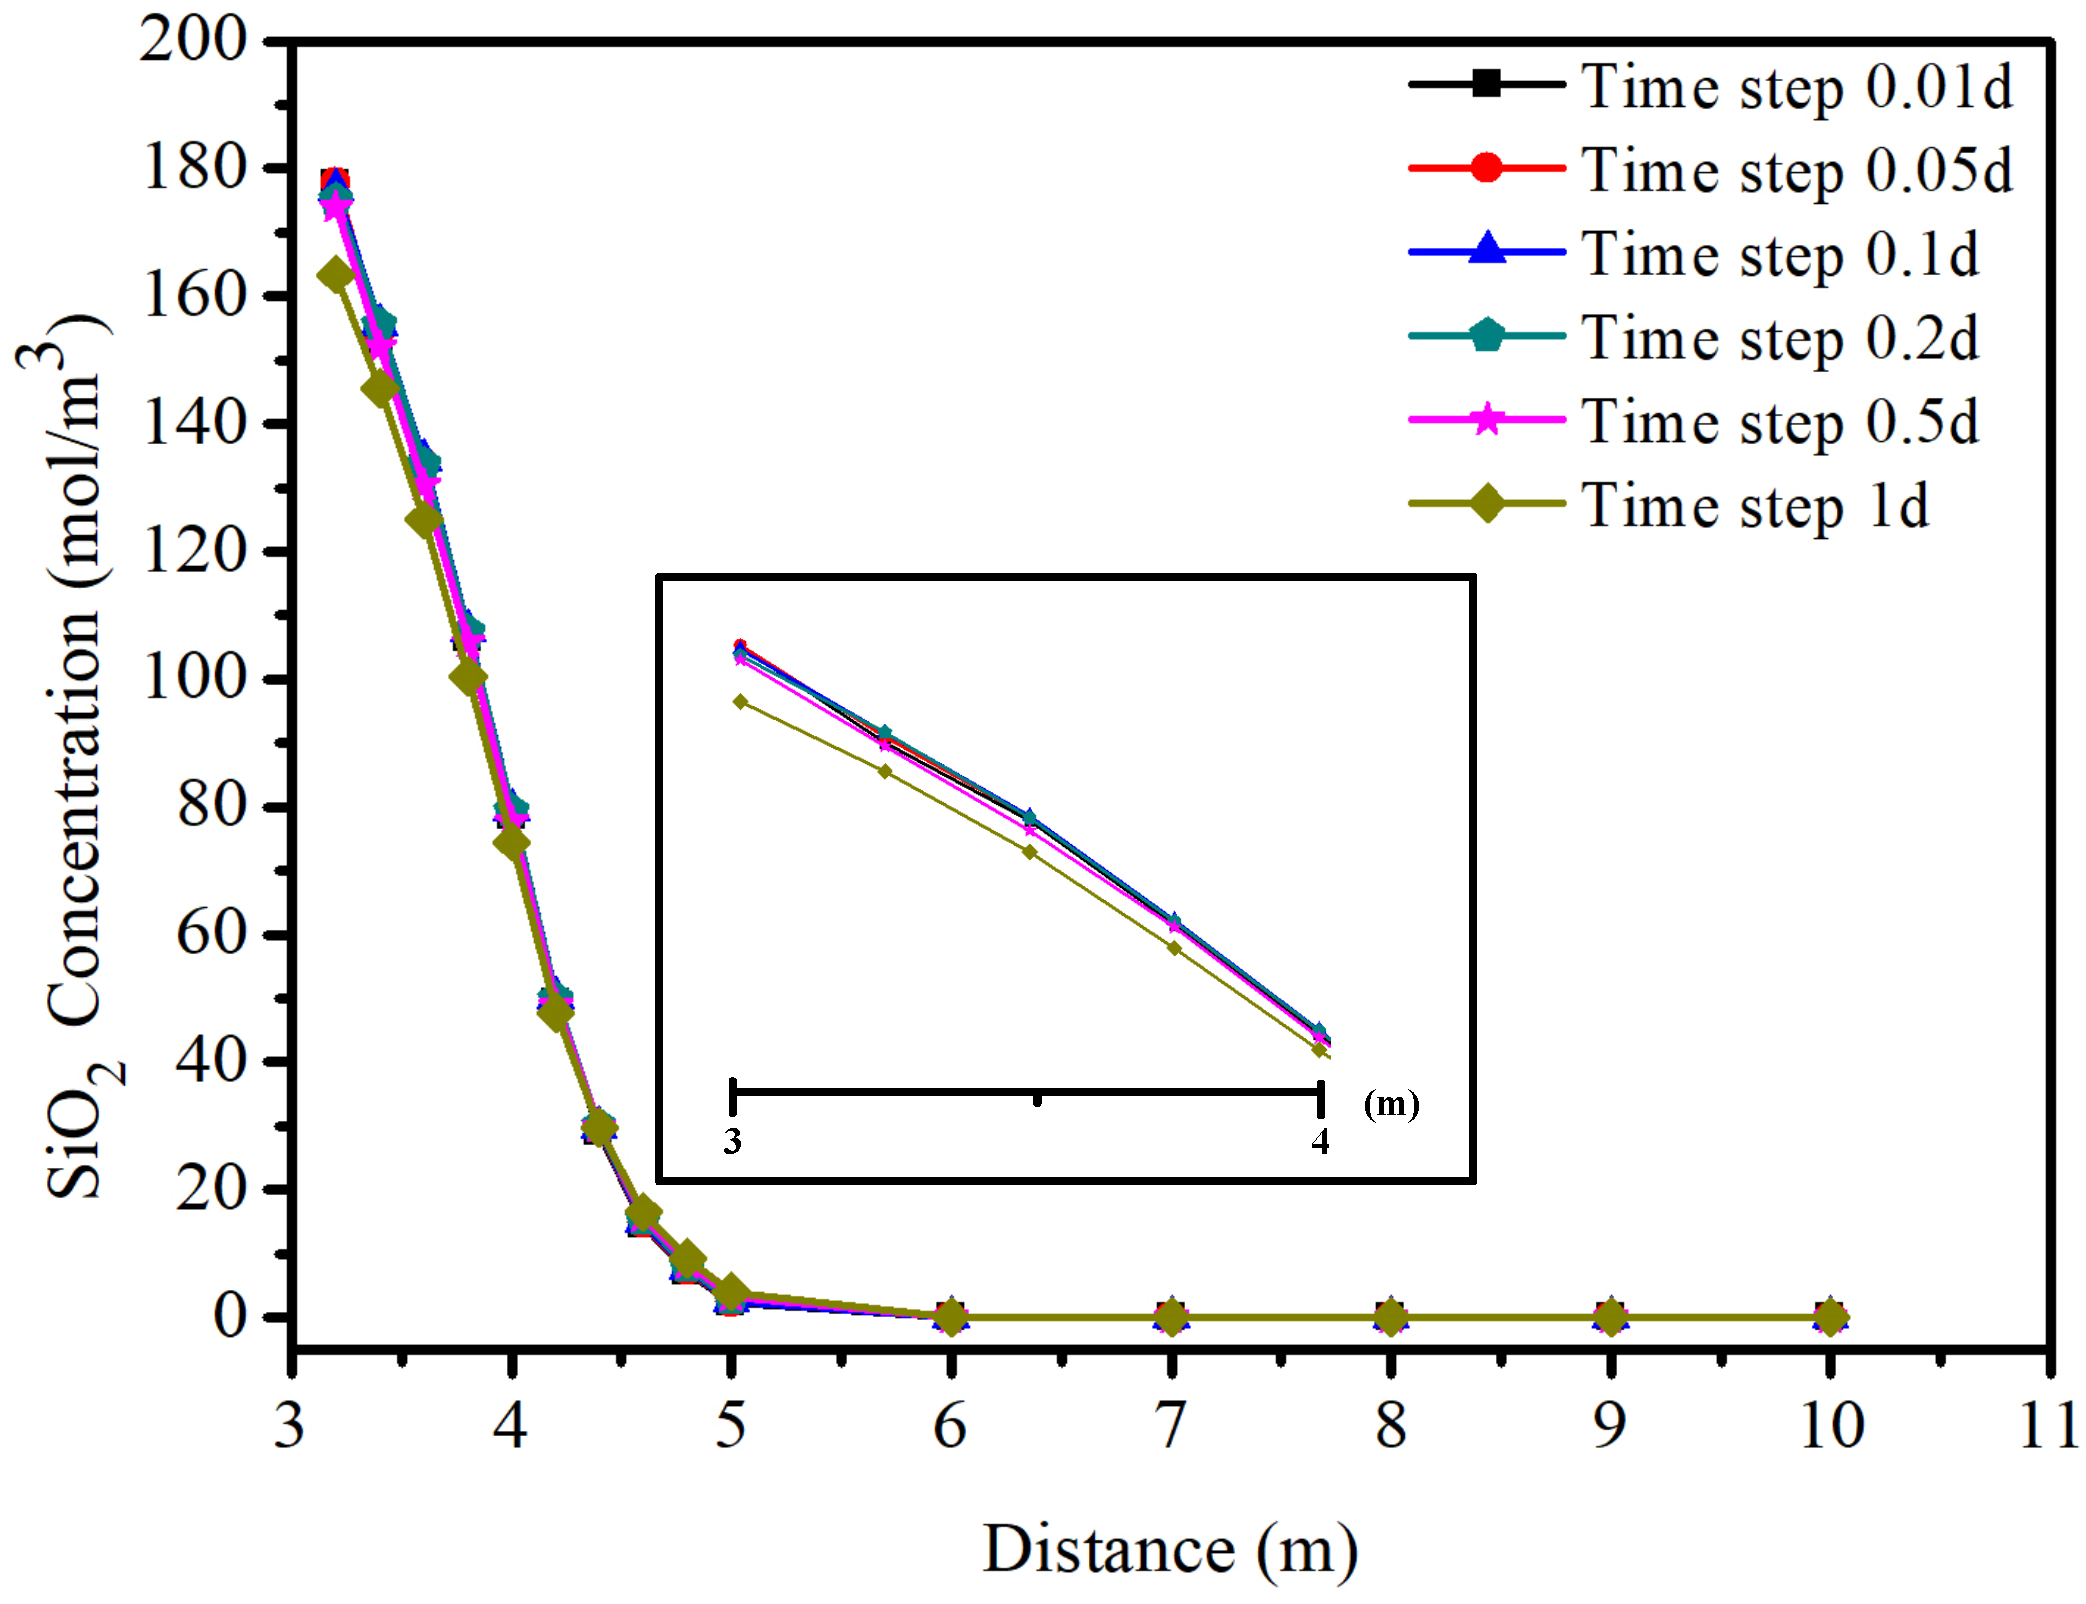
3.2. Precipitation Reaction in Fractured Porous Media
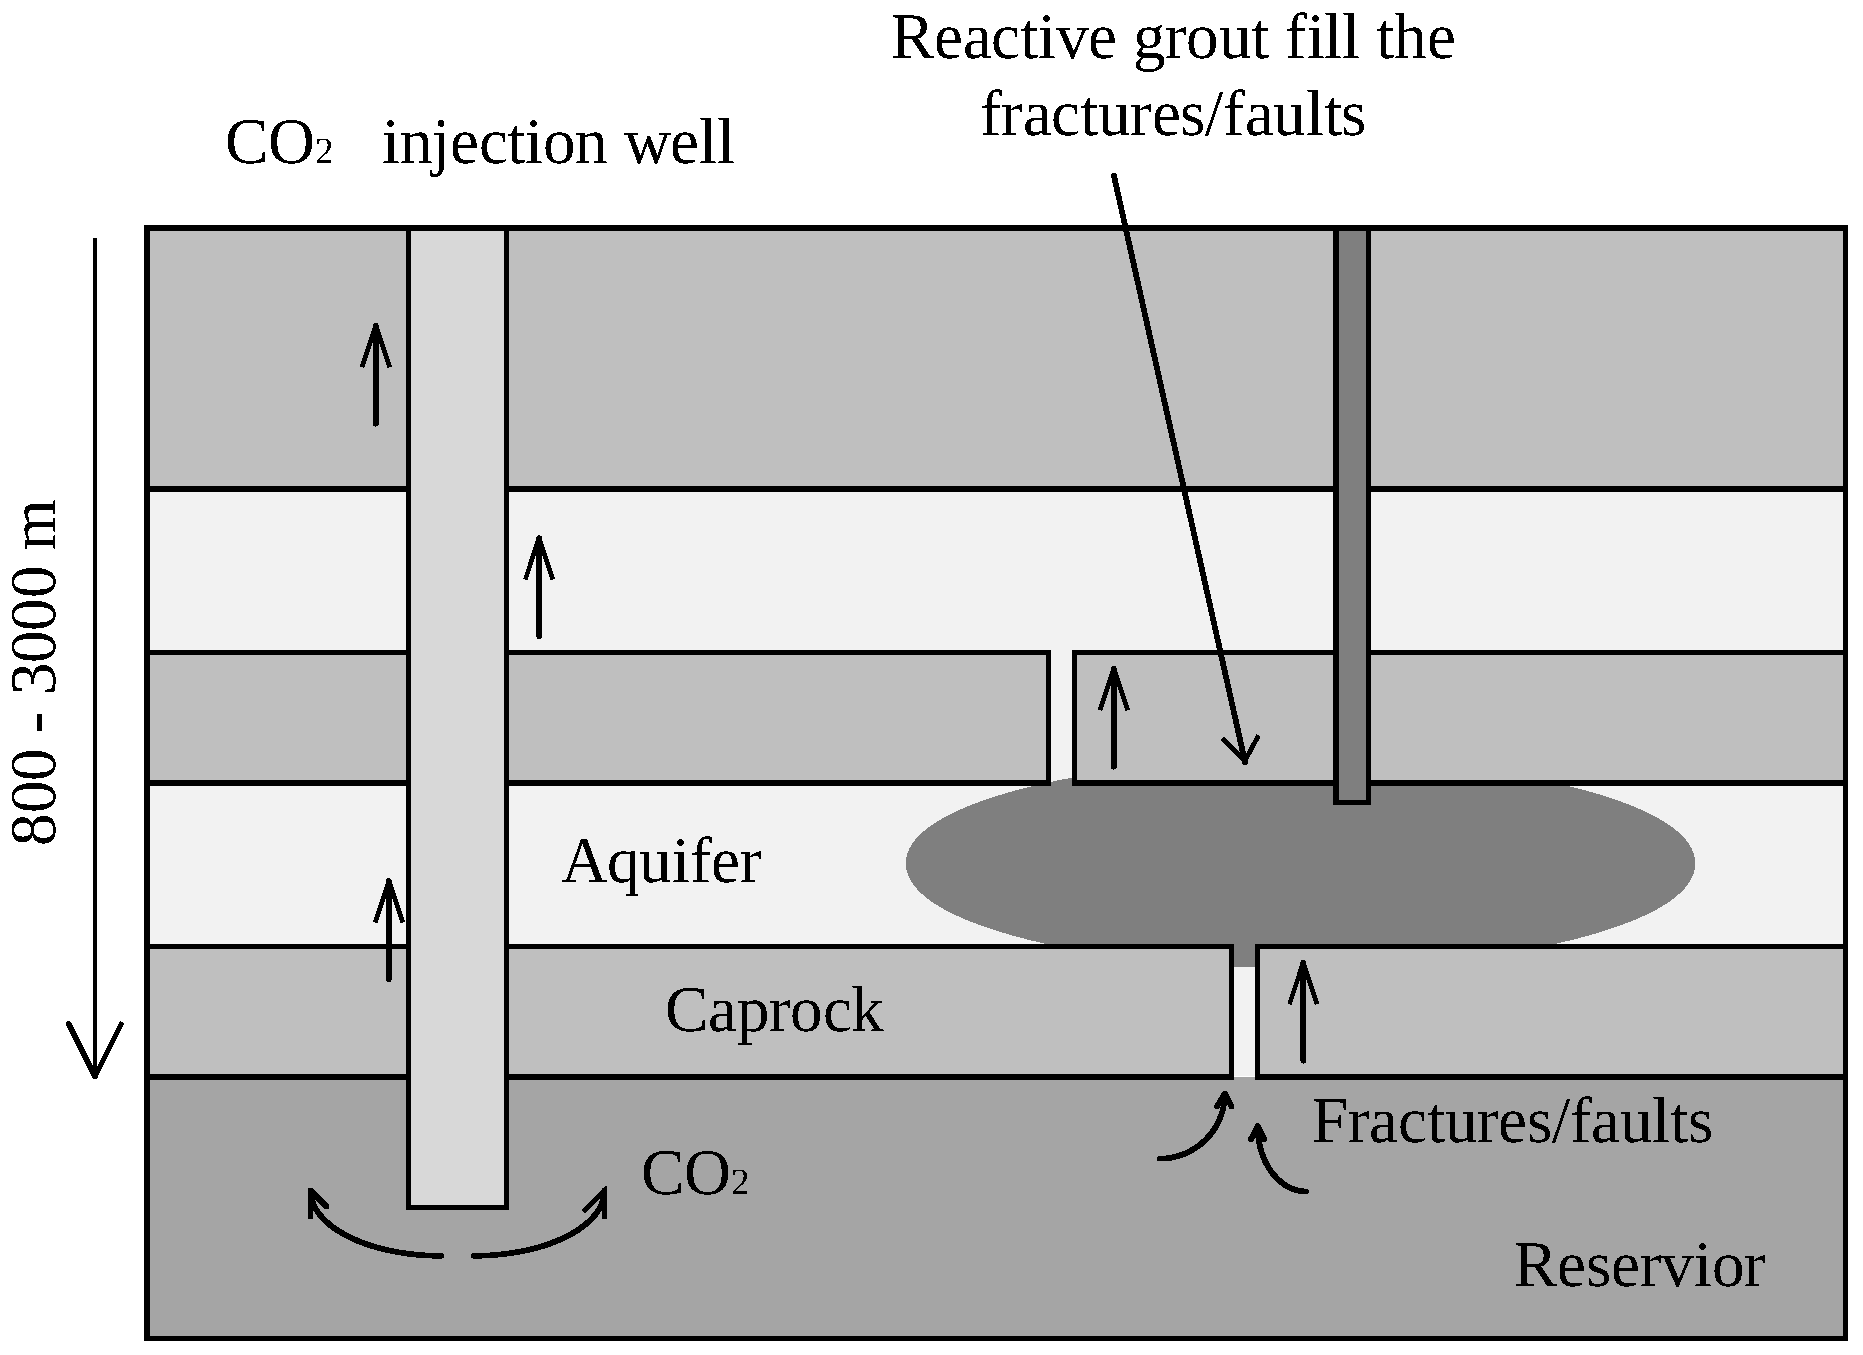
The existence of a high permeable fracture embedded into the caprock may lead to the significantly leakage of CO 2 . The injection of appropriate reactive grout into the aquifer overlying the caprock filling with the pores around the fracture is regarded as an effective method to remedy the CO 2 leakage, as shown in Figure 2. In order to simulate this process, a 3 m thick caprock, with a single fracture throughout it, in a cube with dimensions of (10 m × 10 m × 10 m) is modeled, as shown in Figure 3. Initially, the pores above the caprock are full of the reactive grout in advance of the occurrence of CO 2 leakage. The concentration of reactive chemical species Si in the solution is 2720 mol/m 3 [73]. The whole domain is set with a constant temperature (25 C). The atmospheric pressure on the top boundary is 10 bar. CO 2 leakage at a constant flow velocity ( 1 . 25 5 m/s) and concentration (316 mol/m 3 ) at the bottom boundary [2]. The concentration of CO 2 (g) is redefined as the concentration of CO 2 (aq) in groundwater. Other parameters employed in this simulation are listed in Table 1. In Chen et al. [69], it is pointed that, for the precipitation reaction, the reactants A(aq) is a kind of carbonate or bicarbonate, and B(aq) is a kind of toxic cation, which is the same condition as expressed in this paper, so the value of K c is defined from Chen et al. [69].
Since our method is quasi-implicit to calculate the total reaction rate through the concentration of reactant at the last time step, six time steps are selected to conduct the sensitivity analysis, as shown in Figure 4. The concentration of SiO 2 is chosen from the central line of the domain along the z-axis above the caprock since the model is symmetrical about the fracture plane. The total simulation time is 10 days. Figure 4 shows that the final results are convergent with the reduction of time step, and they are not sensitive to the selection of time step when the time step is less than 0.5 days.
Sensitivity analyses are further carried out with respect to the atmospheric pressure, formation temperature, the initial reactant concentration in the grout (Si), and fracture aperture. A different atmospheric pressure (P CO 2 ) and a different formation temperature (T) will influence the solubilities of CO 2 (CO 2 (g) → CO 2 (aq)). The solubilities at each P and T are calculated from the model presented by Duan and Sun [82] and are listed in Table 2. Figure 5a–c shows the variation of precipitation concentration (SiO 2 ) and formation porosity with time at three different atmospheric pressures (10 bar, 50 bar, and 74 bar) and temperatures (25 C, 70 C, and 90 C ) in the observation Point A, as shown in Figure 3 (which is in the middle line of the domain and is 1.5 m higher than the caprock). It is observed that the quicker growth of SiO 2 concentration will cause the faster drop of porosity of formation. This is because the growth of precipitation will plug the voids of the rock. At the low atmospheric pressure, the drop of the porosity is slower than that of high pressure, since the solubilities of CO 2 at high pressure are larger. Although the reaction rate constant increases with temperature, the total variation rate decreases with the increase of temperature. At P CO 2 of 10 bar and T of 25 C, the concentration of SiO 2 and porosity vary gradually with time, while they keep almost unchanged when Time is less than 200 d at T of 70 and 90 C. At P CO 2 of 50 bar and 74 bar, the porosity drops quickly and tends to keep steady after 150 d.
Variation of porosity over time at Point A under different initial grout reactant concentration (Si) is shown in Figure 6a. When the Si concentration in the grout is 3500 mol/m 3 , the porosity is a constant as the initial porosity. The rapid drop is observed at the Si concentration of 2000 mol/m 3 , while the porosity reaches the minimum value at the Si concentration of 2700 mol/m 3 . This is because when the concentration of reactant Si is high, once CO 2 flows into the aquifer full of grout, the reaction will happen quickly, and the volume fraction of precipitation product is large enough to clog the void to stop CO 2 further reveal into the atmosphere, as shown in Figure 6b–d. The concentration of CO 2 is zero when the height is more than 4 m. Please change the unit not to be italic if unnecessary. at the Si concentration of 3500 mol/m 3 and the leakage distance of CO 2 is unchanged with time. For the low concentration of reactant solution, the pores of the formation cannot be clogged completely, and the CO 2 continues to release. But, the flow rate of CO 2 is large with the low Si concentration.
Figure 7 shows the variation of porosity at Point A considering different fracture aperture. The porosity decreases quickly with the increase of the fracture aperture. However, the rate of descent is almost same for the fracture aperture of 0.01 m and 0.1 m. This can be explained that it takes a longer time for CO 2 leakage into the aquifer when the fracture aperture is small (see Figure 7b,c). However, once the CO 2 has filled with the fracture and releases into the aquifer, the diffusion rate is almost the same (see Figure 7d). The fracture aperture can influence the CO 2 leakage effect at the initial stage. The effect of fracture dip on the CO 2 leakage and plugging effect is shown in Figure 8a,b. The dip of the fracture will influence the distribution of CO 2 in the aquifer. So, the configuration of the grout injection hole needs to be rearranged.

4. Simulation of CO 2 Sequestration in Rock Masses with Fracture Networks

Previous versions of fracture networks in caprock are generated in this section to simulate the CO 2 sequestration process in the reservoir. The simulation model is still a cube, and the size of model is identical to Figure 3; however, there are four large fractures connected with each other are embedded in the caprock as the main path for CO 2 leakage, as shown in Figure 9. The aquifer above the caprock is formed of sandstone with initial porosity of 0.3 and critical porosity of 0.2735 [73]. The aperture of each fracture is 0.001 m, and the intact caprock is regarded to be impermeable. The grout is silicate solution with Si concentration chosen as 3000 mol/m 3 and 3500 mol/m 3 , respectively. CO 2 begins to release from the bottom of the model at a constant flow velocity ( 1 . 25 5 m/s). A constant pressure and a constant temperature is set along the outlet boundary. The atmospheric pressure is 50 bar, and the formation temperature is 70 C. The total simulation time is 500 days. Other parameters are same as listed in Table 1. The fractures are discretized as triangle elements, and the rock matrix is discretized as tetrahedron elements based on an advanced adaptive mesh method [83].
Figure 10a–c shows the distribution of CO 2 concentration, Si concentration, and porosity at different times with the Si concentration in grout of 3000 mol/m 3 . When the fracture is non-penetrative in the caprock, CO 2 cannot leak into the aquifer through such a kind of crack. However, if they connected with other fractures that cut through the whole caprock, it still influences the final leakage effect. The distribution of Si concentration is adverse to that of CO 2 , and the reduction of Si concentration is consistent with the drop of porosity. The region of increased CO 2 concentration and reduced Si concentration and porosity spread simultaneously in the aquifer with time. At the early stage (the simulation time is five days), the fractures are filled with CO 2 since the permeability of fractures is relatively high, which provide channels for CO 2 release with high velocity. Furthermore, the amount of CO 2 emission from two respective penetrative fractures is almost same. The distribution of CO 2 is mainly along the fracture walls, and then CO 2 releases upward. The leakage region is small and surrounds the fracture walls. With the increase of time, CO 2 continues to diffuse into the aquifer along the fractures because the voids of the aquifer are not clogged completely and the porosity does not drop to the critical value (see Figure 10c). The leakage region in x-direction is larger than that in the y-direction. This is because the amount of CO 2 leakage along the oblique fracture is influenced by the fracture that is parallel to y-axis. This can be explained by Figure 11, in which there is an obvious inflection point where CO 2 concentration starts to increase quickly at a certain time at different location. It can seen from Figure 12 that, although CO 2 continues to leak, the concentration stops to react at a low concentration. Thus, once the Si concentration and porosity stop to reduce, it will keep the same condition all the time. Such phenomena are caused by the reaction threshold, since the concentration of reactant is too low, and the reaction on the surface of fluid–solid cannot happen.
Figure 13 shows the variation of CO 2 concentration, Si concentration, and porosity during simulation process with the Si concentration in grout of 3500 mol/m 3 . It is obvious that, at the early stage, the amount of CO 2 leakage with higher Si concentration is less than that of lower Si concentration as compared with Figure 13a. As shown in Figure 13c, when CO 2 is invaded into the a region above the fracture, of which the porosity have reduced to the critical porosity, CO 2 will be successfully trapped there and stop further invasion. Thus, injecting reactive grout into the aquifer before CO 2 leakage will work well to stop CO 2 migration upward into the atmosphere through the fractures. And choosing a reasonable concentration of reactive grout according to the solubilities of CO 2 (g) is necessary. Through the simulation method, the sequestration effect and CO 2 release area can be obtained to guide the arrangement of borehole of grouting.

5. Conclusions

The Unified Pipe-Network Method is introduced to simulate CO 2 geological sequestration in a reservoir with caprock above it that contains fractures as channels for CO 2 leakage in a 3D domain. In this model, the grout with reactive chemical solution are full of the permeable porous media located just above the caprock and can produce precipitation by a chemical reaction between the solution and dissolved CO 2 . This method combines the Darcy-scale model and pore-scale model and couples the fluid flow, mass transport, and chemical reaction. The chemical module is verified by comparing with analytical results, and it is proved that the results obtained from UPM are much more accurate than other numerical results. Furthermore, due to the semi-implicit method combined in UPM, the proposed model is confirmed by performing convergence tests in respect of different time steps. The distribution of CO 2 leakage, the concentration of reactive solution Si, the concentration of precipitation, and the porosity of the formations after chemical reactive can be obtained by numerical simulation.
A sensitivity analysis that CO 2 can release from one fracture is conducted to analyze the influence of atmospheric pressure, formation temperature, the initial reactant concentration, fracture aperture, and fracture dip on CO 2 sequestration. An increase in atmospheric pressure P C O 2 is contributed to the chemical reaction and accelerate the reduce of porosity. At 10, 50, and 74 bar, the drop rate of porosity will decrease with the increase of temperature. Due to the mineral growth threshold, the chemical reaction cannot continue when the concentration of reactive solution is less. Increasing the reactant (Si) concentration is an effective way to improve the sequestration effect, which can effectively reduce the leakage rate of CO 2 . When the Si concentration in the reactive grout is high enough, the precipitation formed in the formation can plug the pores completely and stop CO 2 being further released near the fracture. The fracture aperture can influence the distribution of CO 2 at the early stage, and the fracture dip will influence the final CO 2 release area.
A case study is carried out by establishing multi-connected fractures in the 3D caprock. At the initial stage, the connected fractures have less influence on CO 2 leakage. This 3D model can demonstrate the influence of fractures on the CO 2 emission more clearly than 2D model and help to understand the direction of CO 2 release and arrange the injection hole.

Author Contributions

Author Contributions: Conceptualization, X.Y. and Z.S.; Methodology, Z.S., X.Y. and Y.Z.; Software, X.Y. and Z.S.; Formal Analysis, Y.Z. and Z.S.; Investigation, X.Y.; Resources, S.L.; Data Curation, W.Y.; Writing—Original Draft Preparation, X.Y. and Y.Z.; Writing—Review & Editing Y.Z.; Visualization, X.Y.; Supervision, S.L.; Project Administration, S.L.; Funding Acquisition, S.L. All authors have read and agreed to the published version of the manuscript.

Funding

This research was funded by National Key Research and Development Program of China (Grant No.2017YFC0603001) and Key projects of the national natural science foundation of China (517340009).

Acknowledgments

This research is financially supported by National Key Research and Development Program of China (Grant No. 2017YFC0603001) and Key projects of the national natural science foundation of China (517340009).

Conflicts of Interest

The authors declare no conflict of interest.

Abbreviations

The following abbreviations are used in this manuscript:
UPMUnified Pipe network Method

Appendix A. The Derivation of the Equivalent Coefficient of 3D Matrix Pipe

In the 3D UPM the rock matrix is reconstructed by tetrahedral element and the fracture is reconstructed by triangle element as shown in Figure 1 of Paper [78]. The pressures and concentrations within each tetrahedral element can be approximated by using the linear shape function as that in FEM:
P ( x , y , z ) = N k p k ( k = i , j , m , n )
C ( x , y , z ) = N k C k ( k = i , j , m , n )
where P k and C k are pressures and grout concentrations, respectively, and N k is the linear shape function as in the FEM:
N k = 1 6 V i j m n ( a k + b k x + c k y + d k z ) , ( k = i , j , m , n )
where V i j m n is the volume of the tetrahedron, and the coefficients b k , c k , and d k , are dependent on the coordinates of the three nodes in each triangle element. These coefficients are represented as
b i = ( y n y j ) ( z m z j ) ( y m y j ) ( z n z j ) b j = ( y m y i ) ( z n z m ) ( y n y m ) ( z m z i ) b m = ( y j y n ) ( z i z m ) ( y i y m ) ( z j z n ) b n = ( y i y m ) ( z j z i ) ( y j y i ) ( z i z m ) c i = ( z n z j ) ( x m x j ) ( z m z j ) ( x n x j ) c j = ( z m z i ) ( x n x m ) ( z n z m ) ( x m x i ) c m = ( z j z n ) ( x i x m ) ( z i z m ) ( x j x n ) c n = ( z i z m ) ( x j x i ) ( z j z i ) ( x i x m ) d i = ( x n x j ) ( y m y j ) ( x m x j ) ( y n y j ) d j = ( x m x i ) ( y n y m ) ( x n x m ) ( y m y i ) d m = ( x j x n ) ( y i y m ) ( x i x m ) ( y j y n ) d n = ( x i x m ) ( y j y i ) ( x j x i ) ( y i y m )
The fluid flow Q i j m and mass of the solutions transported in pipe i j are equal to the flow and mass through the area o c 1 f c 2 and can be calculated as
Q i j m = Q o c 1 f c 2 m = A o c 1 f c 2 n o c 1 f c 2 · u d A
m ˙ i j m = m ˙ o c 1 f c 2 m = A o c 1 f c 2 n o c 1 f c 2 ( u · C + ϕ m D i m · C ) d A
where A o c 1 f c 2 is the area of the face o c 1 f c 2 and n o c 1 f c 2 is the unit normal vector, which can be expressed as,
n of = 1 l i j ( ( x j x i ) x + ( y j y i ) y + ( z j z i ) z )
Therefore, the equivalent conductance coefficient and equivalent diffusion coefficient for 3D matrix pipe is derived as:
K i j m = A o c 1 f c 2 K i m l i j μ
D i j m = ϕ i m A o c 1 f c 2 D i m l i j

Appendix B. The Derivation of the Equivalent Coefficient of 3D Fracture Pipe

The linear shape function of 3D pipe network N k with b k , c k is expressed as
N k = 1 2 A i j m ( a k + b k x + c k y ) , ( k = i , j , m )
b i = y j y m b j = y m y i b m = y i y j c i = x m x j c j = x i x m c m = x j x i
Therefore, the equivalent conductance coefficient and equivalent diffusion coefficient for 3D fracture pipe is derived as:
K i j f = A o f K i f l i j μ = l o f a 3 l i j μ
D i j f = ϕ i f A o f D i f l i j = ϕ i f l o f D i f a l i j

References

  1. Wasch, L.J.; Wollenweber, J.; Neele, F.; Fleury, M. Mitigating CO2 leakage by immobilizing CO2 into solid reaction products. Energy Procedia 2017, 114, 4214–4226. [Google Scholar] [CrossRef]
  2. Dávila, G.; Cama, J.; Gali, S.; Luquot, L.; Soler, J.M. Efficiency of magnesium hydroxide as engineering seal in the geological sequestration of CO2. Int. J. Greenh. Gas Control 2016, 48, 171–185. [Google Scholar] [CrossRef] [Green Version]
  3. Dalkhaa, C.; Shevalier, M.; Nightingale, M.; Mayer, B. 2-d reactive transport modeling of the fate of CO2 injected into a saline aquifer in the wabamun lake area, alberta, canada. Appl. Geochem. 2013, 38, 10–23. [Google Scholar] [CrossRef]
  4. Sahimi, M. Flow and Transport in Porous Media and Fractured Rock: From Classical Methods to Modern Approaches; John Wiley & Sons: Hoboken, NJ, USA, 2011. [Google Scholar]
  5. Seifert, D.; Engesgaard, P. Sand box experiments with bioclogging of porous media: Hydraulic conductivity reductions. J. Contam. Hydrol. 2012, 136, 1–9. [Google Scholar] [CrossRef]
  6. Kutchko, B.G.; Strazisar, B.R.; Dzombak, D.A.; Lowry, G.V.; Thaulow, N. Degradation of well cement by CO2 under geologic sequestration conditions. Environ. Sci. Technol. 2007, 41, 4787–4792. [Google Scholar] [CrossRef]
  7. Dewaele, P.; Reardon, E.; Dayal, R. Permeability and porosity changes associated with cement grout carbonation. Cement Concr. Res. 1991, 21, 441–454. [Google Scholar] [CrossRef]
  8. Scherer, G.W.; Celia, M.A.; Prevost, J.-H.; Bachu, S.; Bruant, R.; Duguid, A.; Fuller, R.; Gasda, S.E.; Radonjic, M.; Vichit-Vadakan, W. Leakage of CO2 through abandoned wells: Role of corrosion of cement. In Carbon Dioxide Capture for Storage in Deep Geologic Formations; Elsevier: Amsterdam, The Netherlands, 2015; pp. 827–848. [Google Scholar]
  9. Bachu, S.; Bennion, D.B. Experimental assessment of brine and/or CO2 leakage through well cements at reservoir conditions. Int. J. Greenh. Gas Control 2009, 3, 494–501. [Google Scholar] [CrossRef]
  10. Duguid, A. An estimate of the time to degrade the cement sheath in a well exposed to carbonated brine. Energy Procedia 2009, 1, 3181–3188. [Google Scholar] [CrossRef] [Green Version]
  11. Luquot, L.; Abdoulghafour, H.; Gouze, P. Hydro-dynamically controlled alteration of fractured portland cements flowed by CO2-rich brine. Int. J. Greenh. Gas Control 2013, 16, 167–179. [Google Scholar] [CrossRef]
  12. Babaei, M.; Sedighi, M. Impact of phase saturation on wormhole formation in rock matrix acidizing. Chem. Eng. Sci. 2018, 177, 39–52. [Google Scholar] [CrossRef] [Green Version]
  13. Ellery, A.J.; Simpson, M.J. An analytical method to solve a general class of nonlinear reactive transport models. Chem. Eng. J. 2011, 169, 313–318. [Google Scholar] [CrossRef] [Green Version]
  14. Kim, Y.; Wan, J.; Kneafsey, T.J.; Tokunaga, T.K. Dewetting of silica surfaces upon reactions with supercritical CO2 and brine: Pore-scale studies in micromodels. Environ. Sci. Technol. 2012, 46, 4228–4235. [Google Scholar] [CrossRef] [Green Version]
  15. Noiriel, C.; Gouze, P.; Bernard, D. Investigation of porosity and permeability effects from microstructure changes during limestone dissolution. Geophys. Res. Lett. 2004, 31. [Google Scholar] [CrossRef]
  16. Noiriel, C.; Bernard, D.; Gouze, P.; Thibault, X. Hydraulic properties and microgeometry evolution accompanying limestone dissolution by acidic water. Oil Gas Sci. Technol. 2005, 60, 177–192. [Google Scholar] [CrossRef]
  17. Li, L.; Peters, C.A.; Celia, M.A. Upscaling geochemical reaction rates using pore-scale network modeling. Adv. Water Resour. 2006, 29, 1351–1370. [Google Scholar] [CrossRef]
  18. De Anna, P.; Dentz, M.; Tartakovsky, A.; Le Borgne, T. The filamentary structure of mixing fronts and its control on reaction kinetics in porous media flows. Geophys. Res. Lett. 2014, 41, 4586–4593. [Google Scholar] [CrossRef] [Green Version]
  19. Algive, L.; Bekri, S.; Robin, M.; Vizika, O. Reactive transport: Experiments and pore network modelling. In Proceedings of the International Symposium of the Society of Core Analysts, Calgary, AB, Canada, 10–12 September 2007; pp. 10–12. [Google Scholar]
  20. Gramling, C.M.; Harvey, C.F.; Meigs, L.C. Reactive transport in porous media: A comparison of model prediction with laboratory visualization. Environ. Sci. Technol. 2002, 36, 2508–2514. [Google Scholar] [CrossRef]
  21. Raje, D.S.; Kapoor, V. Experimental study of bimolecular reaction kinetics in porous media. Environ. Sci. Technol. 2000, 34, 1234–1239. [Google Scholar] [CrossRef]
  22. Lagneau, V. Influence des Processus géochimiques sur le Transport en Milieu Poreux–Application au Colmatage de Barrières de Confinement Potentielles Dans un Stockage en Formation Géologique. Ph.D. Thesis, École des Mines de Paris, Paris, France, 2000. [Google Scholar]
  23. Emmanuel, S.; Berkowitz, B. Mixing-induced precipitation and porosity evolution in porous media. Adv. Water Resour. 2005, 28, 337–344. [Google Scholar] [CrossRef]
  24. ATartakovsky, M.; Redden, G.; Lichtner, P.C.; Scheibe, T.D.; Meakin, P. Mixing-induced precipitation: Experimental study and multiscale numerical analysis. Water Resour. Res. 2008, 44. [Google Scholar] [CrossRef]
  25. Chasset, C.; Jarsjö, J.; Erlström, M.; Cvetkovic, V.; Destouni, G. Scenario simulations of CO2 injection feasibility, plume migration and storage in a saline aquifer, Scania, Sweden. Int. J. Greenh. Gas Control 2011, 5, 1303–1318. [Google Scholar] [CrossRef]
  26. De Windt, L.; Pellegrini, D.; van Der Lee, J. Coupled modeling of cement/claystone interactions and radionuclide migration. J. Contam. Hydrol. 2004, 68, 165–182. [Google Scholar] [CrossRef]
  27. Gaucher, E.C.; Blanc, P. Cement/clay interactions—A review: Experiments, natural analogues, and modeling. Waste Manag. 2006, 26, 776–788. [Google Scholar] [CrossRef] [Green Version]
  28. Kosakowski, G.; Berner, U. The evolution of clay rock/cement interfaces in a cementitious repository for low-and intermediate level radioactive waste. Phys. Chem. Earth Parts A/B/C 2013, 64, 65–86. [Google Scholar] [CrossRef]
  29. Xu, T.; Apps, J.A.; Pruess, K.; Yamamoto, H. Numerical modeling of injection and mineral trapping of CO2 with H2S and SO2 in a sandstone formation. Chem. Geol. 2007, 242, 319–346. [Google Scholar] [CrossRef] [Green Version]
  30. Gaus, I. Role and impact of CO2–rock interactions during CO2 storage in sedimentary rocks. Int. J. Greenh. Gas Control 2010, 4, 73–89. [Google Scholar] [CrossRef]
  31. Gaus, I.; Audigane, P.; André, L.; Lions, J.; Jacquemet, N.; Durst, P.; Czernichowski-Lauriol, I.; Azaroual, M. Geochemical and solute transport modelling for CO2 storage, what to expect from it? Int. J. Greenh. Gas Control 2008, 2, 605–625. [Google Scholar] [CrossRef] [Green Version]
  32. Steefel, C.I.; Lasaga, A.C. A coupled model for transport of multiple chemical species and kinetic precipitation/dissolution reactions with application to reactive flow in single phase hydrothermal systems. Am. J. Sci. 1994, 294, 529–592. [Google Scholar] [CrossRef]
  33. Pollock, D.W. Semianalytical computation of path lines for finite-difference models. Groundwater 1988, 26, 743–750. [Google Scholar] [CrossRef]
  34. Voss, C.I. A finite-Element Simulation Model for Saturated-Unsaturated, Fluid-Density-Dependent Ground-Water Flow with Energy Transport or Chemically-Reactive Single-Species Solute Transport; US Geological Survey: Reston, VA, USA, 1984; Volume 84.
  35. Löhner, R.; Morgan, K.; Peraire, J.; Vahdati, M. Finite element flux-corrected transport (fem–fct) for the euler and navier–stokes equations. Int. J. Numer. Methods Fluids 1987, 7, 1093–1109. [Google Scholar] [CrossRef] [Green Version]
  36. Trefry, M.G.; Muffels, C. Feflow: A finite-element ground water flow and transport modeling tool. Groundwater 2007, 45, 525–528. [Google Scholar] [CrossRef]
  37. Diersch, H.-J.G. FEFLOW: Finite Element Modeling of Flow, Mass and Heat Transport in Porous and Fractured Media; Springer Science & Business Media: Berlin/Heidelberg, Germany, 2013. [Google Scholar]
  38. Geiger, S.; Roberts, S.; Matthäi, S.; Zoppou, C.; Burri, A. Combining finite element and finite volume methods for efficient multiphase flow simulations in highly heterogeneous and structurally complex geologic media. Geofluids 2004, 4, 284–299. [Google Scholar] [CrossRef]
  39. Saripalli, K.P.; Meyer, P.D.; Bacon, D.H.; Freedman, V.L. Changes in hydrologic properties of aquifer media due to chemical reactions: A review. Crit. Rev. Environ. Sci. Technol. 2001, 31, 311–349. [Google Scholar] [CrossRef]
  40. Luo, H.; Quintard, M.; Debenest, G.; Laouafa, F. Properties of a diffuse interface model based on a porous medium theory for solid–liquid dissolution problems. Comput. Geosci. 2012, 16, 913–932. [Google Scholar] [CrossRef]
  41. Kang, Q.; Chen, L.; Valocchi, A.J.; Viswanathan, H.S. Pore-scale study of dissolution-induced changes in permeability and porosity of porous media. J. Hydrol. 2014, 517, 1049–1055. [Google Scholar] [CrossRef]
  42. Kang, Q.; Lichtner, P.C.; Zhang, D. Lattice boltzmann pore-scale model for multicomponent reactive transport in porous media. J. Geophys. Res. Solid Earth 2006, 111. [Google Scholar] [CrossRef]
  43. Parmigiani, A.; Huber, C.; Bachmann, O.; Chopard, B. Pore-scale mass and reactant transport in multiphase porous media flows. J. Fluid Mech. 2011, 686, 40–76. [Google Scholar] [CrossRef] [Green Version]
  44. Maloszewski, P.; Zuber, A. Tracer experiments in fractured rocks: Matrix diffusion and the validity of models. Water Resour. Res. 1993, 29, 2723–2735. [Google Scholar] [CrossRef]
  45. Sudicky, E.; Frind, E. Contaminant transport in fractured porous media: Analytical solutions for a system of parallel fractures. Water Resour. Res. 1982, 18, 1634–1642. [Google Scholar] [CrossRef]
  46. Bigi, S.; Battaglia, M.; Alemanni, A.; Lombardi, S.; Campana, A.; Borisova, E.; Loizzo, M. CO2 flow through a fractured rock volume: Insights from field data, 3d fractures representation and fluid flow modeling. Int. J. Greenh. Gas Control 2013, 18, 183–199. [Google Scholar] [CrossRef]
  47. Lee, I.-H.; Ni, C.-F. Fracture-based modeling of complex flow and CO2 migration in three-dimensional fractured rocks. Comput. Geosci. 2015, 81, 64–77. [Google Scholar] [CrossRef]
  48. Pan, P.-Z.; Rutqvist, J.; Feng, X.-T.; Yan, F. Modeling of caprock discontinuous fracturing during CO2 injection into a deep brine aquifer. Int. J. Greenh. Gas Control 2013, 19, 559–575. [Google Scholar] [CrossRef]
  49. Ren, F.; Ma, G.; Wang, Y.; Fan, L. Pipe network model for unconfined seepage analysis in fractured rock masses. Int. J. Rock Mech. Min. Sci. 2016, 88, 183–196. [Google Scholar] [CrossRef]
  50. Ren, F.; Ma, G.; Wang, Y.; Fan, L.; Zhu, H. Two-phase flow pipe network method for simulation of CO2 sequestration in fractured saline aquifers. Int. J. Rock Mech. Min. Sci. 2017, 98, 39–53. [Google Scholar] [CrossRef]
  51. Ma, G.; Chen, Y.; Jin, Y.; Wang, H. Modelling temperature-influenced acidizing process in fractured carbonate rocks. Int. J. Rock Mech. Min. Sci. 2018, 105, 73–84. [Google Scholar] [CrossRef]
  52. Ma, G.; Li, T.; Wang, Y.; Chen, Y. A semi-continuum model for numerical simulations of mass transport in 3-d fractured rock masses. Rock Mech. Rock Eng. 2019, 1–20. [Google Scholar] [CrossRef]
  53. Zhang, Y.; Pichler, C.; Yuan, Y.; Zeiml, M.; Lackner, R. Micromechanics-based multifield framework for early-age concrete. Eng. Struct. 2013, 47, 16–24. [Google Scholar] [CrossRef]
  54. Pesavento, F.; Gawin, D.; Wyrzykowski, M.; Schrefler, B.; Simoni, L. Modeling alkali-silica reaction in non-isothermal, partially saturated cement based materials. Comput. Methods Appl. Mech. Eng. 2012, 225–228, 95–115. [Google Scholar] [CrossRef]
  55. Zhang, Y.; Zeiml, M.; Pichler, C.; Lackner, R. Model-based risk assessment of concrete spalling in tunnel linings under fire loading. Eng. Struct. 2014, 77, 207–215. [Google Scholar] [CrossRef]
  56. Gawin, D.; Pesavento, F.; Schrefler, B. Hygro-thermo-chemo-mechanical modelling of concrete at early ages and beyond. Part I: Hydration and hygro-thermal phenomena. Int. J. Numer. Methods Eng. 2006, 67, 299–331. [Google Scholar] [CrossRef]
  57. Zhang, Y.; Zeiml, M.; Maier, M.; Yuan, Y.; Lackner, R. Fast assessing spalling risk of tunnel linings under rabt fire: From a coupled thermo-hydro-chemo-mechanical model towards an estimation method. Eng. Struct. 2017, 142, 1–19. [Google Scholar] [CrossRef]
  58. Zhang, Y.; Lackner, R.; Zeiml, M.; Mang, H. Strong discontinuity embedded approach with standard SOS formulation: Element formulation, energy-based crack-tracking strategy, and validations. Comput. Methods Appl. Mech. Eng. 2015, 287, 335–366. [Google Scholar] [CrossRef]
  59. Wu, J.-Y. A unified phase-field theory for the mechanics of damage and quasi-brittle failure. J. Mech. Phys. Solids 2017, 103, 72–99. [Google Scholar] [CrossRef]
  60. Zhang, Y.; Zhuang, X. Cracking elements: A self-propagating strong discontinuity embedded approach for quasi-brittle fracture. Finite Elem. Anal. Des. 2018, 144, 84–100. [Google Scholar] [CrossRef]
  61. Wu, J.-Y. A geometrically regularized gradient-damage model with energetic equivalence. Comput. Methods Appl. Mech. Eng. 2018, 328, 612–637. [Google Scholar] [CrossRef]
  62. Ren, H.; Zhuang, X.; Cai, Y.; Rabczuk, T. Dual-horizon peridynamics. Int. J. Numer. Methods Eng. 2016, 108, 1451–1476. [Google Scholar] [CrossRef] [Green Version]
  63. Zhang, Y.; Zhuang, X. Cracking elements method for dynamic brittle fracture. Theor. Appl. Fract. Mech. 2019, 102, 1–9. [Google Scholar] [CrossRef]
  64. Rabczuk, T.; Ren, H. A peridynamics formulation for quasi-static fracture and contact in rock. Eng. Geol. 2017, 225, 42–48. [Google Scholar] [CrossRef]
  65. Zhang, Y.; Gao, Z.; Li, Y.; Zhuang, X. On the crack opening and energy dissipation in a continuum based disconnected crack model. Finite Elem. Anal. Des. 2019. [Google Scholar] [CrossRef]
  66. Nikolić, M.; Do, X.N.; Ibrahimbegovic, A.; Nikolić, Ž. Crack propagation in dynamics by embedded strong discontinuity approach: Enhanced solid versus discrete lattice model. Comput. Methods Appl. Mech. Eng. 2018, 340, 480–499. [Google Scholar] [CrossRef] [Green Version]
  67. Haeberlein, F. Time Space Domain Decomposition Methods for Reactive Transport-Application to CO2 Geological Storage. 2011. Available online: https://tel.archives-ouvertes.fr/tel-00634507/file/transparents.pdf (accessed on 20 October 2019).
  68. Zimmerman, R.W.; Bodvarsson, G.S. Hydraulic conductivity of rock fractures. Transp. Porous Media 1996, 23, 1–30. [Google Scholar] [CrossRef] [Green Version]
  69. Chen, L.; Kang, Q.; Carey, B.; Tao, W.-Q. Pore-scale study of diffusion–reaction processes involving dissolution and precipitation using the lattice boltzmann method. Int. J. Heat Mass Transf. 2014, 75, 483–496. [Google Scholar] [CrossRef]
  70. Lasaga, A.C. Chemical kinetics of water-rock interactions. J. Geophys. Res. Solid Earth 1984, 89, 4009–4025. [Google Scholar] [CrossRef]
  71. Xu, T.; Apps, J.A.; Pruess, K. Mineral sequestration of carbon dioxide in a sandstone–shale system. Chem. Geol. 2005, 217, 295–318. [Google Scholar] [CrossRef]
  72. Liu, M.; Mostaghimi, P. Numerical simulation of fluid-fluid-solid reactions in porous media. Int. J. Heat Mass Transf. 2018, 120, 194–201. [Google Scholar] [CrossRef]
  73. Ito, T.; Xu, T.; Tanaka, H.; Taniuchi, Y.; Okamoto, A. Possibility to remedy CO2 leakage from geological reservoir using CO2 reactive grout. Int. J. Greenh. Gas Control 2014, 20, 310–323. [Google Scholar] [CrossRef]
  74. Verma, A.; Pruess, K. Thermohydrological conditions and silica redistribution near high-level nuclear wastes emplaced in saturated geological formations. J. Geophys. Res. Solid Earth 1988, 93, 1159–1173. [Google Scholar] [CrossRef] [Green Version]
  75. Lichtner, P.C. The quasi-stationary state approximation to coupled mass transport and fluid-rock interaction in a porous medium. Geochim. Cosmochim. Acta 1988, 52, 143–165. [Google Scholar] [CrossRef]
  76. Ren, F.; Ma, G.; Fu, G.; Zhang, K. Investigation of the permeability anisotropy of 2d fractured rock masses. Eng. Geol. 2015, 196, 171–182. [Google Scholar] [CrossRef]
  77. Ren, F.; Ma, G.; Wang, Y.; Li, T.; Zhu, H. Unified pipe network method for simulation of water flow in fractured porous rock. J. Hydrol. 2017, 547, 80–96. [Google Scholar] [CrossRef]
  78. Sun, Z.; Yan, X.; Han, W.; Ma, G.; Zhang, Y. Simulating the filtration effects of cement-grout in fractured porous media with the 3d unified pipe-network method. Processes 2019, 7, 46. [Google Scholar] [CrossRef] [Green Version]
  79. Sun, Z.; Yan, X.; Liu, R.; Xu, Z.; Li, S.; Zhang, Y. Transient analysis of grout penetration with time-dependent viscosity inside 3d fractured rock mass by unified pipe-network method. Water 2018, 10, 1122. [Google Scholar] [CrossRef] [Green Version]
  80. Poskozim, P.S. General chemistry, principles and modern applications, (petrucci, ralph h.; harwood, william s.) and general chemistry, (whitten, kenneth w.; davis, raymond e.; peck, m. larry). J. Chem. Educ. 1997. [Google Scholar] [CrossRef] [Green Version]
  81. Alhashmi, Z.; Blunt, M.; Bijeljic, B. Predictions of dynamic changes in reaction rates as a consequence of incomplete mixing using pore scale reactive transport modeling on images of porous media. J. Contam. Hydrol. 2015, 179, 171–181. [Google Scholar] [CrossRef] [Green Version]
  82. Duan, Z.; Sun, R. An improved model calculating CO2 solubility in pure water and aqueous nacl solutions from 273 to 533 k and from 0 to 2000 bar. Chem. Geol. 2003, 193, 257–271. [Google Scholar] [CrossRef]
  83. Wang, Y.; Ma, G.; Ren, F.; Li, T. A constrained delaunay discretization method for adaptively meshing highly discontinuous geological media. Comput. Geosci. 2017, 109, 134–148. [Google Scholar] [CrossRef]
Figure 1. The variations of dimensionless concentration C D of reactant and product with dimensionless time t D .
Energies 13 00387 g001
Figure 2. Diagram of reactive grouting for the CO 2 leakage remediation. Reference from [73].
Energies 13 00387 g002
Figure 3. A 3D model for simulation the process of remedying CO 2 leakage by grouting.
Energies 13 00387 g003
Figure 4. The influence of the time step on the UPM results.
Energies 13 00387 g004
Figure 5. Variation of SiO 2 concentration and porosity with time at different atmospheric pressure and formation temperature.
Energies 13 00387 g005
Figure 6. Influence of initial reactant concentration (Si) on CO 2 sequestration; (a) the variation of porosity with time; (b)–(d) the variation of CO 2 concentration with distance on five days, 100 days, and 300 days.
Energies 13 00387 g006
Figure 7. Influence of fracture aperture on CO 2 sequestration; (a) the variation of porosity with time; (bd) the variation of CO 2 concentration with distance on five days, 100 days, and 300 days.
Energies 13 00387 g007
Figure 8. Numerical results of CO 2 leakage and grout reactive concentration for 365 days with different dip of fracture.
Energies 13 00387 g008
Figure 9. Three-dimensional fracture networks model in caprock for analyzing the CO 2 sequestration process (our large connected fractures)
Energies 13 00387 g009
Figure 10. Numerical results of CO 2 sequestration at Si concentration of 3000 mol/m 3 .
Energies 13 00387 g010
Figure 11. The variation of CO 2 concentration with time at different position at Si concentration of 3000 mol/m 3 .
Energies 13 00387 g011
Figure 12. The variation of Si concentration with time at different position at Si concentration of 3000 mol/m 3 .
Energies 13 00387 g012
Figure 13. Numerical results of CO 2 sequestration at Si concentration of 3500 mol/m 3 .
Energies 13 00387 g013
Table 1. Simulation parameters for chemical precipitation reaction.
ParametersSymbolUnitValueReference
Acid fluid viscosity μ Pa · s 0.0017 Ito et al. [73]
Acid fluid density ρ kg / m 3 1000Ito et al. [73]
Initial porosity of aquifer ϕ 0 m a 0.3 Ito et al. [73]
Intrinsic permeability of aquifer k 0 m a m 2 4 × 10 14 Ito et al. [73]
Initial porosity of caprock ϕ 0 m c 0.2375 Ito et al. [73]
Intrinsic permeability of caprock k 0 m c m 2 0Ito et al. [73]
Molecular diffusion-dispersion coefficient D m m 2 / s 1.13 × 10 11 D a ´ vila et al. [2]
Reaction rate constant at 25 C k 25 mol / m 2 · s 4.62 × 10 9 Ito et al. [73]
Activation energyE J / mol 49.8 × 10 3 Ito et al. [73]
Gas constantR J / mol · J 8.314 Ito et al. [73]
Reaction equilibrium constant K e q m 6 / mol 2 1.25 × 10 5 Chen et al. [69]
Precipitation growth threshold K c mol 2 / m 6 0.8 × 10 5 Chen et al. [69]
Initial specific reactive surface areaA 1 / m 74.8 Ito et al. [73]
Power law exponent for permeabilityn 2Ito et al. [73]
Critical porosity ϕ c 0.2375 Ito et al. [73]
Fracture apertuream 0.01
Fracture porosity ϕ 0 f 1
Fracture diffusivity D f m 2 / s 1.6 × 10 5
Table 2. Concentration of CO 2 (aq) (mol/(kg water)) at different atmospheric pressure and formation temperature. Reference from [2].
Temperature ( C)P CO 2 = 10 barP CO 2 = 50 barP CO 2 = 74 bar
25 3.16 × 10 1 1.2 × 10 0
70 1.39 × 10 1 5.95 × 10 1 7.88 × 10 1
90 1.09 × 10 1 4.95 × 10 1 6.7 × 10 1

