Remote Laboratory Testing Demonstration
by
 , , and
Luigi Pellegrino
1,* ,
,
Carlo Sandroni
1,
Enea Bionda
1,
Daniele Pala
2,
Dimitris T. Lagos
3,
Nikos Hatziargyriou
3 and
Nabil Akroud
4 1
Ricerca Sistema Energetico, 20134 Milano, Italy
2
Unareti S.p.A., 25124 Brescia, Italy
3
School of Electrical and Computer Engineering, National Technical University of Athens, 15780 Zografou, Greece
4
Ormazabal Corporate Technology, 48340 Amorebieta-Etxano, Bizkaia, Spain
*
Author to whom correspondence should be addressed.
Energies 2020, 13(9), 2283; https://doi.org/10.3390/en13092283
Submission received: 13 March 2020
/
Revised: 24 April 2020
/
Accepted: 28 April 2020
/
Published: 6 May 2020
(This article belongs to the Special Issue Advancements in Real-Time Simulation of Power and Energy Systems)
Abstract
:The complexity of a smart grid with a high share of renewable energy resources introduces several issues in testing power equipment and controls. In this context, real-time simulation and Hardware in the Loop (HIL) techniques can tackle these problems that are typical for power system testing. However, implementing a convoluted HIL setup in a single infrastructure can be physically impossible or can increase the time required to test a smart grid application in detail. This paper introduces the Joint Test Facility for Smart Energy Networks with Distributed Energy Resources (JaNDER) that allows users to exchange data in real-time between two or more infrastructures. This tool enables the integration of infrastructures, exploiting the synergies between them, and creating a virtual infrastructure that can perform more experiments using a combination of the resources installed in each infrastructure. In particular, JaNDER can extend a HIL setup. In order to validate this new testing concept, a coordinated voltage controller has been tested in a Controller HIL setup where JaNDER was used to interact with an actual On Load Tap Changer (OLTC) controller located in a remote infrastructure. The results show that the latency introduced by JaNDER is not critical; hence, under certain circumstances, it can be used to expand the real-time testing without affecting the stability of the experiment.
1. Introduction
In a global warming trend [1], the key enablers to manage the increasing emission of greenhouse gases (GHGs) are energy efficiency and low-carbon technologies. Renewable sources, storage systems, and flexible loads provide enhanced possibilities. However, these new resources introduce several issues that power system operators have to cope with and investigate. Indeed, an infrastructure with a growing amount of heterogeneous components typically has a higher complexity than traditional power plants [2]. Sophisticated component design methods, intelligent information and communication architectures, automation and control concepts, and proper standards are necessary in order to manage the higher complexity of such intelligent power systems (i.e., Smart Grids) [3,4,5]. Due to the considerable higher complexity of such cyber-physical systems, it is expected that the validation of smart grid configurations will play a major role in future technology developments.
During the last decade, a growing number of various research and technology development activities have already been carried out in this area. This has been brought to form several research infrastructures (RIs) performing experiments on smart grid activities. However, up to now, no integrated approach for analyzing and evaluating smart grid configurations addressing power system, as well as information, communication, and control topics is available. The integration of cyber security and privacy issues are also not sufficiently addressed by existing solutions. In order to guarantee a sustainable and secure supply of electricity in a smart grid system with considerable higher complexity, and to support the expected forthcoming large-scale roll out of new technologies, a proper integrated RI for smart grids is necessary.
In this context, ERIGrid project [6] came up with a tool for integrating laboratories, exchanging data in real-time. This tool, the Joint Test Facility for Smart Energy Networks with Distributed Energy Resources (JaNDER), allows users to exploit the synergies among the RIs in order to increase the number of test cases that can be implemented without any further cost for hardware/software extension. Obviously, some test cases can be performed in an integrated RI, while others, with strict time constraints, cannot. Indeed, the exchange of information between the RIs introduces a delay due to the communication latency that changes as a function of RI locations, the architecture of the communication infrastructure, and the amount of data to exchange.
There are a few research papers that document real-time simulation using geographically distributed resources. Ravikumar et al. [7] integrated two digital real-time simulator (DRTS) setups based on a customized advanced data acquisition system. Similar setups have been used by Faruque et al. [8] and Rentachintala [9]. In recent works [10] and [11] a geographically distributed real-time simulation (GD-RTS) has been performed using VILLASframework [12], a set of tools that can be used for integrating RIs. In particular, VILLASframework includes a lab-to-lab communication mode, thorough the public internet, with an architecture very similar to that of JaNDER. While VILLAS supports various integration modes with different purposes and performances, JaNDER makes lightness and simplicity of use its major strengths.
In Section 2, a description of the main challenges in power system testing are discussed to explain why HIL techniques and the integration of RIs are important to tackle the upcoming issues in the transition of the power system. Section 3 describes the architecture of JaNDER, and Section 4 presents the results of the characterization tests performed. In the end, Section 5 presents a real application involving two RIs to validate the concept of integrated RIs and to evaluate the performance of JaNDER.
2. Real-Time Simulation Testing
Real-time simulation and HIL techniques are gaining significant attention as a testing procedure for smart grid applications. These techniques allow the connection of physical devices (e.g., inverters, controllers) to a DRTS that simulates the rest of the power system in real-time. Therefore, instead of using simulated models of hardware equipment, which could be inaccurate compared to the actual device, the actual hardware components are used providing a more realistic view of a smart grid application. Under this setup, exhaustive testing can be achieved in realistic, flexible, controllable, and repeatable conditions leading to fewer problems at the commissioning phase and field operation [13,14,15,16].
HIL approaches can be the closest representation that a laboratory test can get to a full hardware application. However, as the HIL setup approaches the actual field implementation, complexity and interfacing challenges increase due to the introduction of various hardware components.
The implementation procedure of such convoluted setup could be quite time consuming. This is derived from the fact that the engineers involved must gain adequate expertise on the different equipment, which could have been developed by various manufacturers, in order to address communication, protection and interface issues between the hardware devices and the DRTS. The physical space required, in the infrastructure hosting the HIL setup, can be another important limitation factor.
To sum up, implementing a convoluted HIL setup in a single infrastructure can be physically impossible or can increase the time required to test a smart grid application in detail. However, platforms like JaNDER, which is described in this work, can be used to overcome the aforementioned issues.
JaNDER allows the interconnection of different infrastructures with very small communication latencies and can be used, as presented in Section 5, to expand the HIL setup. This addresses the space limitation issue and also reduces the time required to interface the different equipment due to the collaboration of different personnel specialized in different components.
3. JaNDER Concept
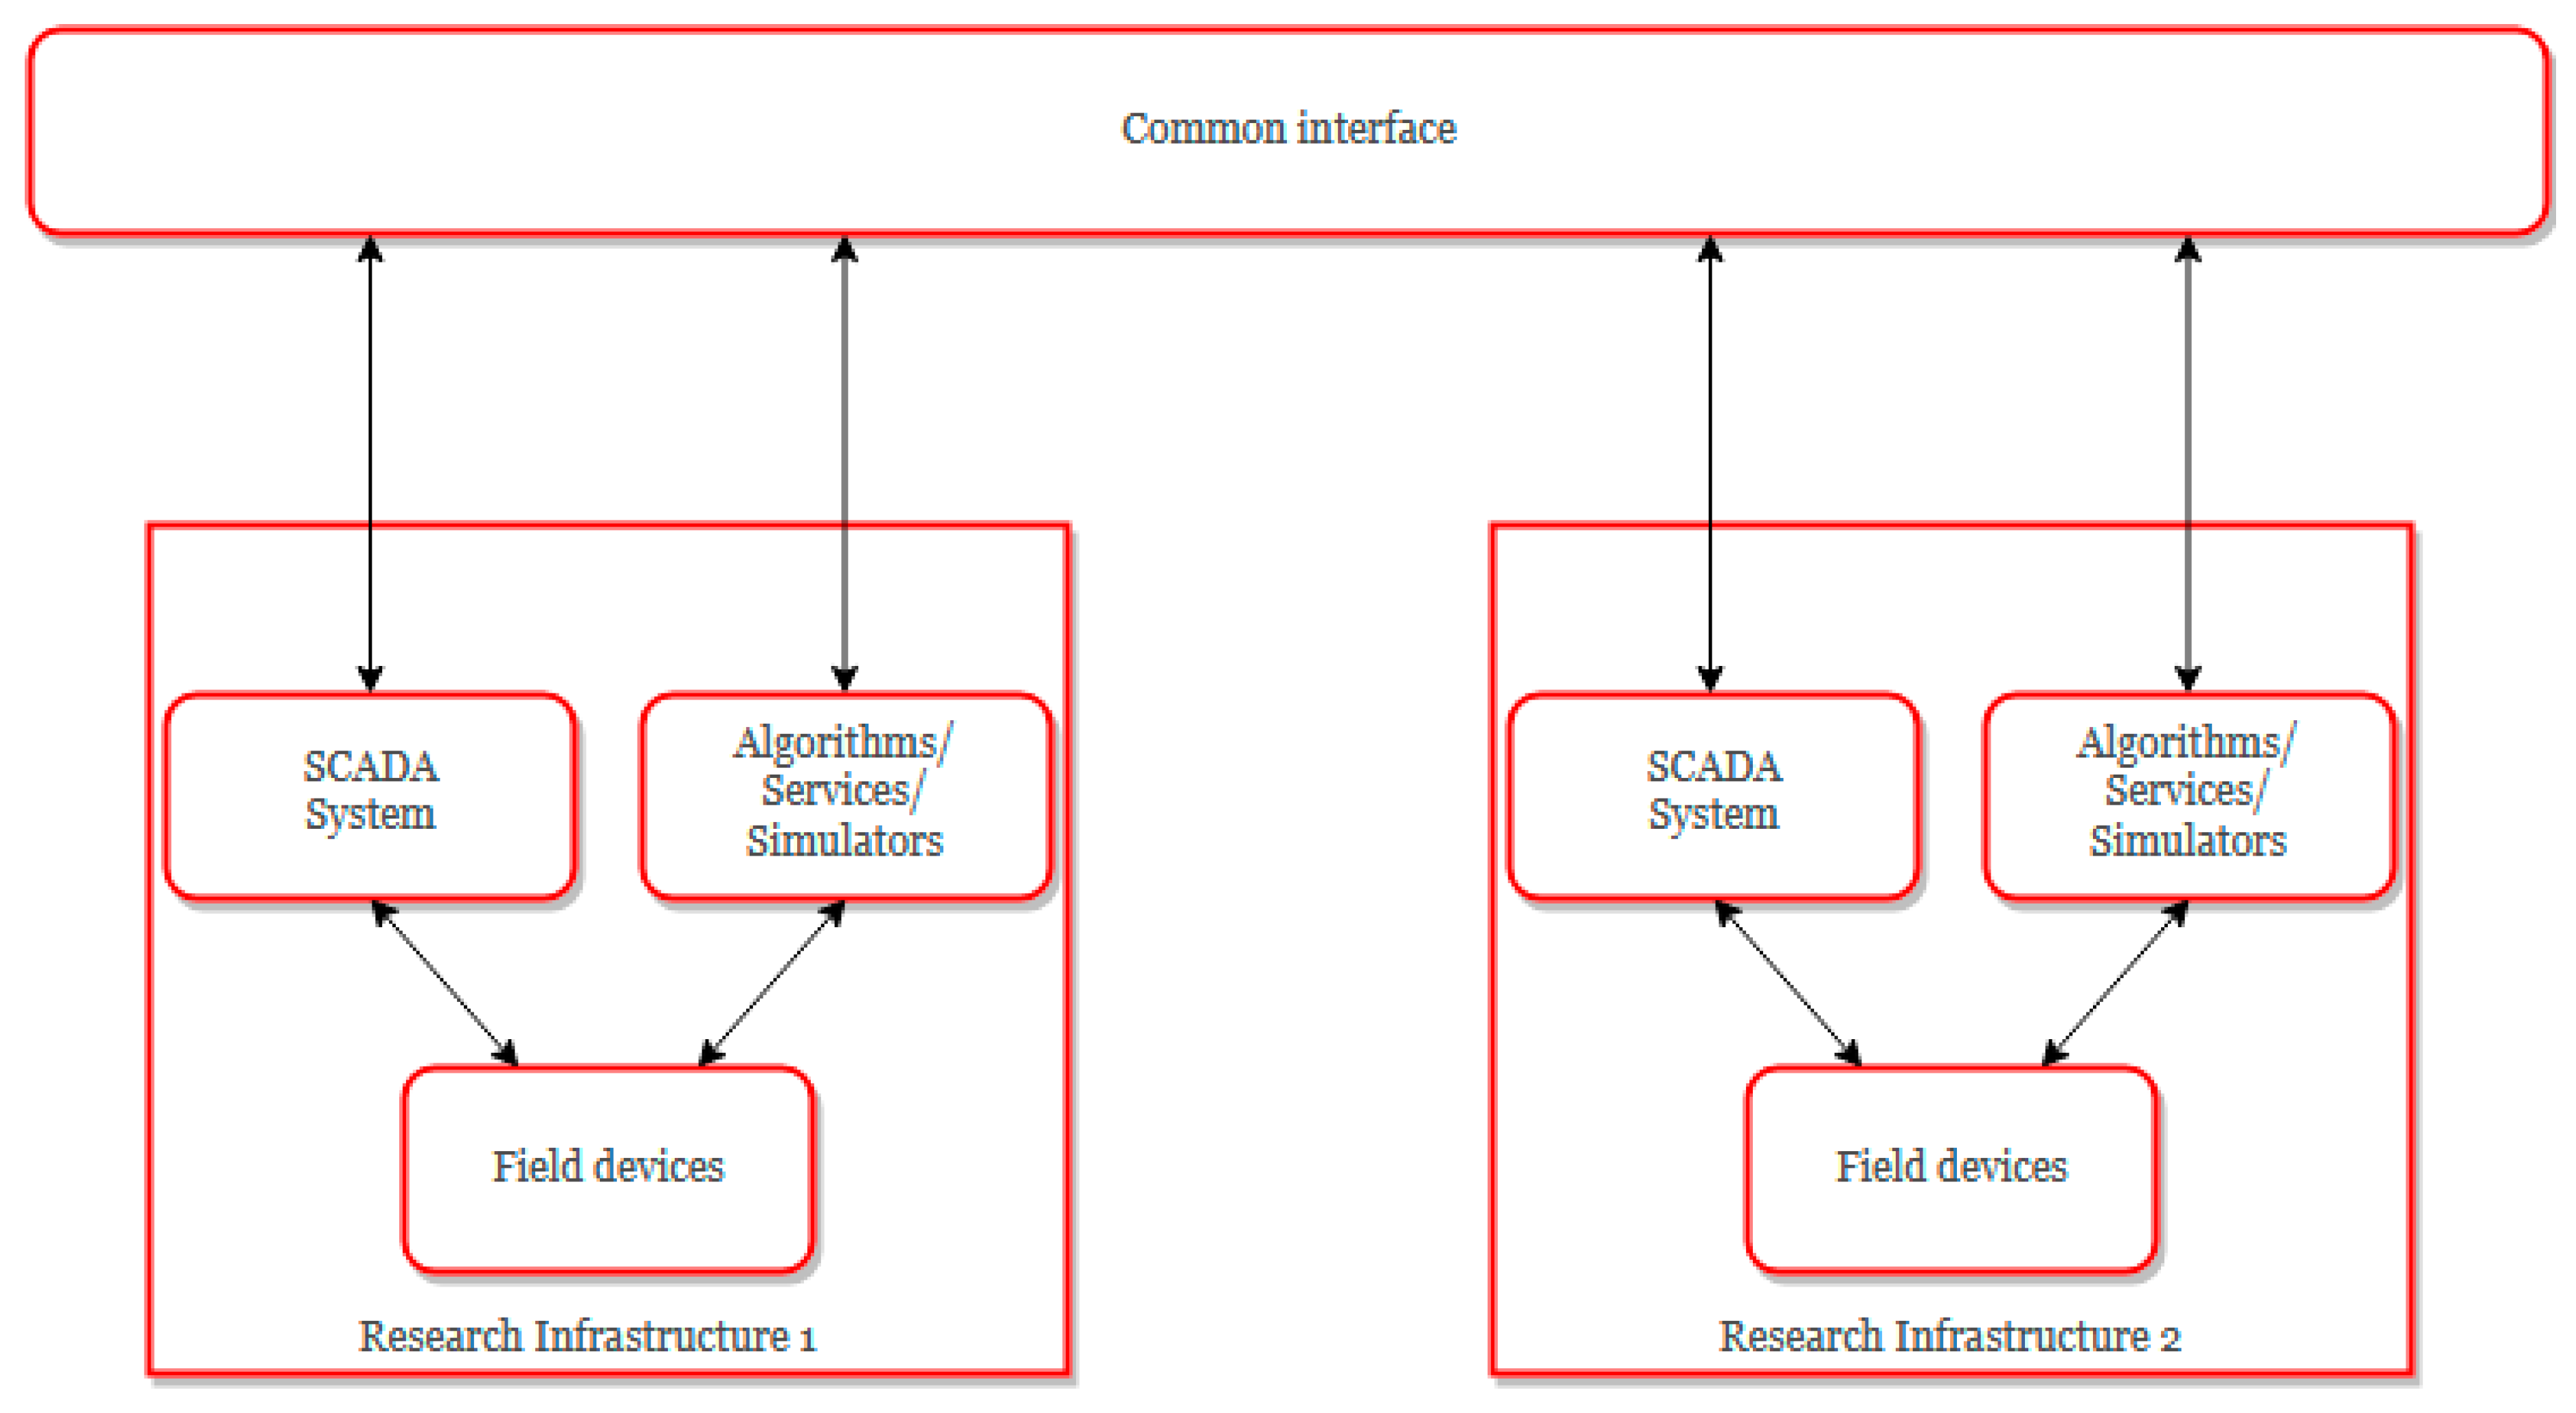
To better understand how an HIL setup can be extended on two or more RIs, it is useful to explain how JaNDER works. At the heart of the JaNDER platform, there is the idea that several RIs, linked with a standardized ICT solution, are integrated into a Virtual Research Infrastructure (VRI), encompassing the simulation/experimental potential made available by each laboratory, and thus being able to participate in tests of complex use cases. The overall idea of VRI is depicted in Figure 1.
Figure 1 shows the advantage of the VRI concept: the possibility for one RI to seamlessly access the resources located at a remote site: these resources might be real field devices, typically mediated through a supervisory control and data acquisition (SCADA) system, or resources modelled inside a DRTS. DRTSs are crucial components of smart grid laboratory experiments but are also very expensive and the possibility of sharing them among RIs is a big advantage. Also, software artifacts such as control algorithms (e.g., a voltage control algorithm, operating on both local and remote devices) can be remotely connected. In practice, measurements and control signals transferred through the VRI’s common interface can benefit from higher levels of interoperability—at a basic level, there is the need to transfer plain values associated to devices (either real or simulated), while a more semantic level can be placed “above” the basic exchange of field signals. In fact, this “layered” approach is the one used by the JaNDER platform (under the terminology of “Level 0” and “Level 1”), as described in more details in the following subsections.
3.1. JaNDER Level 0
JaNDER Level 0 implements the basic mechanism for exchanging live data (i.e., typically measurements and controls) between different RIs. The non-functional constraints associated to this layer are the following:
- Work with a “push” communication model, i.e., do not require any RI to accept incoming TCP connections. This allows for a simpler deployment of the platform.
- Use the HTTPS protocol; the reason for this requirement is the same as the previous one.
- It must be easy to integrate the platform in many different existing laboratory environments, using different communication protocols and programming languages.
- It must be secure. Since RIs are connected over the Internet, proper cyber security mechanisms must be adopted in order to guarantee that only authorized parties can connect to the platform.
- It must be “fast enough”; this actually means fast enough to support the foreseen test cases, both in terms of latency and volume of data.
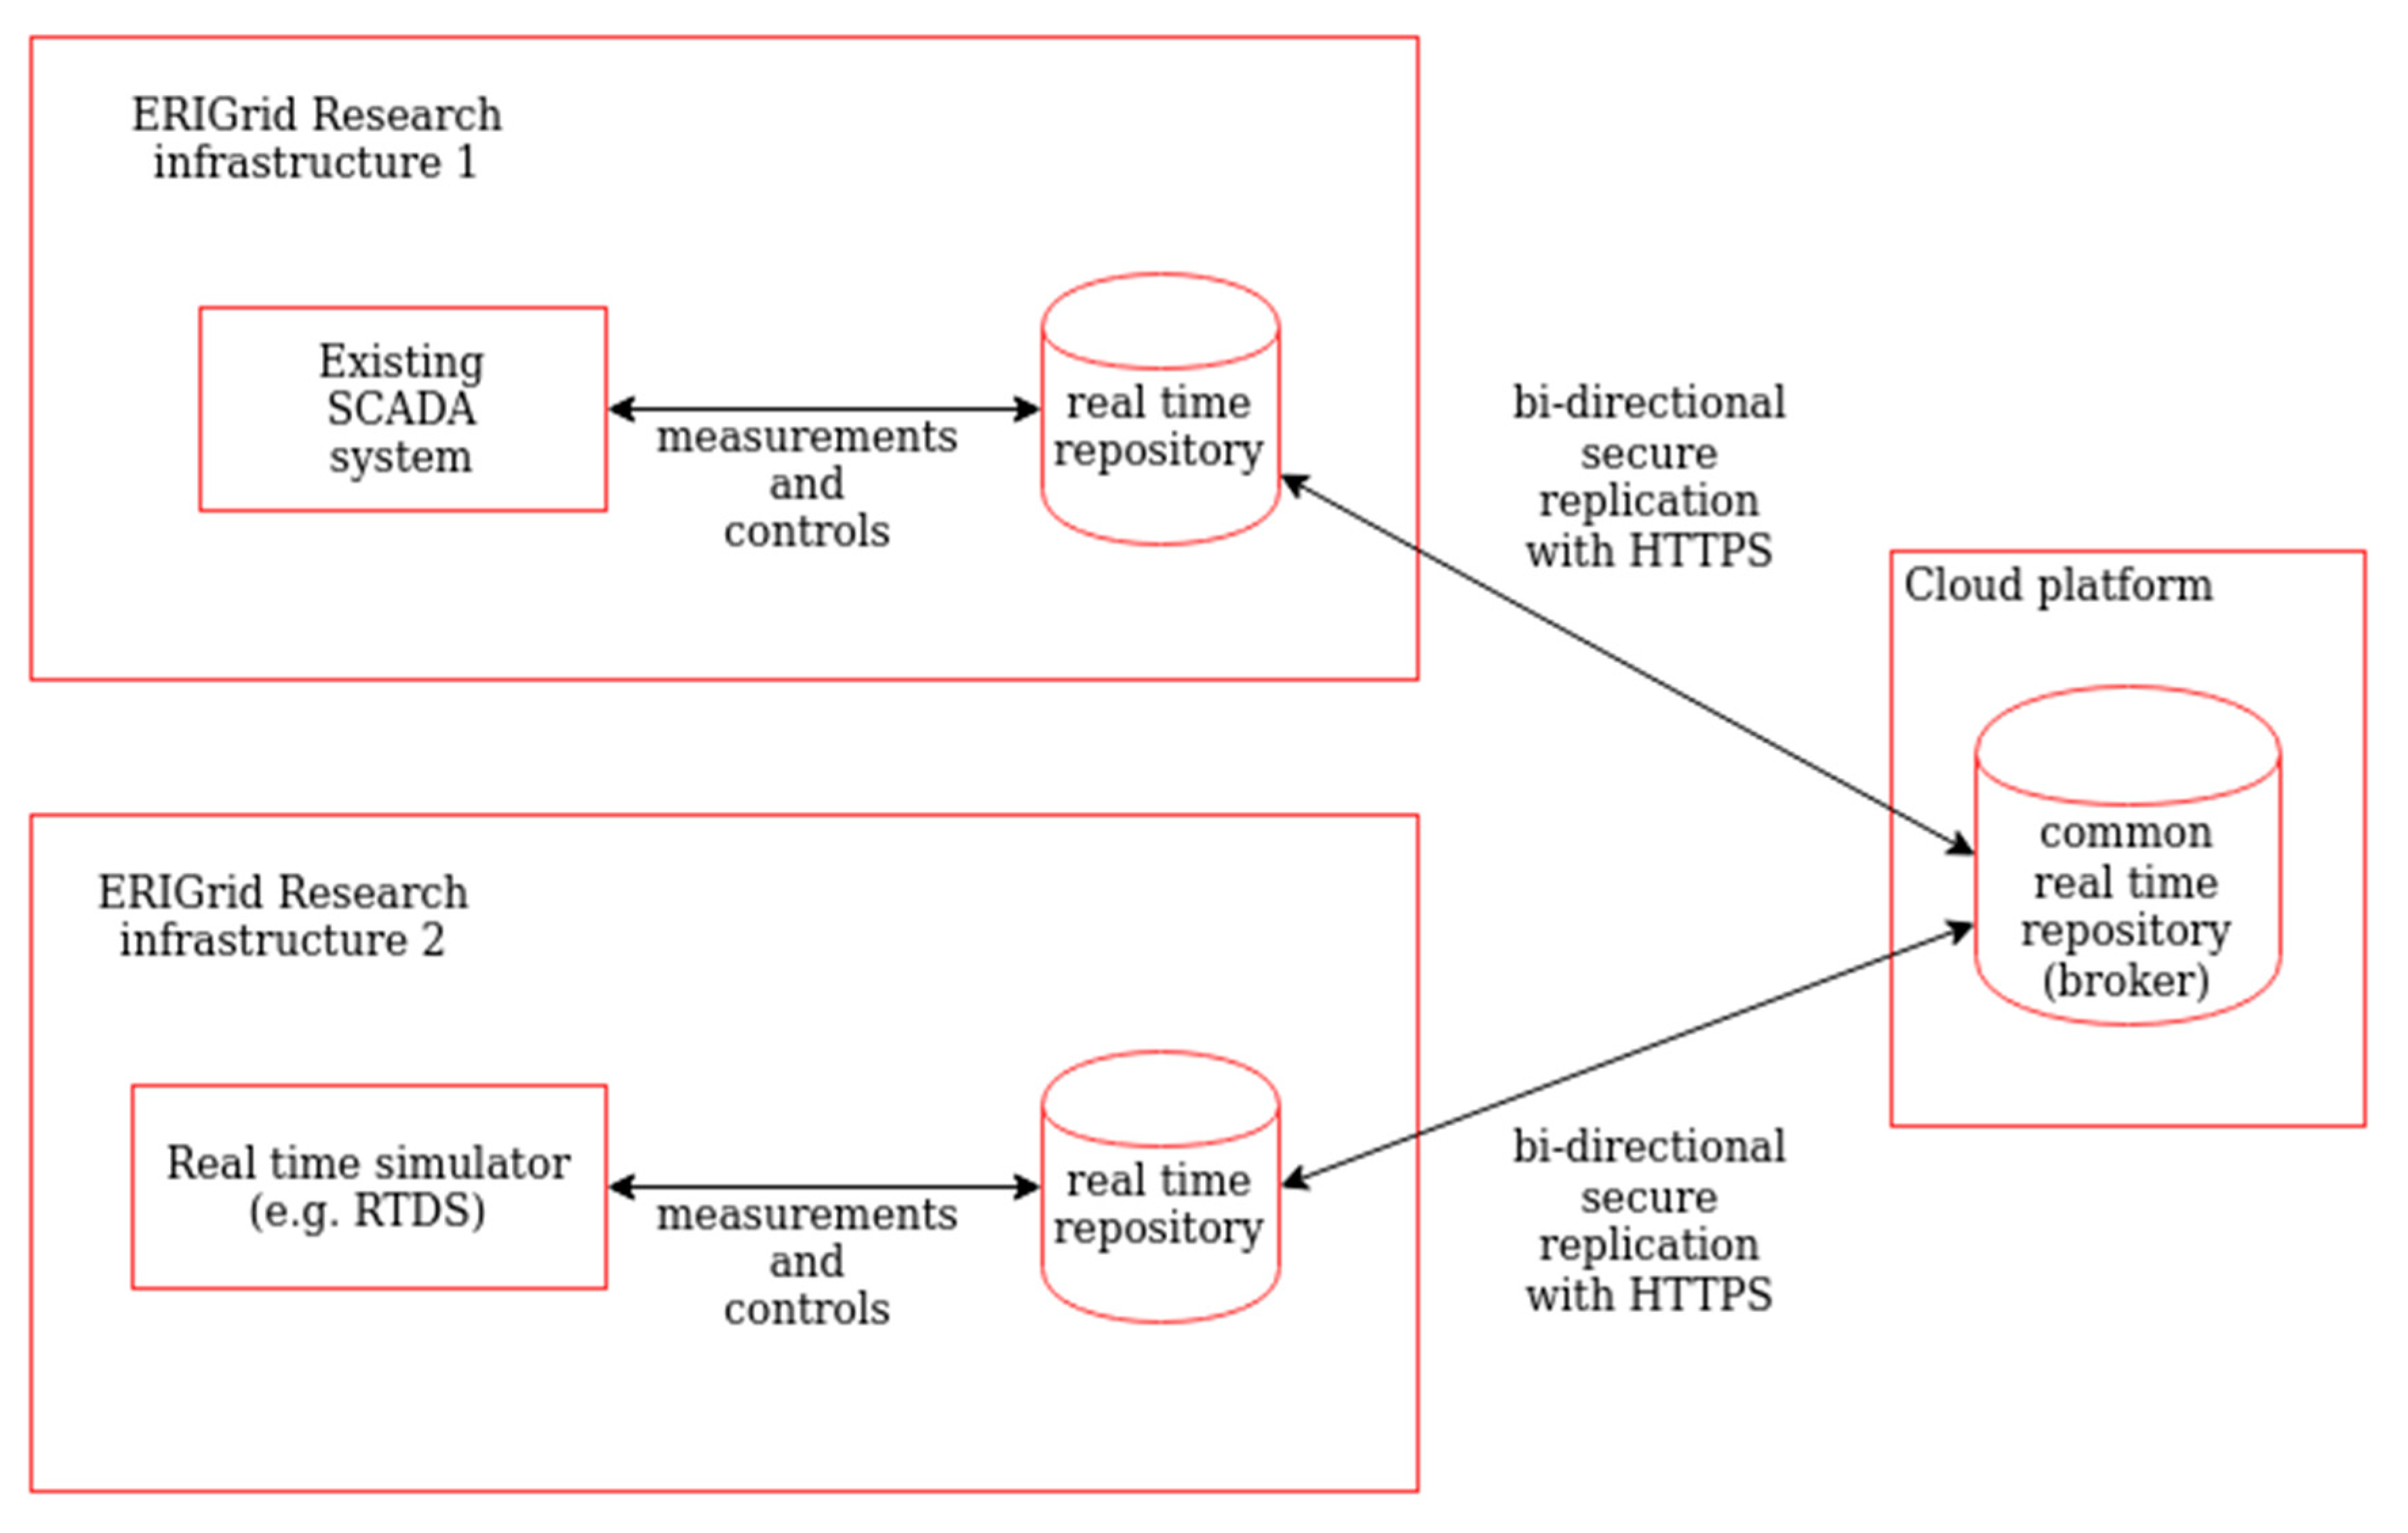
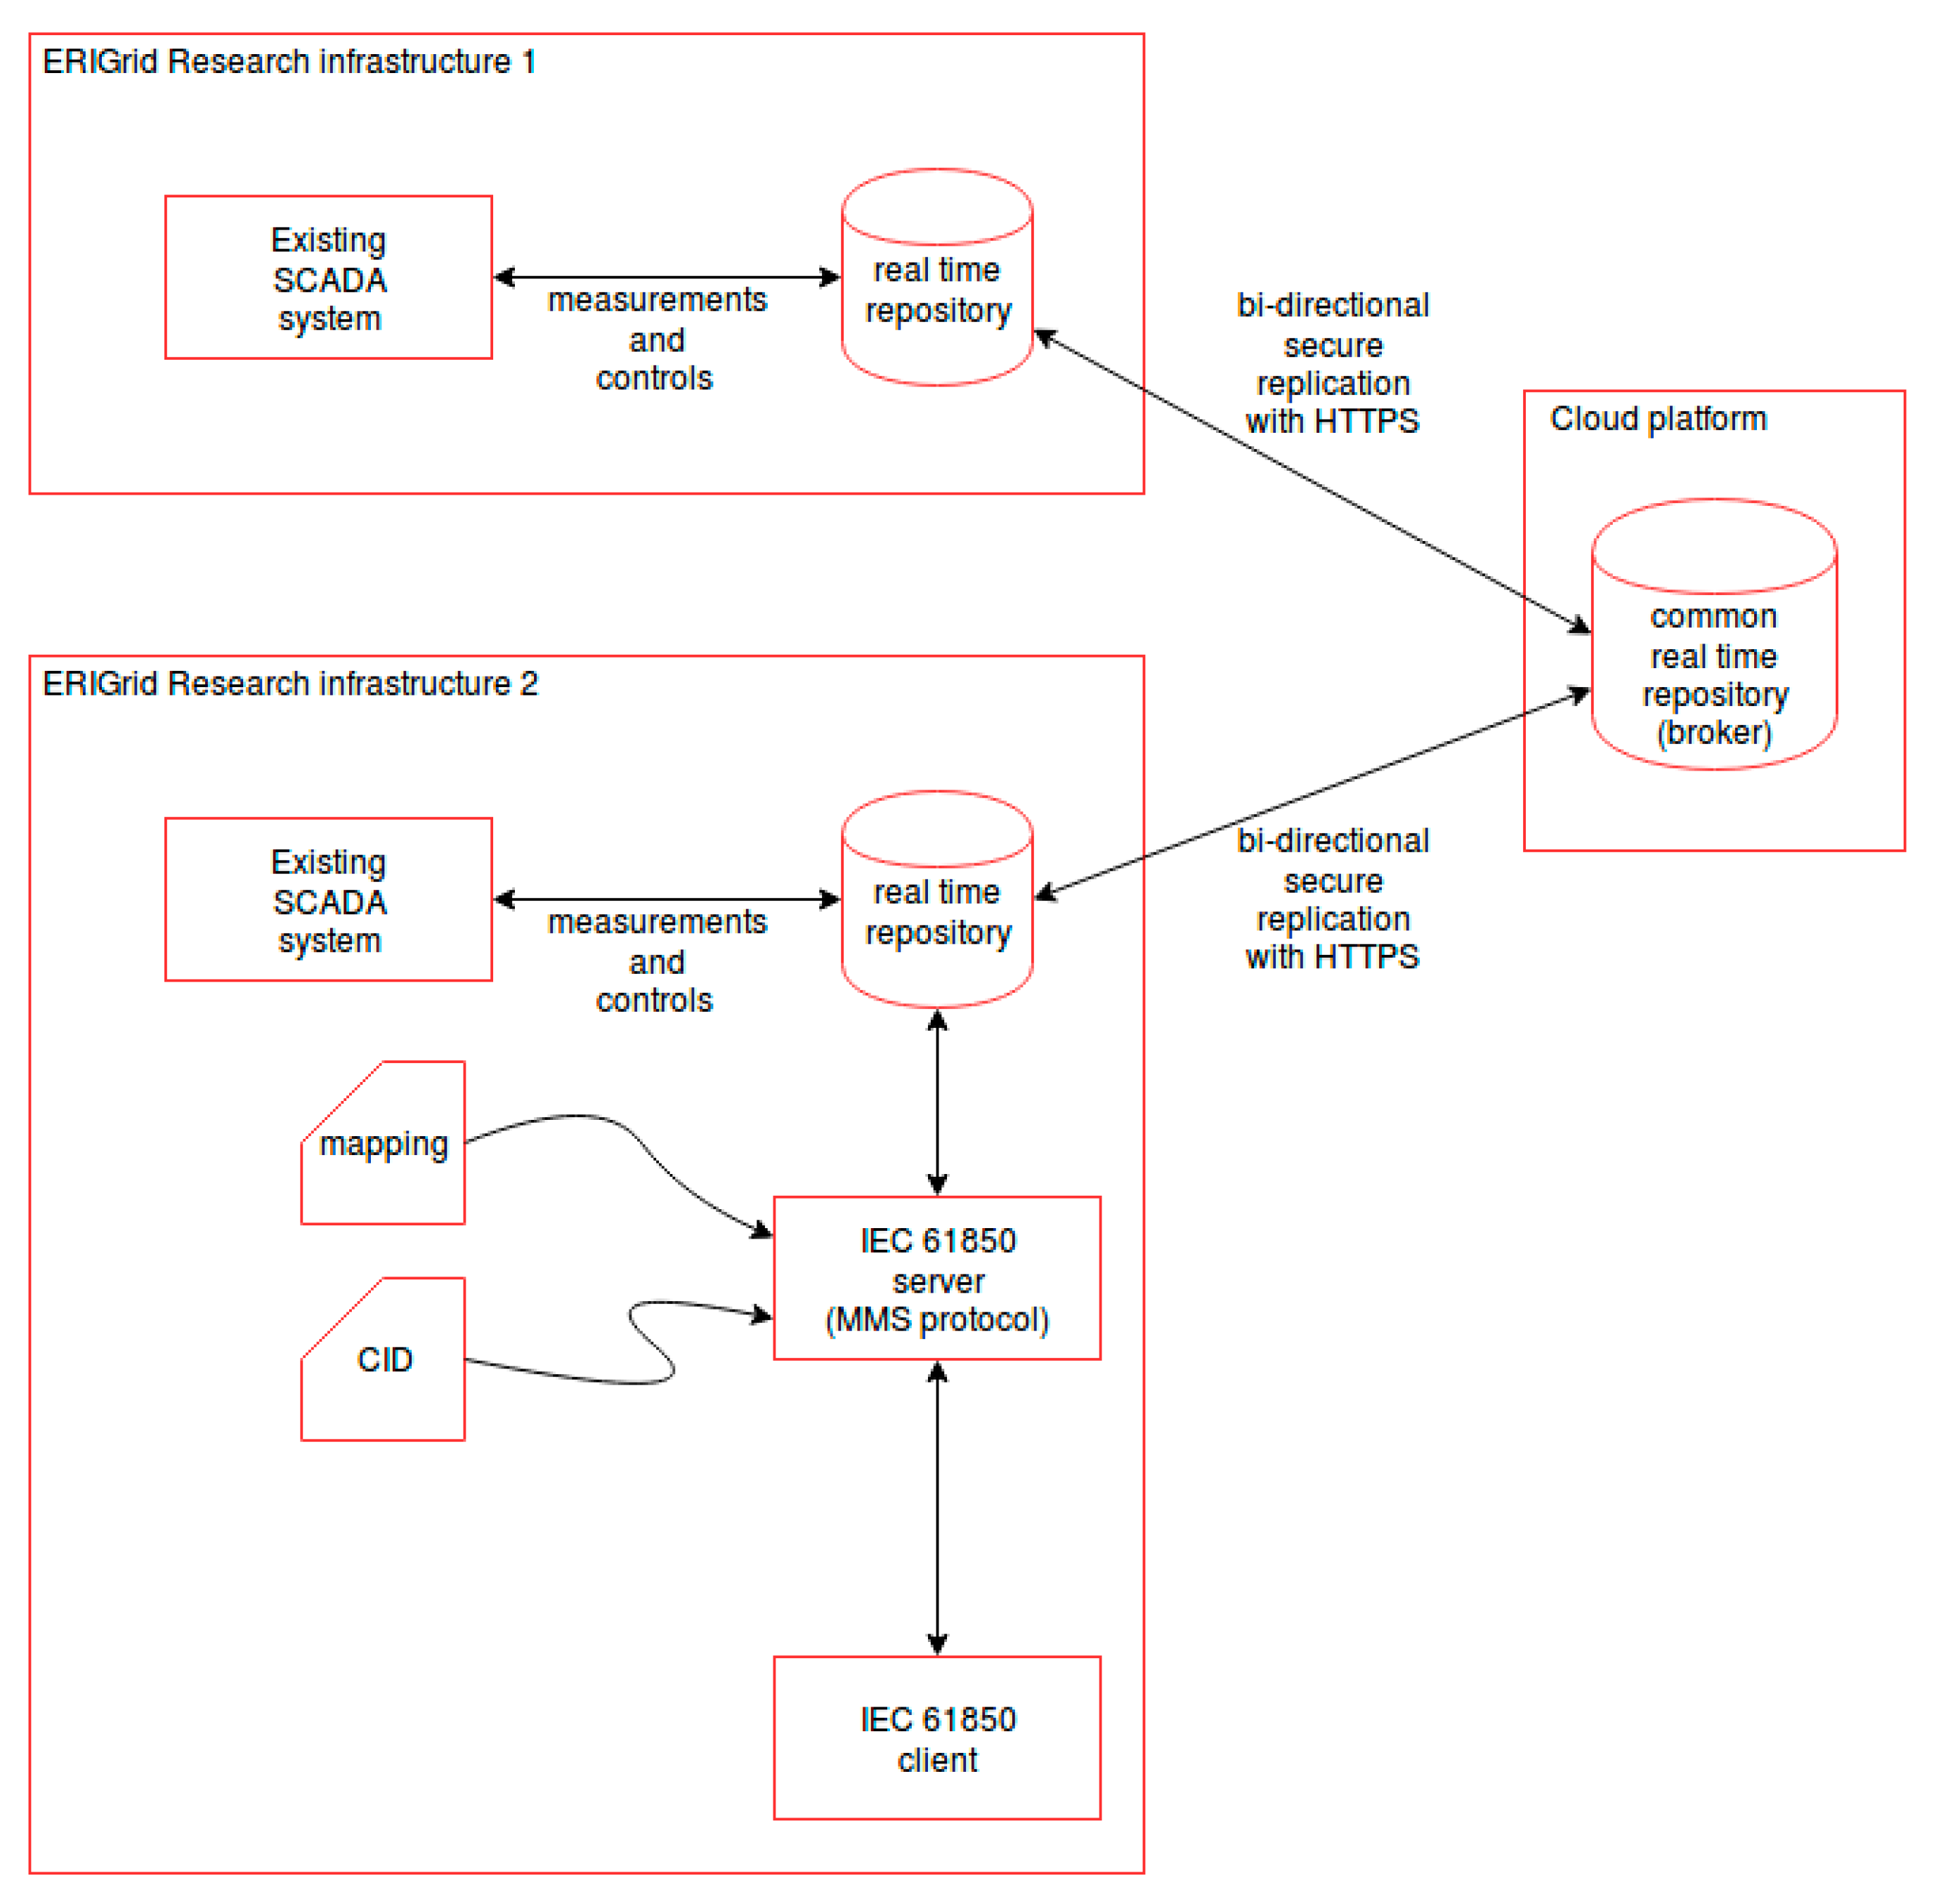
Given the above requirement, Figure 2 illustrates in a simplified manner the implemented JaNDER Level 0 architecture, which is then explained in details.
The starting point for each RI is a real-time repository used to collect measurements and controls from the field (or more often, as shown in Figure 2, from an already existing SCADA system or DRTS). The reason for this repository is the decoupling of the JaNDER platform from any specific automation solution already installed in the infrastructure. The idea is to have data points from each partner available in the same basic format using a simple key-value repository. The remote connection of remote infrastructures is then implemented by deploying a common real-time repository (which can be hosted in a cloud environment, for example) that is automatically synchronized with all the local real-time databases of the partners. In other words, the common repository acts as a central broker for connecting the different local repositories of the partners, and can be thought as a “virtual bus” connecting all authorized facilities. The real-time repository is an existing open source product, called Redis [17], which is a widely tested, supported, and documented solution with client libraries already developed for many programming languages and environments. However, the HTTPS replication logic is not part of the Redis product and has been developed originally within the project and then released as open-source software.
A crucial implementation aspect of JaNDER Level 0 is the connection between Redis and the existing SCADA system (or individual field devices, depending on each laboratory architecture, such as a DRTS); this link is of course different for each partner, and therefore, the associated software development effort can vary from a really straightforward task, in case the SCADA system provides an open and well-documented interface for connection with external systems to a difficult and time-demanding task, in case there is no central SCADA system and each device must be integrated separately (possibly with different communication protocols). Given the impossibility to address each of the partner’s ICT infrastructures in a unified way, it should be noted that the extremely simple data model of the Redis database and the fact that client libraries are available in almost any programming language and environment (including LabVIEW and Matlab, which are highly popular in laboratory environments) helps in keeping the integration effort minimal. In conclusion, all of the requirements mentioned at the beginning of this section have been addressed with the described implementation: the performance argument in particular is detailed in the next section.
The fully open source nature of JaNDER Level 0 [18] makes it easy to extend the VRI community in the future with new participants, however external users will also typically be interested in having a standardized protocol for interfacing: this is handled by the higher JaNDER levels, as described in the next subsection.
3.2. JaNDER Level 1
JaNDER Level 1 is a software abstraction build on top of Level 0, and its purpose is to provide an IEC 61850 interface on top of the very simple data structures defined in Redis. The reason for adding this level is of course to provide access to the VRI by means of an internationally accepted standard where applicable, such as IEC 61850, which is a standard of primary importance in the field of Smart Grids. The high level architecture of JaNDER Level 1, as an extension of the picture presented for JaNDER level 0, is the following.
In Figure 3, one RI wants to access some contents of its Redis database using the IEC 61850 protocol. It should be stressed that the data points which are in its repository can also come from another RI by means of the JaNDER Level 0 replication mechanism. This means that the IEC 61850 server in the picture can give access to devices in infrastructure 2 but also in infrastructure 1, in a seamless way; at the same time, since the IEC 61850 connection is local to infrastructure 2, there is no need to setup sophisticated cyber security mechanisms for this connection, i.e., the basic MMS protocol without any encryption can be safely used. Of course this is possible because strong cyber security mechanisms are already implemented at Level 0, and are therefore completely transparent for Level 1. The “Mapping” and “CID” files shown as inputs in the above figure are the fundamental inputs needed by the IEC 61850 server in order to work. More in detail, the configured IED description (CID) is the standard IEC 61850 file used for configuring a device (an IED) and contains a data model representing (a subset of) the contents of the Redis repository in terms of IEC 61850 logical nodes. Apart from this file, it is of course necessary to link the data attributes defined inside it with the live values stored in Redis: this is done by means of a mapping file, which is a text file where each line contains an IEC 61850 data attribute name and a corresponding Redis data point name. The server will use this file in order to connect the IEC 61850 data model specified in the CID to Redis.
The IEC 61850 server software is completely open source [19] and based on the OpenIEC61850 Java library provided by Fraunhofer ISE [20] and others in the context of the wider OpenMUC framework. The library has been integrated with a Redis interfacing mechanism which allows the implementation of the behavior discussed above. The interfacing is of course bidirectional, so that measurements can be retrieved and control commands can be issued. (It should be highlighted that the more advanced IEC 61850 control services (enhanced security and select-before-operate) have not been implemented since the direct control with normal security is adequate for the testing scenarios.) In conclusion, the Level 1 of the JaNDER platform provides a simplified way of adding an IEC 61850 standard interface to a RI, built on top of the Level 0 basic solution.
4. JaNDER Characterization
4.1. JaNDER Characterization Introduction
To better understand the behavior of JaNDER in different contexts a characterization of the different JaNDER levels is necessary. First of all, two of the principal features that are usually taken into account in a distributed system have been considered: latency and response time. In this work only one level has been tested: JaNDER Level 0. The difference between JaNDER Level 0 and Level 1, in terms of latency, is negligible; the delay introduced by JaNDER Level 1 is only few milliseconds due to the mapping between the two layers. For this reason, only a single test has been performed. For this type of architecture, it is important to evaluate the latency to exchange measurements between a single RI and the cloud platform. The next subsection introduces a useful platform to log the measurements used during the tests in order to characterize JaNDER and the test procedure adopted for testing JaNDER Level 0.
4.2. Logging Data Platform: a Big Data Solution
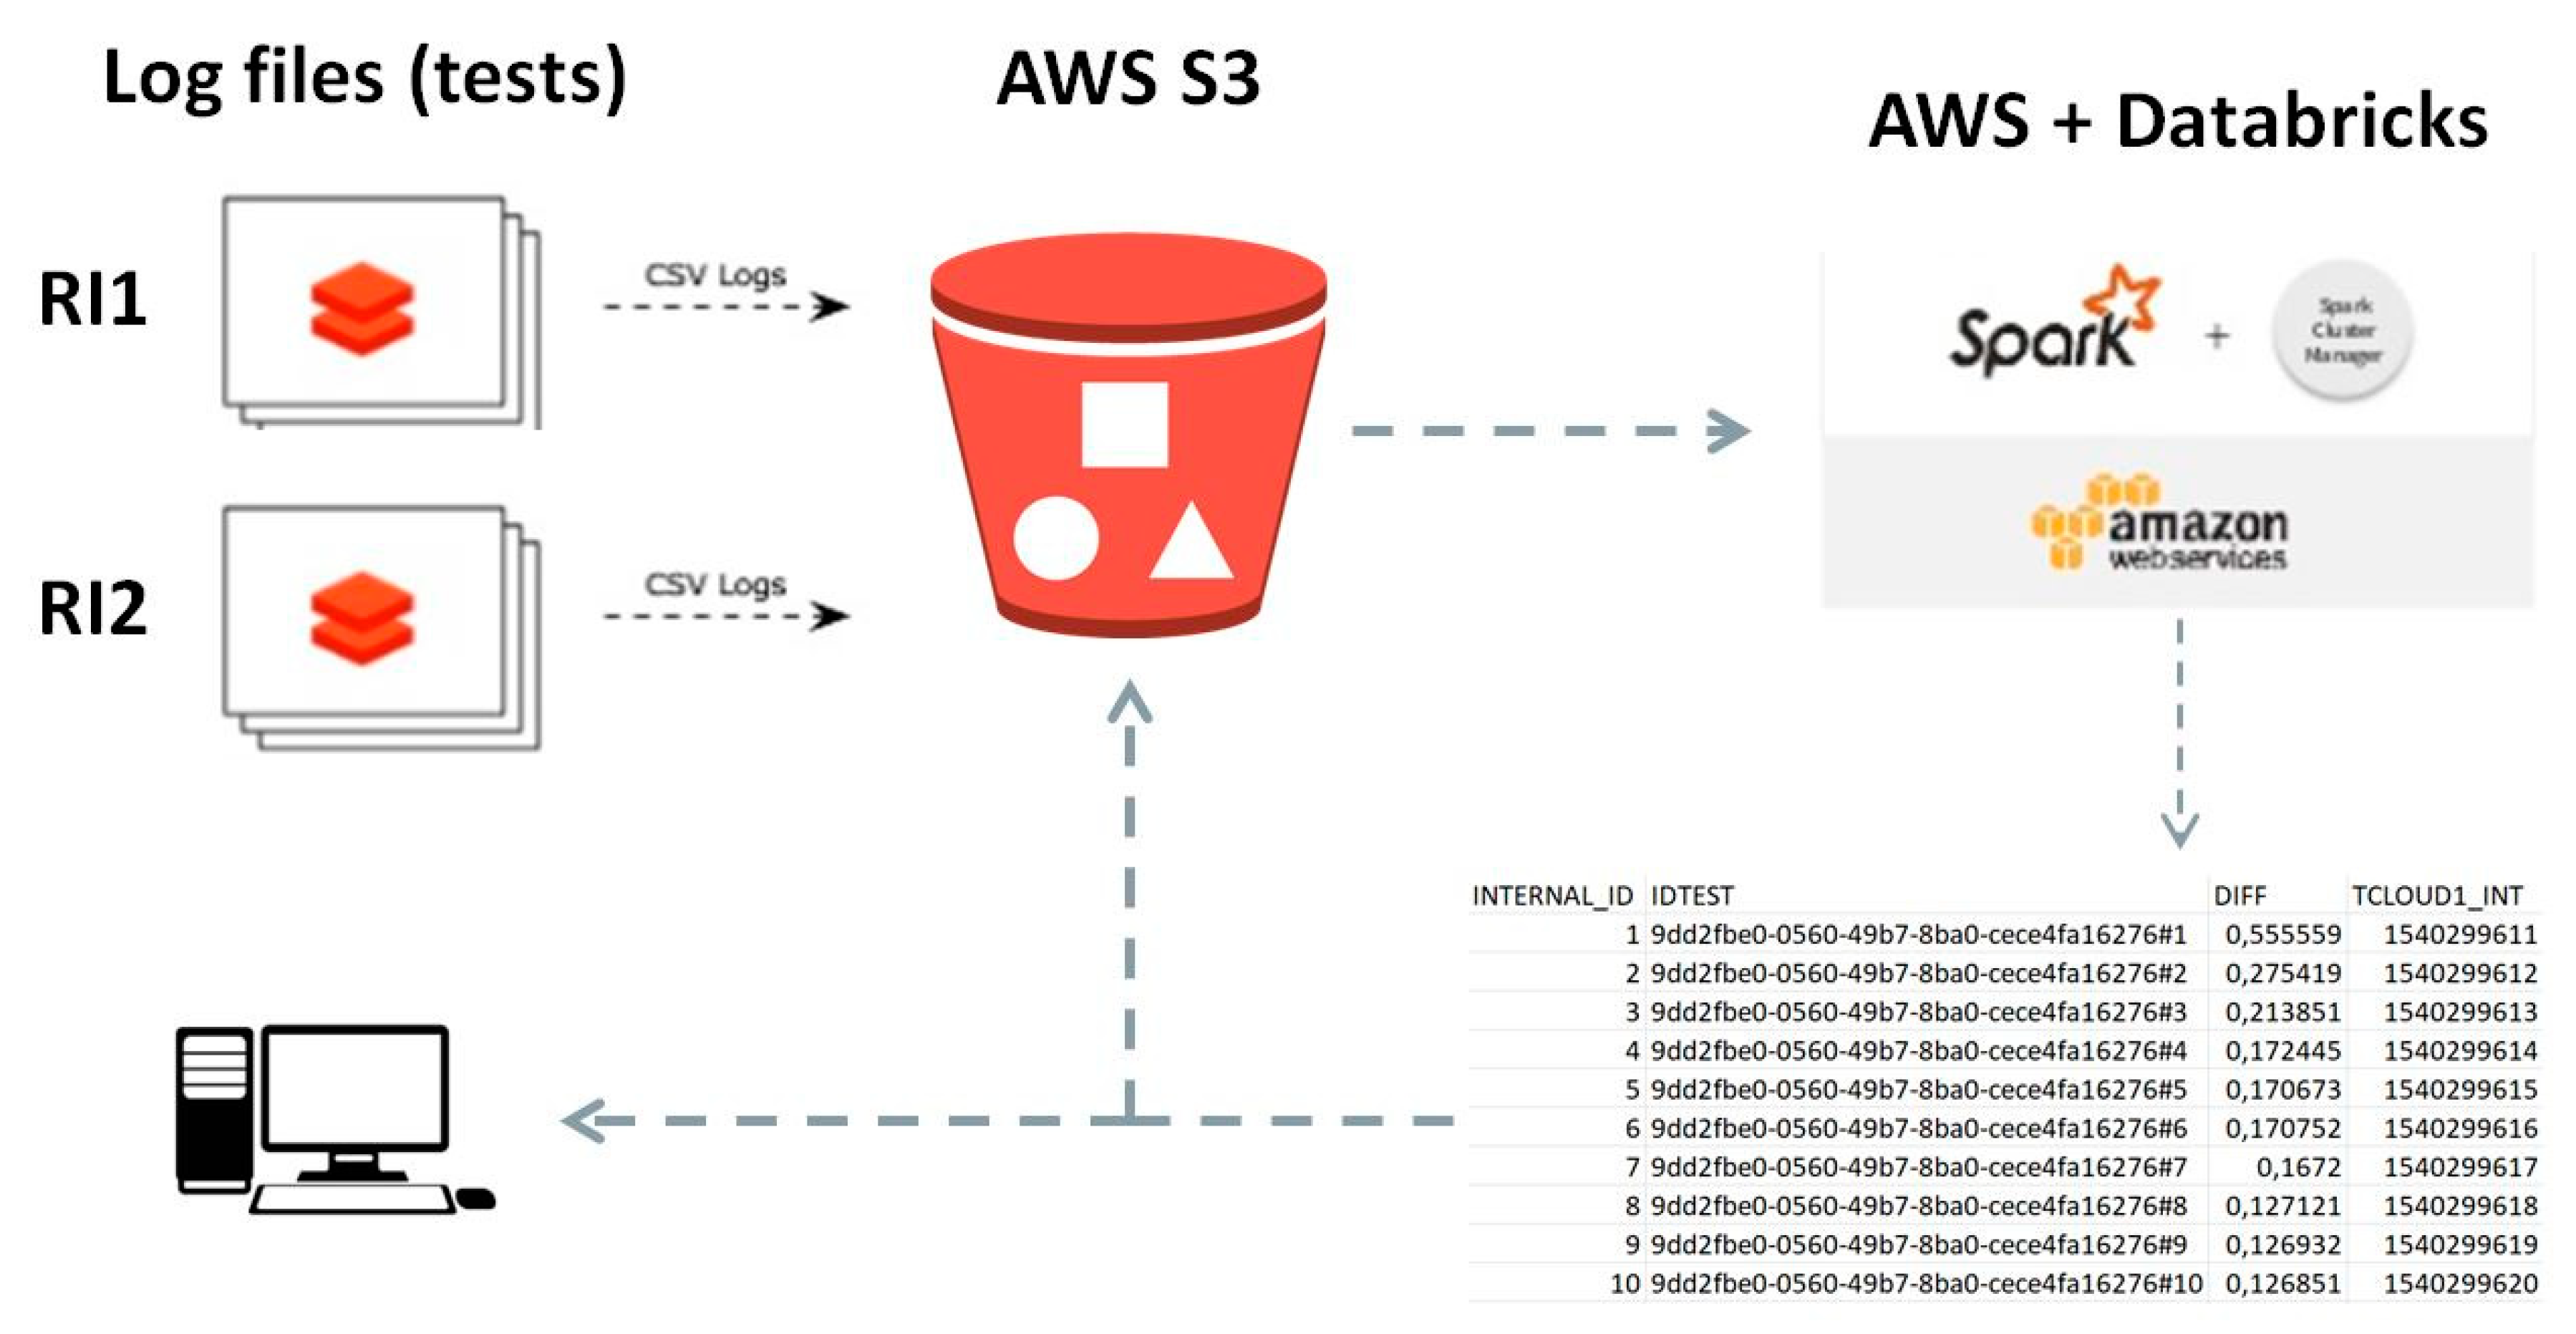
Since the characterization of JaNDER needs a large number of experiments, to simplify the management of the test, a Big Data solution has been developed. The idea is to automate the analysis of test results as much as possible and to make it easy to manage the collection and analysis of data with a Big Data platform. The platform for data analysis is deployed using the Amazon AWS [21] infrastructure. Databricks [22] was used for the Big Data analysis. Every single RI records the files coming from tests, and at the end of the test, these logs are sent to the single cloud repository (AWS S3 in Figure 4). Using the framework Apache Spark [23] in Databricks, it is possible to aggregate and explore the data coming from all the tests performed by the RI in a single place with powerful Big Data tools and save the results again in AWS S3 to be eventually visualized or processed with other tools.
To permit that every single test is realized without the overlap of other tests, scheduling the tests is recommended in order to automatically run the test for every RI. In this way, the latency of every single measurement is not compromised by other tests. In the next paragraph, the JaNDER Level 0 test is described.
4.3. Test JaNDER Level 0: Test Description
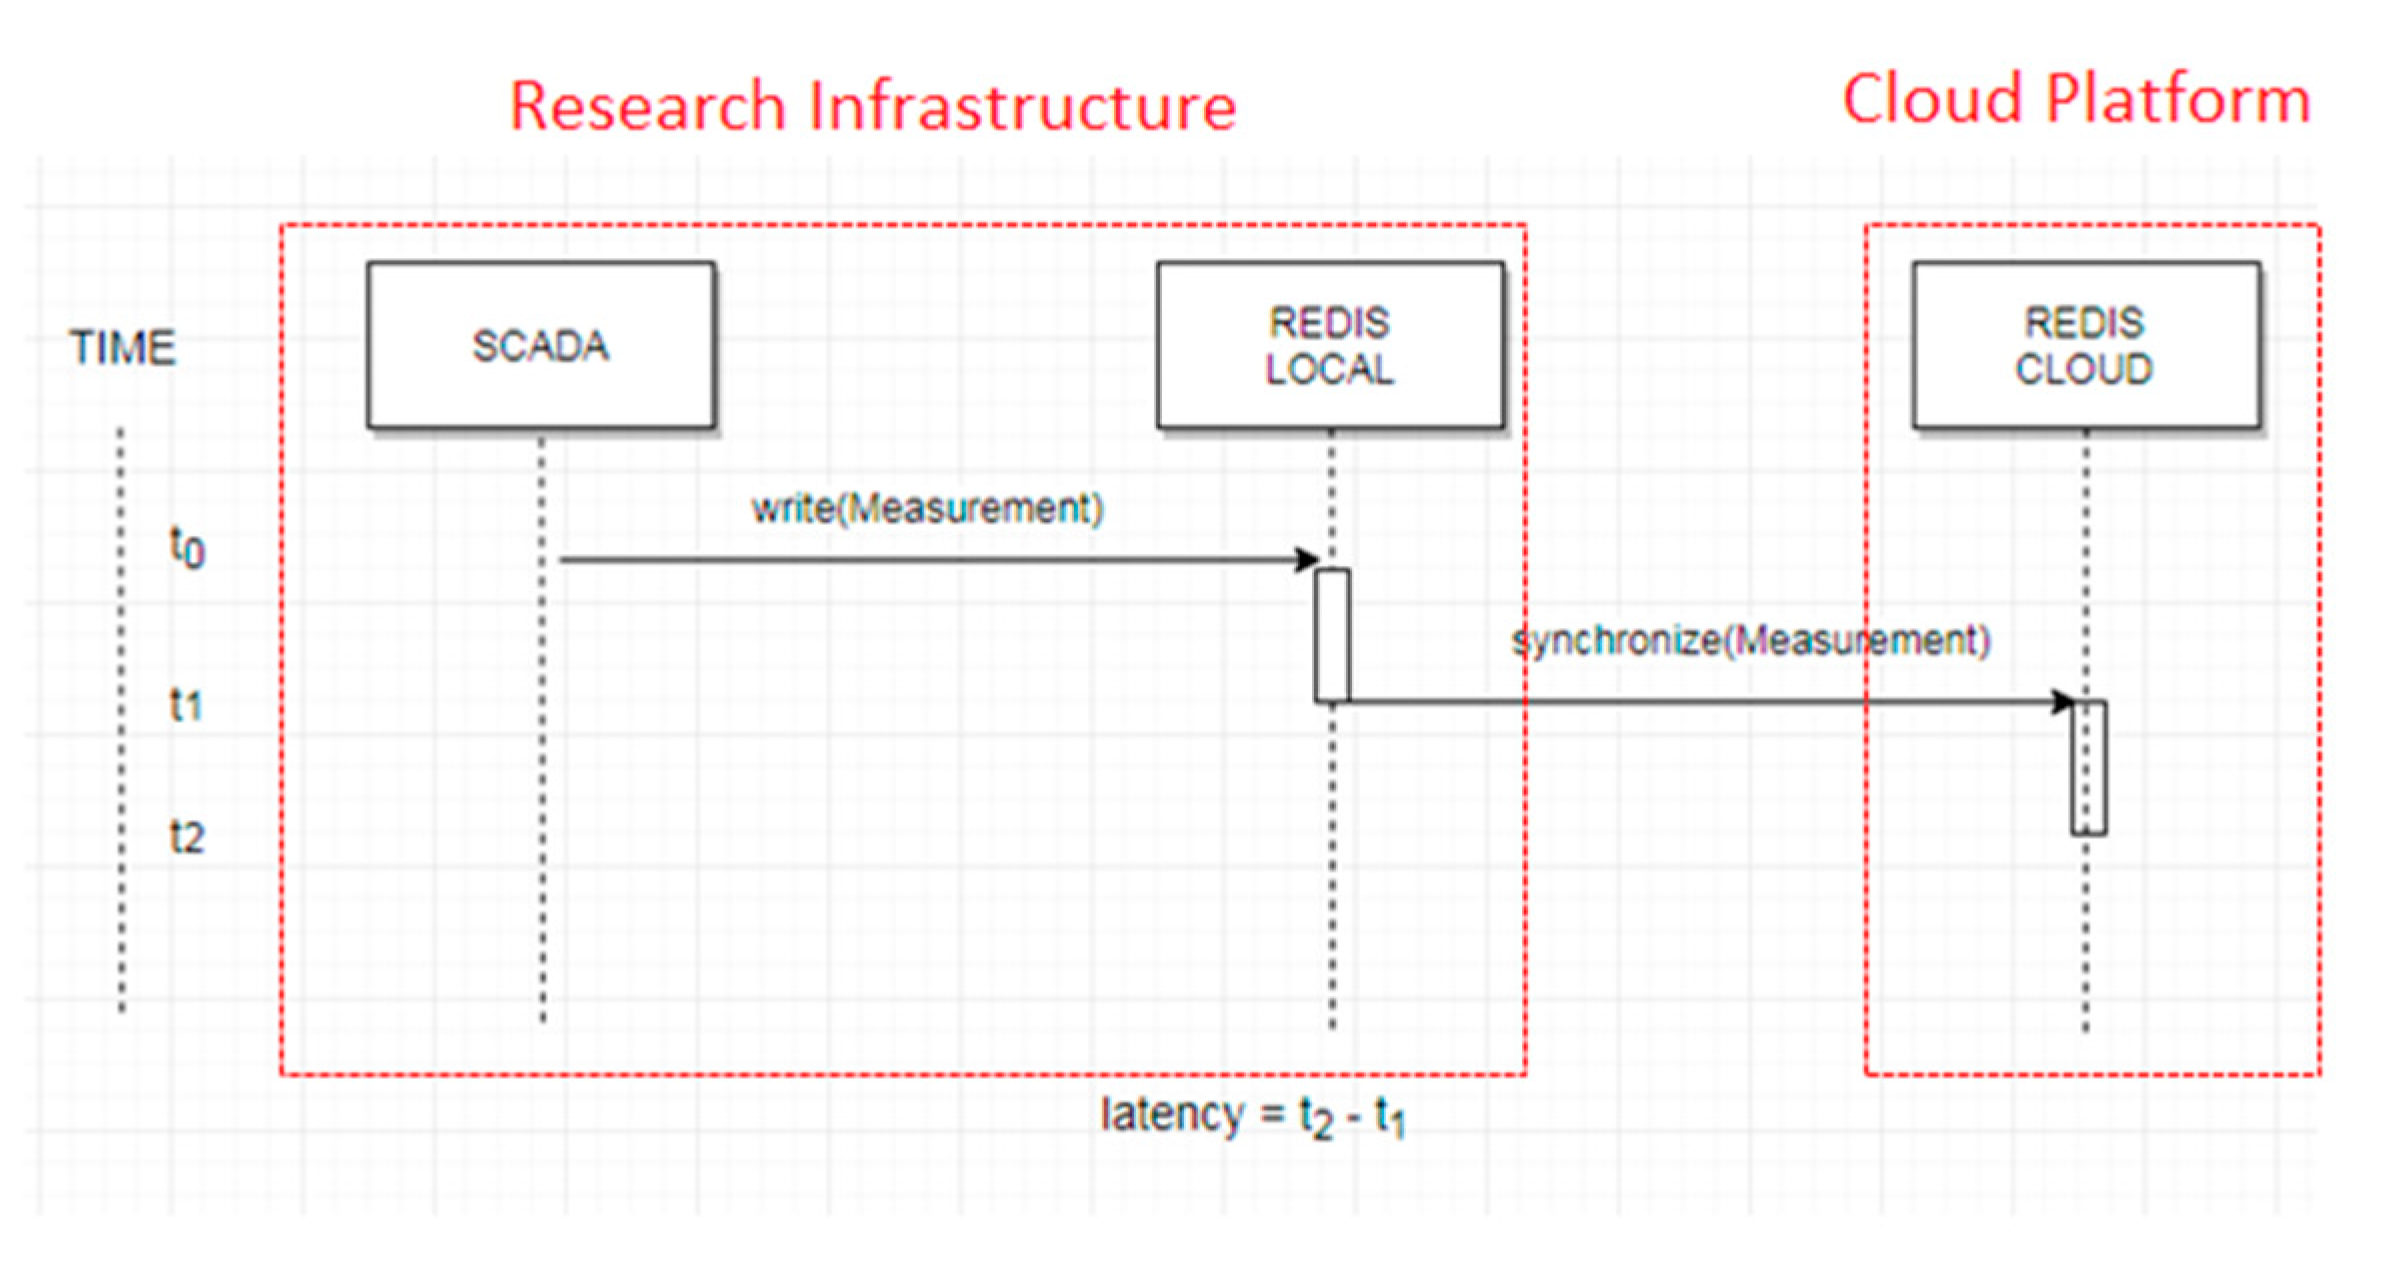
The layer considered for this test is JaNDER Level 0. Figure 5 shows the conceptual model of this test. It aims to measure the time required for the data synchronization from an RI to the Cloud Platform: . In practice this time should be similar to the latency value of a public network such as the Internet. Since the Internet is not a deterministic network and does not present Quality of Service (QoS), but it is based on best-effort service, obviously the results must always consider this characteristic of the Internet, so it means that sometimes the measured latency may contain outliers with very high values (also in the order of tens of seconds).
Every single RI, at the scheduled time, will send 1000 times a group of measurements. The test is repeated for four times with groups of 1, 10, 100, and 1000 measurements every time. The tests have been executed for a week, in slots of 30 min from 09:00 to 17:00, for each single RI. As already mentioned these experiments were performed using a scheduler in such a way as to have at any moment only a laboratory connected for the tests. The test parameters for JaNDER Level 0 can be summarized as follows:
- Target measure: latency of updating data on cloud platform;
- N° of measurements: 1, 10, 100, and 1000 repetitions for every single test (one hour per day for each RI);
- The synchronization between the machines is obtained using NTP.
For this type of test, a lot of data was collected—16 tests a day, four for every partners for four number of measurements. Every test consists of 1000 repetitions, for a total of 16,000 single repetitions for day. This was possible thanks to the automatic script system. Here a test summarizations (after a data cleaning):
| • n° of considered tests: | 67 |
| • n° of measurement synchronization (local to cloud): | 66,580 |
| • n° of 1 measurement sync: | 16,820 (hours 7–8) |
| • n° of 10 measurement sync: | 18,985 (hours 9–10) |
| • n° of 100 measurement sync: | 17,775 (hours 11–12) |
| • n° of 1000 measurement sync: | 13,000 (hours 13–14) |
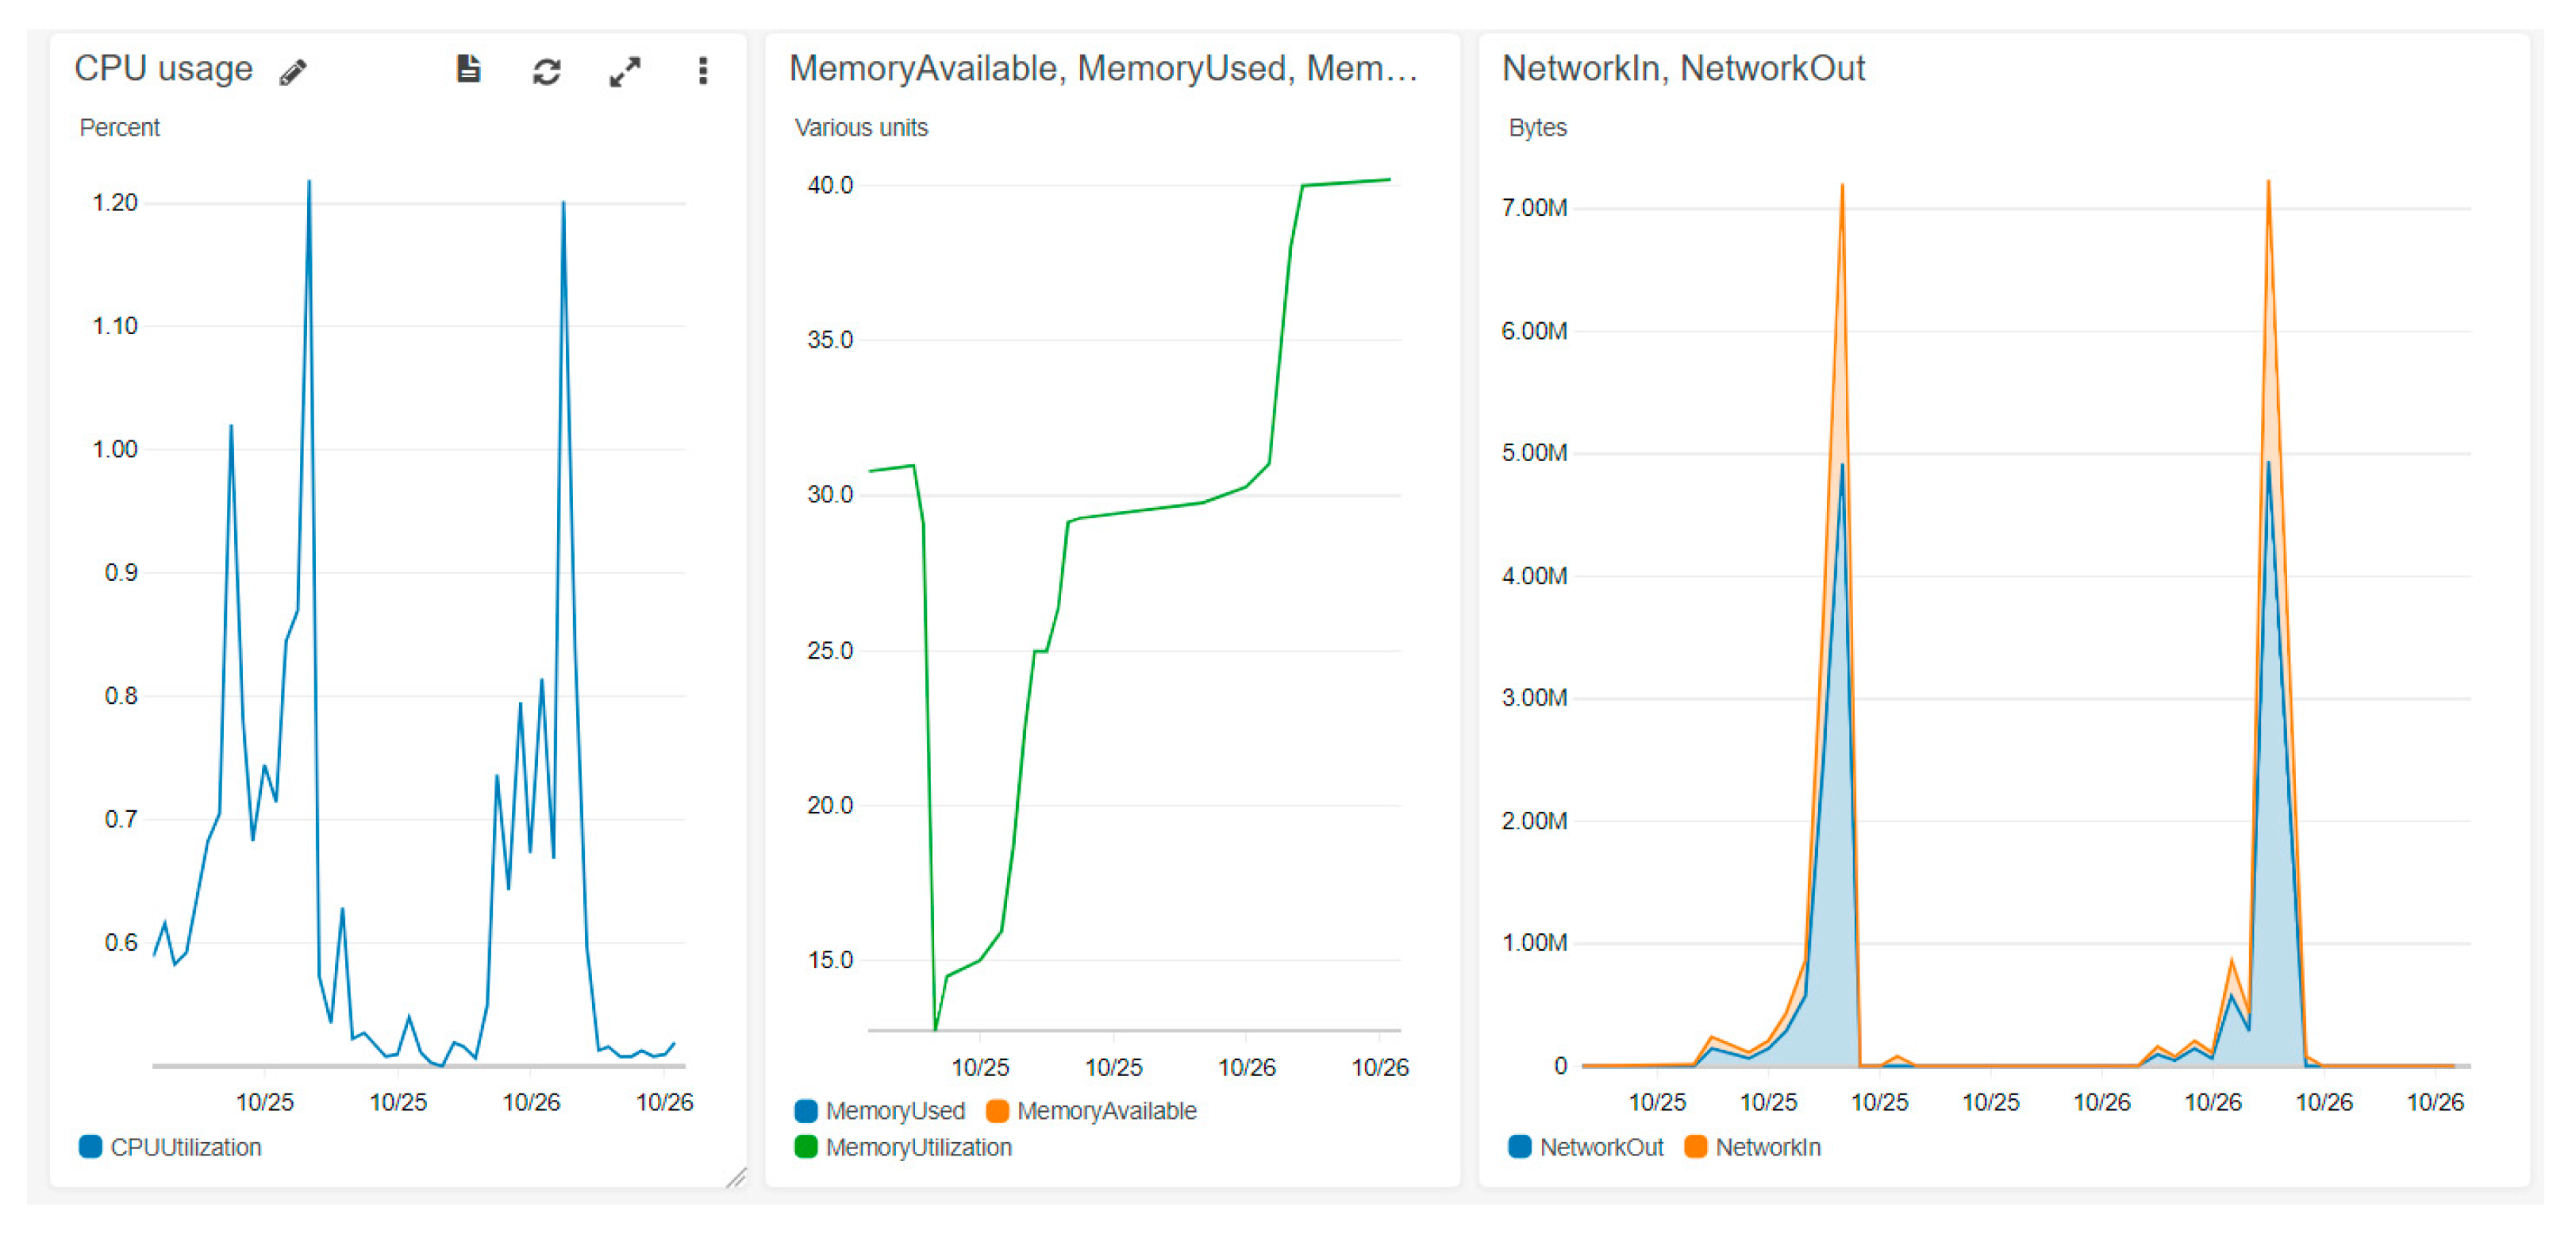
Figure 6 shows that during the test the server has no Central Processing Unit (CPU), memory, network problems (of course, there is only one active client). This means that the latency measurement is not influenced by the machine (an Amazon AWS EC2 c3.large).
4.4. Test JaNDER Level 0: Test Results
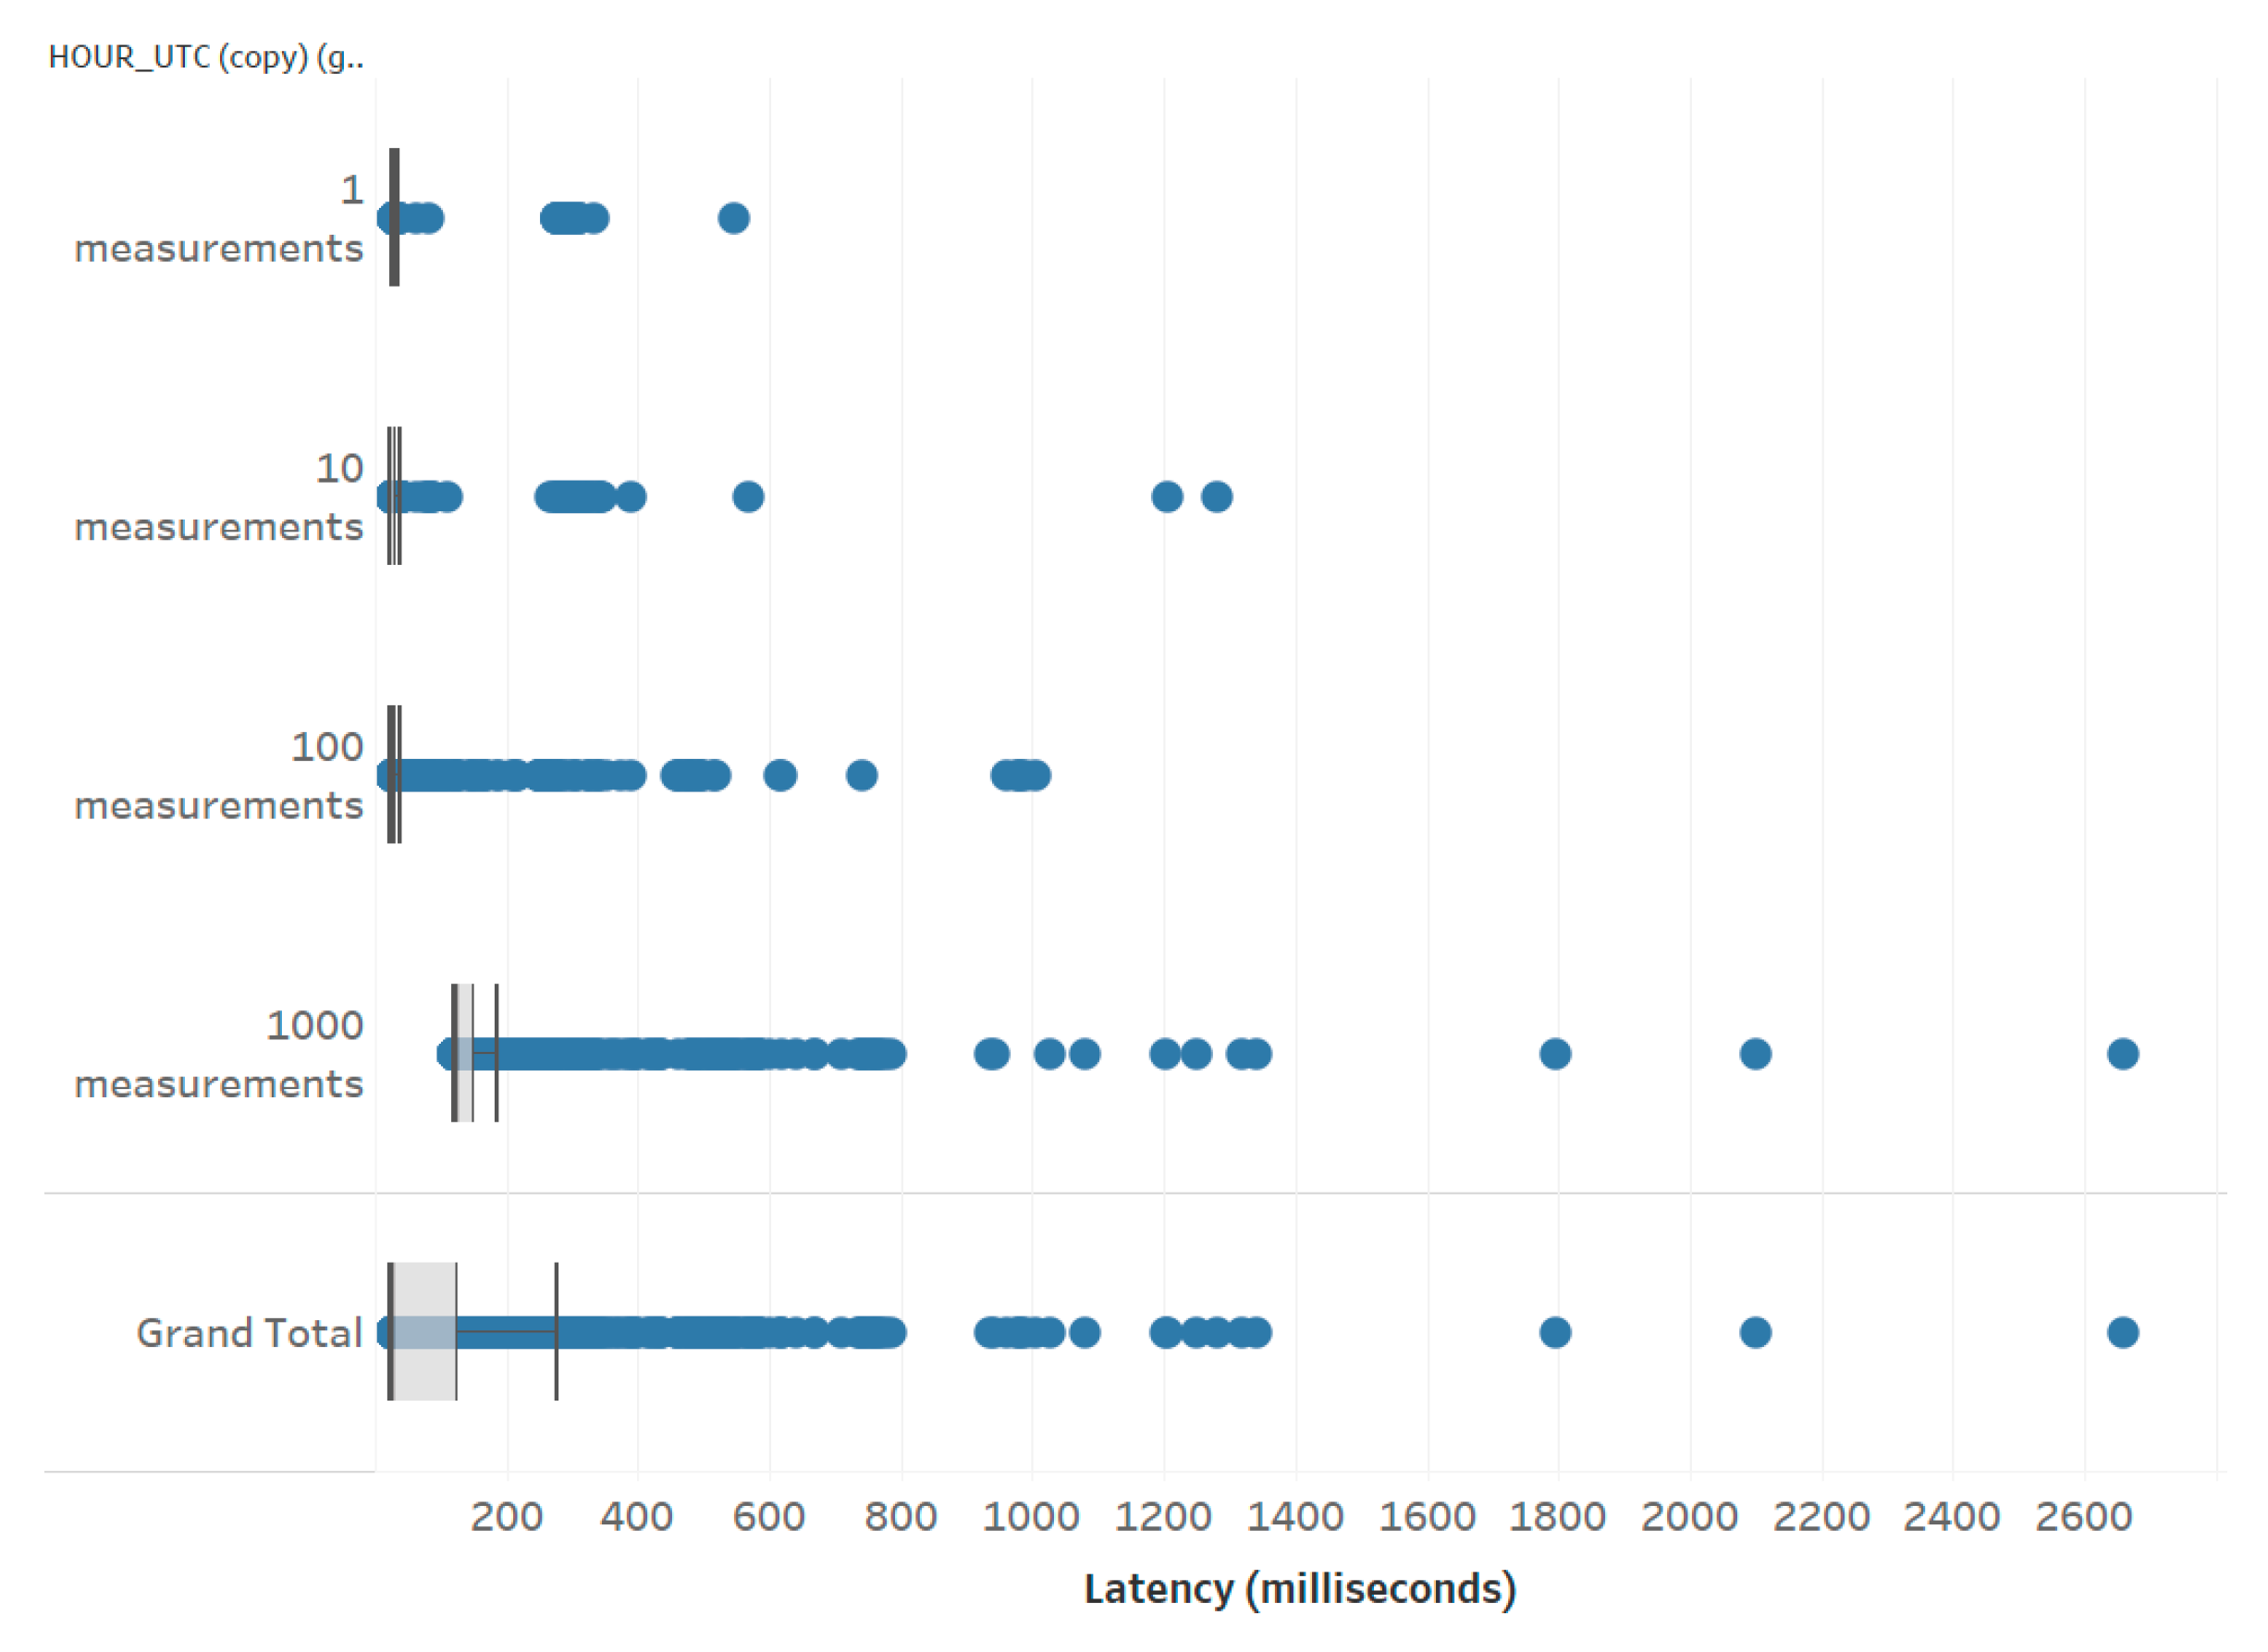
This paragraph shows some results of the JaNDER Level 0 characterization. Considering one of the RI, Figure 7, Figure 8, Figure 9 and Figure 10 show the latency as function of the number of measurements sent from the RI to the cloud for every single repetitions.
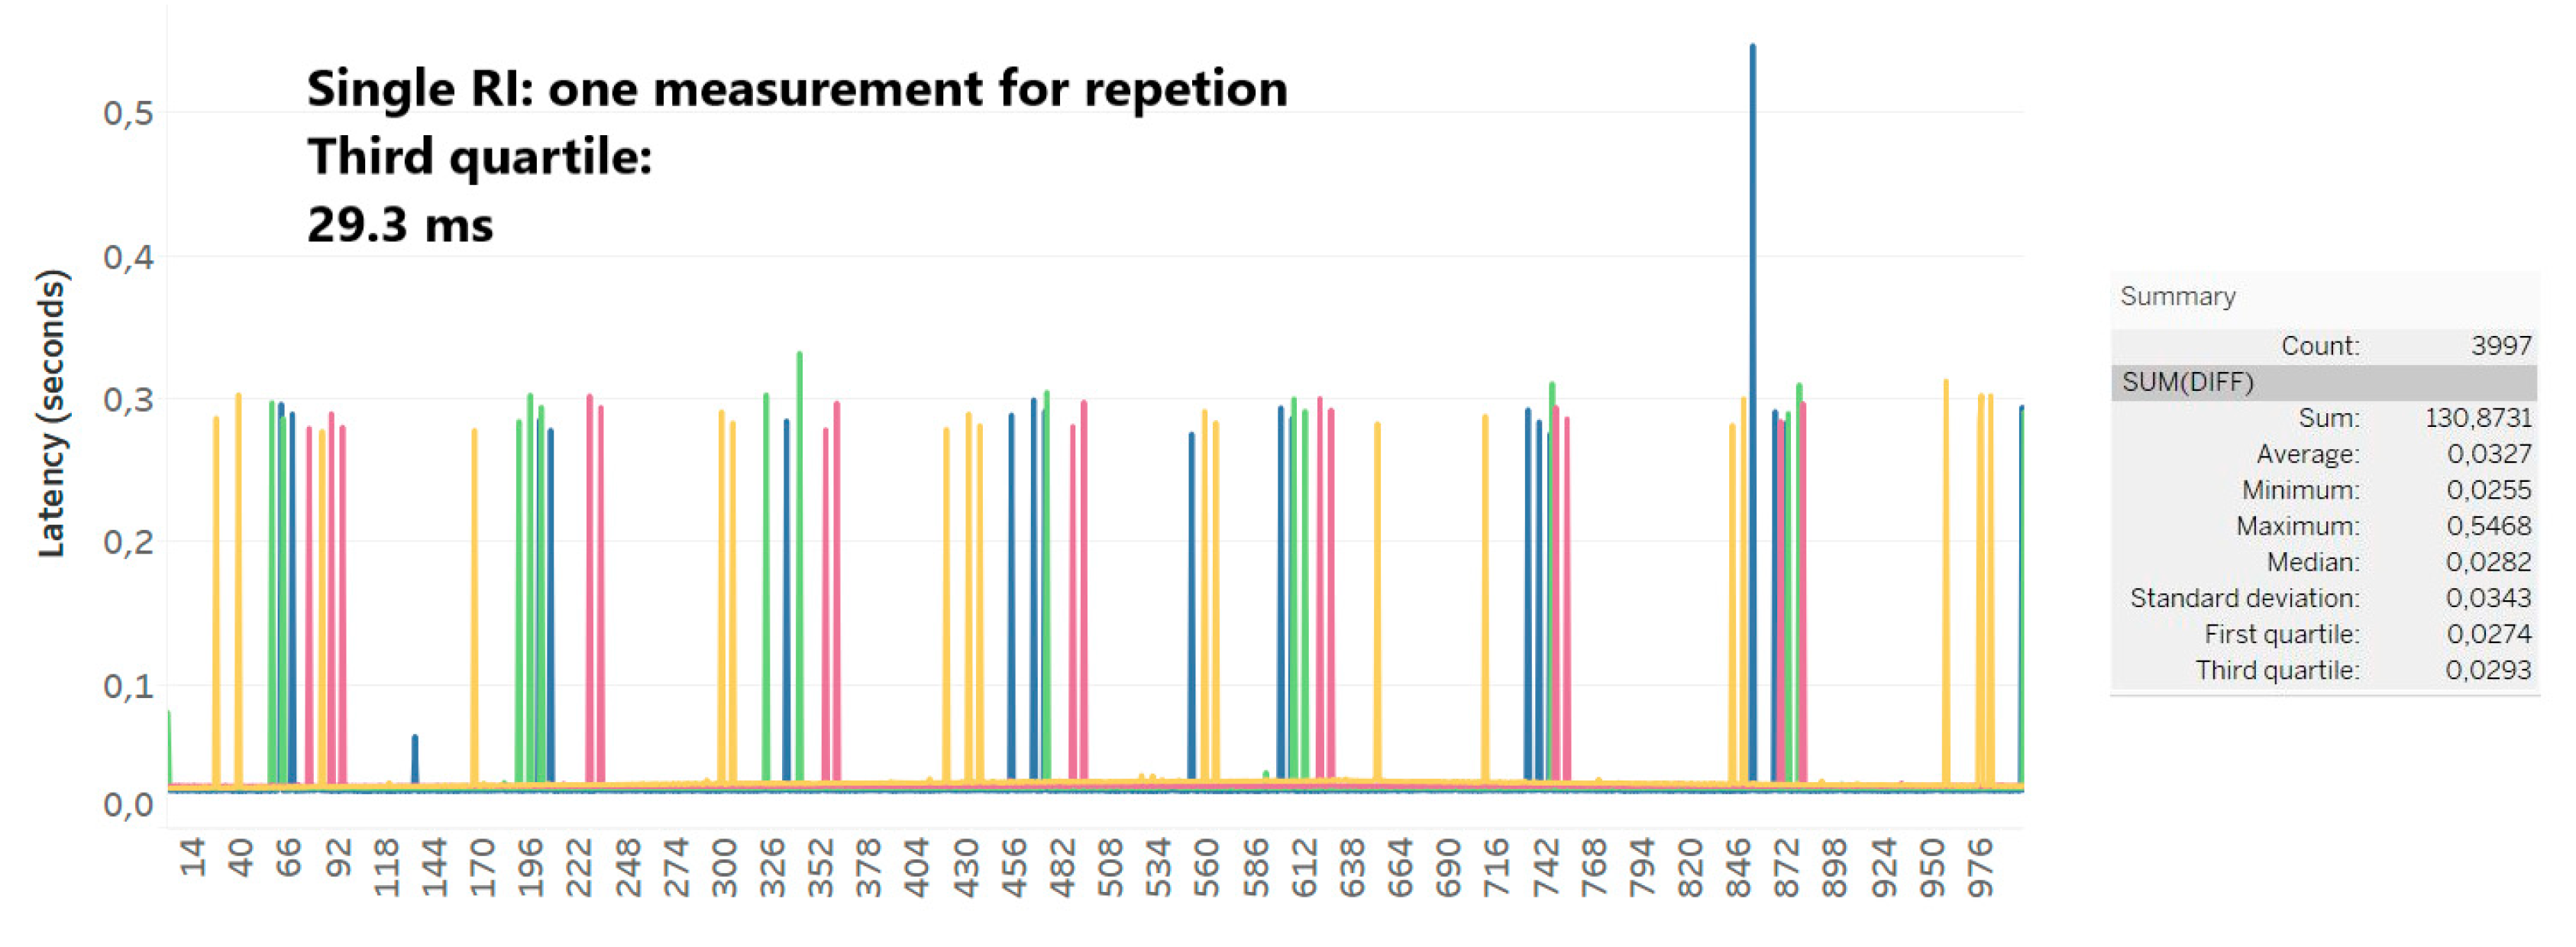
The first set of tests considers one single measurement for repetition. Figure 7 shows the results coming from tests related to a single RI for JaNDER Level 0 test.
In this case the picture on the right shows that there are 3997 measurements exchange between the RI and the cloud platform. The average latency is 32.7 ms, and the third quartile is equal to 29.3 ms.
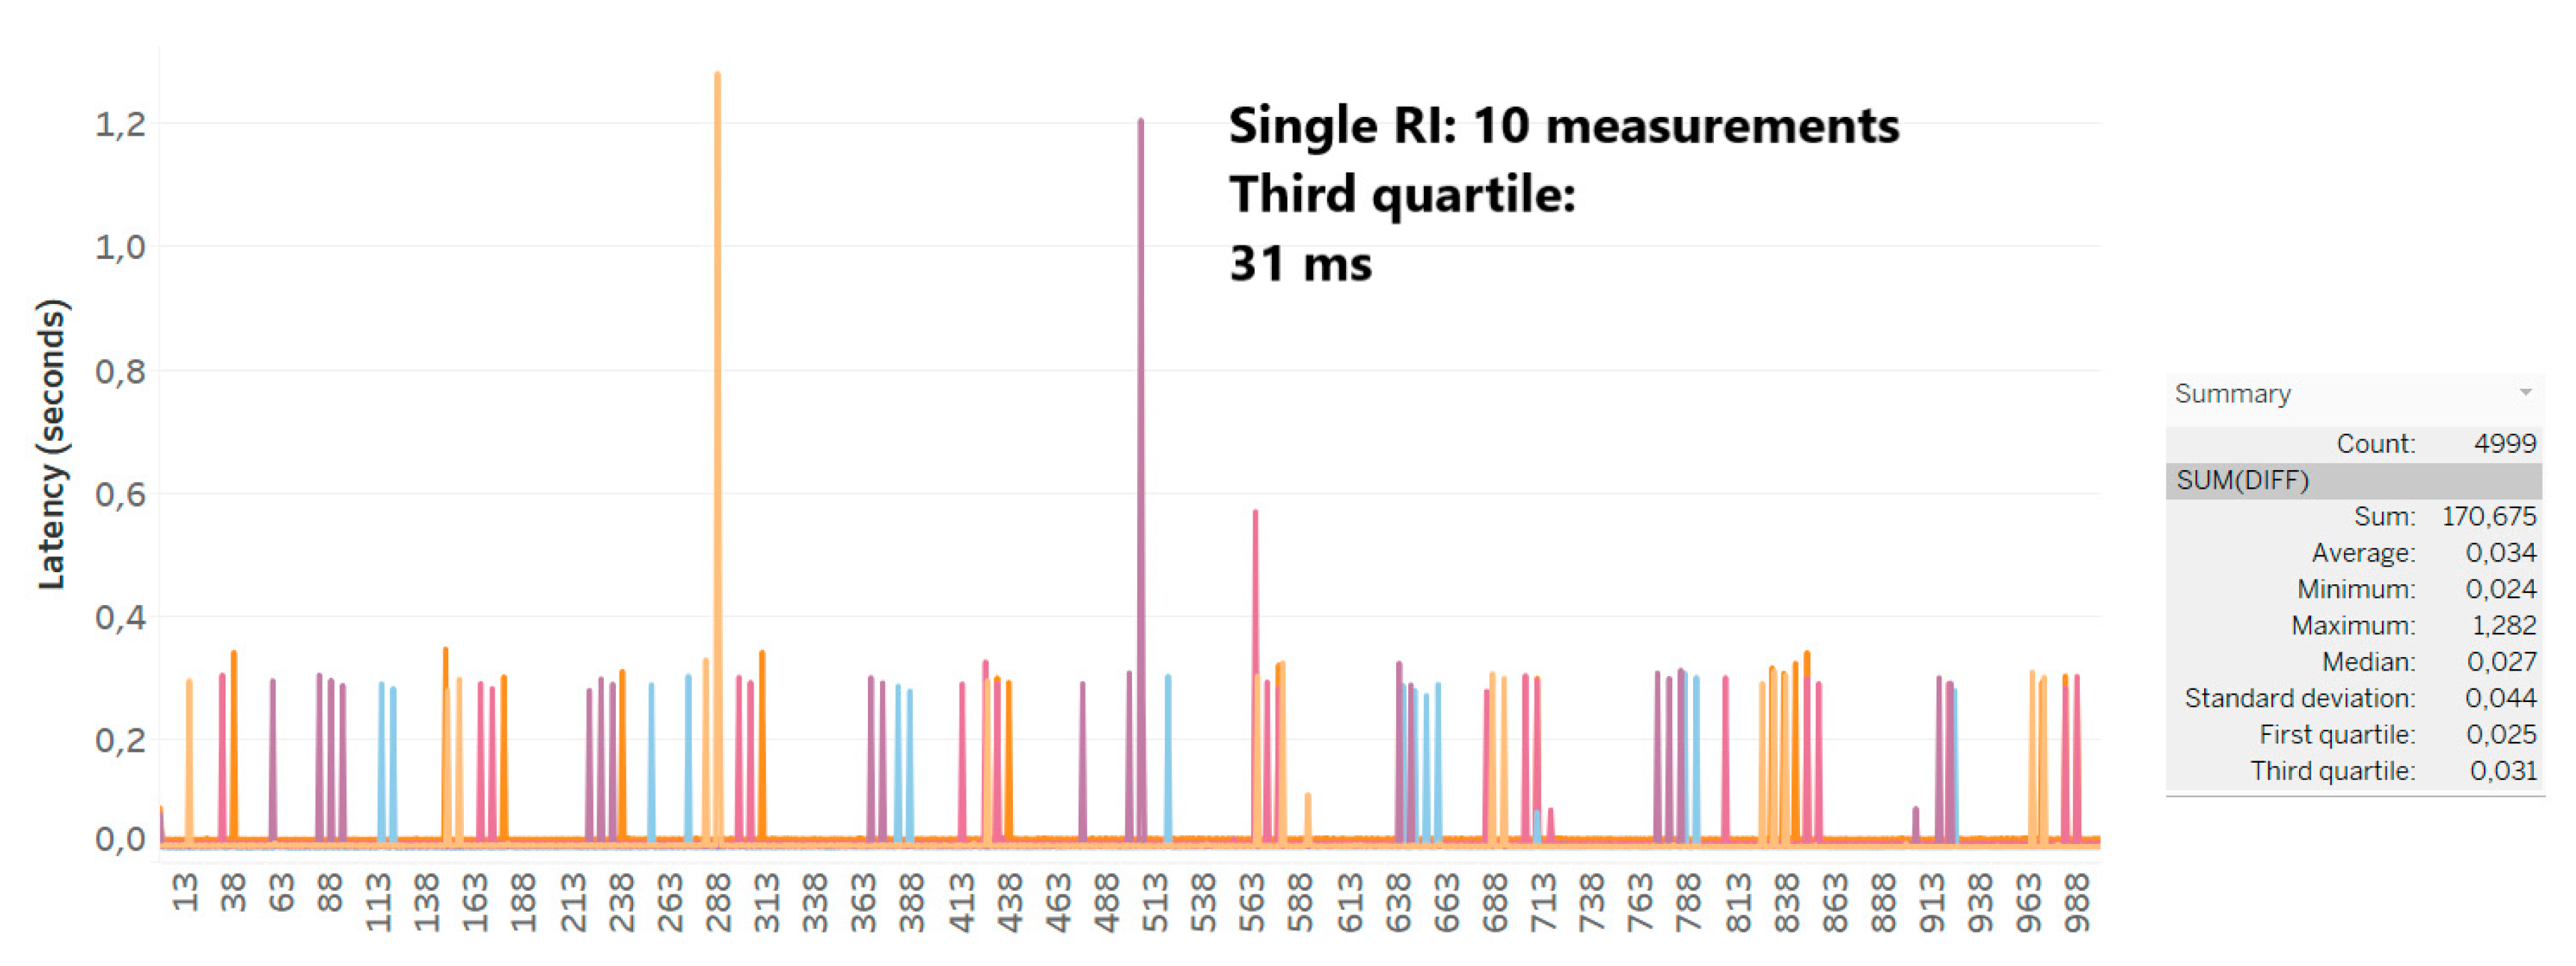
The second set of experiments considers 10 measurements for time. Figure 8 displays the results. In this case, the third quartile is equal to 31 ms.
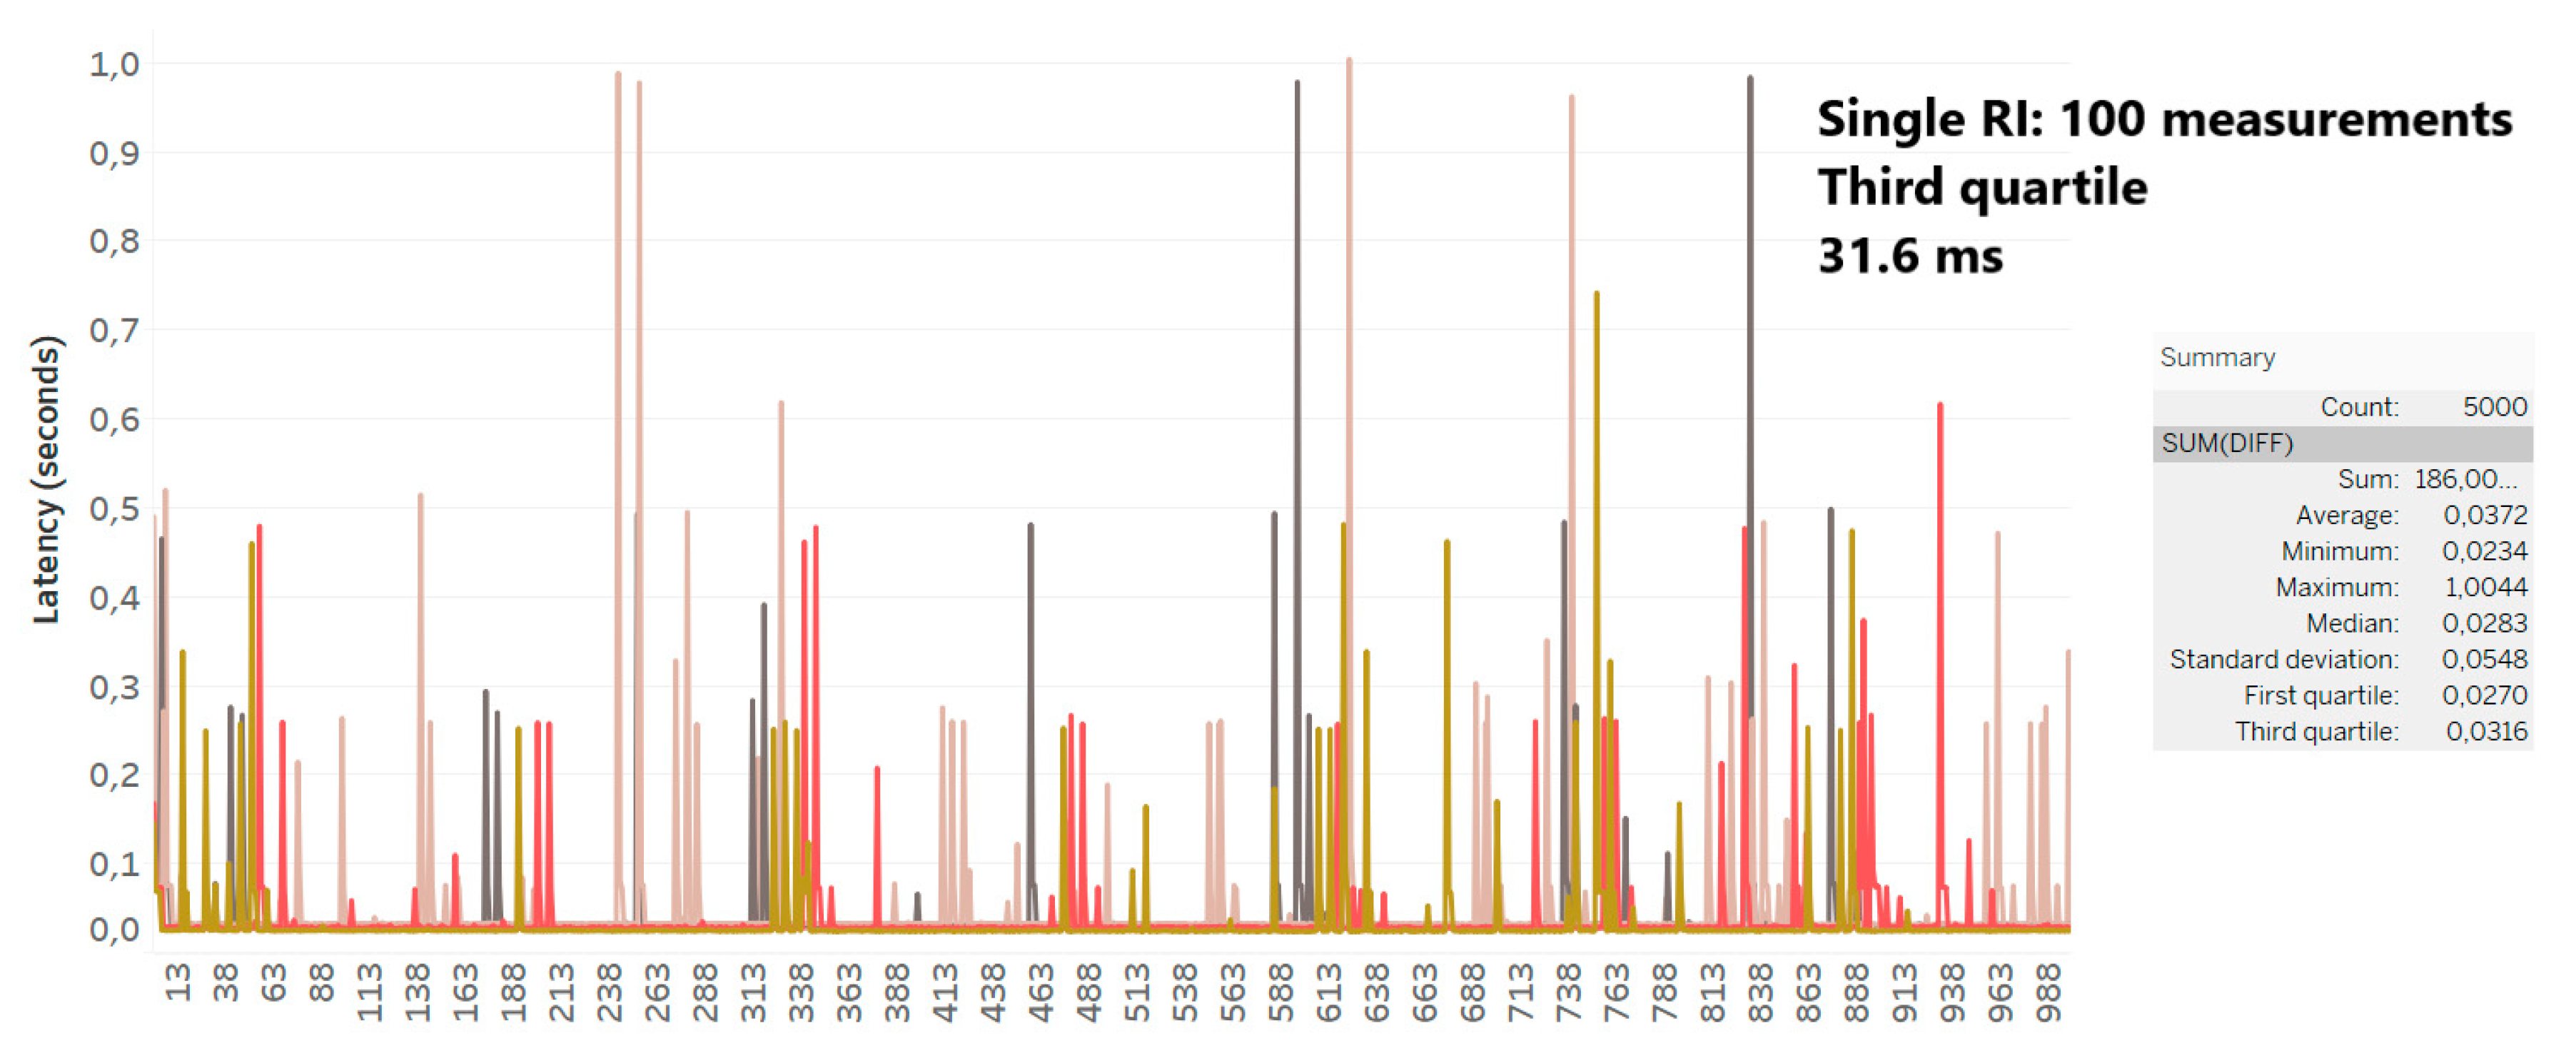
The third experiment considers 100 measurements for time. Figure 9 shows the results. The third quartile is equal to 31.6 ms. The latency is practically in line with previous tests.
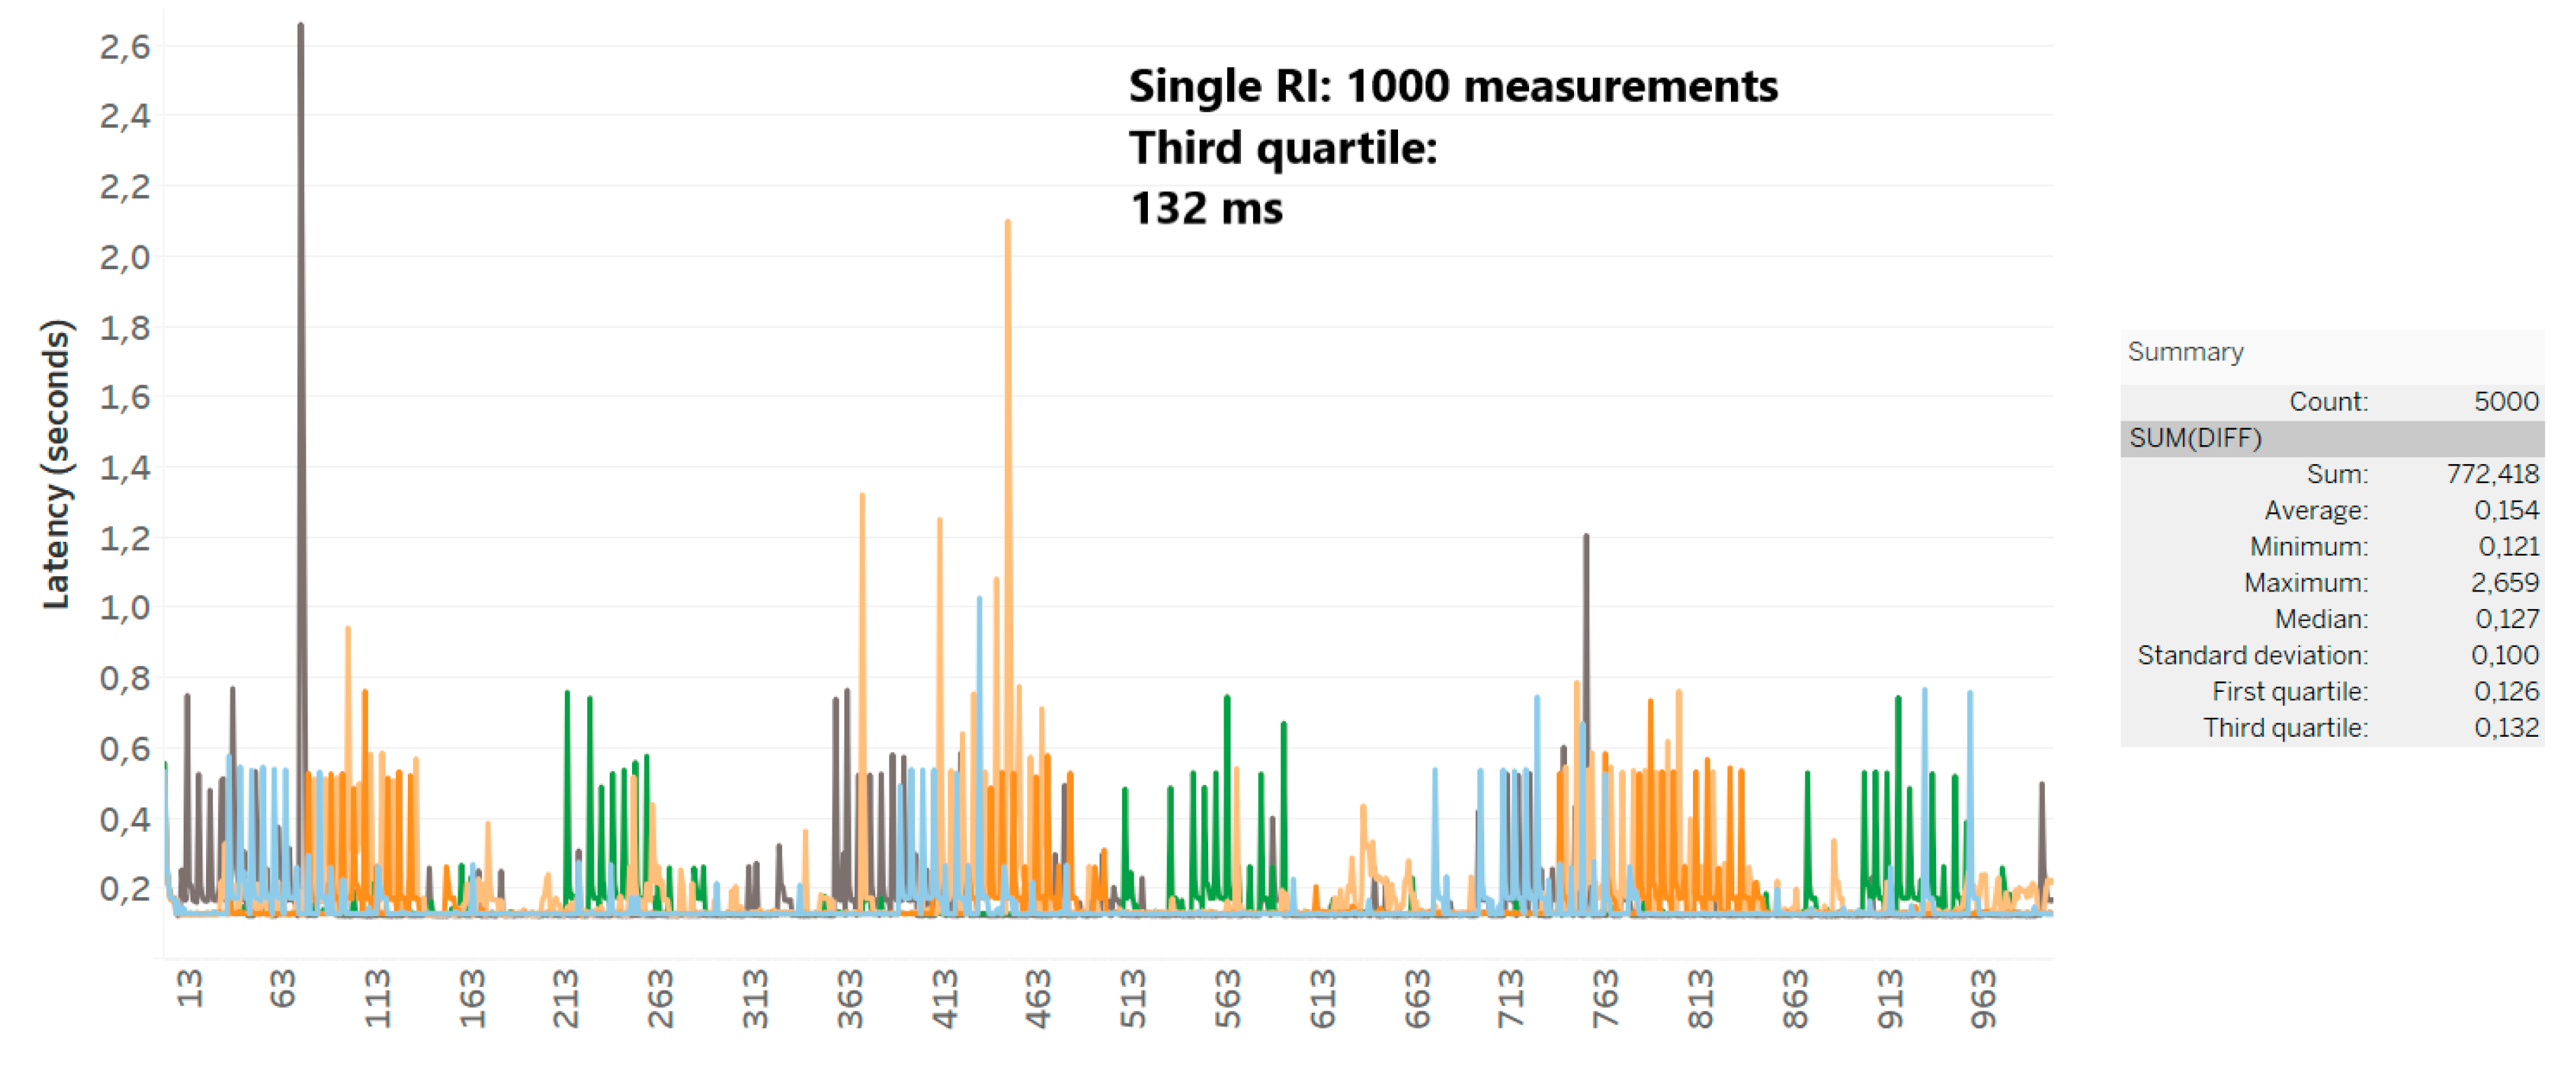
The fourth and last test is with 1000 measurements sent from the RI to the cloud platform. Figure 10 shows that the third quartile is equal to 132 ms. This means that with 1000 measurements at a time, the latency increases from about 30 ms to 130 ms.
Figure 11 presents a summary of the tests. Figure 11 compares all the tests for different number of measurements (1, 10, 100, 1000) and showing the total statistics (grand total). Blue points represent the outlier of every test. The Internet latency, and thus the JaNDER Level latency, is sometime more than one second.
The JaNDER Level 0 test results confirms that applications with time constant in the range of seconds are feasible with a number of measurements lower than 1000 measurements.
5. Example of Application: Integration of a Remote OLTC Controller
Real-time testing, using HIL techniques, can evaluate equipment performance in realistic conditions. This could lead in a decrease of their integration time while also reducing potential risks in their field deployment [14]. Components such as controllers and power equipment that are part of actual applications make the HIL setup more realistic and close to the actual conditions.
However, there might be a limitation on how many devices a research infrastructure can host, due to space limitation or due to the fact that different components probably are developed by different manufacturers. Therefore, it might be difficult to investigate if any integration issue occurs between the devices in a safe laboratory environment prior to field implementations. For example, possible issues might exist due to communication delays between the different IED’s control devices.
In this section the adequacy of JaNDER platform to serve as the interface between equipment located at remote RIs coupling them in the same HIL setup is investigated.
In order to illustrate that, a Coordinated Voltage Controller, which aims to reduce voltage deviations utilizing different inverters and an On Load Tap Changer (OLTC) located in a Low Voltage (LV) benchmark grid, will be tested in a Control Hardware in the Loop (CHIL) setup. At the same time, it will utilize JaNDER to interact with an actual OLTC controller located in a remote infrastructure.
Finally, in actual field implementations, an interface with an industrial communication protocol is established between a centralized controller and remote IEDs. Therefore, using the JaNDER Level 1 platform, which integrates different components located in remote infrastructures with the industrial protocol IEC 61850, a more realistic environment can be achieved.
5.1. Test Description
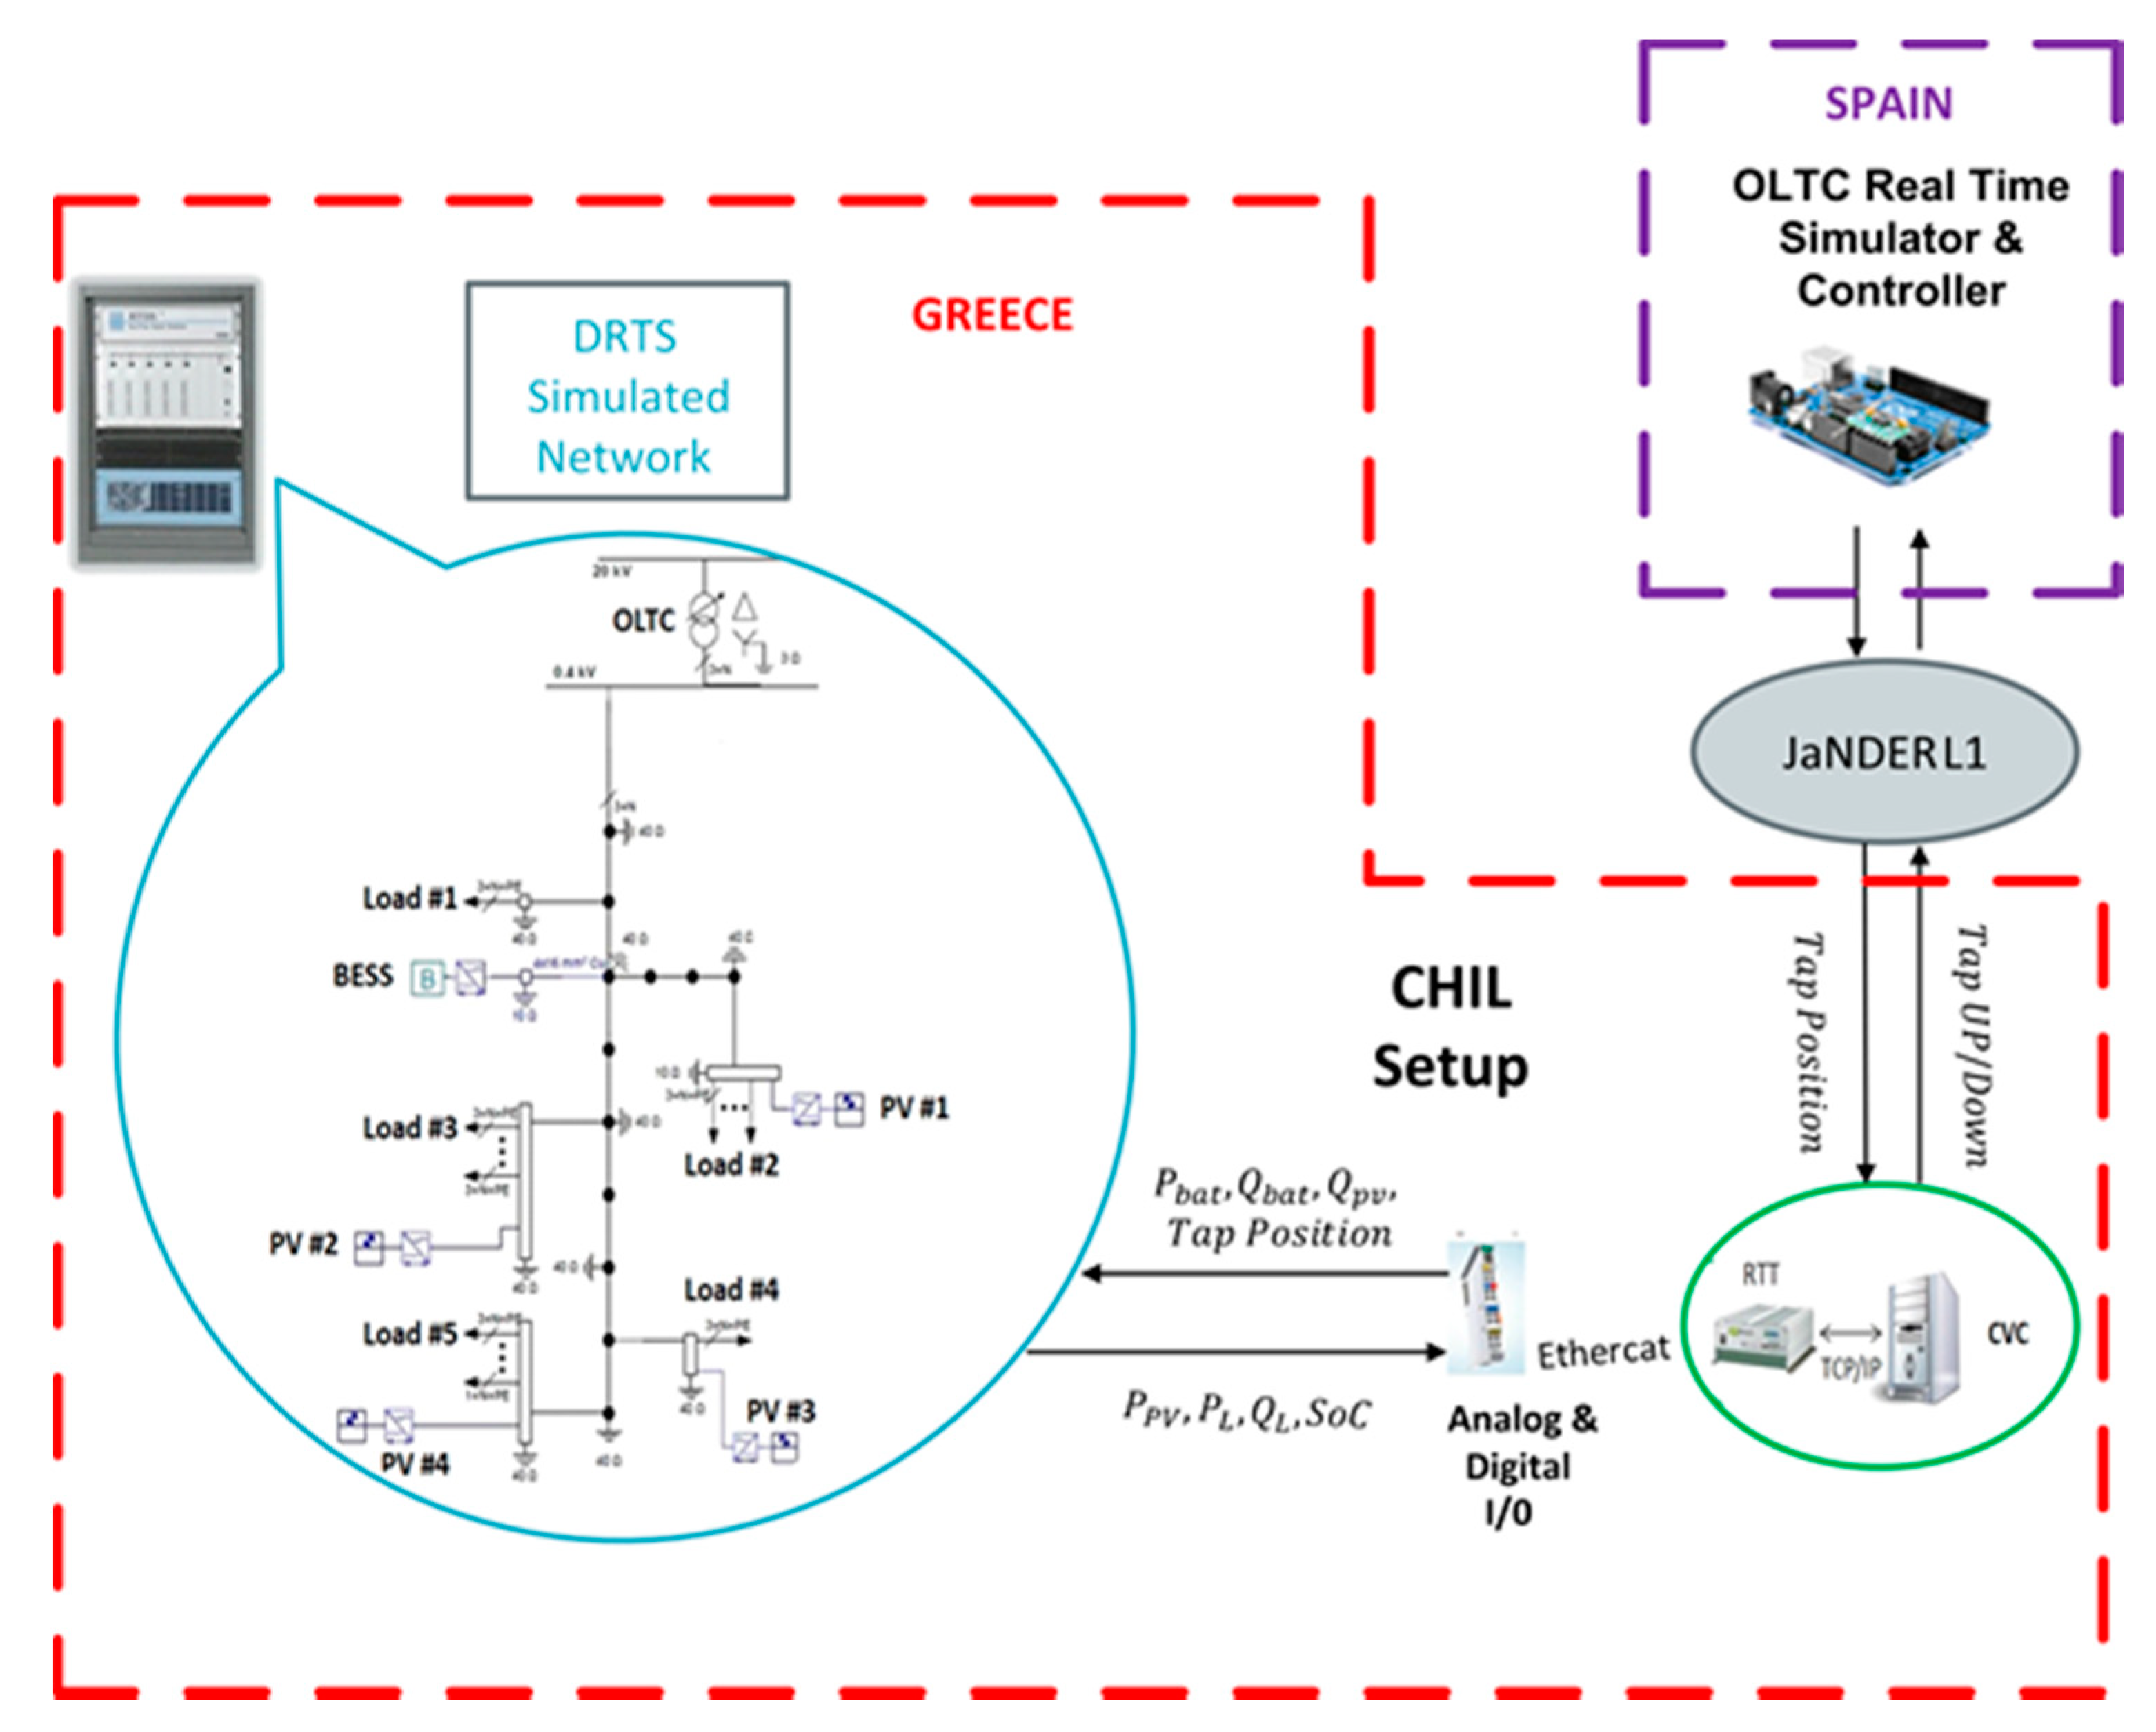
In the aforementioned setup, a centralized voltage controller (CVC) operates in the premises of Electrical Energy Systems Laboratory (EESL) of the National Technical University of Athens (NTUA). The aim of this controller is to minimize the voltage deviations, power losses and the required OLTC operations [14]. In order to do that, the CVC receives measurements such as the load demand, the PVs’ production, the batteries state of charge (SoC), and the OLTC’s tap position. Then, an optimization problem is solved providing the required setpoints for the PV and battery inverters as well as the OLTC’s required tap changes in order to achieve the aforementioned goals. The aim of this optimization is to minimize the voltage deviation from the nominal value while at the same time to ensure that the power losses are not increased considerably, due to the additional reactive power injection, and the OLTC operations are restricted to avoid its wear. This optimization problem is solved with a commercial solver that is able to find a local minimum for non-linear problems. The timestep of each iteration is around 1 min [8].
In this setup, a DRTS located in the EESL, is the backbone of a CHIL setup. Under this setup, the centralized controller can receive and send measurements in real-time. Therefore, both its behavior and its impact on the power system can be investigated under realistic conditions. In the DRTS, the LV Cigre benchmark network is simulated in a similar way to previous works [14,15]. The main goal of the test-case described in this work is to demonstrate the ability of JaNDER to further enhance the setup including an OLTC controller located in a remote installation. Therefore, possible interaction issues between the CVC controller located in EESL in Athens, Greece, and an OLTC controller located in the UDEX laboratory at the Ormazabal premises in Bilbao, Spain, have been investigated. It should be highlighted that the CVC controller has been integrated through the JaNDER Level 1 platform with the OLTC controller. To meet the test setup requirements, an OLTC controller emulator has been used instead of the actual transformer with the OLTC. This controller emulator includes the control of the OLTC and also serves as a real-time simulator of the whole OLTC system. This is achieved by including in the emulator the expected behavior of the OLTC hardware, such as delays in changing taps [24,25]. Therefore, through the JaNDER platform, a HIL setup is interconnected with a custom-made real-time simulator.
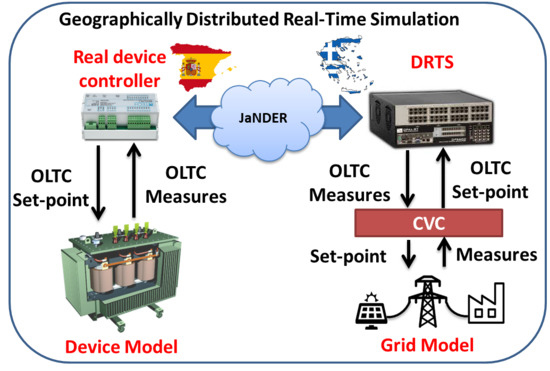
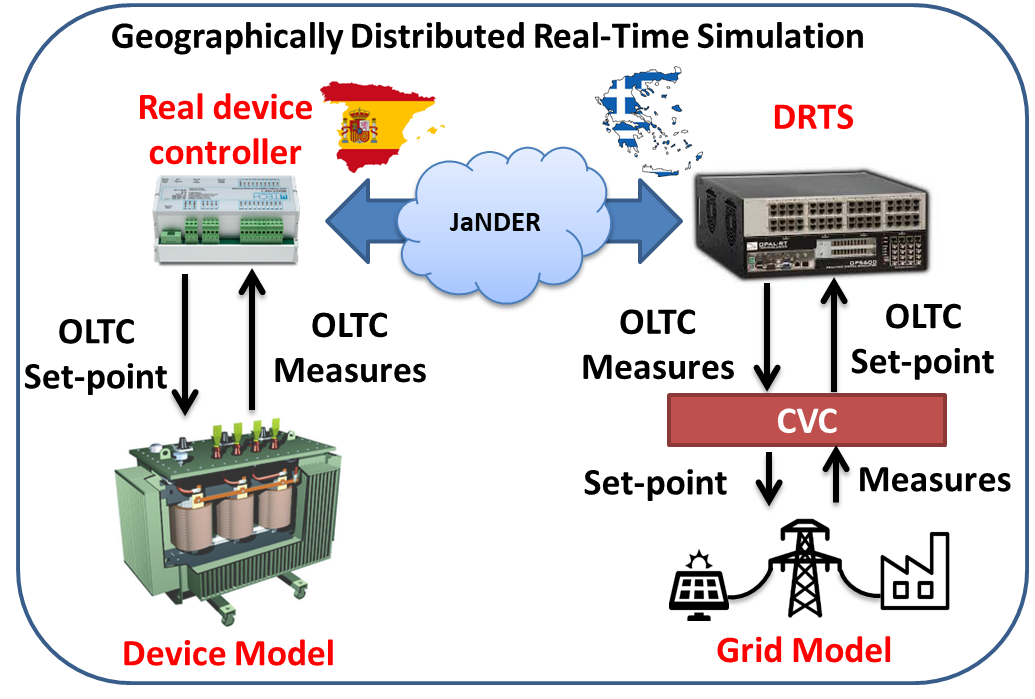
JaNDER-Level 1 was used to receive measurements (tap position) and send commands (tap changes) to the OLTC controller. Finally, the tap position measured by the OLTC controller is forced to a simulated OLTC in the DRTS at NTUA’s premises in order to include the impact of the actual OLTC’s changes to the simulated system. The described advanced setup is presented in Figure 12.
5.2. Results
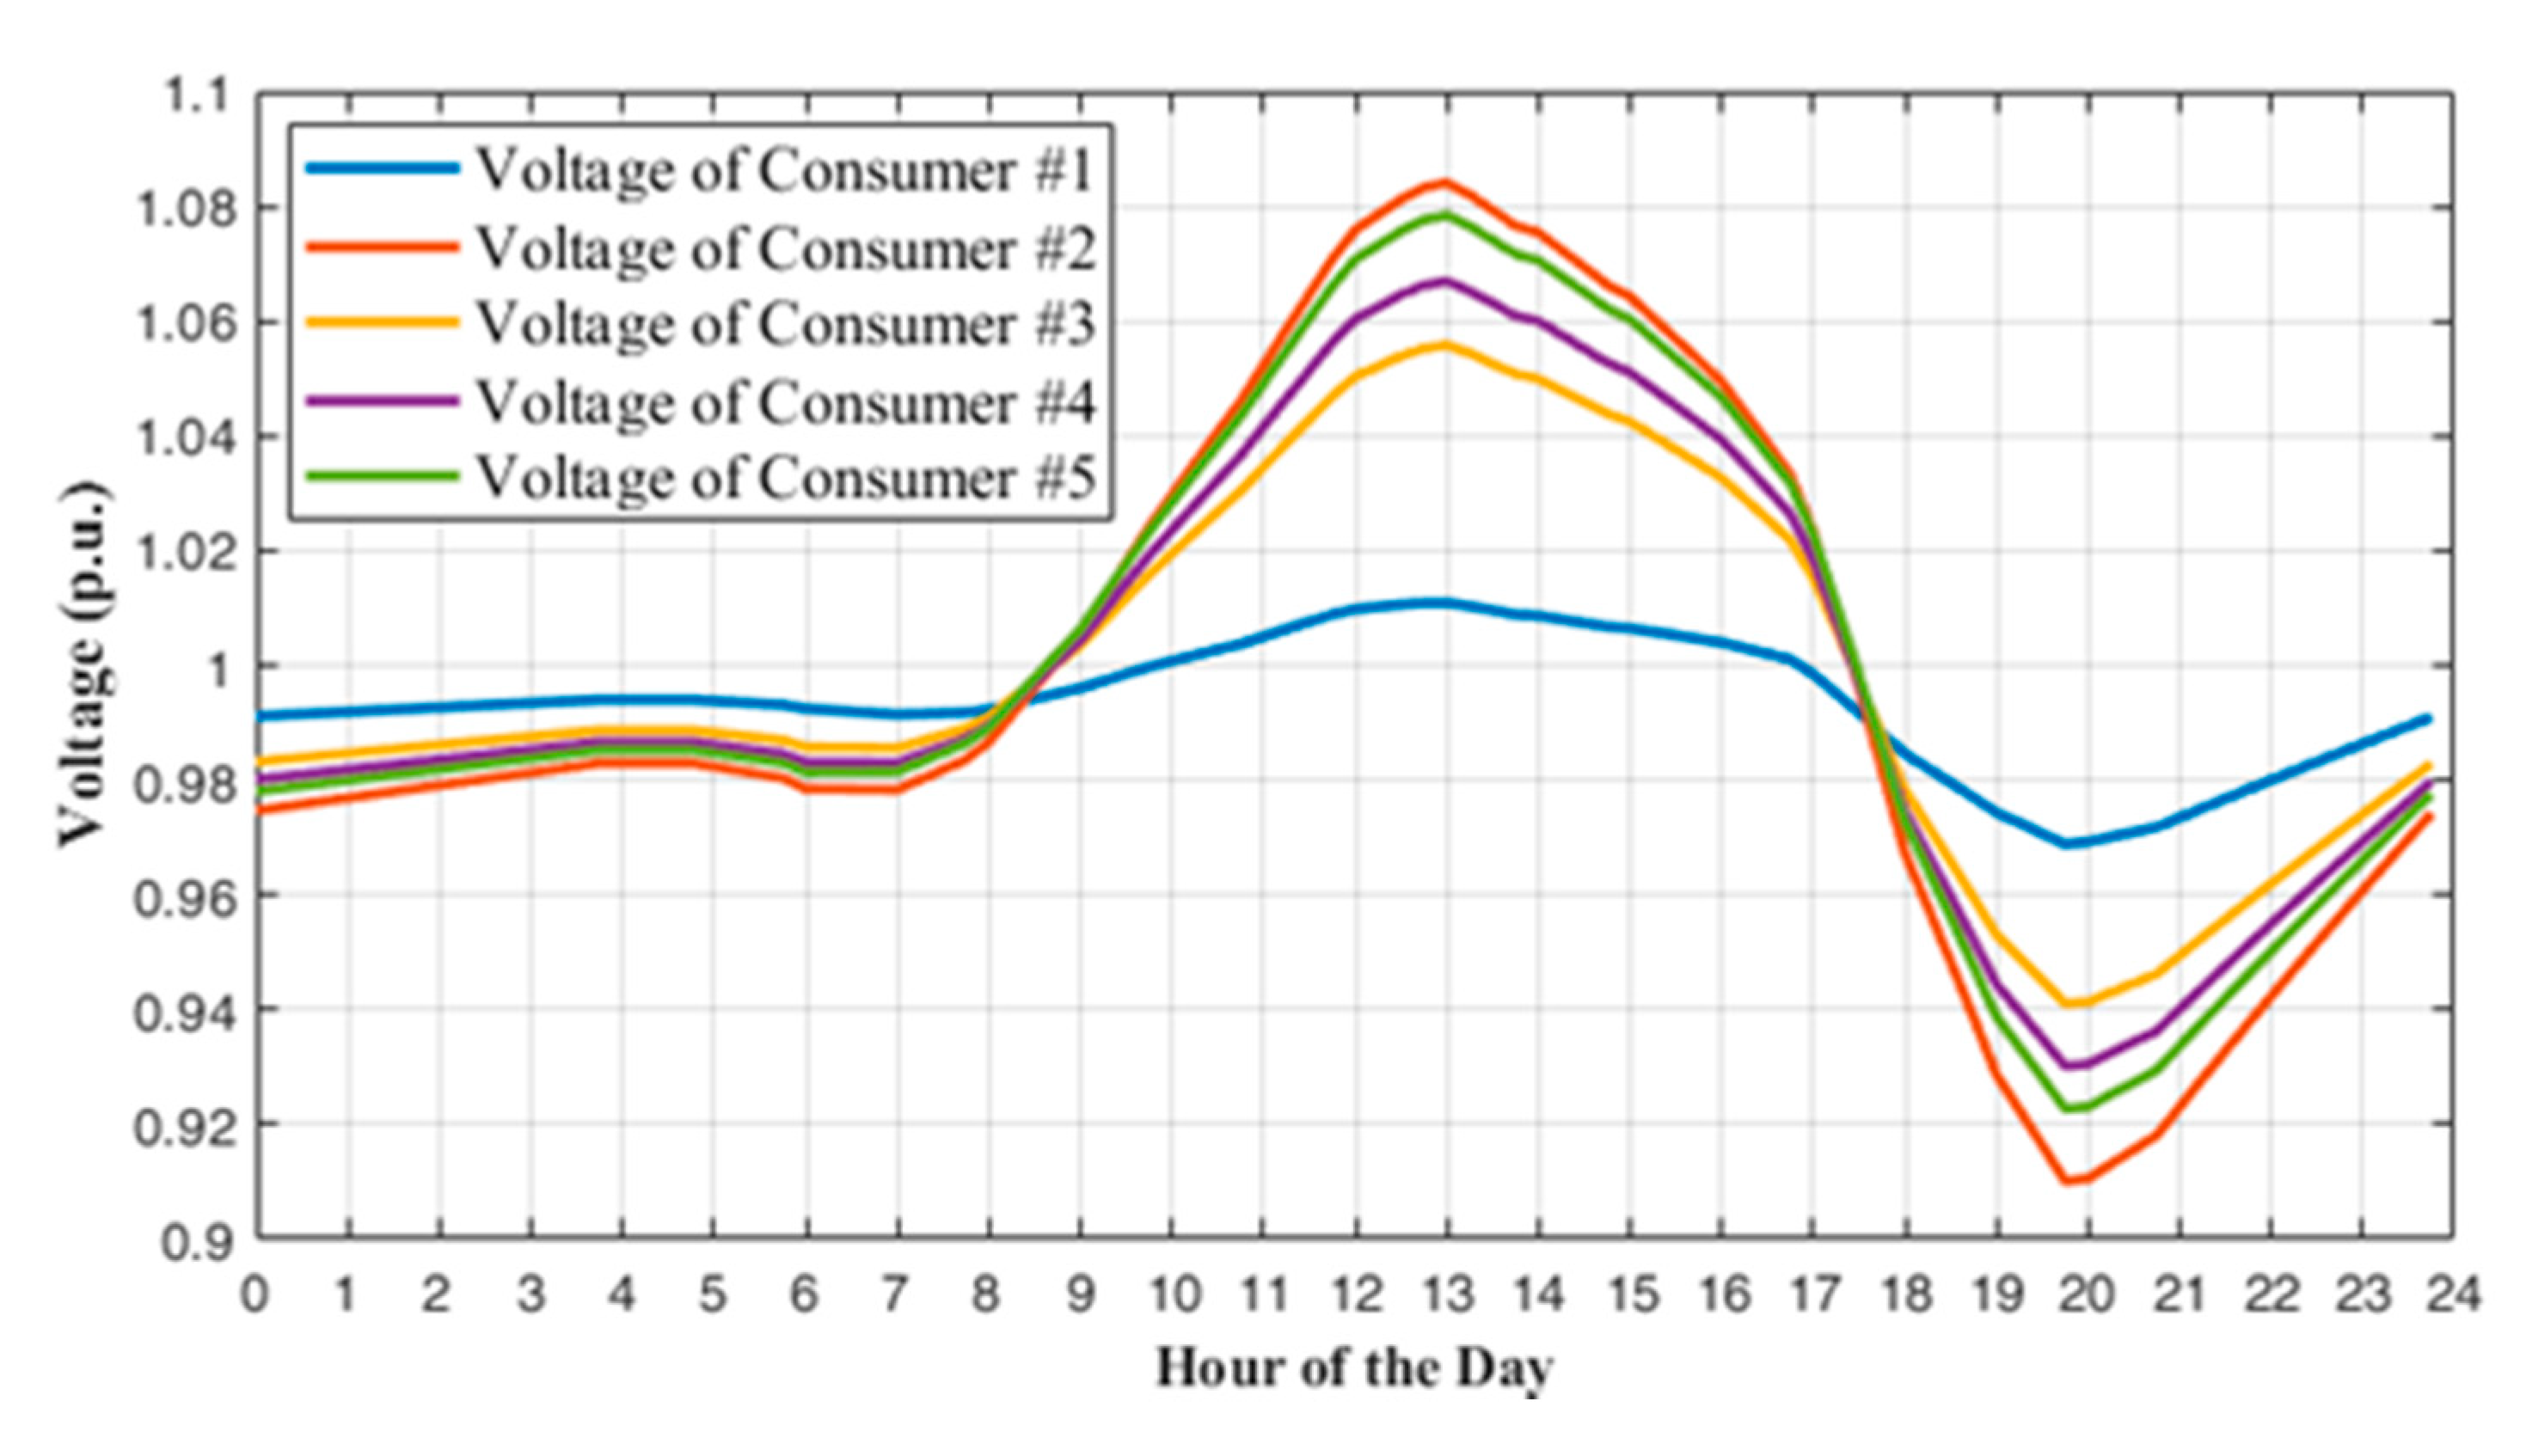
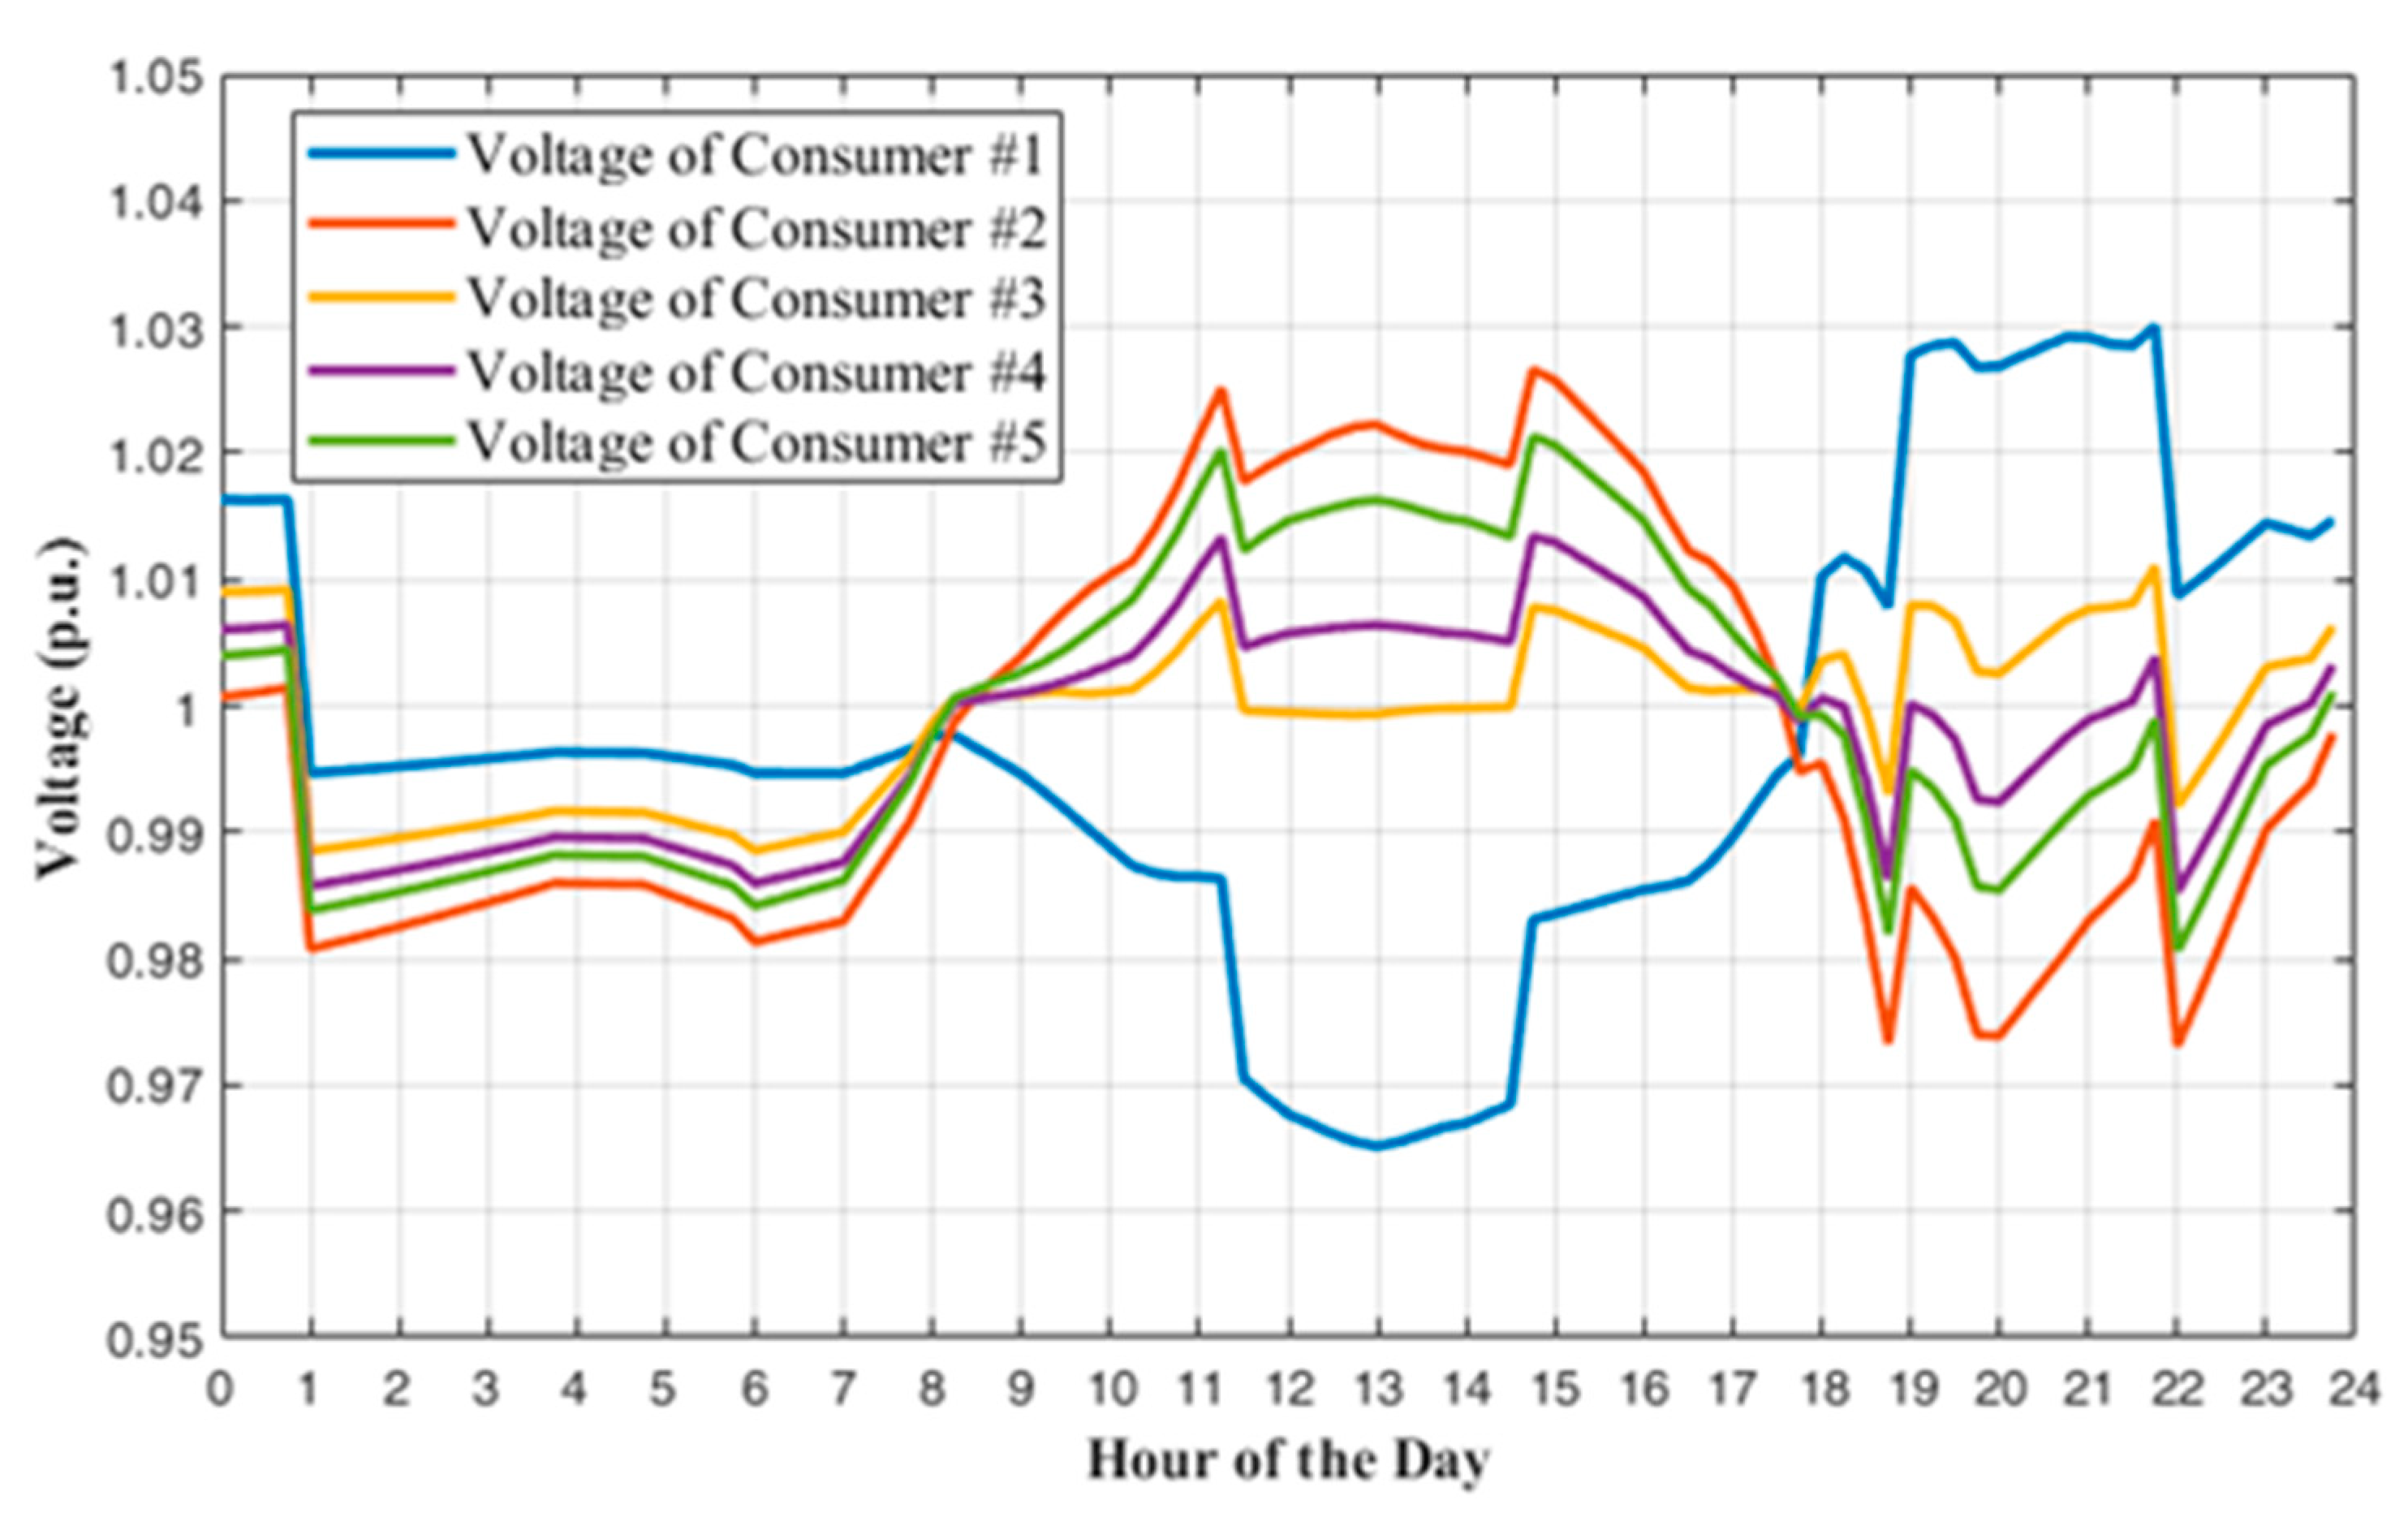
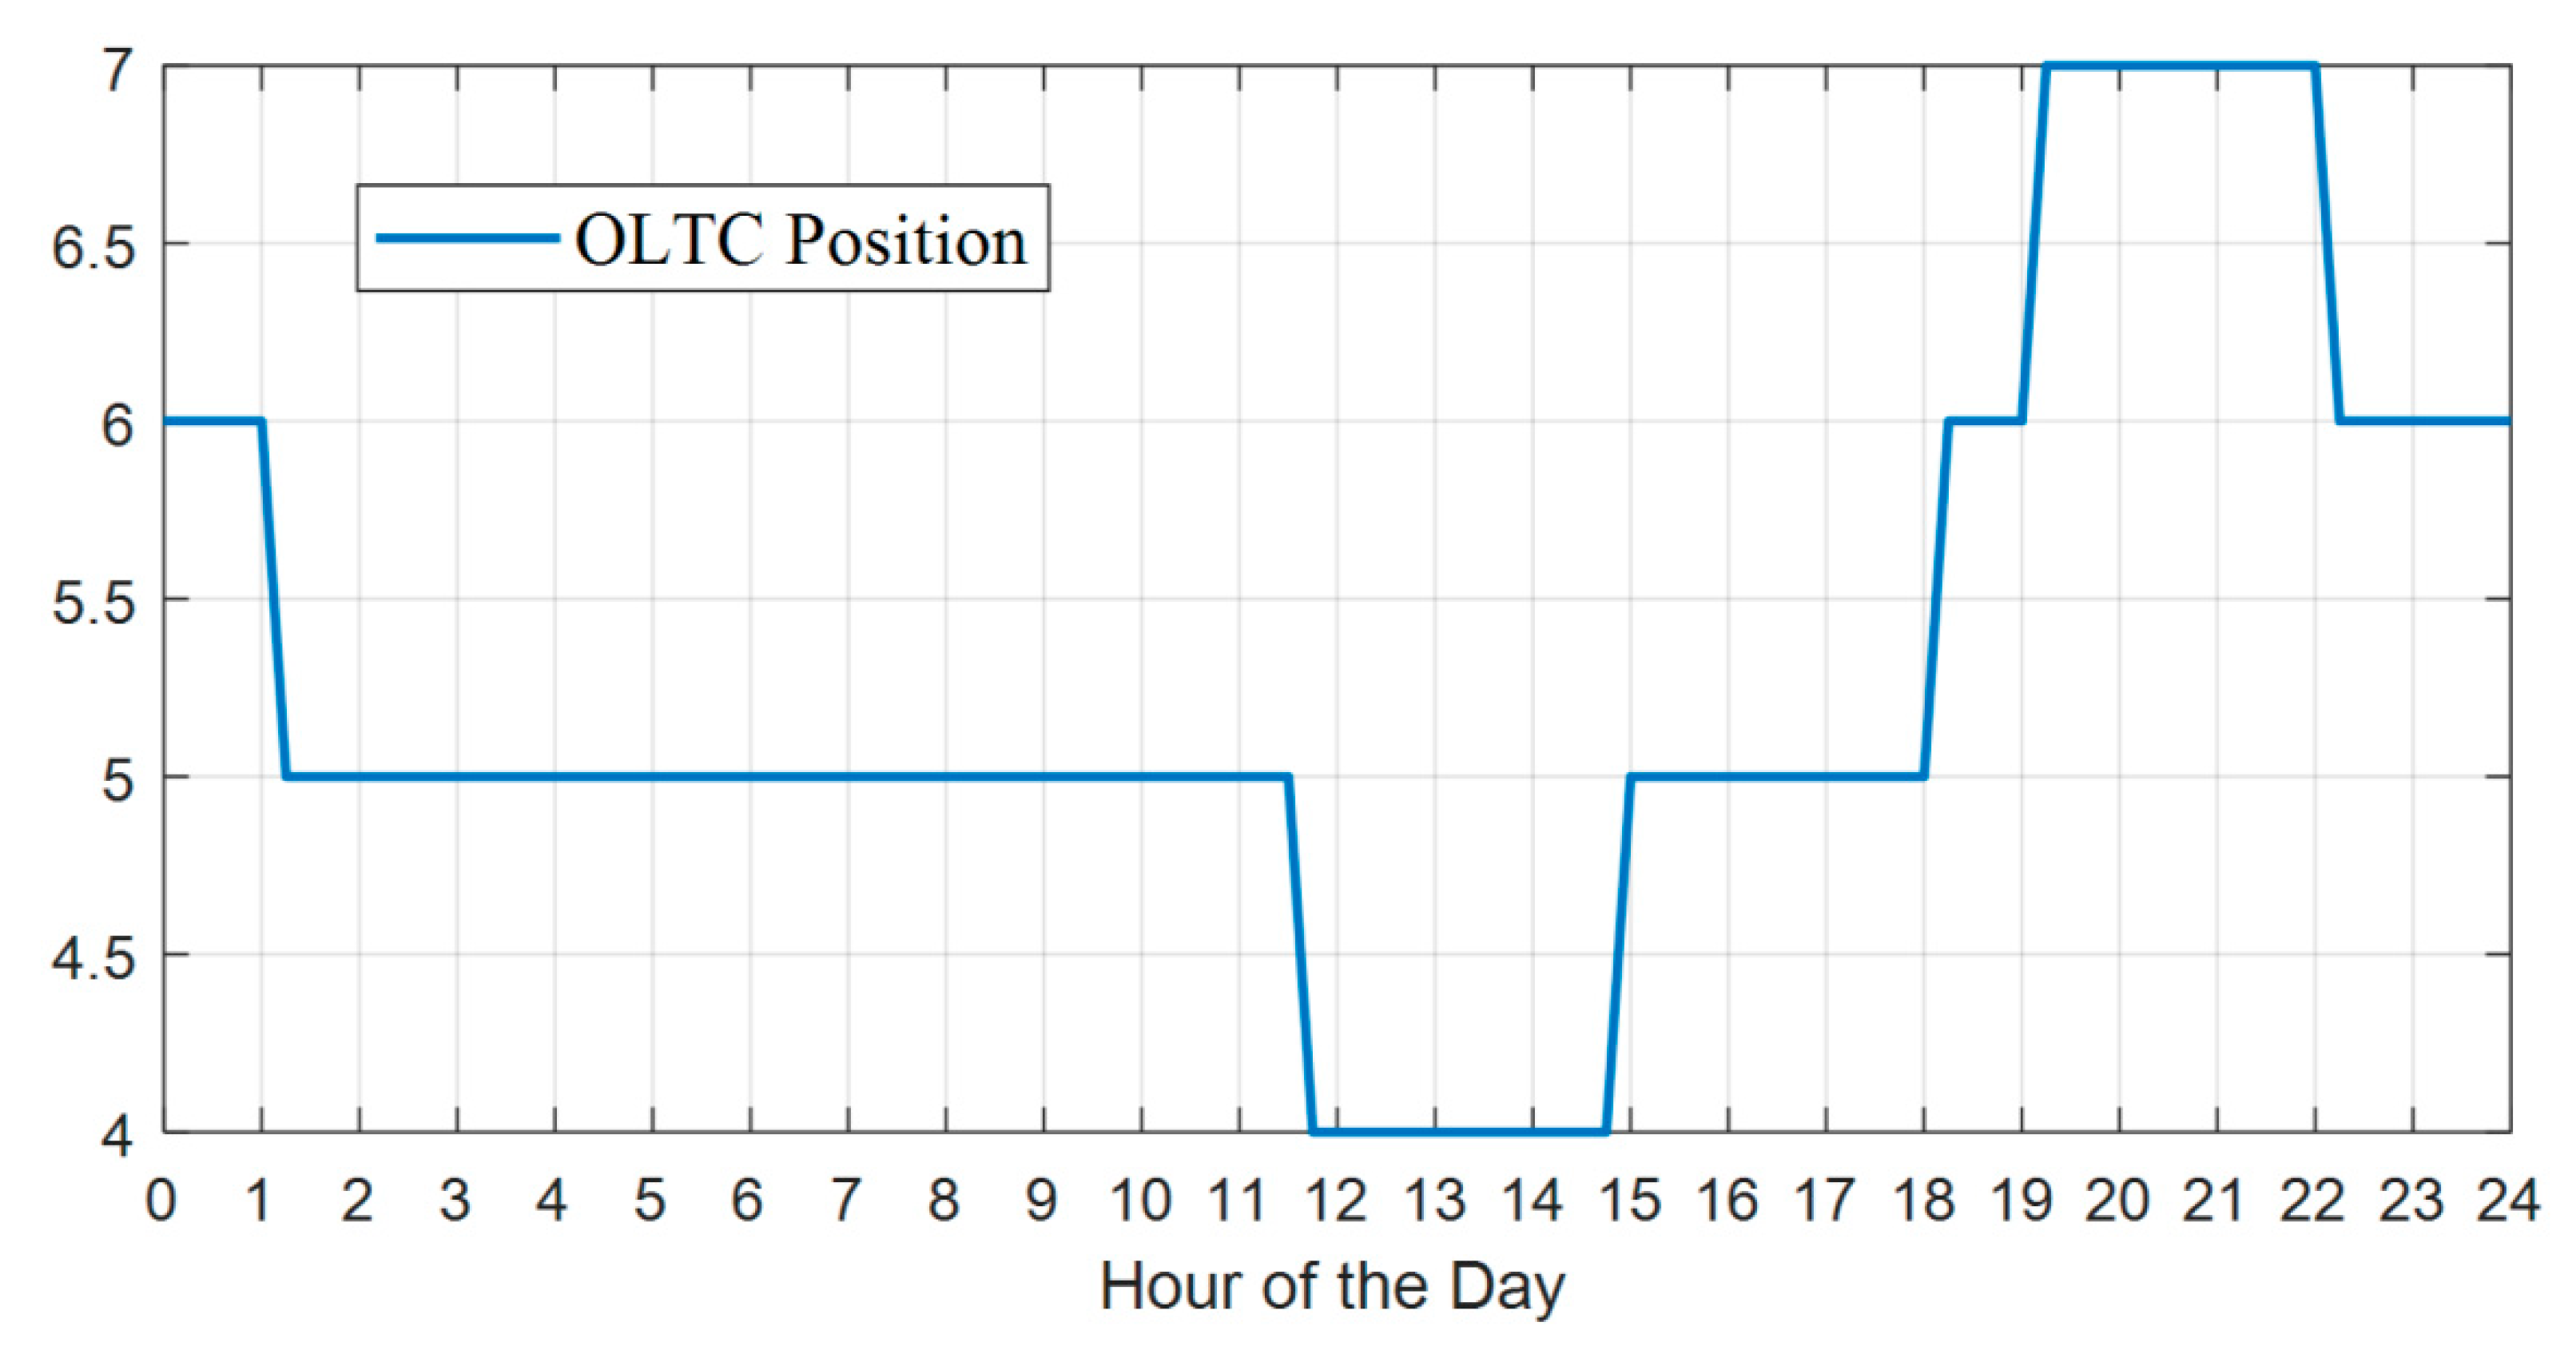
The operation of CVC controller in parallel with the OLTC controller was tested for a daily scenario with increased PV production. Under this scenario, the CVC is expected to utilize the OLTC in order to mitigate voltage rise issues.
In Figure 13 and Figure 14, the voltage profiles with and without the CVC operation are presented. In Figure 15, the Tap position forced to the OLTC controller by the CVC controller is presented.
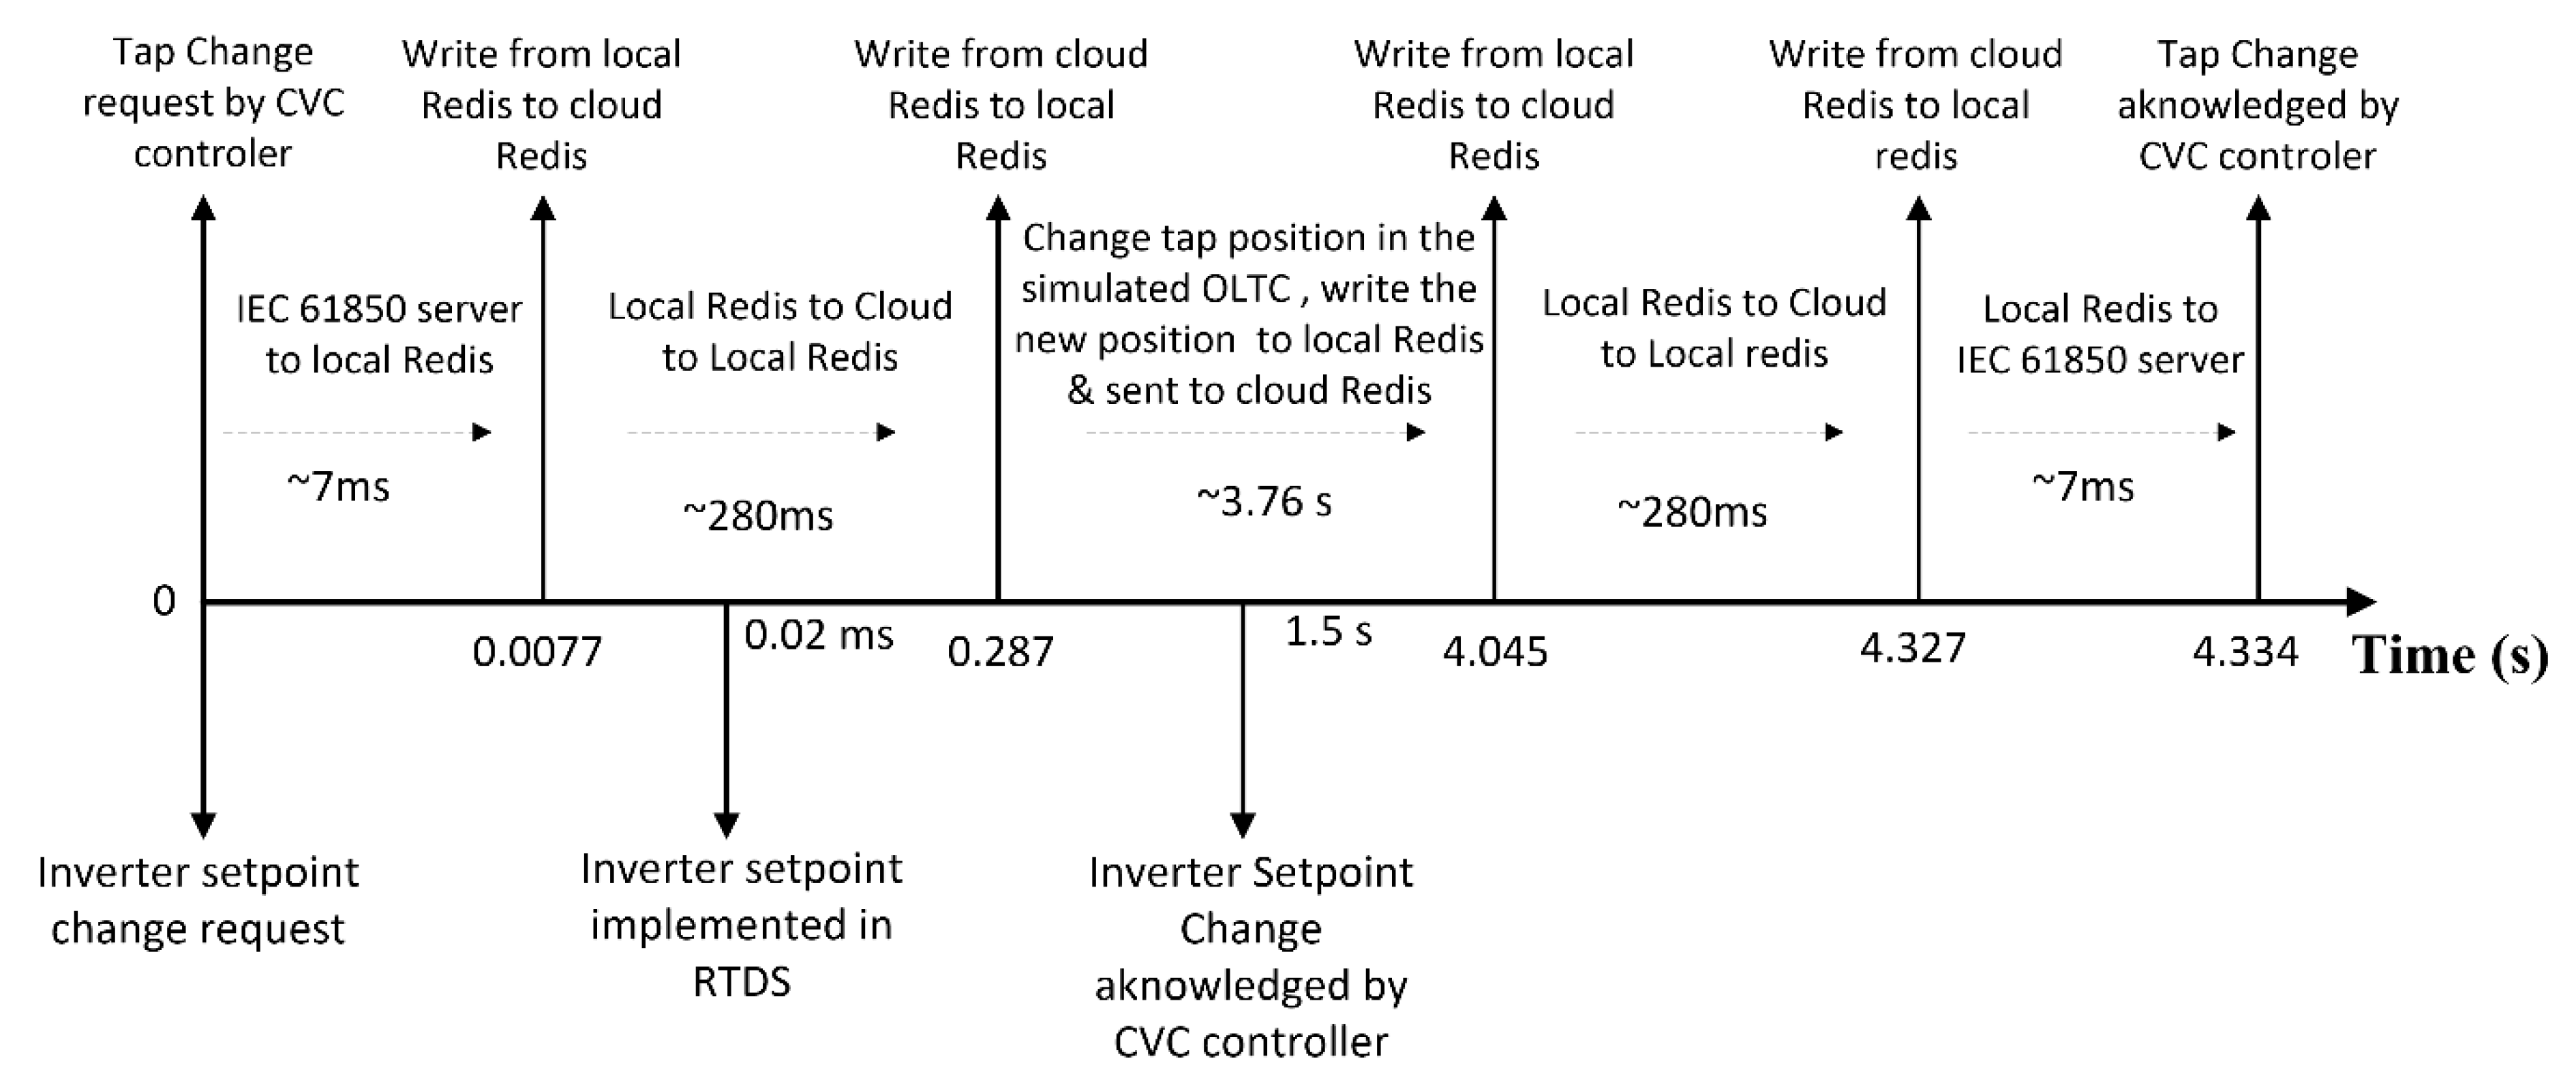
Under this setup, the ability of JaNDER platform to enhance real-time testing was investigated. The CVC was tested and validated against an OLTC controller and real-time simulator designed by specialized personnel in a different location. This test case clearly showed that JaNDER can be used for testing applications, like the CVC controller with equipment in different RIs without affecting its operation due to the time delays introduced by the interface. In Figure 16, the delays measured during a request for a tap position by the CVC to the OLTC are presented. The most significant delay is introduced by the OLTC controller/OLTC real-time simulator which emulates the actual performance of an OLTC in a transformer. The inverters, which are simulated in the DRTS located in the same infrastructure as the CVC controller, receive their setpoint faster, which results in faster acknowledgement of the setpoint implementation by the CVC controller. Therefore, both the distributed DERs implement their setpoints in different time frames and the CVC controller acknowledges those setpoints at different time stamps.
However, the CVC time step (~1 min) is significantly larger than the time required from the CVC controller to send the setpoints to the DERs and OLTC and acknowledge their implementation (~5 s). Therefore, the overall behavior of this application is not affected by the different time frames that the devices react to the CVC controller setpoints.
As shown in Figure 16, the most significant delay is introduced by the OLTC operation according to the CVC request. This delay could differ according to the OLTC manufacturer. It is clear of course that if the OLTC controller’s response is comparable to the centralized controller’s timestep, the overall behavior of the system would be affected. For example, during online operation the centralized controller initiates a sequence by sending setpoints to all the local devices. If the OLTC controller response is comparable to the centralized controller timestep, then it is possible that the tap position will remain the same when the central controller begins measurements in the next timestep. The central controller would then send an additional request (e.g., tap increase) to the OLTC controller. If the OLTC controller implements those request in series, the resulting tap position would be wrong leading to undesired operation of the OLTC. To avoid this, the CVC controller should request, for example acknowledgement from the local controllers that the ordered setpoints have been implemented. The setup presented can effectively reveal such weaknesses of the controller design in a safe laboratory environment.
In this implementation, the most significant factor of failure is the OLTC response compared to the CVC timestep, since the platform’s delays are insignificant compared to the CVC timestep. Nevertheless, the platform delays can affect the overall stability of the setup and the accuracy of the results, if applications requiring faster response are considered. The stability of a control system considering the sample rate of the controller for systems with communication network delays has been investigated in [26,27]. A controller with slower response or slower sample rate is usually a way to increase the robustness of the control against communication delays. This is not applicable in setups with several controllers located in remote locations, since altering their response might lead to a behaviour different than anticipated in the field deployment. A general rule of thumb when using the JaNDER platform to create a testing setup is to compare the network delays introduced by JaNDER, with the actual network delays expected in the field deployment or to ensure that the controller has a sample rate that is not affected by the communication delays. Otherwise, the testing setup is not suitable, as shown in the example of decentralized secondary voltage and frequency control of an islanded microgrid under varying time delays [27].
6. Discussion
From the point of view of the CVC users, this test case using JaNDER was more realistic by interfacing their DRTS with the industrial product. At the same time, the collaboration with the experienced industrial personnel has assured a safe and fast interfacing of both devices, since every team was able to prepare the equipment in their area of expertise, thus boosting the overall implementation time.
From the point of view of the industrial partner, the JaNDER implementation has provided an insight on state-of-the-art approaches on smart grid applications. At the same time, the introduction of their equipment in such application presented a new opportunity for future research and investigation area.
Since most of commercial real-time simulators have a considerable capital cost, from the overall project perspective, JaNDER can promote collaboration between different infrastructures in order to expand their real-time testing capabilities without spending significant resources in the upgrade of their equipment and can provide considerable benefits for both a commercial and academic field by connecting geographically distributed real-time simulators.
On the other hand, since the industrial protocol (IEC 61850) is widely supported by JaNDER platform, studying the impact of this communication alongside the electrical grid in real-time, can provide a valuable insight on the impact of the delays and interfacing issues of both networks.
Finally, connecting power components (e.g., inverters) to different infrastructures can also be utilized through this platform to study the latency impact and to test slow varying phenomena of these components. Knowing that this platform was proven as a reliable and valuable tool with no critical latency, it is interesting to expand it in real-time testing without affecting the stability of the experiment.
7. Conclusions
The integration of distributed renewable energy resources to the grid is increasing its complexity and, therefore, new flexible system test methods are needed to study their impact and to ensure their efficiency and security. A novel HIL setup, based on remote hardware integration, is presented in this paper. This new testing setup is available thanks to the real-time communication tool developed in the context of ERIGrid project called JaNDER.
To demonstrate this new testing setup, a real test case, interfacing an industrial device like an OLTC controller with a remote DRTS with a LV network model, has been implemented. The test results shows that the latency for data exchanging due to JaNDER is lower than 300 ms. Hence, this platform is suitable for testing remote hardware/software and analyzing slow varying phenomena. Indeed the latency does not affect the stability of the experiments.
Author Contributions
Conceptualization, C.S. and D.P.; Data curation, E.B. and D.T.L.; Project administration, L.P.; Resources, D.T.L., N.H., and N.A.; Software, E.B. and D.P.; Supervision, L.P.; Writing—original draft, L.P., E.B., D.P., D.T.L., and N.A.; Writing—review and editing, L.P., C.S., D.T.L., and N.H. All authors have read and agreed to the published version of the manuscript.
Funding
This work is supported by the European Community’s Horizon 2020 Program (H2020/2014–2020) under project “ERIGrid” (Grant Agreement No. 654113). Further information is available at the corresponding website www.erigrid.eu.
Conflicts of Interest
The authors declare no conflict of interest.
References
- IPCC. Climate Change 2014: Mitigation of Climate Change. Contribution of Working Group III to the Fifth Assessment Report of the Intergovernmental Panel on Climate Change; Edenhofer, O., Pichs-Madruga, R., Sokona, Y., Farahani, E., Kadner, S., Seyboth, K., Adler, A., Baum, I., Brunner, S., Eickemeier, P., et al., Eds.; Cambridge University Press: Cambridge, UK; New York, NY, USA, 2014. [Google Scholar]
- Strategic Research Agenda for Europe’s Electricity Networks of the Future; European Commission, Directorate-General for Research: Brussels, Belgium, 2007.
- Smart Grid Mandate—Standardization Mandate to European Standardisation Organisations (ESOs) to Support European Smart Grid Deployment; European Commission: Brussels, Belgium, 2011.
- Farhangi, H. The path of the smart grid. IEEE Power Energy Mag. 2010, 8, 18–28. [Google Scholar] [CrossRef]
- IEA. Technology Roadmap—Smart Grids; IEA: Paris, France, 2011; Available online: https://www.iea.org/reports/technology-roadmap-smart-grids (accessed on 5 May 2020).
- Strasser, T.I.; Pröstl Andrén, F.; Widl, E.; Lauss, G.; De Jong, E.C.W.; Calin, M.; Sosnina, M.; Khavari, A.; Rodriguez, J.E.; Kotsampopoulos, P.; et al. Elektrotech. Inftech 2018, 135, 616. [Google Scholar] [CrossRef] [Green Version]
- Ravikumar, K.; Schulz, N.; Srivastava, A. Distributed simulation of power systems using real-time digital simulator. In Proceedings of the IEEE/PES Power Systems Conference and Exposition, Washington, DC, USA, 15–18 March 2009; pp. 1–6. [Google Scholar]
- Faruque, M.; Sloderbeck, M.; Steurer, M.; Dinavahi, V. Thermo-electric co-simulation on geographically distributed real-time simulators. In Proceedings of the IEEE Power Energy Society General Meeting, Calgary, AB, Canada, 26–30 July 2009; pp. 1–7. [Google Scholar]
- Rentachintala, K.S. Multi-Rate Co-Simulation Interfaces between the RTDS and the Opal-RT; Florida State University: Tallahassee, FL, USA, 2012. [Google Scholar]
- Stevic, M.; Vogel, S.; Monti, A. From Monolithic to Geographically Distributed Simulation of HVdc Systems. In Proceedings of the 2018 IEEE 19th Workshop on Control and Modeling for Power Electronics (COMPEL), Padova, Italy, 25–28 June 2018; pp. 1–5. [Google Scholar]
- Monti, A.; Stevic, M.; Vogel, S.; De Doncker, R.W.; Bompard, E.; Estebsari, A.; Gevorgian, V. A Global Real-Time Superlab: Enabling High Penetration of Power Electronics in the Electric Grid. IEEE Power Electron. Mag. 2018, 5, 35–44. [Google Scholar] [CrossRef] [Green Version]
- Available online: https://www.fein-aachen.org/projects/villas-framework/ (accessed on 5 May 2020).
- Henderson, M.I.; Novosel, D.; Crow, M.L. Electric Power Grid Modernization Trends, Challenges, and Opportunities. IEEE Power Energy 2017. [Google Scholar]
- Maniatopoulos, M.; Lagos, D.; Kotsampopoulos, P.; Hatziargyriou, N. Combined control and power hardware in-the-loop simulation for testing smart grid control algorithms. IET Gener. Transm. Distrib. 2017, 11, 3009–3018. [Google Scholar] [CrossRef]
- Kotsampopoulos, P.; Lagos, D.; Hatziargyriou, N.; Faruque, M.O.; Lauss, G.; Nzimako, O.; Dinavahi, V. A Benchmark System for Hardware-in-the-Loop Testing of Distributed Energy Resources. IEEE Power Energy Technol. Syst. J. 2018, 5, 94–103. [Google Scholar] [CrossRef]
- Kotsampopoulos, P.; Georgilakis, P.; Lagos, D.; Kleftakis, V.; Hatziargyriou, N. FACTS Providing Grid Services: Applications and Testing. Energies 2019, 12, 2554. [Google Scholar] [CrossRef] [Green Version]
- Available online: https://redis.io/ (accessed on 5 May 2020).
- Available online: https://bitbucket.org/danielePala/redisrepl (accessed on 5 May 2020).
- Available online: https://bitbucket.org/danielePala/openiec61850-redis (accessed on 5 May 2020).
- Available online: https://github.com/beanit/openiec61850 (accessed on 5 May 2020).
- Available online: https://aws.amazon.com/ (accessed on 5 May 2020).
- Available online: https://databricks.com/ (accessed on 5 May 2020).
- Available online: https://spark.apache.org/ (accessed on 5 May 2020).
- Brandl, R.; Arnold, G.; Cirujano, P.; Pérez de Nanclares, G.; Del Rio Etayo, L.; Soto, A.; Larracoechea, I. Assesement of the Low Voltage Ride Through capability of a smart distribution transformer with On-Load Tap Changer (OLTC) for renewable applications. In Proceedings of the CIRED 2019 Ljubljana Workshop, Ljubljana, Slovenia, 7–8 June 2018. [Google Scholar]
- Ulasenka, A.; Del Rio Etayo, L.U.I.S.; Cirujano, P.; Ortiz, A.; Brandl, R.; Montoya, J. Holistic Coordination of Smart Technologies for efficiently LV operation, increasing hosting capacity and reducing grid losses. In Proceedings of the 25th International Conference on Electricity Distribution, Madrid, Slovenia, 3–6 June 2019. [Google Scholar]
- Zhang, W.; Branicky, M.; Phillips, S. Stability of networked control systems. IEEE Control Syst. 2001, 21, 84–99. [Google Scholar]
- Zhao, C.; Sun, W.; Wang, J.; Li, Q.; Mu, D.; Xu, X. Distributed Cooperative Secondary Control for Islanded Microgrid With Markov Time-Varying Delays. IEEE Trans. Energy Convers. 2019, 34, 2235–2247. [Google Scholar] [CrossRef]
Figure 1.
Virtual research infrastructure concept.

Figure 2.
Joint Test Facility for Smart Energy Networks with Distributed Energy Resources (JaNDER) Level 0 architecture.
Figure 2.
Joint Test Facility for Smart Energy Networks with Distributed Energy Resources (JaNDER) Level 0 architecture.

Figure 3.
JaNDER Level 1 architecture.

Figure 4.
Logging data platform.

Figure 5.
Conceptual model to test latency for JaNDER Level 0.

Figure 6.
CPU, memory, network measurements during the tests.

Figure 7.
Single research infrastructure (RI) results for JaNDER Level 0 test: one single measurement for every repetition.
Figure 7.
Single research infrastructure (RI) results for JaNDER Level 0 test: one single measurement for every repetition.

Figure 8.
Single RI results for JaNDER Level 0 test: 10 measurements for every repetition.

Figure 9.
Single RI results for JaNDER Level 0 test: 100 measurements for every repetition.

Figure 10.
Single RI results for JaNDER Level 0 test: 1000 measurements for every repetition.

Figure 11.
RI results for JaNDER Level 0 test.

Figure 12.
Test setup using JaNDER.

Figure 13.
Voltage profile at consumer premises without the centralized voltage controller (CVC).

Figure 14.
Voltage profile at consumer premises with the CVC.

Figure 15.
On Load Tap Changer (OLTC) position changes.

Figure 16.
Time delays introduced in the setup.

© 2020 by the authors. Licensee MDPI, Basel, Switzerland. This article is an open access article distributed under the terms and conditions of the Creative Commons Attribution (CC BY) license (http://creativecommons.org/licenses/by/4.0/).
Share and Cite
MDPI and ACS Style
Pellegrino, L.; Sandroni, C.; Bionda, E.; Pala, D.; Lagos, D.T.; Hatziargyriou, N.; Akroud, N. Remote Laboratory Testing Demonstration. Energies 2020, 13, 2283. https://doi.org/10.3390/en13092283
AMA Style
Pellegrino L, Sandroni C, Bionda E, Pala D, Lagos DT, Hatziargyriou N, Akroud N. Remote Laboratory Testing Demonstration. Energies. 2020; 13(9):2283. https://doi.org/10.3390/en13092283
Chicago/Turabian StylePellegrino, Luigi, Carlo Sandroni, Enea Bionda, Daniele Pala, Dimitris T. Lagos, Nikos Hatziargyriou, and Nabil Akroud. 2020. "Remote Laboratory Testing Demonstration" Energies 13, no. 9: 2283. https://doi.org/10.3390/en13092283
Note that from the first issue of 2016, this journal uses article numbers instead of page numbers. See further details here.