
Pore-Scale Investigation on Natural Convection Melting in a Square Cavity with Gradient Porous Media

1
School of Mathematics and Physics, China University of Geosciences, Wuhan 430074, China
2
Center for Mathematical Sciences, China University of Geosciences, Wuhan 430074, China
*
Author to whom correspondence should be addressed.
Energies 2021, 14(14), 4274; https://doi.org/10.3390/en14144274
Submission received: 5 June 2021
/
Revised: 12 July 2021
/
Accepted: 13 July 2021
/
Published: 15 July 2021
(This article belongs to the Special Issue Advances in Simulation of Fluid Flow Dynamics in Porous and Fractured Media)
Abstract
:In this paper, natural convection melting in a square cavity with gradient porous media is numerically studied at pore-scale level by adopting the lattice Boltzmann method. To generate the gradient porous media, a Monte Carlo technique based on the random sampling principle is used. The effects of several factors, such as Rayleigh number, gradient porosity structure, gradient direction, and particle diameters on natural convection melting are investigated in detail. Based on the numerical data, it is observed that the thermal performance of the gradient porous media always depends on the Rayleigh number and, specifically, as the Rayleigh number is set to , the total melting time obtained for the case of the negative gradient porous media is always shorter than the cases of positive gradient and uniform porous media. However, if the Rayleigh number is equal to , at which the heat transfer is dominated by the heat conduction, it is noted that the performance of the positive gradient porous media is better than the other cases. To have a better understand on this point, various simulations are also performed and we found that there usually exists a critical value of Rayleigh number to determine the thermal performance of the gradient porous media. Moreover, our numerical results also show that the influence of the particle diameter on the liquid fraction is insignificant as Rayleigh number is set to , while it has a great impact on the liquid fraction when Rayleigh number equals .
1. Introduction
Thermal energy storage (TES) technology has attracted wide attention due to its ability to solve the temporal and spatial imbalance between energy supply and energy demand [1,2]. Among various TES methods [3,4], the latent heat thermal energy storage (LHTES), which stores thermal energy in latent heat through the solid–liquid phase change of phase change material (PCM), has drawn great attention due to its stable thermal energy storage temperature, low cost, and high thermal density [5]. However, as pointed out by some researchers, the low thermal conductivity of the PCMs (∼0.3 for solid paraffin [6]) in LHTES seriously limits the heat storage efficiency. In the past few years, various heat transfer enhancement approaches have been proposed to improve the thermal performance of phase change heat transfer in LHTES [7,8,9,10,11,12], such as employing fins with high thermal conductivity [7,8], using multiple PCM methods [9,10], and embedding PCMs in highly conductive porous media [11,12] and so on.
As a new material, high porosity cellular metal foams with open cells are a kind of promising porous media with high thermal conductivity, high surface area to volume ratio, and ultra lightweight to improve the heat transfer performance in the charging and discharging process [13]. In such a case, recently some experimental and numerical studies have been conducted to investigate the solid–liquid phase change heat transfer in metal foams [14,15,16,17,18,19,20]. Chen et al. [14] used an infrared camera and microscope to experimentally study the heat transfer performance of PCM in metal foam, and also used the double-distribution lattice Boltzmann method to carry out a numerical simulation. It is found that the numerical values are in consistent with the experimental results and the authors stated that the the existing of metal foam has a positive impact on the PCM melting. Yang et al. [15] experimentally studied the influences of metal foam on solid–liquid phase change and found that, compared with the case of pure paraffin, completely melting the PCM in metal foam takes much less time under the same condition. Later, Yao et al. [19] conducted a visualized experiment to study the melting of paraffin in high porosity copper foam at pore scale. They concluded that the copper foam with a high porosity of 0.974 effectively extends the phase change interface and improves the heat storage of paraffin, while the reduction in the amount of latent heat is only 2.6%. In addition, Zhao et al. [16] numerically studied the melting behavior of paraffin in metal foam, and it is noted that the Rayleigh number, porosity, and pore density have significant impacts on the melting and solidification process. Tao et al. [17] used the lattice Boltzmann method to study the heat storage performance of the metal foam filled with paraffin, and the influences of porosity and pore density on the melting rate are both considered. Based on the numerical results, the authors stated that increasing pore density could help dissipate the heat more rapidly from the heat source, but weaken the natural convection heat transfer performance. Zhu et al. [18] employed the finite volume method to discuss the heat loss, the liquid melting rate and the efficiency of LHTES. The results show that the pores per inch (PPI) of aluminum foam, the shape of cold wall, and the distribution of heat sources could impact the heat conduction performance of the metal foam. More recently, Yang et al. [20] numerically and experimentally explored the influence of the inclination angle and the aspect ratio of the inclined cavity filled with metal foam. It is found that for a given aspect ratio, the influence of the tilt angle is insignificant, while the case with a smaller aspect ratio outperforms the one with a bigger ratio for different aspect ratios.
From the above literature review, one can find that embedding PCMs in highly conductive porous media is an effective approach to enhance the performance of phase change heat transfer. However, it should be noted that the pore structure appeared in these works are usually fixed. Actually, in view of the evolution of the solid–liquid interface is usually non-uniform during melting process, some researchers recently pointed out that the phase change heat transfer can be further enhanced by vary the porosity or the pore density in the porous media [21,22,23,24,25,26,27]. In this context, few attempts have been carried out to study the effect of the non-uniform pore structure on phase change heat transfer [21,22,23,24,25,26,27]. Yang et al. [21] numerically investigated the melting process of sodium nitrate inside porous copper foam with linearly changed porosity. The numerical re sults show that porosity linearly increased from bottom to top could improve the heat transfer performance and shorten the completely melted time compared to that for constant porosity. Later, Zhu et al. [22] proposed an improved metal foam structure, which is composed of metal foam and finned metal foam with gradient pores. The finite volume method is also used to analyze the influence of structural parameters on energy storage performance. It is found that this structure can shorten the melting time by changing the melting sequence of the PCM. Zhang et al. [23] numerically studied the melting behavior in gradient foam metal, which consists of three different homogeneous porosity slices, and the results show that the gradient porosity structure can overcome the bottom corner phenomenon to increase the heat storage rate. Yang et al. [24] experimentally and numerically studied the effect of gradient porosity and gradient density in tube latent heat thermal energy storage. Results indicated that the positive gradient design of porosity can significantly reduce the melting time of PCMs filled in the pore space and simultaneously obtain a better temperature uniformity. Ghahremannezhad et al. [25] used a finite volume approach to numerically simulate the melting behavior of PCMs in gradient foam metal under different heating modes. They found that the direction of gradient porosity and PPI can affect the heat transfer rate. Hu et al. [26] used a three-dimensional model to numerically simulate the melting behavior in a gradient metal foam saturated with PCM and quantitatively explored the effect of gradient size and gradient difference on the heat storage characteristics of PCMs. It found that gradient metal foam effectively improves and accelerates the heat storage efficiency and there is an optimal gradient difference under a fixed average porosity. Marri et al. [27] experimentally and numerically studied the thermal performance of cylindrical foam metal/PCM composite heat sinks with gradients of porosity and density. The results show that the three-level gradient and the two-level gradient have comparable thermal performance, which are 4.4 times and 4.0 times stronger than the thermal performance of the uniform structure, respectively.
These exiting works show that the pore structure of the porous media has a significant impact on solid–liquid phase change heat transfer, and it can be served as an effective mean to enhance PCM melting. However, we note that most numerical studies on PCM melting in gradient porous media are based on the representative elementary volume (REV) models [21,22,23,24,25,26,27,28,29], and it is well known that in the REV model, the macroscopic quantities, including permeability and effective thermal conductivity, are always obtained by using some empirical correlations, which further affects the accuracy of the REV model. In addition, since the pore structures are ignored in the REV model, it cannot capture the detailed information of the fluid flow and heat transfer inside pores [30]. Further, we noted that although some previous works stated that the employing of positive gradient pore structures is always a good choice in enhancement of solid–liquid phase change [24,25], some researchers have also stated that the negative gradient porous media has a better melting performance than the positive one [26], and these contradictory statements most likely arise from the various parameters used in REV model.
In this context, it is essential to conduct a pore scale study on solid–liquid phase change in gradient porous media, and to the best of our knowledge, no systematical investigations have been reported in the open literature for this issue. To fill this gap, we intend to investigate natural convection melting in a square cavity with porosity gradient at pore-scale in this work. In our simulations, the macroscopic equations are numerically solved by using the lattice Boltzmann (LB) method, which has become a promising pore-scale method for simulating complex fluid flow [31,32,33,34,35]. Compared with the traditional computational fluid dynamics (CFD) methods, the LB method has mesoscopic physical background and has advantages in mesh generation, boundary processing, multi-factor coupling effects and massively parallel computation of complex structures [36], which is very suitable for simulation studies of solid–liquid phase change in porous media [37,38,39,40]. The remainder of this paper is structured as follows. The governing equations for the melting problem and physical problem are presented in Section 2, followed by the LB method for the enthalpy equation and the fluid flow and boundary treatment in Section 3.1, Section 3.2 and Section 3.3, respectively. Subsequently, the model verification is given in Section 4. Numerical results are presented and discussed in Section 5, and, finally, some conclusions are summarized in Section 6.
2. Problem Statement and Governing Equations
In this work, we focus on the solid–liquid phase change in a square cavity filled with a gradient porous media, and the schematic diagram of the two-dimensional physical model is depicted in Figure 1, and the porous structure considered here can be viewed as a kind of gradient metal foam [13]. As shown in this figure, a square cavity with side length of encloses the gradient porous media, and the PCM is embedded inside the pores with the melting temperature of . In addition, the left side wall is set to be a high temperature of ( > ), while the temperature of the right side wall is kept at a low temperature of . Further, the two horizontal walls of the enclosure are assumed to be adiabatic.
In order to generate the gradient porous media, a Monte Carlo method based on the random sampling principle is employed [41], and, for simplicity, the gradient porous media considered here is a so-called two-layer structure [27], and it is obtained by varying the porous media porosity in the horizontal direction (see Case A in Figure 1a) or the vertical direction (see Case B in Figure 1b). In addition, the positive gradient porous media is gained through increasing the porosity of porous media along the horizontal or vertical direction, while the negative one is got by decreasing porosity in the corresponding direction. Further, the grid resolution of per unit in following simulations is set to 512, which is fine enough to give the grid-independence results. As stated in Reference [13], the value of metal foam porosity is usually around 0.9, and without loss of generality, the average porosity of the porous media used in this work is fixed at 0.875. Finally, in order to keep the distribution of the porous media more uniform, the diameter of the particle is set to 7.5 (lattice unit).
The macroscopic governing equations are established by incorporating the following assumptions [25]: (1) all thermophysical properties of the fluid and porous media are taken to be constant except for the density variation in the buoyancy term, in which it is taken as a function of the temperature by considering the Boussinesq approximation, (2) the volume change during the phase transition is ignored, (3) all materials meet the assumptions of uniformity and isotropy. In such a case, the governing equations for the solid–liquid phase change in the gradient porous media can be expressed by [42]
where , , are the gravity acceleration vector, velocity, temperature, pressure, the thermal conductivity, the constant density, kinetic viscosity, thermal volumetric expansion coefficient, and the heat capacity, respectively. Further, in order to close the above governing equations, the popular formal to connect the relationship between the enthalpy and temperature are adopted here, and it can be expressed as
in which L and represent latent heat and liquid phase volume fraction of PCM, respectively. Meanwhile, the energy equation in the porous media can be described as
in which the subscript represents the porous media.
Based on the above equations, the present problem can be characterized by the following three main dimensionless parameters, i.e., Rayleigh number (), Prandtl number (), Stefan number (), Fourier number (), which are defined by
where and are the thermal diffusivity and length of the square cavity, respectively.
3. The Lattice Boltzmann Model for Solid–Liquid Phase Change
3.1. Lattice Boltzmann Method for Velocity Field
In the present study, the incompressible lattice Bhatnagar–Gross–Krook (LBGK) model proposed by Guo et al. [43] is used to simulate the fluid flow, the evolution equation of the particle velocity field is
where is the probability density distribution functions with velocity at position and time t, is the time increment. is the dimensionless relaxation time determined by . In addition, is the equilibrium distribution function given by [43]
where is the model parameter satisfying with the constant being the fluid average density. is the weight coefficient, represented as
The direction of the discrete velocity of the model in i direction is given by
where i is velocity direction, and c is the lattice speed satisfying , is the lattice spacing. The body force term is defined as [44]
where is the sound speed of the model, is the buoyancy force, and can be calculated according to Boussinesq assumption:
Finally, the macroscopic pressure and velocity can be obtained by
3.2. The Optimal Two-Relaxation-Time Lattice Boltzmann Model for Temperature Field
In recent years, various LB models have been proposed to simulate the solid-phase change problems [37,38,39,40,42], and the most widely used model is the so-called total-enthalpy-based LB model [45]. However, as pointed out by Lu et al. [46], the traditional total enthalpy-based thermal LB model is usually accompanied by the numerical diffusion across the phase interface. To address such drawback, Lu et al. [46] proposed an optimal two-relaxation-time (OTRT) LB model for PCM melting, and the unphysical numerical diffusion can be largely reduced without introducing any substantial complication with respect to the original TRT model. In this context, the OTRT model is adopted here and the evolution equation of the temperature distribution function can be described as
where and are the symmetric and anti-symmetric parts of the particle distribution function, where the superscript s and a represent the symmetric and anti-symmetric parts of distribution function, respectively. and are the symmetric relaxation time and anti-symmetric relaxation time, respectively. The expressions of are defined by
in which represents the opposite direction of i. The equilibrium distribution function is expressed as
In addition, the dimensionless relaxation time and are calculated by
Further, the total enthalpy is given as
Finally, the liquid fraction and the temperature T are calculated from the total enthalpy H as [45]
in which and are total enthalpy of the solid phase and the liquid phase, respectively. and denote the solid and liquid temperatures, respectively.
3.3. Boundary Treatment
For the problem considered here, the no-slip boundary condition is adopted for the solid–liquid interface, as well as the solid particles. In numerical simulations, an immersed moving boundary scheme is used to treat the above boundary, and it can be expressed as [47]
where is the weighting function which is expressed by
is an additional collision term and it can be given as
where is the velocity of solid phase. In addition, the non- equilibrium extrapolation scheme proposed by Guo et al. [48] is employed to the boundary of the cavity.
4. Model Validation
In order to demonstrate the ability of the present model in simulation of solid–liquid phase change, the pure PCM melting at , , and in a square cavity is selected to validate, and a grid resolution of 512 × 512 is employed in our simulations, which is fine enough to give the grid-independent solution. As shown in Figure 2, it can be clearly seen that the present numerical results are in good agreement with previous studies, indicating that the present LB model and the simulation code is accurate and reliable. Additionally, to improve the computational efficiency, the code for each case is performed on the graphics processing unit (GPU) by using “Compute Unified Device Architecture (CUDA)” programming.
5. Results and Discussion
We now turn to study the natural convection melting in a square enclosure with gradient porous media, and the influences of Rayleigh number, gradient pore structure, gradient direction, as well as the particle diameter are investigated in detail. In addition, unless otherwise stated, the Stefan number and the Prandtl number are selected as 0.1 and 0.2, and the thermal conductivity ratio between the PCM and the porous media is set to 500.0.
We first examine the effect of the gradient porosity on melting behavior at . Figure 3 illustrates the variations of the liquid fraction with dimensionless time at , in which the numerical results obtained for the uniform pore structure are also included. According to the melting curve, one can find that no matter which case we studied, the melting curves obtained for all pore structures are completely overlap at the early stage due to the fact that heat conduction is the main mode of heat transfer in this stage. However, as the dimensionless time increases further, the melting rate is first increased significantly and then decreased slightly, which indicates that a gradually slow propagation rate for melting interface. In addition, it is noted that the heat transfer performance obtained for negative gradient in case A is usually better than those gained for positive and uniform pore structures, which is caused by the fact that the remanent space near the hot wall is larger than the other cases such that the convection is more easily to be activated at this Rayleigh number of . However, as shown in Figure 3b, it is find that for case B, only when the dimensionless time is larger than 1.0, the melting rate obtained for negative pore structure is always larger than the other two cases, while the melting rates gained for uniform and positive pore structure are comparable. Finally, no matter which case we studied, it is observed the total melting time for negative gradient porous media is shorter than the other two cases, which further indicates that for this relatively larger Rayleigh number, applying the negative porous media for natural convection melting is suggested.
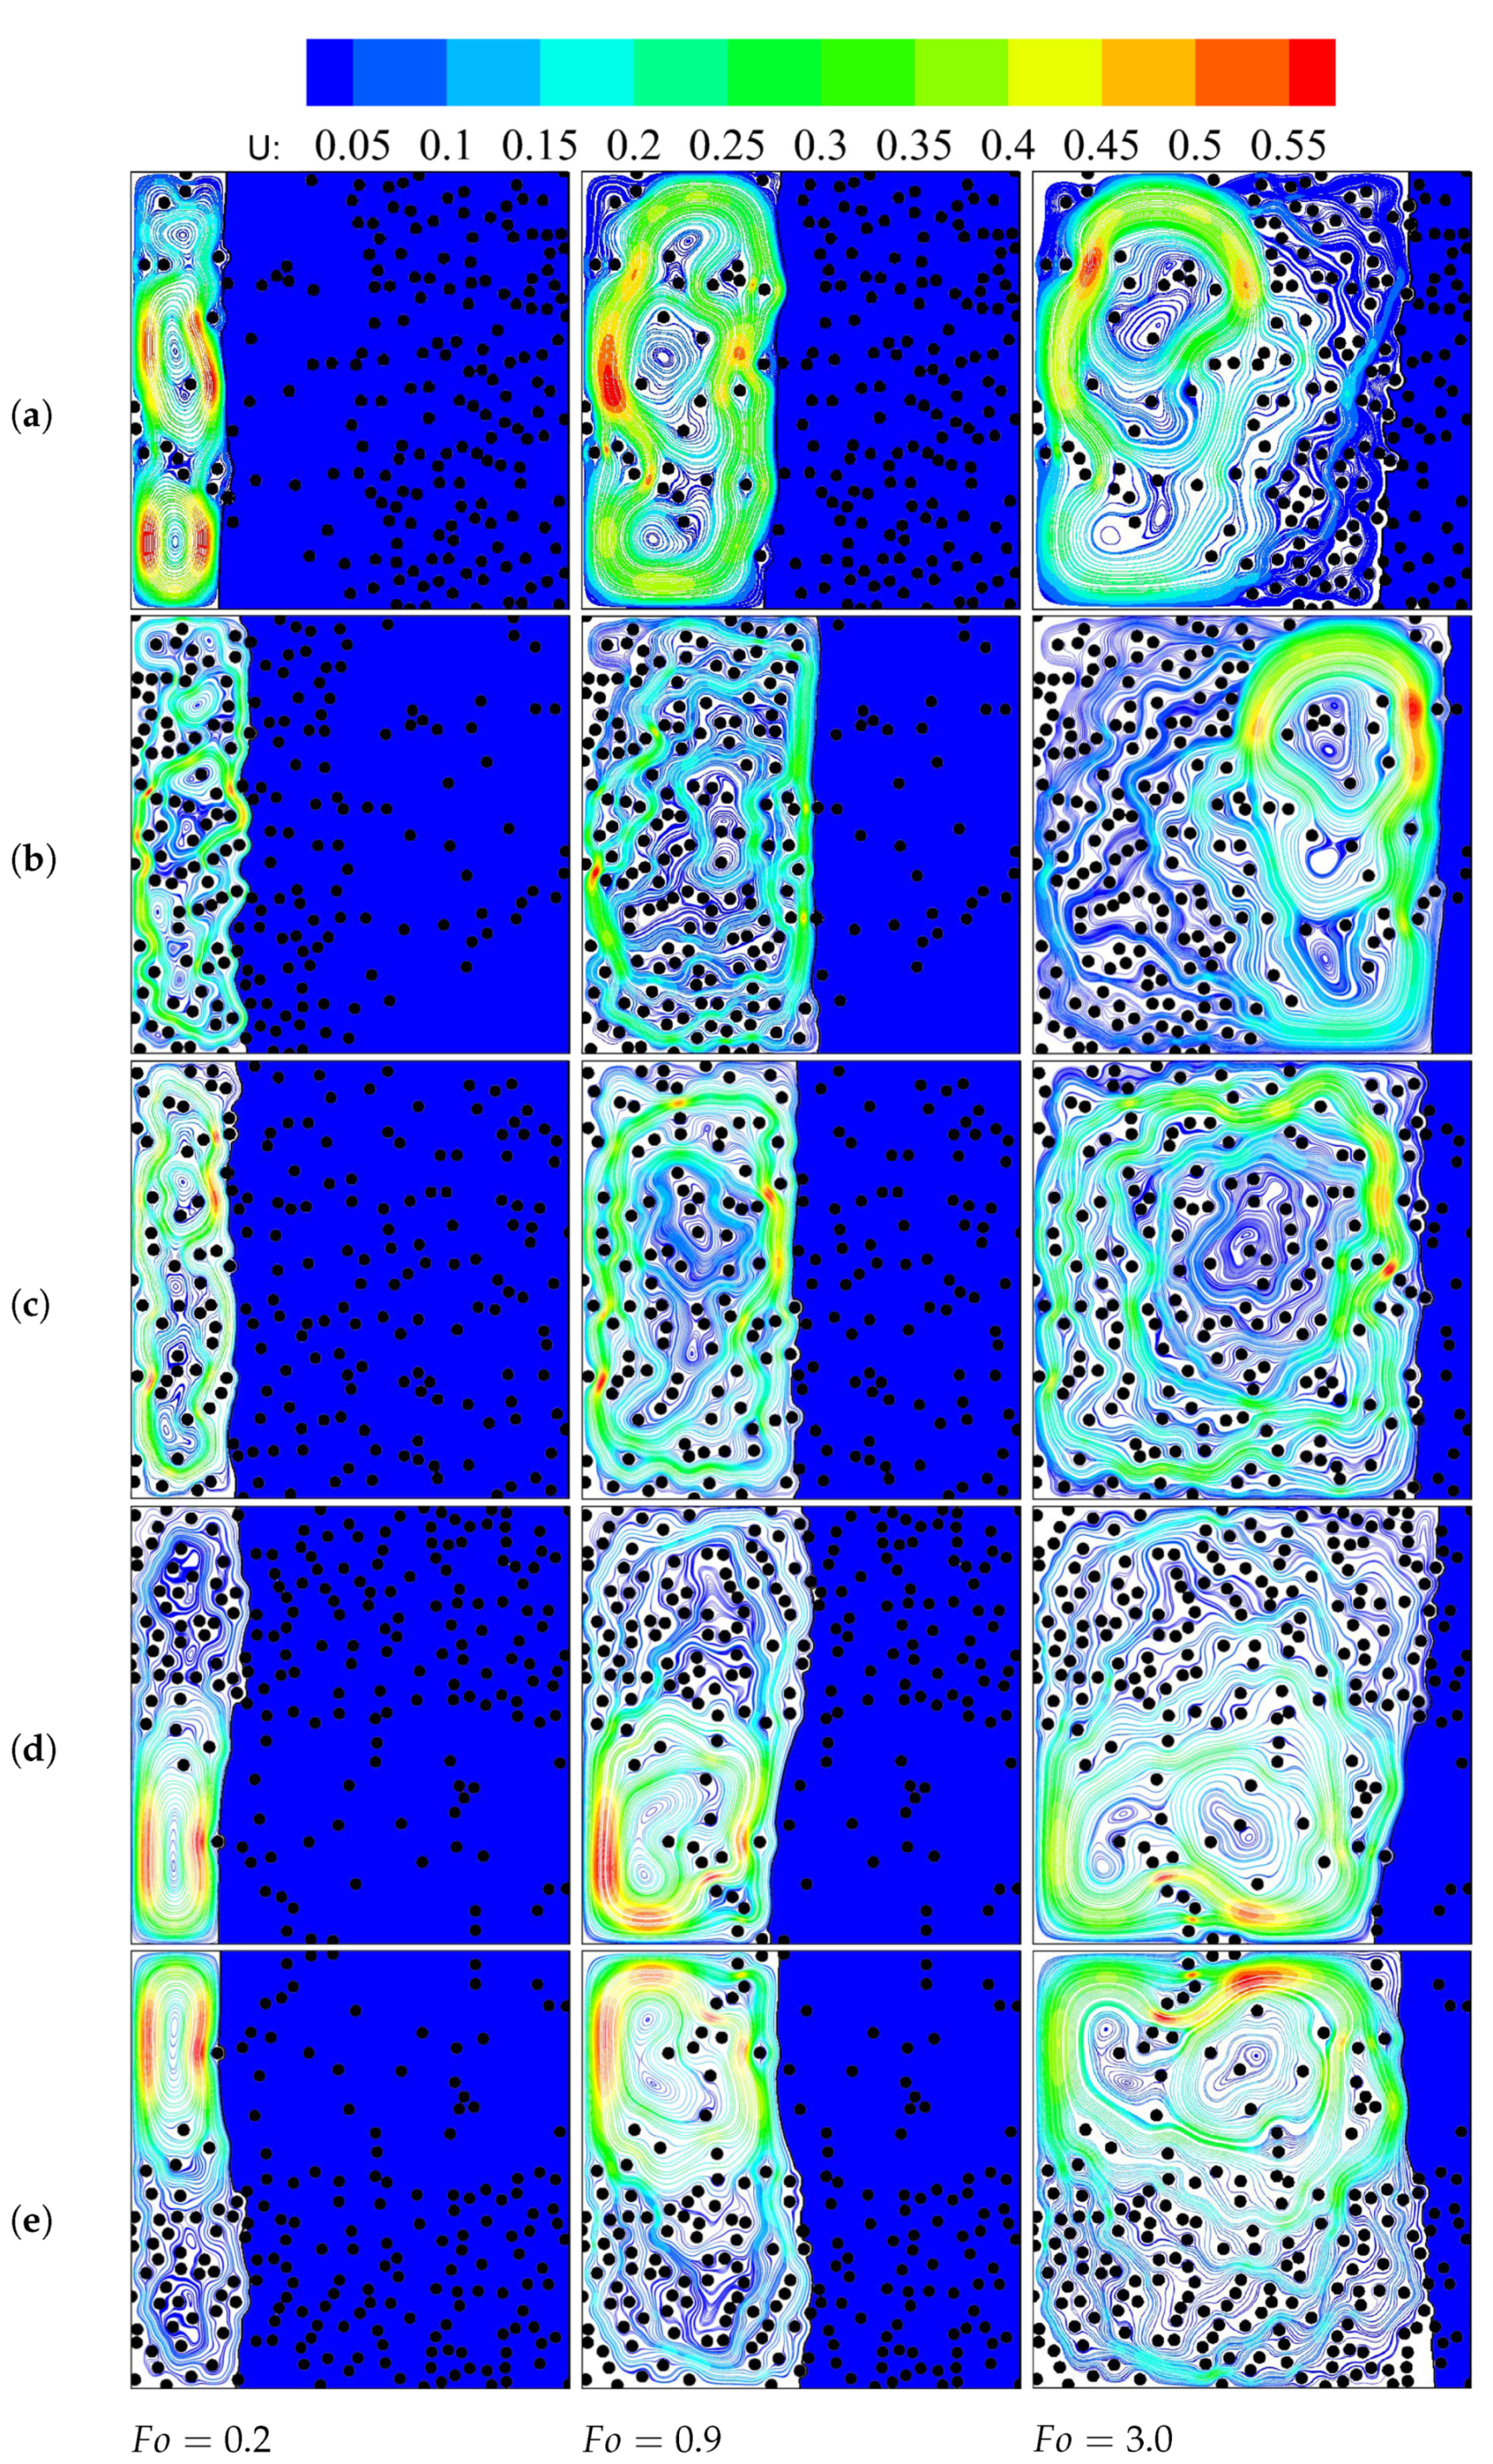
In order to intuitively understand the flow transition process in different gradient structures. Figure 4 shows streamline and total liquid fraction distributions with three different gradient structures at , where the liquid and solid phase zone are represented by the white and blue region, and the porous media is denoted by black region. Due to the influence of the heat conduction in porous media, the flow regime in the enclosure is actually determined by the combined effect of convection and conduction during melting, and the final heat transfer performance relies on which mechanism is the dominant mode during the melting process. As shown in Figure 4, at the early stage of melting (), since there is not enough molten PCM that can support natural convection in the enclosure, the heat conduction is the main mode of heat transfer, such that as the general trend of the solid–liquid interface is roughly perpendicular to the upper and lower wall for all the three different gradient structures. As the dimensionless time increases to 0.9 (see Figure 4 at ), the gradual increase in molten PCM provides a larger carrier for natural convection resulting the main heat transfer mechanism gradually changed from heat conduction to natural convection. As shown in Figure 4, due to the impact of the buoyancy force, the molten PCM is first move upward until it reaches the top side wall of the cavity, and then the heat is transferred to the vicinity of the solid–liquid interface. As a consequence, the solid–liquid interface moves forward and is gradually titled at a certain angle. However, in the final stage of the melting (see Figure 4 at ), since the strength of the convection at the lower right corner of the enclosure is small enough that the PCM in this place melting slowly. Actually, as pointed out by Zhu et al. [18], this phenomenon is the so-called “bottom corner phenomenon”, which will worsen the conduction heat transfer at the bottom region and reduce energy storage efficiency. Another point worth being mentioned is that due to the conductivity of porous media is much higher than that of PCM, the PCM near the solid particle is always preferentially melt, leading the solid–liquid interface shows a sign of fluctuation.
The above discussion is mainly focused on the overall tendency of melting, and in what follows, the influences of the pore structure are investigated in detail. As shown in Figure 4, although the average porosities used in the three pore structures are the same to each other, one can clearly find that the variations of the porosity in the horizontal or vertical direction have a great impact on both the solid–liquid interface and the streamlines. Specifically, compared to the case of uniform pore structure, the negative gradient pore structure in case A provides a lower thermal conductivity and a smaller convection resistance in the left area since it has the highest porosity in the left region. As a result, a stronger natural convection is formed in the left area, bringing more heat near the solid–liquid interface, such that the negative gradient always has a faster melting rate during PCM melting (see Figure 3a). In addition, since the negative gradient has the lowest porosity and the highest thermal conductivity at the right side, the heat is transferred more effectively to the right side of the cavity during the final melting phase resulting in a shorter total melting time (see Figure 3a). Further, due to the positive gradient porous media has a completely opposite porosity gradient direction in contrast to the negative gradient pore structure, it provides the higher resistance to natural convection at the left area and also the lower thermal conductivity at the lower right corner of the enclosure, leading a lower melting rate in such a case (see Figure 3a). Furthermore, since the heat transfer is mainly controlled by the heat conduction at the early stage of melting, it is noted that the difference of the melting rates obtained for all these three cases in this stage are insignificant (see Figure 3a). On the other hand, as far as the positive pore structure in case B is considered, it is find that the enhancement of the PCM melting is just remarkable at the upper side of the cavity due to the smaller porosity in this region. For the lower side, since the distribution of the solid particle is compact, the convection effect in this area is not significant such that the melting efficiency is relatively smaller in contrast to that of the upper side. Moreover, since the porosity at the upside (downside) of the cavity for negative pore structure in case B is smaller (larger), the heat at the upside of the cavity is more easily to be transferred by the conduction and the convection on the downside of the enclosure is more inclined to be activated. As a consequence, the two main heat transfer mechanisms are all effectively present in the cavity, and specially, it is also noted that although the “bottom corner phenomenon” exists for other structures (see Figure 4), it does not appeared for the negative pore structure in case B as a result of the convection at final stage in such a case is stronger than the others. Finally, compared with the structures used in case A (see Figure 3), the negative gradient structure of case B has a shorter melting time due to the elimination of bottom corner phenomenon.
The thermal Rayleigh number in the above discussion is just set to at which the effect of the convection is usually larger than that of the conduction, however, we note that if the thermal Rayleigh number in our simulations are fixed at , the evolution of the solid–liquid interface, as well as the impact of the gradient pore structure are largely different from that of . To this end, in what follows, we intend to study the natural convection melting in the enclosure with gradient porous media at . Figure 5 illustrates the variations of the liquid fraction with dimensionless time for all the three different gradient structures in case A and case B at . To begin with, due to the convection effect in such a Rayleigh number being insignificant, the melting rates obtained for case A and case B are both smaller than that gained for the case of . Additionally, we also find that the PCM in the positive gradient structure of case A is the first to fully melted, and the melting performance in such a case is usually better than that of the uniform and negative gradient structures. This phenomenon can be explained by the following two aspects. As shown in Figure 6, because the solid–liquid interface is nearly parallel to the vertical direction, it is easy to understand that conduction is the main mode of the heat transfer for this small Rayleigh number. On the other hand, since the porosity near the left side of the enclosure for positive gradient structure is smaller, such that the conduction effect in this area is stronger than that of the negative gradient structure (see Figure 6a,b), which, in turn, enhances the total conduction effect in the enclosure. As a result, the total melting time in this case is smaller than that of the uniform and negative gradient pore structures. However, as seen from Figure 5b, one can find that the melting performance for all the three pore structures in case B are nearly the same, which is largely different from that of case A. In fact, considering conduction is the main mode of heat transfer at this Rayleigh number, the effect of the gradient direction for case B is insignificant as a result of the porosity gradient direction (see Figure 1b) is vertical to that of the temperature in this situation. Further, it is interesting to note that there are obvious steps in the solid–liquid interface, and the steps are always located exactly at the interface where the porosity changes (see Figure 6), and this phenomenon can be explained by the fact that the lower porosity area always has higher conductivity, such that the the PCM in this areas melts more quickly than the regions with higher porosity.
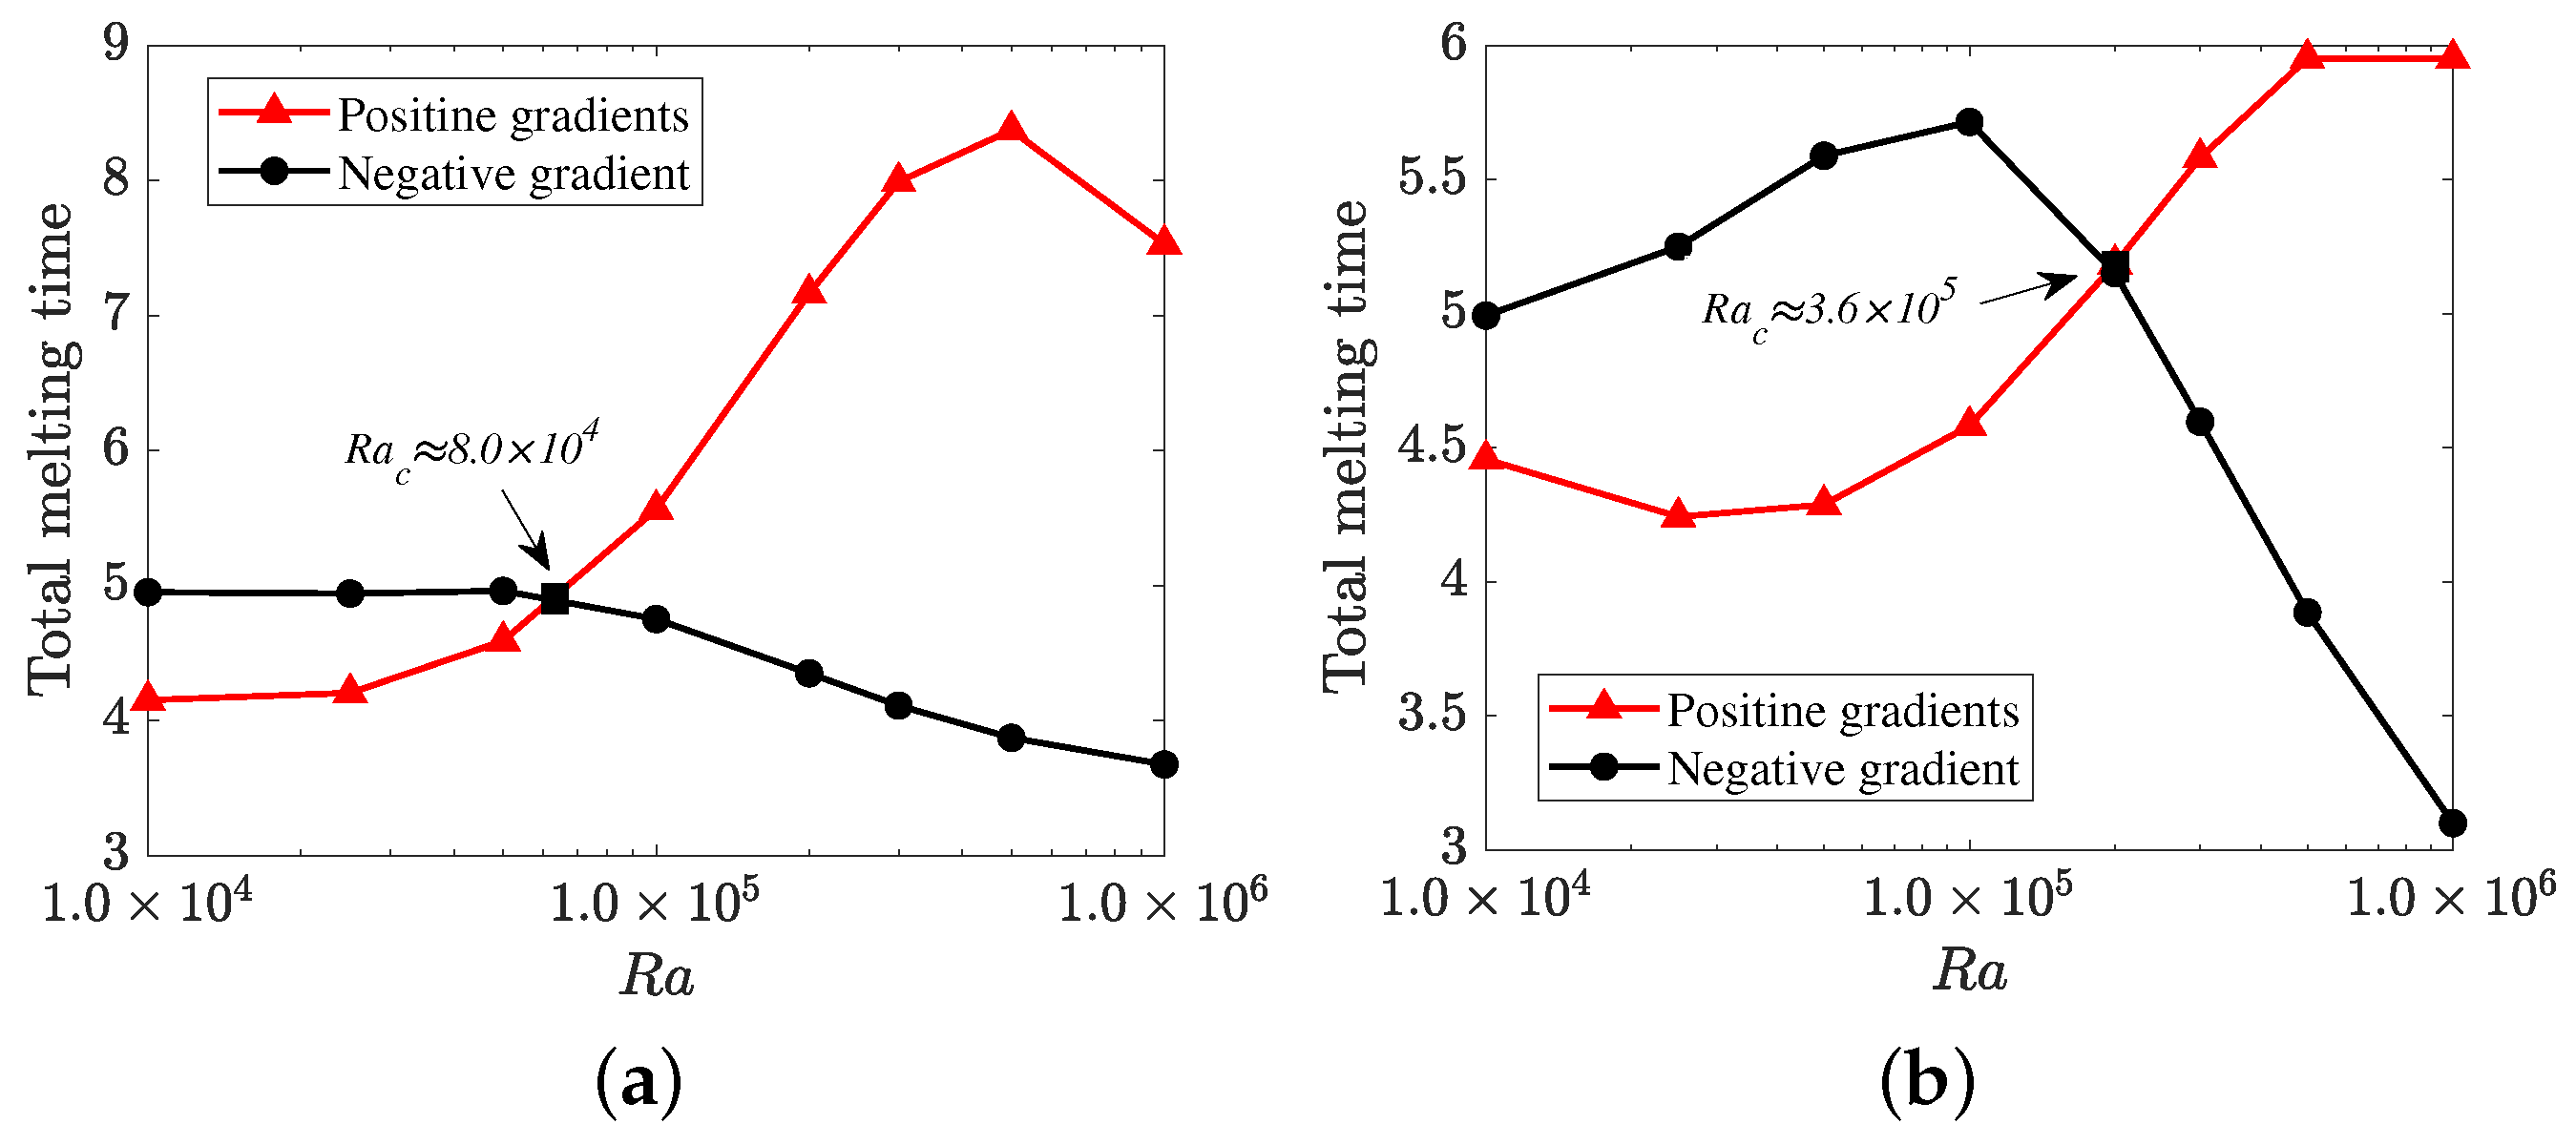
The above discussions illustrate that the influence of the gradient pore structure on melting performance depends on the thermal Rayleigh number, and it brings us a new question: whether there is a critical Rayleigh number to determine the performance of the gradient pore structure? To this end, we also conduct various numerical simulations to investigate the effect of the Rayleigh number on the total melting time and the results are plotted in Figure 7, in which the numerical data obtained for case A and case B are both included. As shown in this figure, one can observe that no matter which case we studied, the performance of the positive gradient pore structure is usually better than that of the negative gradient porous media up to a critical Rayleigh number , at which the influences of the positive and negative gradient pore structures are comparable, and then the melting performance of the negative gradient is better than that of the positive one. In fact, as discussed previously, the heat transfer in the enclosure is mainly controlled by the conduction and the convection, and as the Rayleigh number is smaller than the critical number , conduction is then the main mode of heat transfer for both cases. For the positive gradient structure in case A, since the dispersal particles near the left side wall is more tightly grouped than that for the negative one, therefore, the conduction effect is more significant, meaning that the total melting time in such a case is much shorter than the negative gradient pore structure, and this statement can also be verified by Figure 6a,b. In addition, as far as the pore structures in case B is considered, it is noted that the last melting PCMs for positive and negative gradient pore structures are mainly distributed over the top-right and the bottom-right corners, respectively (also see Figure 6d,e), and since the porosity of the positive gradient pore structure at the upper part of the cavity is relatively larger, the buoyancy force effect in this area is more significant than that of the negative gradient porous media. As a consequence, the total melting time used for the positive gradient pore structure is a little smaller in contrast to the negative one.
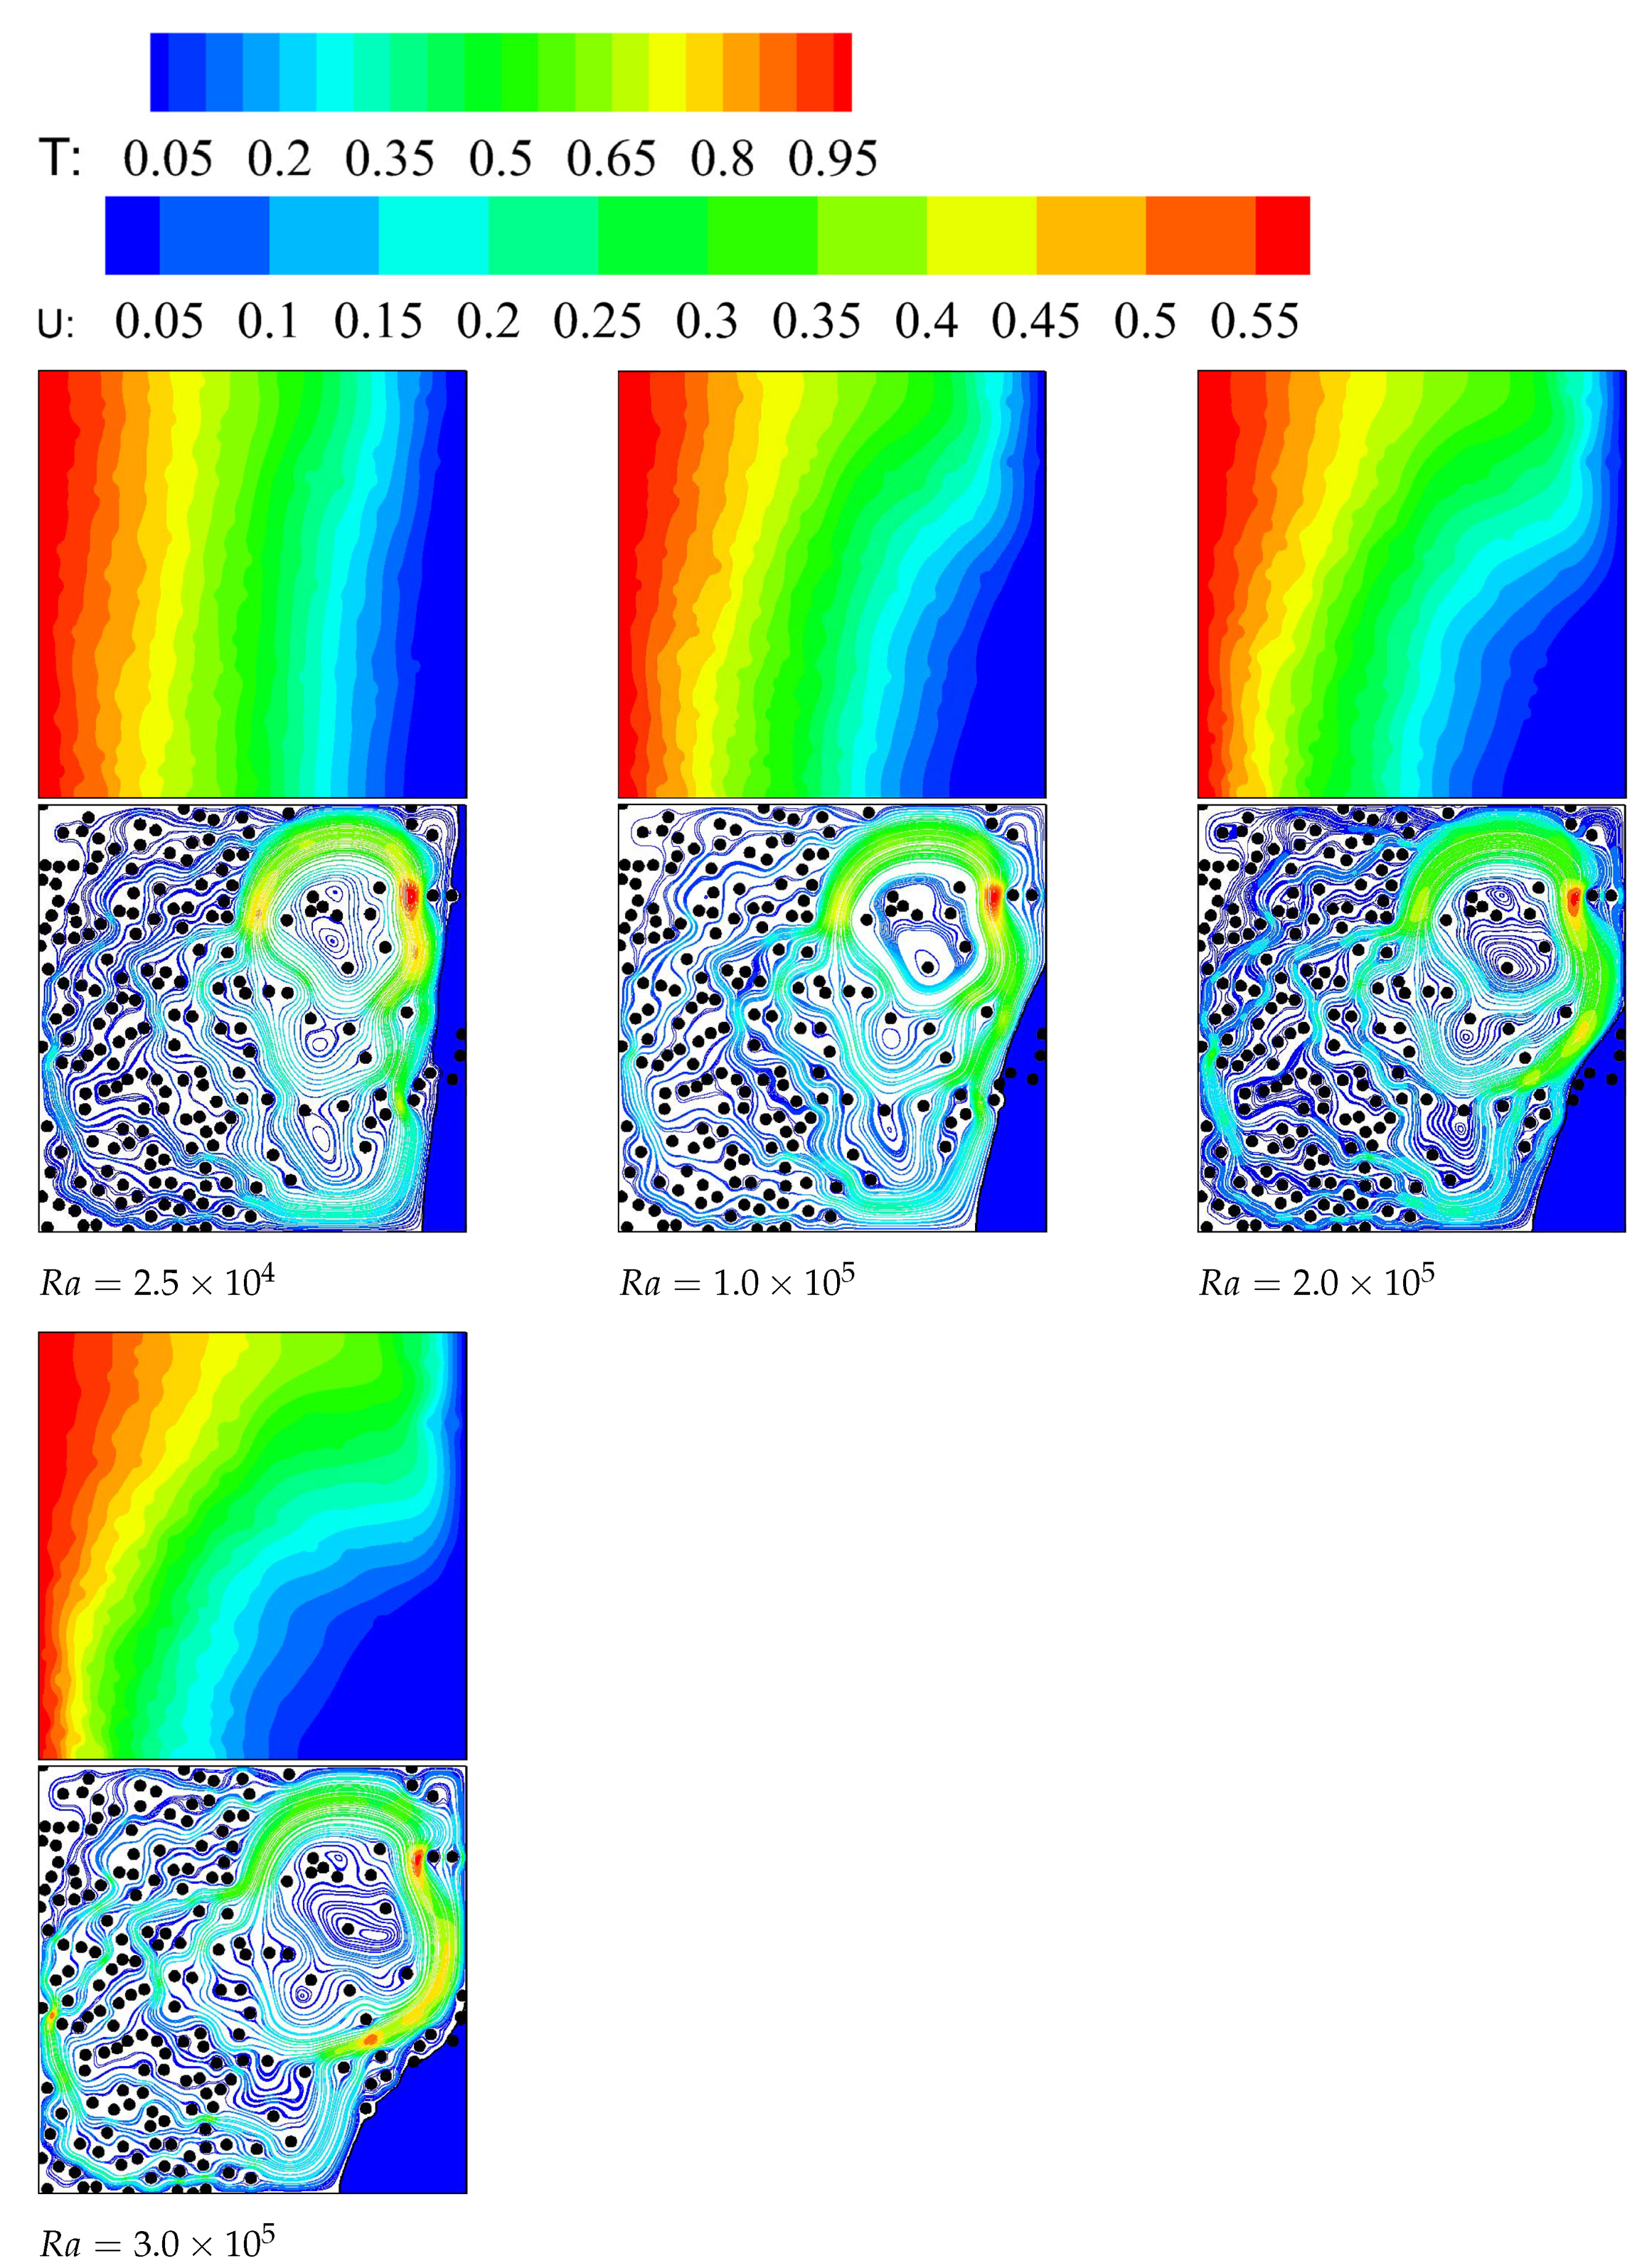
On the other hand, as illustrated in Figure 7, it is found that as the thermal Rayleigh number is higher than the critical number , the melting performance of the negative gradient pore structures is always better than the positive gradient porous media, and this is because that the heat transfer in the enclosure is mainly dominated by the convection, and the “bottom corner phenomenon” in negative gradient pore structures are less likely to be induced; this statement can also be validated by Figure 4. Another point that needs to be emphasized is that the total melting times obtained for the positive gradient porous media in both case A and case B are always increased with the increasing of Rayleigh number. To have a better understanding of this abnormal phenomenon, we also present the distributions of the liquid fraction with dimensionless time for different thermal Rayleigh numbers in Figure 8. As shown in this figure, it is noted that for both cases, although the melting rate increases with increasing Rayleigh number at the early stage, it is decreased with the growing of the thermal Rayleigh number at the final stage. Actually, as shown in Figure 9, one can observe that although the convection effect is more significant as increases, the “bottom corner phenomenon” tends to become more obvious, and the volume of the remaining PCMs at the bottom corner is increased significantly with the increasing of , such that the total melting time increases, which further indicates that the elimination of the bottom corner phenomenon in the PCM melting problem is significant. Further, the above numerical results show that the performance of the gradient porous medium relies on various parameters, and the statement of positive gradient pore structure is better than that of the negative one in some previous works [24,25,26] is somewhat arbitrary. Finally, based on the present numerical data, it can be concluded that there are two ways to eliminate the bottom corner phenomenon for the PCM melting problem, and it is usually related to the Rayleigh number. As , since the heat transfer is dominated by the convection, the bottom corner phenomenon can be eliminated by increasing the porosity of the lower part of the cavity to increase the convection strength at the lower right corner. However, when , due to the main mode of heat transfer is conduction, the bottom corner phenomenon can be prevented by minimizing the porosity of the corner, such that heat conduction at the bottom corner increases.
Finally, the influence of the particle diameter d is also explored, and the corresponding numerical results are presented in Figure 10 and Figure 11, in which the average porous porosities of the porous media for different cases are set to the same value, i.e., 0.875. As seen from Figure 10, it is noted that the influence of the particle diameter on the melting performance in both case A and case B can be neglected, and the total melting time obtained for different cases are nearly identical, and the reasons for this phenomenon are attributed to the following two aspects. For one thing, the conduction is the main mode of heat transfer, and for another, since the average porosities of different particle diameters are identical, the total areas of the solid particle in the enclosure are also the same. As a result, the conduction effects in such a case are comparable and the melting rates of different particle diameters are more likely to be identical. However, as the Rayleigh number increases to , it is found that for the positive gradient structures, the melting rate increases with increasing particle diameter (see Figure 11), which is caused by the fact that as the particle diameter increases, there is more space to induce the natural convection, and a better melting performance is expected. In addition, for the negative gradient pore structures in both case A and case B at this Rayleigh number, it is found that the liquid fraction obtained for is always smaller in contrast to the cases of and . Actually, as the particle diameter is set to , the porosities of the porous media near the right sidewall in case A and the upside wall in case B are smaller, relatively, which further induces a more significant flow resistance during the melting process, causing the melting performance decreases. However, for and , since the average porosity in these two cases is the same as that of , the distribution of the particle in the whole domain is very sparse, and the local porosities in different layers are comparable, resulting in the difference of the liquid fraction in such cases is insignificant.
6. Conclusions
In this paper, a pore scale study is conducted to investigate the solid–liquid phase change in a square cavity filled with gradient porous media by using the total enthalpy-based LB model, and the present LB model is verified by simulating the natural convection in a square enclosure, and the numerical results agree well with the benchmark data. Additionally, in order to improve the computational efficiency, the present algorithm is performed on the GPU by using NVIDIA’s CUDA, and the influences of gradient porosity, Rayleigh number, gradient direction and particle diameter on the phase change heat transfer performance are all investigated in detail.
Based on the present numerical results, it turns out that the porous media with gradient porosities has a significant effect on the melting performance, and it is noted that there is a critical Rayleigh number to determine the performance of the gradient pore structure, and as , the total melting time for the case of negative gradient structures are always shorter than the cases of positive gradient and uniform porous media. On the contrary, the performance of the positive gradient porous media is better than the other cases as , and it is interesting to note that since the bottom corner phenomenon is more easily to be induced at a relatively larger Rayleigh number, the total melting time obtained for the positive gradient porous media increases in thermal Rayleigh number. Furthermore, no matter which the gradient structures we study, the impact of the particle diameter on the melting performance in both case A and case B can be neglected at . However, increasing particle size has a great impact on the liquid fraction when Rayleigh number equals and this phenomenon is more distinct for the positive gradient pore structures.
Further, we would like to give some suggestions in eliminating the bottom corner phenomenon, which has a significant influence on the melting performance. As , since the heat transfer is dominated by the convection, the bottom corner phenomenon can be eliminated by increasing the porosity of the lower part of the cavity to increase the convection strength at the lower right corner. However, when , due to the main mode of heat transfer is conduction, the bottom corner phenomenon can be prevented by minimizing the porosity of the corner such that heat conduction at the bottom corner increases. Finally, the present work just focuses on the two-dimensional case, and we will conduct some three-dimensional simulations on the similar problem in our future work, which is more close to the real problem.
Author Contributions
Methodology, formal analysis, investigation, and writing—original draft preparation, J.H.; supervision, methodology, K.H.; conceptualization, supervision, review and editing, funding acquisition, L.W. All authors have read and agreed to the published version of the manuscript.
Funding
This work is financially supported by the National Natural Science Foundation of China (Grant No. 12002320), and the Fundamental Research Funds for the Central Universities (Grant No. CUGGC05).
Institutional Review Board Statement
Not applicable.
Informed Consent Statement
Not applicable.
Data Availability Statement
Data are contained within the article.
Acknowledgments
The authors gratefully acknowledges the support of Yin Jiang.
Conflicts of Interest
The authors declare no conflict of interest.
References
- Liao, Z.; Xu, C.; Ren, Y.; Gao, F.; Ju, X.; Ju, X. A novel effective thermal conductivity correlation of the PCM melting in spherical PCM encapsulation for the packed bed TES system. Appl. Therm. Eng. 2018, 135, 116–122. [Google Scholar] [CrossRef]
- Arteconi, A.; Hewitt, N.J.; Polonara, F. Domestic demand-side management (DSM): Role of heat pumps and thermal energy storage (TES) systems. Appl. Therm. Eng. 2013, 51, 155–165. [Google Scholar] [CrossRef]
- Agyenima, F.; Hewitta, N.; Eamesb, P.; Smyth, M. A review of materials, heat transfer and phase change problem formulation for latent heat thermal energy storage systems (LHTESS). Renew. Sust. Energ. Rev. 2010, 14, 615–662. [Google Scholar] [CrossRef]
- Sarı, A.; Karaipekli, A. Thermal conductivity and latent heat thermal energy storage characteristics of paraffin/expanded graphite composite as phase change material. Appl. Therm. Eng. 2007, 27, 1271–1277. [Google Scholar] [CrossRef]
- Liu, M.; Saman, W.; Bruno, F. Review on storage materials and thermal performance enhancement techniques for high temperature phase change thermal storage systems. Renew. Sust. Energ. Rev. 2012, 16, 2118–2132. [Google Scholar] [CrossRef]
- Yang, X.H.; Lu, T.J.; Kim, T. Temperature effects on the effective thermal conductivity of phase change materials with two distinctive phases. Int. Commun. Heat Mass Transf. 2011, 38, 1344–1348. [Google Scholar] [CrossRef]
- Zhang, S.; Pu, L.; Xu, L.; Liu, R.; Li, Y. Melting performance analysis of phase change materials in different finned thermal energy storage. Appl. Therm. Eng. 2020, 176, 115425. [Google Scholar] [CrossRef]
- Kok, B. Examining effects of special heat transfer fins designed for the melting process of PCM and Nano-PCM. Appl. Therm. Eng. 2020, 170, 114989. [Google Scholar] [CrossRef]
- Mosaffa, A.H.; Garousi Farshi, L.; Infante Ferreira, C.A.; Rosen, M.A. Energy and exergy evaluation of a multiple-PCM thermal storage unit for free cooling applications. Renew. Energy 2014, 68, 452–458. [Google Scholar] [CrossRef]
- Peiro, G.; Gasia, J.; Miro, L.; Cabeza, L.F. Experimental evaluation at pilot plant scale of multiple PCMs (cascaded) vs. single PCM configuration for thermal energy storage. Renew. Energy 2015, 83, 729–736. [Google Scholar] [CrossRef] [Green Version]
- Xiong, T.; Zheng, L.; Shah, K.W. Nano-enhanced phase change materials (NePCMs): A review of numerical simulations. Appl. Therm. Eng. 2020, 178, 115492. [Google Scholar] [CrossRef]
- Darvanjooghi, M.H.K.; Esfahany, M.N. Experimental investigation of the effect of nanoparticle size on thermal conductivity of in-situ prepared silica–ethanol nanofluid. Int. Commun. Heat Mass Transf. 2016, 77, 148–154. [Google Scholar] [CrossRef]
- Zhao, C.Y. Review on thermal transport in high porosity cellular metal foams with open cells. Int. J. Heat Mass Transfer. 2012, 55, 3618–3632. [Google Scholar] [CrossRef]
- Chen, Z.; Gao, D.; Shi, J. Experimental and numerical study on melting of phase change materials in metal foams at pore scale. Int. J. Heat Mass Transf. 2014, 72, 646–655. [Google Scholar] [CrossRef]
- Yang, J.L.; Yang, L.J.; Xu, C.; Du, X.Z. Experimental study on enhancement of thermal energy storage with phase-change material. Appl. Energy 2016, 169, 164–176. [Google Scholar] [CrossRef]
- Zhao, Y.; Zhao, C.Y.; Xu, Z.G.; Xu, H.J. Modeling metal foam enhanced phase change heat transfer in thermal energy storage by using phase field method. Int. J. Heat Mass Transf. 2016, 99, 170–181. [Google Scholar] [CrossRef]
- Tao, Y.B.; You, Y.; He, Y.L. Lattice Boltzmann simulation on phase change heat transfer in metal foams/paraffin composite phase change material. Appl. Therm. Eng. 2016, 93, 476–485. [Google Scholar] [CrossRef]
- Zhu, F.; Zhang, C.; Gong, X.L. Numerical analysis and comparison of the thermal performance enhancement methods for metal foam/phase change material composite. Appl. Therm. Eng. 2016, 109, 373–383. [Google Scholar] [CrossRef]
- Yao, Y.P.; Wu, H.Y.; Liu, Z.Y.; Gao, Z.S. Pore-scale visualization and measurement of paraffin melting in high porosity open-cell copper foam. Int. J. Therm. Sci. 2018, 123, 73–85. [Google Scholar] [CrossRef]
- Yang, X.H.; Wang, X.Y.; Liu, Z.; Guo, Z.X.; Jin, L.W.; Yang, C. Influence of aspect ratios for a tilted cavity on the melting heat transfer of phase change materials embedded in metal foam. Int. Commun. Heat Mass Transf. 2021, 122, 105127. [Google Scholar] [CrossRef]
- Yang, J.L.; Yang, L.J.; Xu, C.; Du, X.Z. Numerical analysis on thermal behavior of solid–liquid phase change within copper foam with varying porosity. Int. J. Heat Mass Transf. 2015, 84, 1008–1018. [Google Scholar] [CrossRef]
- Zhu, F.; Zhang, C.; Gong, X.L. Numerical analysis on the energy storage efficiency of phase change material embedded in finned metal foam with graded porosity. Appl. Therm. Eng. 2017, 123, 256–265. [Google Scholar] [CrossRef]
- Zhang, Z.Q.; He, X.D. Three-dimensional numerical study on solid-liquid phase change within open-celled aluminum foam with porosity gradient. Appl. Therm. Eng. 2017, 113, 298–308. [Google Scholar] [CrossRef]
- Yang, X.H.; Wei, P.; Wang, X.Y.; He, Y.L. Gradient design of pore parameters on the melting process in a thermal energy storage unit filled with open-cell metal foam. Appl. Energy 2020, 268, 115019. [Google Scholar] [CrossRef]
- Ghahremannezhad, A.; Xu, H.J.; Salimpour, M.R.; Wang, P.; Vafai, K. Thermal performance analysis of phase change materials (PCMs) embedded in gradient porous metal foams. Appl. Therm. Eng. 2020, 179, 115731. [Google Scholar] [CrossRef]
- Hu, C.Z.; Li, H.Y.; Tang, D.W.; Zhu, J.; Wang, K.M.; Hu, X.F.; Bai, M.L. Pore-scale investigation on the heat-storage characteristics of phase change material in graded copper foam. Appl. Therm. Eng. 2020, 178, 115609. [Google Scholar] [CrossRef]
- Marri, G.K.; Balaji, C. Experimental and numerical investigations on the effect of porosity and PPI gradients of metal foams on the thermal performance of a composite phase change material heat sink. Int. J. Heat Mass Transf. 2021, 164, 120454. [Google Scholar] [CrossRef]
- Erfani, H.; Babaei, M.; Niasar, V. Signature of Geochemistry on Density-Driven CO Mixing in Sandstone Aquifers. Water Resour. Res. 2020, 56, e2019WR026060. [Google Scholar]
- Erfani, H.; Babaei, M.; Niasar, V. Dynamics of CO2 Density-Driven Flow in Carbonate Aquifers: Effects of Dispersion and Geochemistry. Water Resour. Res. 2021, 57, e2020WR027829. [Google Scholar]
- Fang, W.Z.; Tang, Y.Q.; Yang, C.; Tao, W.T. Pore scale investigations on melting of phase change materials considering the interfacial thermal resistance. Int. Commun. Heat Mass Transf. 2020, 115, 104631. [Google Scholar] [CrossRef]
- Chen, S.Y.; Doolen, G.D. Lattice Boltzmann method for fluid flows. Annu. Rev. Fluid Mech. 1998, 30, 329–364. [Google Scholar] [CrossRef] [Green Version]
- Krastev, V.K.; Falcucci, G. Simulating Engineering Flows through Complex Porous Media via the Lattice Boltzmann Method. Energies 2018, 11, 175. [Google Scholar] [CrossRef] [Green Version]
- Frouté, L.; Wang, Y.H.; Aryana, S.A.; Kovscek, A.R. Transport Simulations on Scanning Transmission Electron Microscope Images of Nanoporous Shale. Energies 2020, 13, 6665. [Google Scholar] [CrossRef]
- Li, T.F.; Su, Z.G.; Luo, K.; Yi, H.L. Transition to chaos in electro-thermoconvection of a dielectric liquid in a square cavity. Phys. Fluids 2020, 32, 013106. [Google Scholar]
- He, K.; Guo, X.Y.; Zhang, X.Y.; Wang, L. Numerical investigation on electrohydrodynamic solid-liquid phase change in a square enclosure. Acta Phys. Sin. 2021, 70, 14. [Google Scholar]
- Wang, L.; Wei, Z.C.; Li, T.F.; Chai, Z.H.; Shi, B.C. A lattice Boltzmann modelling of electrohydrodynamic conduction phenomenon in dielectric liquids. Appl. Math. Model. 2021, 95, 361–378. [Google Scholar] [CrossRef]
- He, K.; Ma, B.; Wang, L. Numerical study on electrohydrodynamic enhancement of PCM melting in cylindrical annulus under microgravity. arXiv 2021, arXiv:2104.14305. [Google Scholar]
- Zhang, X.Y.; Wang, L.; Li, D.G. Lattice Boltzmann simulation of natural convection melting in a cubic cavity with an internal cylindrical heat source. Int. J. Therm. Sci. 2021, 165, 106917. [Google Scholar] [CrossRef]
- Zhao, Y.; Shi, B.C.; Chai, Z.H.; Wang, L. Lattice Boltzmann simulation of melting in a cubical cavity with a local heat-flux source. Int. J. Heat Mass Transf. 2018, 127, 497–506. [Google Scholar] [CrossRef]
- Zhao, Y.; Wang, L.; Chai, Z.H.; Shi, B.C. Comparative study of natural convection melting inside a cubic cavity using an improved two-relaxation-time lattice Boltzmann model. Int. J. Heat Mass Transf. 2019, 143, 118449. [Google Scholar] [CrossRef]
- Zhou, F.; Cheng, G.X. Lattice Boltzmann model for predicting effective thermal conductivity of composite with randomly distributed particles: Considering effect of interactions between particles and matrix. Comput. Mater. Sci. 2014, 92, 157–165. [Google Scholar] [CrossRef]
- Wang, L.; Zhao, Y.; Yang, X.G.; Shi, B.C.; Chai, Z.H. A lattice Boltzmann analysis of the conjugate natural convection in a square enclosure with a circular cylinder. Appl. Math. Model. 2019, 71, 31–44. [Google Scholar] [CrossRef]
- Guo, Z.L.; Shi, B.C.; Wang, N.C. Lattice BGK Model for Incompressible Navier–Stokes Equation. J. Comput. Phys. 2000, 165, 288–306. [Google Scholar] [CrossRef]
- Guo, Z.L.; Zheng, C.G.; Shi, B.C. Discrete lattice effects on the forcing term in the lattice Boltzmann method. Phys. Rev. E 2002, 65, 046308. [Google Scholar] [CrossRef] [PubMed]
- Huang, R.Z.; Wu, H.Y.; Cheng, P. A new lattice Boltzmann model for solid—Liquid phase change. Int. Commun. Heat Mass Transf. 2013, 59, 295–301. [Google Scholar] [CrossRef]
- Lu, J.H.; Lei, H.Y.; Dai, C.S. An optimal two-relaxation-time lattice Boltzmann equation for solid-liquid phase change: The elimination of unphysical numerical diffusion. Int. J. Therm. Sci. 2019, 135, 17–29. [Google Scholar] [CrossRef]
- Huo, Y.; Rao, Z. Lattice Boltzmann simulation for solid–liquid phase change phenomenon of phase change material under constant heat flux. Int. J. Heat Mass Transf. 2015, 86, 197–206. [Google Scholar] [CrossRef]
- Guo, Z.L.; Zheng, C.G.; Shi, B.C. An extrapolation method for boundary conditions in lattice Boltzmann method. Phys. Fluids 2002, 6, 2007–2010. [Google Scholar] [CrossRef]
Figure 1.
Schematic of solid–liquid phase change in gradient porous media, in which the porous media consists of various solid particles denoted by black spots, and the dash line represents the solid–liquid interface: (a) Case A: horizontal porosity gradient; (b) Case B: vertical porosity gradient.
Figure 1.
Schematic of solid–liquid phase change in gradient porous media, in which the porous media consists of various solid particles denoted by black spots, and the dash line represents the solid–liquid interface: (a) Case A: horizontal porosity gradient; (b) Case B: vertical porosity gradient.

Figure 2.
Comparisons of liquid fraction , average Nusselt number (a) and phase interface position (b) between present numerical results and Huang et al. [45].
Figure 2.
Comparisons of liquid fraction , average Nusselt number (a) and phase interface position (b) between present numerical results and Huang et al. [45].

Figure 3.
Comparisons of liquid fraction in three gradient structures for (a) case A and (b) case B at , in which , and .
Figure 3.
Comparisons of liquid fraction in three gradient structures for (a) case A and (b) case B at , in which , and .

Figure 4.
The distribution of the liquid fraction for different gradient structures at , in which , and : (a) Case A: negative gradient; (b) Case A: positive gradient; (c) Uniform gradient; (d) Case B: negative gradient; (e) Case B: positive gradient.
Figure 4.
The distribution of the liquid fraction for different gradient structures at , in which , and : (a) Case A: negative gradient; (b) Case A: positive gradient; (c) Uniform gradient; (d) Case B: negative gradient; (e) Case B: positive gradient.

Figure 5.
Comparisons of in three gradient structures for (a) case A and (b) case B at , in which , and .
Figure 5.
Comparisons of in three gradient structures for (a) case A and (b) case B at , in which , and .

Figure 6.
The distribution of the liquid fraction for different gradient structures at , in which , and : (a) Case A: negative gradient; (b) Case A: positive gradient; (c) Uniform gradient; (d) Case B: negative gradient; (e) Case B: positive gradient.
Figure 6.
The distribution of the liquid fraction for different gradient structures at , in which , and : (a) Case A: negative gradient; (b) Case A: positive gradient; (c) Uniform gradient; (d) Case B: negative gradient; (e) Case B: positive gradient.

Figure 7.
Comparisons of total melting time in two different gradient structure for different , in which , and : (a) Case A; (b) Case B.
Figure 7.
Comparisons of total melting time in two different gradient structure for different , in which , and : (a) Case A; (b) Case B.

Figure 8.
Comparisons of total melting time for positive gradient structure at different , in which , and : (a) Case A; (b) Case B.
Figure 8.
Comparisons of total melting time for positive gradient structure at different , in which , and : (a) Case A; (b) Case B.

Figure 9.
Comparisons of temperature, streamlines and liquid fraction distributions in turning point for positive gradient of case A at , in which , and .
Figure 9.
Comparisons of temperature, streamlines and liquid fraction distributions in turning point for positive gradient of case A at , in which , and .

Figure 10.
Comparisons of liquid fraction at different particle diameters for , in which , and : (a) Case A; (b) Case B.
Figure 10.
Comparisons of liquid fraction at different particle diameters for , in which , and : (a) Case A; (b) Case B.

Figure 11.
Comparisons of liquid fraction at different particle diameters for , in which , and : (a) Case A; (b) Case B.
Figure 11.
Comparisons of liquid fraction at different particle diameters for , in which , and : (a) Case A; (b) Case B.

Publisher’s Note: MDPI stays neutral with regard to jurisdictional claims in published maps and institutional affiliations. |
© 2021 by the authors. Licensee MDPI, Basel, Switzerland. This article is an open access article distributed under the terms and conditions of the Creative Commons Attribution (CC BY) license (https://creativecommons.org/licenses/by/4.0/).
Share and Cite
MDPI and ACS Style
Huang, J.; He, K.; Wang, L. Pore-Scale Investigation on Natural Convection Melting in a Square Cavity with Gradient Porous Media. Energies 2021, 14, 4274. https://doi.org/10.3390/en14144274
AMA Style
Huang J, He K, Wang L. Pore-Scale Investigation on Natural Convection Melting in a Square Cavity with Gradient Porous Media. Energies. 2021; 14(14):4274. https://doi.org/10.3390/en14144274
Chicago/Turabian StyleHuang, Jiangxu, Kun He, and Lei Wang. 2021. "Pore-Scale Investigation on Natural Convection Melting in a Square Cavity with Gradient Porous Media" Energies 14, no. 14: 4274. https://doi.org/10.3390/en14144274
Note that from the first issue of 2016, this journal uses article numbers instead of page numbers. See further details here.