Article

Drying and Heating Processes in Arbitrarily Shaped Clay Materials Using Lumped Phenomenological Modeling

by
Elisiane S. Lima
1,
João M. P. Q. Delgado
2,*,
Ana S. Guimarães
2,
Wanderson M. P. B. Lima
1,
Ivonete B. Santos
3,
Josivanda P. Gomes
4,
Rosilda S. Santos
5,
Anderson F. Vilela
6,
Arianne D. Viana
6,
Genival S. Almeida
7,
Antonio G. B. Lima
1 and
João E. F. Franco
1
1
Department of Mechanical Engineering, Federal University of Campina Grande, Campina Grande, PB 58429-900, Brazil
2
CONSTRUCT-LFC, Department of Civil Engineering, Faculty of Engineering, University of Porto, 4200-465 Porto, Portugal
3
Department of Physics, State University of Paraiba, Campina Grande, PB 58429-500, Brazil
4
Department of Agricultural Engineering, Federal University of Campina Grande, Campina Grande, PB 58429-900, Brazil
5
Department of Science and Technology, Federal Rural University of the Semi-Arid Region, Caraúbas, RN 59780-000, Brazil
6
Department of Agro-Industrial Management and Technology, Federal University of Paraíba, Bananeiras, PB 58220-000, Brazil
7
Federal Institute of Education, Science and Technology of Paraiba, Pedras de Fogo, PB 58328-000, Brazil
*
Author to whom correspondence should be addressed.
Energies 2021, 14(14), 4294; https://doi.org/10.3390/en14144294
Submission received: 14 June 2021 / Revised: 12 July 2021 / Accepted: 13 July 2021 / Published: 16 July 2021
(This article belongs to the Special Issue Advances of Heat Transfer in Porous Media)

Abstract

:
This work aims to study the drying of clay ceramic materials with arbitrary shapes theoretically. Advanced phenomenological mathematical models based on lumped analysis and their exact solutions are presented to predict the heat and mass transfers in the porous material and estimate the transport coefficients. Application has been made in hollow ceramic bricks. Different simulations were carried out to evaluate the effect of drying air conditions (relative humidity and speed) under conditions of forced and natural convection. The transient results of the moisture content and temperature of the brick, and the convective heat and mass transfer coefficients are presented, discussed and compared with experimental data, obtaining a good agreement. It was found that the lower the relative humidity is and the higher the speed of the drying air is, the higher the convective heat and mass transfer coefficients are at the surface of the brick and in the holes, and the faster the moisture removal material and heating is. Based on the predicted results, the best conditions for brick drying were given. The idea is to increase the quality of the brick after the process, to reduce the waste of raw material and energy consumption in the process.

1. Introduction

The need for investment in improving quality and productivity is a growing concern for the ceramics sector worldwide. Currently, the industrial ceramics sector is well diversified, consisting of several segments, such as red ceramics, coating materials, refractory materials, electrical porcelain insulators, tableware, artistic ceramics, ceramic filters for domestic use, technical ceramics and thermal insulation.
Red ceramics are a class of material with a reddish color. This raw material has been used in civil construction to manufacture products of different geometries, such as bricks, blocks, tiles, floors, hollow elements, slabs, tubes, decorative vases, household and adornment artifacts, among others.
The red ceramic sector only uses common clay as a raw material for the manufacture of its products. The clays contain a wide variety of mineral substances of a clay nature, such as quaternary alluvial clays, mudstones, siltstones, shales and rhythms, which burn in reddish colors, at temperatures between 800 and 1250 °C. These clays generally have a very fine granulometry, a characteristic that gives them, with the incorporated organic matter, different degrees of plasticity when added with certain percentages of water, and the workability and resistance to green, dry and after the firing process, which are important aspects for the manufacture of a wide variety of ceramic products [1].
As it is a sector that produces solid and pierced bricks, structural blocks, tiles and floors, which has great application in civil construction, the production of red ceramic products, also known as structural ceramics, is considered a basic activity, due to the fact that it can be applied to construct homes, buildings, etc. Thus, due to its importance, in terms of energy and environmental impact, it is necessary to know the manufacture of products originated from clay.
The manufacturing process of clayey ceramic products comprises several stages, such as the exploration of deposits, the pre-treatment of raw materials, homogenization, drying, firing and dispatch [2]. After being extracted from the soil, the clay is sieved and then moistened with water. These procedures give the material greater plasticity [3], which facilitates the molding of wet clay in the shape of the desired piece and increases its mechanical resistance, still in the green state, to be subjected to drying.
Drying is a thermodynamic process whereby the moisture in the solid is reduced by providing a large amount of thermal energy to evaporate the water and heats the humid solid. This drying occurs due to the transport of moisture from the center to the surface of the material, and heat conduction from the surface to the center of the material, when it comes to convective drying, for example. Moisture transport can occur in the form of liquid and/or vapor, depending on the type of the solid, their characteristics in terms of material (shape, composition, porosity, granulometry, etc.) and the percentage of moisture present in them.
Drying is the stage of the process that precedes firing. In the industry, convective drying is the technique usually employed. It is an artificial drying that is carried out in drying chambers or oven. In this type of drying, temperature, relative humidity and air speed (the thermodynamic state of the drying air) and the characteristics of the raw material, the shape of the pieces and the type of dryer are essential conditions for the duration of drying.
In general, the water is evaporated in drying chambers at temperatures ranging from approximately 38 to 204 °C. The total drying time is usually between 24 and 48 h. Although heat can be generated specifically for the drying chambers, it is usually supplied from the exhaust heat of the kiln used to fire ceramic products, with the aim of maximizing the thermal efficiency of the plant.
In any physical situation, heat and moisture must be carefully regulated to avoid or minimize drying problems, such as cracks in the brick. During the drying stage, shrinkage affects the mechanical strength and shape of clay bricks. Cracks can be seen when very rapid drying has been allowed, causing high mechanical stresses within the brick that can produce cracks or local breakage.
The mechanisms of moisture migration and heating in the material during drying can be affected by internal and external conditions and are not yet well known. In this sense, some authors [4,5,6,7,8,9] state that during the drying of clayey material, the main moisture migration mechanism is liquid diffusion. However, other researchers such as the authors of [10,11] consider that a diffusive transport of liquid and vapor occurs, predominantly in certain moments of drying.
With the drying performed incorrectly, the removal of water from the piece is left uncontrolled, which can cause structural damages such as cracks, deformations, warping and, consequently, a great loss of products. That is why drying operations are important industrial processes and knowing the mechanism of moisture and heat transfer is of fundamental importance for the ceramic industry. Additionally, this can be conducted through refined and precise experimental and theoretical studies, in order to determine the process parameters and their effects on the quality of the final product.
Therefore, control of the drying process and knowledge of the main mechanism of moisture migration inside the material play important roles. Further, since with simulation and/or experimental data, the best conditions of the process (minimum product losses and energy consumption) can be verified, an improvement in the product quality and a less expensive product can be obtained.
Drying experiments, although not less important, require a lot of time to perform and require infrastructure (well-equipped laboratories), which is not always used by the industrial sector. On the other hand, numerical simulation requires little infrastructure for its realization, which makes it less expensive and makes it possible to obtain quick results, which is desirable for the industrial sector.
Mathematical modeling and numerical simulation present a series of useful aspects from a scientific point of view. Depending on the material studied, its shape and arrangements, mathematical models applied to drying can be divided into lumped or distributed models [12,13,14,15,16,17]. The lumped models describe the rates of heat and mass transfer of the material, ignoring the internal resistance of heat and mass transfer, that is, the effects of temperature and moisture variation inside the material are neglected. In contrast, the distributed models describe the rates of heat and mass transfer as a function of the position within the material and the drying time. Thus, it is clear that these models consider the external and internal resistances to the transport of heat and mass inside the product.
The distributed models based on the diffusion of liquid and/or vapor within the solid describe the rates of heat and mass transfer as a function of the position within the solid and the drying time, thus considering the resistances (external and internal) to the heat and mass fluxes. When applied to the drying of ceramic materials, the following works related to the diffusive model are reported in the literature [9,18,19].
Lumped models can be classified as empirical, semi-empirical and theoretical. In the empirical model, the moisture content is expressed only as a function of the drying time, while the semi-empirical model considers that the drying rate is proportional to the difference between the moisture content of the product and its respective equilibrium moisture content. On the other hand, theoretical models are derived from the distributed models when severe considerations are previously established [17].
In this context, some research related to the drying models applied to ceramic materials, based on a lumped analysis, is reported in the literature. In some of these works, drying experiments are carried out, empirical models are proposed and a linear or non-linear regression is performed to predict the removal of moisture and heating of the product and, subsequently, to estimate the convective mass and heat transfer coefficients on the surface of the product using distributed models [20]. In others, the authors develop a lumped phenomenological mathematical modeling and use previously established heat and mass transfer coefficients to perform simulations and evaluate the effects of these parameters on the drying process [21,22].
Thus, the need to develop more complete (phenomenological) lumped models that involve external and internal parameters to the porous and humid solid was perceived, aiming to make a greater contribution in the prediction of the phenomena of heat and mass transport that occur during the drying of a ceramic material. Then, some researchers have published studies related to predictions of moisture adsorption and desorption in building material under isothermal condition using lumped model, such as the effective moisture penetration depth model [23] and the moisture buffering model [24]. The effective moisture penetration depth model is not suitable when the hygroscopic material is thin and limited, while the moisture buffering model considers that the mass of moisture buffering of the materials is in balance with the room humidity. These assumptions reduce the accuracy of the models provoking deviation between predicted and experimental data. Moreover, these models are commonly applied for physical situations at room temperature.
In view of the above, this work aims to study the heat and mass transfer in porous and arbitrarily shaped solids using the method of lumped analysis with particular reference to the drying of industrial hollow ceramic bricks. The idea is to show the development of a new and advanced phenomenological mathematical model and its analytical solution to predict the drying process and estimate the convective heat and mass transfer coefficients at different process operational conditions, without the need to perform linear or non-linear mathematical regression from experimental data and apply for an arbitrarily shaped body. It is, therefore, an innovative formulation that will certainly help engineers, industrialists, academics and people interested in the subject in making decisions aimed at improving and optimizing the drying process, with regard to energy savings, product quality and an increase in industrial competitiveness. Furthermore, the model has great potential to be applied in predicting moisture adsorption and desorption at room temperature without restrictions or modifications.

2. Methodology

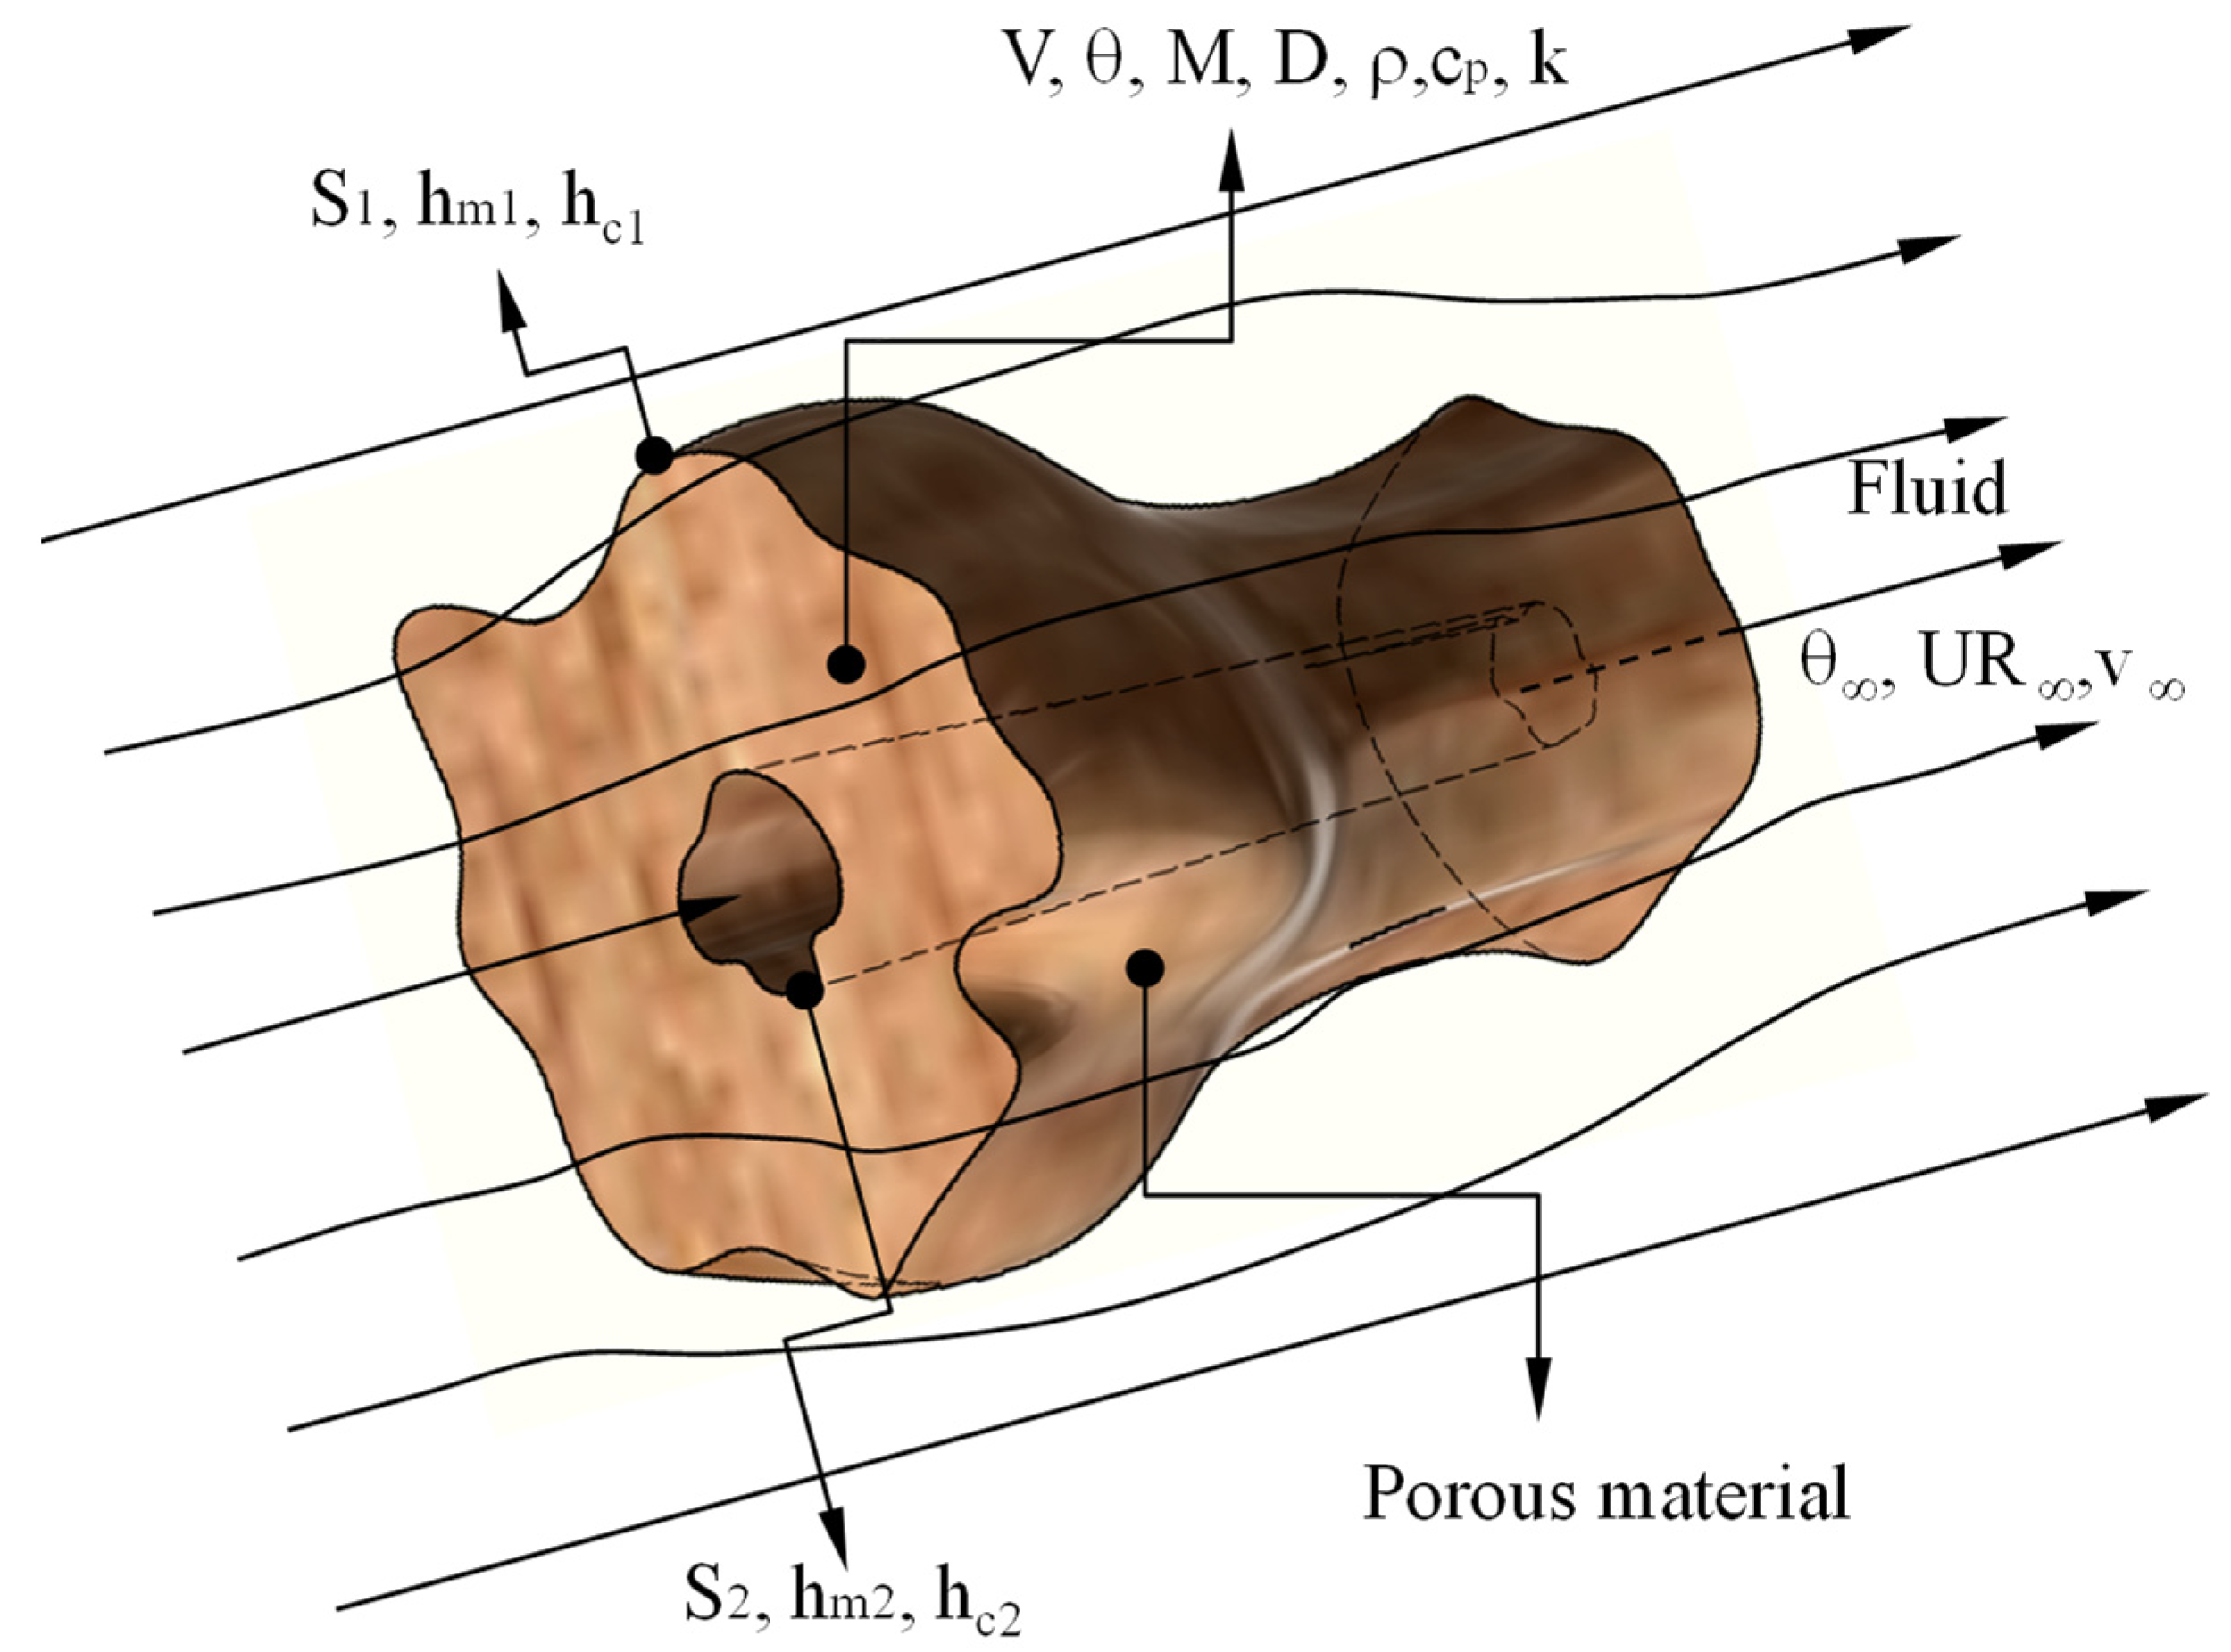
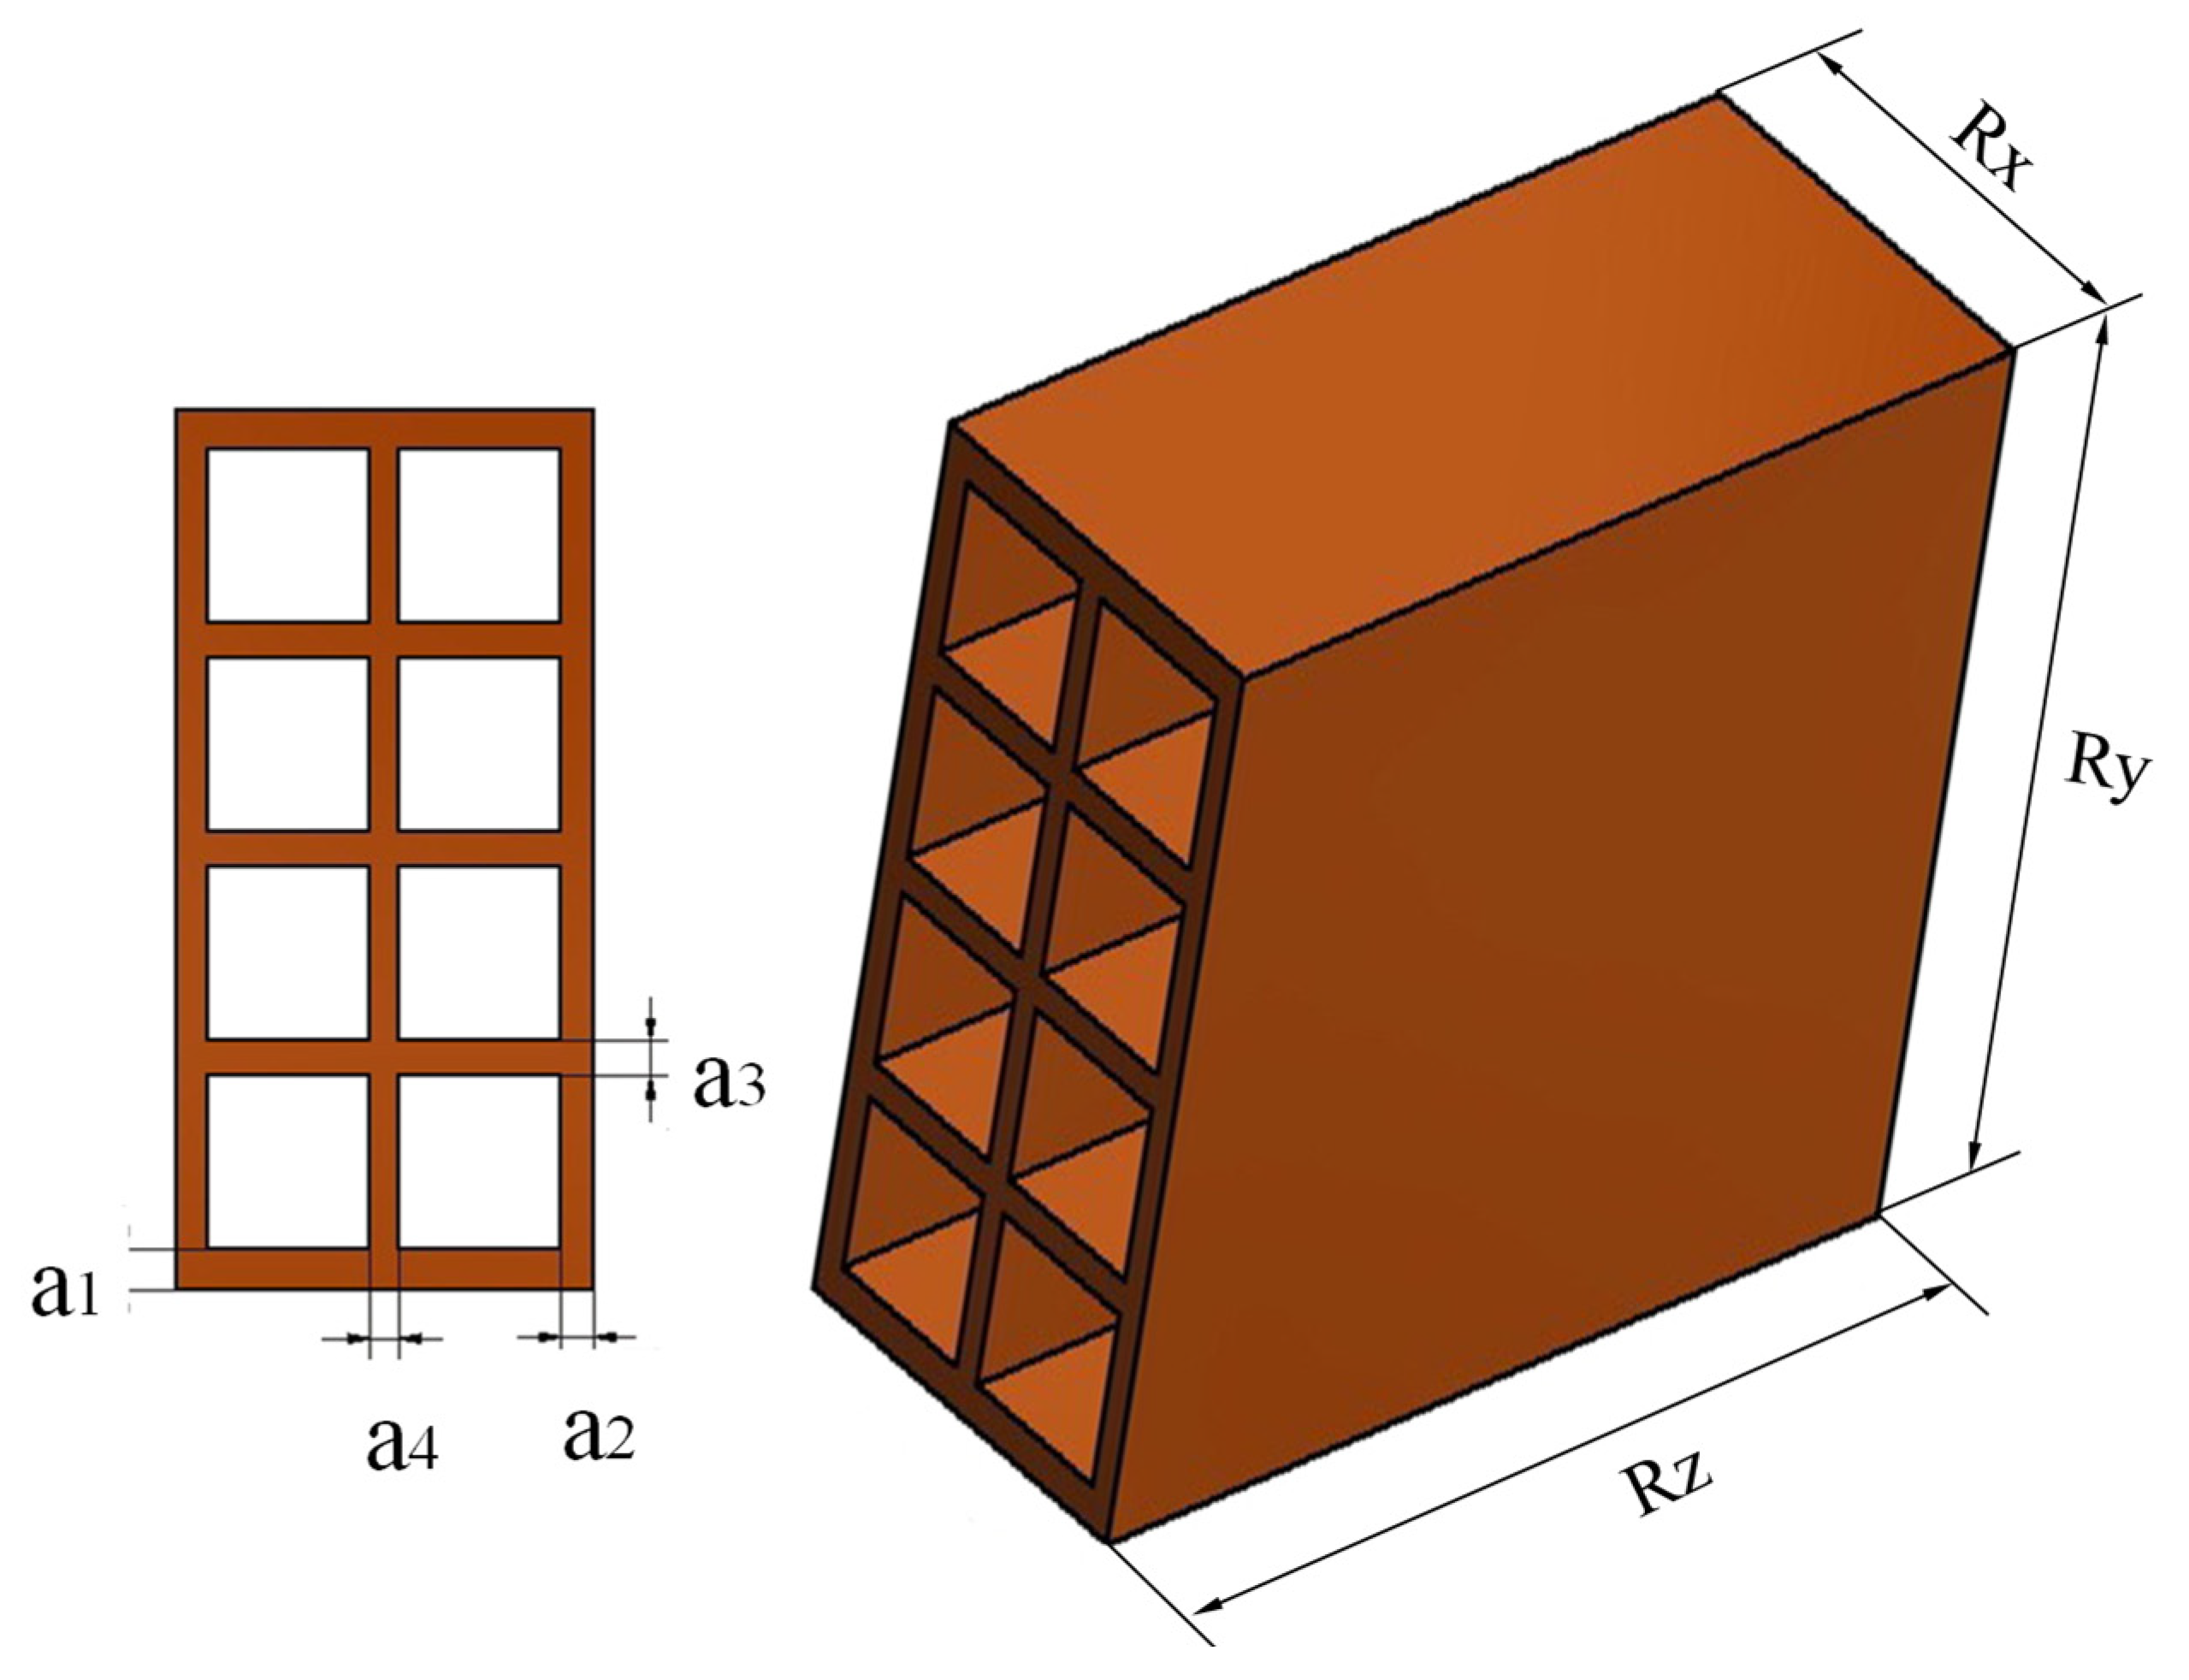
2.1. The Physical Problem and Geometry

To assist in understanding the lumped approach, consider a porous body of arbitrary and hollow shape, as shown in Figure 1. The material can receive (or provide) heat and/or moisture fluxes per unit of area on its surface and has an evenly distributed internal generation of mass and/or energy per unit of volume. The lumped analysis method [25] admits that the moisture and/or temperature of the solid have a uniform distribution at any time, in such a way that the moisture and/or temperature gradients of the solid are negligible. Therefore, the moisture content and temperature of the material vary only with time. Therefore, it is a transient physical problem.

2.2. Mathematical Modeling

In order to mathematically model the drying process of arbitrary-shaped porous material (Figure 1), the following assumptions were adopted:
(a)
The solid is homogeneous and with constant thermophysical properties;
(b)
Moisture content and temperature distributions inside the brick are uniform along the drying process;
(c)
Drying process occurs by heat and mass diffusion inside the solid and heat and mass convection and evaporation occur on its surface;
(d)
Dimensions of the brick are constant along the drying process.

2.2.1. Mass Conservation Equation

To predict the transfer of mass in the holed porous product and with arbitrary shape, based on the adopted considerations, the following mass conservation equation is proposed for all physical domain presented in Figure 1:
V d   M ¯ dt = h m 1 S 1 ( M ¯ M ¯ e ) h m 2 S 2 ( M ¯ M ¯ e ) + M ˙   V
Using the initial condition M (t = 0) = M 0 , separating the variables from Equation (1) and integrating it from the initial condition, we have the following as a result:
( M ¯ M ¯ e ) M ˙   V h m 1 S 1 + h m 2 S 2 ( M ¯ 0 M ¯ e ) M ˙   V h m 1 S 1 + h m 2 S 2 = Exp [ ( h m 1 S 1 h m 2 S 2 V ) t ]
where, in Equations (1) and (2), M ¯ is the moisture content on a dry basis (kg/kg); h m 1 and h m 2 are the external and internal convective mass transfer coefficients (m/s), respectively; V is the volume of the homogeneous solid (m³); S1 and S2 are the external and internal surface areas of the homogeneous solid (m²), respectively; M ˙ is the generation of moisture (kg/kg/s); M e is the equilibrium moisture content on a dry basis (kg/kg) and t is the time (s).

2.2.2. Thermal Energy Conservation Equation

For the analysis of heat transfer, mass transfer analogy can be made and we can assume that on the surface of the solid thermal convection, the evaporation and heating of the produced vapor occur simultaneously. Therefore, the following energy conservation equation is valid for all the physical domains presented in Figure 1:
ρ u Vc p d θ ¯ dt = h c 1 S 1 ( θ ¯ θ ¯ ) + h c 2 S 2 ( θ ¯ θ ¯ ) + ρ s V d M ¯ dt [ h fg + c v ( θ ¯ θ ¯ ) ] + q ˙ V
where ρ u is the specific density of the wet solid (kg/ m 3 ); c p is the specific heat (J/kgK); θ ¯ is the instantaneous temperature of the solid (K or °C);   θ ¯ is the temperature of the external medium (K or °C); θ ¯ 0 is the initial temperature of the solid (K or °C); h c 1 and h c 2 are the external and internal convective heat transfer coefficients (W/ m 2 K ), respectively; ρ s is the specific density of the dry solid (kg/ m 3 ); c v is the specific heat of the vapor (J/kgK); h fg is the latent heat of water vaporization (J/kg) and q   ˙ is the heat generation per unit volume (W/m³).
Equation (3) is an ordinary differential equation of the first order, it is non-linear and inhomogeneous; therefore, it cannot be solved analytically. Thus, for the simplification of Equation (3), the energy needed to heat water vapor from the temperature on the surface of the solid to the temperature of the fluid is disregarded. Thus, after simplifying and replacing Equations (1) and (2) in Equation (3), the result is as follows:
ρ Vc p d θ ¯ dt = ( h c 1 S 1 + h c 2 S 2 ) ( θ ¯ θ ¯ ) + ρ s h fg { ( h m 1 S 1 h m 2 S 2 ) [ [ ( M ¯ 0 M ¯ e ) M ˙ V h m 1 S 1 + h m 2 S 2 ] Exp [ ( h m 1 S 1 h m 2 S 2 V ) t ] + M ˙ V h m 1 S 1 + h m 2 S 2 ] + M ˙ V } + q ˙ V
or yet
d θ ¯ dt = ( ( h c 1 S 1 + h c 2 S 2 ρ Vc p ) ( θ ¯ θ ¯ ) +
ρ s h fg ρ Vc p { [ ( h m 1 S 1 h m 2 S 2 ) ( M ¯ 0 M ¯ e ) + M ˙ V ]   Exp [ ( h m 1 S 1 h m 2 S 2 V ) t ] } + q ˙ ρ c p
Assuming y = θ ¯ θ ¯ , then dy dt = d θ ¯ dt . Thus, Equation (5) can be written as follows:
y + a = be ct d
where
a = ( h c 1 S 1 + h c 2 S 2 ) ρ Vc p
b   = ρ s h fg ρ c p [ ( h m 1 S 1 h m 2 S 2 ) ( M ¯ 0 M ¯ e ) + M ˙ V ]
c   = h m 1 S 1 h m 2 S 2 V
d = q ˙ ρ c p
Using the initial condition, θ ¯ ( t = 0 ) = θ ¯ 0 , and solving Equation (6), we obtain as a result the following:
θ ¯ = θ ¯ [ ( θ ¯ θ ¯ 0 ) + ( b a c + d a ) ] e at + ( b a c e ct + d a )
Equation (11) describes the transient behavior of the temperature of the solid throughout the drying process. It is important to note that Equation (1) and (3) incorporate several thermophysical parameters of the heating fluid and the material, in such a way, that the model proposed to describe the drying of the material can be considered as phenomenological, differently from the models commonly used in the literature, for such purpose.

2.3. Applications to Drying of Industrial Ceramic Bricks

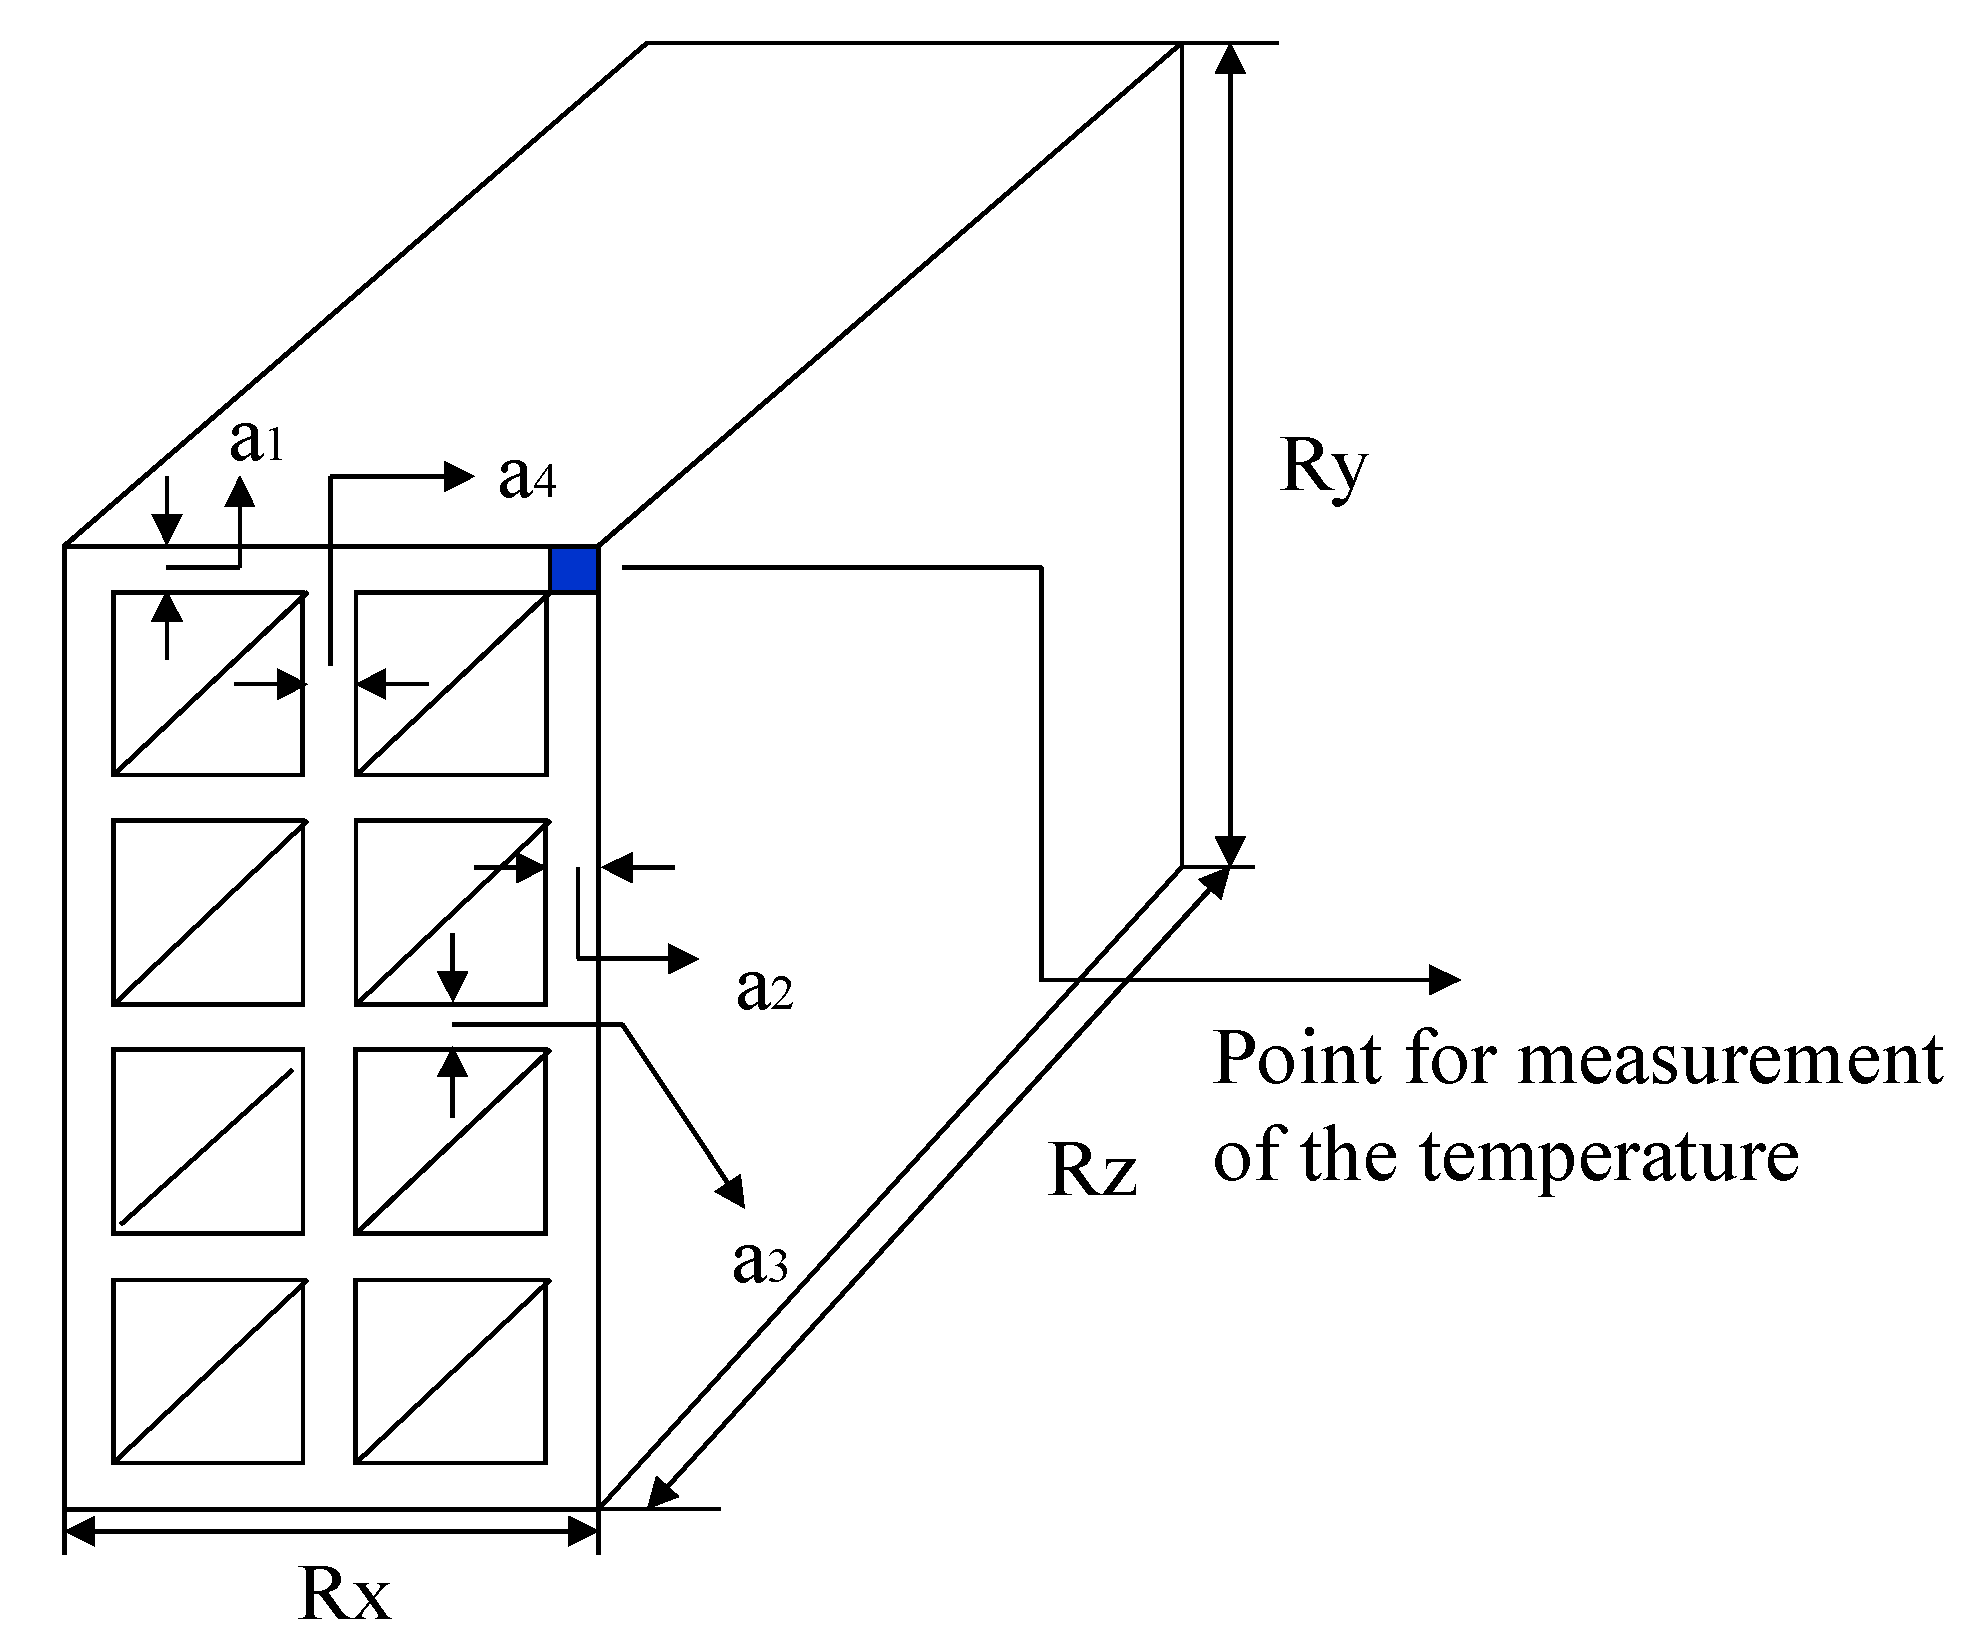
2.3.1. Volume and Surface Area of the Brick

The research was applied to describe the drying of industrial ceramic bricks (Figure 2). For this solid, the equations for determining the surface area of the brick are defined by the following:
A C =   A L + A I
where
A L = 2 [ ( R x R Z ) + ( R x R y ) + ( R y R z ) 8 ( a h a v ) ]
A I = 16 [ ( a h R z ) + ( a v R z ) ]
a h = R x 2 a 2 a 4 2
a v = R y 2 a 1 3 a 3 4
where A C is the total surface area of the brick, A L corresponds to the lateral area (faces) of the bricks, AI is the internal surface area (internal faces determined by the holes) and a h and a v are the height and width of a hole, respectively.
The calculation of the volume of the brick was made based on the value of its dimensions, width (Rx), height (Ry), length (Rz) and the dimensions that characterize the brick holes, a1, a2, a3 and a4, using the following equations:
V =   V T V f
where
V T = R x R y R z  
V F = 8 a v a h R z
where V is the total volume of the brick, V T is the volume of the solid brick (with the holes) and V F is the volume of the holes.

2.3.2. Thermophysical Properties of Air and Water

Specific heat of the air, latent heat of water vaporization, air density, absolute temperature, universal air constant, relative humidity, saturation vapor pressure and local atmospheric pressure [26,27], are determined by the following:
c p a = 1.00926 × 10 3 4.04033 × 10 2 T + 6.17596 × 10 4 T 2 4.0972 × 10 7 T 3  
k a = 2.425 × 10 2 + 7.889 × 10 5 T 1.790 × 10 8 T 2 8.570 × 10 12 T 3
μ a = 1.691 × 10 5 + 4.984 × 10 8 T 3.187 × 10 11 T 2 + 1.3196 × 10 14 T 3
ρ a = P atm MM ¯ a R a T abs   ( kg / m 3 )
T abs = T a + 273.15   K
R a = 8314.34   ( J / kmol   K )
RH = P atm   x a ( x a + 0.622 )   P vs
h fg = 352.8 × ( 374.14 T ) 0.33052   ( kJ / kg )
P vs = 22105649.25   Exp   { [ 27405.53 + 97.5413 T abs 0.146244 T abs 2 + 0.12558 × 10 3 T abs 3 0.48502 × 10 7 T abs 4 ]   / [ 4.34903 T abs   0.39381 × 10 2 T abs 2 ]   }     ( Pa )
P atm = 101325   Pa
where, in these equations, xa is the absolute humidity of the air, RH is the relative humidity of the air, MM ¯ a = 28.966 kg/kmol is the molecular weight of the gas, R a is the universal constant of the gases, Tabs is the absolute temperature in Kelvin and P is the pressure on Pascal.
The specific heats of water in the liquid and vapor phases are determined by the following [26]:
c w = 2.82232 + 1.18277 × 10 2 T abs 3.5047 × 10 5 T abs 2 + 3.6010 × 10 8 T abs 3
c v = 1.8830 0.16737 × 10 3 T abs + 0.84386 × 10 6 T abs 2 0.2696610 9 T abs 3

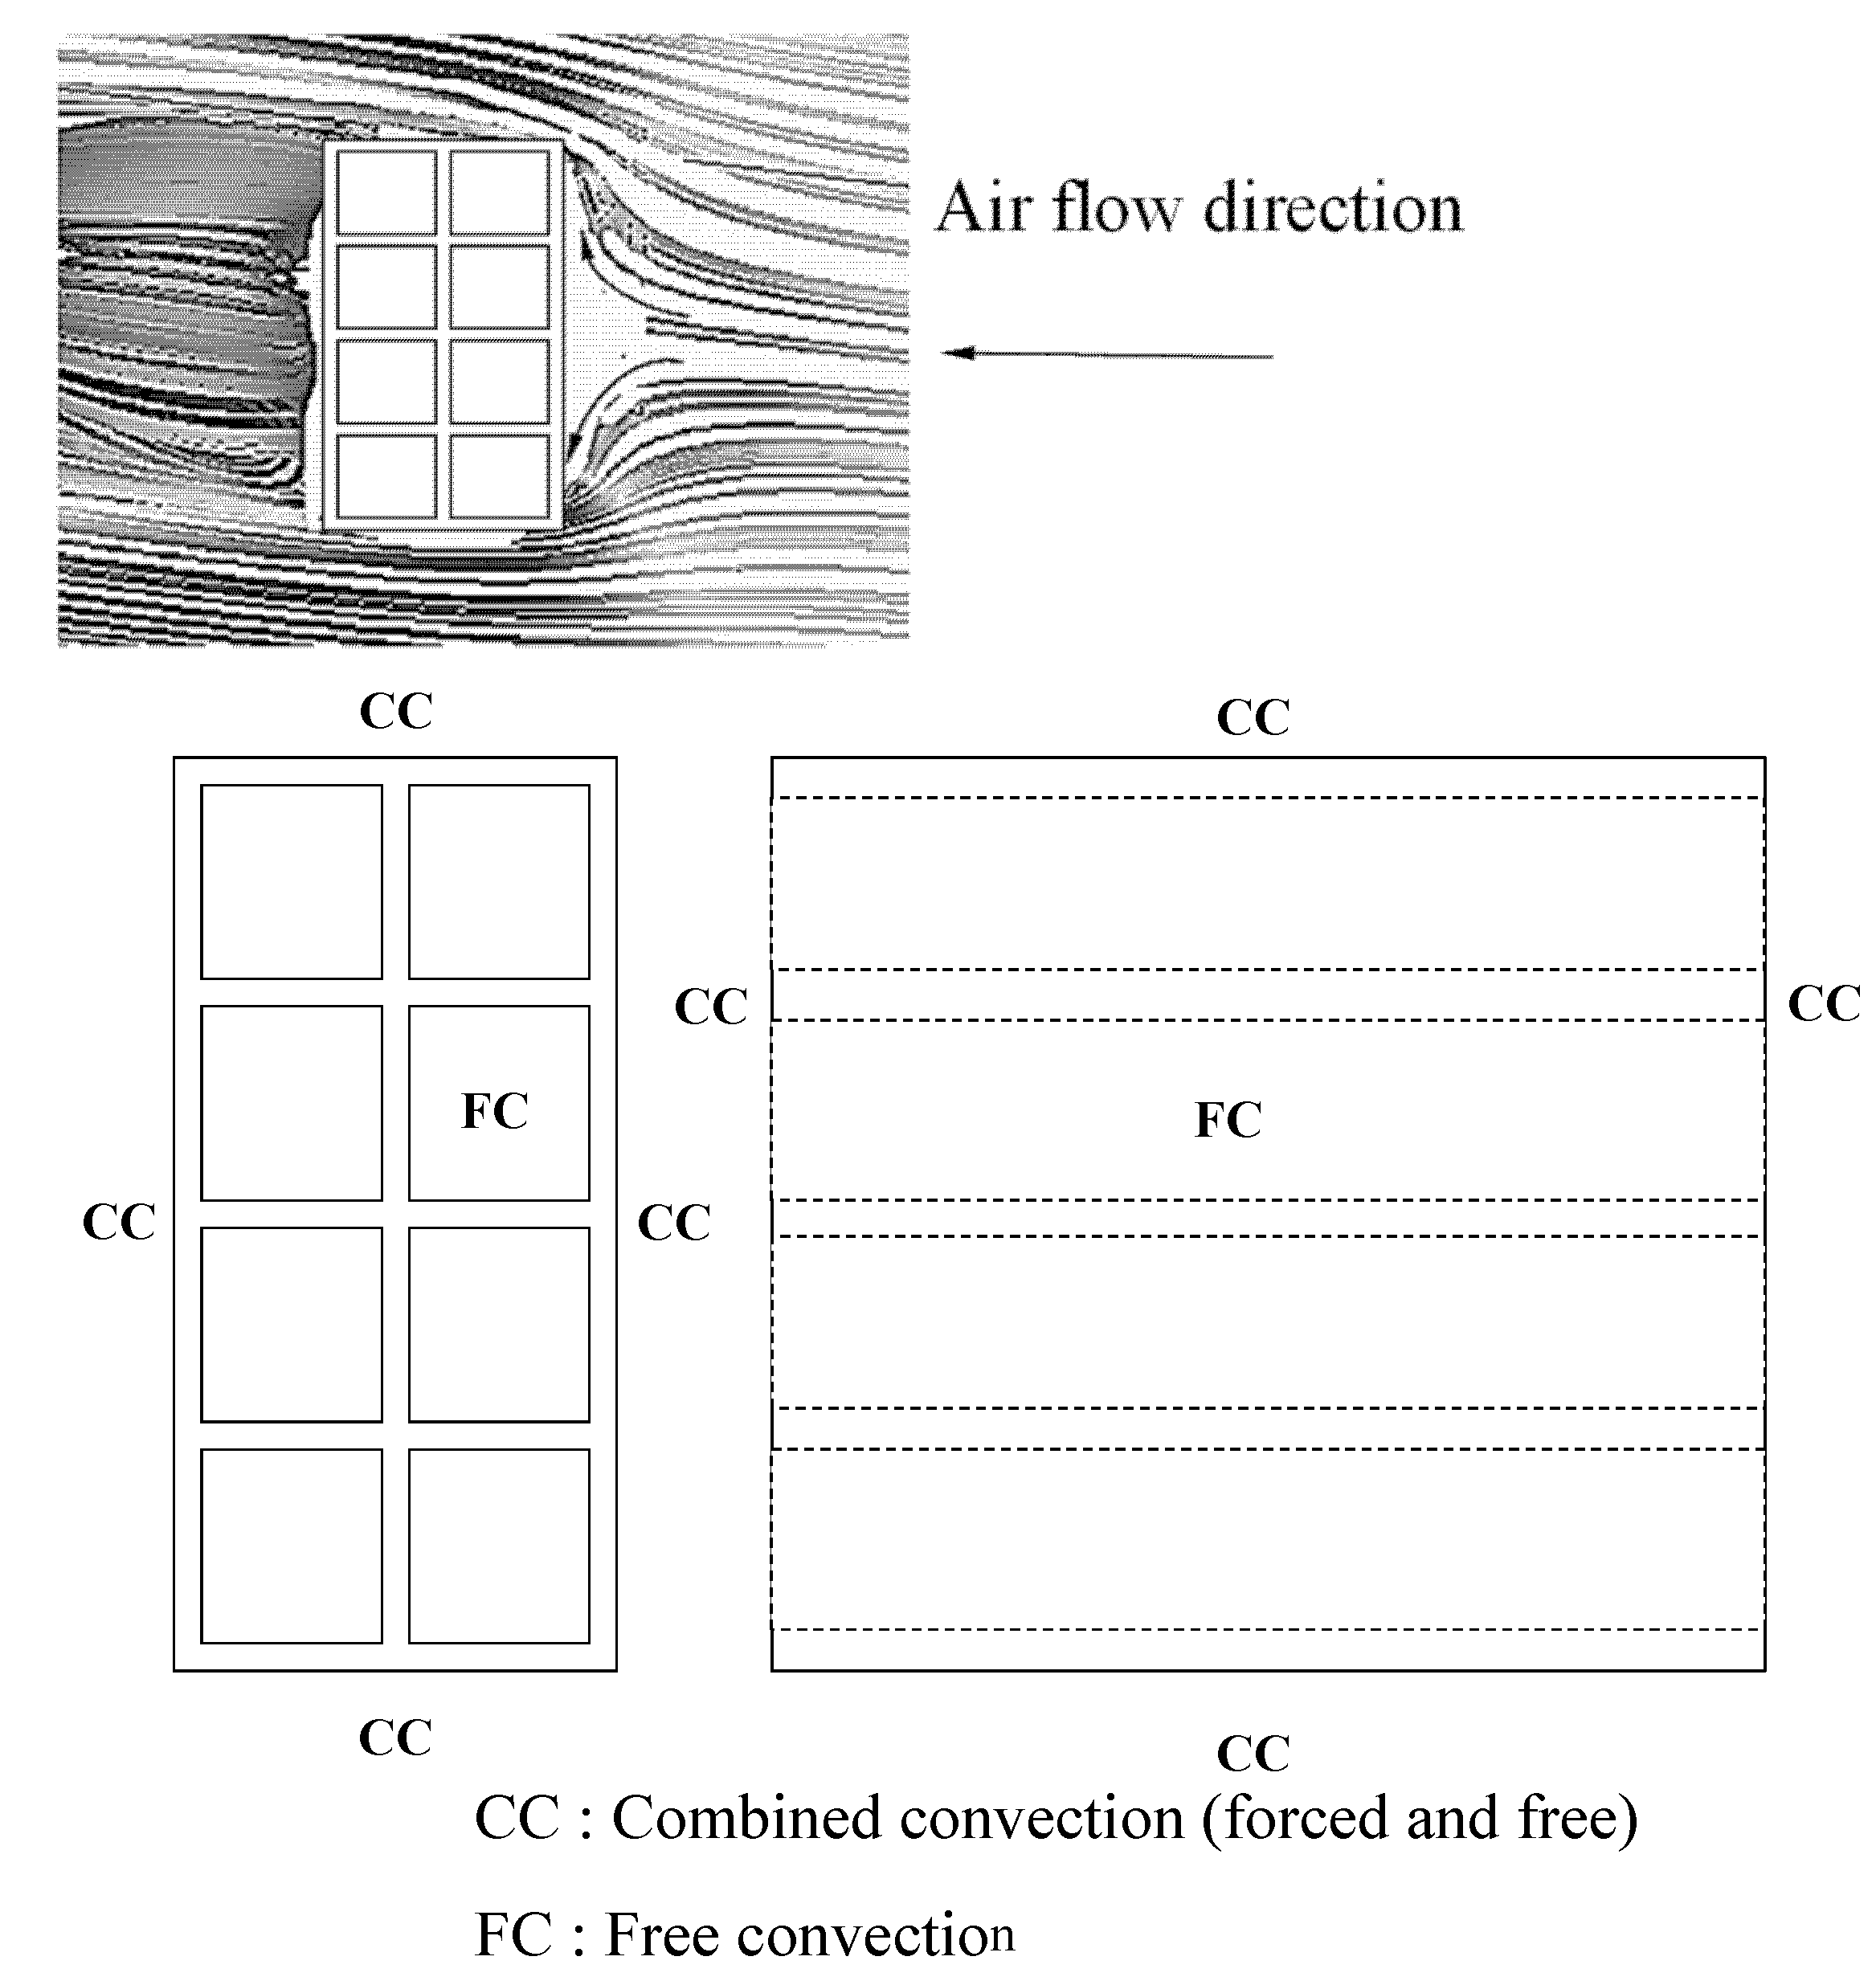
2.3.3. Estimation of Convective Heat and Mass Transfer Coefficients

In this research, the brick was considered to be in a lateral position to the fluid that flows on the material surface, as illustrated in Figure 3. For this situation, depending on the speed of the drying air, the drying process can occur by natural, forced convection or a combination of them on all external faces of the brick and by natural convection in the internal walls of the hole.
In forced convection, the tendency of a particular system is based mathematically on the Reynolds number (Re) of the fluid, which is the ratio of the inertial forces to the viscous forces. This dimensionless parameter is defined as follows:
Re L c = ρ a v a L c μ a
where Lc represents a characteristic length of the porous solid.
In natural convection, the tendency of a particular system is based mathematically on the Grashof number (Gr) of the fluid, which is the ratio between the buoyancy and viscous forces. This dimensionless parameter is given as follows:
Gr L c = g β ( T s T ) L c 2 2
where g is the gravitational acceleration, β = 1 T f is the thermal expansion coefficient, T f = Ts + T 2 is the film temperature on the absolute scale, Ts is the plate temperature, T∞ is the fluid temperature and ν = μ ρ is the kinematic viscosity.
The product of the Grashof number by the Prandtl number (Pr) is called the Rayleigh number (Ra) of the fluid. Thus, the Rayleigh number is given by the following:
Ra L c = Gr L c Pr = δ β ( T s T ) L c 3 2 Pr
where Pr = C a μ a k a .
The relative magnitudes of the Grashof and Reynolds numbers determine which form of convection dominates the phenomenon. For example, if Gr Re 2 1 , forced convection can be neglected, whereas if Gr Re 2 1 , natural convection can be neglected. For other situations, both forced convection and natural convection must be considered in a combined manner.
The average Nusselt number of the fluid on the surface of the porous solid can be determined as follows:
Nu ¯ = h ¯ c L c k a
Looking to Figure 3, it can be seen that the brick is composed of vertical and horizontal plates, upper and lower, both on the external surface and in the holes, all at a lower temperature than the drying fluid. Thus, based on this geometry, one can determine the Nusselt numbers for heat transfer and, thus, determine the convective heat and mass transfer coefficients for each physical situation, under air flow regime [25,28].

Natural Convection

For natural convection on flat surfaces, the following empirical correlations for the average Nusselt number are given:
(a) Vertical plate
Nu ¯ pvt = { 0.825 + 0.387 R a L 1 / 6 [ 1 + ( 0.492 / Pr ) 9 / 16 ] 8 / 27 } 2
where, in the calculation of the number of Rayleigh ( R a L ), Lc = Ry, for the front and rear plates.
Nu ¯ pvl = { 0.825 + 0.387 R a L 1 / 6 [ 1 + ( 0.492 / Pr ) 9 / 16 ] 8 / 27 } 2
where, in the calculation of the Rayleigh number ( R a L ), Lc = Ry − 4 ((Ry − 2a1 − 3a3)/4), for the side plates.
(b) Horizontal plate (Top surface)
Nu ¯ phs = 0.27 ( Gr L Pr ) 1 / 4 ,   10 5 < Gr L   Pr < 10 11
where, in calculating the number of Rayleigh ( R a L ), Lc = RxRz/(2Rx + 2Rz).
(c) Horizontal plate (bottom surface)
Nu ¯ phi = 0.54   ( Gr L   Pr ) 1 / 4 ,    10 4 < Gr L Pr < 10 7
Nu ¯ phi = 0.15   ( Gr L   Pr ) 1 / 3 ,    10 7 < Gr L Pr < 10 11
where, in calculating the number of Rayleigh ( R a L ), Lc = RxRz/(2Rx + 2Rz).
(d) Vertical Plate (Hole)
Nu ¯ pvf = { 576 [ R a L ( L c / Rz ) ] 2 + 2.873 [ R a L ( L c / Rz ) ] 0.5 } 0.5
where Lc = (Rx − 2a2 − 2a4)/2.
(e) Horizontal plate (Hole)
Nu ¯ phf = { 576 [ R a L ( L c / Rz ) ] 2 + 2.873 [ R a L ( L c / Rz ) ] 0.5 } 0.5
where Lc = (Ry − 2a1 − 3a3)/4.
From Equations (34)–(40), the convective heat transfer coefficients were calculated on the flat external surfaces and on the brick hole, using the following equation:
h ¯ c = Nu ¯ k a L c
With Equation (41) applied to each of the outer flat surfaces and the brick hole, the average external and internal convective heat transfer coefficients were obtained, as follows:
h c 1 = h ¯ c   ext | nc = [ ( 2 h ¯ cpvt + 2 h ¯ cpvl + h ¯ cphs + h ¯ cphi ) 6 ] nc
h c 2 = h ¯ c   int | nc = [ ( h ¯ cpvf + h ¯ cphf ) 2 ] nc
where the nc sign indicates free convection.
Once the external and internal convective heat transfer coefficients were determined, the convective mass transfer coefficients were determined on the flat outer and hole surfaces of the brick, using the Chilton–Colburn analogy for heat and mass transfer, as follows:
h ¯ m = h ¯ c D va Le 1 / 3 k a
where Le = α D va = k a D va ρ a c p a is the Lewis number, α = k a ρ a c p a is the thermal diffusivity of the air and D va is the diffusion coefficient of water vapor in the air, given by the following:
D va = 1.87 × 10 10 T ( K ) 2.072 P ( atm )
With Equation (44) applied to each of the external flat surfaces and the brick hole, the average external and internal convective mass transfer coefficients were obtained, as follows:
h ¯ m   ext | nc = [ ( 2 h ¯ mpvt + 2 h ¯ mpvl + h ¯ mphs + h ¯ mphi ) 6 ] nc
h ¯ m   int | nc = [ ( h ¯ mpvf + h ¯ mphf ) 2 ] nc
Since the convective heat and mass transfer coefficients, determined by Equations (45) and (46), are calculated with the drying air parameters, and these same parameters that are present in Equations (2) and (11) are dependent on the brick parameters, it is necessary to recalculate these parameters for this new physical situation. This is performed using the following equations:
h m 1 = ρ a ρ s ( x bu x 0 ) ( M 0 M e ) h ¯ m   ext | nc
h m 2 = ρ a ρ s ( x bu x 0 ) ( M 0 M e ) h ¯ m   int | nc
where ρ s is the density of the brick, xo is the absolute humidity of the air at the drying air temperature and xbu is the absolute humidity of the air at the wet bulb temperature of the drying air, given by the following:
x bu = ( P vwb P atm P vwb ) ( MM ¯ v MM ¯ a )
where Pvwb is the vapor pressure in the air at the wet bulb temperature of the air (which is equal to the saturation pressure of the water vapor at the wet bulb temperature) and MM ¯ v is the molecular weight of the water vapor.

Forced Convection

For forced convection on the external walls of the brick, depending on the air flow regime, the Nusselt number can be determined as follows:
(a) Laminar flow (Re < 5 × 10⁵)
Nu ¯ i = 0.664 Re Lc 0.5 Pr 1 / 3
(b) Turbulent flow (5 × 10⁵ < Re < 1 × 10⁷)
Nu ¯ i = 0.037 Re Lc 0.8 Pr 1 / 3
where subscript i refers to pvt, pvl, phs and phi. In calculating the Reynolds number, Lc = Ry for the front and rear plates; Lc = RxRz/(2Rx + 2Rz) for the upper and lower plates and Lc = Ry − 4 [(Ry − 2a1 − 3a3)/4] for the side plates.
In the hole, the condition remains natural convection, the Nusselt number being calculated as defined in Equations (34) and (40). From Equations (34), (40), (50) and (52), the convective heat transfer coefficients were calculated on the flat external surfaces and on the brick hole, using Equation (41). From these coefficients, the average external and internal convective heat transfer coefficients were obtained, as follows:
h c 1 = h ¯ c   ext | fc = [ ( 2 h ¯ cpvt + 2 h ¯ cpvl + h ¯ cphs + h ¯ cphi ) 6 ] fc
h c 2 = h ¯ c   int | nc = [ ( h ¯ cpvf + h ¯ cphf ) 2 ] nc
where the subscript fc indicates forced convection.
Once the external and internal convective heat transfer coefficients were determined, the convective mass transfer coefficients were determined on the flat outer and surfaces of the brick hole, using the Chilton–Colburn analogy for heat and mass transfer, as defined by Equation (43). From these coefficients, the average external and internal convective mass transfer coefficients were obtained, as follows:
h ¯ m   ext | fc = [ ( 2 h ¯ mpvt + 2 h ¯ mpvl + h ¯ mphs + h ¯ mphi ) 6 ] fc
h ¯ m   int | nc = [ ( h ¯ mpvf + h ¯ mphf ) 2 ] nc
Since the convective heat and mass transfer coefficients, determined by Equations (54) and (55), are calculated with the drying air parameters, and these same parameters that are present in Equations (2) and (11) are dependent on the brick parameters, it is necessary to recalculate these parameters for this new situation. This is performed using the following equations:
h m 1 = ρ a ρ s ( x bu x 0 ) ( M 0 M e ) h ¯ m   ext | fc
h m 2 = ρ a ρ s ( x bu x 0 ) ( M 0 M e ) h ¯ m   int | nc

Combined Natural and Forced Convection

In case both natural and forced convection are important, the Nusselt number is given by a combination of effects as follows:
Nu ¯ i = [ Nu ¯ i ,   nc 3 + Nu ¯ i ,   fc 3 ] 1 3
where subscript i refers to pvt, pvl, phs and phi for external surface plates and pvf and phf, for hole plates.
From the Nusselt numbers calculated using Equation (58), the convective heat transfer coefficients on the flat external surfaces and the brick hole were calculated, using Equation (41). In turn, from these coefficients, the average external and internal convective heat transfer coefficients were obtained, as follows:
h c 1 = h ¯ c   ext | cc = [ ( 2 h ¯ cpvt + 2 h ¯ cpvl + h ¯ cphs + h ¯ cphi ) 6 ] cc
where the cc subscript indicates combined convection.
Once the external and internal convective heat transfer coefficients were determined, the convective mass transfer coefficients were determined on the flat outer and hole surfaces of the brick, using the Chilton–Colburn analogy for heat and mass transfer, as defined by Equation (43). From these coefficients, the average external and internal convective mass transfer coefficients were obtained, as follows:
h ¯ m   ext | cc = [ ( 2 h ¯ mpvt + 2 h ¯ mpvl + h ¯ mphs + h ¯ mphi ) 6 ] cc
h ¯ m   int | cc = [ ( h ¯ mpvf + h ¯ mphf ) 2 ] cc
Since the convective heat and mass transfer coefficients, determined by Equations (61) and (62), are calculated with the drying air parameters, and these same parameters that are present in Equations (2) and (11) are dependent on the brick parameters, it is necessary to recalculate these parameters for this new situation. This is performed using the following equations:
h m 1 = ρ a ρ s ( x bu x 0 ) ( M 0 M e ) h ¯ m   ext | cc
h m 2 = ρ a ρ s ( x bu x 0 ) ( M 0 M e ) h ¯ m   int | cc

2.3.4. Cases Studied

Validation

Silva [8] developed an experimental study on the drying of industrial clay bricks. To carry out the drying experiment, the following procedures were adopted:
  • Initially, dimensions, mass, brick temperature, ambient temperature and relative humidity were measured.
  • Following that, the bricks were placed inside the oven where drying was carried out. In this process, air temperature inside the oven was established at 100°C through the temperature controller.
  • At previously established time intervals, the brick was withdrawn from the oven, making it possible to measure its temperature, mass and dimensions. In principle, measurements were made every 10 min for up to 30 min. Then, the measurements were made every 30 min, with the next measurements being made every 60 min until the mass was approximately constant.
  • Soon after, the sample was subjected to drying for 24 h to obtain the equilibrium mass, and then for another 24 h, to obtain the dry mass.
Figure 4 illustrates the specimen model used by the author of [8], the positions where the measurements of temperature, width (Rx), height (Ry), length (Rz) and the dimensions that characterize the holes in the bricks (a1, a2, a3 and a4) were obtained.
From the data obtained of the average moisture content throughout the drying process, it was possible to verify that in the initial period, the moisture loss rates are higher, requiring the researcher to read these data in shorter intervals, which can be expanded, as the process developed. From the physical point of view, this methodology is extremely satisfactory, as it allows the description of the phenomenon with great precision, especially at the beginning of the process. However, it is statistically more appropriate to perform parameter comparisons from a more uniform distribution of points throughout the process. Thus, the author proposed to fit an exponential equation with 2 terms and 4 parameters to these experimental data, as follows:
( M ¯ M e M o M e ) = A 1 E x p ( k 1 t ) + A 2 E x p ( k 2 t )
where t is given in minutes. The estimation of parameters A1, A2, k1 and k2 in Equation (65) was performed using the numerical method of Rosembrock and quasi-Newton using the Statistica® Software, with a convergence criterion of 0.001. Table 1 summarizes the values of these estimated parameters.
Similar to the procedure adopted by the author of [8], Lima et al. [15] proposed fitting an exponential equation with 2 terms and 4 parameters to the experimental data of the surface temperature of the brick, as follows:
θ = B 1 +   B 2   Log 10 ( t k 3 +   B 3 )
where t is given in minutes. The estimation of parameters B1, B2, k3 and B3 was performed using the Quasi-Newton numerical method using the Statistica® Software, with a convergence criterion of 0.0001. Table 2 summarizes the values of these estimated parameters.
With the equations adjusted, instants of “data taking” were fixed along the process in which the average moisture content and temperature could be determined. This procedure allowed that uniform distribution of these points was reached. Following that, these equations were used in the computer program, to ensure that the predicted and experimental results of these process parameters could be compared.
Table 3 and Table 4 show, for the experiment, the geometric information, temperature and moisture content of the brick and the drying air conditions used in the oven. Table 5 summarizes the thermophysical properties, external and internal surface areas and brick volume, at the beginning of the process. To obtain the predicted results of the average moisture content and temperature at the vertex of the brick, a computational code was developed in the Mathematica® software. The quadratic deviations between the experimental and calculated values and the variance for the average moisture content and surface temperature were obtained as follows:
ERMQ M = i = 1 n ( M ¯ i , Num M ¯ i , Exp ) 2
S ¯ M 2 = ERMQ M ( n n ^ )
ERMQ θ = i = 1 n [ ( θ i , Num θ i , Exp ) ( θ e θ 0 ) ] 2
S ¯ θ 2 = ERMQ θ ( n n ^ )
where n = 56 is the number of experimental points and n ^ = 0 is the number of fitted parameters (number of degrees of freedom) [29].

Studied Cases

To verify the application of the mathematical model to the drying of industrial bricks, 11 cases were defined for simulation (Table 6). The aim is evaluating the effect of the following different process parameters: temperature and relative humidity of the drying air, in the removal of moisture and temperature of the brick during drying. In all cases studied, the dimensions, initial and equilibrium moisture contents, initial temperature and thermophysical properties of the brick are reported in Table 3, Table 4 and Table 5.

3. Results and Discussion
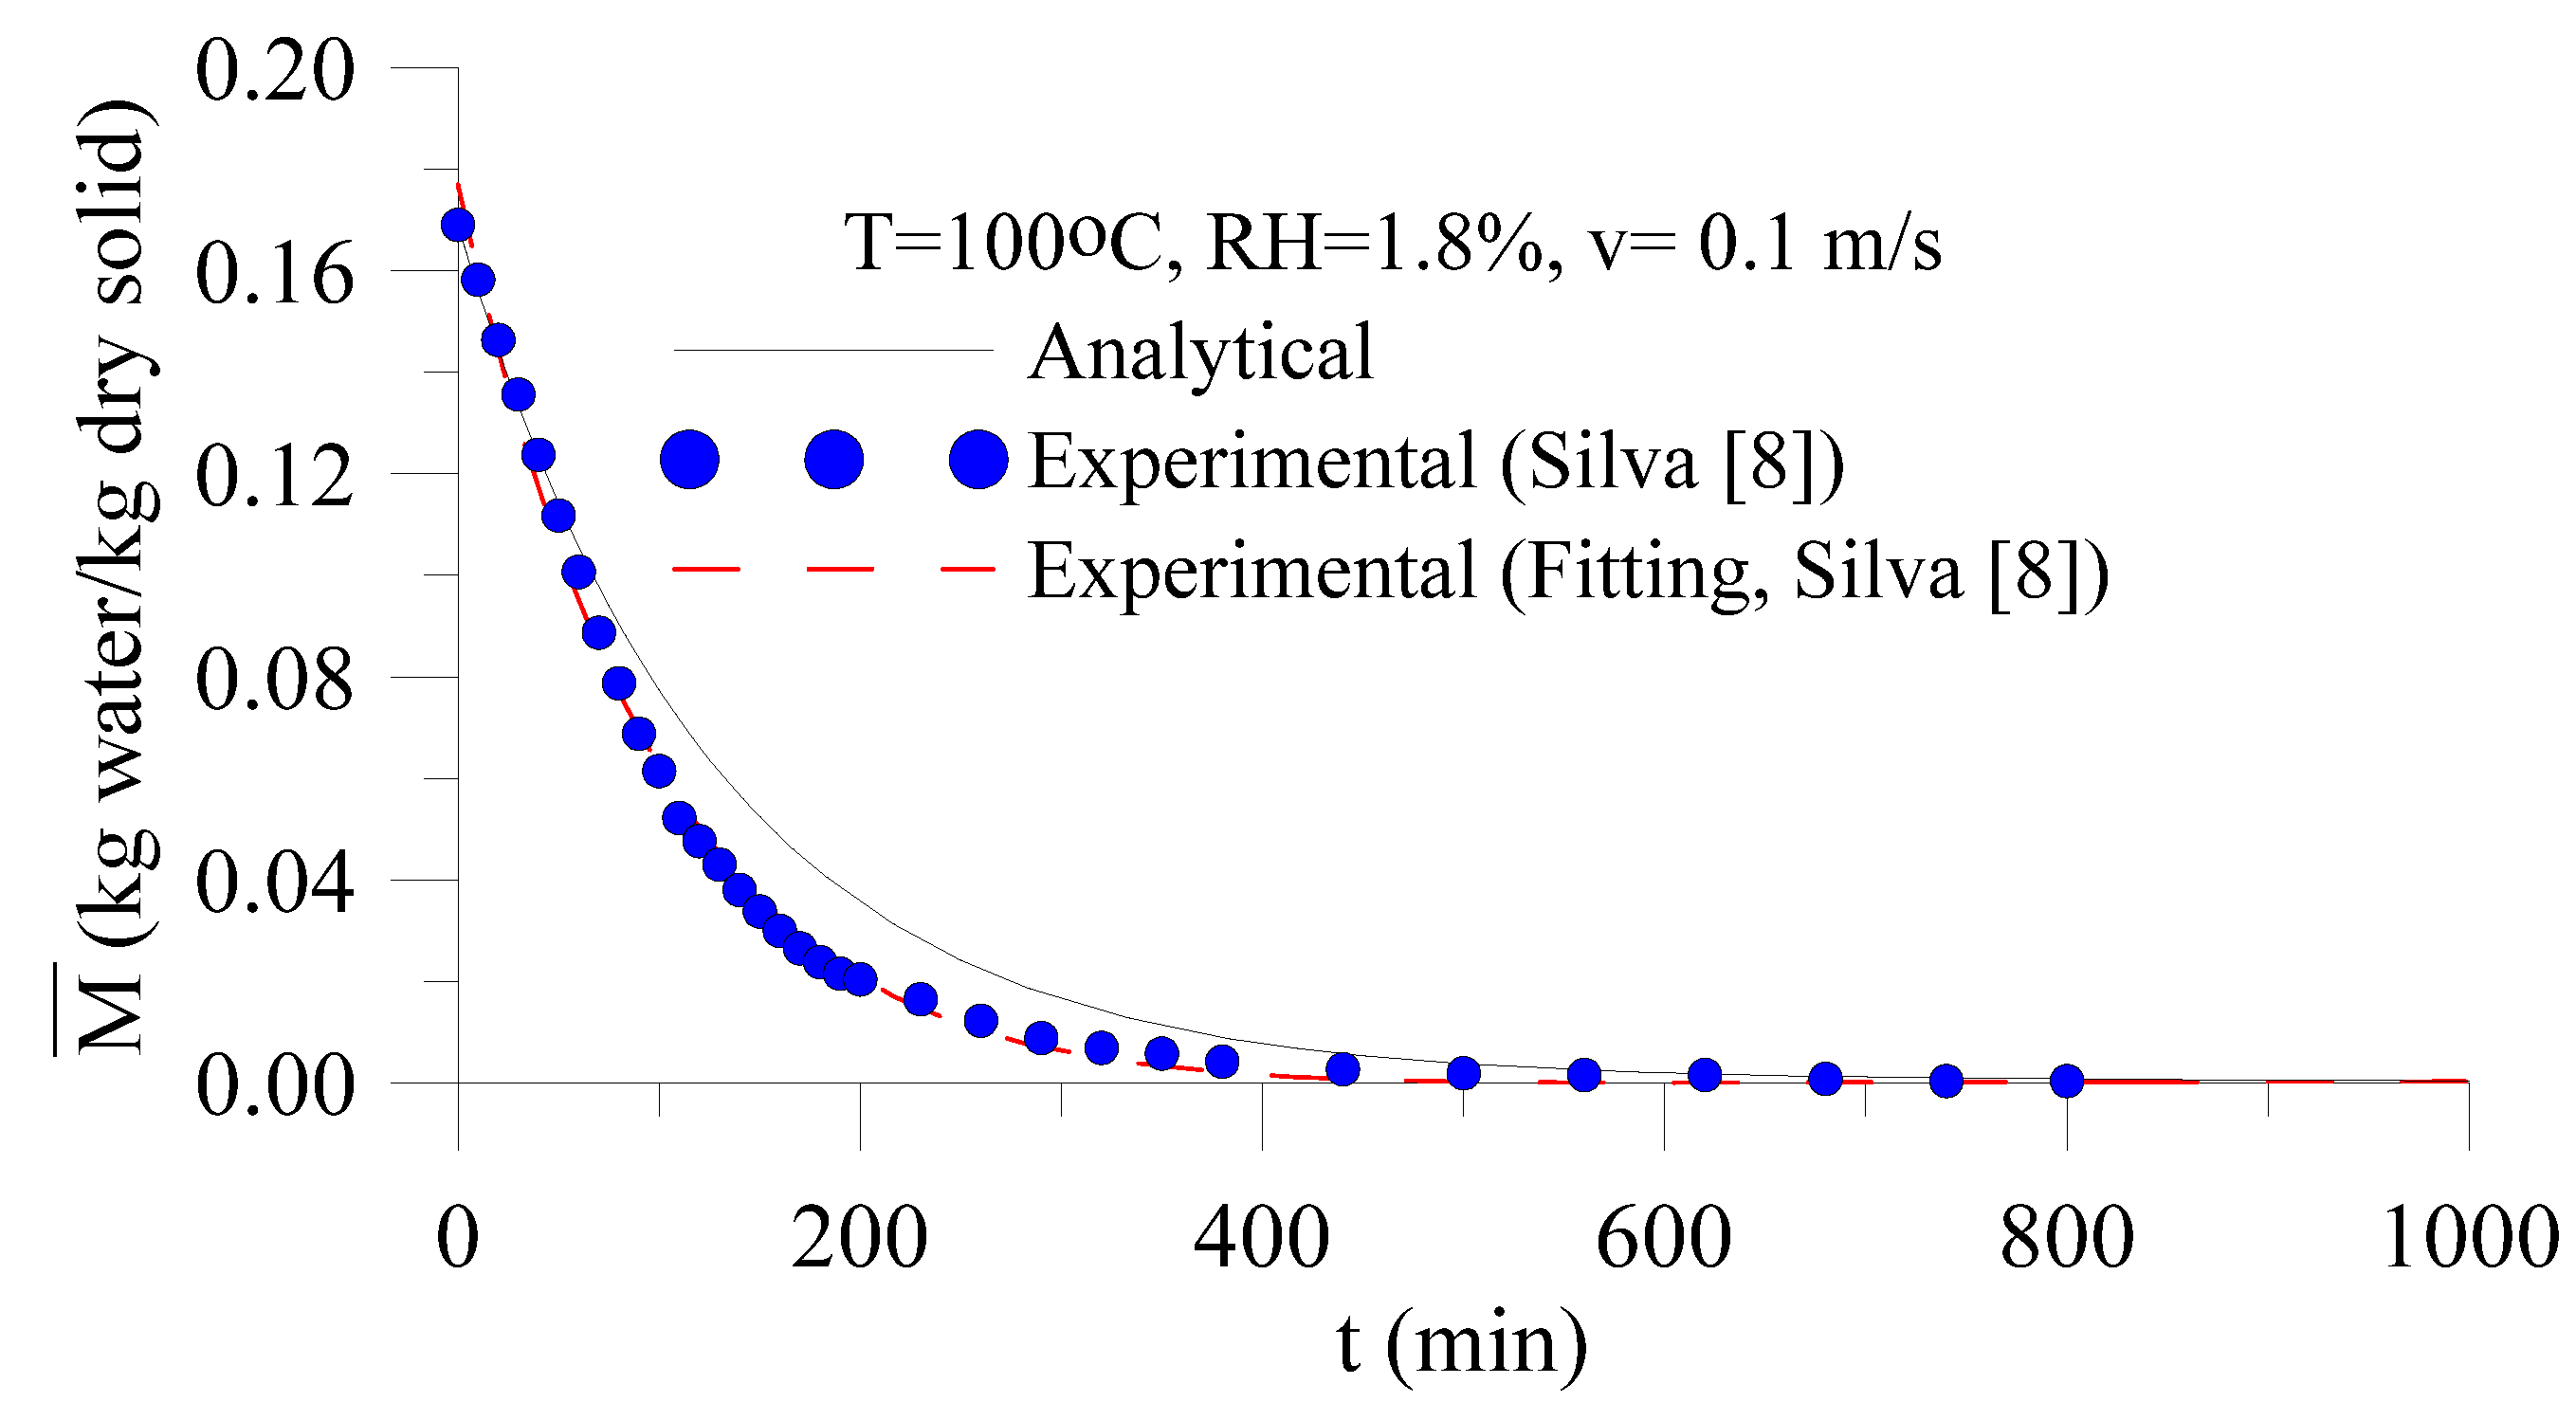
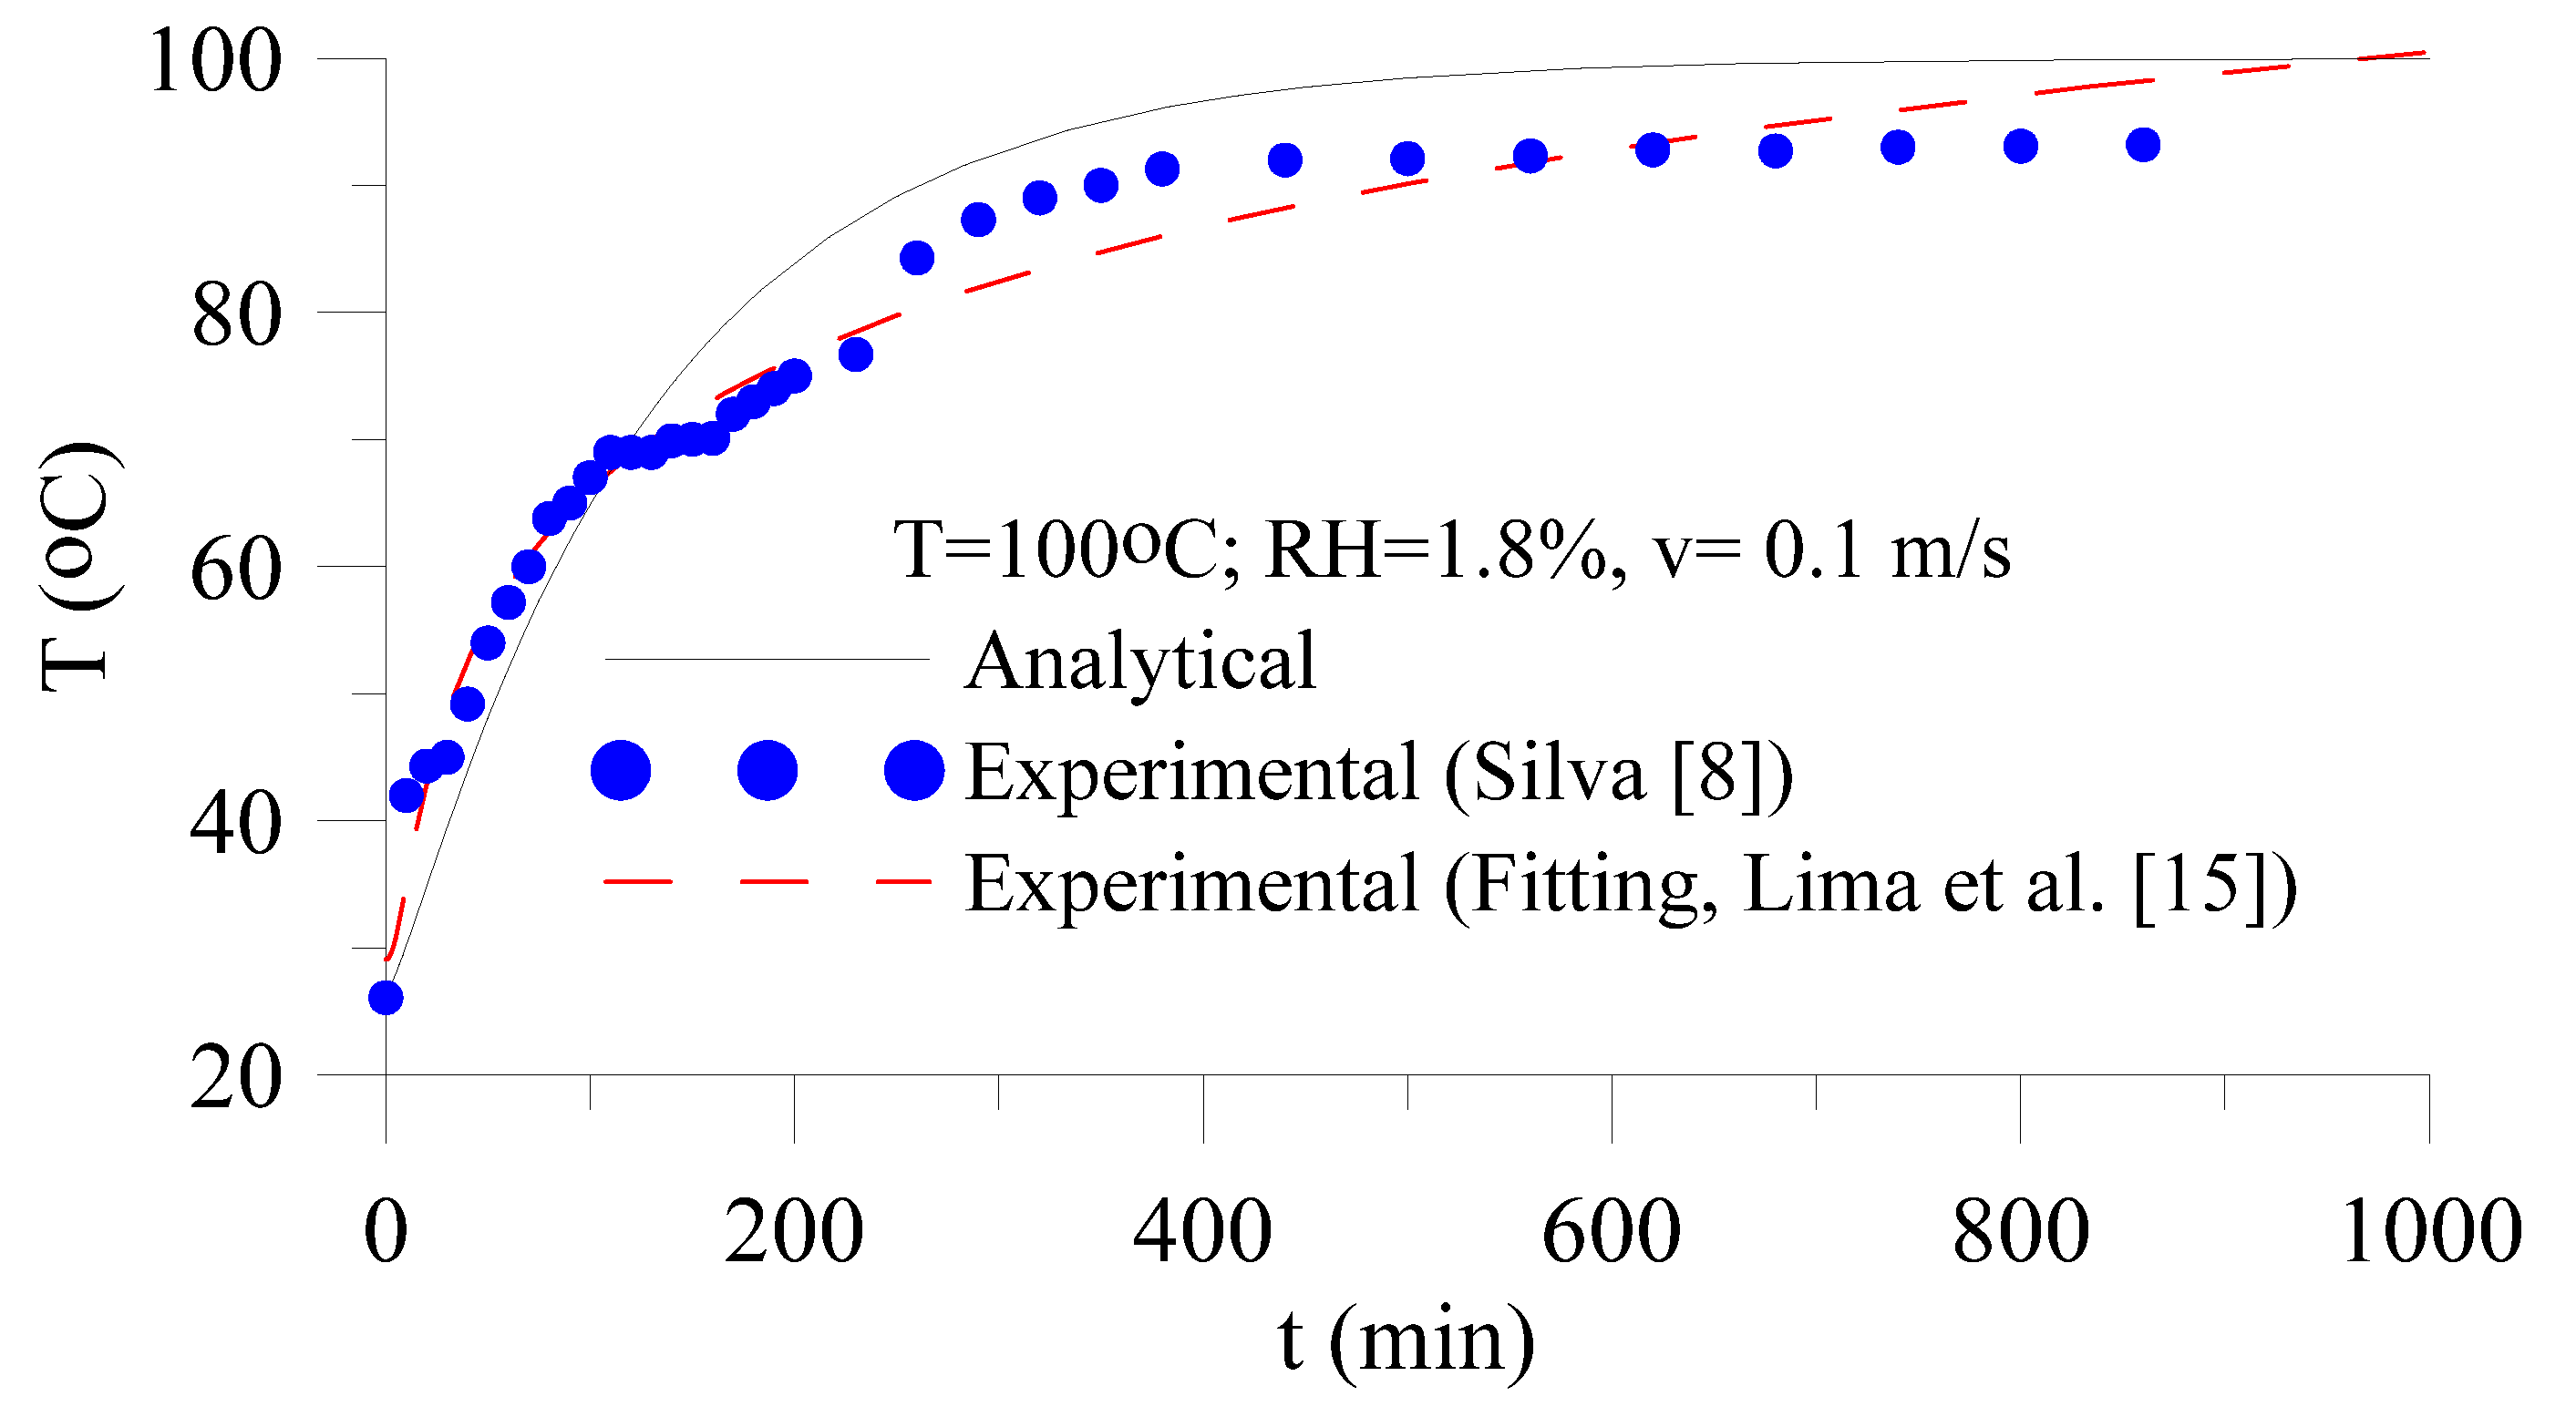
3.1. Validation

Figure 5 illustrates a comparison between the predicted and experimental results [8] of the average moisture content of the brick during the drying process. An analysis of this figure shows a good agreement between the results. From the comparison with the experimental data obtained from Equation (50), ERMQM = 0.00509741 (kg/kg)2 and S ¯ M 2 = 9.10252 × 10⁻⁵ (kg/kg)2 were obtained. For this physical situation, the following convective mass transfer coefficients were obtained hm1 = 6.46958 × 10⁻⁷ m/s and hm2 = 6.13473 × 10⁻⁷ m/s.
Figure 6 illustrates a comparison between the predicted and experimental results [8,15] of the temperature at the vertex of the brick during the drying process. An analysis of this figure shows a good agreement between the results. From the comparison with the experimental data obtained from Equation (51), ERMQθ = 0.346251426 (°C/°C)2 and S ¯ θ 2 = 0.006183061 (°C/°C)2 were obtained. For this physical situation, the following convective heat transfer coefficients were obtained: hc1 = 6.89281 W/m2K and hc2 = 6.53606 W/m2K. These low values of the convective heat transfer coefficient are typical of a physical situation of natural convection. In fact, for this case, a ratio Gr/Re2 = 10705.4 was obtained, which is much greater than 1.0, justifying that the effect of natural convection is much higher than forced convection.

3.2. Analysis of the Drying Process

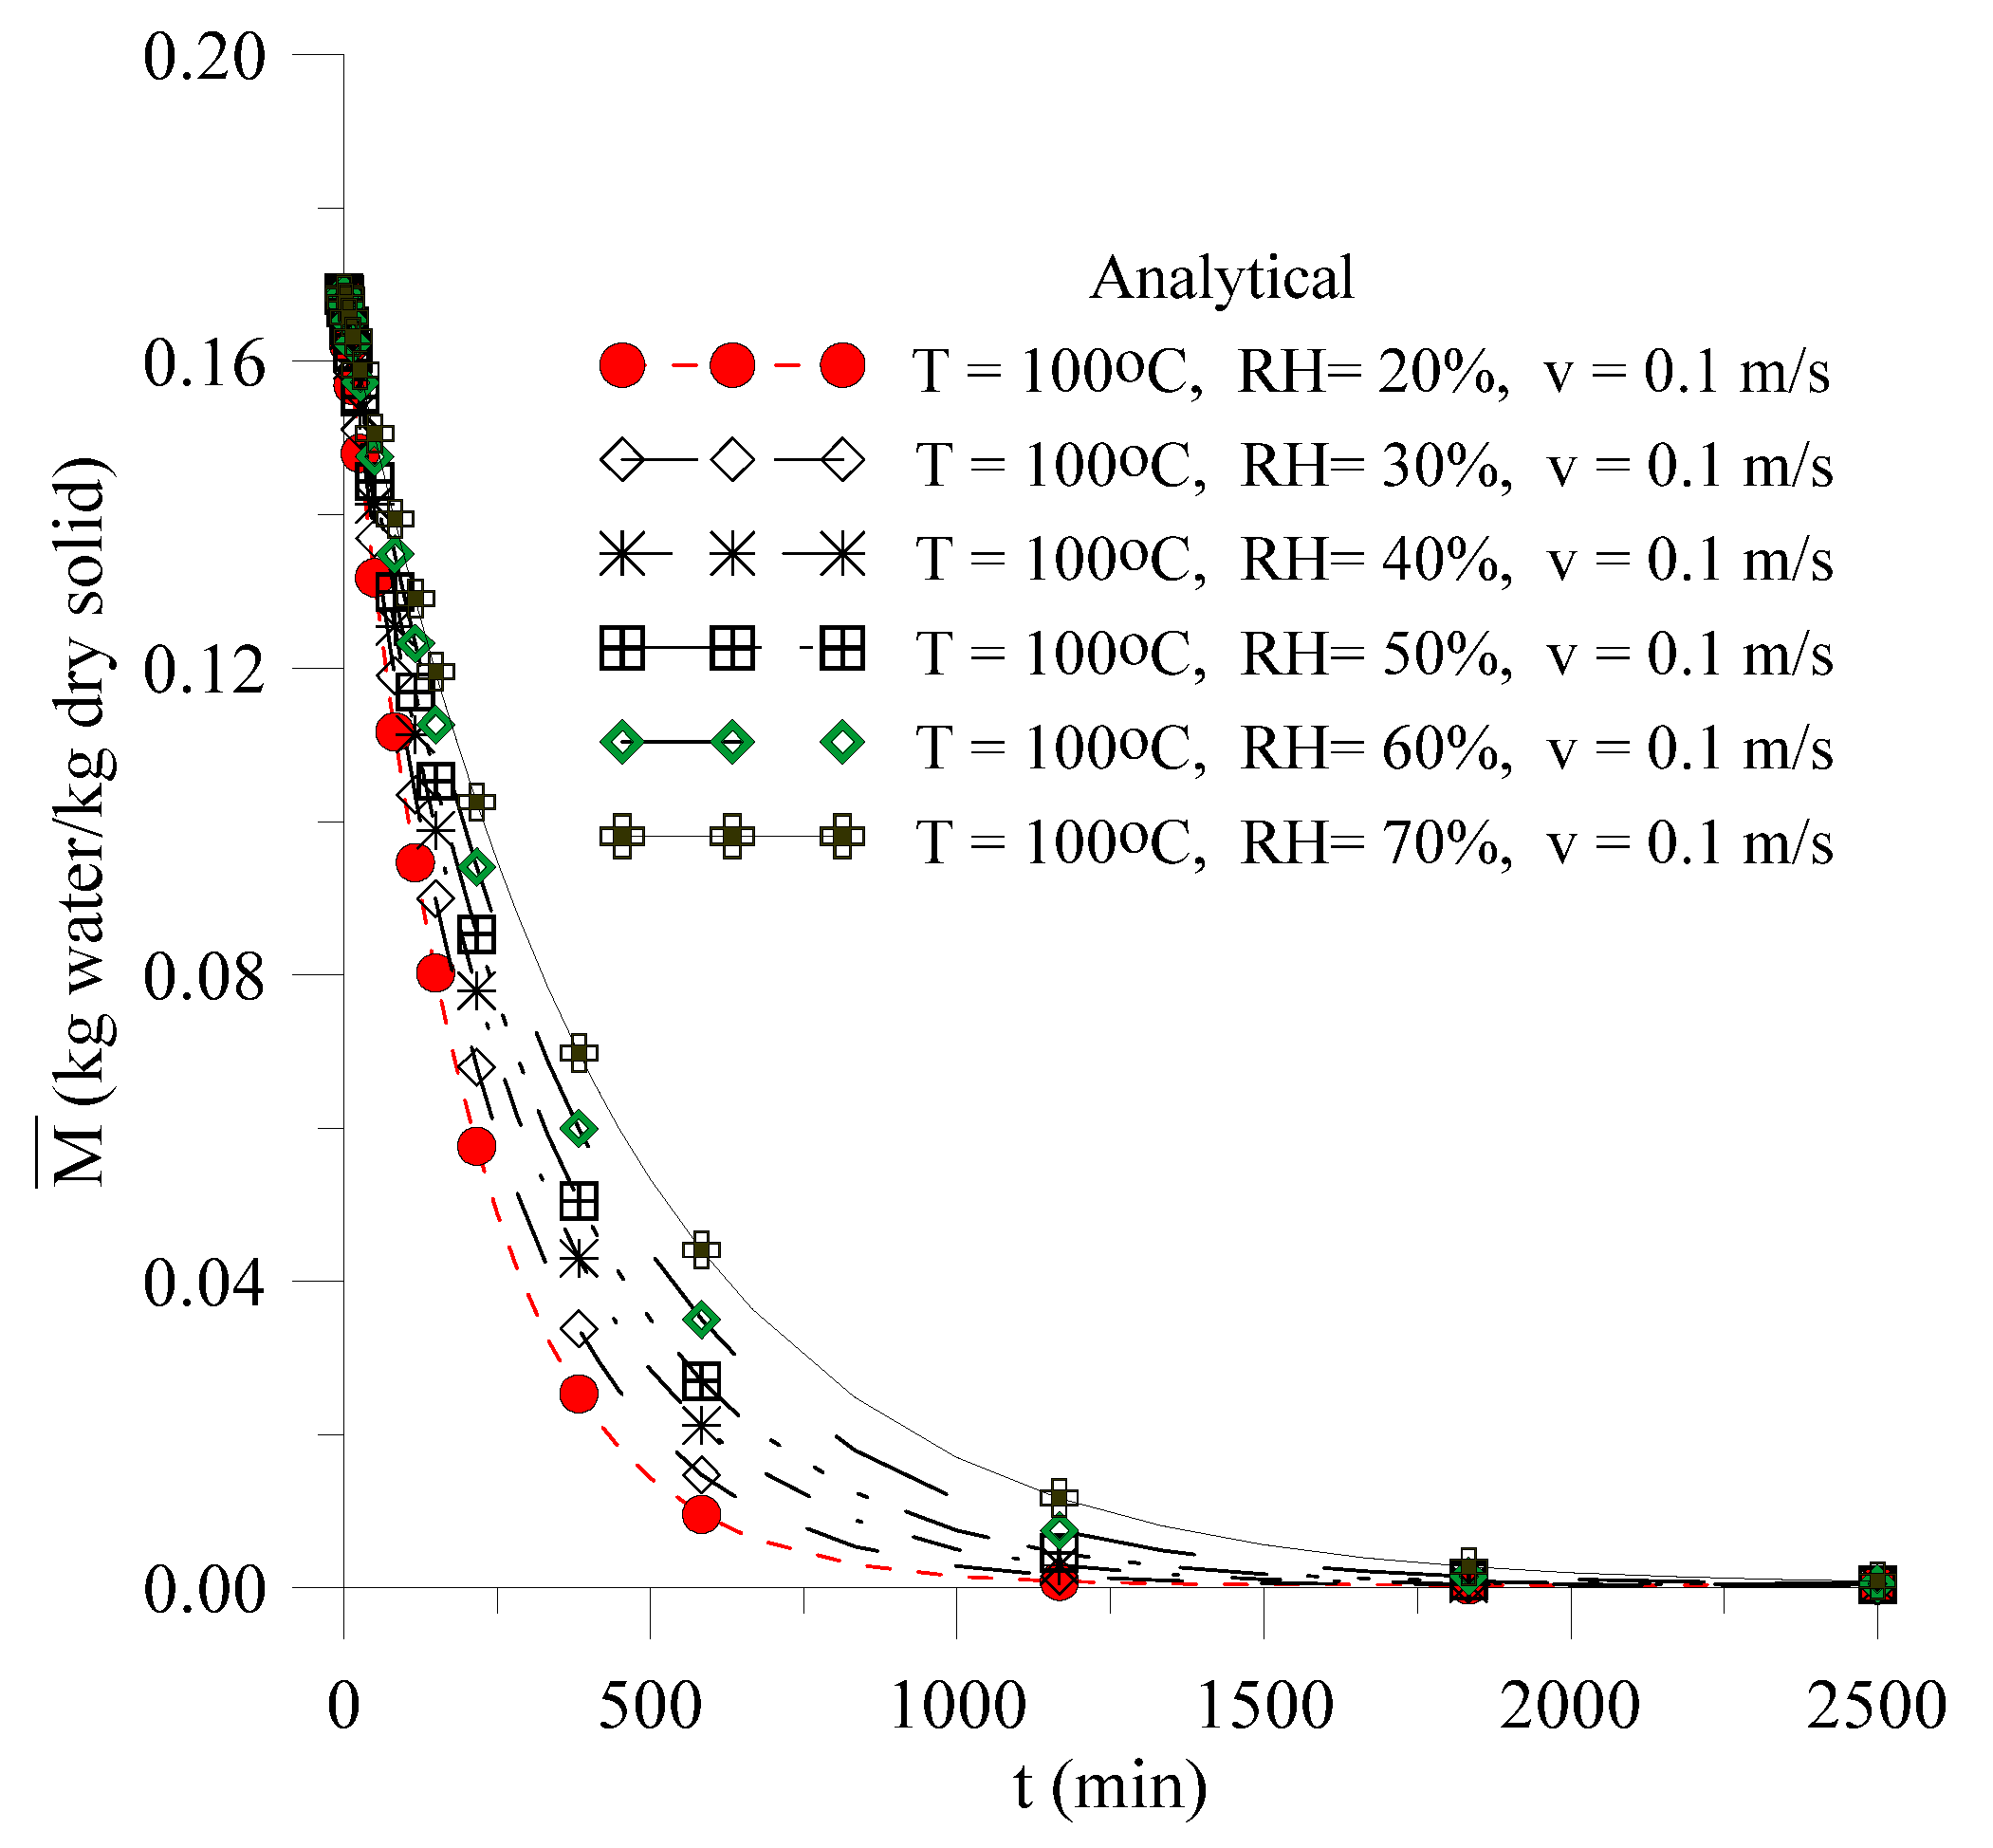
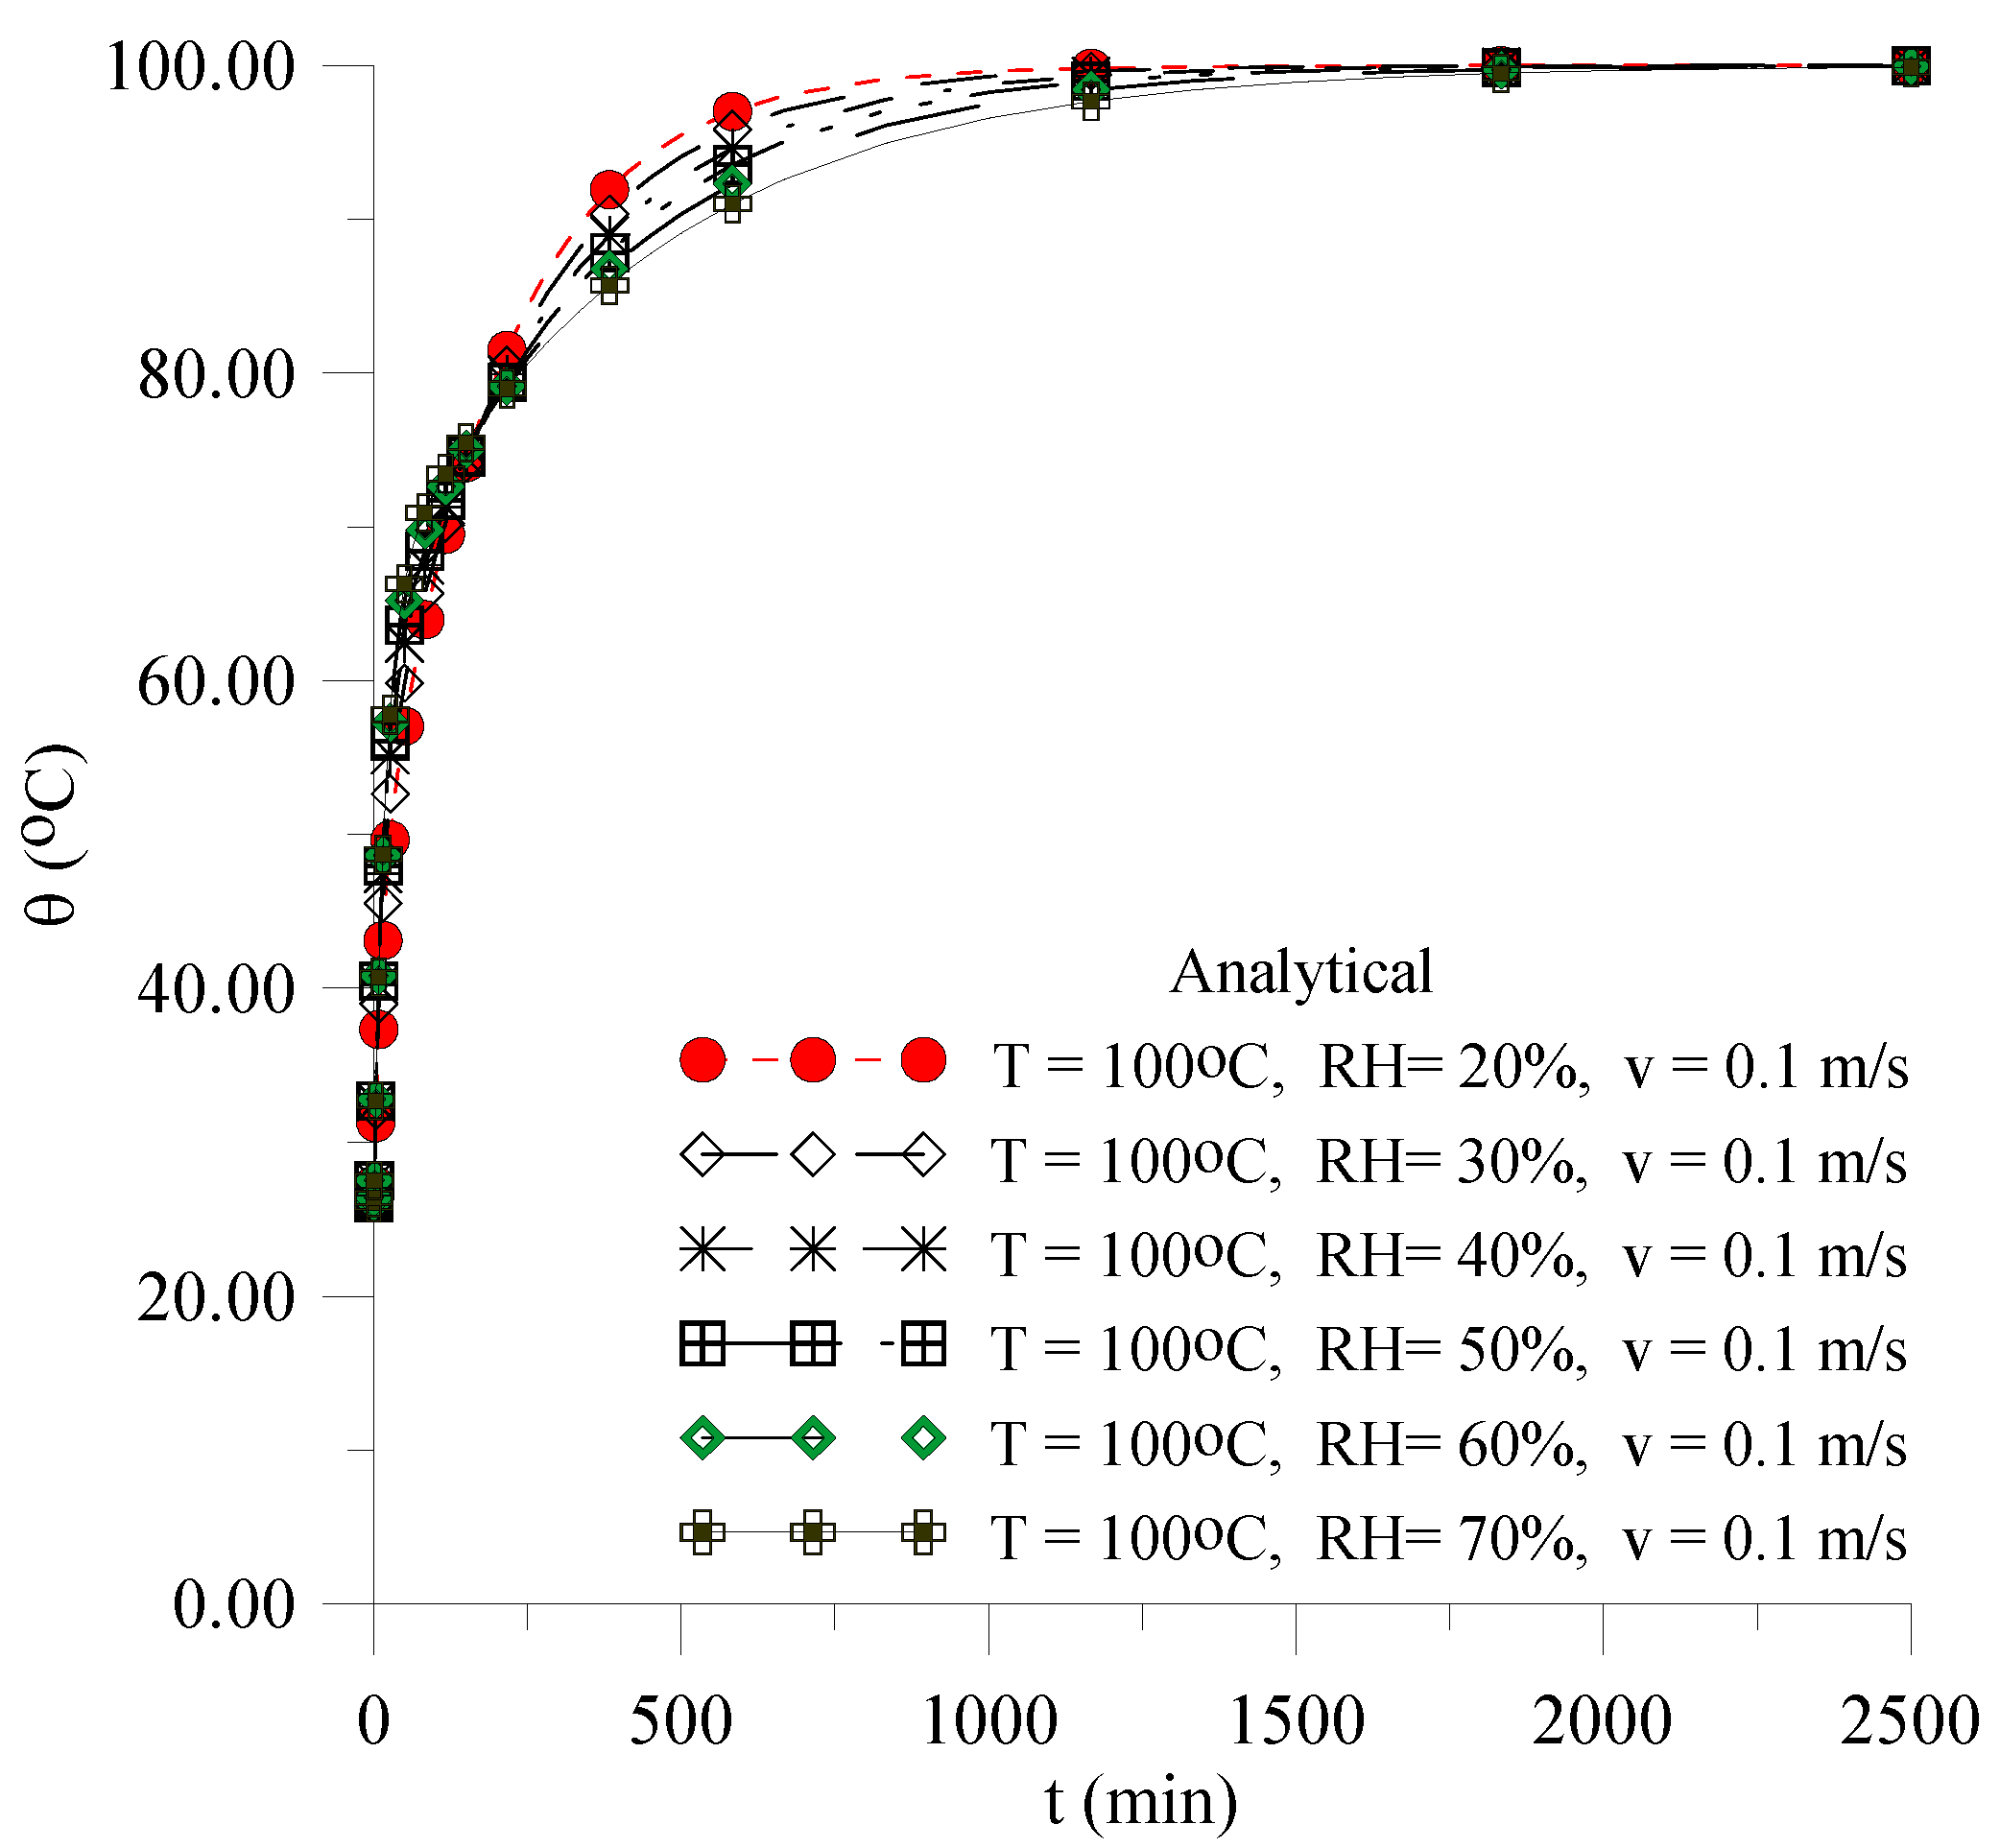
3.2.1. Effect of Relative Humidity of Drying Air

Figure 7 shows the drying kinetics of the industrial ceramic brick, in different relative humidities of the drying air, with the air temperature and speed kept constant (Cases 1 to 7, from Table 6). An analysis of this figure shows that the lower the relative humidity of the drying air, the faster the solid dries and, with that, there is a reduction in the drying time, to reach a previously specified moisture content. To give an idea, in t = 500 min (8.33 h) of the process, the average moisture content of the brick is 0.01433 and 0.05341 kg/kg (dry basis), for the relative humidity of 20% and 70%, respectively.
Figure 8 shows the heating kinetics of the industrial ceramic brick, in different relative humidities of the drying air, keeping the temperature and air speed constant. An analysis of this figure shows that the lower the relative humidity of the drying air is, the faster the solid heats up. To give an idea, in t = 500 min (8.33 h) of the process, the brick temperature is 95.49 and 89.09 °C for the relative humidity of 20 and 70%, respectively.
It is worth mentioning that higher drying and heating rates can cause problems in the brick structure and reduce the quality of the product at the end of the drying process. Therefore, it is preferable to have a process with a higher relative humidity, thus preventing defects from the drying process, such as cracks, deformations and fractures in the brick. However, the process time is longer, which reduces the productivity of this type of ceramic product.
Table 7 summarizes the values of the convective heat and mass transfer coefficients obtained under different drying conditions (Cases 1 to 6). An analysis of this table shows that both the convective mass transfer coefficient and the convective heat transfer coefficient decrease with an increase in the relative humidity of the drying air. Its values are small, typical of a natural mass and thermal convection problem. This can be confirmed by the high values of the relationship between the Grashof and Reynolds numbers ( Gr Re 2 1 ), in such a way that the effects of forced convection are negligible. Similar to the effect of the drying air temperature, the convective heat and mass transfer coefficients in the hole of the brick are slightly lower than those on the outer surface of the brick.
From the above, it can be said that for the drying situation with a lower relative humidity, there is slightly longer drying time, which leads to slightly lower productivity, but with products with good quality. This is because the removal of moisture is controlled and the temperature of the brick, throughout the process, is lower, reducing the thermo-mechanical effects of moisture and thermal gradients inside the brick. Moreover, we can mention the fact that the energy cost is much lower when drying with a low relative humidity (20%) compared to drying with relative humidity 70%, which reduces the final cost of the product.

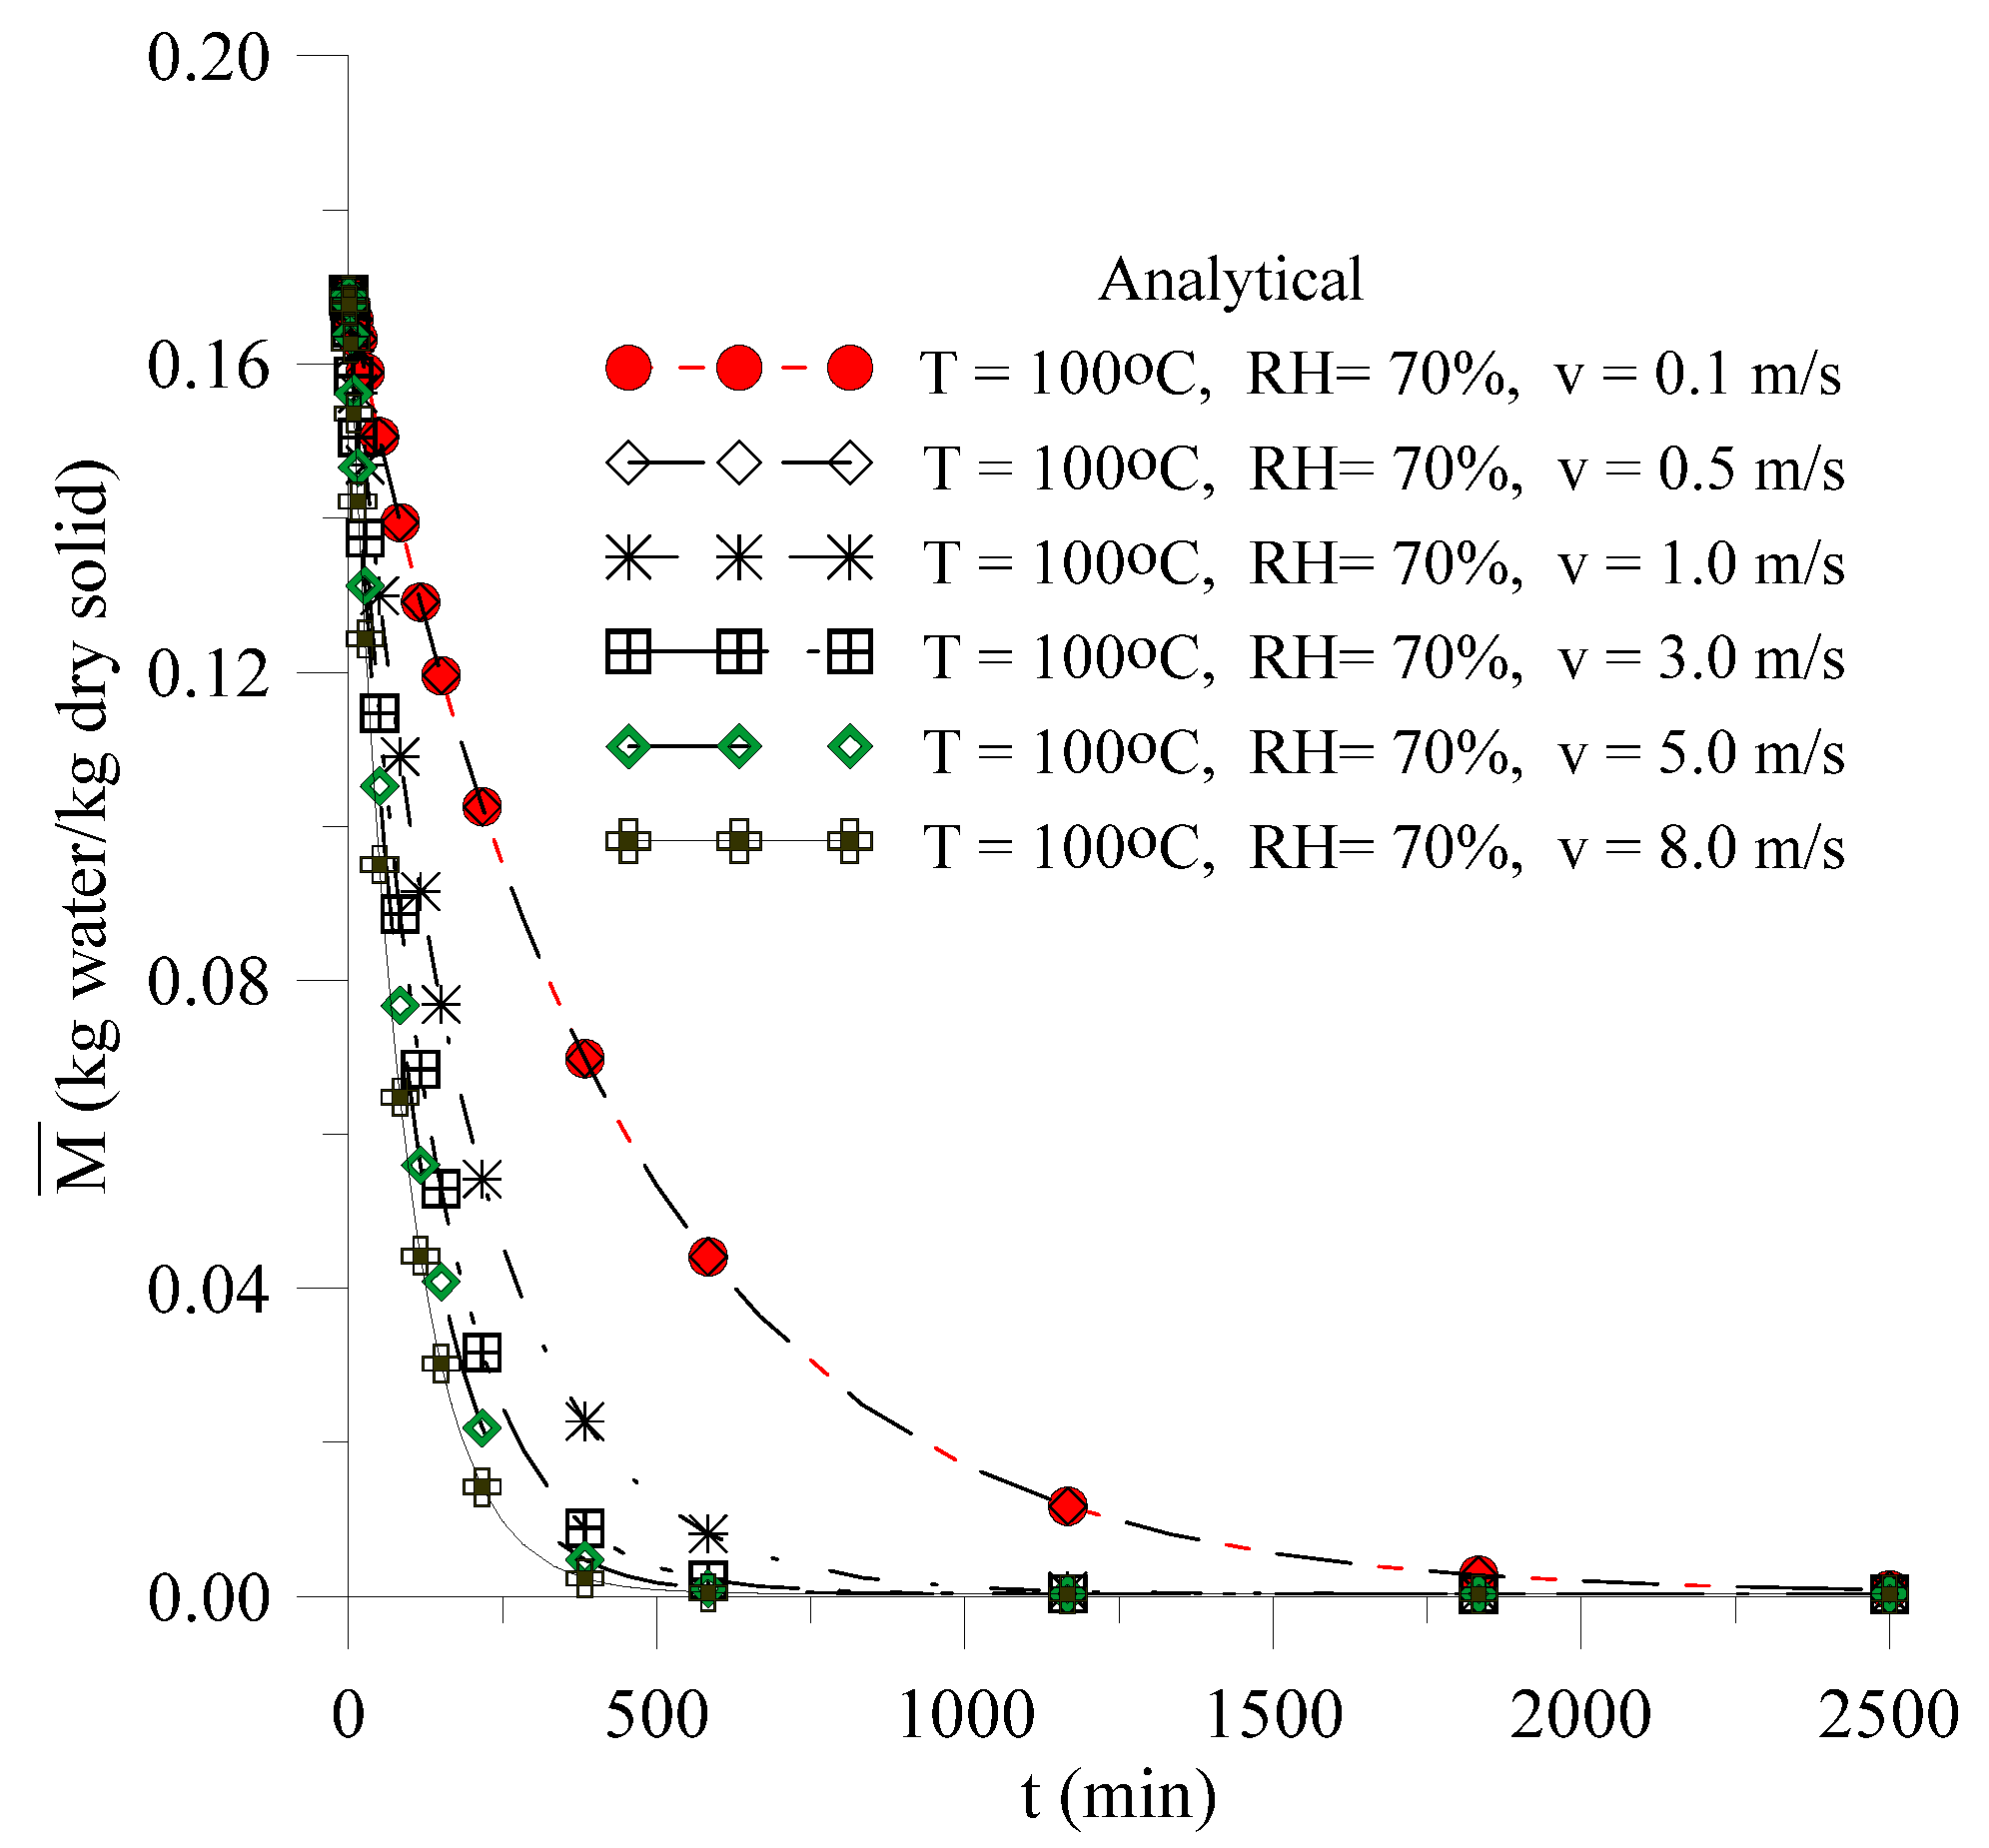
3.2.2. Effect of Drying Air Speed

Figure 9 shows the drying kinetics of the industrial ceramic brick, at different speeds of the drying air, keeping the temperature and relative humidity of the air constant (Cases 6 to 11, from Table 6). Analyzing this figure, it can be seen that, the higher the speed of the drying air is, the faster the solid dries and, with that, there is a reduction in the drying time, to reach the previously desired moisture content. In addition, it can be seen that for low speeds (up to 0.5 m/s), the drying kinetics is independent of the value of this parameter, substantially modifying the behavior of moisture loss for higher speeds. To give an idea, in t = 500 min (8.33 h) of the process, the average moisture content of the brick is 0.05341 and 0.00091 kg/kg (dry basis), for air speeds of 0.1 and 8.0 m/s, respectively.
In Figure 10, it is possible to observe that the heating kinetics of the industrial ceramic brick, at different speeds of the drying air, keeping the temperature and relative humidity of the air constant. From the analysis of this figure, it can be seen that the higher the speed of the drying air, the faster the solid heats up (higher heating rates). The explanation for this fact is related to the dependence of the convective heat transfer coefficient on the speed. To give an idea, in t = 500 min (8.33 h) of the process, the brick temperature is 89.09 and 99.89 °C for the air speeds of 0.1 and 8.0 m/s, respectively.
As previously mentioned if the drying and heating rates are higher, it can cause problems in the brick structure and reduce the quality of the product at the end of the drying process. Therefore, it is preferable to have a process with a lower air speed, thus preventing defects from the drying process, such as cracks, deformations and fractures in the brick. However, the process time is longer, which reduces the productivity of this type of ceramic product.
Table 8 shows the values of the convective heat and mass transfer coefficients obtained under different drying conditions (Cases 6 to 11). Analyzing the results of this table, it can be seen that both the convective mass transfer coefficient and the convective heat transfer coefficient increase with an increasing drying air speed. For speeds up to 0.5 m/s, the values of hm1, hm2, hc1 and hc2 are small, typical of a natural mass and a thermal convection problem. This can be confirmed by the high values of the relationship between the Grashof and Reynolds numbers ( Gr Re 2 1 ), in such a way that the effects of forced convection are negligible. However, for a speed between 1.0 and 8.0 m/s, the process occurs by combined natural and forced convection, confirmed by the values of the relationship between the Grashof and Reynolds numbers that are in the range of 0.23   Gr Re 2 14.89 .
Since the convective effects are more intense on the external surface of the brick, the values of the mass transfer coefficients (hm1) and heat (hc1) are much higher than the values of these parameters in the holes, where natural convection predominates.
Comparing the values of these parameters with those obtained when analyzing the effects of the relative humidity of the drying air, it can be observed that drying at a higher speed (Case 11) has a much higher convective mass and heat transfer coefficients. For example, for drying at T = 100 °C, RH = 70% and v=8.0 m/s, at t = 1000 min (16.67 h), the average moisture content of the brick was 0.00038 kg/kg (dry basis) and its vertex temperature reached 100 °C. For drying at T = 100 °C, RH = 20% and v = 0.1 m/s, at that same time, the average moisture content of the brick was 0.0015 kg/kg (dry basis) and its temperature at the apex reached 99.62 °C.
It is worth noting that in the industry, the average moisture content found in the ceramic bricks, at the end of the drying stage, reaches values between 3 and 4% (wet basis) and the process time is around 24 h, for drying being carried out in a crossflow tunnel dryer. In this type of dryer, the length of the equipment can reach 100 m, the temperature varies from 25 to 120 °C and the relative humidity ranges from 60 to 90%, but in some equipment of shorter length (35 m, for example), the value of this parameter can reach 10%. In general, after drying, due to the low moisture content, the brick absorbs water (either in the form of vapor, contained in the air, or in liquid form, from rain or soil, during the storage phase, before firing), which causes slight degradation due to volumetric expansion.
Table 9 summarizes the results that meet the conditions of the final moisture content established by the industrial sector for each drying condition studied. Thus, evaluating the results obtained in the analyzed cases, considering the maximum final moisture content of 3 to 4% (dry basis) and the temperature of the brick, the position of the brick with a hole perpendicular to the air flow, the drying time in these moisture content conditions, as well as the experimental results (in terms of brick quality during drying) presented by the author of [8], T = 100 °C, RH = 50% and v = 0.1 m/s are suggested as the optimal drying conditions.

3.3. Limitations of the Proposed Model

Despite the advantages presented by the proposed mathematical model, it fails in some points, such as:
(a)
In physical situations involving the effect of moisture removal on solid heating (simultaneous heat and mass transport);
(b)
In physical situations involving heterogeneous solids;
(c)
It does not allow for the determination of temperature gradients and the moisture content inside the material; therefore, analysis of internal hydric and thermal stresses during the drying process is not possible.

4. Conclusions

In this work, the physical problem of industrial clay brick drying using a lumped approach has been analyzed. From the results obtained, it can be concluded that:
(a)
The phenomenological mathematical modelling based on a lumped analysis to predict the mass and heat transfers in hollow ceramic bricks, was adequate, with small deviations from the experimental data on the average moisture content and temperature of the product over the process;
(b)
The lower the relative humidity is and the higher the speed of the drying air is, the faster the brick loses moisture and raises its temperature, which can cause defects in the post-drying product, reducing its quality for the firing step;
(c)
The heat and mass transfer coefficients on the external surface and on the brick hole are different, being higher on the external surface, especially under a forced convection condition;
(d)
The convective mass transfer coefficient on the external surface of the brick varied from 1.89 × 10⁻⁷ m/s in the drying condition at 100 °C, 70% and 0.1 m/s (natural convection) up to 20.90 × 10⁻⁷ m/s at 100 °C, 70% and 8.0 m/s (combined and natural convection). The convective mass transfer coefficient in the brick hole varied from 1.83 × 10⁻⁷ m/s in the drying condition at 100 °C, 20% and 0.1 m/s (natural convection) up to 2.30 × 10⁻⁷ m/s at 100 °C, 70% and 8.0 m/s (natural convection).
(e)
The convective heat transfer coefficient on the external surface of the brick varied from 4.13 W/m2K in the drying condition 100 °C, 70% and 0.1 m/s (natural convection) to 45.55 W/m2K at 100 °C, 70% and 8.0 m/s (combined and natural convection). The convective heat transfer coefficient in the brick hole varied from 3.98 W/m2K in the drying condition 100 °C, 70% and 0.1 m/s (natural convection) to 5.02 W/m2K at 100 °C, 70% and 8.0 m/s (natural convection).
(f)
Based on the maximum final moisture content of 3 to 4% (dry basis) after drying, commonly used in the industry, the temperature of the brick, the position of the brick with a hole perpendicular to the air flow, the drying time in these moisture content conditions and the experimental results (in terms of brick quality during drying) presented by the author of [8], T = 100 °C, RH = 50% and v = 0.1 m/s are proposed as the optimal drying conditions.

Author Contributions

All the authors contributed to the development, analysis, writing and revision of the paper: conceptualization, E.S.L. and W.M.P.B.L.; methodology, E.S.L., I.B.S. and W.M.P.B.L.; software, J.E.F.F., G.S.A. and A.G.B.L.; validation, E.S.L., I.B.S. and W.M.P.B.L.; formal analysis, E.S.L., J.M.P.Q.D., A.S.G. and A.G.B.L.; investigation, E.S.L., W.M.P.B.L., R.S.S. and J.M.P.Q.D.; writing—original draft preparation, E.S.L., J.M.P.Q.D. and A.G.B.L.; writing—review and editing, J.M.P.Q.D., A.G.B.L. and J.P.G.; visualization, E.S.L., A.F.V. and A.D.V.; supervision, A.G.B.L. and J.M.P.Q.D. All authors have read and agreed to the published version of the manuscript.

Funding

This work was supported by base funding (UIDB/04708/2020) and programmatic funding (UIDP/04708/2020) of the CONSTRUCT—Instituto de I&D em Estruturas e Construções, which is funded by national funds through the Fundação para a Ciência e a Tecnologia (FCT/MCTES). This work was funded by Paraiba State Research Foundation (FAPESQ) (grant number: 324/19), CNPq (grant number: 307414/2018−3), CAPES, and FINEP (Brazilian Research Agencies).

Institutional Review Board Statement

Not applicable.

Informed Consent Statement

Not applicable.

Data Availability Statement

The data that support the findings of this study are available upon request from the authors.

Acknowledgments

The authors would like to thank the Computational Laboratory of Thermal and Fluids, Mechanical Engineering Department, Federal University of Campina Grande (Brazil), for the research infrastructure and the references cited in the manuscript.

Conflicts of Interest

The authors declare no conflict of interest.

Nomenclature

Latin Letters
a1, a2, a3, a4Dimensions of the brick holes(m)
A C Total surface area(m2)
A L Lateral area(m2)
AIInternal surface area (m2)
a h Height of a hole(m)
a v Width of a hole(m)
c p Specific heat of the brick(J/kgK)
c v specific heat of the vapor phase(J/kgK)
c p a Specific heat of the air(J/kgK)
c w specific heat of water in the liquid phase(J/kgK)
D va diffusion coefficient of water vapor in the air(m2/s)
ERMQMQuadratic deviations for moisture content(kg2/kg2)
ERMQθQuadratic deviations for temperature(°C2/°C2)
GrGrashof number(---)
gGravitational acceleration(m/s2)
h fg Latent heat of water vaporization (J/kg)
h c 1 External convective heat transfer coefficients (W/m2K)
h c 2 Internal convective heat transfer coefficients(W/m2K)
h m 1 External convective mass transfer coefficients(m/s)
h m 2 Internal convective mass transfer coefficients(m/s)
Le Lewis number(---)
LcCharacteristic length(m)
MM ¯ v molecular weight of the water vapor(kg/kmol)
M ˙ Generation of moisture (kg/kg/s)
M e Equilibrium moisture content(kg/kg, d.b)
M 0 Initial moisture content(kg/kg, d.b)
M ¯ Average moisture content(kg/kg, d.b)
MM ¯ a Molecular weight of the gas(kg/kmol)
nNumber of experimental points(---)
n ^ Number of fitted parameters(---)
NuNusselt number(---)
PvwbVapor pressure in the air at the wet bulb temperature(Pa)
PrPrandtl number(---)
PvsSaturation vapor pressure(Pa)
PatmAtmospheric pressure(Pa)
Ppressure(Pa)
q   ˙ Heat generation per unit volume (W/m³)
R a Universal constant of the gases(J/molK)
RaRayleigh number(---)
ReReynolds number(---)
RxWidth(m]
RyHeight(m]
RzLength(m]
RHRelative humidity(%]
S1Internal surface area(m²]
S2Enternal surface area(m²]
S ¯ M 2 Variance for moisture content(kg2/kg2)
S ¯ θ 2 Variance for temperature(°C2/°C2)
tTime(s or min)
TabsAbsolute temperature(K)
T f Film temperature(K or °C)
TsPlate temperature(K or °C)
T∞Fluid temperature(K or °C)
V T Volume of the solid brick (with the holes)(m³0
V F Volume of the holes(m³)
VVolume(m³)
xaAbsolute humidity of the air(kg/kg)
xoAbsolute humidity of the air at the drying air temperature(kg/kg)
xbuAbsolute humidity of the air at the wet bulb temperature (kg/kg)
Greek Letters
α Thermal diffusivity of the air(m2/s)
β Thermal expansion coefficient(K−1)
ν Kinematic viscosity(m2/s)
ρ s Specific density of the dry solid (kg/m3)
ρ a Air density(kg/m3)
ρ u Specific density of the wet solid(kg/m3)
θ ¯ Instantaneous temperature(K or °C)
θ ¯ Temperature of the external medium(K or °C)
θ ¯ 0 Initial temperature of the solid(K or °C)

References

  1. Cabral Junior, M.; Motta, J.F.M.; Almeida, A.S.; Tanno, L.C. RMIs: Clay for red ceramic. Rocks and industrial minerals in Brazil: Uses and specifications. CETEM 2008, 2, 747–770. (In Portuguese) [Google Scholar]
  2. Sahu, K.M.; Singh, L.; Choudhary, S.N. Critical Review on Bricks. Int. J. Eng. Manag. Res. 2016, 6, 80–88. [Google Scholar]
  3. Andrade, F.A.; Al-Qureshi, H.A.; Hotza, D. Measuring the plasticity of clays: A review. Appl. Clay Sci. 2011, 51, 1–7. [Google Scholar] [CrossRef] [Green Version]
  4. Brooker, D.B.; Bakker-Arkema, F.W.; Hall, C.W. Drying and Storage of Grains and Oilseeds; AVI Book: New York, NY, USA, 1992. [Google Scholar]
  5. Yang, J.; Lu, H.; Zhang, X.; Li, J.; Wang, W. An experimental study on solidifying municipal sewage sludge through skeleton building using cement and coal gangue. Adv. Mater. Sci. Eng. 2017, 2017, 5069581. [Google Scholar] [CrossRef] [Green Version]
  6. Musielak, G.; Śliwa, T. Modeling and Numerical Simulation of Clays Cracking During Drying. Dry Technol. 2015, 33, 1758–1767. [Google Scholar] [CrossRef]
  7. Itaya, Y.; Taniguchi, S.; Hasatani, M. A numerical study of transient deformation and stress behavior of a clay slab during Drying. Dry Technol. 1997, 15, 1–21. [Google Scholar] [CrossRef]
  8. Silva, J.B. Simulation and Experimentation of the Holed Ceramic Bricks Drying. Ph.D. Thesis, Federal University of Campina Grande, Campina Grande, Brazil, 2009. [Google Scholar]
  9. Silva, J.B.; Almeida, G.S.; Lima, W.M.P.B.; Neves, G.A.; de Barbosa Lima, A.G. Heat and mass diffusion including shrinkage and hygrothermal stress during drying of holed ceramics bricks. Defect Diffus. Forum 2011, 312–315, 971–976. [Google Scholar] [CrossRef]
  10. Van der Zanden, A.J.J. Modelling and Simulating Simultaneous Liquid and Vapour Transport in Partially Sutured Porous Materials, Mathematical Modeling and Numerical Techniques in Drying Technology; Mareei Dekker Inc.: New York, NY, USA, 1997. [Google Scholar]
  11. Van der Zanden, A.J.J.; Schoenmakers, A.M.E.; Kerkof, P.J.A.M. Isothermal Vapour and Liquid Transport Inside Clay During Drying. Dry Technol. 1996, 14, 647–676. [Google Scholar] [CrossRef]
  12. Zaccaron, A.; Souza Nandi, V.; Bernardin, A.M. Fast drying for the manufacturing of clay ceramics using natural clays. J. Build. Eng. 2021, 33, 101877. [Google Scholar] [CrossRef]
  13. El Ouahabi, M.; El Boudour El Idrissi, H.; Daoudi, L.; El Halim, M.; Fagel, N. Moroccan clay deposits: Physico-chemical properties in view of provenance studies on ancient ceramics. Appl. Clay Sci. 2019, 172, 65–74. [Google Scholar] [CrossRef]
  14. Kolesnikov, G.; Gavrilov, T. Modeling the Drying of Capillary-Porous Materials in a Thin Layer: Application to the Estimation of Moisture Content in Thin-Walled Building Blocks. Appl. Sci. 2020, 10, 6953. [Google Scholar] [CrossRef]
  15. De Barbosa Lima, A.G.; Delgado, J.M.P.Q.; Nascimento, L.P.C.; Lima, E.S.; Oliveira, V.A.B.; Silva, A.V.; Silva, J.V. Clay ceramic materials: From fundamentals and manufacturing to drying process predictions. In Transport Processes and Separation Technologies, 1st ed.; Delgado, J.M.P.Q., Lima, A.G.B., Eds.; Springer: Cham, Switzerland, 2021; Volume 133, pp. 1–29. [Google Scholar]
  16. Yan, M.; Song, X.; Tian, J.; Lv, X.; Zhang, Z.; Yu, X.; Zhang, S. Construction of a New Type of Coal Moisture Control Device Based on the Characteristic of Indirect Drying Process of Coking Coal. Energies 2020, 13, 4162. [Google Scholar] [CrossRef]
  17. Lima, E.S.; Lima, W.M.P.B.; Lima, A.G.B.; Farias Neto, S.R.; Silva, E.G.; Oliveira, V.A.B. Advanced study to heat and mass transfer in arbitrary shape porous materials: Foundations, phenomenological lumped modeling and applications. In Transport Phenomena in Multiphase Systems, 1st ed.; Delgado, J.M.P.Q., Lima, A.G.B., Eds.; Springer: Cham, Switzerland, 2018; Volume 93, pp. 181–217. [Google Scholar]
  18. Araújo, M.V.; Correia, B.R.B.; Brandão, V.A.A.; Oliveira, I.R.; Santos, R.S.; Oliveira Neto, G.L.; Silva, L.P.L.; de Barbosa Lima, A.G. Convective Drying of Ceramic Bricks by CFD: Transport Phenomena and Process Parameters Analysis. Energies 2020, 13, 2073. [Google Scholar] [CrossRef] [Green Version]
  19. Silva, W.P.; Silva, C.M.D.P.S.; Silva, L.D.; Farias, V.S.O. Drying of clay slabs: Experimental determination and prediction by two-dimensional diffusion models. Ceram. Int. 2013, 39, 7911–7919. [Google Scholar] [CrossRef]
  20. Silva, A.M.V.; Delgado, J.M.P.Q.; Guimarães, A.S.; Lima, W.M.P.B.; Gomez, R.S.; Farias, R.P.; Lima, E.S.; de Barbosa Lima, A.G. Industrial Ceramic Blocks for Buildings: Clay Characterization and Drying Experimental Study. Energies 2020, 13, 2834. [Google Scholar] [CrossRef]
  21. Lima, W.M.P.B.; Lima, E.S.; Lima, A.R.C.; Oliveira Neto, G.L.; Oliveira, N.G.N.; Farias Neto, S.R.; de Barbosa Lima, A.G. Applying Phenomenological Lumped Models in Drying Process of Hollow Ceramic Materials. Defect Diffus. Forum 2020, 400, 135–145. [Google Scholar] [CrossRef]
  22. De Lemos, M.J.S. Turbulence in Porous Media: Modeling and Applications; Elsevier: Amsterdam, The Netherlands, 2006. [Google Scholar]
  23. Wana, H.; Xua, X.; Gaoa, J.J.; Lia, A. A moisture penetration depth model of building hygroscopic material. Procedia Eng. 2017, 205, 3235–3242. [Google Scholar] [CrossRef]
  24. Zhang, M.; Qin, M.; Rode, C.; Chen, Z. Moisture buffering phenomenon and its impact on building energy consumption. Appl. Therm. Eng. 2017, 124, 337–345. [Google Scholar] [CrossRef]
  25. Incropera, F.P.; de Witt, D.P. Fundamentals of Heat and Mass Transfer; John Wiley & Sons: New York, NY, USA, 2002. [Google Scholar]
  26. Pakowski, Z.; Bartczak, Z.; Strumillo, C.; Stenstrom, S. Evaluation of equations approximating thermodynamic and transport properties of water, steam and air for use in CAD of drying processes. Dry Technol. 1991, 9, 753–773. [Google Scholar] [CrossRef]
  27. Jumah, R.Y.; Mujumdar, A.S.; Raghavan, G.S.V. A mathematical model for constantand intermittent batch drying of grains in a novel rotating jet spouted bed. Dry Technol. 1996, 14, 765–802. [Google Scholar]
  28. Çengel, Y.A. Heat and Mass Transfer: A Practical Approach; McGraw Hill: Boston, MA, USA, 2007. [Google Scholar]
  29. Figliola, R.S.; Beasley, D.E. Theory and Design for Mechanical Measurements; Wiley: New York, NY, USA, 1995. [Google Scholar]
Figure 1. Schematic representation of a solid with arbitrary geometry immersed in a heated fluid.
Energies 14 04294 g001
Figure 2. Scheme of the brick used in the research.
Energies 14 04294 g002
Figure 3. Brick with side facing the air flow.
Energies 14 04294 g003
Figure 4. Brick model with the dimensions that characterize the brick and holes, and the location of the brick temperature measurement.
Energies 14 04294 g004
Figure 5. Comparison between the predicted and experimental average moisture content during the drying process of industrial hollow ceramic bricks.
Energies 14 04294 g005
Figure 6. Comparison between predicted and experimental surface temperature (vertex) during the drying process of industrial hollow ceramic bricks.
Energies 14 04294 g006
Figure 7. Average moisture content of industrial ceramic brick as a function of time for different relative humidity of the drying air.
Energies 14 04294 g007
Figure 8. Temperature at the vertex of the industrial ceramic brick as a function of time for different relative humidity of the drying air.
Energies 14 04294 g008
Figure 9. Average moisture content of industrial ceramic brick as a function of time for different drying air speeds.
Energies 14 04294 g009
Figure 10. Temperature at the vertex of the industrial ceramic brick as a function of time for different drying air speeds.
Energies 14 04294 g010
Table 1. Parameters of Equation (65) obtained after fitting to experimental data of average moisture content [8].
T
(°C)
ParametersRProportion of Variance
A1 (-)k1 (min−1)A2 (-)k2 (min−1)
1004.875507−0.008383−3.827964−0.0078810.9982974960.996597890
Table 2. Equation (66) parameters obtained after adjustment to experimental moisture content data [15].
T
(°C)
ParametersRProportion of Variance
B1 (°C)B2 (°C/Log10(min))B3 (min)k3 (-)
100−2.8696915.41788118.382132.2346650.9846327710.969501694
Table 3. Experimental parameters of air and dimensions of hollow ceramic bricks used in the experiments [8].
AirBrick
T
(°C)
RH
(%)
v
(m/s)
Rx
(mm)
Ry
(mm)
Rz
(mm)
a1
(mm)
a2
(mm)
a3
(mm)
a4
(mm)
1001.80.1092.8198.0202.011.79.418.748.0
Table 4. Experimental parameters of air and brick for drying test [8].
AirBrickt (h)
T (°C)Mo (d.b.)Mf (d.b.)Me (d.b.)θ0 (°C)θf (°C)
1000.169030.000380.0003826.193.212.3
Table 5. Thermophysical and geometric parameters of the brick used in the simulation.
Brick
k
(W/mK)
ρu
(kg/m3)
ρs
(kg/m3)
cp
(J/kgK)
S1
(mm2)
S2
(mm2)
V
(mm3)
0.8331754.881889.95545.00134,651.775226,514.7201,734,026.095
Table 6. Air and brick conditions used in drying simulations.
CaseAir
T ( ° C ) RH (%)v (m/s)Twb (°C)x0 (kg/kg)
1100200.162.460.15550
2100300.170.480.26660
3100400.176.760.41470
4100500.181.980.62210
5100600.186.450.93330
6100700.190.381.45200
7100700.590.381.45200
8100701.090.381.45200
9100703.090.381.45200
10100705.090.381.45200
11100708.090.381.45200
Table 7. Heat transfer coefficients and convective mass for different relative humidity of the drying air.
Drying Air ConditionMass Transfer CoefficientHeat Transfer CoefficientGr/Re2
(-)
T (°C)RH (%)v (m/s)hm1
(m/s)
hm2
(m/s)
hc1
(W/m2K)
hc2
(W/m2K)
100200.14.10 × 10−73.92 × 10−75.915.666037.75
100300.13.46 × 10−73.32 × 10−75.535.314694.73
100400.12.94 × 10−72.83 × 10−75.194.993663.88
100500.12.59 × 10−72.50 × 10−74.854.672820.57
100600.12.22 × 10−72.14 × 10−74.504.342107.97
100700.11.89 × 10−71.83 × 10−74.133.981488.59
Table 8. Convective heat and mass transfer coefficients for different drying air speeds.
Drying Air ConditionMass Transfer CoefficientHeat Transfer CoefficientGr/Re2
(-)
T (°C)RH (%)v (m/s)hm1
(m/s)
hm2
(m/s)
hc1 (W/m2K)hc2
(W/m2K)
100700.11.89 × 10−71.83 × 10−74.133.981488.59
100700.51.89 × 10−71.83 × 10−74.133.9859.54
100701.07.44 × 10−72.30 × 10−716.225.0214.89
100703.012.81 × 10−72.30 × 10−727.935.021.65
100705.016.53 × 10−72.30 × 10−736.025.020.59
100708.020.90 × 10−72.30 × 10−745.555.020.23
Table 9. Brick conditions at the end of the drying process.
CaseAirBrick
T ( ° C ) RH (%)v (m/s)M (kg/kg)θ (°C)t (min)
1100200.10.0323989.65333.33
2100300.10.0338590.34383.33
3100400.10.0339891.31450.00
4100500.10.0350291.60500.00
5100600.10.0350292.30583.33
6100700.10.0364492.58666.67
7100700.50.0364492.58666.67
8100701.00.0382592.21283.33
9100703.00.0316793.56216.67
10100705.00.0378292.30158.33
11100708.00.0302493.86150.00
Publisher’s Note: MDPI stays neutral with regard to jurisdictional claims in published maps and institutional affiliations.

