
Equivalent Parallel Strands Modeling of Highly-Porous Media for Two-Dimensional Heat Transfer: Application to Metal Foam

Department of Mechanical Engineering, University of Detroit Mercy, Detroit, MI 48221, USA
Energies 2021, 14(19), 6308; https://doi.org/10.3390/en14196308
Submission received: 6 July 2021
/
Revised: 24 September 2021
/
Accepted: 30 September 2021
/
Published: 2 October 2021
(This article belongs to the Special Issue Advances of Heat Transfer in Porous Media)
Abstract
:A new geometric modeling of isotropic highly-porous cellular media, e.g., open-cell metal, ceramic, and graphite foams, is developed. The modelling is valid strictly for macroscopically two-dimensional heat transfer due to the fluid flow in highly-porous media. Unlike the current geometrical modelling of such media, the current model employs simple geometry, and is derived from equivalency conditions that are imposed on the model’s geometry a priori, in order to ensure that the model produces the same pressure drop and heat transfer as the porous medium it represents. The model embodies the internal structure of the highly-porous media, e.g., metal foam, using equivalent parallel strands (EPS), which are rods arranged in a spatially periodic two-dimensional pattern. The dimensions of these strands and their arrangement are derived from equivalency conditions, ensuring that the porosity and the surface area density of the model and of the foam are indeed equal. In order to obtain the pressure drop and heat transfer results, the governing equations are solved on the geometrically-simple EPS model, instead of the complex structure of the foam. By virtue of the simple geometry of parallel strands, huge savings on computational time and cost are realized. The application of the modeling approach to metal foam is provided. It shows how an EPS model is obtained from an actual metal foam with known morphology. Predictions of the model are compared to experimental data on metal foam from the literature. The predicted local temperatures of the model are found to be in very good agreement with their experimental counterparts, with a maximum error of less than 11%. The pressure drop in the model follows the Forchheimer equation.
1. Introduction
Highly-porous open-cell media include open-cell metal foam (e.g., aluminum, copper, nickel) and graphite foam. These foams can have porosities exceeding 90%. They are composed of cells and ligaments that form pores or windows, which is shown in Figure 1. Many of these highly-porous media, such as well-produced aluminum foam made by casting over polymeric pre-forms, are practically isotropic and have uniform average geometrical properties [1,2]. There are a few thermal advantages of metal foams. The advantages stem from their high solid-phase conductivities, very large surface area (up to 10,000 m2/m3) [3,4,5], and their good permeability, which is in the order of 10−8 m2 [6,7,8,9]. Additionally, the foams’ internal structure causes vigorous mixing, which augments convection heat transfer. Thermal applications of metal foams have been sought in compact heat exchangers [10,11,12,13,14], the thermal management of fuel cells [15,16], and high-power batteries [17]. Combining aluminum foam with phase change materials caused a 50% temperature drop and provided a uniform temperature of Li-Ion batteries [18]. The combination has been considered for the cooling of portable [19,20] and other electronics [21,22]. The use of metal foams is also envisioned in metal hydride reactors [23], catalytic reactors [24], turbojet engines [25], and geothermal power plants [26].
Studying the foam by direct numerical simulation is computationally demanding; it can require millions of computational elements. For example, 1.5 million elements were used to analyze ten foam cells [27]. The common analytical approach for studying transport in the foam is to average the microscopic governing equations over an elementary volume: the volume-average theory. The smallest representative elementary volume (REV) for metal foam is eight cells (two in each direction) [28]. The resulting macroscopic momentum and energy equations require four closure terms: permeability, inertial coefficient, thermal dispersion conductivity, and interstitial heat transfer coefficient. These closure terms need to be determined experimentally [29] or from correlations [30]. To solve the resulting averaged equations for a full REV, the number of numerical elements will be too large. For example, to analyze an REV of 10-ppi foam with a porosity of 93.2%, the number of elements would be in the order of 200 million [31]. The volume-average theory, conceived for tight porous media, has produced some unacceptable results when applied to highly-porous metal foam. For example, this theory predicts that the hydrodynamic entrance length in any porous medium is of order , where is the permeability, is the Darcy velocity, and is the kinematic viscosity [32,33]. For packed 1-mm spheres, the porosity is 35% and the permeability is 10 × 10−10 m2 [34], whereas for a metal foam with a porosity of 87.6%, the permeability is 5.3 × 10⁻⁸ m2 [35]; thus, at the same velocity, the entry region in the foam is about two orders of magnitude longer compared to the spheres. Microscopic simulations [36] have shown that the hydrodynamic entry length for air flow in metal foam having a cell diameter of 5.1 mm is 30.5 mm, compared to 1.7 mm predicted by the volume-average theory (at the same Reynolds number). This clearly shows the disparity between the two approaches when it comes to hydrodynamic development. Sachan et al. [37] indicated that the volume-average theory may not be valid for metal foams.
Another approach for capturing the complex structure of metal foam and similar highly-porous media is by using micro-computed tomography (µCT) [38,39,40,41]. Governing transport equations are then solved over the reconstructed foam structure. Tomography machines are very expensive. Moreover, µCT data require powerful computers in order to capture and reconstruct the 3D structure of the foam from 2D images, and then to solve the governing equations over this complex structure. Typically, researchers scanned small foam samples and investigated transport on these samples, e.g., 8 mm3 [38], 9 mm3 [13], 10 × 11.7 × 11.7 mm [28], which is inadequate for capturing entry/boundary effects, and thus the obtained results are only valid for fully-developed or periodic conditions. Even though larger samples can be scanned, the maximum sample size depends on the resolution of the µCT machines. Also, when using µCT, morphological and transport properties of a specific foam structure are obtained individually on a case-by-case basis. This prevents performing sizable systematic studies on multiple samples in order to yield general relations among various parameters.
In order to save costs and time, researchers have modeled the complex geometry of metal foam using ‘idealized’ cells that are intended to capture the relevant characteristics of the foam’s structure [24,27,42]. The widely used cells [43] are the Kelvin tetradecahedron cell [44,45,46,47] and Kelvin-like cells [48]. The foam’s structure has also been generated by Laguerre-Voronoi tessellations [49]. Kumar et al. [50] investigated the effect of strut’s cross-sectional shape on the thermo-hydraulic properties of metal foams when they are represented by circular, square, diamond, hexagon, and star strut shapes. It was shown that the cross-section shape had an influence on the thermal and hydraulic phenomena in the foam.
In order to calculate the effective thermal conductivity, Bhattacharya et al. [51] represented the foam structure with two-dimensional hexagonal units with circular intersections. The same representation was used by [52], but the intersections were square. Hu et al. [53] represented the foam structure by tetrakaidecahedra to investigate the dehumidifying process of moist air in metal foam. The same structural unit was used by [54] to determine the surface area density of foams. Miwa et al. [55] utilized a geometrical cell that has exterior cubical skeleton with interior struts.
Issues with current geometrical modeling include the complexity of cell structures, the multi-steps needed to create the models, and the effort needed to duplicate cells for large numerical-solution domains. Because of the complex cell structures, solutions usually require considerable computational power and time. Certain models have limitations in terms of the foam than can be represented by them. For example, the body-centered- cube (BCC) model is limited to a foam porosity higher than 93% [55]. Other issues with the BCC model is the difficulty of adjusting the ligament thickness and the pore diameter independently [55]. Existing geometrical-modeling studies have typically assumed fully-developed conditions by using a single (periodic) cell or few cells in their simulations, e.g., in [40,41]; as such, critical boundary and entrance effects are automatically not investigated. Sachan et al. [37] has shown that these effects are considerable in foams.
Modeling efforts seem to be primarily focused on trying to match the geometrical shape of the internal structure of the foam [27,56,57,58], not on matching pertinent morphological properties (e.g., porosity and surface area). By doing so, they inadvertently compromise the critical matching of key transport properties, e.g., effective thermal conductivity and convection heat transfer coefficient. Thus, not surprisingly, some of the idealized structures poorly predict heat transfer and pressure drop as compared to actual structures of foam [59,60]. Actually, several foam’s modeling studies have recorded significant differences between predictions of their models and experimental data, e.g., in [27,56,58].
It is evident that there is a need for robust modeling of highly-porous media such as metal foams, so that cost and time of investigating flow and heat transfer therein can be reduced. To that end, the modeling needs to be manageable in terms of geometric complexity. More importantly, any geometric model must possess the equivalent properties as the foam, such that pressure drop and heat transfer in the model match their counterparts in the actual foam. This kind of matching is far more important than matching geometrical shapes. The current paper is a first attempt at addressing some of these critical points. The novelty and advantages of the current model described in this paper—over existing models and other approaches for studying heat transfer in highly-porous media—can be summarized as follows. The current modeling effort is focused on matching pertinent heat transfer properties, e.g., effective thermal conductivity and convection heat transfer area, in order to better predict the combined conduction/convection heat transfer in metal foam. Unlike previous modeling, the current modeling employs a very simple geometry that is easy to duplicate, and saves computational time. The simple geometry is conducive to constructing a large computational domain quickly. The model presented here mitigates the need for expensive micro-computed tomography. In addition, the present model avoids the use of the volume-average theory, which seems to produce unacceptable results when applied to highly-porous media such as metal foam.
2. New Model Rationale and Development
When a highly-porous cellular material, e.g., open-cell metal foam, is attached to a heated solid surface and subjected to fluid flow, the thin ligaments of the foam conduct heat from the heated surface, which is subsequently convected to the through-moving fluid. The ligaments have small diameters compared to the cell diameter. For example, for a 97%-porous aluminum foam with a 6.90 mm cell diameter, the ligament diameter is 0.41 mm [27]. This foam can be represented by equivalent parallel strands (EPS) made from the same material as the foam, and attached perpendicularly to the same solid surface. This modeling pertains strictly to two-dimensional heat transfer, e.g., a metal-foam heat sink and metal foam sandwiched between two parallel plates with one or both plates heated. To ensure that the EPS and the foam produce the same heat transfer and pressure drop, the geometrical parameters for the EPS will be strategically derived from the actual morphology of foam, as explained below.
In one manifestation of the EPS, the strands can be thin circular cylinders arranged in a staggered fashion. For this case, the foam is actually represented by thin cylinders of equal diameter, as in tube banks or pin fins. The geometry of the EPS is not arbitrary, but is governed by the morphology of the foam. The geometry of an EPS model is fully described by the cylinder’s diameter as well as the longitudinal, transverse, and diagonal pitches. Figure 2 shows a top view of an EPS, identifying the width W, length L, and height H (not shown). Assume that the EPS is attached at the bottom to a solid wall to apply heat, as in the case of a heat sink. The geometric parameters of the EPS can be determined using modeling relations (conceived for the first time). To ensure that the EPS and the foam are equivalent in producing the same transport effects, conditions are imposed on the modelling a priori. The equivalency conditions will yield equations that will be eventually solved to yield the geometrical parameters of the EPS model, as expounded next.
- Conduction Equivalency Condition and First Modelling Relation:
The conduction in the solid phase of the foam is governed by the effective thermal conductivity, which is primarily a function of porosity [48,60,61]. The gas flow in the metal foam dispersion is negligible [62]. The porosity of the foam
is the ratio of the void fraction to the total volume of the foam. The first equivalency condition is that the porosities of EPS and foam must be equal:
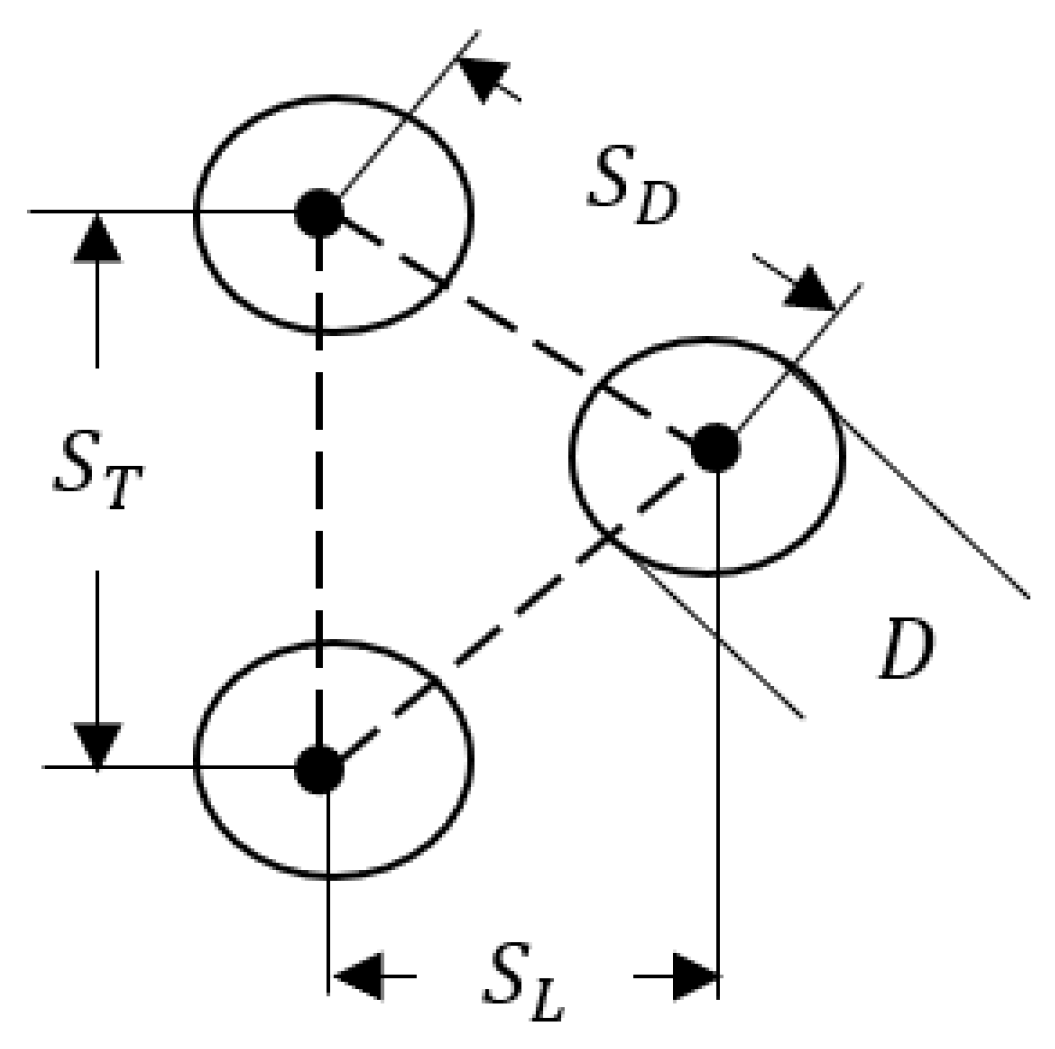
For isotropic foam, the contact area between the foam and the wall is governed by the solid fraction of foam, which is . Unlike packed spheres, the porosity of foams is constant even close to solid boundaries [57]. The percentage of the contact area (the area where the cylinders contact the wall) to the total wall’s area is given by . To take this further and illustrate the development of the EPS model, the cylinders’ arrangement of Figure 2 is considered. This is a staggered arrangement with a longitudinal pitch , transverse pitch , and diagonal pitch . One can define a repeating unit: an area having a length and width surrounding a typical EPS cylinder (the dotted small rectangle in Figure 2). If the diameter of a typical cylinder is , then the contact area is given by . Substituting for in the above equation, the following is obtained:
This is the first EPS modelling relation. It relates the longitudinal pitch and transverse pitch of the EPS model to the porosity of the foam.
- Convection Equivalency Condition and Second Modelling Relation:
The internal surface area of the foam controls the convection in such materials to a large extent. This is, of course, in addition to the heat transfer coefficient, geometry, and temperature difference between the solid and fluid inside the foam. In an attempt to have the EPS model produce the same heat transfer as the foam, the second equivalency condition imposed is that the surface area of the foam and that of its EPS model must be equal:
The surface area of metal foams is often given in the literature [57,58], or can be calculated [48,63,64]. Sometimes it is available by manufacturers, e.g., in [65]. Based on Figure 2, the surface area (per unit volume) of the EPS is given by , where is the number of cylinders in a volume . Based on a single cylinder, the EPS is given by . Substituting in the surface area equivalency condition in the second EPS modelling relation is obtained as:
This is the second modeling relation. It relates the longitudinal pitch and transverse pitch of the EPS model to the surface area density of the foam. Equations (2) and (4) have three unknowns: , , and .
- Staggering Option and Closing Set of Modelling Relations:
The remaining set of modelling relations depends on the choice of strands’ staggering arrangement. For example, for the equilateral-triangle arrangement shown in Figure 3, there is a relationship between the three pitches; namely . Once this is substituted in Equations (2) and (4), only two unknowns and remain, and the resulting two equations are solved simultaneously to yield Equations (5)–(8):
Note that in these last four equations, , , and (the full description of the EPS) are completely expressed in terms of the foam’s porosity and surface area density . The following procedure illustrates how the results of this section can be applied to study heat transfer and pressure drop in metal foam:
- (a)
- Start with metal foam with known porosity and surface area density, in which heat transfer and pressure drop are of interest;
- (b)
- use these two known morphological properties of the foam, and find the geometrical properties of the tube bank (EPS) that would produce the same heat transfer and pressure drop for this foam. The geometrical properties of the tube bank are obtained using Equations (5)–(9);
- (c)
- construct this tube bank geometry (EPS) in a numerical package, e.g., ANSYS;
- (d)
- investigate (solve the momentum and energy governing equations) over this tube bank in the numerical package. The resulting heat transfer and pressure drop of this step will be the same as those of the foam.
These steps, and the way the current modeling is employed, are illustrated by the following example.
3. Example and Numerical Solution on EPS
Consider a block of commercial open-cell aluminum foam having 20 pores per inch (ppi). Let the dimensions of the cross-section of the foam be W = 10.16 cm (4 in) and H = 10.16 cm (4 in). The length of the block in the flow direction is L = 5.08 cm (2 in). The block is brazed to a 3-mm thick solid aluminum base. The aluminum block acts like a heat sink: it is heated from the bottom with a constant heat flux of 29,900 W/m2 and is cooled by the air. The cross-sectional area is open to the flow, while all other sides are insulated. The porosity is 78.2%, which can be determined by comparing the weight of the foam to the weight of an equivalent volume of solid aluminum alloy from which the foam is made. The surface area density for this 20 ppi foam is available directly from the manufacturer [65]:
It should be noted that the surface area depends on the ppi, so the surface area and the porosity are independent. For this foam block, knowledge of the porosity and surface area density, along with a choice of staggering arrangement, are sufficient to determine an EPS. Employing an equilateral-triangle arrangement, the EPS representing this foam block is obtained using Equations (5)–(8), and is shown in Figure 4. The diameter of each cylindrical strand in the EPS is 0.41 mm, and diagonal , longitudinal , and transverse pitches are 1.37, 1.19, and 1.37 mm, respectively.
The EPS was imported into a numerical package, i.e., ANSYS, and the microscopic governing equations for energy and momentum were solved. To save time, and due to symmetry, only a thin representative slice with a width of 1.37 mm, a height of 50 mm, and the full length in the flow direction of 50.8 mm was used as the solution domain. This segment includes 21 EPS cylinders, and is shown after meshing in Figure 5.
The CFD solver within ANSYS was used to solved the governing equations for the conservation of mass, momentum, and energy in two dimensions. The velocity components were u and v in the x- and y-directions, respectively. The flow was assumed laminar and incompressible with constant properties. The governing equations [27,39] are presented below in the form of the dependent variables u, v, P, and T:
Continuity:
Momentum:
where and are thermal conductivity and specific heat of the fluid, respectively.
The following boundary conditions were imposed:
A mesh independence study was conducted in order to establish both the accuracy and independence of the results from the mesh employed. It was also conducted to save time and computational cost. Three types of meshing were used: coarse, medium, and fine. The number of nodes and the simulation time for three meshes are listed in Table 1. There was a minor change in the results (0.17%) between the medium and fine meshes, and the medium mesh was used in all investigations. The number of computation cells was 1,072,143. A laptop with a processor with four cores and eight logical processors at 1.6 GHz and 8 GB of RAM was used. A typical run took 7 h and 15 min.
4. Numerical Predictions of the EPS Model
For an inlet air temperature of 300 K and a velocity of 2.5 m/s, Figure 6 shows the air temperature as a function of y (distance from the heated base) at three different axial locations measured form the inlet X = 6.53 mm, 19.05 mm, and 31.75 mm. The same information is given for velocity 2.71 m/s in Figure 7. For these two velocities, the Reynolds numbers based on the permeability of the foam are 37.4 and 40.6, respectively, which indicates that the flow regime is laminar [35,66].
It is clear that the temperature behavior at the qualitative level makes sense and is expected. The temperature decreases as the distance from the heated base increases. It is at its maximum at the heated base, as indicated by the red color in Figure 6 and Figure 7. At a sufficiently far location from the heated base, the air temperature is cooler, and it is equal to the inlet air temperature shown in blue. In addition, the temperature increases in the flow direction due to continuous heating of the cooling air as it travels through the heat sink. As the velocity increases from 2.5 to 2.71 m/s, the cooling of the EPS is more efficient because of higher convection rates at the higher velocity. Also, the colored region (outside the blue region) is shorter, and heat transfer is confined to a smaller region closer to the heated base. While these trends are encouraging, a direct quantitative comparison to experimental heat transfer data in metal foam is needed in order to establish the validity of the modeling approach, which will be shown below.
One key parameter for investigating engineering designs employing forced convection heat transfer in metal foam is the associated pressure drop. Figure 7 is a plot of the pressure drop predicted by the EPS per unit length (in the flow direction) as a function of average flow velocity. It is clear that the EPS model produces pressure drop data that strongly follow the Forchheimer equation for porous media, including metal foam [8]:
In other words, the functional relationship between the pressure drop and the average velocity is quadratic, which is the same behavior found in metal foam. This is encouraging and suggests the possibility that the pressure drop in the EPS model can, albeit with some adjustment, be made to match the pressure drop in metal foam. The adjustment incudes changing the staggering arrangement, while keeping the porosity and surface area density of the EPS model equal to their counterparts in the foam. Nonetheless, experimental pressure drop data is needed in order to directly compare pressure drop and further validate the model.
5. Experimental Validation
Dukhan and Chen [67] measured steady-state local temperatures in a metal foam block subjected to a constant heat flux with air flowing through it to remove the heat. The current EPS modeling is used to model one of the foam blocks of [67], and then the predictions of the model are compared to the experimental temperatures obtained by [67]. The dimensions of the cross section of the foam block of [67] were 10.16 cm (4 in) by 10.16 cm (4 in), and its length in the flow direction was 5.08 cm (2 in). The block was brazed to a 12.7 mm (0.5 in) thick solid aluminum base. The temperature measurements in the foam were performed at the axial locations (flow direction) X = 2.54, 3.81, and 4.44 cm, and at y-locations 1.27, 2.54, 3.81, 6.35, and 8.89 cm (perpendicular to the flow direction), as shown in Figure 8. The problem was assumed two-dimensional by [67], and all temperature measurements were performed in the z = 5.08 cm plane, where z is the coordinate perpendicular to the page (not shown in Figure 8).
Since the porosity (78.2%) and the pore density (20 ppi) of this foam are known, an EPS model for this foam can be constructed. The porosity is used to calculate the surface area density according to Equation (9), which is specific to ERG aluminum foam with 20 ppi only. Using the modeling relations Equations (5)–(8), the EPS model representing this particular foam was obtained, for which the geometrical properties are shown in Table 2. The EPS model was constructed in ANSYS, and CFD analysis was performed on it according to Equations (10)–(16). The same average air velocity and inlet temperature was imposed on the EPS as those used by [67] in their experiment. The boundary conditions were also the same for the EPS and the actual foam of [67].
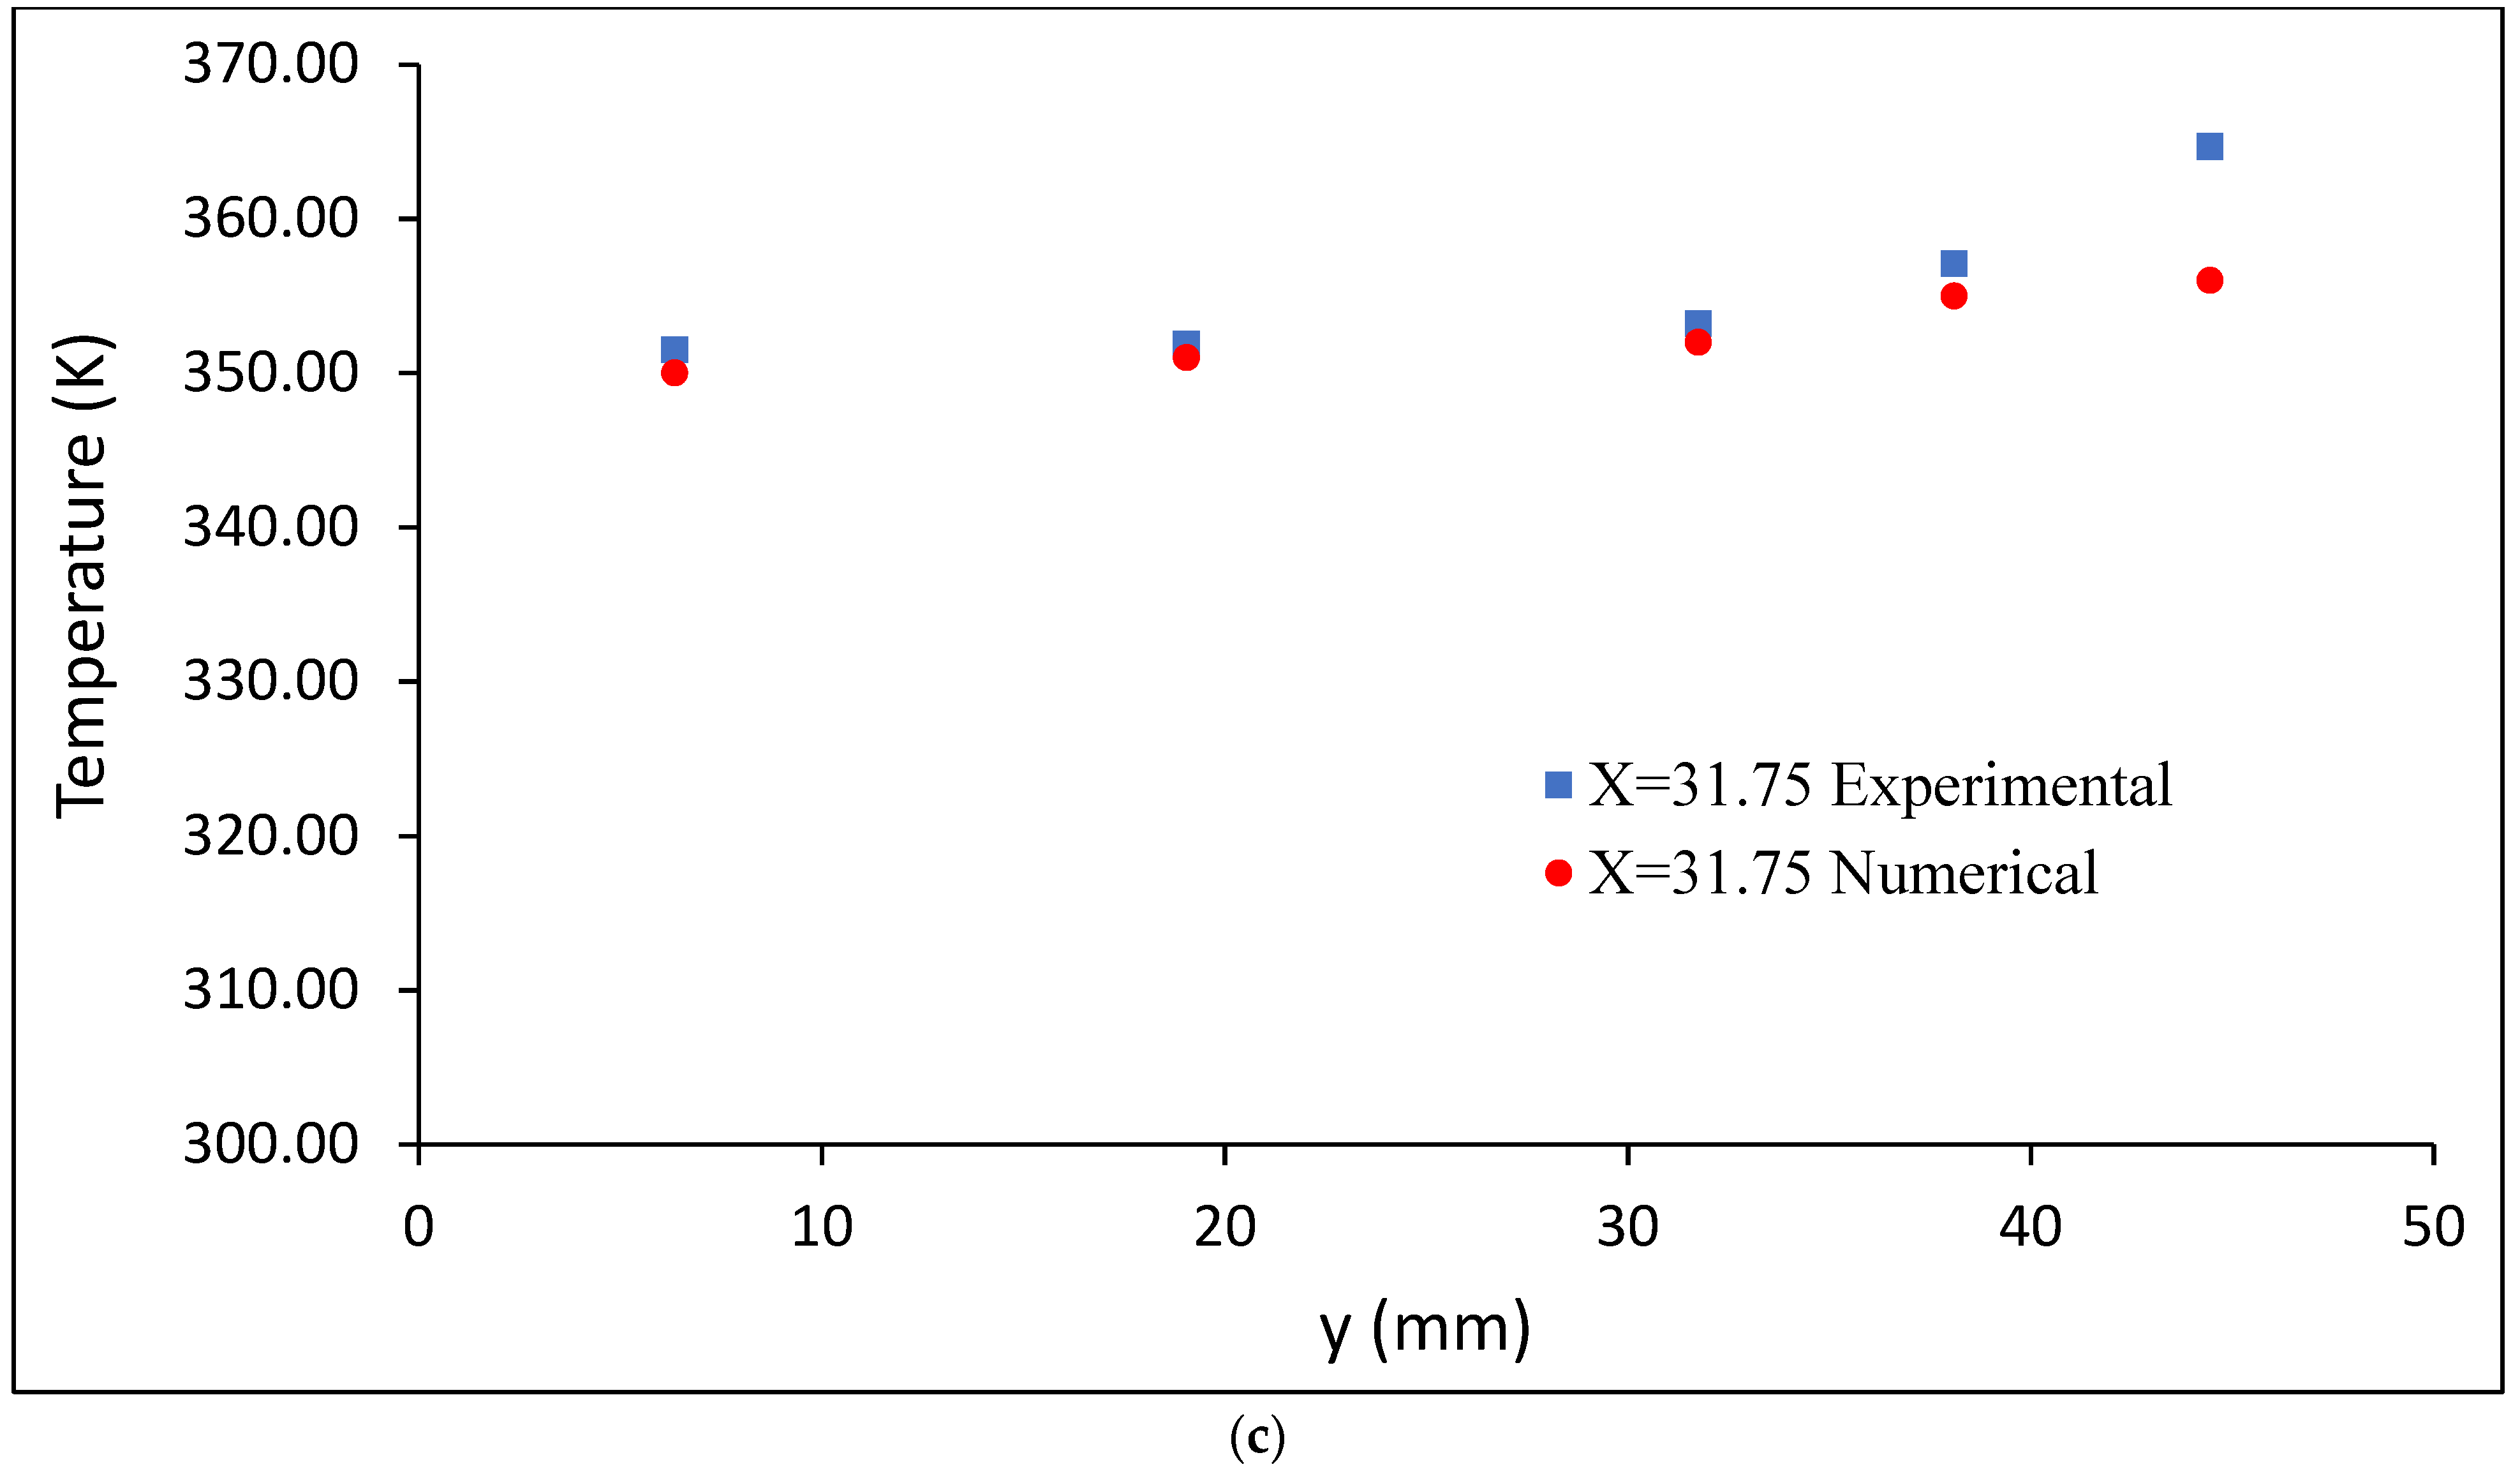
The EPS models’ predicted temperatures are compared to their experimental counterparts of [67] in the following figures. Figure 9 represents an average air speed of 2.5 m/s. In this figure, parts (a), (b), and (c) are for axial locations 6.35 cm, 19.05 cm, and 31.75 cm, respectively. At these three axial locations, the experimental and EPS-predicted temperatures are plotted as a function of y (the distance from the heated base). The two temperatures agree very well, and they exhibit the same trend: the temperature increases as the distance from the heated base decreases (note the coordinate system in Figure 8). This is true for all axial locations; however, there are two observations. The first is that the agreement is best at intermediate y locations, and is poorer at the heated base (y = 44.45 cm) and far away from the heated base (y = 6.35 cm). This may be caused by differences in the flow fields of the EPS model and the actual foam close to the solid heated boundary, which may alter convection heat transfer in that region. The other observation is that the agreement gets poorer as the distance from the inlet increases, meaning that the agreement is best close to the inlet (at x = 6.35 cm, Figure 9a), and is worse far away from the inlet (at x = 31.75, Figure 9c). The reason for this may be the existence of an exit region in metal foam. This exit region may be different in the case of the EPS model as compared to the foam due to geometric differences. Nonetheless, it can be stated that the agreement is generally very good, since the average error between the predicted and experimental temperature is rather small, as shown in Table 3. The maximum error is 9.46%.
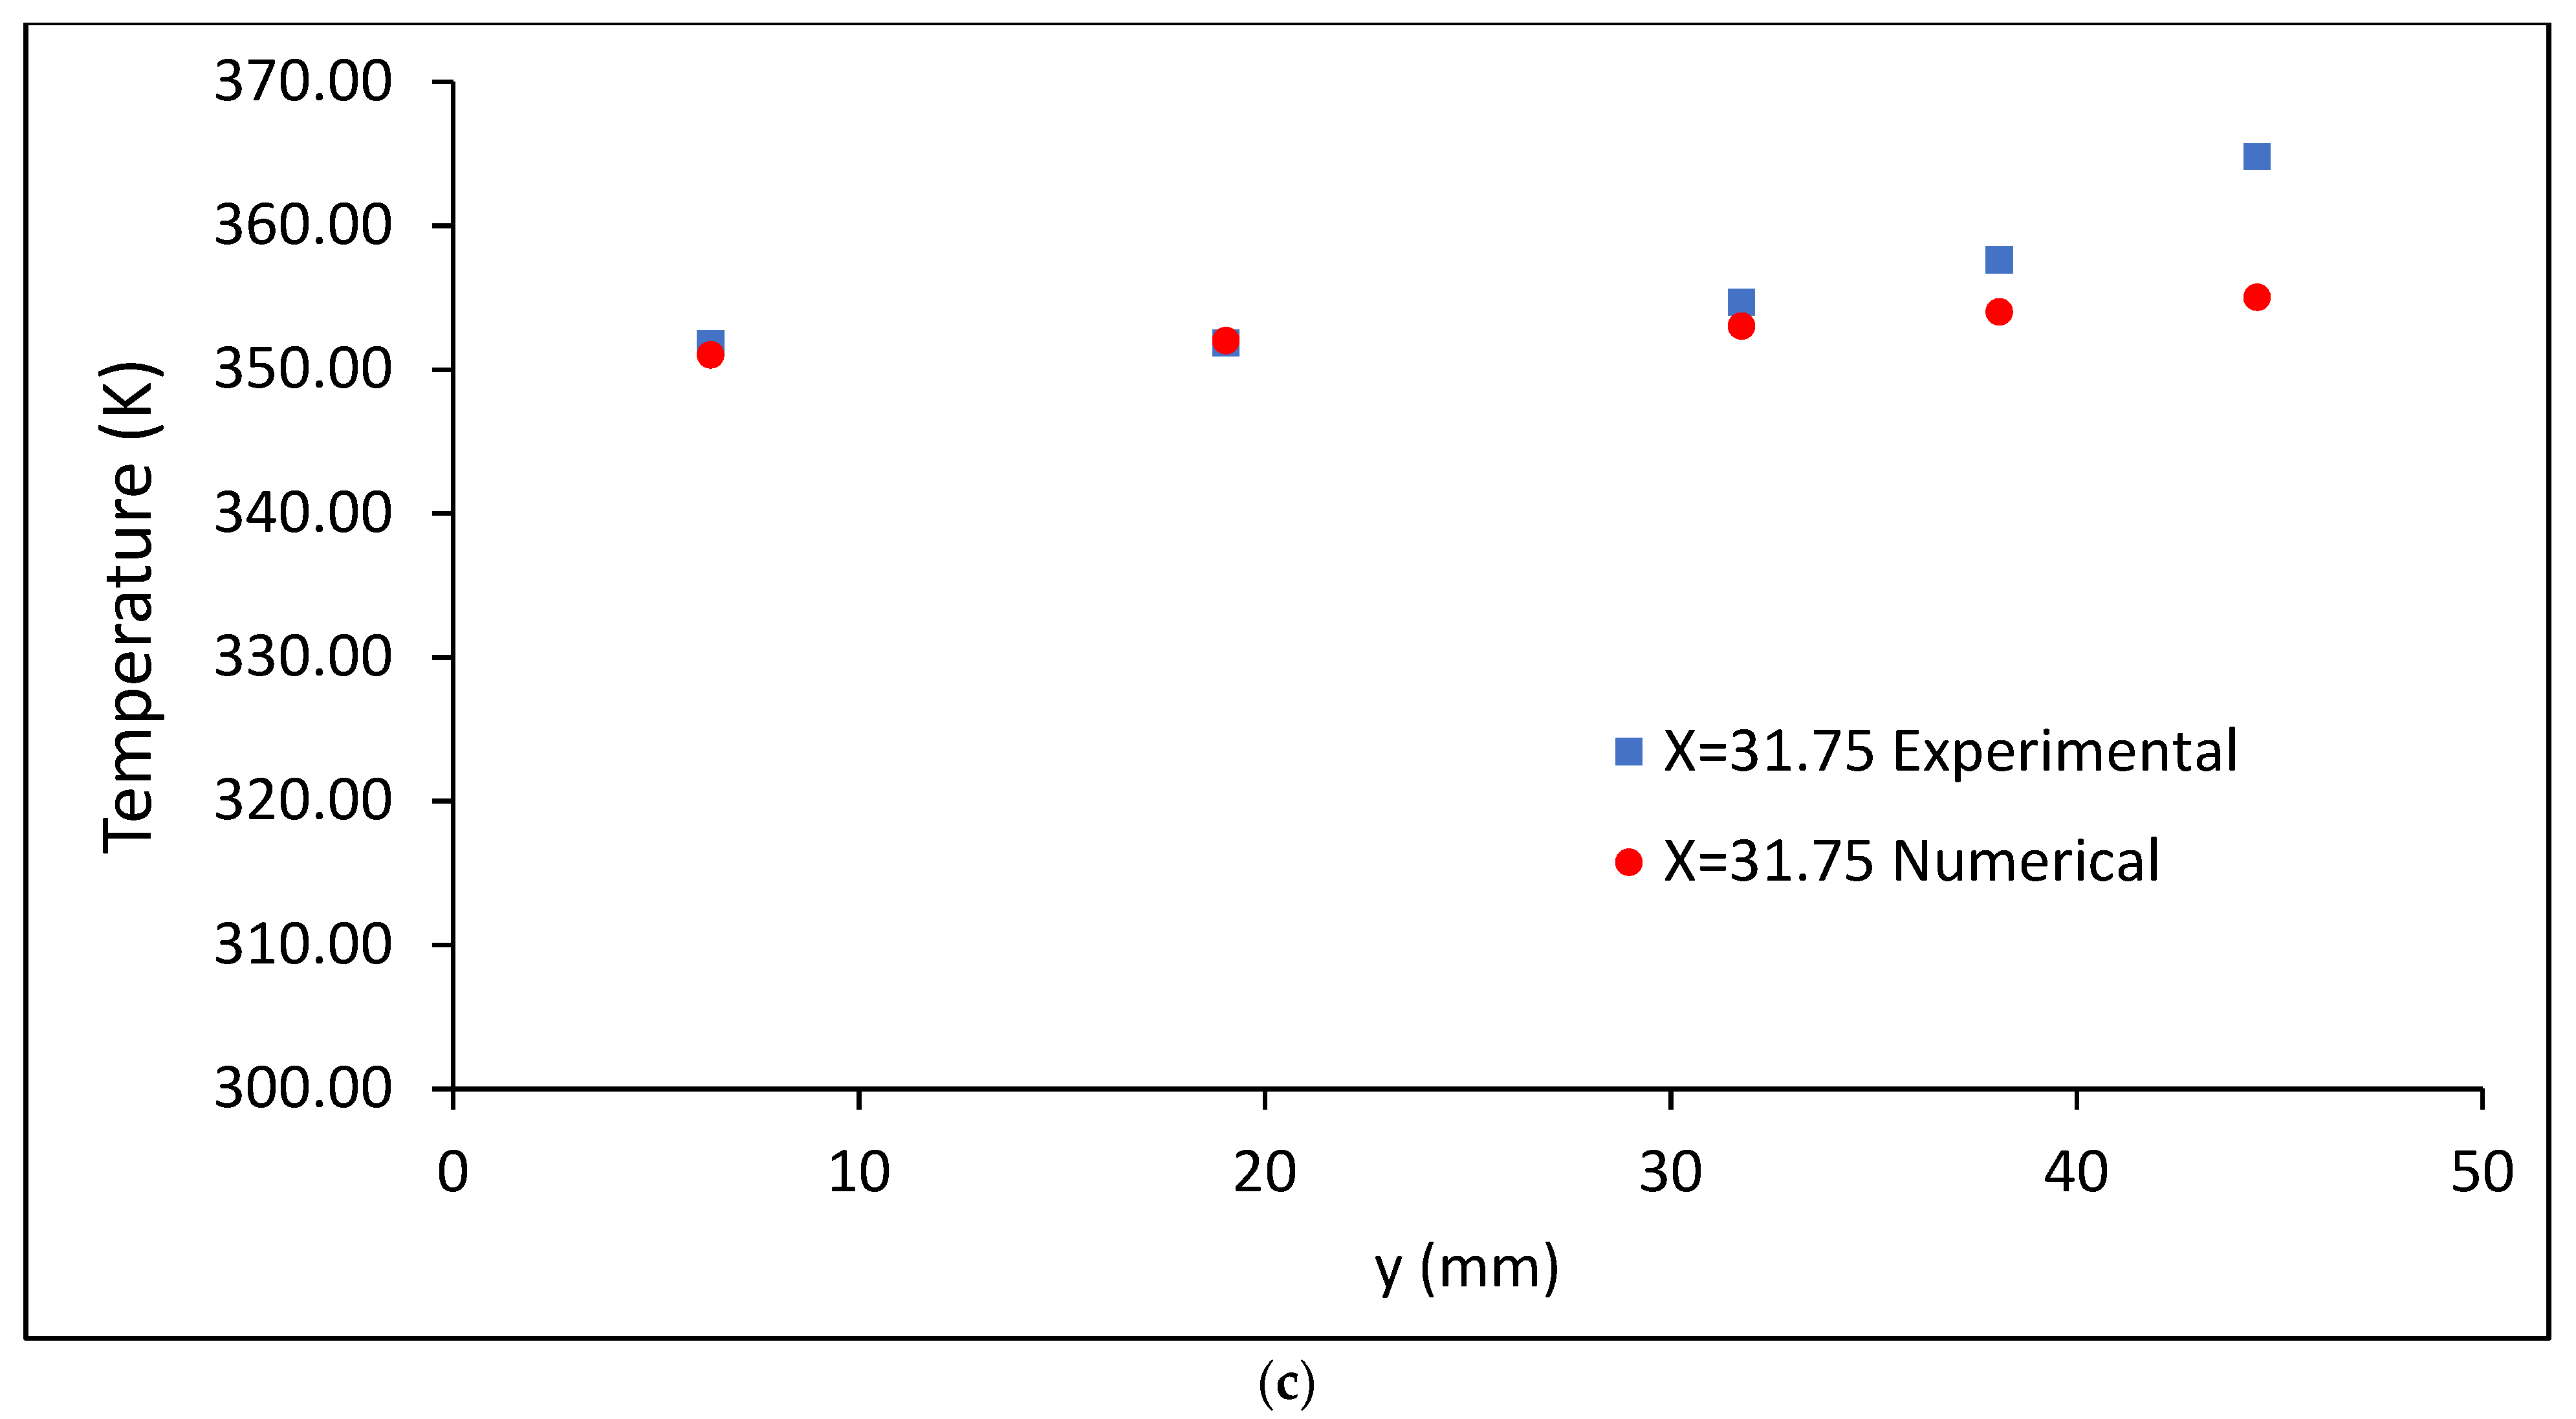
Figure 10 has a comparison between the EPS model and the actual foam of [67] at an average air speed of 2.71 m/s. Similar observations that were made for the lower velocity of 2.50 m/s can be made for this higher flow velocity. For the two velocities and at all locations, the EPS model is seen to always predict lower temperatures compared to the experimental temperatures of [67]. At this higher velocity, the difference between the models’ predictions and the experimental temperatures is higher, as indicated in Table 4. This is due to the fact that geometric differences between the model and the foam are expected to play a stronger role at a higher velocity. The geometry has a stronger influence on the flow field at higher velocities, and thus on convection heat transfer. Another issue is that the parallel strands of the EPS are not cross-connected, while the ligaments of the foam connect randomly in three dimensions. This contributes to a more efficient heat transfer in the case of the foam.
The solution domain employed in this study was 1.37 mm × 50 mm × 50.8 mm, which represented 1574 foam cells. For this large domain, only 1,072,143 computational elements were needed, and the obtained numerical results were in very good agreement with their experimental counterparts. This represents considerable savings in the computational time and power needed. For example, 188,885 computational cells were needed to investigate one body-centered-cube model of a single foam cell [57], while for 20 body-centered-cube cells representing metal foam, a total 918,016 computational elements we needed in the numerical solution of [36]. As for solving the governing equations over a domain made of 20 Kelvin cells representing metal foam, three million numerical cells were needed [56], and for the Laguerre-Voronoi structure representing 10 foam cells, eight million computational cells were needed [49]. In the case of solving a domain of 2 mm × 2 mm × 10 mm of foam captured by μCT, eight million computational cells were required [51]. These comparisons show the efficiency of the current EPS modeling.
6. Conclusions
A new modelling technique for highly-porous metal foam and similar porous media has been presented. The modelling is valid strictly for macroscopically two-dimensional heat transfer due to the fluid flow in highly-porous media; for example, metal-foam heat sinks and metal foam packed between two parallel plates, with one or both plates heated. The modeling is designed to produce a simpler geometry than the foam’s complex structure, and thus save time and computational costs. The new paradigm stresses that, instead of focusing on geometrical shape similarity, the modeling should strive to match key morphological and transport properties of the foam, so that pressure drop and heat transfer in the model are as close as possible to those of the foam. The modeling technique was illustrated by an example, and partially validated by comparison to experimental local temperatures in actual foam from the literature. Good agreement was obtained for all temperatures. The case considered in the comparison was for cylindrical strands in an equilateral-triangle staggered arrangement, and one metal foam with one pore density was considered. Further verification and experimental data are needed to establish the robustness of the modelling and to identify its limitations. The pressure drop in the equivalent parallel strands model obeyed the Forchheimer equation, suggesting that the strands followed the Forchheimer equation for porous media just like open-cell metal foam. However, pressure-drop predictions of the model need to be directly compared to actual pressure-drop data from experiments on actual foam. Such a comparison may lead to ways of improving the model and/or calibrating it.
Funding
This research received no external funding.
Institutional Review Board Statement
Not applicable.
Informed Consent Statement
Not applicable.
Data Availability Statement
Not applicable.
Conflicts of Interest
Authors declare no conflict of interest.
Nomenclature
| contact area | |
| c | specific heat of fluid |
| C | form drag coefficient (m−1) |
| D | diameter (mm) |
| EPS | equivalent parallel strands |
| H | height of model or foam (cm) |
| k | thermal conductivity (W/m K) |
| K | permeability (m2) |
| L | length of model or foam in flow direction (cm) |
| n | the number of cylinders in EPS |
| ppi | pore per inch |
| heat flux (W/m2) | |
| diagonal pitch (mm) | |
| longitudinal pitch (mm) | |
| transverse pitch (mm) | |
| T | temperature (K) |
| velocity in x-direction | |
| V | Darcian velocity (m/s) |
| velocity in y-direction | |
| W | width of model or foam (cm) |
| x | axial coordinate along the flow direction |
| y | coordinate perpendicular to flow direction |
| pressure drop (Pa) | |
| density of fluid (kg/m3) | |
| porosity | |
| surface area density (m2/m3) | |
| viscosity (kg/m s) | |
| foam | |
| model |
References
- Ranut, P.; Nobile, E.; Mancini, L. High resolution X-ray microtomography-based CFD simulation for the characterization of flow permeability and effective thermal conductivity of aluminum metal foams. Exp. Therm. Fluid Sci. 2015, 67, 30–36. [Google Scholar] [CrossRef]
- Magnico, P. Analysis of permeability and effective viscosity by CFD on isotropic and anisotropic metallic foams. Chem. Eng. Sci. 2009, 64, 3564–3575. [Google Scholar] [CrossRef]
- Ashby, F. Metal Foam, A Design Guide; Butterworth-Heinemann: Oxford, UK, 2000. [Google Scholar]
- Leong, K.C.; Jin, L.W. Characteristics of oscillating flow through a channel filled with open-cell metal foam. Int. J. Heat Fluid Flow 2006, 27, 144–153. [Google Scholar] [CrossRef]
- Inayat, A.; Schwerdtfeger, J.; Freund, H.; Körner, C.; Singer, R.F.; Schwieger, W. Periodic open-cell foams: Pressure drop measurements and modeling of an ideal tetrakaidecahedra packing. Chem. Eng. Sci. 2011, 66, 2758–2763. [Google Scholar] [CrossRef]
- Antohe, B.; Lage, J.L.; Price, D.C.; Weber, R.M. Experimental determination of the permeability and inertial coefficients of mechanically compressed aluminum metal layers. J. Fluids Eng. 1997, 11, 404–412. [Google Scholar] [CrossRef]
- Bonnet, J.-P.; Topin, F.; Tadrist, L. Flow laws in metal foams: Compressibility and pore size effect. Transp. Porous Media 2008, 73, 233–254. [Google Scholar] [CrossRef]
- Mancin, S.; Zilio, C.; Cavallini, A.; Rossetto, L. Pressure drop during air flow in aluminum foam. Int. J. Heat Mass Transf. 2010, 53, 3121–3130. [Google Scholar] [CrossRef]
- Depois, J.-F.; Mortensen, A. Permeability of open-pore microcellular materials. Acta Mater. 2005, 53, 1381–1388. [Google Scholar] [CrossRef] [Green Version]
- Boomsma, K.; Poulikakos, D.; Zwick, F. Metal foams as compact high performance heat exchangers. Mech. Mater. 2003, 35, 1161–1176. [Google Scholar] [CrossRef]
- Tadrist, L.; Miscevic, M.; Rahli, O.; Topin, F. About the use of fibrous materials in compact heat exchangers. Exp. Therm. Fluid Sci. 2004, 28, 193–196. [Google Scholar] [CrossRef]
- Chumpia, A.; Hooman, K. Performance evaluation of single tubular aluminum foam heat exchanges. Appl. Therm. Eng. 2014, 66, 266–273. [Google Scholar] [CrossRef]
- Tamayol, A.; Hooman, K. Thermal assessment of forced convection through metal foam heat exchangers. J. Heat Transf. 2011, 133, 111801-1–111801-7. [Google Scholar] [CrossRef]
- Mahjoob, S.; Vafai, K. A Synthesis of fluid and thermal transport models for metal foam heat exchangers. Int. J. Heat Mass Transf. 2008, 51, 3701–3711. [Google Scholar] [CrossRef]
- Odabaee, M.; Mancin, S.; Hooman, K. Metal foam heat exchangers for thermal management of fuel cell systems- an experimental study. Exp. Therm. Fluid Sci. 2013, 51, 214–219. [Google Scholar] [CrossRef]
- Hossain, M.S.; Shabani, B. Metal foams application to enhance cooling for open cathode polymer electrolyte membrane fuel cells. J. Power Sources 2015, 295, 275–291. [Google Scholar] [CrossRef]
- Sullines, D.; Daryabeige, K. Effective thermal conductivity of high porosity open cell nickel foam. In Proceedings of the 35th AIAA Thermophysics Conference, Anaheim, CA, USA, 11–14 June 2001; Volume 12, p. 2819. [Google Scholar]
- Khatee, S.A.; Amiuddin, S.; Farid, M.; Selman, J.R.; Al-Hallaj, S. Thermal management of Li-ion battery with phase change material for electric scooters: Experimental validation. J. Power Sources 2005, 142, 345–353. [Google Scholar] [CrossRef]
- Alawadhi, E.M.; Amon, C.H. PCM thermal control unit for portable electronic devices: Experimental and numerical studies. IEEE Trans. Compon. Packag. Technol. 2003, 26, 116–125. [Google Scholar] [CrossRef]
- Vesligaj, M.J.; Amon, C.H. Transient thermal management of temperature fluctuations during time varying workloads on portable electronic. IEEE Trans. Compon. Packag. Technol. 1999, 22, 541–550. [Google Scholar] [CrossRef]
- Bhattacharya, A.; Mahajan, R.L. Finned metal foam heat sinks for electronics cooling in forced convection. J. Electron. Packag. 2002, 124, 155–163. [Google Scholar] [CrossRef]
- Zhang, Y.C.L.W.; Xie, H.; Mahajan, R.L. Cooling of a FCHIP pakage with 100 W, 1 cm2 chip. In Proceedings of the 1993 ASME International Electronic Packaging Conference, San Diego, CA, USA, 12–15 September 1993; Volume 1, pp. 419–423. [Google Scholar]
- Laurencelle, F.; Goyette, J. Simulation of heat transfer in a metal hydride reactor with aluminum foam. Int. J. Hydrogen Energy 2007, 32, 2957–2964. [Google Scholar] [CrossRef]
- Horneber, T.; Rauh, C.; Delgado, A. Fluid dynamic characterization of porous solid in catalytic fixed-bed reactors. Microporous Mesoporous Mater. 2012, 154, 170–174. [Google Scholar] [CrossRef]
- Azzi, W.; Roberts, W.L.; Rabiei, A. A study on pressure drop and heat transfer in open cell metal foam for jet engine applications. Mater. Des. 2007, 28, 569–574. [Google Scholar] [CrossRef]
- Ejlali, A.; Ejlali, A.; Hooman, K.; Gurgenci, H. Application of high porosity metal foams as air-cooled heat exchangers to high heat load removal systems. Int. Commun. Heat Mass Transf. 2009, 36, 674–679. [Google Scholar] [CrossRef] [Green Version]
- Kopanidis, A.; Theodorakakos, E.; Gavaises, D. Bouris, 3D numerical simulation of flow and conjugate heat transfer through a pore scale model of high porosity open cell metal foam. Int. J. Heat Mass Transf. 2010, 53, 2539–2550. [Google Scholar] [CrossRef]
- Brun, E. De l‘imagérie 3D Des Structures a L‘étude Des Mécanismes De Transport En Milieux Cellulaires. Ph.D. Thesis, Aix Marseille Université, Marseille, France, 2009. [Google Scholar]
- Taheri, M. Analytical and Numerical Modeling of Fluid Flow and Heat Transfer Through Open-Cell Metal Foam Heat Exchangers. Ph.D. Thesis, University of Toronto, Toronto, ON, Canada, 2015. [Google Scholar]
- Feng, S.; Shi, M.; Li, Y.; Lu, T.J. Pore-scale and volume-averaged numerical simulations of melting phase change heat transfer in finned metal foam. Int. J. Heat Mass Transf. 2015, 90, 838–847. [Google Scholar] [CrossRef]
- De Schampheleire, S.; De Jaeger, P.; De Kerpel, K.; Ameel, B.; Huisseune, H.; De Paepe, M. How to study thermal applications of open-cell metal foam: Experiments and computational fluid dynamics. Materials 2016, 9, 94. [Google Scholar] [CrossRef] [Green Version]
- Vafai, K.; Tien, C.L. Boundary and inertia effects of flow and heat transfer in porous media. Int. J. Heat Mass Transf. 1981, 34, 195–203. [Google Scholar] [CrossRef]
- Nield, D.; Bejan, A. Convection in Porous Media, 2nd ed.; Springer: New York, NY, USA, 1999; p. 73. [Google Scholar]
- Bağcı, Ö.; Dukhan, N.; Özdemir, M. Flow regimes in packed beds of spheres from pre-Darcy to turbulent. Transp. Porous Media 2014, 104, 501–520. [Google Scholar] [CrossRef]
- Dukhan, N.; Bağcı, Ö.; Özdemir, M. Metal foam hydrodynamics: Flow regimes from pre-Darcy to turbulent. Int. J. Heat Mass Transf. 2014, 77, 114–123. [Google Scholar] [CrossRef]
- Dukhan, N.; Suleiman, A.S. Simulation of entry-region flow in open-cell metal foam and experimental validation. Transp. Porous Media 2014, 101, 229–246. [Google Scholar] [CrossRef]
- Sachan, S.; Kumar, S.; Krishnan, S.; Ramamoorthy, S. Impact of entry–exit loss on the measurement of flow resistivity of porous materials. AIP Adv. 2020, 10, 105031. [Google Scholar] [CrossRef]
- Otaru, A.J.; Morvan, H.P.; Kennedy, A.R. Measurement and simulation of pressure drop across replicated porous aluminium in the Darcy-Forchheimer regime. Acta Mater. 2018, 149, 265–273. [Google Scholar] [CrossRef]
- Tabor, G.; Yeo, O.; Young, P. CFD simulation of flow through an open cell foam. Int. J. Mod. Phys. C 2008, 19, 703–715. [Google Scholar] [CrossRef]
- Ranut, P.; Nobile, E.; Mancini, L. High resolution microtomography-based CFD simulation of flow and heat transfer in aluminum metal foams. Appl. Therm. Eng. 2014, 69, 230–240. [Google Scholar] [CrossRef]
- Bianchi, E.; Heidig, T.; Visconti, C.G.; Groppi, G.; Freund, H.; Tronconi, E. An appraisal of the heat transfer properties of metallic open-cell foams for strongly exo-/endo thermic catalytic processes in tubular reactors. Chem. Eng. J. 2012, 198, 512–528. [Google Scholar] [CrossRef]
- Liu, H.; Yu, Q.N.; Qu, Z.G.; Yang, R.Z. Simulation and analytical validation of forced convection in open-cell metal foams. Int. J. Therm. Sci. 2017, 111, 234–245. [Google Scholar] [CrossRef]
- Xu, W.; Zhang, H.; Yang, Z.; Zhang, J. Numerical investigation on the flow characterizations and permeability of three-dimensional reticulated foam materials. Chem. Eng. J. 2008, 140, 562–569. [Google Scholar] [CrossRef]
- Zhaodong, C.; Kuncan, Z.; Xiao, W.; Fuling, H.; Chong, G.; Juanjuan, B. Derivation and validation of a new porous media resistance formula based on a tube-sphere model. Ind. Eng. Chem. Res. 2020, 59, 18170–18179. [Google Scholar] [CrossRef]
- Yang, H.; Li, Y.; Yang, Y.; Chen, D.; Zhu, Y. Effective thermal conductivity of high porosity open-cell metal foams. Int. J. Heat Mass Transf. 2020, 147, 118974. [Google Scholar] [CrossRef]
- Nie, Y.; Lin, Q.; Tong, Q. Modeling structures of open cell foams. Comput. Mater. Sci. 2017, 131, 160–169. [Google Scholar] [CrossRef] [Green Version]
- Hu, C.; Sun, M.; Xie, Z.; Yang, L.; Song, Y.; Tang, D.; Zhao, J. Numerical simulation on the forced convection heat transfer of porous medium for turbine engine heat exchanger applications. Appl. Therm. Eng. 2020, 80, 115845. [Google Scholar] [CrossRef]
- Jobic, Y.; Kumar, P.; Topin, F. Transport properties of solid foams having circular strut cross section using pore scale numerical simulations. Heat Mass Transf. 2018, 54, 2351–2370. [Google Scholar] [CrossRef]
- Nie, Z.; Lin, Y.; Tong, Q. Numerical investigation of pressure drop and heat transfer through open cell foams with 3D Laguerre-Voronoi model. Int. J. Heat Mass Transf. 2017, 113, 819–839. [Google Scholar] [CrossRef]
- Kumar, P.; Topin, F.; Tadrist, L. Geometrical characterization of Kelvin-like metal foams for different strut shapes and porosity. J. Porous Media 2015, 18, 637–652. [Google Scholar] [CrossRef]
- Jafarizade, A.; Panjepour, M.; Meratain, M.; Emami, M.D. Numerical simulation of gas/solid heat transfer in metallic foams: A general correlation for different porosities and pore sizes. Trans. Porous Media 2018. [Google Scholar] [CrossRef]
- Calmidi, V.V.; Mahajan, R.L. The effective thermal conductivity of high porosity fibrous metal foam. J. Heat Transf. 1999, 121, 466–471. [Google Scholar] [CrossRef]
- Hu, H.; Lai, Z.; Weng, X.; Ding, G.; Zhuang, D. Numerical model for the dehumidifying process of wet air flow in open-cell metal foam. Appl. Therm. Eng. 2017, 133, 309–321. [Google Scholar] [CrossRef]
- Inayat, A.; Freund, H.; Zeiser, T.; Schwieger, W. Determining the specific surface area of ceramic foams: The Tetradecahedra model revisited. Chem. Eng. Sci. 2011, 266, 1179–1188. [Google Scholar] [CrossRef]
- Miwa, S.; Kane, C.; Revankar, S. Microscopic fluid dynamics simulation of the metal foam using idealized cell structure. Transp. Porous Media 2016, 115, 35–51. [Google Scholar] [CrossRef]
- Iasiello, M.; Cunsolo, S.; Biano, N.; Chiu, W.K.S.; Naso, V. Developing thermal flow in open-cell foam. Int. J. Therm. Sci. 2017, 111, 129–137. [Google Scholar] [CrossRef]
- Krishnan, S.; Murthy, J.Y.; Garimella, S.V. Direct simulation of transport in open-cell metal foam. J. Heat Transf. 2006, 128, 793–799. [Google Scholar] [CrossRef]
- Boomsma, K.; Poulikakos, D.; Ventikos, Y. Simulation of flow through open cell metal foams using an idealized periodic cell structure. Int. J. Heat Fluid Flow 2003, 24, 825–834. [Google Scholar] [CrossRef]
- Iasiello, M.; Cunsolo, S.; Oliviero, M.; Harris, W.M.; Bianco, N.; Chiu, W.K.S.; Naso, V. Numerical analysis of heat transfer and pressure drop in metal foams for different morphological models. J. Heat Transf. 2014, 136, 11260. [Google Scholar] [CrossRef]
- Bhattacharya, A.; Calmidi, V.V.; Mahajan, R.L. Thermophysical properties of high porosity metal foams. Int. J. Heat Mass Transf. 2002, 45, 1017–1031. [Google Scholar] [CrossRef]
- Aghaei, P.; Visconti, C.G.; Groppo, G.; Tronconi, E. Development of a heat transport model for open-cell metal foams with high cell densities. Chem. Eng. J. 2017, 321, 432–446. [Google Scholar] [CrossRef]
- De Jaeger, P.; T’Joen, C.; Huisseune, H.; Ameel, B.; De Paepe, M. An experimentally validated and parameterized periodic unit-cell reconstruction of open-cell foams. J. Appl. Phys. 2011, 109. [Google Scholar] [CrossRef] [Green Version]
- Perrot, C.; Pannenton, R.; Olny, X. Periodic unit cell reconstruction of porous media: Application to open-cell aluminum foam. J. Appl. Phys. 2007, 101. [Google Scholar] [CrossRef] [Green Version]
- Boomsma, K.; Poulikakos, D. The effect of compression and pore size variations on the liquids flow characteristics in metal foam. J. Fluids Eng. 2002, 124, 263–272. [Google Scholar] [CrossRef]
- ERG Materials and Aerospace. Available online: http://ergaerospace.com/ (accessed on 24 March 2021).
- Kececioglu, I.; Jiang, Y. Flow through porous media of packed spheres saturated with water. J. Fluids Eng. 1994, 116, 164–170. [Google Scholar] [CrossRef]
- Dukhan, N.; Chen, K.C. Heat transfer measurements in metal foam subjected to constant heat flux. Exp. Therm. Fluid Sci. 2007, 32, 624–631. [Google Scholar] [CrossRef]
Figure 1.
Photograph of a block of open-cell aluminum foam with 20 pores per inch. (Photo taken by author).
Figure 1.
Photograph of a block of open-cell aluminum foam with 20 pores per inch. (Photo taken by author).

Figure 2.
Top view of the proposed EPS model showing its length L and width W. The longitudinal, transverse, and diagonal pitches for the equilateral-triangle arrangement is also shown. The unit for all of these parameters is mm.
Figure 2.
Top view of the proposed EPS model showing its length L and width W. The longitudinal, transverse, and diagonal pitches for the equilateral-triangle arrangement is also shown. The unit for all of these parameters is mm.

Figure 3.
The equilateral-triangle arrangement. The longitudinal, transverse, and diagonal pitches, as well as the diameter, are measured in mm.
Figure 3.
The equilateral-triangle arrangement. The longitudinal, transverse, and diagonal pitches, as well as the diameter, are measured in mm.

Figure 4.
An equivalent-parallel-strands model for a metal foam block heated from the bottom. The x- and y-coordinates are measured in mm.
Figure 4.
An equivalent-parallel-strands model for a metal foam block heated from the bottom. The x- and y-coordinates are measured in mm.

Figure 5.
A representative section of the EPS model as a solution domain with meshing. The x- and y-coordinates are measured in mm, while the velocity V is measured in m/s, the inlet temperature Tin in K, and the heat flux q″ in W/m2.
Figure 5.
A representative section of the EPS model as a solution domain with meshing. The x- and y-coordinates are measured in mm, while the velocity V is measured in m/s, the inlet temperature Tin in K, and the heat flux q″ in W/m2.

Figure 6.
Temperature distribution for: (a) = 2.50 m/s and (b) = 2.71 m/s. Temperatures are given in K.
Figure 6.
Temperature distribution for: (a) = 2.50 m/s and (b) = 2.71 m/s. Temperatures are given in K.

Figure 7.
Pressure drop per unit length in flow direction as predicted by the EPS model with an equilateral-triangle arrangement.
Figure 7.
Pressure drop per unit length in flow direction as predicted by the EPS model with an equilateral-triangle arrangement.

Figure 8.
Experimental arrangement showing locations of the local temperature measurement and the coordinate system of [67]. The x- and y-coordinates are measured in mm.
Figure 8.
Experimental arrangement showing locations of the local temperature measurement and the coordinate system of [67]. The x- and y-coordinates are measured in mm.

Figure 9.
Comparison between EPS models’ prediction and the experimental data of [67] at an average air speed of 2.50 m/s and at the axial location form the inlet: (a) 6.35 cm, (b) 19.05 cm, (c) 31.75 cm.
Figure 9.
Comparison between EPS models’ prediction and the experimental data of [67] at an average air speed of 2.50 m/s and at the axial location form the inlet: (a) 6.35 cm, (b) 19.05 cm, (c) 31.75 cm.


Figure 10.
Comparison between EPS models’ prediction and the experimental data of [67] at an average air speed of 2.71 m/s, at the axial location form the inlet: (a) 6.35 cm, (b) 19.05 cm, (c) 31.75 cm.
Figure 10.
Comparison between EPS models’ prediction and the experimental data of [67] at an average air speed of 2.71 m/s, at the axial location form the inlet: (a) 6.35 cm, (b) 19.05 cm, (c) 31.75 cm.


Table 1.
Properties of one sample of open-cell aluminum foam used by [67].
Table 1.
Properties of one sample of open-cell aluminum foam used by [67].
| Pore Density, ppi | Porosit, Ɛ (%) | Surface Area Density, σ (m2/m3) |
|---|---|---|
| 20 | 78.2 | 1705 |
Table 2.
Equilateral-triangle equivalent parallel strands. Parameters for the foam sample of Table 1.
Table 2.
Equilateral-triangle equivalent parallel strands. Parameters for the foam sample of Table 1.
| D (mm) | |||
|---|---|---|---|
| 0.51 | 1.04 | 0.90 | 1.04 |
Table 3.
Percentage error between the EPS models’ predicted and experimental temperatures at an air speed of 2.50 m/s.
Table 3.
Percentage error between the EPS models’ predicted and experimental temperatures at an air speed of 2.50 m/s.
| Axial Location, x (cm) | Average Error (%) | Maximum Error (%) |
|---|---|---|
| 6.35 | 2.64 | 4.05 |
| 19.05 | 2.81 | 5.33 |
| 31.75 | 3.28 | 9.46 |
Table 4.
Percentage error between the EPS models’ predicted and experimental temperatures at an air speed of 2.71 m/s.
Table 4.
Percentage error between the EPS models’ predicted and experimental temperatures at an air speed of 2.71 m/s.
| Axial Location, x (cm) | Average Error (%) | Maximum Error (%) |
|---|---|---|
| 6.35 | 3.05 | 3.85 |
| 19.05 | 4.05 | 8.38 |
| 31.75 | 3.55 | 10.67 |
Publisher’s Note: MDPI stays neutral with regard to jurisdictional claims in published maps and institutional affiliations. |
© 2021 by the author. Licensee MDPI, Basel, Switzerland. This article is an open access article distributed under the terms and conditions of the Creative Commons Attribution (CC BY) license (https://creativecommons.org/licenses/by/4.0/).
Share and Cite
MDPI and ACS Style
Dukhan, N. Equivalent Parallel Strands Modeling of Highly-Porous Media for Two-Dimensional Heat Transfer: Application to Metal Foam. Energies 2021, 14, 6308. https://doi.org/10.3390/en14196308
AMA Style
Dukhan N. Equivalent Parallel Strands Modeling of Highly-Porous Media for Two-Dimensional Heat Transfer: Application to Metal Foam. Energies. 2021; 14(19):6308. https://doi.org/10.3390/en14196308
Chicago/Turabian StyleDukhan, Nihad. 2021. "Equivalent Parallel Strands Modeling of Highly-Porous Media for Two-Dimensional Heat Transfer: Application to Metal Foam" Energies 14, no. 19: 6308. https://doi.org/10.3390/en14196308
Note that from the first issue of 2016, this journal uses article numbers instead of page numbers. See further details here.