
Modelling of a Torrefaction Process Using Thermal Model Object


Institute of Process Engineering, Szent Istvan University, 2100 Godollo, Hungary
*
Author to whom correspondence should be addressed.
Energies 2021, 14(9), 2481; https://doi.org/10.3390/en14092481
Submission received: 20 March 2021
/
Revised: 20 April 2021
/
Accepted: 25 April 2021
/
Published: 27 April 2021
(This article belongs to the Collection Bioenergy and Biofuel)
Abstract
:So far, the torrefaction process has been merely discussed based on the physical and chemical characteristics of the final product, but the mechanism has not been yet pondered and investigated. Thus far, microwave torrefaction has been predominately used for thermal pre-treatment; therefore, a paradigm shift in the methodology has been introduced by using a Joule heating system. The article mainly focuses on the thermal engineering aspect of the torrefaction process. The densified black pine underwent thermal pre-treatment at a temperature of 523 K. The furnace used for torrefaction was initially improvised to carry out thermal degradation at quasi-static/dynamic conditions. A 3D PDE thermal model was developed to determine the numerical solution and temperature distribution across a black pine pellet. To compare the effect of the linear ramping profile, time-dependent as well as fixed Dirichlet conditions were applied to the proposed model. The mass distribution, duration of the torrefaction process, the effect of Nusselt and Reynold’s number of inert gas, and thermal history are some of the factors whose influence on the numerical solution was investigated. The simulation of thermal pre-treatment and its effect on the heat transfer characteristic was examined with help of a PDE thermal model, whereas the numerical solution of diffusion of the product of reactions was determined by solving the partial differential equations with the help of the discretisation method (PDEPE). The densification of black pine was performed in a ring die, whereas initial milling of biomass was carried out using a 1.5 mm sieve size. The system was found to have a homogeneous distribution in energy and temperature with time, whereas the amplitude of heat flux along the radial direction was reduced by 15% if the same pellet underwent torrefaction for a duration of 5 min in dynamic mode. Similarly, a 64.46% drop in amplitude of heat flux along the azimuth plane could be seen while performing torrefaction in a time-dependent thermal history. However, the relative amplitude of the heat flux at the centre of the pellet was estimated to be lowered by 98.41% along the vertical axis for heating a pellet in a quasi-static condition. The net change in the mass fraction of carbon dioxide across the boundary film was seen to be 40% higher than that of carbon monoxide. The rate of change of mass fraction of carbon monoxide across the boundary film was increased by 7–11% with the increase in torrefaction time. A 6.8% rise in the evaporation of water was noticed during the first half interval of torrefaction (from 5 min to 10 min). In the second half, from 10 min to 15 min, it was merely increased by 5.8%. A relative drop of 17.24% in water evaporation was estimated in the dynamic state of the system.
1. Introduction
In the coming years, the energy demand will surge dramatically, and it will become very important to focus on the productivity of biofuel. Another aim of energy production will be to reduce the bulk of the material and increase the quality of energy production so that the capital investment and labour costs can be minimised. Therefore, modified techniques are needed as alternatives to the prevailing technology. Effective metabolism of fuel hinges on two aspects: technology and chemical composition. Densification along with torrefaction can be one of the alternatives to be utilised in developing an enriched biofuel. Torrefaction is a thermal pre-treatment process that is performed at 200–300 °C to impart a remarkable change in the biomass characteristics (handling, milling and co-firing). Thus far, this methodology has been confined to pilot scales and many technical and economic hurdles have not yet been addressed, which hinders its introduction into commercial usage.
A target of the National Renewable Energy Action Plan of 2020 is to reduce the dependence on fossil fuels and encourage the utilisation of torrefied biomass in all types of thermal power plants, from power plants to domestic boilers, across Europe. The main reason for this paradigm shift is to reduce CO2, but in this pursuit, it also pushed manufacturers to import at least 400 million of m3 of wood in 2020 [1]. Therefore, there is immense pressure on companies to develop a torrefaction technology that could reduce the growing demand for biomass consumption by torrefied biomass. Therefore, in the same context, some thermal conditions have been examined to determine the temperature distribution while carrying out the torrefaction. The method that is predominately in use for smaller scales is microwave technology, which relies on varying power output and inconsistent operating frequency. This eventually leads to uneven torrefaction (cold spots within the material) with a poor texture of material due to intermolecular friction within the structure. There is also a high risk of contamination and leakage of radiation during the process, creating a severe health issue [2]. Some studies have been conducted on the modified form of the microwave system. Huang et al. (2016) reported that the energy yield of sewage sludge and Leucaena had been increased by 21% and 7%, respectively, but with the increasing power level, a reverse effect on the heating value of Leucaena, the feedstock, was observed. However, the authors failed to propose an explanation for this phenomenon [3]. The effect of thermal conditions on feedstock behaviour was omitted throughout their work. Similarly, in another work, microwave-induced torrefaction of Lemongrass from 200 to 300 °C increased the fixed carbon merely by 58.72% to 124%. A modified benchtop microwave oven was used for a torrefaction time of 30 to 40 min, while the power level was varied from 100 to 1000 W [4]. The obtained biochar was pelletised upon finishing torrefaction, using starch as a binding agent. After a thorough examination, it had been found that the overall process would merely increase the cost of production. It was found that the microwave-based torrefaction technique influenced the moisture and fixed carbon of the material, but the optimisation of thermal conditions had not been performed. A vague solution had been presented during their experimental work. The demerits and merits of applying a high power level on the temperature distribution were not considered in their work [5]. An approach of co-torrefaction of sewage sludge was also adopted in a similar fashion. It was noticed that a blend of sewage sludge with Leucaena wood did not provide the desired quality of biochar at a lower power level. The conversion efficiency of the process was estimated to be 50%, where the energy yield was merely 46%. The interaction of the blended material with thermal conditions varies due to the variation in the anisotropy of the material, and its influence on the heat transfer characteristics was supposed to adequately explain the poor performance of the heterogeneous material over 50% wt. blending of sewage sludge [6]. Yu et al. (2020) used the same technology to carry out the wet torrefaction of microalgal hydrolysate for bioethanol production. They used a relatively low temperature for a holding time of 5–10 min. The obtained yield of biofuel was merely 7.61%, but the effect of thermal conditions on the behaviour of the productivity of ethanol was omitted. However, the conversion probability was significantly high [7]. Another study focused on the torrefaction of municipal solid waste (MSW) pellets using microwave irradiance for 10–12 min. Agricultural residue char was used as an absorber to mitigate the influence of microwave irradiance on MSW and to lower mass yields of MSW without affecting thermal history across the system. The concept of adding bagasse char worked well, but the overall change in fixed carbon was fairly constant throughout the process. The objective of the addition of char was to enhance the heating value. The overall study did not account for the interaction between biochar and the MSW or the irradiance of microwave [8]. Wang et al. (2012) reported that the micro-wave based torrefaction increased the calorific value of rice husk and sugar cane residue by 26%and 57%, respectively. They observed that the size, water content, time of processing, and heat flux had a significant influence on the mild pyrolysis, which provided a reasonable explanation for the surge in the heating value of the biomass. They stated that the size of biomass was not sufficiently small for microwave torrefaction [9]. In another case, waste palm shell was taken into consideration. Low-temperature pyrolysis was attained via the ingression of steam. The physical properties of biochar were remarkably changed. The surface area of the finished material was increased by 117.97%, whereas the mass yield was reduced by 15% [10]. Torrefaction of wheat and barley straw in a microwave heating system was carbonised due to the action of microwave irradiance, which resulted in a 14–15% increase in energy density and a 29.1% increase in carbon fraction. Notwithstanding the evidence, the overall mass loss of 64% to 66.3% proved that the effect of the microwave at a higher level did not have a significant influence on the physical characteristics of the material. It had diminished the qualitative aspects of torrefaction [10]. Similarly, dewatering of sewage sludge was performed using microwave irradiance. It was estimated that torrefaction for 10 min caused an 80% loss of moisture from the substrate. Moreover, a drop in the ash content, as well as morphological changes, was seen in the sewage sludge. However, the study was confined to physical and kinetic parameters of waste material and the thermal behaviour of the processed material was unaffected [11]. A similar technique was used to enhance the bio-oil yield of various lignocellulosic materials (sugar cane bagasse, palm fibre, palm empty fruit bunch and sugarcane leaves). The effect of Na2CO3 and La2CO3 catalysts on the bio-oil yield was studied and it was reported that the hydrothermal liquefaction of the lignocellulosic material with the help of sodium carbonate was more pronounced, obtaining a higher oil yield from the lignocellulosic biomass [12]. The analysis focused on the biochemical aspects of the biomass. The herb residue was thermally pre-treated with microwave technology, and it was found that the energy yield of the herb residue was increased by 85.813% while processing the residue at 225 °C for 8.55 min. [13]. However, the proposed method was found to be relatively less effective than the quasi-static approach used for processing raw pine [14].
Various other studies based on similar principles have shown that microwave-based technology is suitable for moisture removal [9,10,15], but the optimisation of irradiance, time and temperature was not clearly stated and its influence on the physical characteristics was not explained. Moreover, the cost of consumption and production was found to be high if an additional binding agent is used, and the interaction of the thermal history of the microwave furnace with the biomass is not considered in the study.
In this work, the thermal behaviour of pine pellets is monitored with the help of a 3D thermal model. The two different thermal conditions, quasi-static torrefaction and dynamic torrefaction are investigated. Thus far, the objective of torrefaction has been to focus on the chemical aspects of torrefaction, while omitting the scope of thermodynamic and heat and mass transfer; therefore, we attempt to fill this gap by carrying out FEM analysis of a cylindrical pellet that underwent torrefaction in a Joule heating system. Interpolated solutions have been developed using isosurface. Unlike the microwave-based technique, the furnace which is based on resistive heating has been modified to perform the thermal pre-treatment. The influence of nitrogen flow along the bluff body has also been introduced by varying its volumetric flow rate. It is hoped that this study will make it easier to determine the interaction of a medium with the material subjected to mild pyrolysis.
2. Materials and Methods
Raw black pine needles samples were collected from Pest County of Hungary. The densification and torrefaction were conducted at the National Agriculture and Innovation Centre, Godollo, Hungary. The following subsequent sections are based on the methodology adopted to prepare and develop a new technique for torrefaction. The characteristics of the numerical solutions were determined by Sliceomatic. Cylindrical coordinates were used throughout the analysis work. Unlike other works, densification was performed before the torrefaction process.
3. Preparation and Densification of Black Pine
A 3-phase, heavy-duty, 1.5 kW rotor milling machine (6-disc rotor) (Retsch SM 2000, Haan, Germany) was used to mill 4 kg of raw black pine. The material was fed tangentially through a standard hooper (80 × 80 mm). The selected feed rate and the hooper size were chosen based on moisture content and the size of the processing material. For a given material, the predetermined rate was between 200 and 300 g·h−1. A standard stainless steel sieve of size 1.5 mm was used during the milling process. However, the relative fineness of feedstock also depends on the category of pellet machine employed during the compacting operation. Once the milling process was finished, the moisture content of the milled form was measured. Around 110 mL·kg−1 of water was added to the fine powder of the feedstock. The moisture content of the prepared feedstock was kept below 15%. The prepared feedstock was allowed to be heated up to 70 °C in the pellet machine. During the process, the temperature of the die and pellet was also measured to ensure that the produced pellets could withstand the pressure exerted by the rotating drum. A ring die type pellet machine (CL3, California Pellet Mill, Crawfordsville, IN, USA) was employed while densifying the raw black pine. Screw extrusion of the prepared feedstock was performed by feeding the fine powder into a barrel through a material hooper. The purpose of the screw is to push the material into the chamber, where one to three rollers press the material radially outward through the cylindrical holes provided on the ring die. The length and diameter of the die were 25.95 mm and 6.39 mm, respectively. The recorded temperature of pine pellets was 49–60 °C.
For elemental analysis of black pine, the analyser was heated up to 1200 °C for 30 min. Concomitantly, the samples were encapsulated in tin foil with tungsten (VI) that was used as a reagent to facilitate the oxidation of the samples. The birch leaf sample was used to calibrate the CHNS analyser. Once the furnace reached the pre-combustion temperature, the samples were injected into the system via a multi-sample injector. Oxygen was used to maintain the catalytic combustion, whereas helium gas was used as a carrier gas. The role of the carrier gas was to allow the products of combustion to move into the different reduction columns. These tubes were placed in the signal-processing unit in the middle of combustion. The elements of gas were examined with the help of trap chromatography and a thermal conductivity detector (TCD). The bulk density of the sample was calculated using a conventional graduated flask, whereas the geometrical measurement of the cylindrical pellet was performed by a vernier calliper.
4. Modification of Furnace for Thermal Pre-Treatment
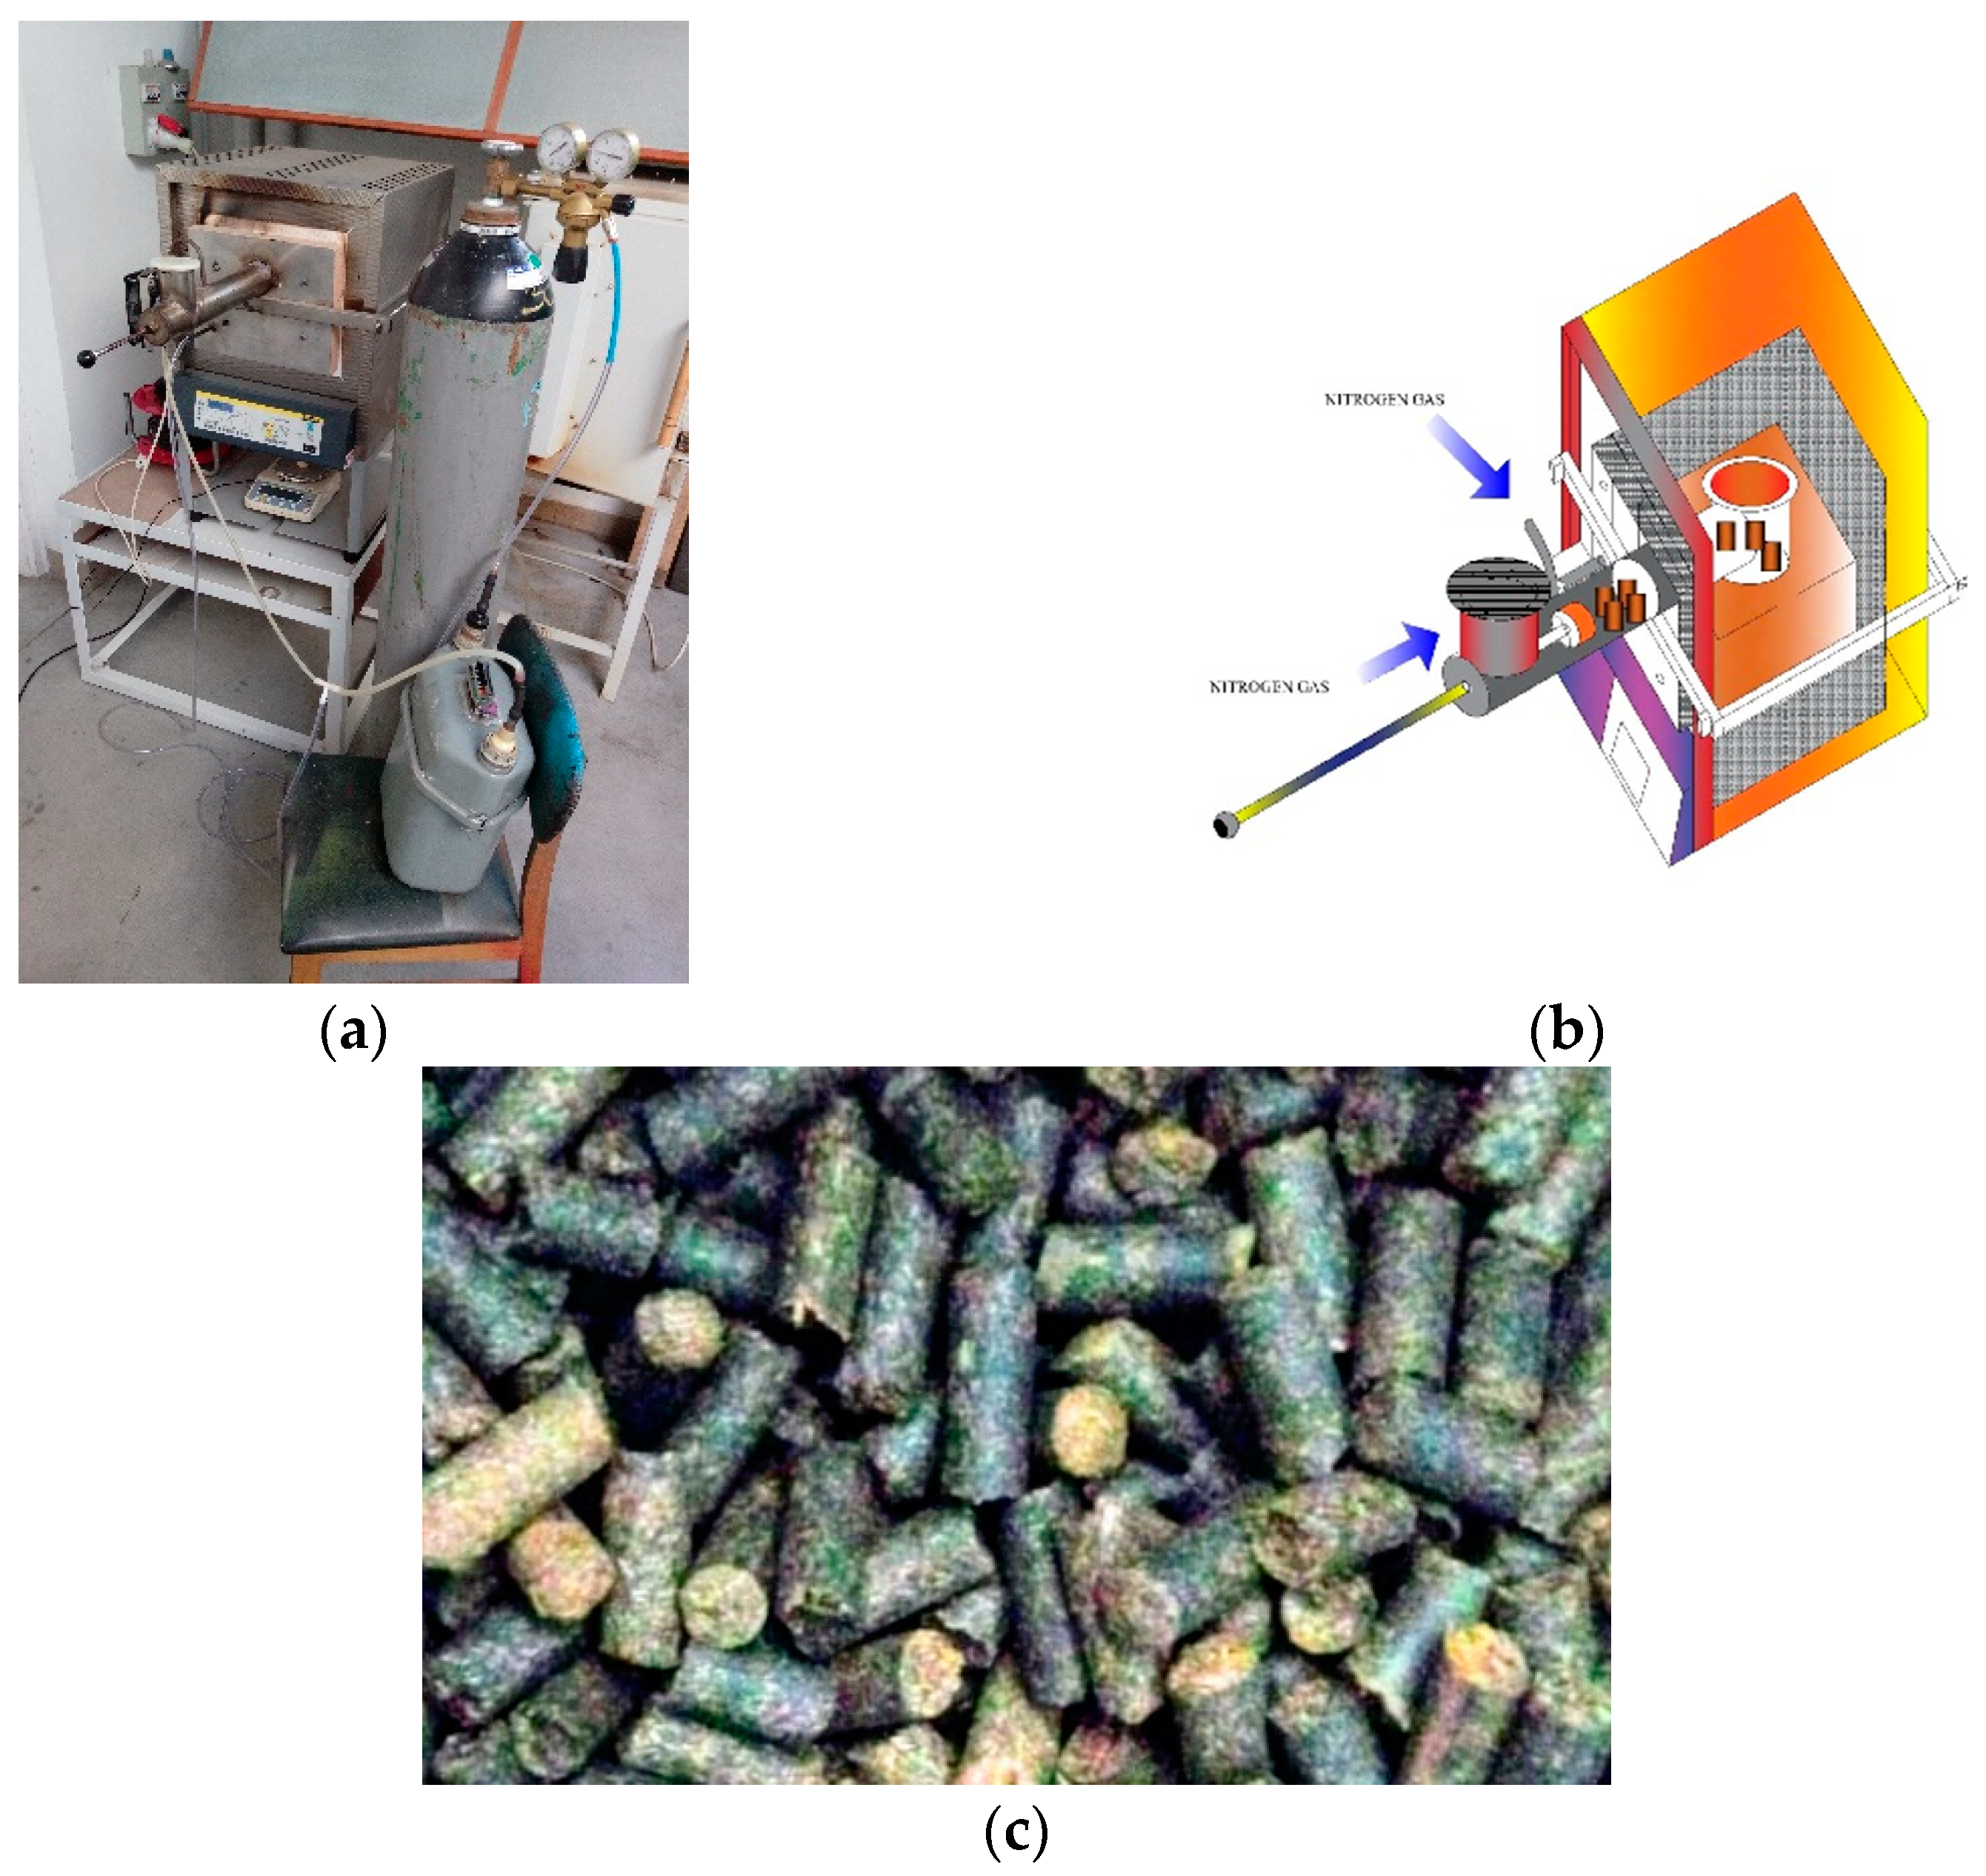
The prepared pellets had undergone torrefaction in the digitally programmed furnace (Nabertherm, P320 Controller, Lilienthal, Germany) for a duration of 5, 10, 15 min at a constant temperature of 523 K. The power consumption of the single-phase furnace was measured by the Energy logger 400 (Voltcraft, Hirschau, Germany). The lid of the furnace was replaced with a detachable lid (313.15 mm × 250 mm) bolted with the help of a steel bracket frame. To hold the pellets and provide insulation, a hollow cylinder (122.45 mm in diameter and length of 559.8 mm) with a plunger (length of 568.71 mm) was welded at the centre of the lid. Along with this arrangement, the two cylindrical ducts of 21.5 mm in diameter were provided on the lid and the hollow cylinder for the flow of nitrogen gas. For feeding the pellets into the system, a cylindrical hooper of 109.02 mm diameter was provided along the length of the hollow cylinder. The operating pressure of nitrogen was pre-set to 1.5 bar at the outlet of the nitrogen cylinder by a regulating value. A digital console was used to program the thermal profile for the heating furnace. A mechanical link was used to measure the mass of the material fed into the vessel. A purge rate of 700 mL.min−1 was considered while performing the torrefaction of the pellets. To cool down the system, a fan was bolted along the structure to prevent the heat of the furnace from influencing the mass of the pellets held in the hollow cylinder. The flow rate of nitrogen was measured with a gas flow meter (Ganz 2000, Budapest, Hungary). The pre-treated pine pellets along with the furnace are shown in Figure 1.
5. Finite Element Analysis of Biofuel Pellets
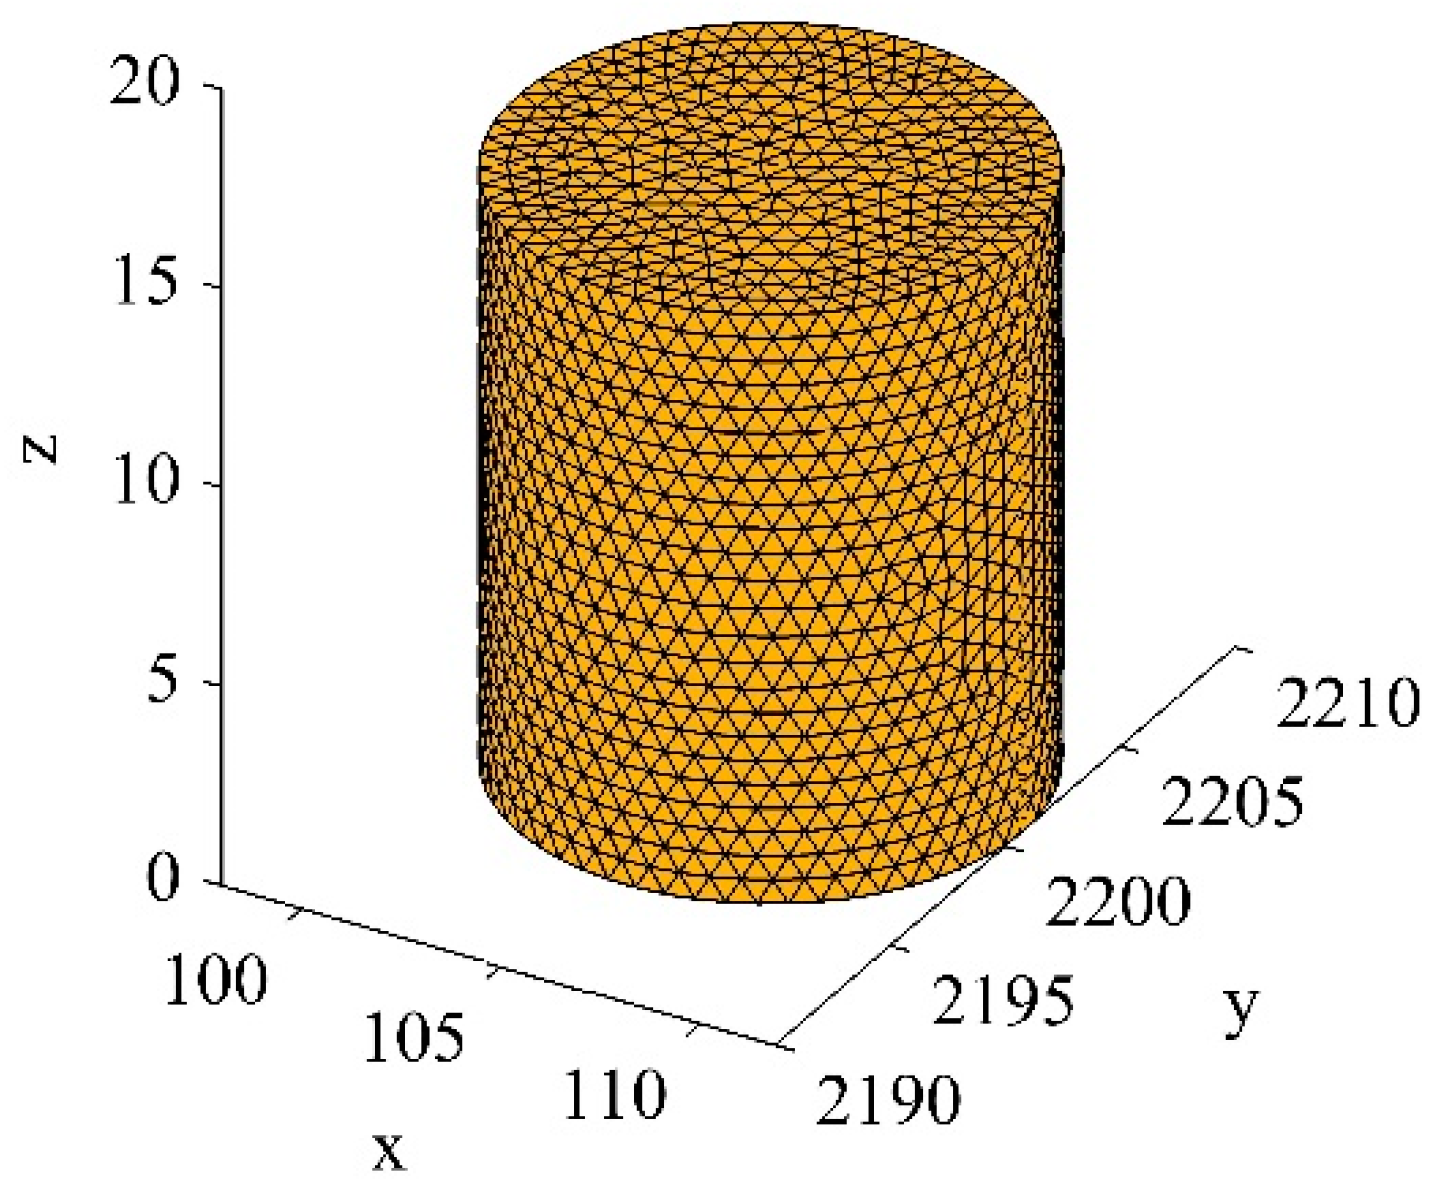
The thermal model was developed and solved with the help of an algorithm written in the MATLAB2015a interface. Only the effects of conduction and convection on the temperature, thermal gradient and heat flux were included, whereas the significance of irradiance was considered to be absent during analysis. The objective was to determine the temperature distribution inside the biofuel pellet while performing dry torrefaction at quasi-static and dynamic thermal histories. The heating rate of the modified furnace was inherently designed for a linear thermal profile, whereas the waiting time was pre-set with the help of a digital console. The mathematical solution was determined at different values of Nusselt and Reynold numbers of nitrogen flow around the pine pellets (bluff body), torrefaction duration and the heating rate corresponding to the selected duration of the pre-treatment process. It was assumed that the porosity within biofuel pellets is negligibly small and it was considered as a solid body subjected to a varying thermal history. The 3D heat conduction equation was used with a constant heat supply. The solution was derived at mesh points as well as interpolated sites of the meshed structure (Figure 2). The effect of surface regularity along the top and bottom surface was excluded during the simulation process. The mixed boundary conditions (BC) were used during the computation process. The time dependence of BCs was involved according to the applied thermal history. Finite element analysis at the mesh points was performed for 5, 10 and 15 min. The numerical solution was later determined at an arbitrary location of the pellets. The slicing of the interpolated solution was evaluated with the help of the patching function and isonormals of isosurface vertices using temperature gradient, ∇T. Thermal conductivity of the pine pellet was assumed to be isotropic in nature. The thermo-fluid parameters related to torrefaction are provided in Table 3.
The PDE equation in cylindrical coordinates (Equation (1)) was solved with the help of a 3D thermal model for the transient condition.
Here, , C, τ, ρ, ϕ, q and k denote the density, specific heat, time, radius, azimuth angle, the internal heat source and thermal conductivity of the pine pellets, respectively.
The equation is analogous to the general partial differential equation in Cartesian coordinates, which can be also converted into cylindrical coordinates by using a parametric equation.
The boundary condition for the ramping profile can be given by
where and G can either be a linear or non-linear function of time. For linear ramping,
Here, is the heating rate of the furnace.
Neumann and Dirichlet conditions for the boundary of a pellet are expressed by the following equation:
and
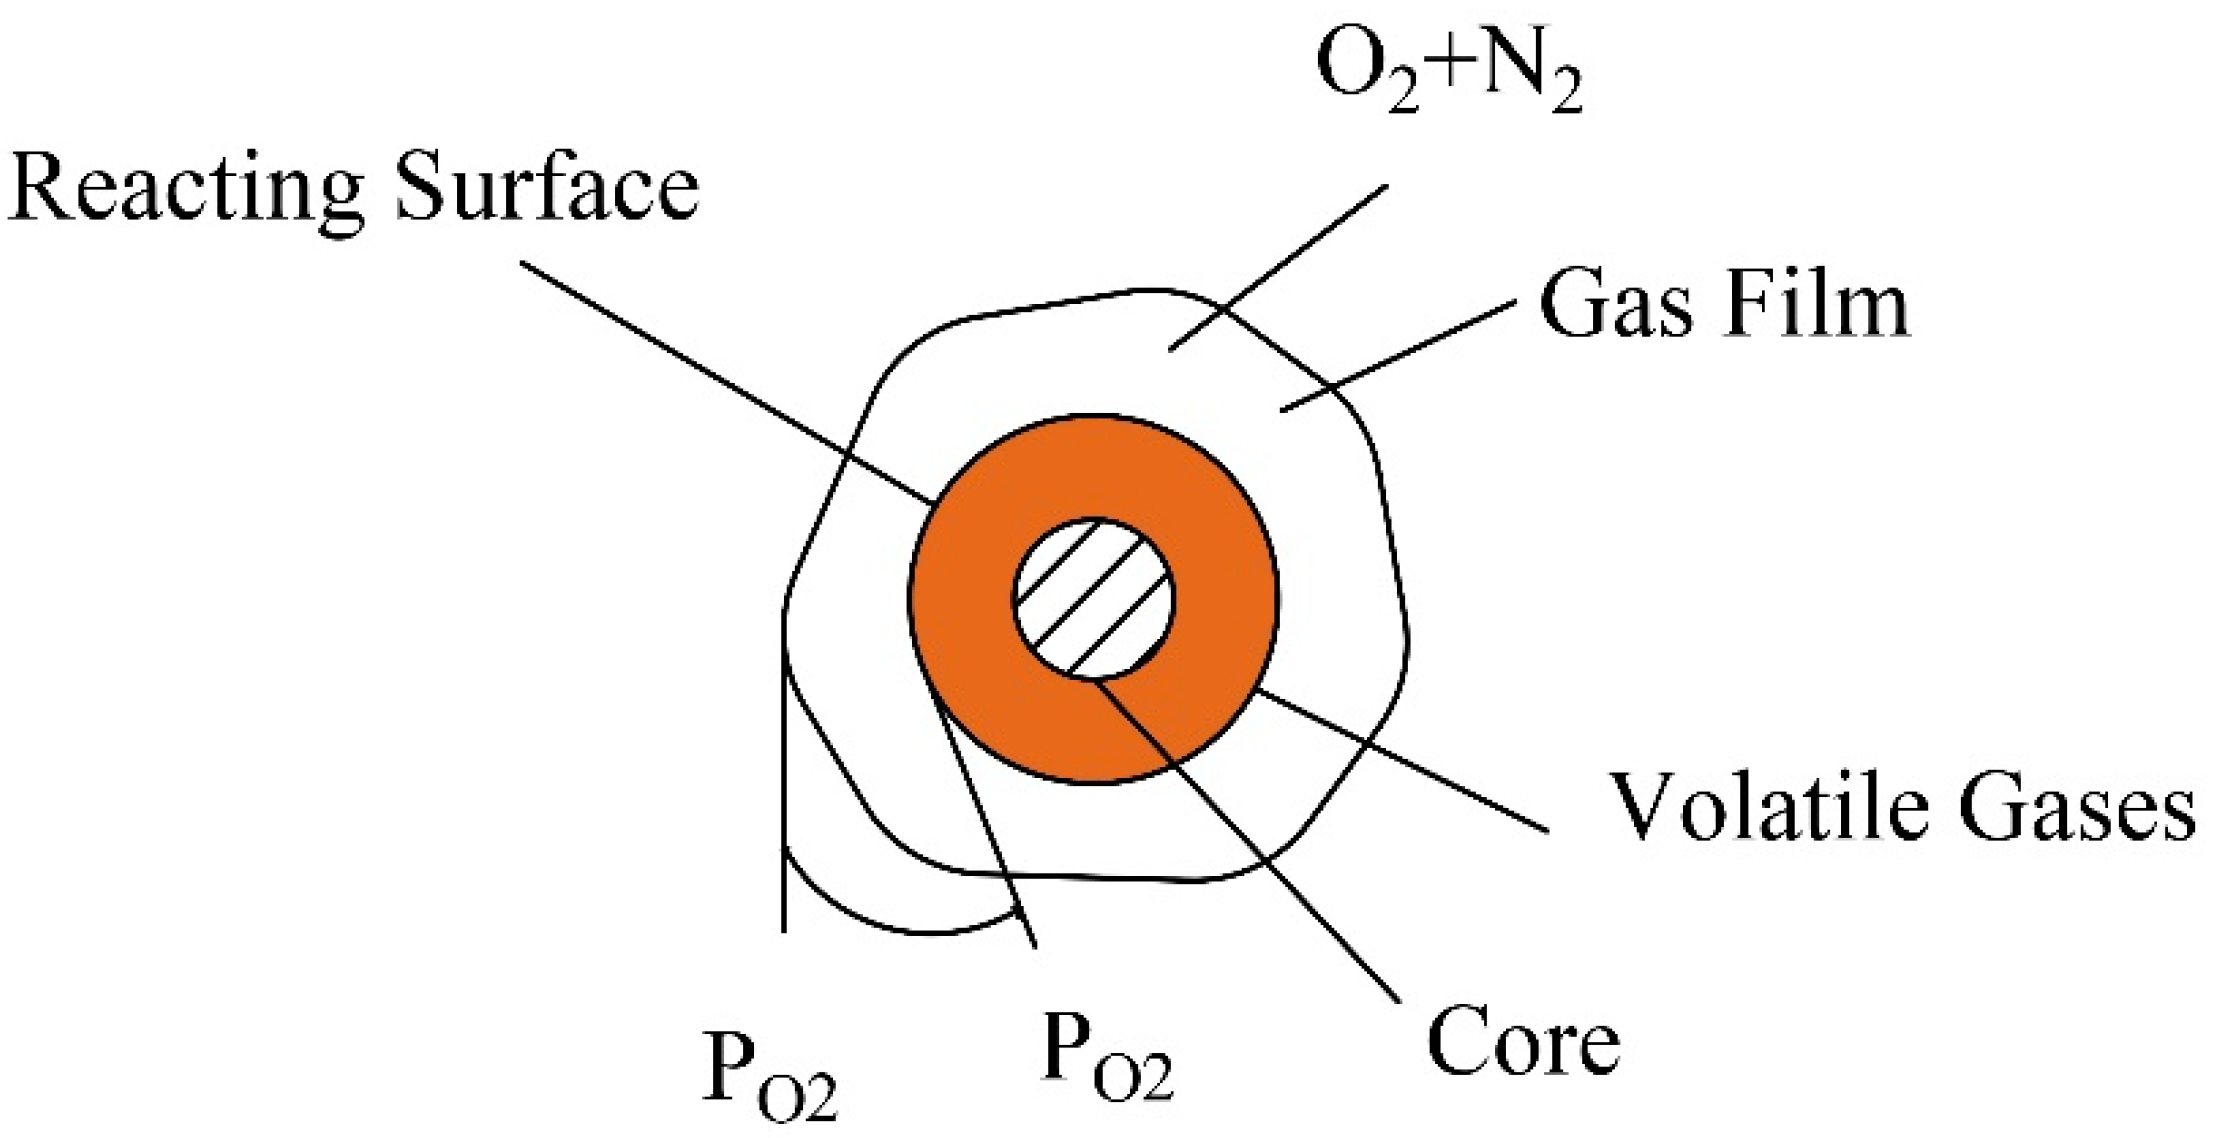
Here, g is the heat flux (W·m−2) and q (W·m−2·K−1) is the heat transfer coefficient of the thin film of nitrogen gas around the surface (Figure 3). On the other hand, h and r are the arguments at the edge of the pellet.
The heat transfer coefficient ( of the nitrogen gas inside the furnace is determined by the empirical correlation of Churchill and Bernstein [16] (valid for and ).
Here, D is the diameter of a biofuel pellet.
The thermal conductivity based on the moisture and specific gravity of the pellet is determined from the correlation provided by the following expression [17]:
where S and M represent the specific gravity and moisture content of biofuel pellets.
The differential equation for the diffusion of species i in terms of mass fraction yi is determined by using the following differential equation:
where and Di is the diffusion coefficient for species i.
Here, the media on both sides of solid boundary are considered to be quiescent.
The boundary condition at the solid-gas interface can be given by
* It is based on the assumption that the oxygen consumption in the surface reaction is equal to the oxygen supply through the boundary film; that is, . and denote the diffusion rate of oxygen and the rate of a heterogeneous reaction, respectively. l is the trailing length along with the biofuel pellet.
Here, , and are the diffusion coefficient, the concentration of oxygen in the bulk flow and on the surface of the pellet.
The diffusion coefficient for gaseous constituents is determined by the Hirschfelder equation for non-polar, non-reacting gas pairs in proximity to biofuel pellets. Information about mass diffusivity is provided in Table 4.
For the evaporation of water, the following boundary condition is imposed:
6. Results and Discussion
6.1. Thermal Characteristics of a Biofuel Pellet
The numerical solution for applying the different thermal conditions in the torrefaction process was analytically examined with the help of the PDE thermal model for a biofuel pellet. On the other hand, the mass diffusion of volatile and water content was modelled through a pdepe module. The interpolated solutions at different spatial positions other than the mesh points were computed by a slicing technique. The torrefaction temperature was kept constant and the effect of time and heat flux on the temperature distribution and mass diffusion was determined. The temperature in the quasi-static state of the control volume was constant, while it varied linearly in the dynamic condition applied to the Joule heating system. Though the thermal history is known, how the biofuel pellet (system) responds to changes in the state of the surrounding (chamber) was targeted during finite element analysis.
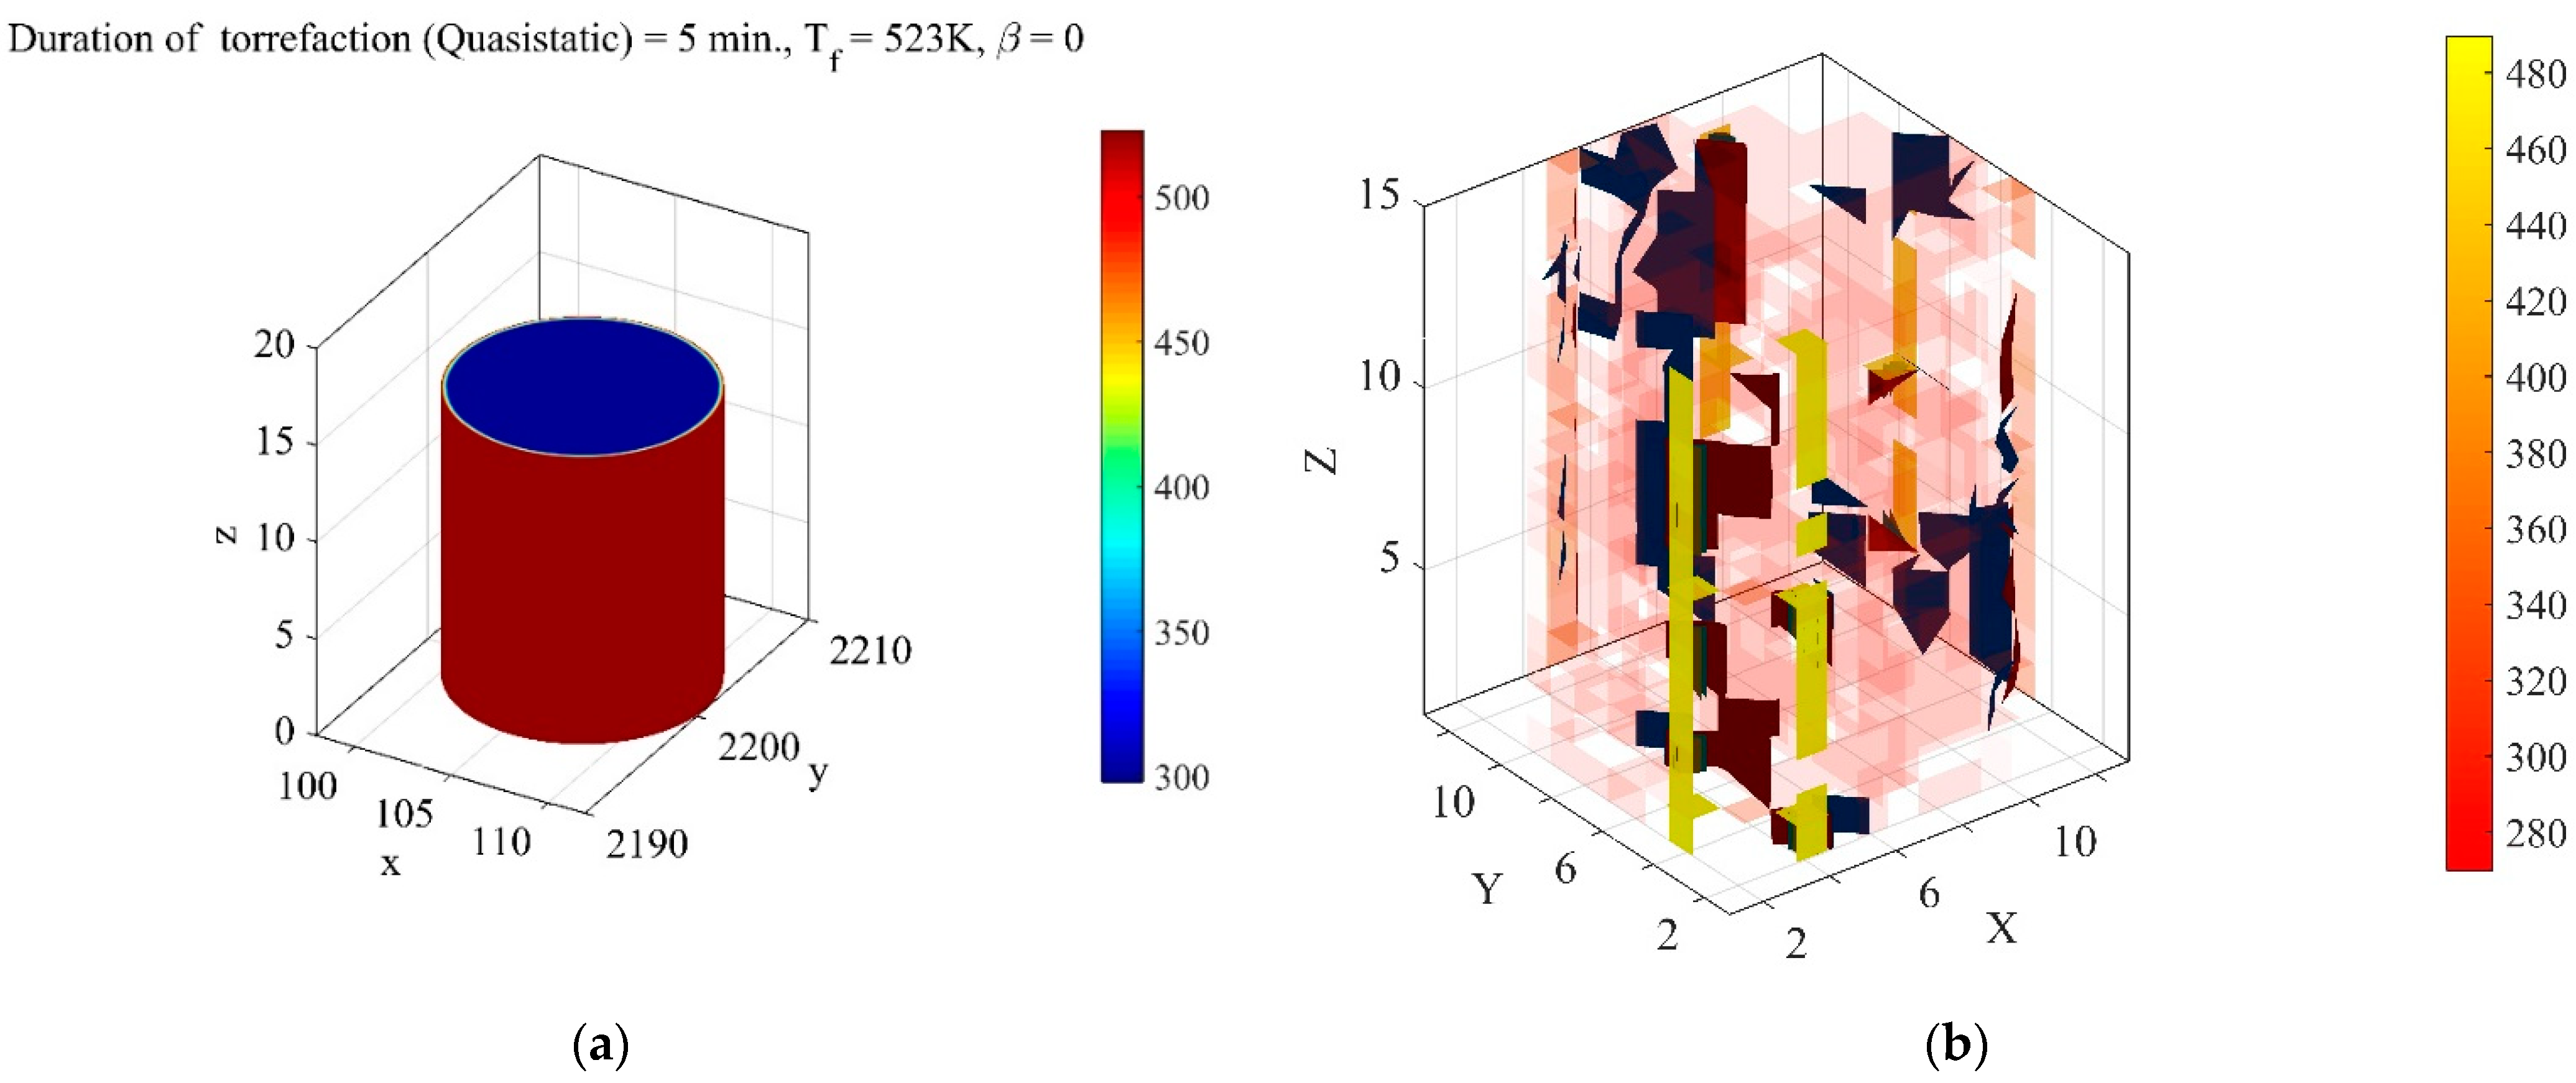
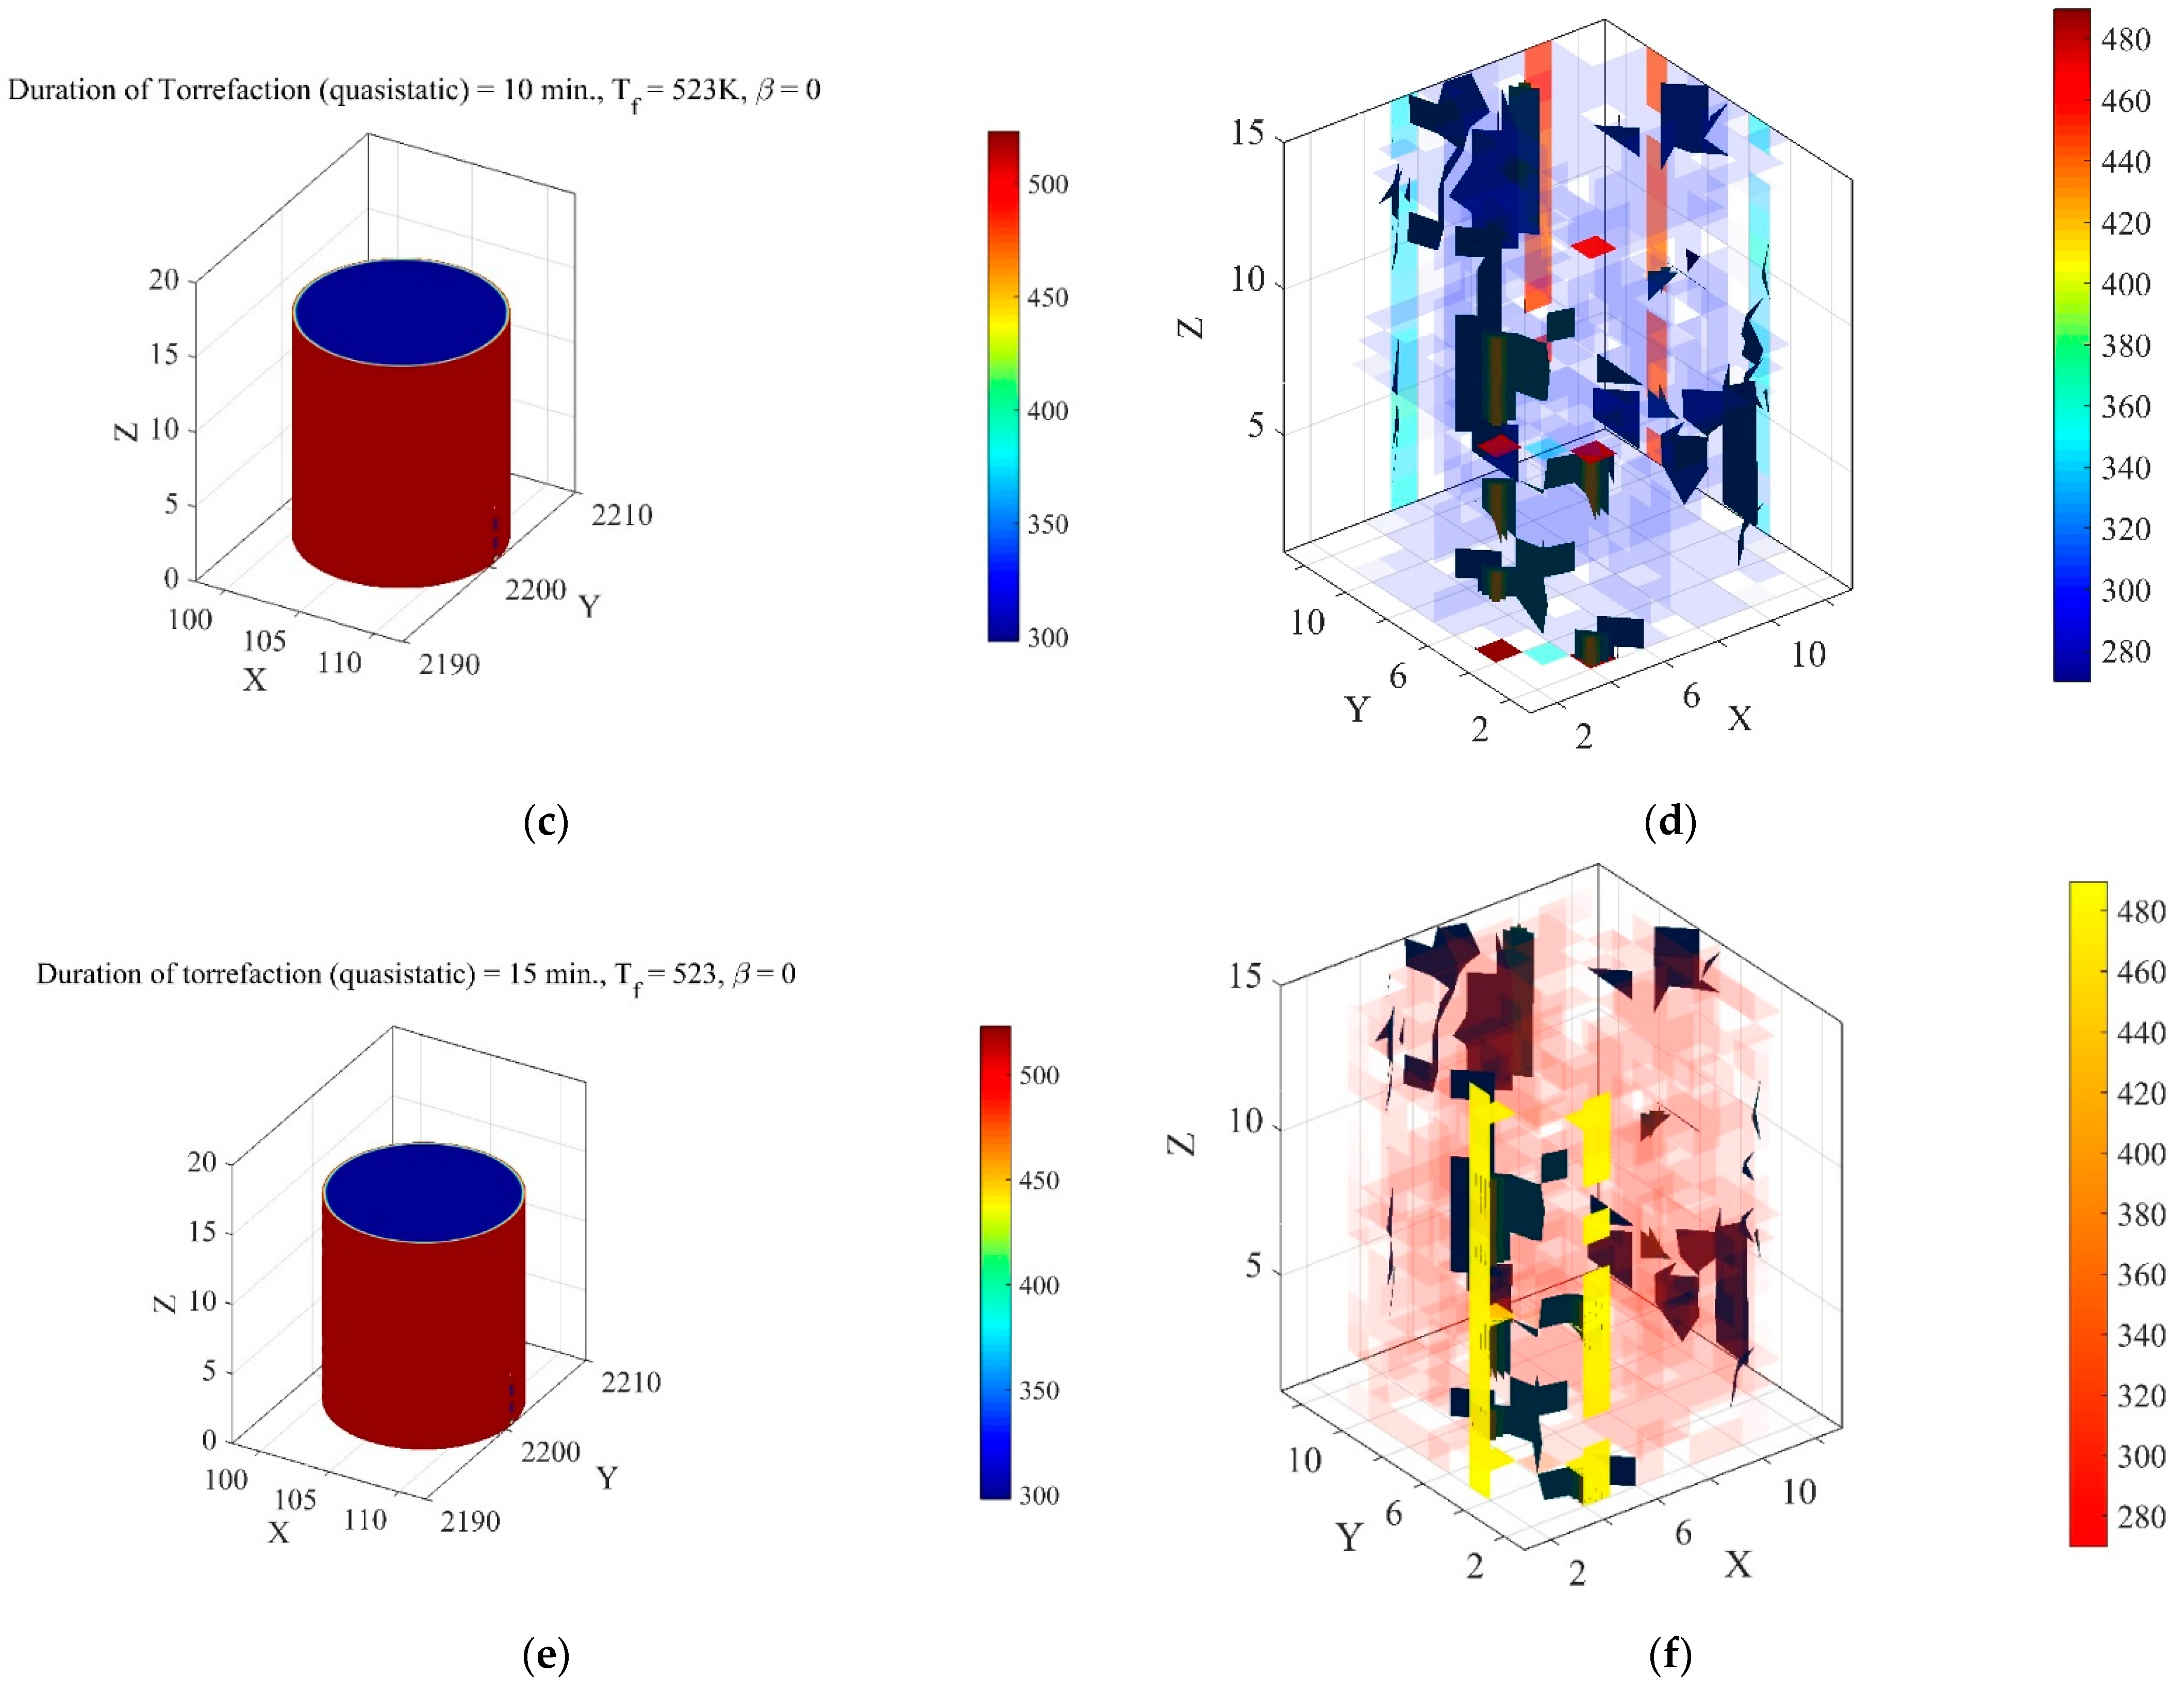
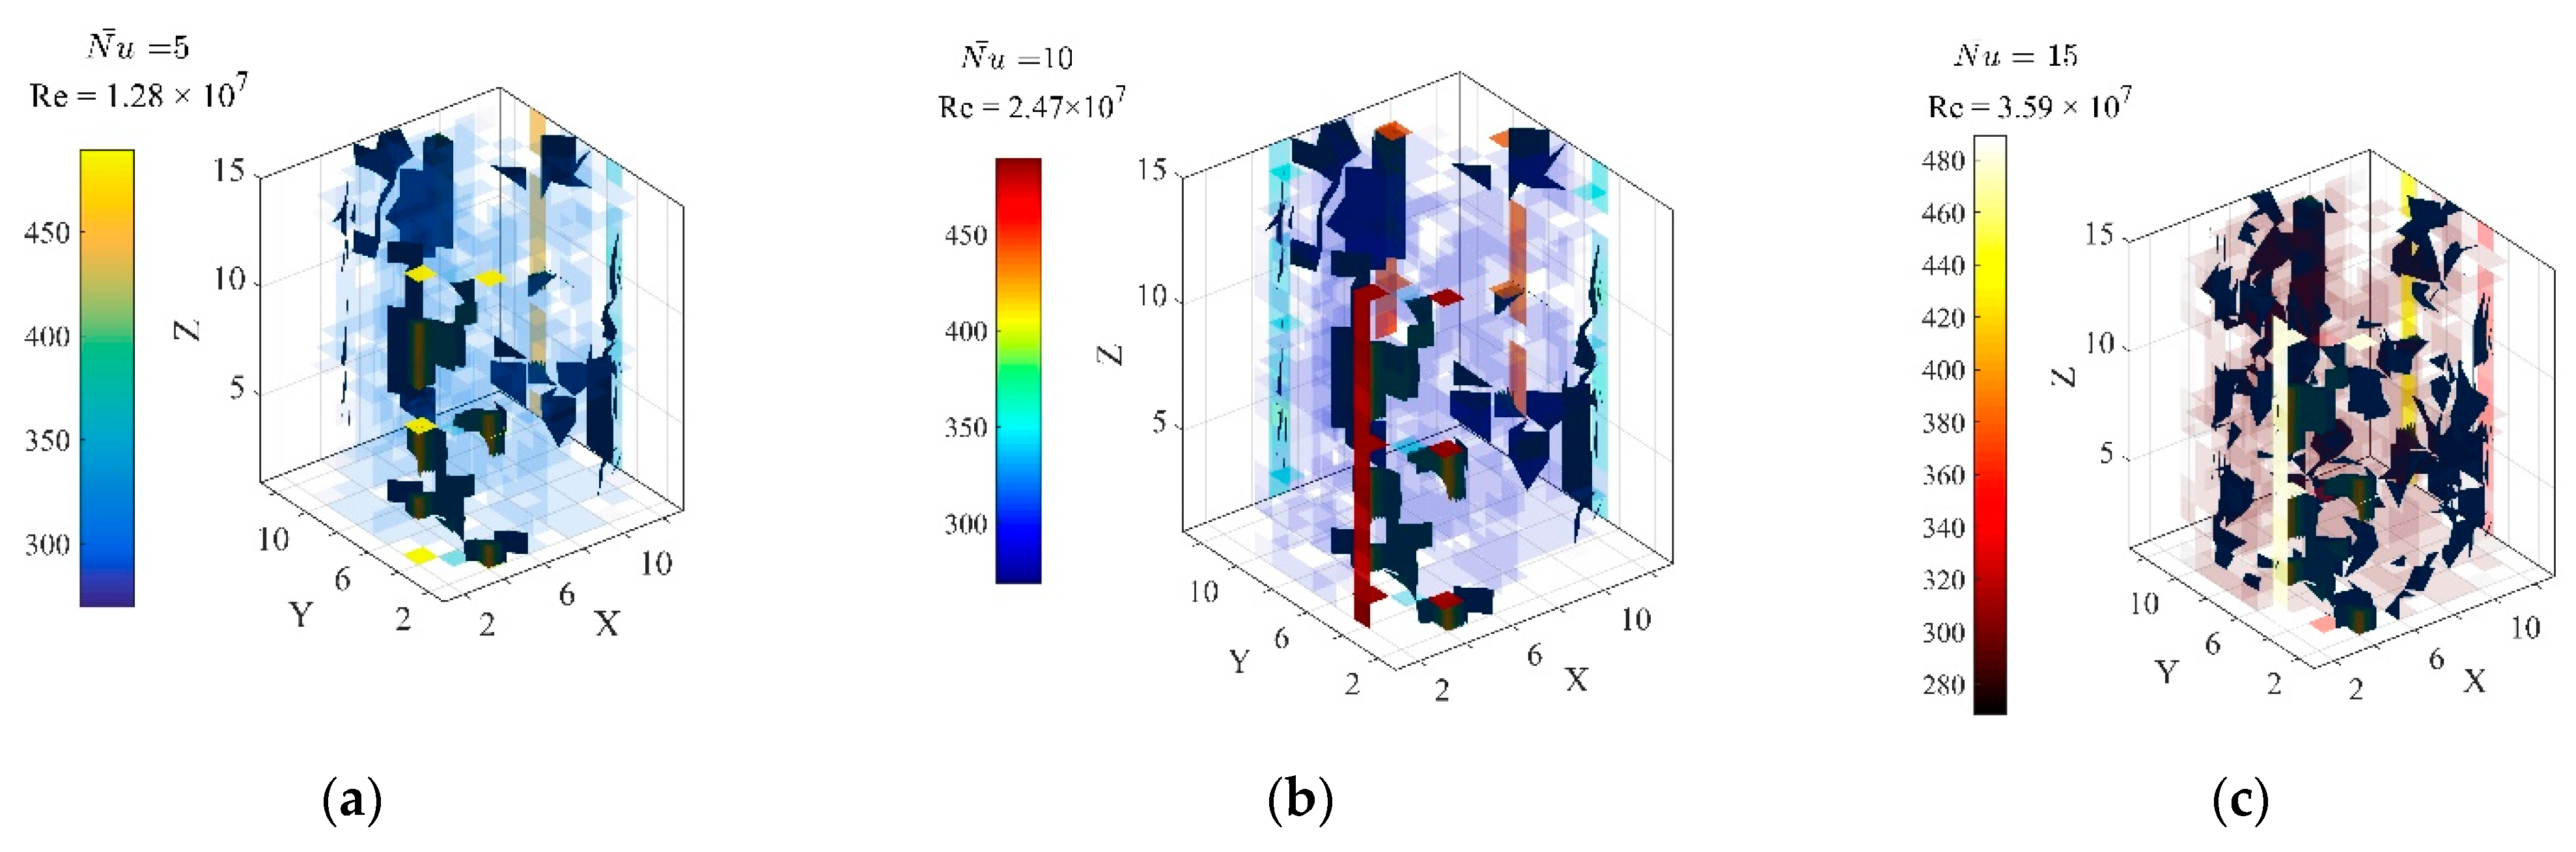
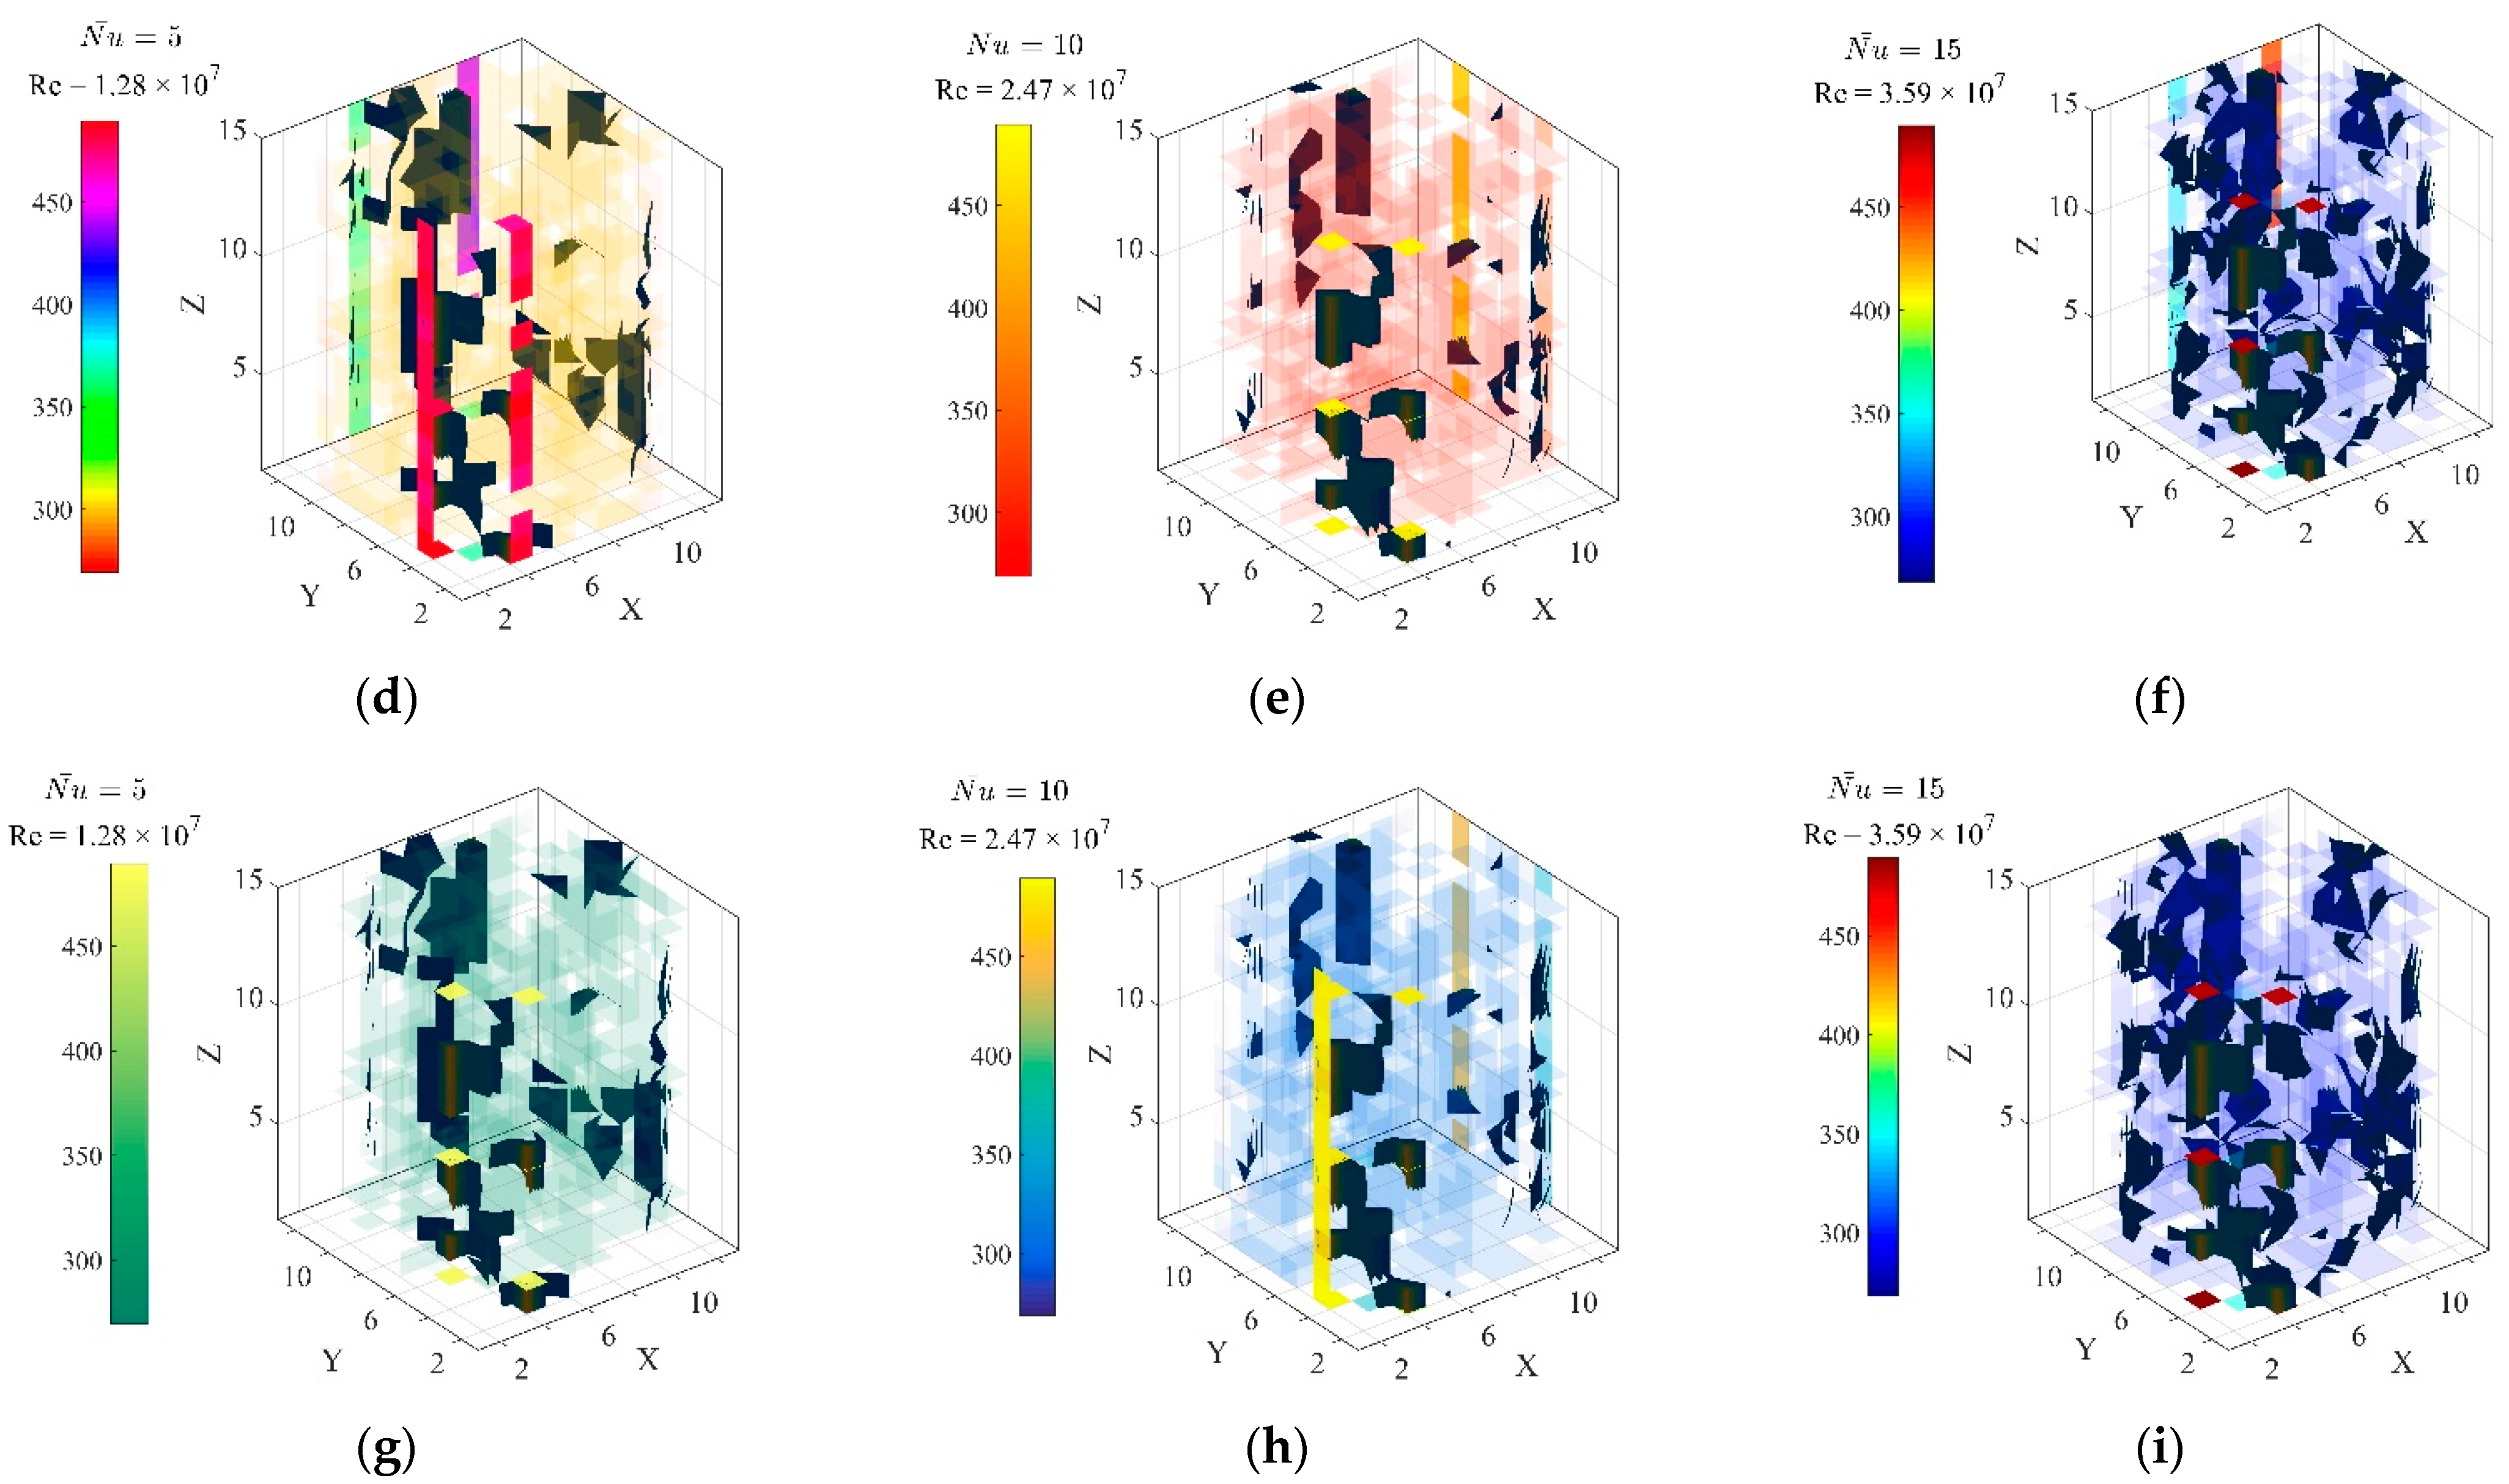
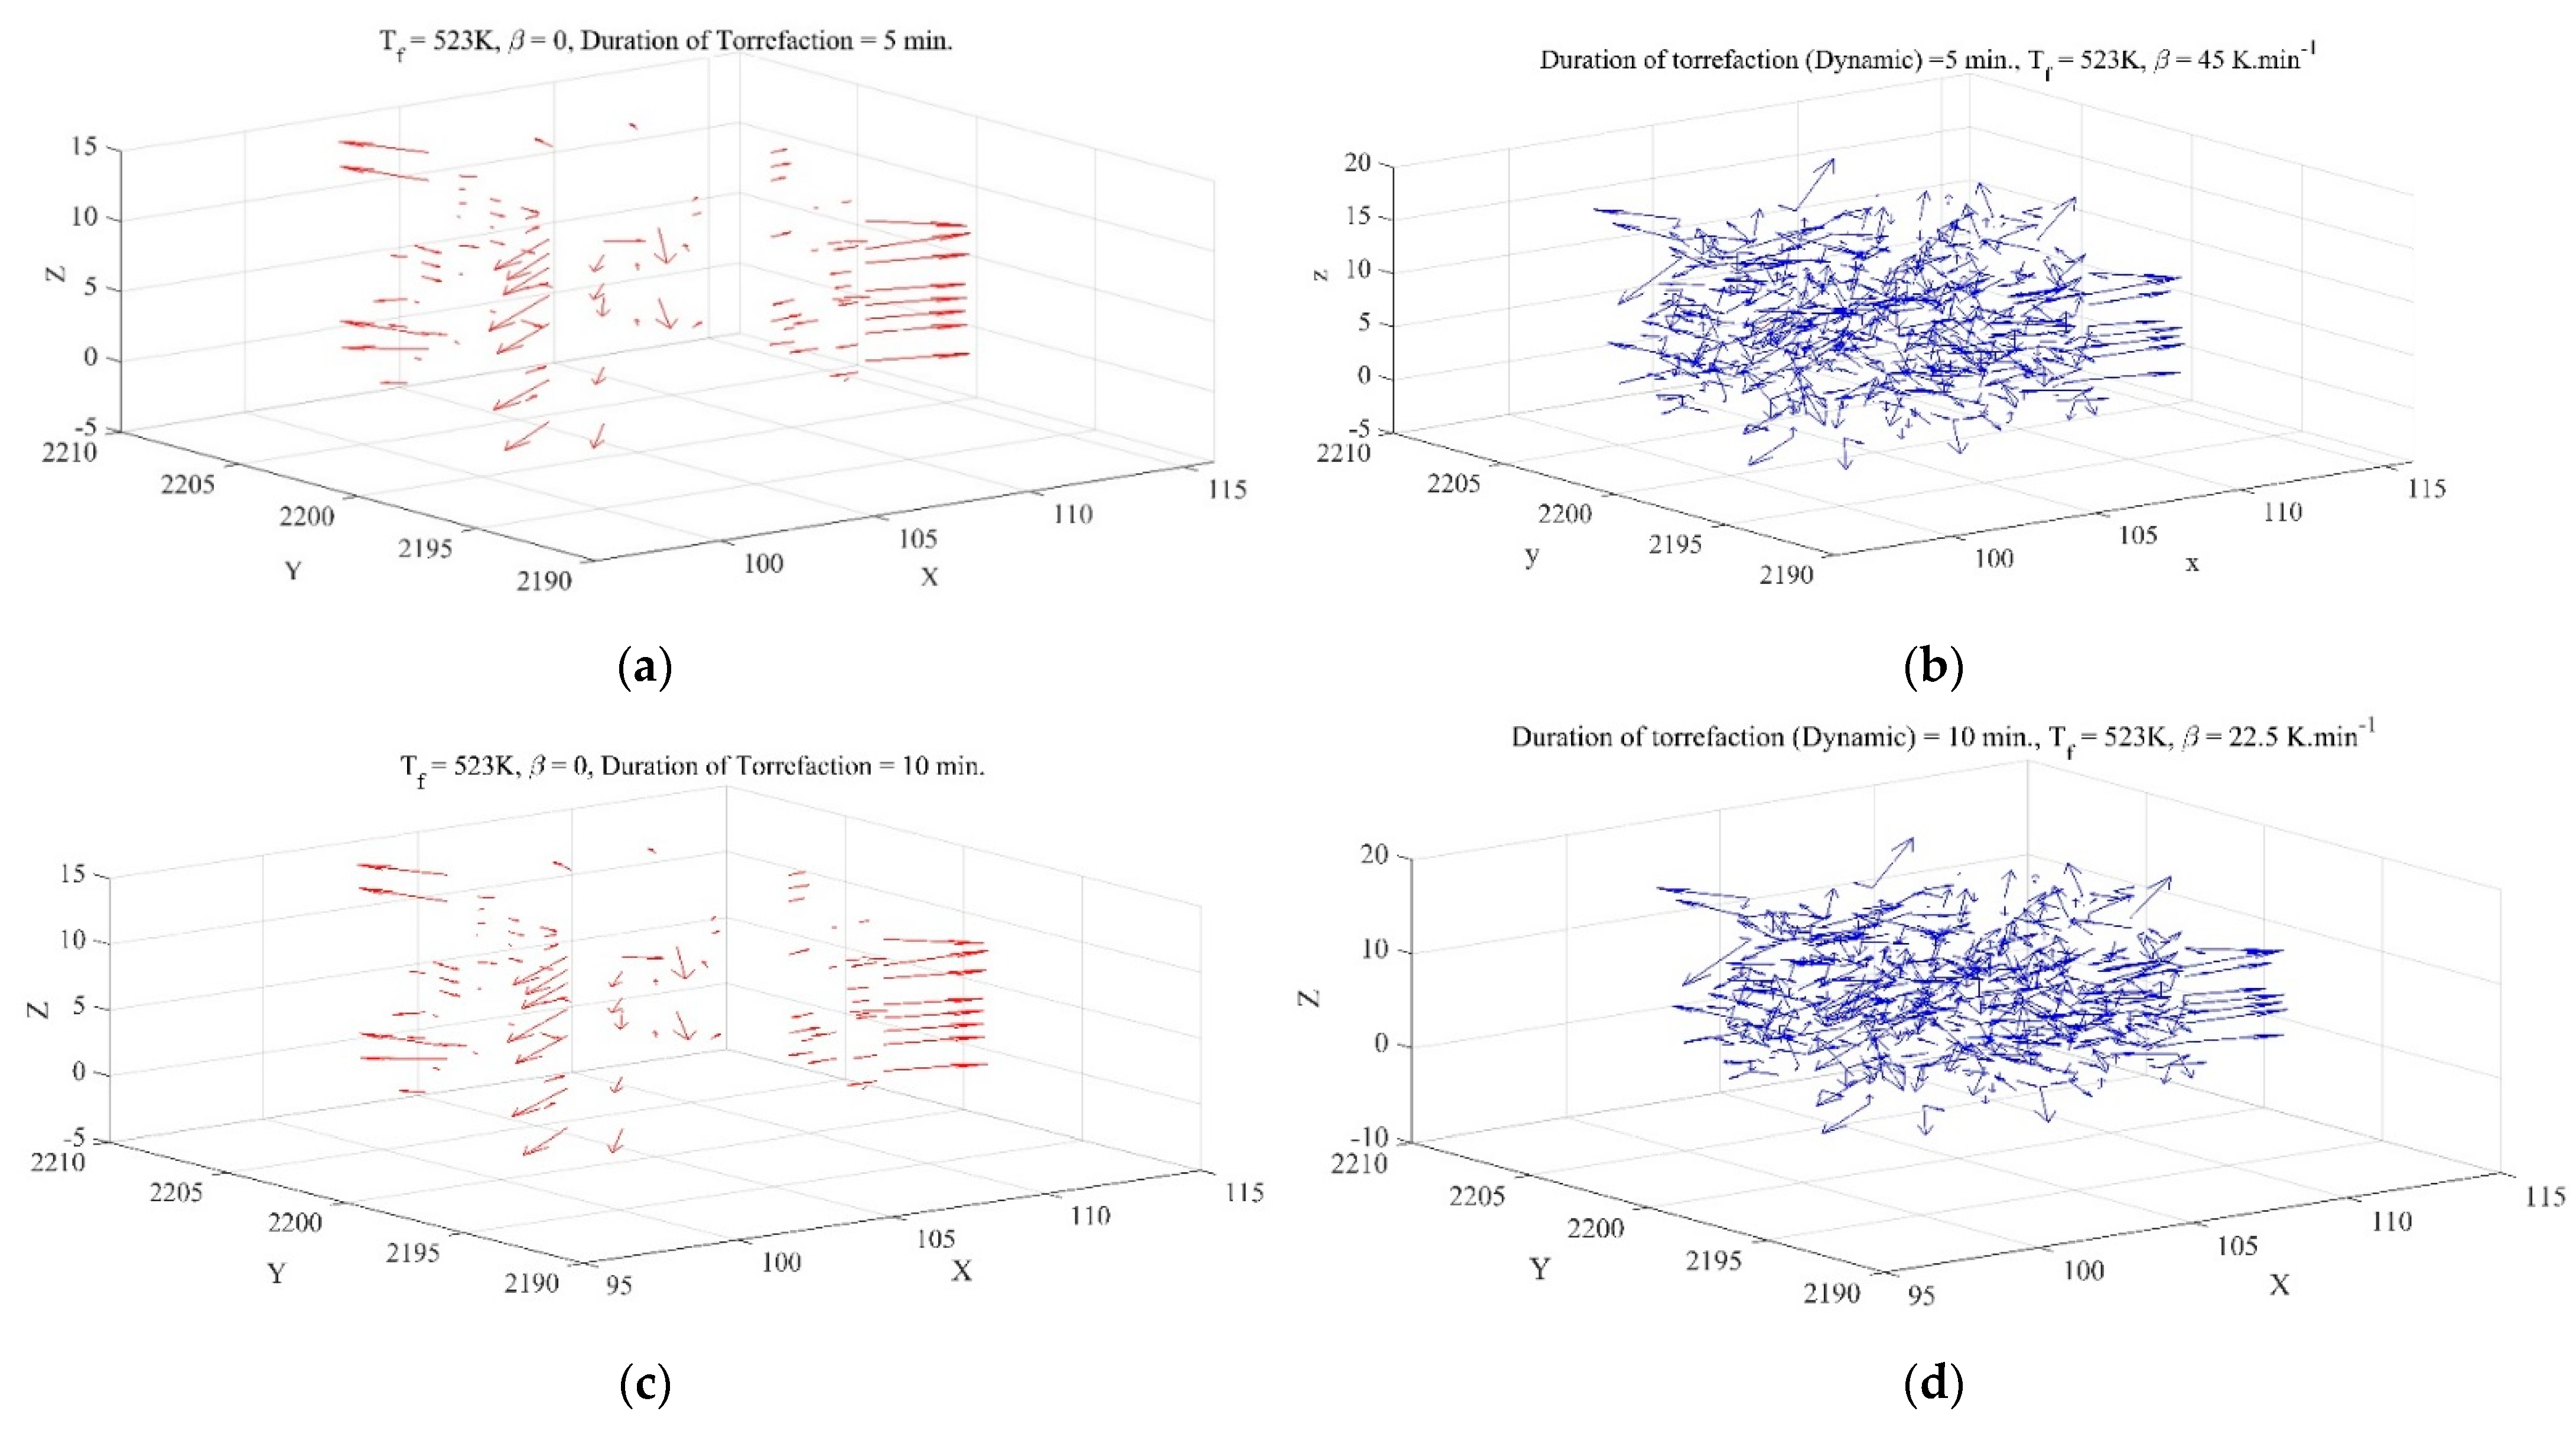
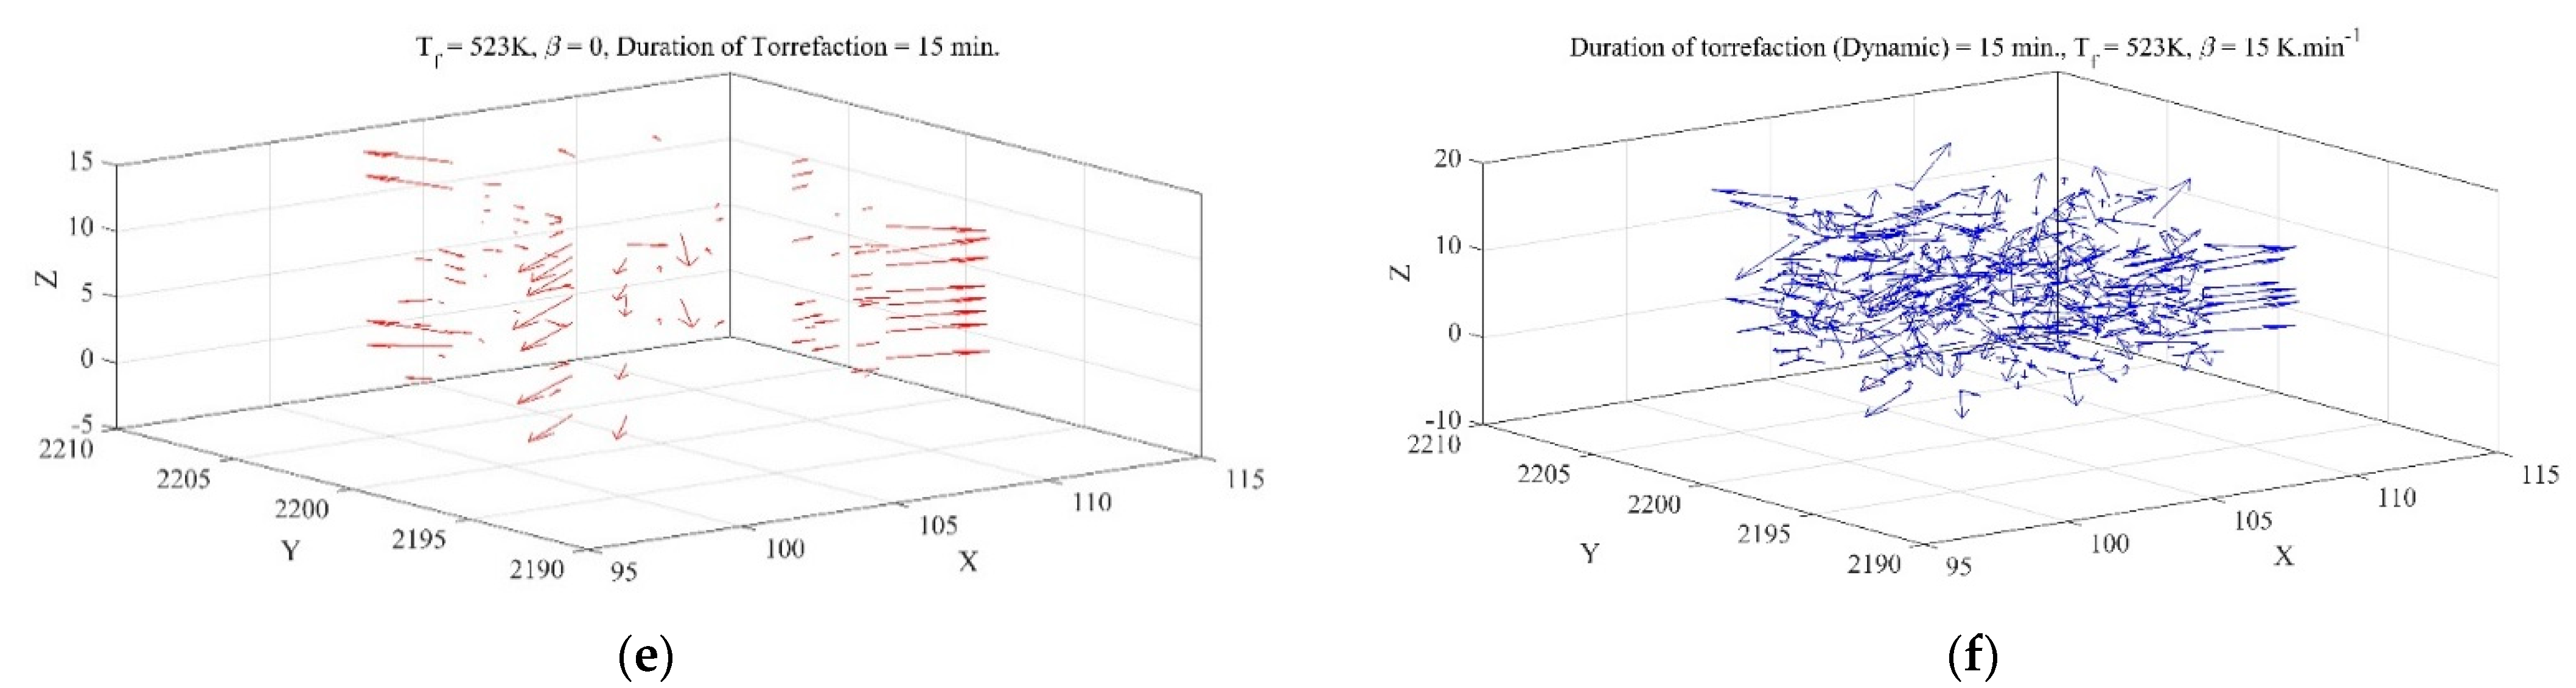
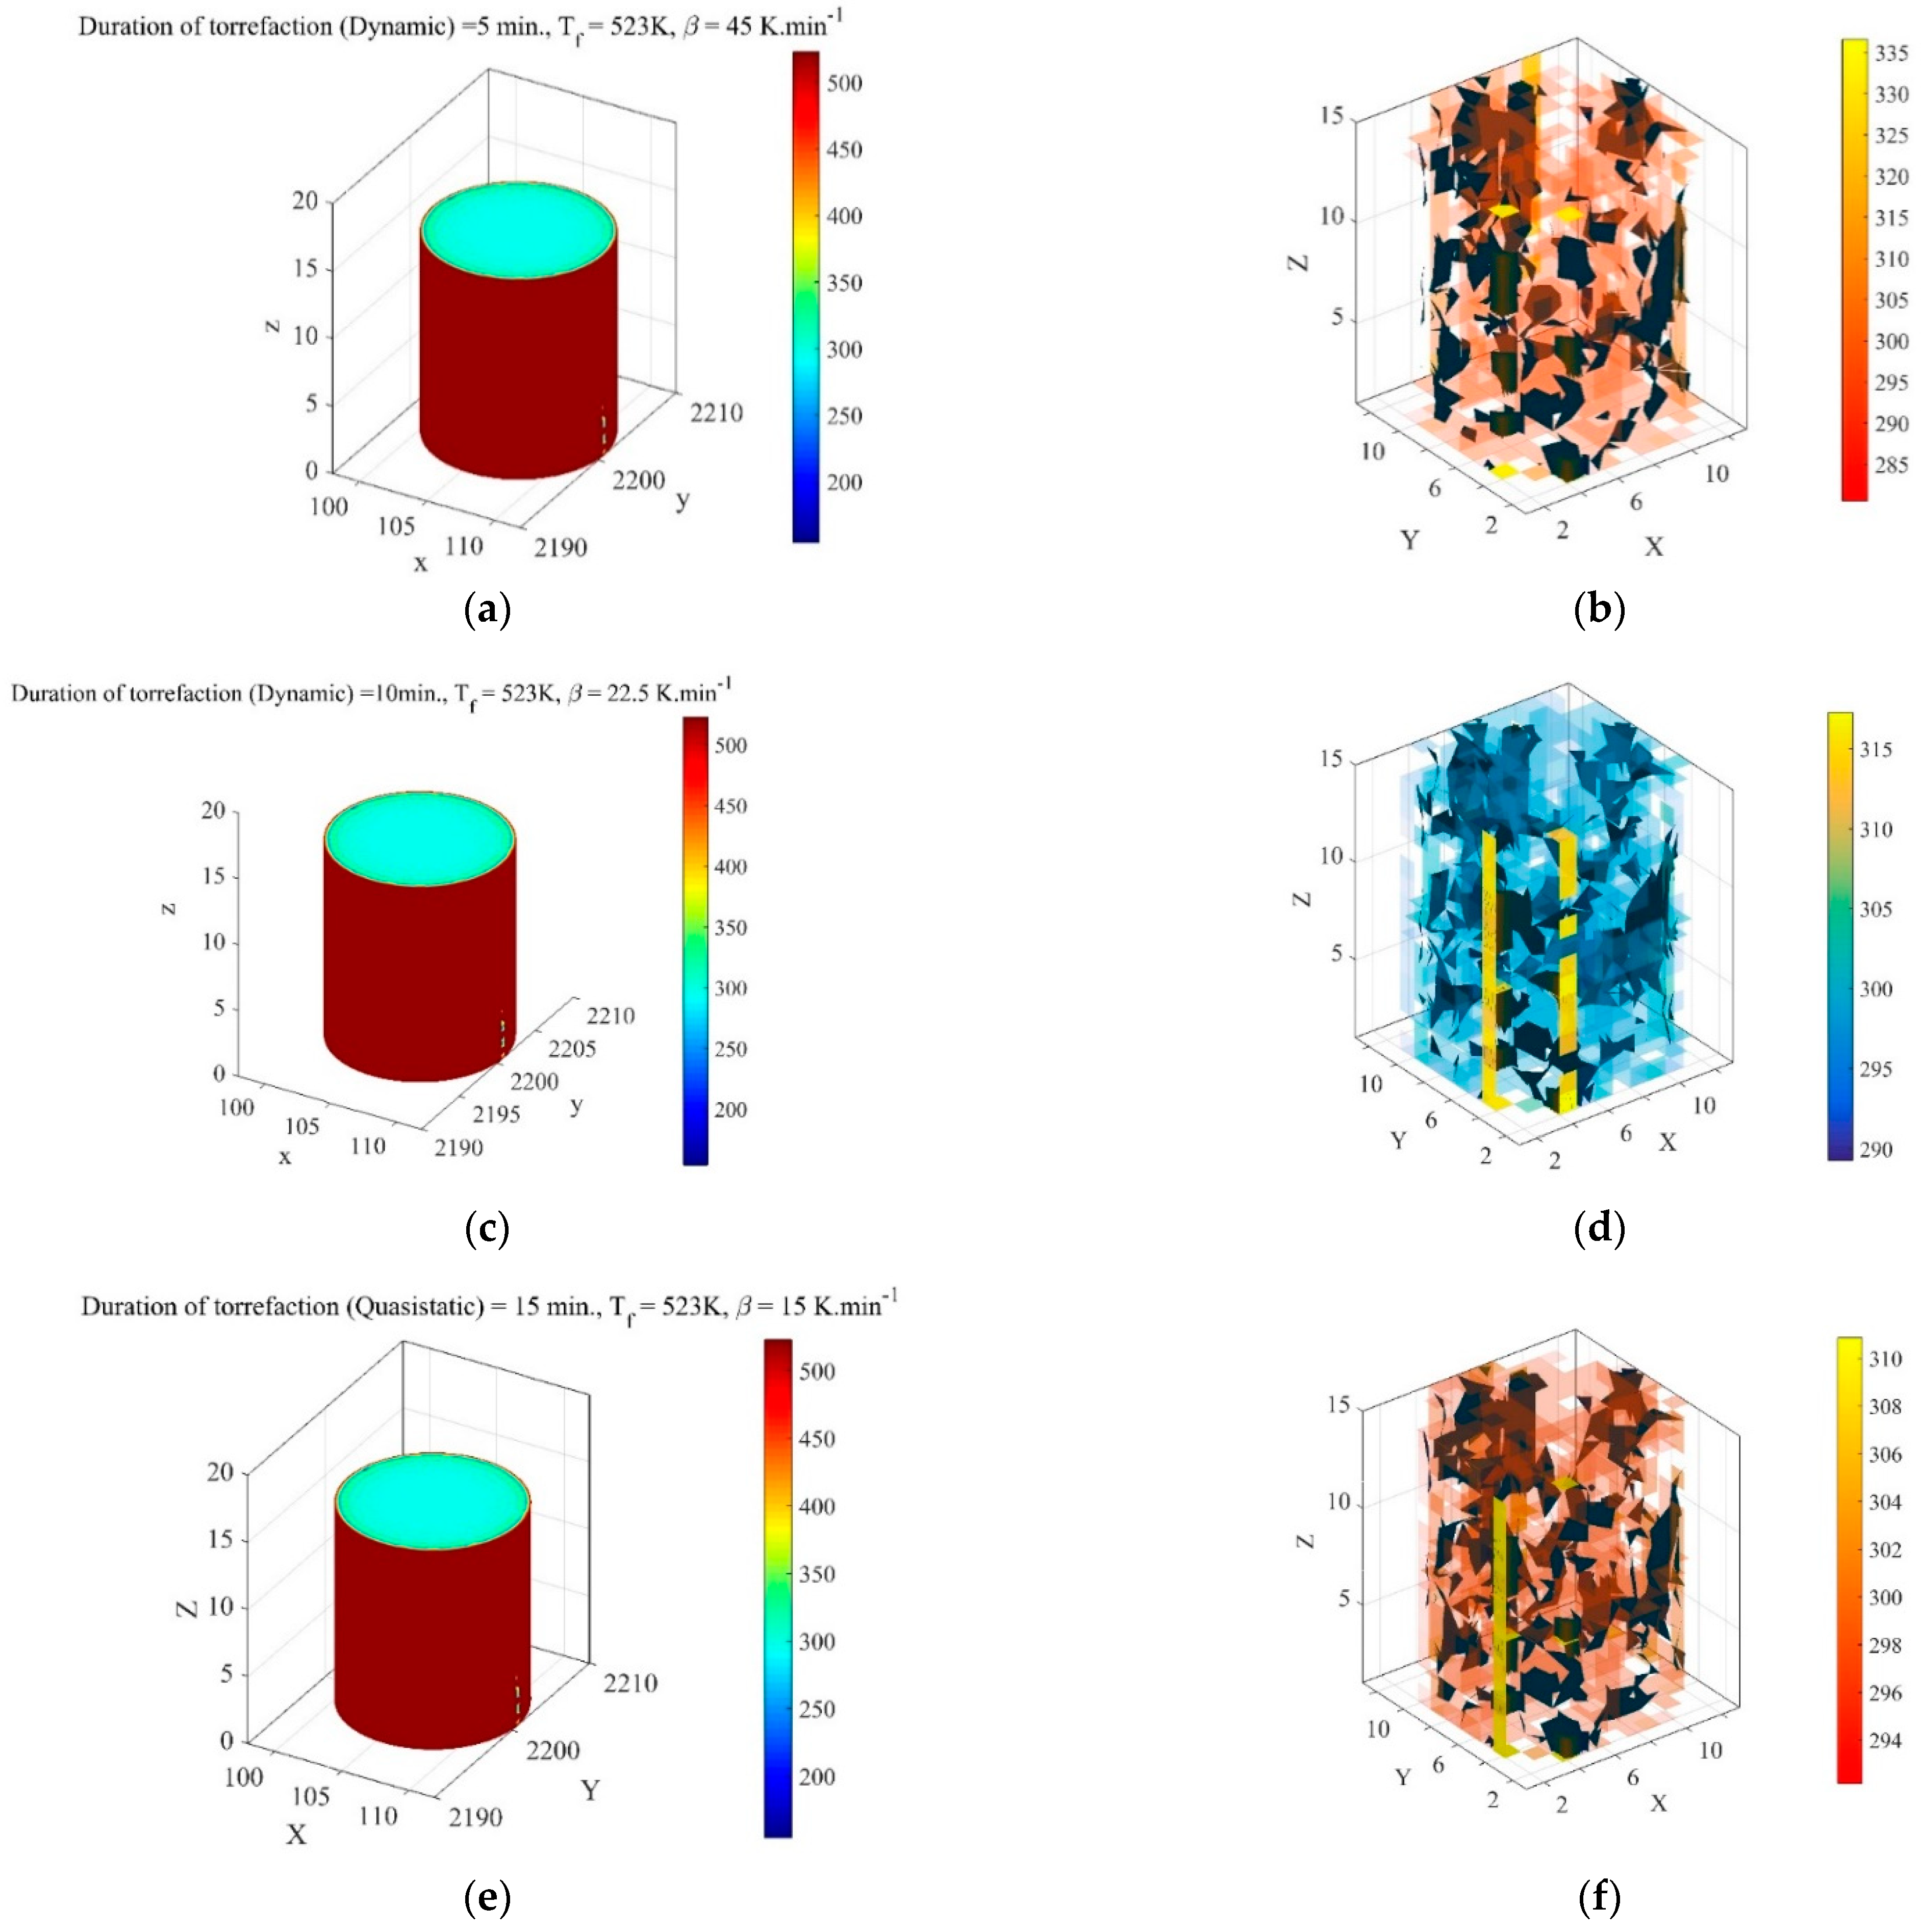
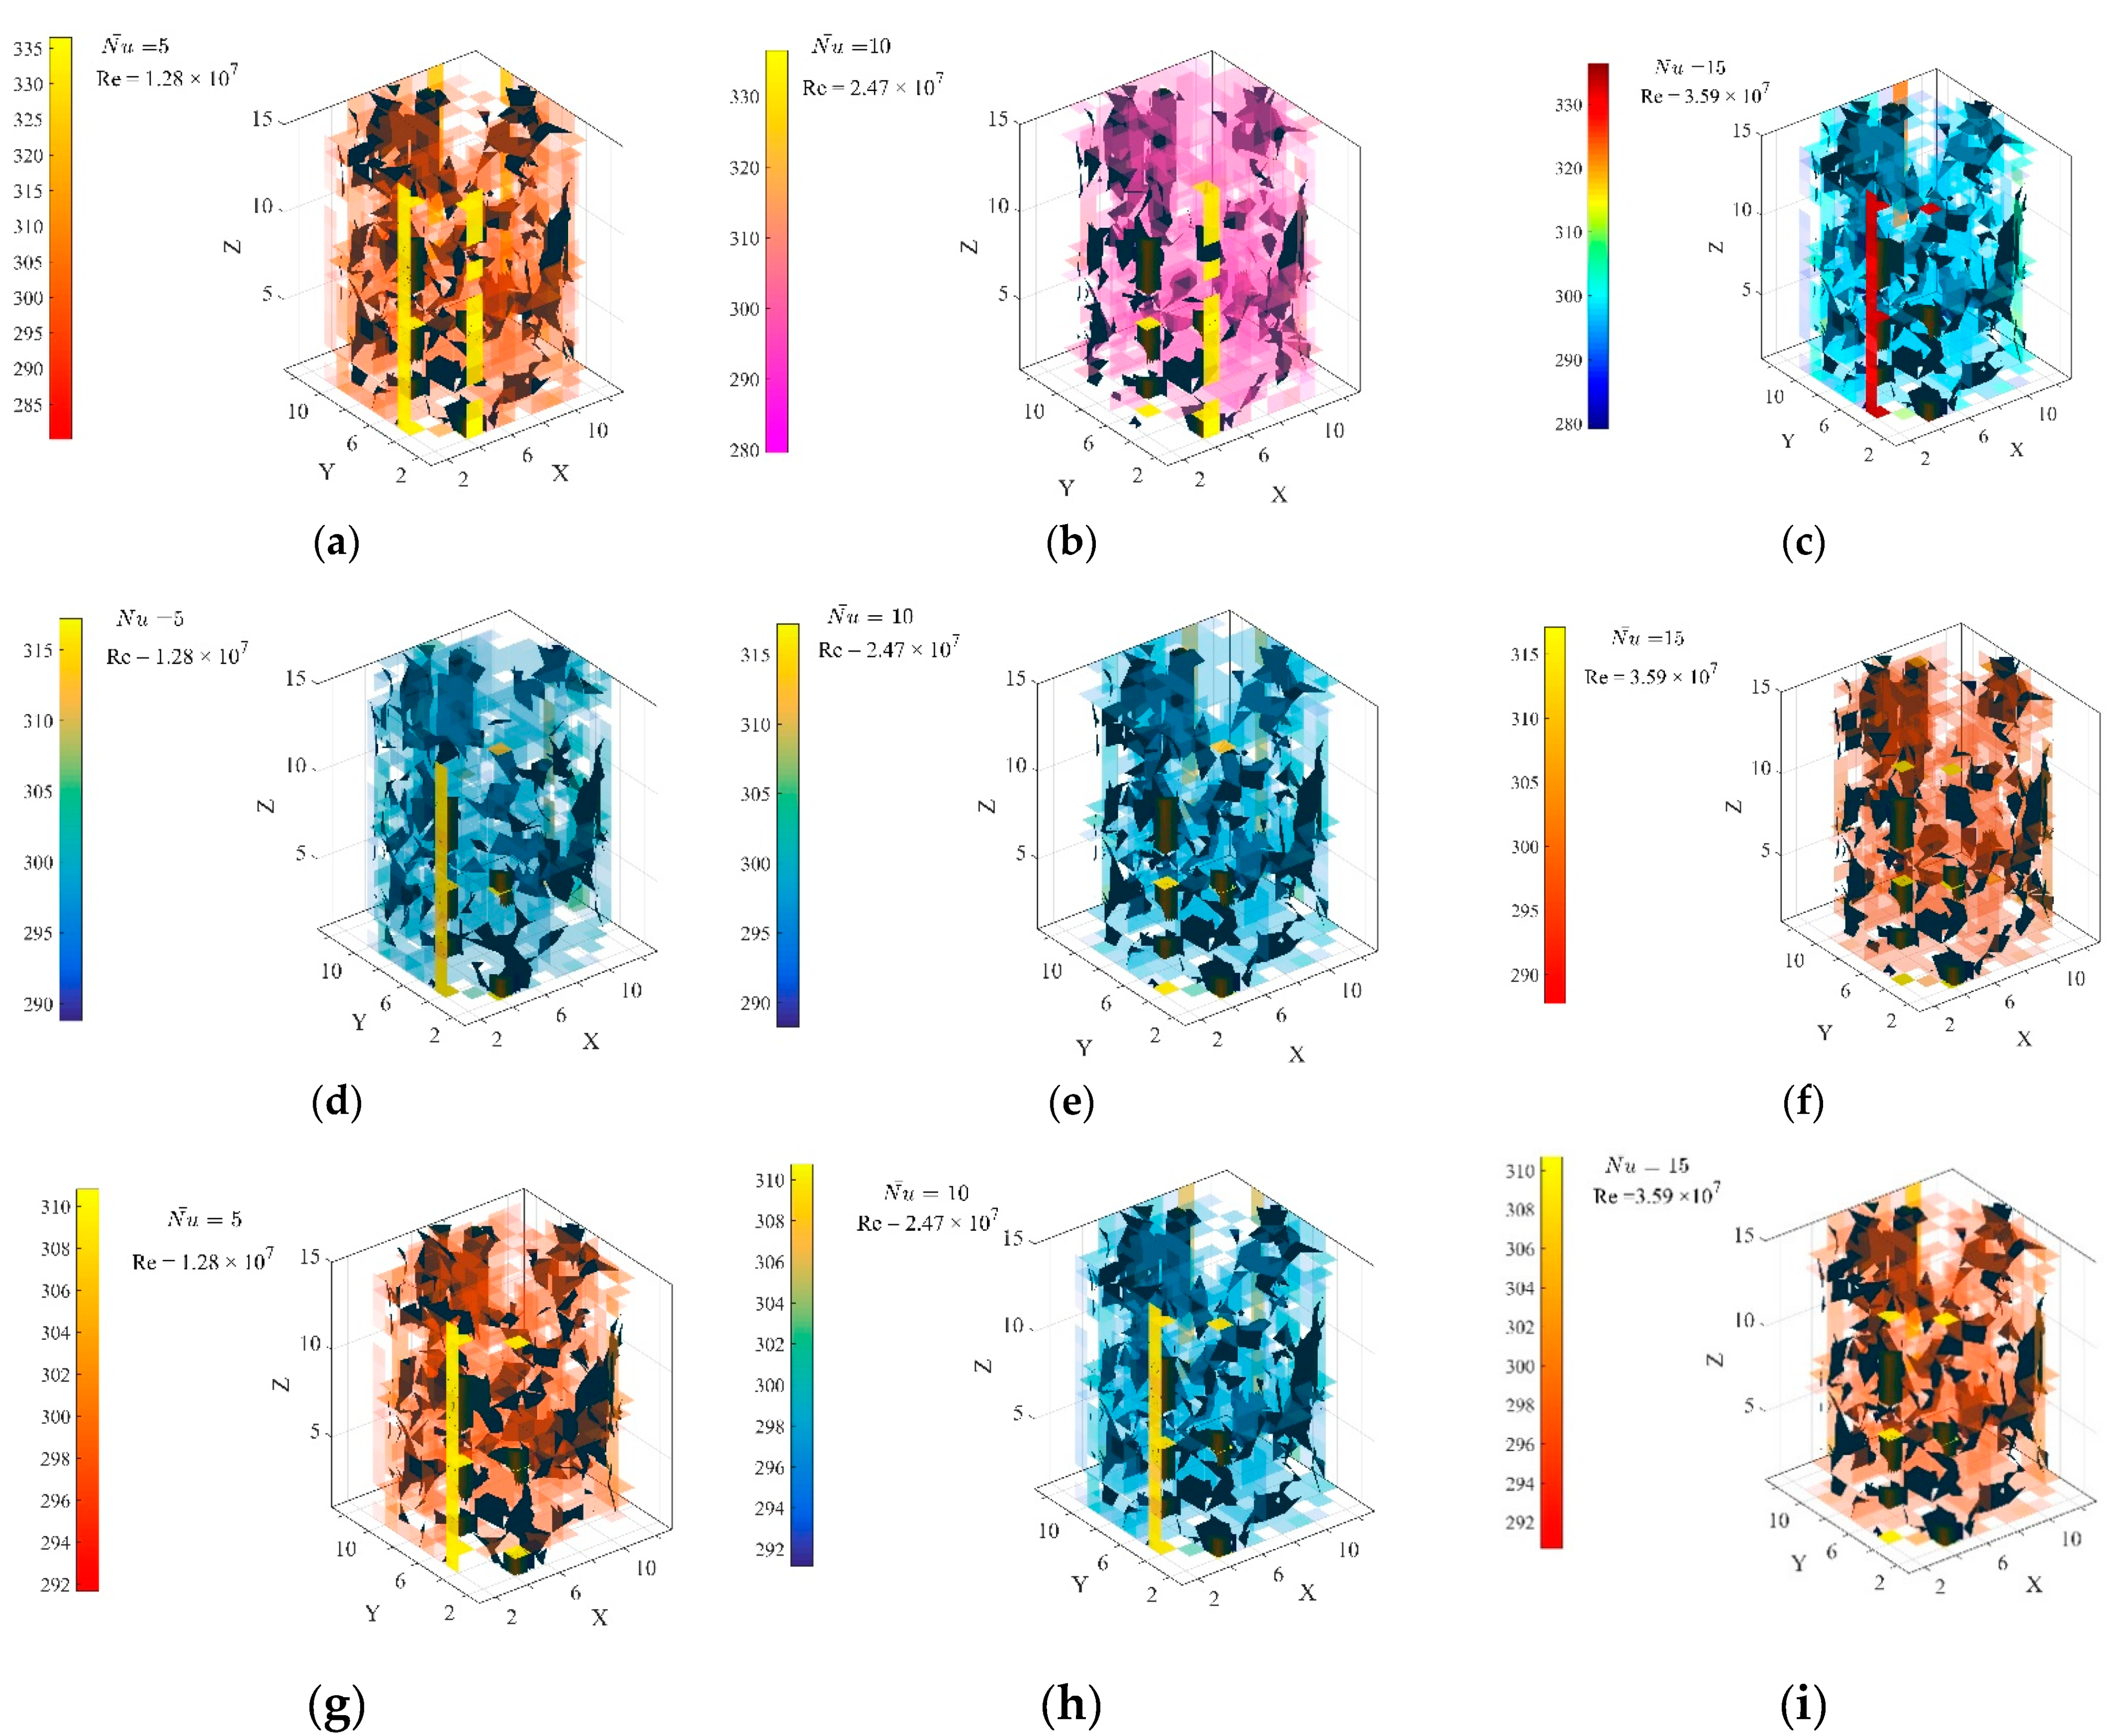
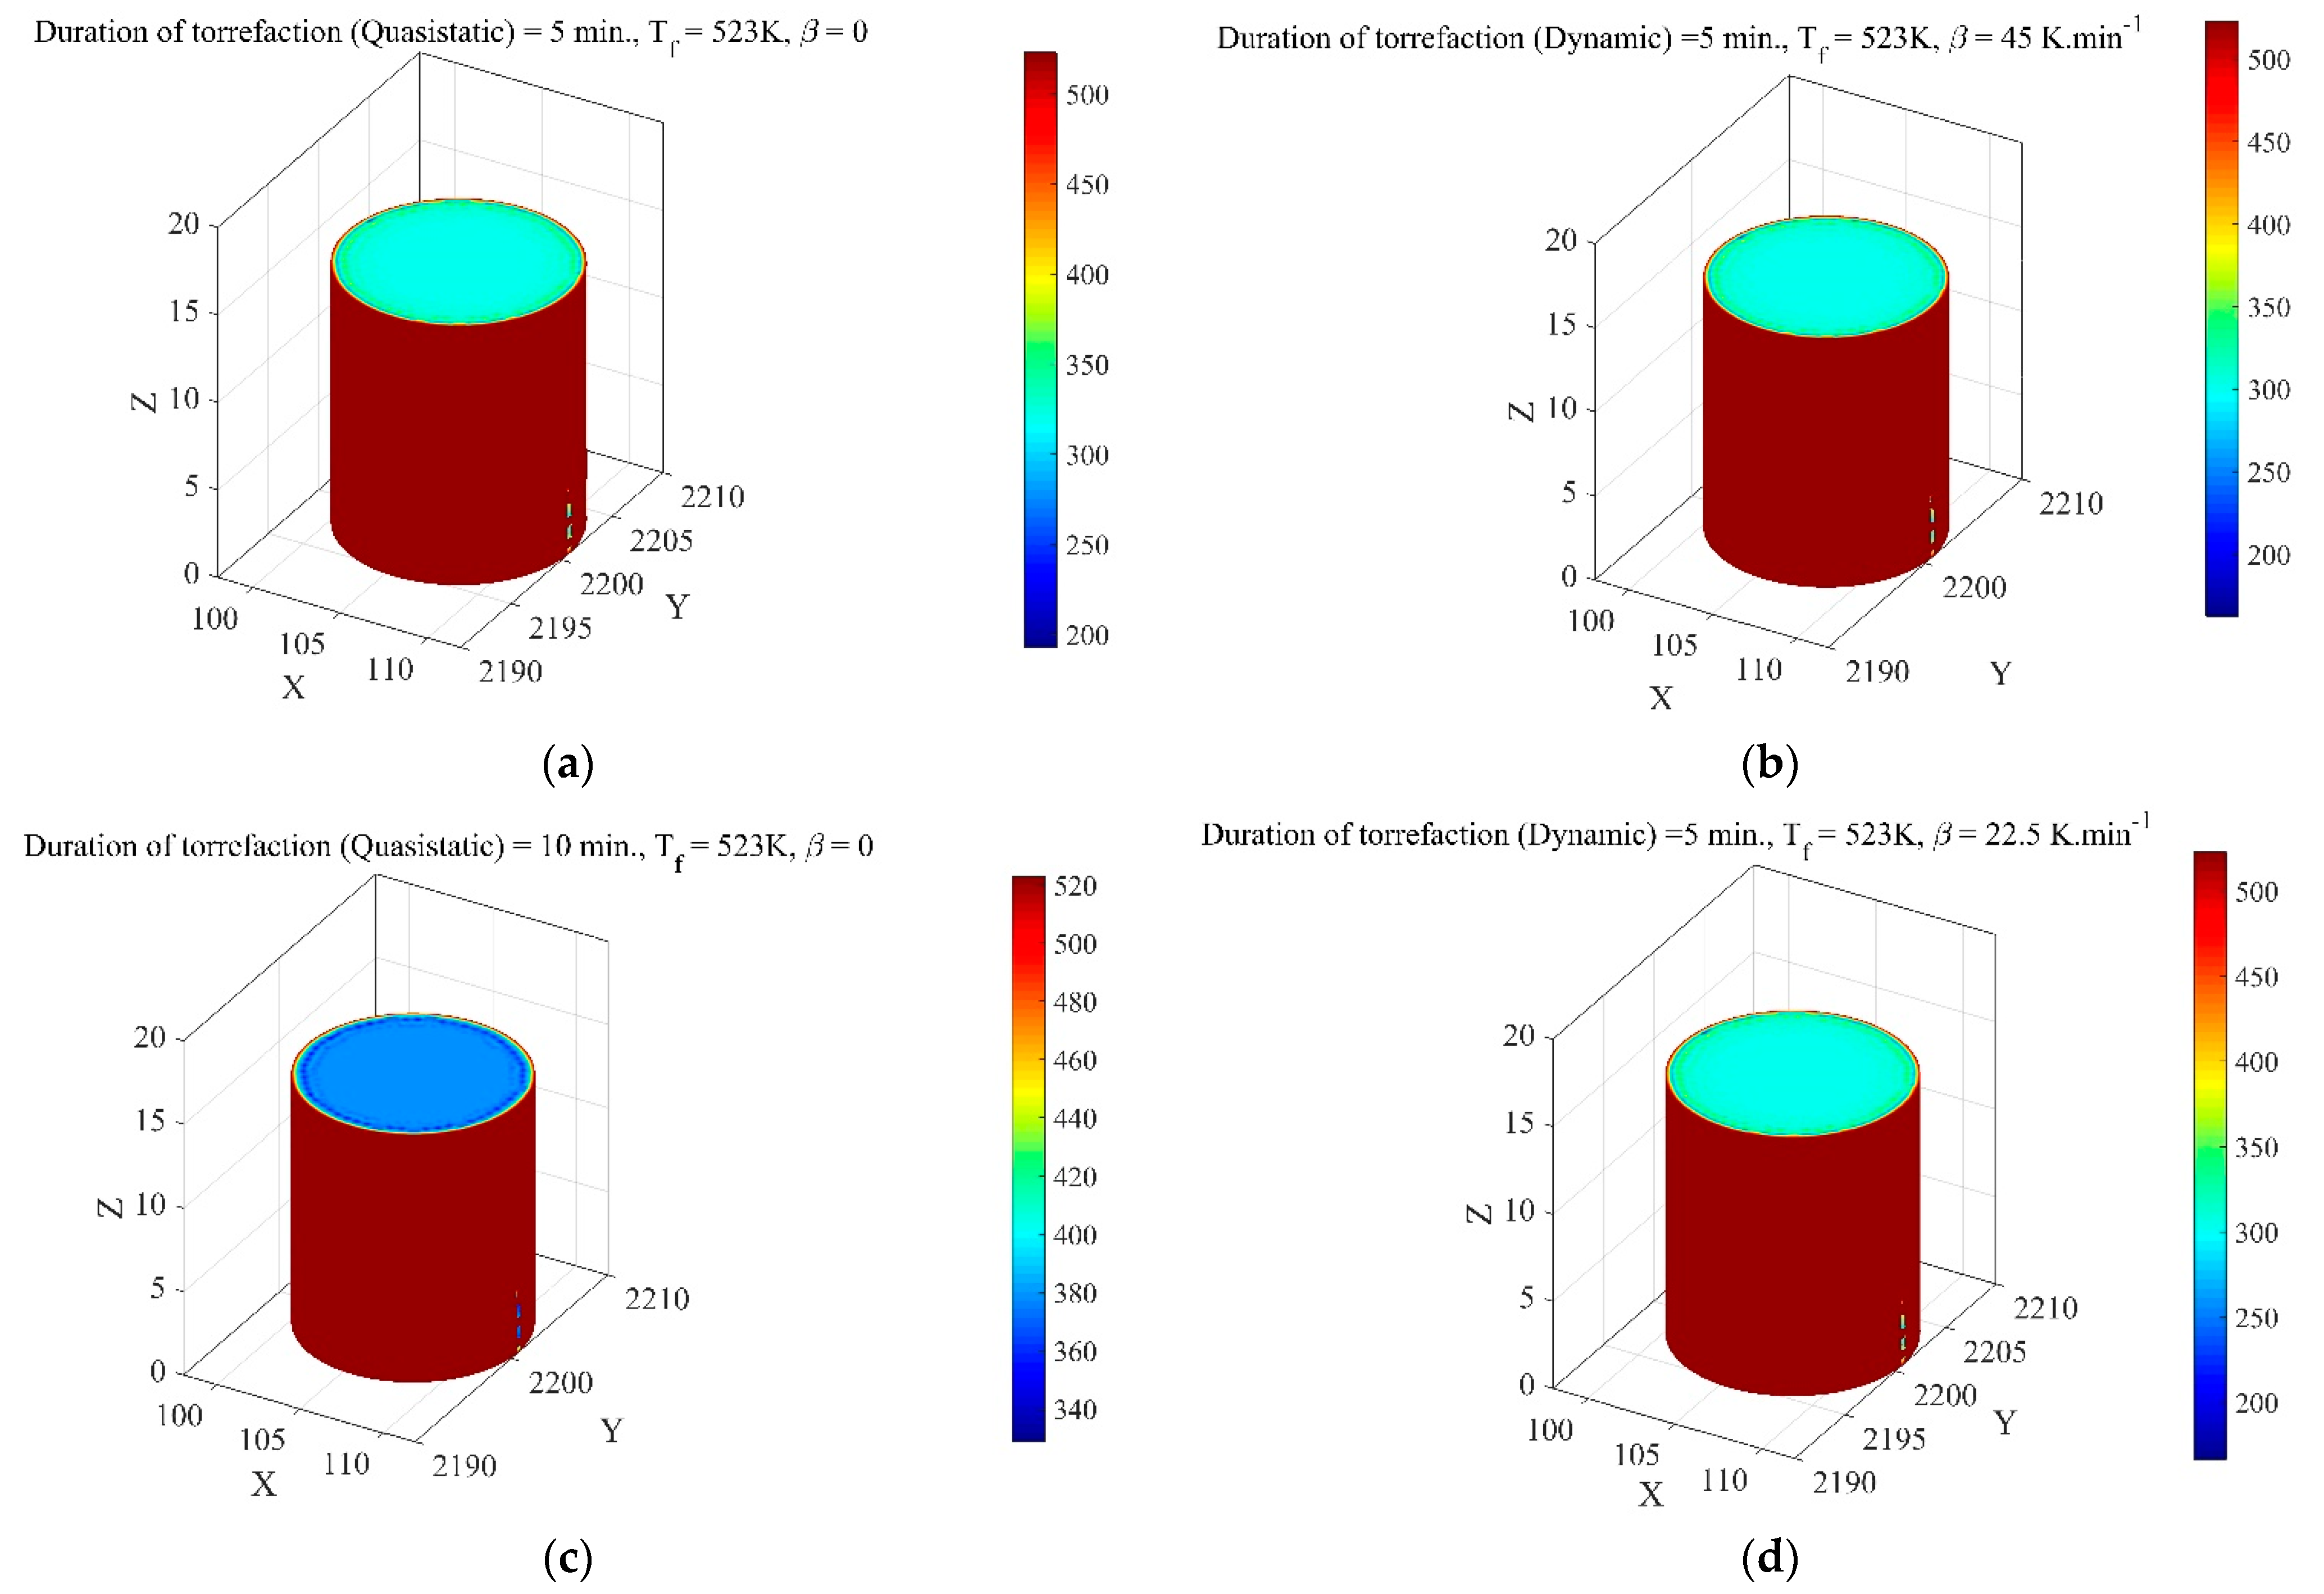
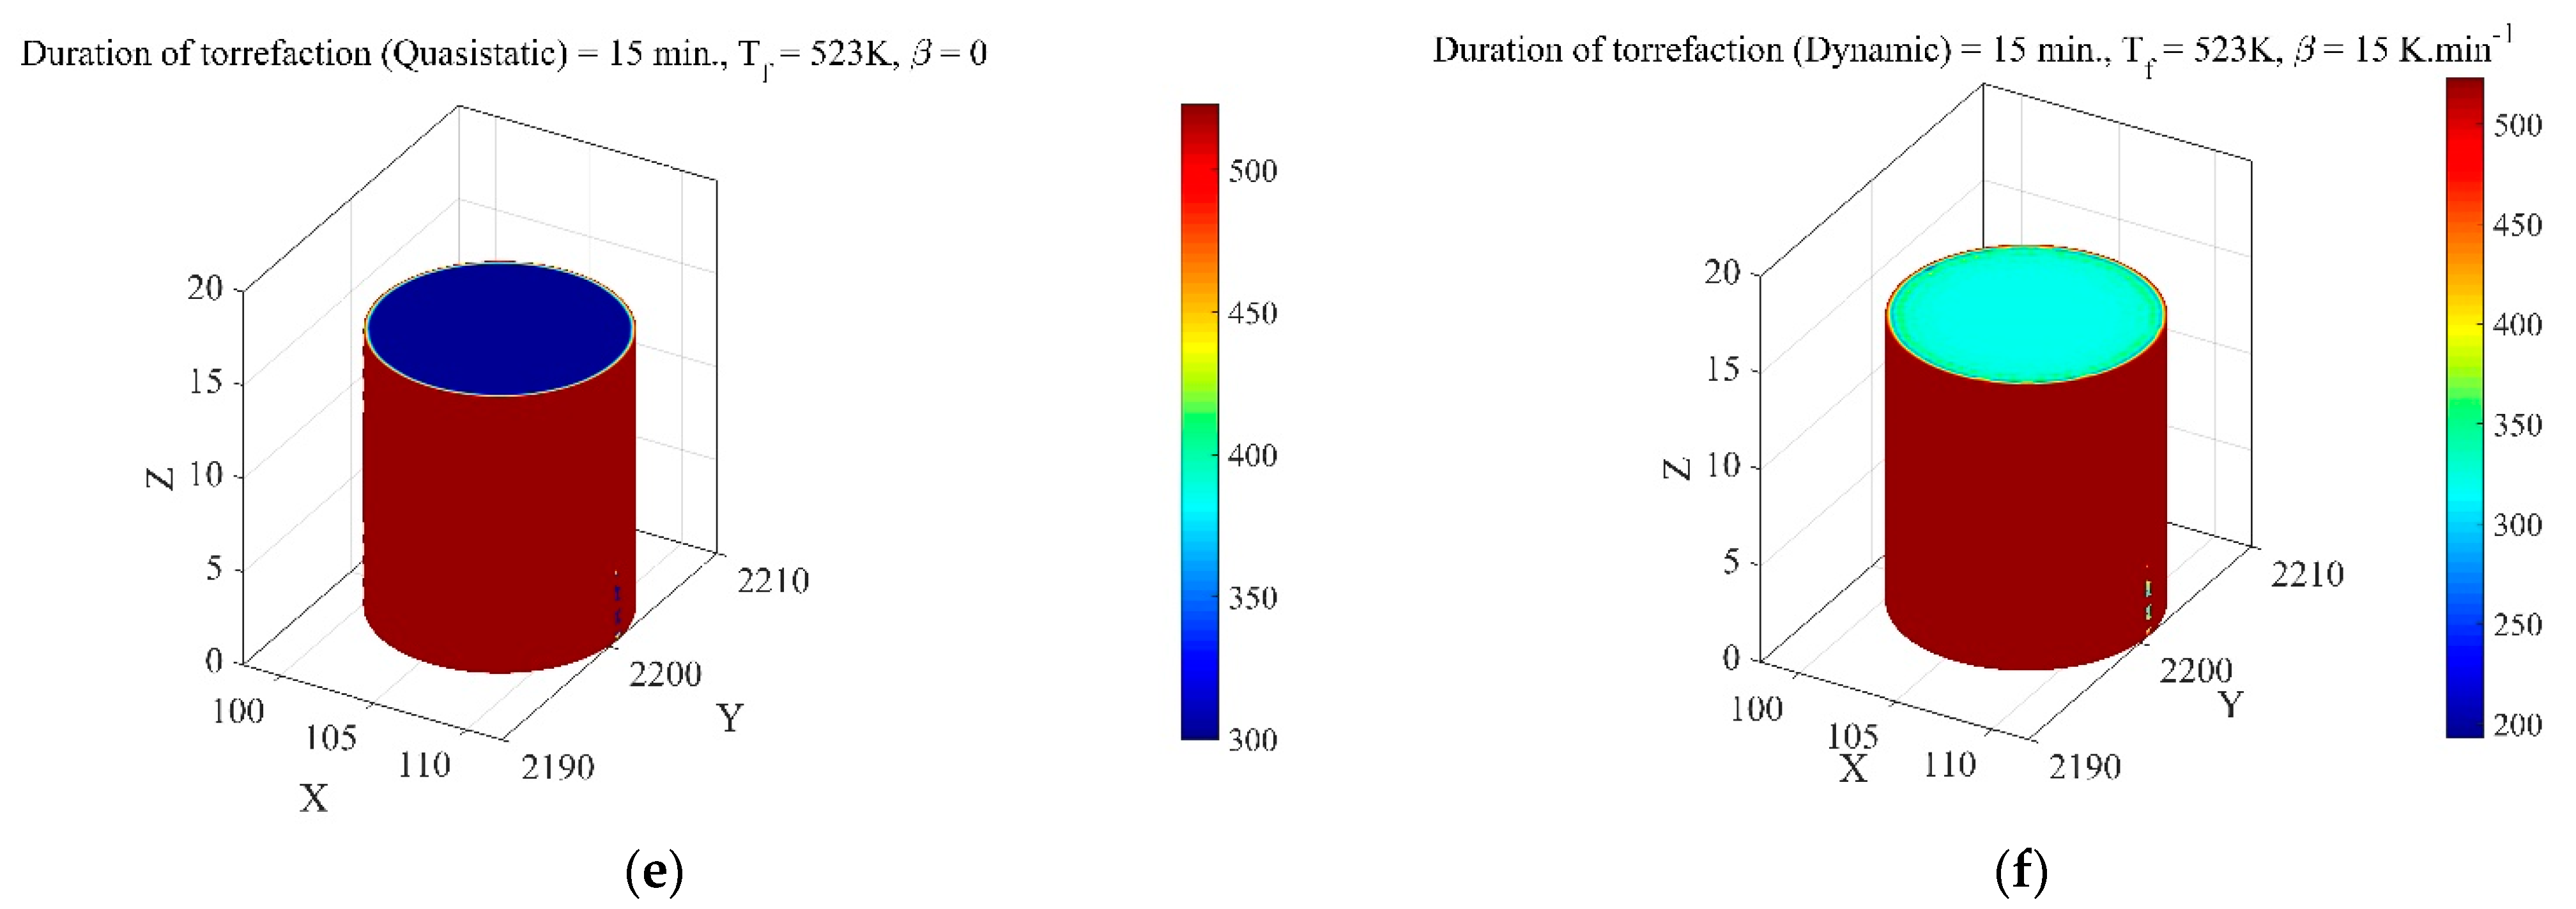
The temperature distribution on the surfaces of biofuel pellets along with the interpolated solution is illustrated in Figure 4 at different processing times. It was noticed that the variation in temperature distribution (τ = 5 min) for a quasi-static condition at constant heat supply is unperceivable and it affected merely the surfaces embedded between the interior and outer regions of the biofuel pellets (Figure 4a). The temperature variation was found to be in the range of 500–523 K at the mesh points, whereas it varied from 400 to 450 K in the intermediate mesh region of the biofuel pellets. The interior zone of the pellet remained at a constant temperature of 300–350 K. Apart from the jiggled mesh points, through the slicing of the biofuel pellets into three different planes along each Cartesian axis, it was observed that the overall change in temperature along the tangential plane to the pellet surface would vary from 420 to 480 K. A temperature drop of 19–21% was noticed along the radial direction of the pellet. With the increase in processing duration, the temperature range was reduced, and the interior temperature of the pellet increased by 14–16% (Figure 4d,e). There was no drift found in the surface temperature of pellets at the mesh points, but the drift was observed in the central plane of the biofuel pellets (Figure 4c,e). The local temperature of a pellet was computed to be reduced by 66%. The effect of average Nusselt () and Reynold (Re) numbers of an inert atmosphere on the local temperature distribution is shown in Figure 5. It was observed that the increase in the average value of and Re elevated the surface temperature of the pellet by 28–37% (Figure 5a–c). Similarly, the increase in the processing time of biofuel pellets had a similar effect on the local temperature of the pellet, but the effect was more localised or concentrated at a particular spatial position. The thermal gradient increased and a vast drift in temperature scale was noticed at different circumferential as well as longitudinal layers of the pellet. The temperature on the tangential plane to the pellet surface was reduced by 33%. The common solution retrieved at each processing time (τ = 5, 10, 15 min) was that the local thermal gradient on the surface was increased and thermal homogeneity was severely impacted (Figure 5). However, it was also clear from the derived solution that the average value of Nu = 10 and Re = 2.47 × 10⁷ would make torrefaction more uniform and steadier in time at a constant Prandtl number and applied pressure of 1.5 bar. Further increasing the Nu and Re would affect the temperature distribution and advection of volatile components by nitrogen gas, which would eventually reduce the propagation of thermal energy at solid boundaries of biofuel pellets. The effect of changing thermal conditions on the local thermal gradient is shown in Figure 6. In a quasi-static condition, the thermal gradient would predominantly appear on the tangential planes, whereas it would be more concentrated at the interior cross-sectional planes of the pellet. From the quiver plot, irrespective of processing time, it was noticed that the quasi-static state of the control volume would have the least drift in its interior solid temperature, while a remarkable change in temperature distribution across various layers would be noticed in the dynamic state. Moreover, it would also influence the flow and residence time of the gases. This happens due to an increase in the pressure-driven flow across the pellet. The higher heating rate experienced at the interior would reduce the intra-particle residence time and eventually reduce the cross-linking, repolymerisation and cracking of the pellets [18]. Consequently, deterrence to the autocatalytic reaction would hamper heat transfer between the cooler pellet layers and the volatile gases. The higher deviation in temperature distribution also makes these volatile gases condense on the surface of the pellet. To support this fact, the effect of dynamic ramping of furnace temperature at the generated mesh points as well as at interpolated points is illustrated in Figure 7. It was noticed through a thermal model (Figure 7a,c,e) of a biofuel pellet that there was a 25% increase in temperature in the intermediate layers of the biofuel pellets, which was correspondingly 42% in a quasi-static condition. The only difference between dynamic and quasi-static was in the isothermal region between the core and outer surface of the pellet. A sporadic or discontinuity in the isothermal domain was found while the biofuel was subjected to a time-dependent thermal history. Thus, the temperature would be rather more homogeneous in quasi-static states of a system than in a dynamic state of a system. By comparing the isosurfaces for both the thermal conditions, a fine demarcation between the thermal boundaries at the interior and exterior regions of the pellet could be seen. The numerical solution predicted the maximum temperature for a dynamic system at non-mesh points was 30% lower than that of the quasi-static condition. It implies that the overall time of processing would significantly increase if the thermal pre-treatment was performed in the Joule heating system for a time-dependent thermal history. Moreover, the overall cost of production of torrefied pellets in a dynamic condition would also be very high to achieve the desired level of torrefaction. A reduction in the processing time of pine pellets or an increase in the ramp rate of the furnace would also increase the temperature scale, with higher uncertainties in the interpolated solution. According to the isosurface plot (Figure 7b,d,f), the temperature of biofuel pellets would vary from 285 to 335 K, which is 6.4% higher than the temperature scale required for processing biofuel for 10 min, whereas this gap further widened by 8% when the same biofuel pellet was held for 15 min in the Joule heating system. A similar reduction in the temperature domain with time was observed for both quasi-static and dynamic types of torrefaction. The temperature of the biofuel pellets was found to reach thermal homogeneity with increasing processing time, whereas, in the case of the quasi-static condition, an inhomogeneous characteristic in the temperature scale along the different slicing planes was found. In other words, the transfer of heat flux along the sectional planes would be much faster with the increase in the processing time, whereas it tends to be constant in dynamic conditions. The effect of average Nusselt () and Re numbers on the temperature distribution of biofuel pellets in the time-dependent heating of biofuel is illustrated in Figure 8. As compared to the quasi-static condition, the temperature profile at different sectional planes would be severely impacted by the simultaneous increase in the Nu and Re numbers. Unlike the phenomenon of redistribution of the thermal profile without affecting its magnitude on the sectional plane in the quasi-static condition of torrefaction, the temperature along the slicing planes is reduced by 1.2% to 1.8% at a constant inert gas pressure of 1.5 bar. However, the effect of nitrogen gas was found to be restrained with the increase in the torrefaction duration, and the redistribution of temperature across the slicing profile was not noticeable. Though the temperature range remained constant, an overall drop in the local temperature along the tangential plane was noticed for τ = 10 and 15 min. The temperature would be fairly constant during the torrefaction process if the average Nusselt and Reynold numbers remained low for a dynamic condition. The effect of processing time on temperature distribution at constant values of Nusselt and Reynold numbers would be on the magnitude as well as on the range of temperature scale. A significant change in thermal energy along the curvature of biofuel and in the radial direction can be estimated by applying time-dependent heat flux for both the quasi-static and dynamic conditions.
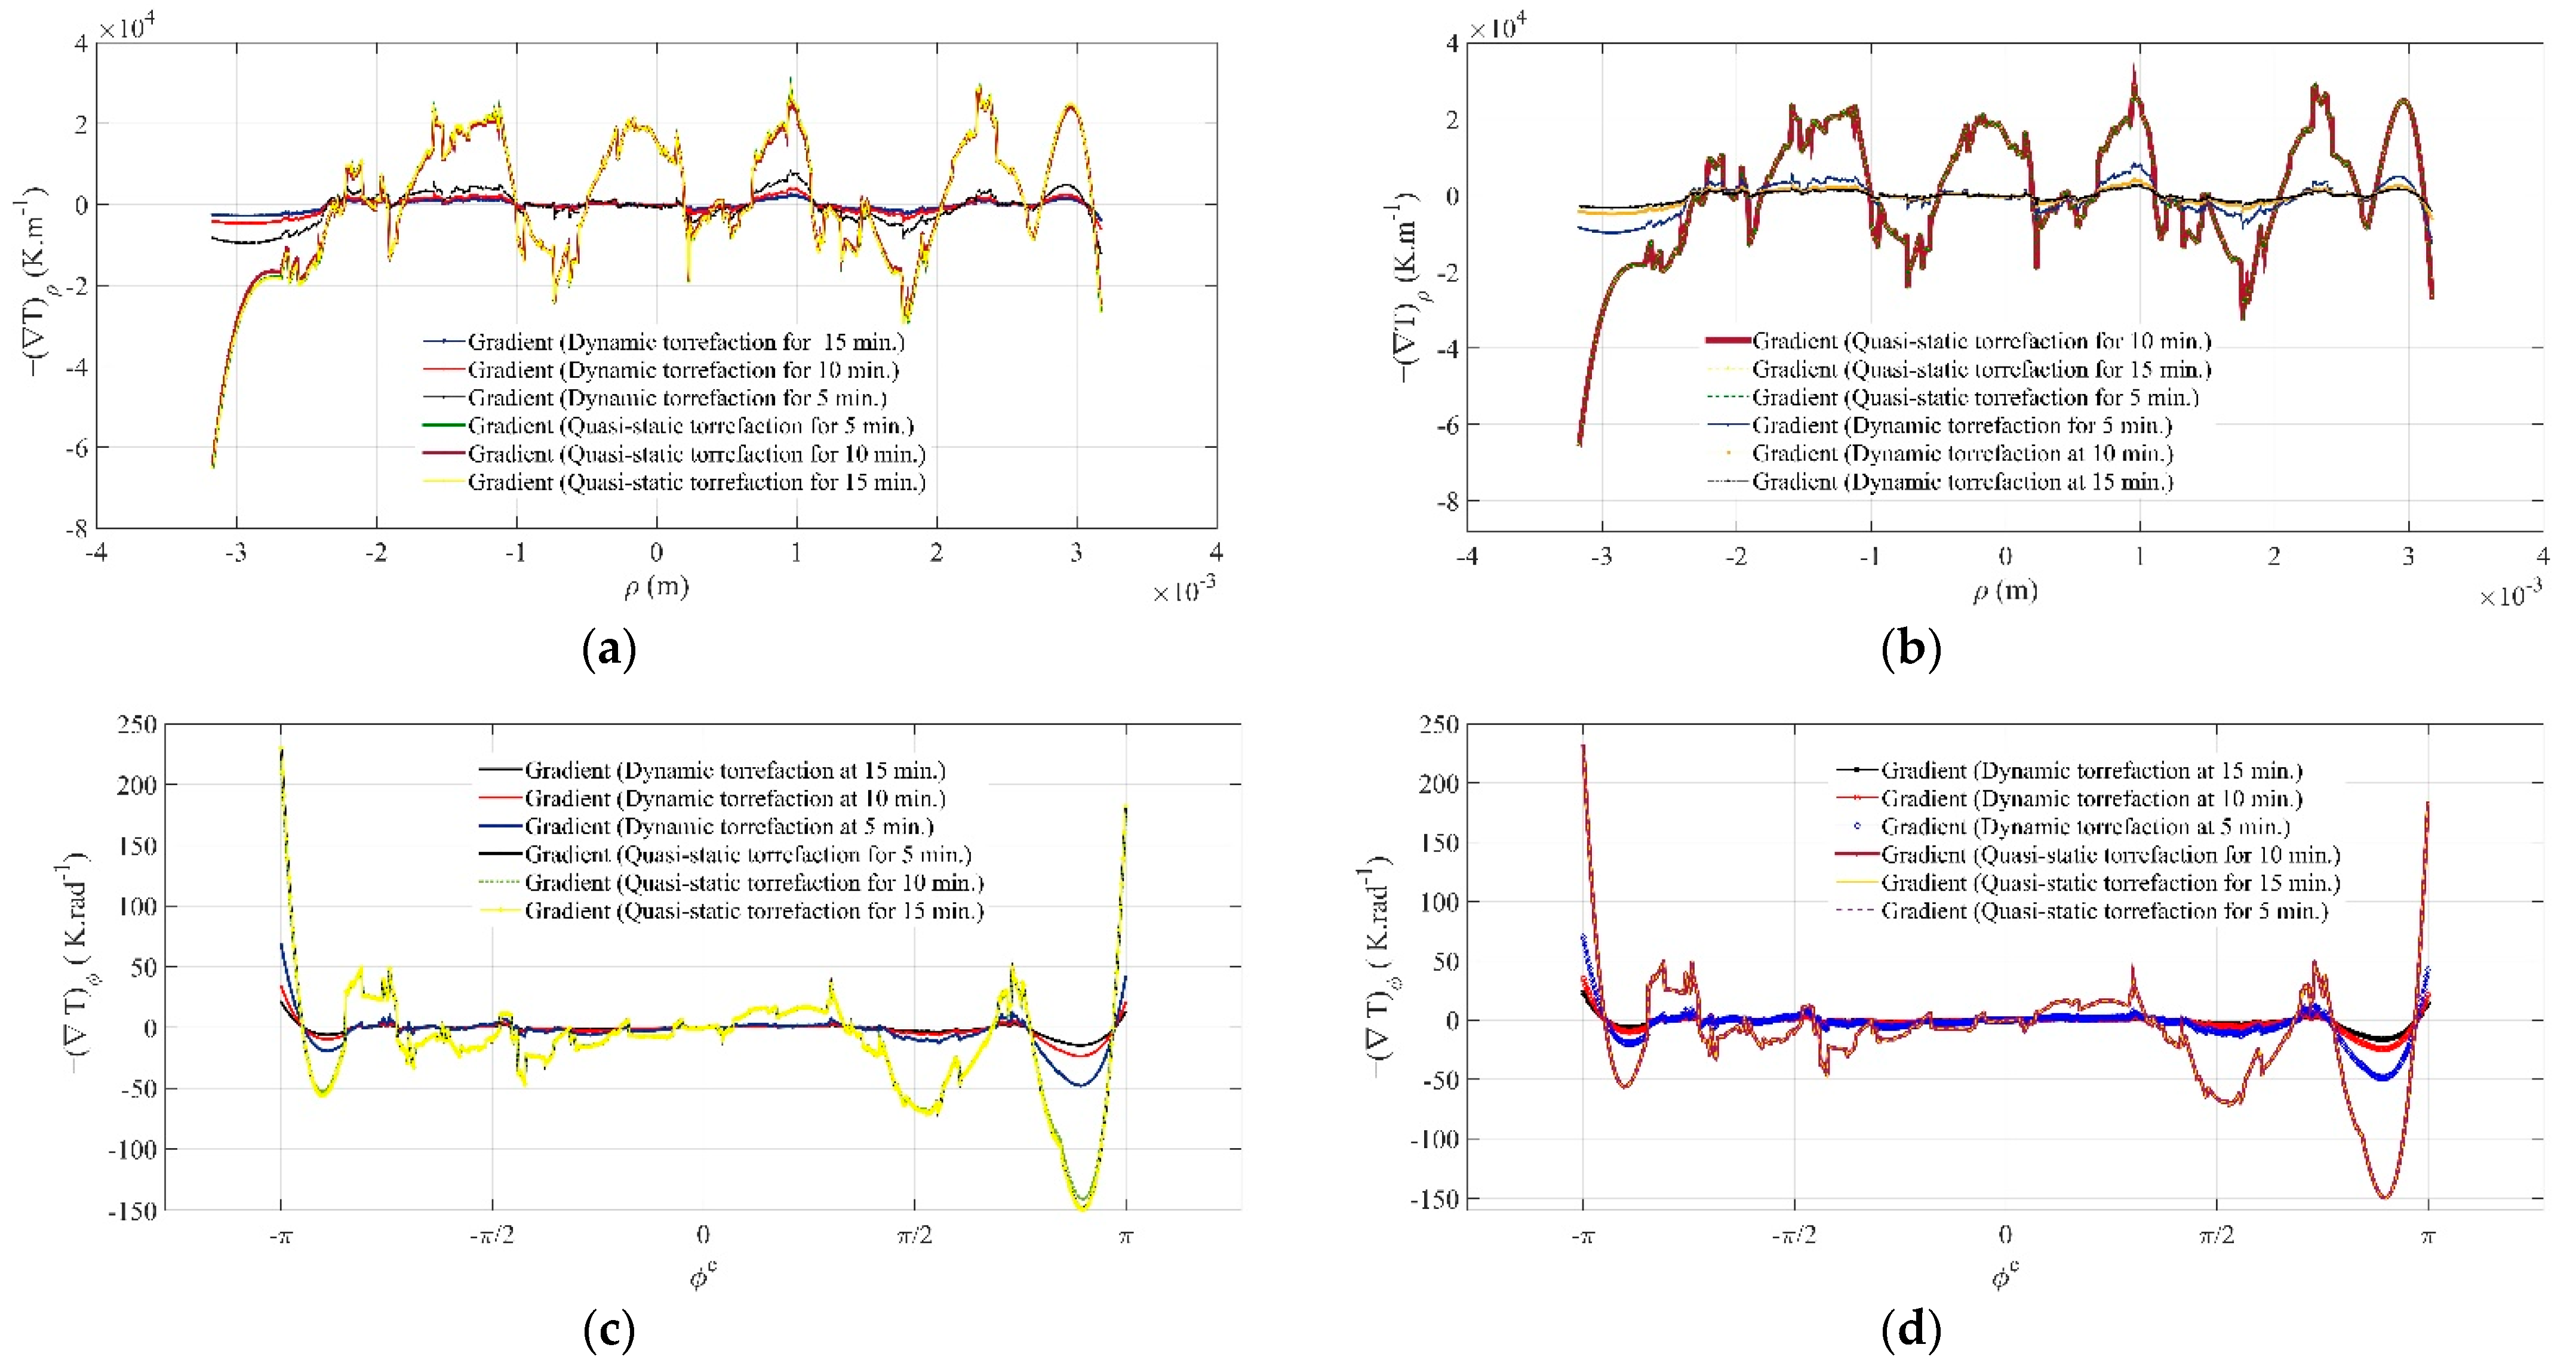
The temperature gradient along the polar coordinate under both varying and constant heat of a furnace is provided in Figure 9. It was noticed that the temperature gradient along the radial direction (Figure 9a,b) would marginally deviate with the increasing torrefaction duration. Consequently, the change in heat flux across the pellet would be imperceptible. On the other hand, deviation in the heat flux with time would substantially increase along the outer surface of the biofuel pellets when carrying out torrefaction in dynamic condition. Comparatively, the magnitude of the thermal gradient along the radial direction would be much higher in the quasi-static condition than that of a time-dependent thermal history. For the quasi-static state of the Joule heating system, the heat flux at the centre of the biofuel pellet was found to initially increase with torrefaction time. With a further increase in the torrefaction time, a drop of 4.4% was recorded in the heat flux. On the contrary, a surge of 3.75% was noticed when the torrefaction duration was increased by 5 min. The reverse trend was seen in the vicinity of the outer surfaces of the biofuel pellets. Initially, on the right layer of the biofuel pellet, the heat flux was found to be decreased by 36% as the torrefaction time increased by 5 min, and it suddenly increased by 41% when torrefaction time increased to 15 min. The cosine characteristic of the thermal gradient along the radial plane was noticed for the quasi-static condition. The thermal pre-treatment under the dynamic condition was seen to follow a similar trend, but the direction of heat flux was reversed at the centre of the biofuel pellet. Unlike quasi-static heating, the heat flux would increase with increasing torrefaction time under the dynamic state of the system. The heat flux increased by 50.42% as torrefaction time increased by 5 min. With a further elevation of processing duration, the heat flux was estimated to rise to 39.53%. It was noticed that the magnitude of the reversal of heat flow was reduced when the torrefaction duration was increased. This implies that heat transport would significantly influence the diffusion of volatile gases and the evaporation of water molecules. If it is noticed near the outer layers of biofuel pellets, a reverse pattern would be seen. The heat flux in the outer zone of the pellet was predominately flowing towards the core of the pellet and the heat flux increased with a decrease in processing time. A drastic drop of 52.17% in the heat flux was estimated at the outer region of the pellets when the torrefaction time was increased by 5 min. Upon a further increase in the processing time, the heat flux was additionally reduced by 39.52%. At a constant torrefaction time, the heat flux at the quasi-static state was computed to be five times higher than that under the dynamic state of the system. This implies that both the thermal conditions are accompanied by an alternating change in heat flux and thermal gradient along the radial direction of a biofuel pellet. The heat would simultaneously flow in and out with the change in the heat energy provided by the furnace. It was also noticed that the heat flux or thermal gradient was overly damped during dynamic heating of a pellet, whereas underdamped response was found for a quasi-static state of the system. This might happen due to the removal of the applied heat flux from the system in the form of thermal energy (for increasing internal energy of the pellets or absorption of heat by the fluid flowing across porous medium) if the thermal conductivity of the pellet remains independent of the grain orientation and direction of heating. This change would be more rapid if a Joule heating system was programmed in dynamic mode. For a short period of torrefaction in the dynamic heating system, the thermal gradient would succumb to the non-conservative energies at the central domain of the pellet. The overall fluctuation in the thermal gradient at the interior region of the biofuel would be insignificantly low when the thermal history follows a time-dependent function. Contrary to the varying heat supply, the characteristics of the thermal gradient along the radial direction would have a similar cosine characteristic except for a minuscule change in the magnitude of heat flux and thermal gradient at the centre and in the vicinity of the outer layers of the biofuel pellet.
Unlike the gradual increase in the inward flow of heat flux along the radial axis, it would decrease for the azimuth plane (Figure 9c,d). At ϕ = 0, the heat flux would have a similar pattern of variation as at the central axis of the biofuel pellet. The only difference in the behaviour of heat fluxes along the radial plane and azimuth plane for a quasi-static condition is the reverse characteristic. Specifically, the fluctuating heat flux would transform into an alternating heat flux, whereas it would have the opposite attribute for dynamic heating of the system. It was initially elevated when the processing time was increased from 5 min to 10 min, and with further increases in the duration of torrefaction, it reversed its path and reduced by 7.1%. However, it would be continuously increasing with the processing time when the pellet is subjected to a time-dependent thermal history. An increase of 39.51% was noticed while increasing the torrefaction time from 10 min to 15 min, whereas it was 52.15% during the initial transition of the system from 5 min to 10 min. Thus, the heat flux gap with the processing time was found to be reduced by 2% and it approached a thermal equilibrium state with increasing processing time. It must be noted that these traits are defined at a particular azimuth plane and would alter with a change in the orientation of the azimuth plane. With the further clockwise rotation of the plane,, the characteristics of thermal gradient or heat flux curves were changed from alternating to fluctuating in nature. The heat flux inside the pellet was increased by 2.5% as the thermal pre-treatment duration changed from 5 min to 10 min, whereas it was noticed that it dropped by 2.6% upon further increasing the torrefaction duration in a quasi-static state of the system. Similarly, for the dynamic or time-dependent thermal history, the thermal gradient curves at would share the same characteristic as the quasi-static system but increasing torrefaction time would make the curves asymptotic to the tangential plane to the thermal profile. The relative increase in the heat flux during a period of 5–10 min would be the same as that estimated at ϕ = 0 for a dynamic condition. This implies that the heat flux or thermal gradient would fluctuate with a constant time-dependent phase difference. If the thermal gradient along the azimuth plane is compared with a thermal gradient along the radial direction, it can be seen that the change in heat flux corresponding to the thermal gradient at a particular spatial position would be far higher in the radial plane than the azimuth plane. It can be concluded that the penetration of the applied heat flux would be much quicker in a thin specimen than in a thick one. On the other hand, the removal of heat in the form of thermal energy would be much higher along an azimuth plane than in the radial direction for a quasi-static system. The opposite is true for a dynamic condition, where the thermal gradient would be much more homogenous along the radial plane than the azimuth plane and heat would concentrate more in the circumferential region of a pellet. As in the case of the radial plane (Figure 9b), the effect of the steady heat supply (Figure 9d) would be to merely influence the magnitude of the thermal gradient or the corresponding heat flux. It would bear no relationship with the characteristics of the gradient curves.
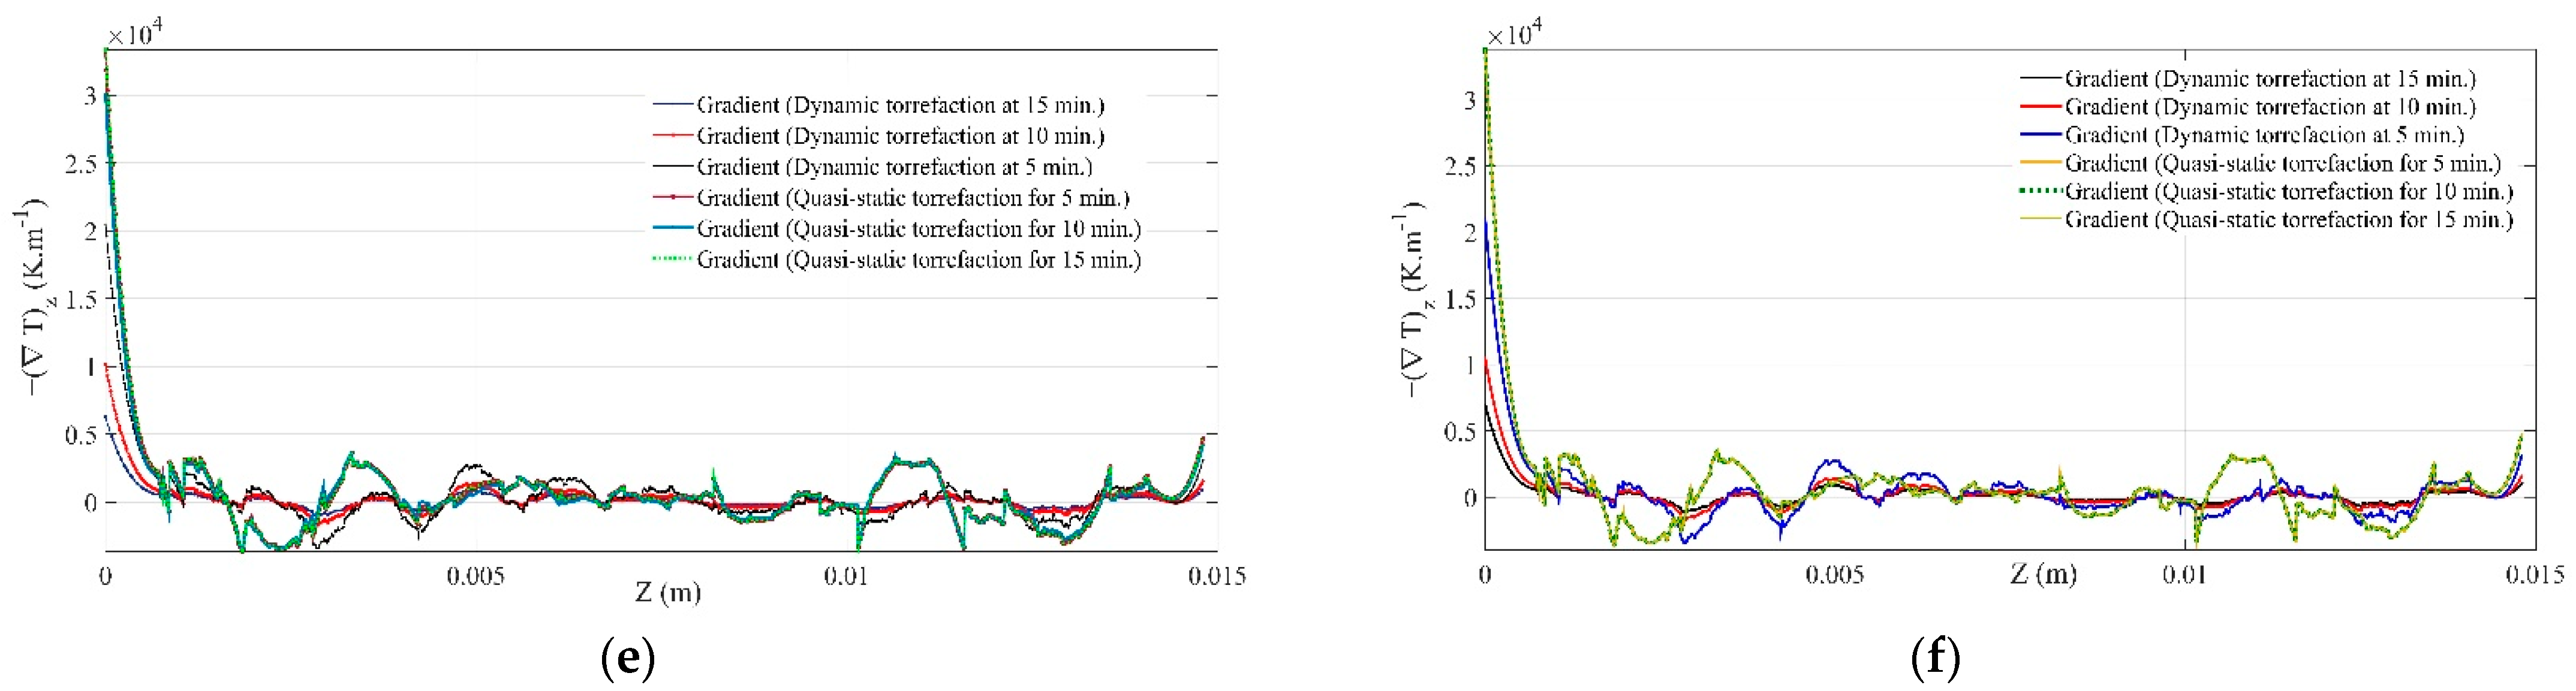
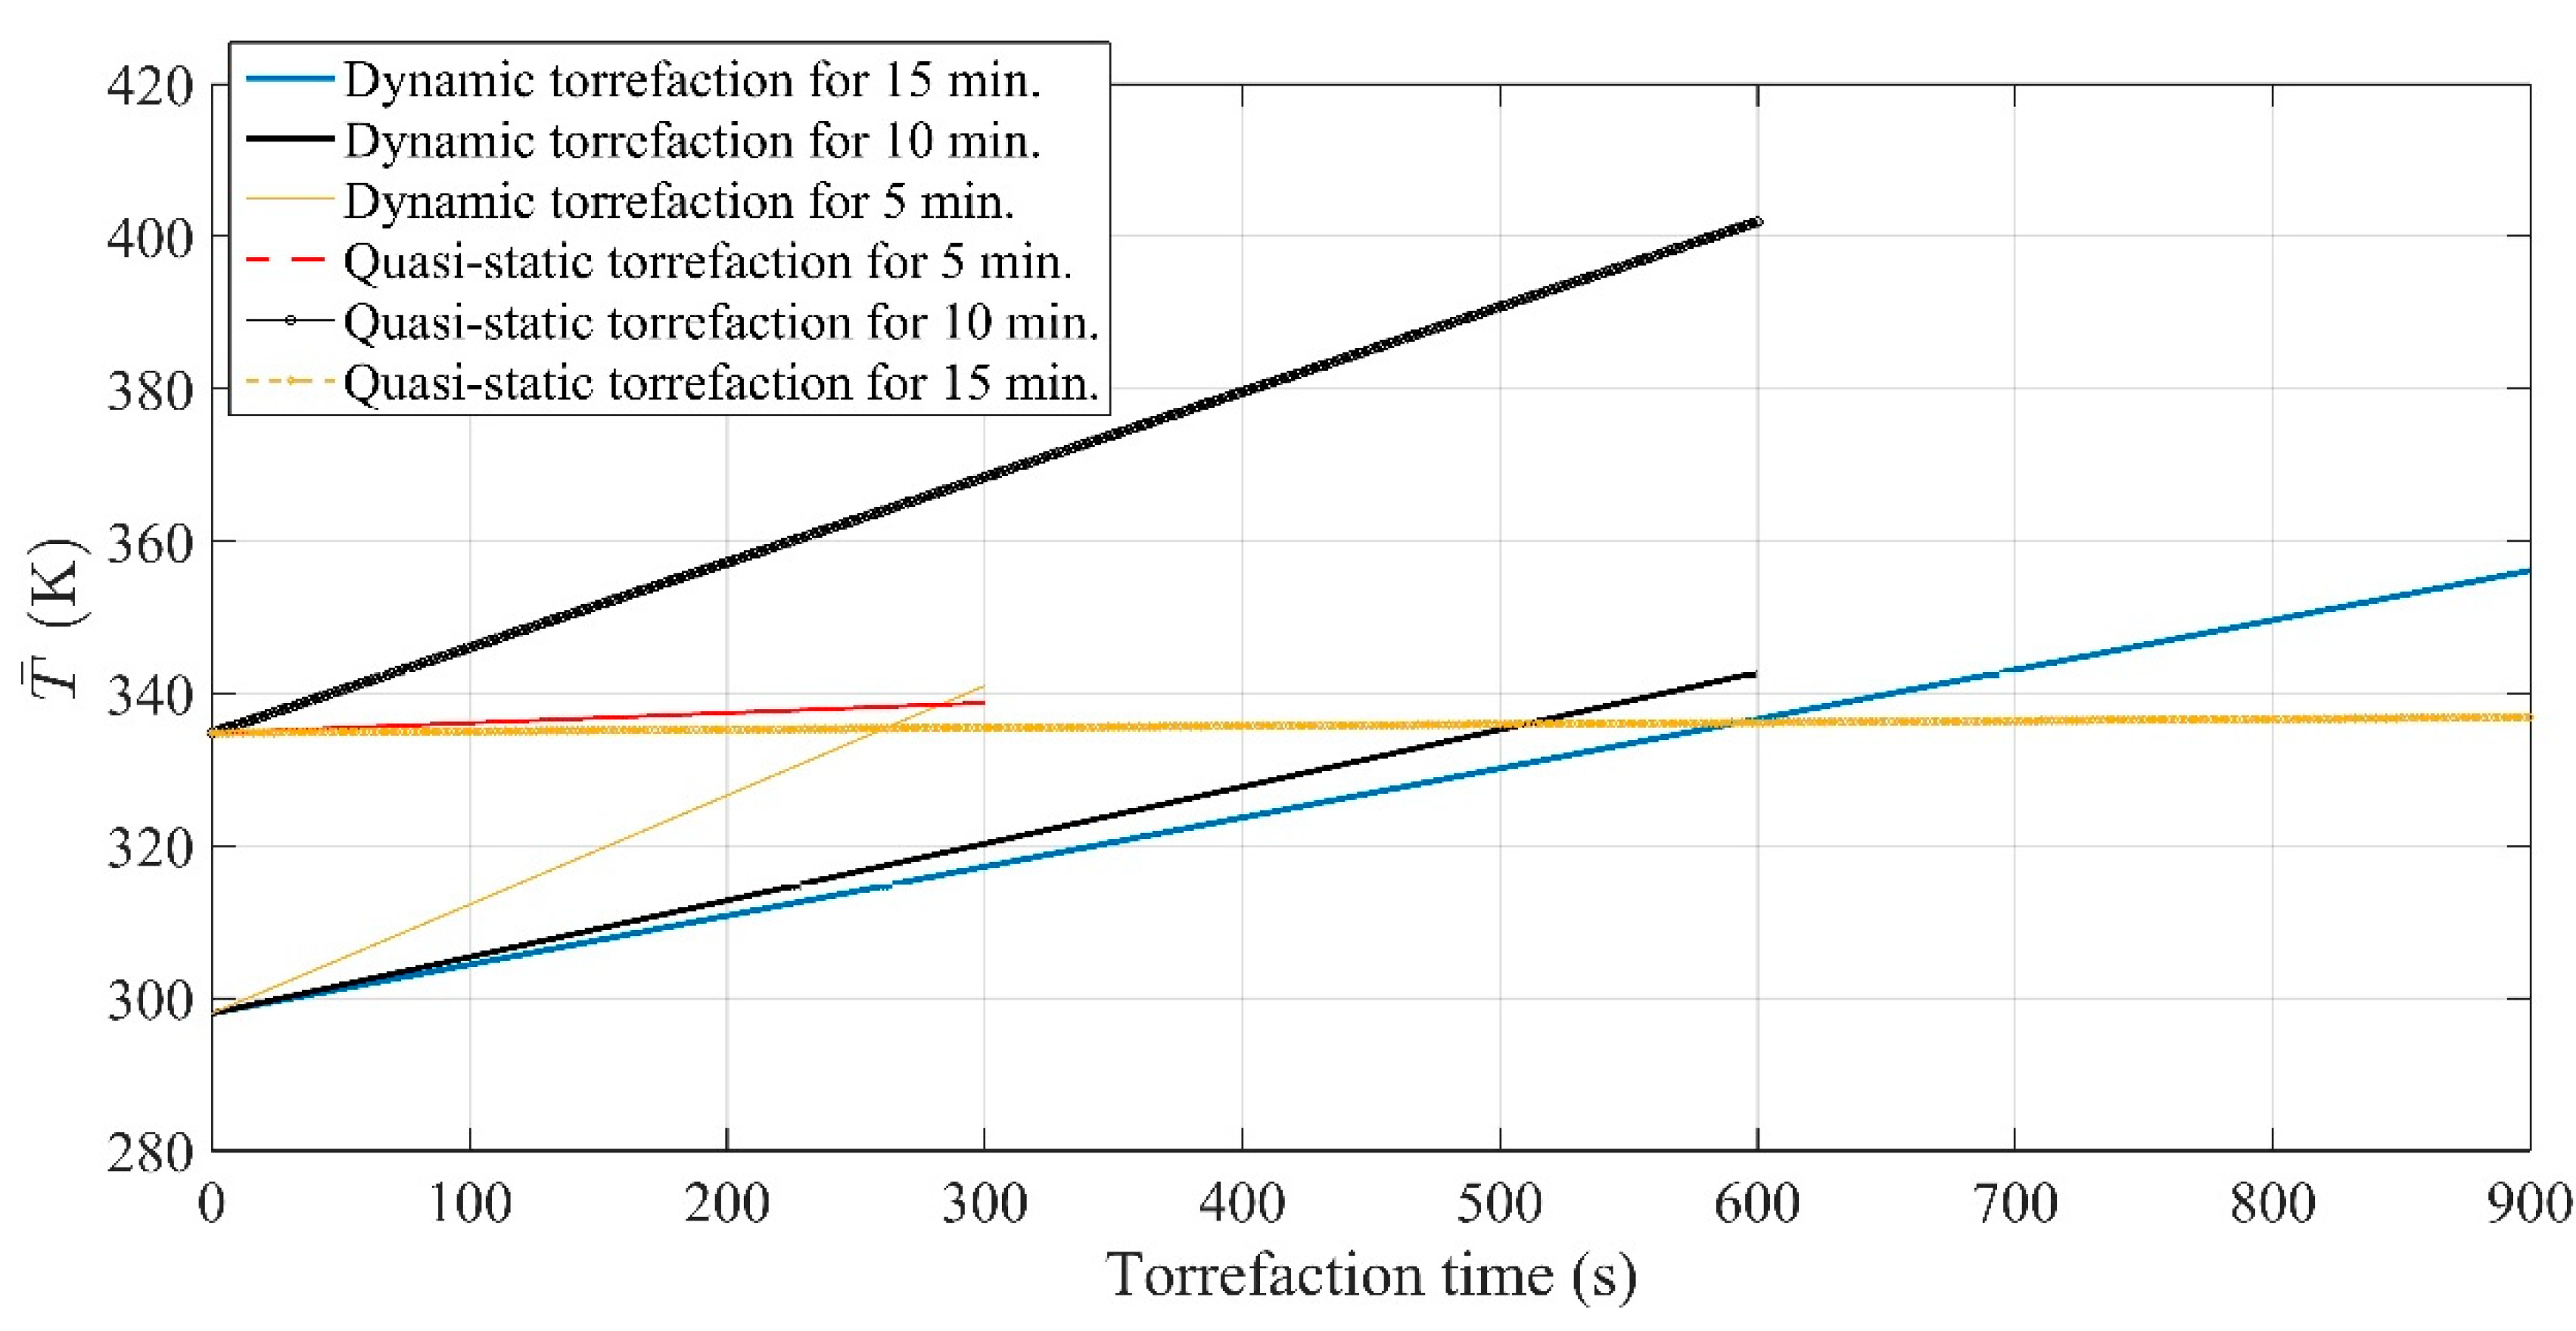
The variation in the thermal gradient or corresponding heat flux along the vertical plane of a pellet is shown in Figure 9e,f. It can be seen that the amplitude of the thermal gradient along the vertical plane varies exponentially with processing time, with an over-damping cosine characteristic. As compared to the azimuth and radial planes, the pellet would attain thermal equilibrium more quickly with the applied thermal history along the vertical plane. Initially, for a quasi-static condition, the heat flux would decrease by 67.74% when the torrefaction period changes from 5 min to 10 min. Later, with a further increase in the processing duration, it was estimated to be increased by 87%. At the onset of the torrefaction process, a dead time or thermal lag between the curve for a processing time of 5 min and the curve of 15 min was noticed in a quasi-static condition. This implies that the biofuel pellet would have a constant heat flux for a pellet of length 0–0.5 mm. As the length of the pellet increased, the heat flux was also found to languish for a constant processing time. During the increase in the processing time from 5 min to 10 min, the heat flux was reduced by 12.41% at the centre of the vertical plane, whereas with a further increase in the duration of the torrefaction process, the heat flux along the vertical plane was elevated by 160%. The relative change in heat flux with the increasing height of the pellet was widened with the processing period. This energy gap was correspondingly augmented in a dynamic state of the system. For the same length of pellet, the change in heat flux during a torrefaction time of 10–15 min was 15.53% higher than that in a quasi-static condition. However, the amplitude of the thermal gradient in a dynamic state from the radial plane for the same processing time is 80% lower than that of the thermal gradient in a quasi-static condition at the centre of a vertical plane. Unlike the quasi-static condition, heat flux along the vertical plane in dynamic heating would dramatically decrease with increasing processing time. The overall change in heat flux along the vertical plane would be fluctuating in nature rather than cyclic or alternating. If a comparative picture is drawn, the thermal gradient or corresponding heat flux would vary significantly along the vertical axis with a standard deviation of 920.32 W·m−2, followed by 0.148 W·m−2 along the azimuth plane and 0.121 W·m−2 in the radial direction at the centre of the biofuel pellet. Correspondingly, in a time-dependent heating system, the standard deviation in the heat flux along the vertical plane is merely 0.535 W·m−2. On the other hand, it was 3.312 kW·m−2 in the radial plane and 3.1 kW·m−2 along the azimuth plane, ϕ = 0. It can be seen that the deviation in heat flux or thermal gradient along different planes is significantly affected by the applied thermal conditions. The system has a more homogeneous distribution of energy and temperature with processing time, whereas the amplitude of heat flux along the radial direction is reduced by 15% if the same pellet undergoes torrefaction for a duration of 5 min in dynamic mode. Similarly, a 64.46% drop in the amplitude of the heat flux along the azimuth plane would be seen while performing torrefaction in a time-dependent thermal history. However, the relative amplitude of the heat flux at the centre of the pellet was estimated to be lowered by 98.41% along the vertical axis when heating a pellet in a quasi-static condition. The effect of heat flux on the thermal model is shown in Figure 10. It was found that the domain of temperature (Figure 10a), which was confined to 300–350 K for a constant heat supply, was dilated to 350–400 K at the circumferential plane of the biofuel pellet for a quasi-static condition. The increase in the processing time of the pellet (Figure 10c) shifted the temperature range from 350–400 K to 340–380 K, which was later expanded to 350–450 K when the pellet was processed for 15 min (Figure 10e) in a quasi-static condition. This happened either due to a reduction in the supplied heat to the furnace or a nominal change in the volumetric flow rate of nitrogen gas. Similarly, the change in the thermal model upon applying a time-dependent thermal history shifted the temperature domain to 350–375 K. The average temperature of biofuel pellets found from the numerical solution under the experimental conditions varied from 340 to 400 K for quasi-static heating (Figure 11), whereas it was 300 to 360 K when a similar size of the pellet was subjected to the dynamic heating condition. The numerical solution derived from a PDE model is presented in Table 5. It can be seen that the deviation in the solution was estimated to be the highest at a lower processing time for both the tested thermal conditions. The average heat flux along the Cartesian coordinates is lowest for the torrefaction process carried out for 10 min. From the pdepe solution for mass diffusion of volatile and water, the adopted thermal model estimated the mass yield within less than 5% tolerance, while it was 6% when the same size of the pellet underwent torrefaction in a time-dependent thermal history. The mass yield was found to vary from 92.53% to 96.20% for the quasi-static torrefaction. On the other hand, it was 92.60–96.40% for the dynamic torrefaction. The gap between the numerical and experimental results for the dynamic states occurred due to the thermal lagging factor.
6.2. Characteristic of Mass Transfer during Torrefaction
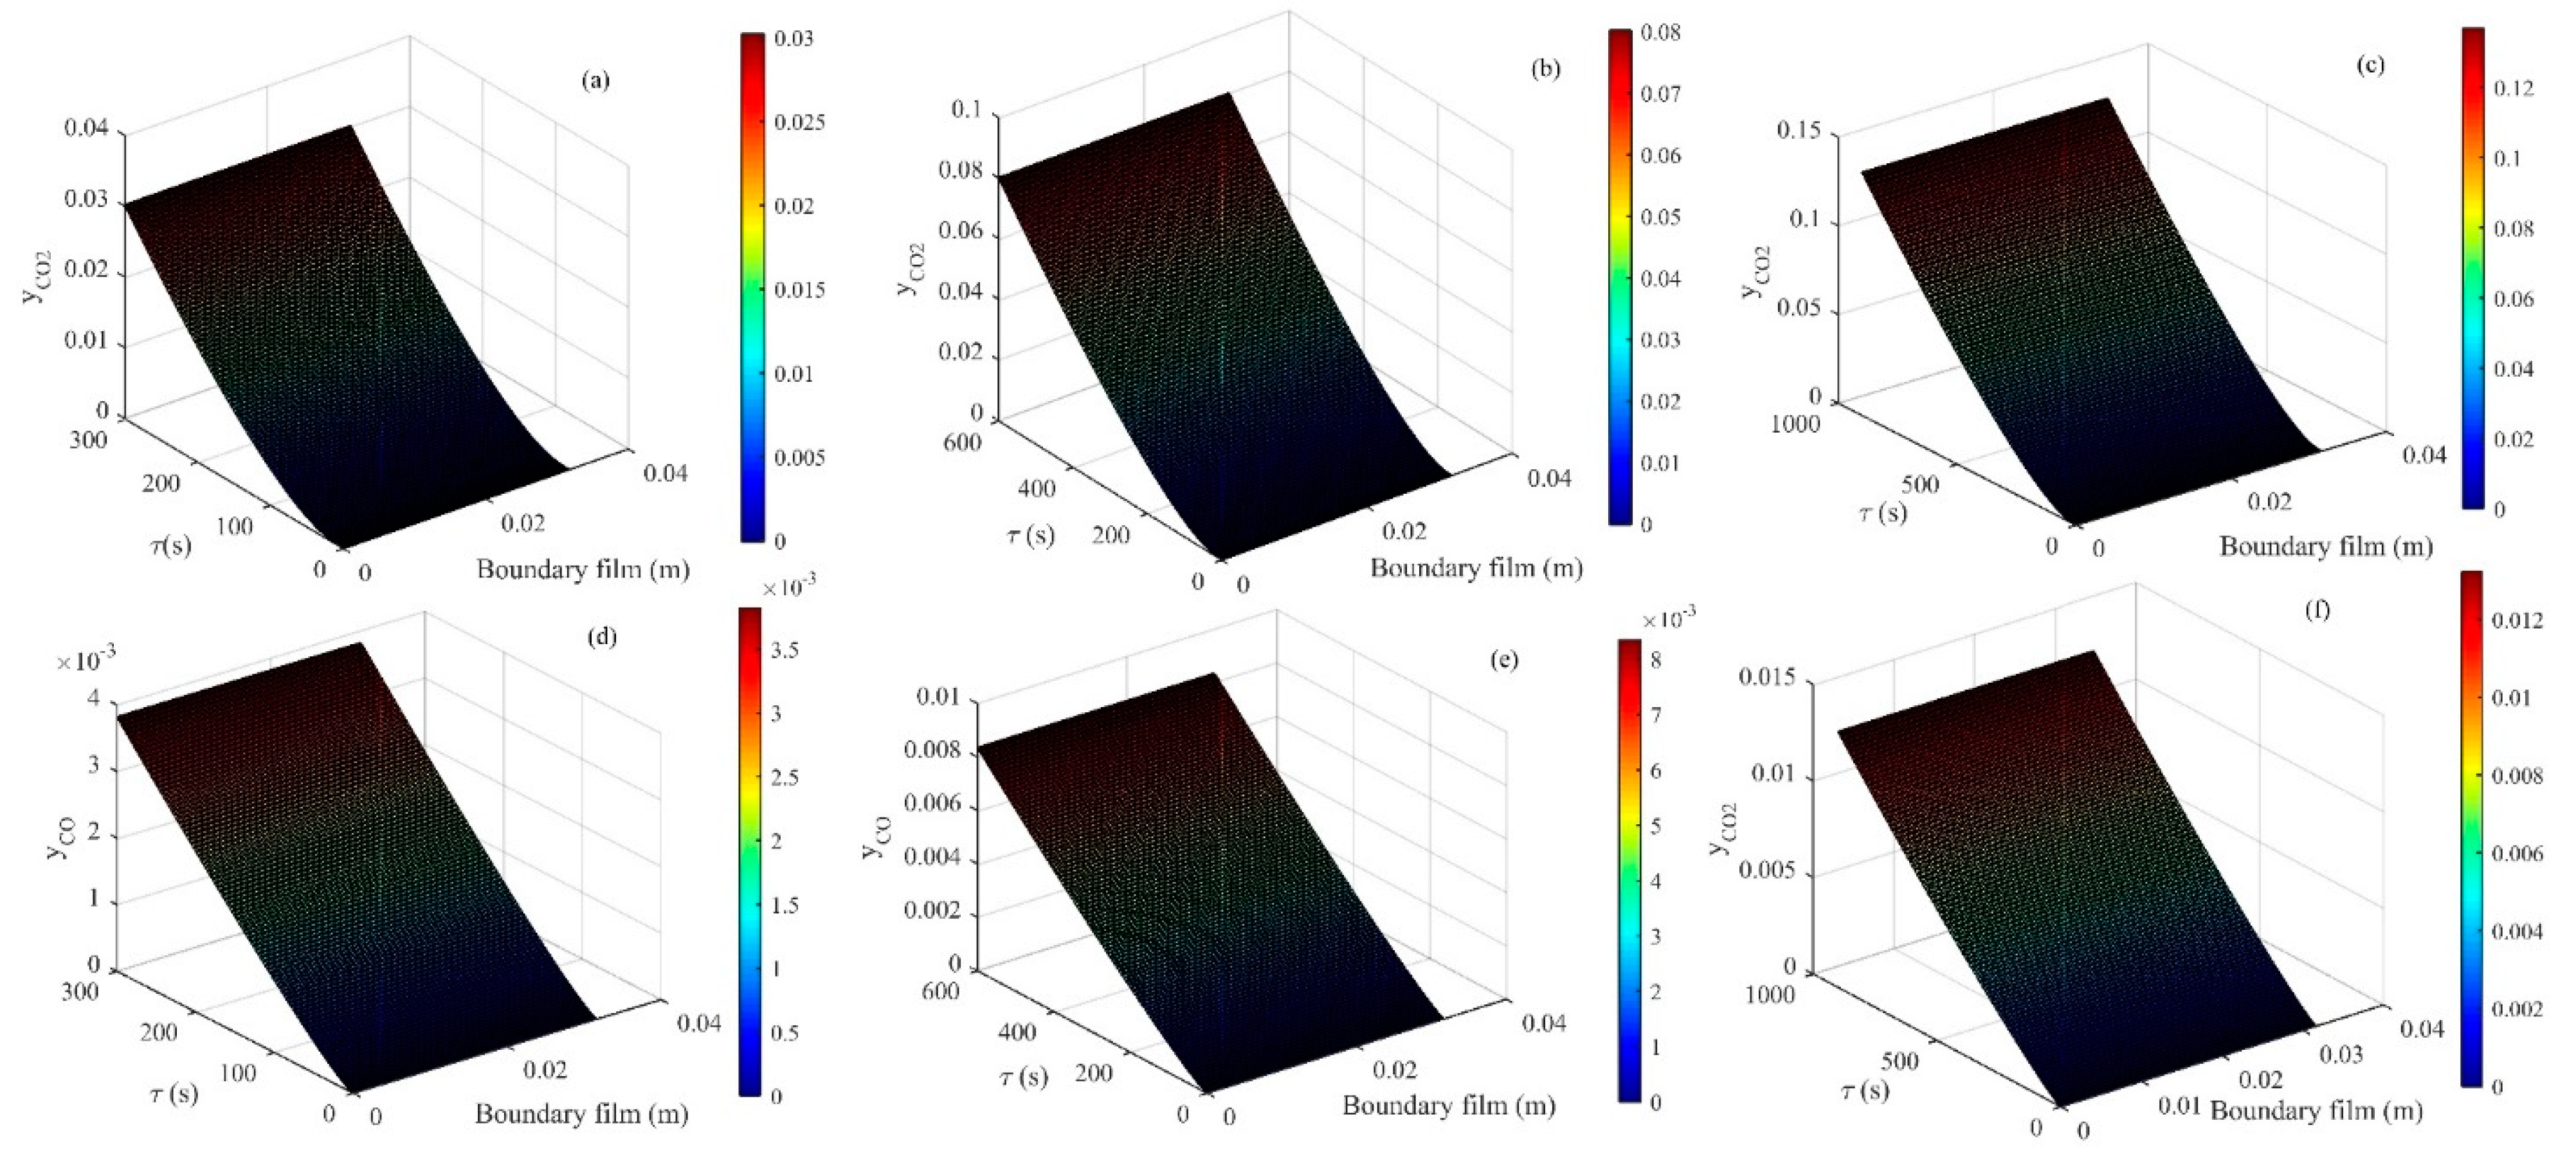
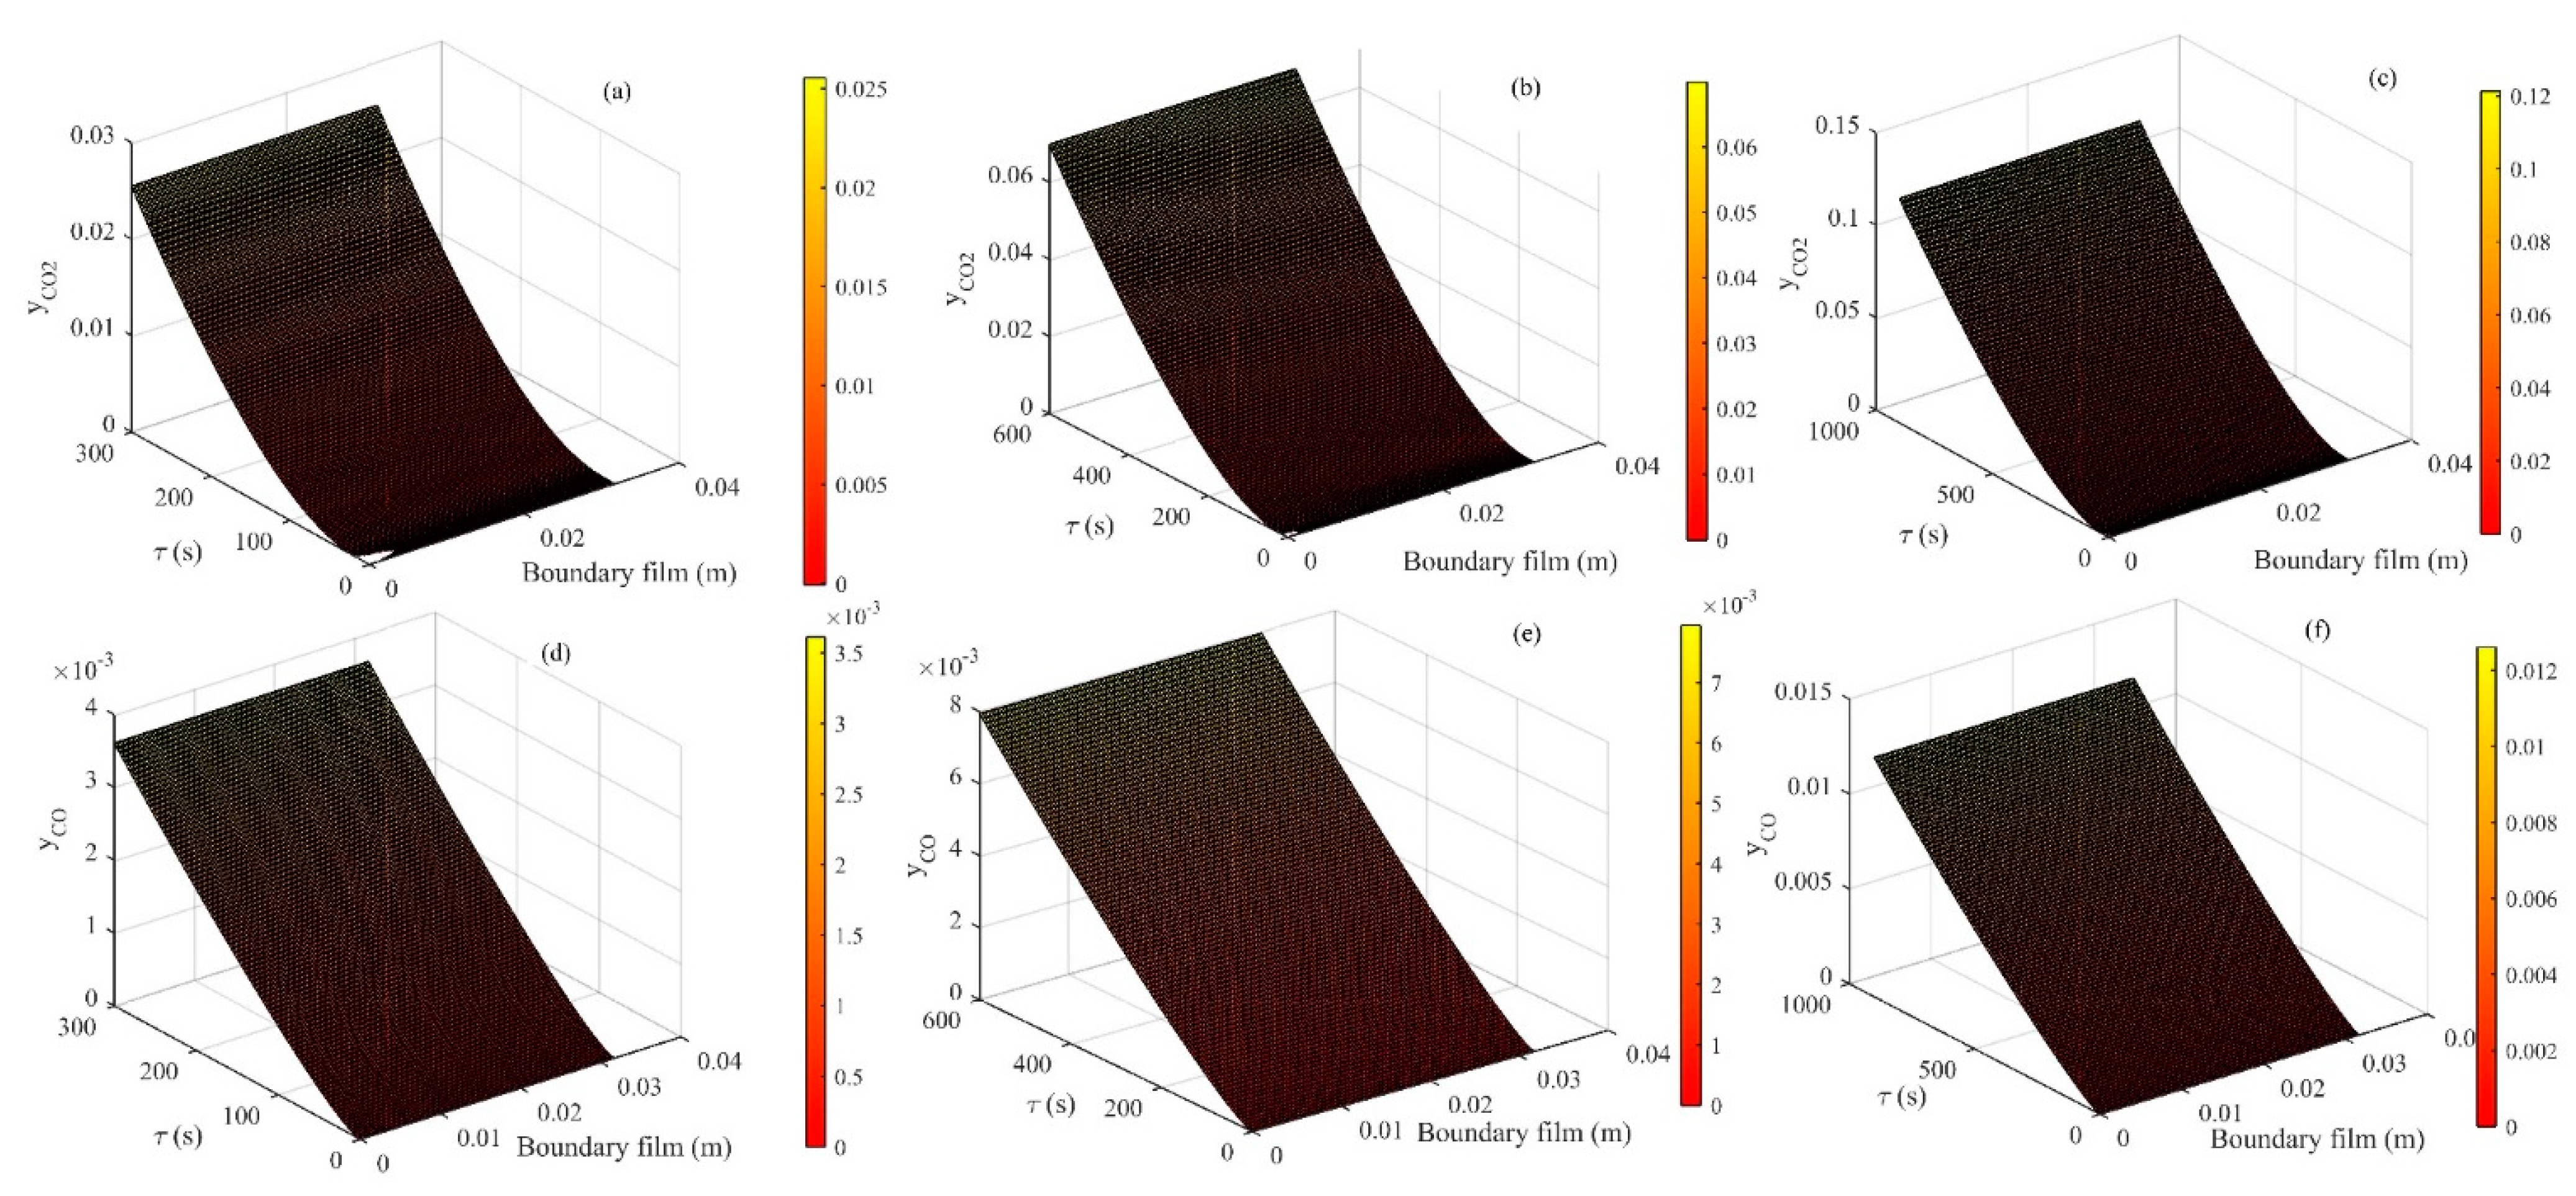
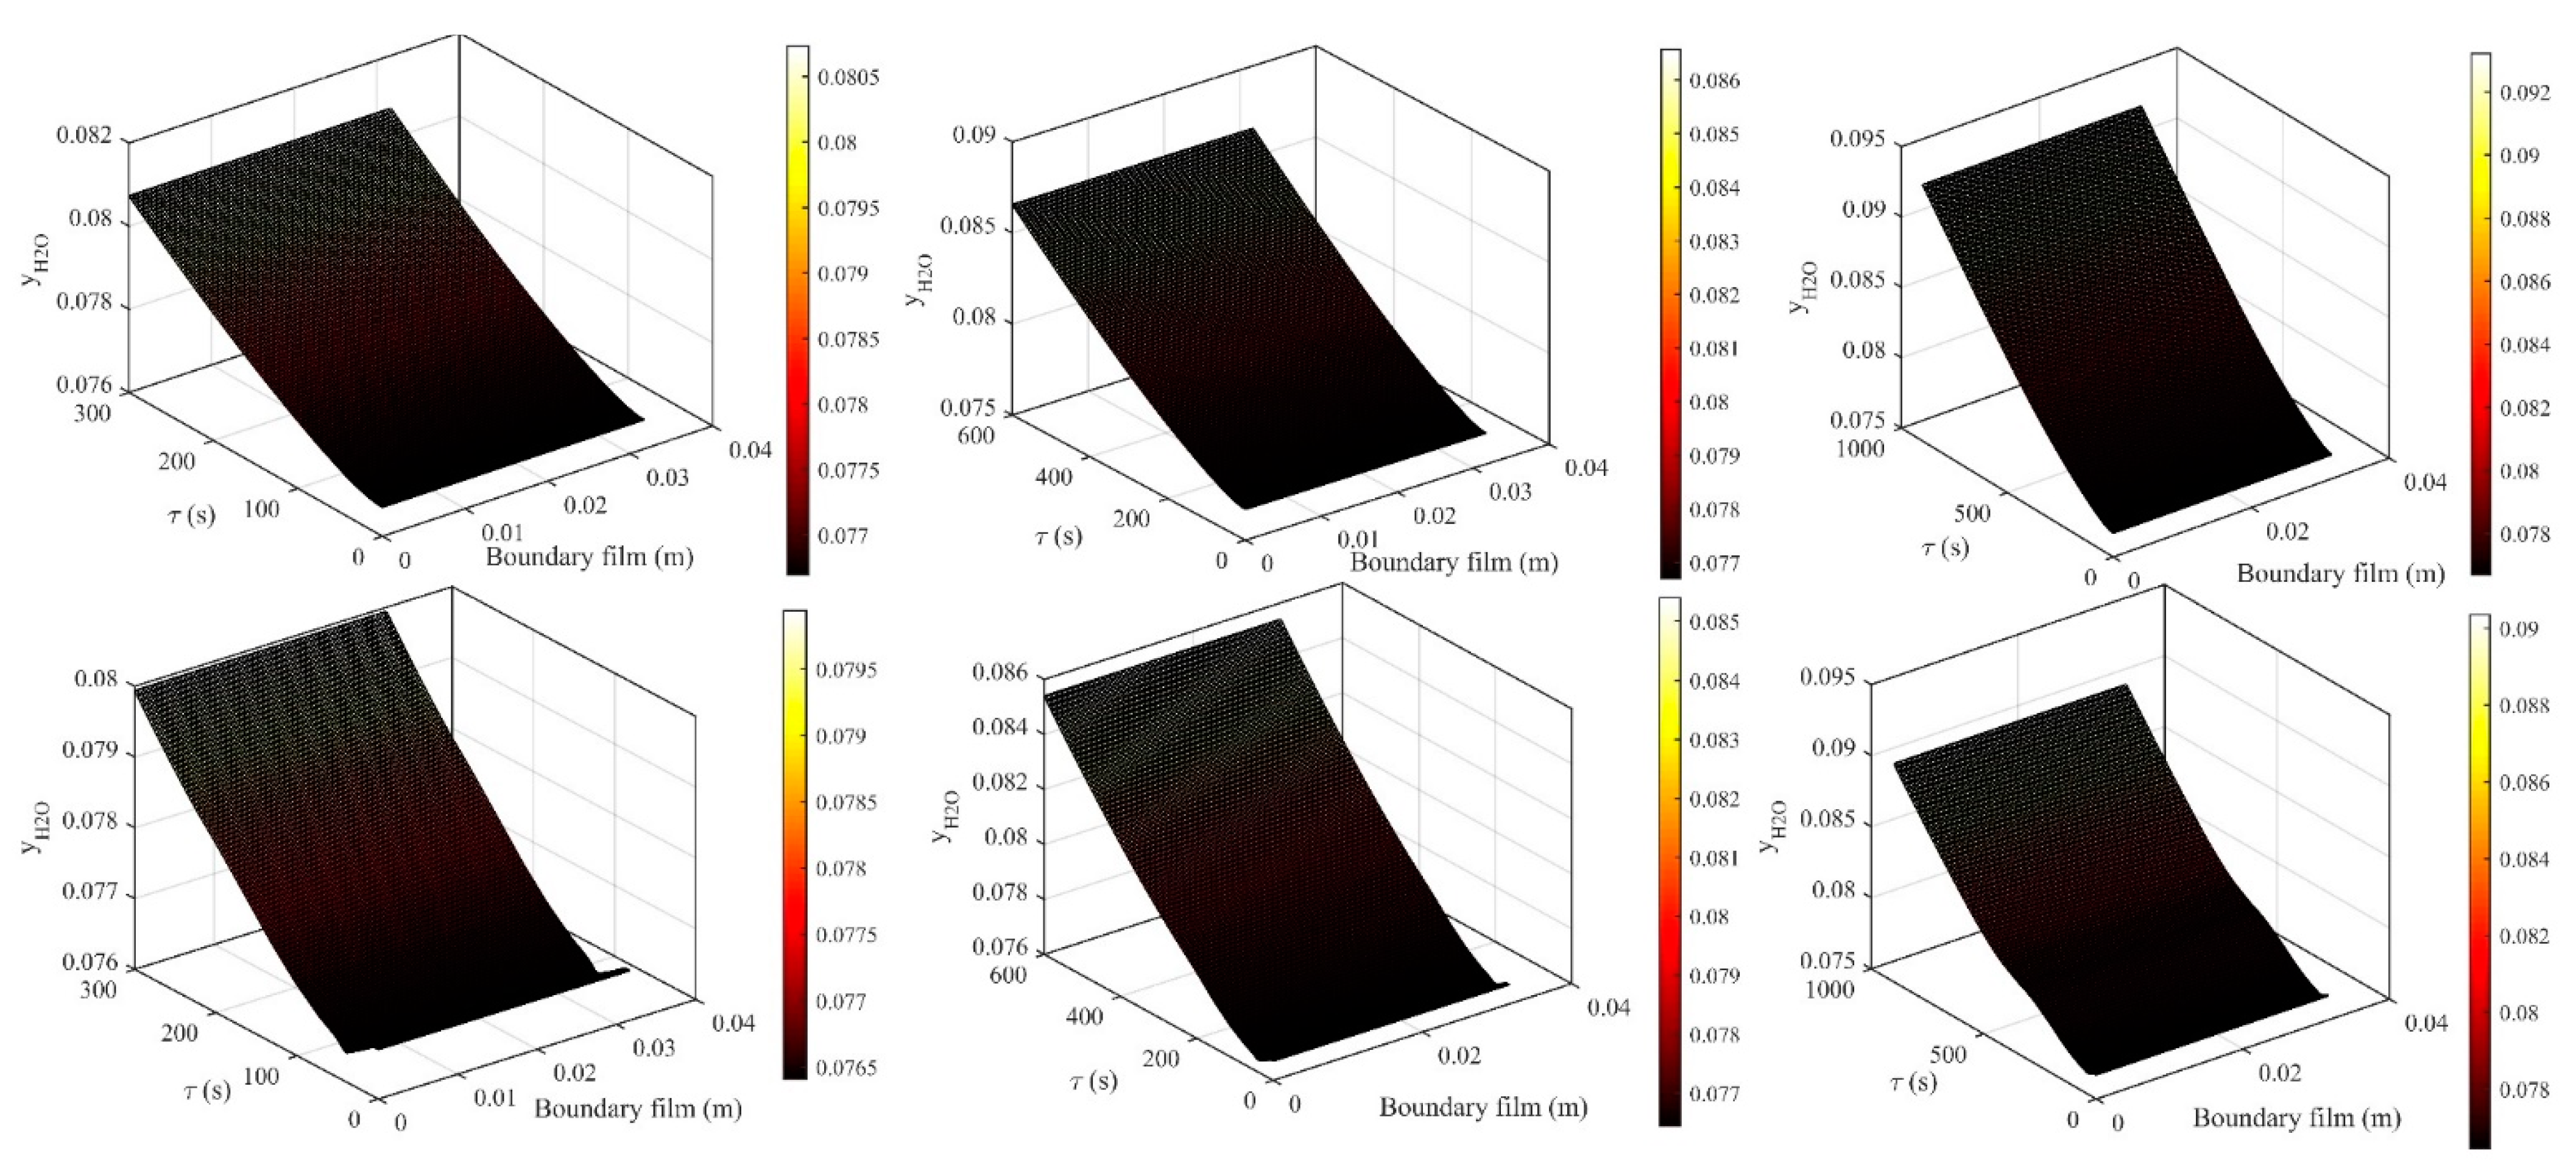
The diffusion of volatile species (CO and CO2) along with the evaporation of water content was modelled by using the pdepe module. The role of surface reaction and the presence of oxygen was considered to determine the boundary condition for a white-box model. The effect of the quasi-static torrefaction on the mass fraction yi of volatile species, CO and CO2, across the fixed boundary film is illustrated in Figure 12. The mass distribution of carbon dioxide, CO2, across the fixed boundary film shows a sigmoidal characteristic (Figure 12a–c). The declaratory phase of diffusion occurred at the onset of the diffusion process, which was found to be subdued as the duration of torrefaction was increased by a fixed time interval. The mass fraction of carbon dioxide, yi, was estimated to be increased by 166% with an increase in torrefaction time from 5 min to 10 min, whereas a further increase in the processing time enhanced the diffusion fraction of carbon dioxide by an additional 85%. As the duration of torrefaction was increased, the rate of diffusion of carbon dioxide across the boundary film also surged by 20.49–36.50% for a quasi-static condition. Unlike the diffusion of carbon dioxide across the boundary film, the change in the mass fraction of carbon monoxide was along a constant linear plane (Figure 12d–f). The diffusion of carbon monoxide was increased by 118.59% upon increasing the processing time by 5 min, which was further heightened by 58.6% as the torrefaction period was increased to 15 min. The overall change in the mass fraction of carbon dioxide across the boundary film was found to be 40% higher than that of carbon monoxide. The rate of change of mass fraction of carbon monoxide across the boundary film was amplified by 7–11% as the duration of torrefaction was increased from 5 min to 15 min. Similarly, the impact of the dynamic torrefaction on the mass fraction of volatile components is shown in Figure 13. The characteristics of the mass fraction curves are similar to the characteristics of the diffusion curves obtained for the quasi-static torrefaction. The only difference is at the onset of mass transfer across the boundary film. The behaviour at the onset of torrefaction showed discontinuity in nature for a very short duration of time (τ) and a boundary film of 4 mm led to the reversal of carbon dioxide flow (Figure 13a–c). However, as the processing time increased, the effect of discontinuity faded. The mass fraction of CO2 was elevated by 174% as the period of torrefaction was increased from 5 min to 15 min. The diffusion of CO2 in the dynamic torrefaction was found to be 5% higher than that of the quasi-static torrefaction. With a further increase in the processing time in the dynamic torrefaction, the mass fraction was additionally augmented by 73.70%, which is 13.2% lower than the obtained mass fraction of CO2 for a quasi-static state of the system. It can be concluded that the diffusion of CO2 across a fixed boundary film would be higher in the quasi-static torrefaction than in the case of the dynamic condition for a long duration of torrefaction. However, the effect of thermal lag is omitted in the diffusion equation, so the obtained solution is based on the assumption that the time required for the conduction of heat flux across the pellet would be longer than the time needed for carrying out the surface reaction, or, in other words, the pyrolysis number is far less than unity, which causes the surface reaction to occur virtually instantaneously. The increase in the processing time of the pellet caused the rate of diffusion of carbon dioxide to be stepped up by 18.39–22.38%, which is correspondingly 10% to 38% lower than the rate of diffusion derived for the quasi-static condition. The diffusion of carbon monoxide across the fixed boundary film in both dynamic and quasi-static conditions has a similar characteristic (Figure 13d–f). The mass fraction of carbon monoxide was estimated to be raised by 120% in a time interval of 5–10 min. With a further increase in this interval, an additional increase of 58% was seen in the mass fraction of carbon monoxide. Thus, the overall rise in carbon monoxide during the dynamic torrefaction was relatively increased by 0.84% as compared to the release of carbon monoxide in the quasi-static condition. However, a marginal drop (1.02%) in CO fraction was noticed when it was compared with the corresponding mass fraction of CO in the quasi-static condition for a processing time of 15 min. The rate of change of mass fraction of CO was found to be increased by 11% when the pellet underwent torrefaction for a transition period of 5–15 min, which was fairly constant for both the thermal conditions. The evaporation of water across the fixed boundary film for the quasi-static as well as dynamic condition is illustrated in Figure 14. The behaviour of the diffusion curves for water varied with the time of processing for the biofuel pellets. With the increase in torrefaction time, the sigmoidal attribute was reflected at the onset of the evaporation, which was initially varying along a linear plane (Figure 14a–c). The evaporation of water increased by 7.22–7.68% as the duration of torrefaction was increased from 5 min to 15 min. Similarly, the rate of evaporation was also affected when the processing was increased within the same time interval. It was initially increased by 19.16% when torrefaction time was stepped up by 5 min, but later, with a further increase in the torrefaction time, the rate of evaporation dropped by 45%. This implies that the evaporation of water would not monotonically increase with time in a quasi-static condition. After a certain period of processing, the water evaporation becomes saturated in the boundary film and no further diffusion of water evaporation can occur.
A declaratory phase of diffusion was also noticed at the beginning of evaporation of water across the fixed boundary layer that implies that the rate of evaporation would be hampered if the conduction time decreases by a significant margin, and it depends on the size of the particle subjected to thermal pre-treatment. The effect of dynamic torrefaction on the evaporation of water across the boundary film is shown in Figure 14d–f. Contrary to the quasi-static torrefaction, the dynamic torrefaction would promote a declaratory phase of diffusion at the onset of the pre-treatment process. A sudden drop of 0.37% from its initial value was noticed within a time interval of 39s. This change was reduced by 0.18% as the duration of dynamic torrefaction increased to 10 min. With a further increase in the duration, an increase of 7% was noticed in the diffusion of water vapour across the fixed boundary layer. The characteristics of the diffusion curves for water were found to be similar in pattern, except that a transit mass plateau was noticed in the numerical solution of the dynamic torrefaction for τ = 15 min. A gradual rise of 1.33% in the mass plateau was observed within the time interval of 200–300 s. A 6.8% rise in the evaporation of water was noticed during the first half interval of torrefaction (from 5 min to 10 min). In the second half, from 10 min to 15 min, it merely increased by 5.8%. The relative drop of 17.24% in water evaporation was estimated in the dynamic state of the system. Relatively speaking, the reduction in evaporation would be 62% less than that in the quasi-static condition. The rate of evaporation increased in the dynamic torrefaction by 24.51% when the biofuel was pre-treated for a duration of 5–10 min. With a further increase in processing time, it would drop by 34.72%. It is clear from this fact that the evaporation of water in both quasi-static and dynamic conditions would have similar attributes, except that the magnitude of the rate of evaporation would be 23% higher in the dynamic torrefaction than in the quasi-static condition. However, the overall removal of water content from the material surface in the quasi-static torrefaction would be around 6.1% to 31% higher than that in the dynamic condition.
7. Conclusions
This work focused on the thermal conditions imposed during thermal pre-treatment of black pine pellets in a Joule heating system. A furnace was improvised in such a manner that it could accommodate both thermal histories without influencing the biofuel pellets. A PDE thermal model was proposed to explain the thermal behaviour of the material when a pellet was subjected to quasi-static as well as dynamic thermal conditions. Similarly, a pdepe module was employed to determine the mass diffusion across the fixed boundary film. It was noticed in the analyses that the response of the material would be different with each thermal condition. The effect of nitrogen gas on the temperature profile of the material was also determined and it was found that an increase in the average Nu number beyond 10 would influence thermal homogeneity along the tangential plane in the quasi-static torrefaction, whereas it merely reduced the temperature scale when a pellet of the same size was subjected to dynamic torrefaction. The effect of thermal conditions on the thermal gradient was also studied and it was seen that the surface of the pellet, rather than the interior region, would experience a drastic change in its thermal gradient for the quasi-static condition. On the contrary, the thermal gradient would be higher at the interior region of the pellet than the circumferential plane of the pellet. The flow of heat would concentrate more along the vertical plane in the quasi-static torrefaction than in the dynamic condition. Correspondingly, the radial and azimuth planes would be primarily affected when a pellet is subjected to dynamic torrefaction. The quasi-static condition would have the least impact on the azimuth and radial plane. However, relatively speaking, the amplitude of heat flux in the quasi-static condition would be five times higher than that in the dynamic state of the system. It was estimated from the numerical solution that along the radial plane of the biofuel pellet, the nature of heat flux would be the opposite. A heat flux of 15.4 kW.m−2 was found along the radial plane for a quasi-static condition, whereas it was estimated to be −0.7 kW·m−2 when the dynamic torrefaction was performed for 5 min. The nature of heat flux would be alternating along the azimuth and vertical planes, whereas it would merely fluctuate along the radial direction in the quasi-static torrefaction. Likewise, heat flux would change direction along radial and azimuth planes during the dynamic torrefaction. The amplitude of the thermal gradient along the vertical plane would decrease with the exponential rate unless it becomes asymptotic to the tangential plane to the thermal profile. The removal of carbon dioxide from the surface of biofuel was estimated to be 44% higher in the quasi-static torrefaction than that in the dynamic thermal condition, whereas the elimination of carbon monoxide would be slightly stepped up by 0.45% in dynamic torrefaction. The rate of evaporation of water was augmented by 24.51% in the dynamic state of the system, while the overall mass fraction of water removed from the surface of a pellet was evaluated to be enhanced by 31% in the quasi-static torrefaction.
Author Contributions
A.D.: Conceptualization, Investigation, Methodology, Software, Writing—original draft preparation, Writing—review and editing, Supervision, Data curation, Validation; L.T.: Resources. All authors have read and agreed to the published version of the manuscript.
Funding
This work was not funded by any government or organisation.
Institutional Review Board Statement
Not applicable.
Informed Consent Statement
Not applicable.
Data Availability Statement
No data availability.
Conflicts of Interest
The authors declare no conflict of interest.
References
- Nikolaisen, S.; Jensen, P.D. Biomass feedstocks: Categorisation and preparation for combustion and gasification. In Biomass Combustion Science, Technology and Engineering; Woodhead Publishing: London, UK, 2013; pp. 36–57. [Google Scholar]
- Zhi, W.J.; Wang, L.F.; Hu, X.J. Recent advances in the effects of microwave radiation on brains. Mil. Med Res. 2017, 4, 1–14. [Google Scholar] [CrossRef] [PubMed] [Green Version]
- Huang, Y.F.; Sung, H.T.; Chiueh, P.T.; Lo, S.L. Microwave torrefaction of sewage sludge and leucaena. J. Taiwan Inst. Chem. Eng. 2017, 70, 236–243. [Google Scholar] [CrossRef]
- Tan, I.A.W.; Shafee, N.M.; Abdullah, M.O.; Lim, L.L.P. Synthesis and characterization of biocoal from Cymbopogon citrates residue using microwave-induced torrefaction. Environ. Technol. Innov. 2017, 8, 431–440. [Google Scholar] [CrossRef]
- Huang, Y.F.; Sung, H.T.; Chiueh, P.T.; Lo, S.L. Co-torrefaction of sewage sludge and leucaena by using microwave heating. Energy 2016, 116, 1–7. [Google Scholar] [CrossRef]
- Yu, K.L.; Chen, W.H.; Sheen, H.K.; Chang, J.S.; Lin, C.S.; Ong, H.C.; Show, P.L.; Ling, T.C. Bioethanol production from acid pretreated microalgal hydrolysate using microwave-assisted heating wet torrefaction. Fuel 2020, 279, 118435. [Google Scholar] [CrossRef]
- Siritheerasas, P.; Waiyanate, P.; Sekiguchi, H.; Kodama, S. Torrefaction of Municipal Solid Waste (MSW) Pellets using Microwave Irradiation with the Assistance of the Char of Agricultural Residues. Energy Procedia 2017, 138, 668–673. [Google Scholar] [CrossRef]
- Wang, M.J.; Huang, Y.F.; Chiueh, P.T.; Kuan, W.H.; Lo, S.L. Microwave-induced torrefaction of rice husk and sugarcane residues. Energy 2012, 37, 177–184. [Google Scholar] [CrossRef]
- Satpathy, S.K.; Tabil, L.G.; Meda, V.; Naik, S.N.; Prasad, R. Torrefaction of wheat and barley straw after microwave heating. Fuel 2014, 124, 269–278. [Google Scholar] [CrossRef]
- Yek, P.N.Y.; Osman, M.S.; Wong, C.C.; Wong, C.S.; Kong, S.H.; Sie, T.S.; Foong, S.Y.; Lam, S.S.; Liew, R.K. Microwave wet torrefaction: A catalytic process to convert waste palm shell into porous biochar. Mater. Sci. Energy Technol. 2020, 3, 742–747. [Google Scholar] [CrossRef]
- Zhang, C.; Ho, S.H.; Chen, W.H.; Eng, C.F.; Wang, C.T. Simultaneous implementation of sludge dewatering and solid biofuel production by microwave torrefaction. Environ. Res. 2021, 195, 110775. [Google Scholar] [CrossRef] [PubMed]
- Angjan, A.; Ngamsiri, P.; Klomkliang, N.; Wu, K.C.W.; Matsagar, B.M.; Ratchahat, S.; Liu, C.-G.; Laosiripojana, N. Effect of microwave-assisted wet torrefaction on liquefaction of biomass from palm oil and sugarcane wastes to bio-oil and carbon nanodots/nanoflakes by hydrothermolysis and solvothermolysis. Renew. Energy 2020, 154, 1204–1217. [Google Scholar] [CrossRef]
- Yan, B.; Jiao, L.; Li, J.; Zhu, X.; Ahmed, S.; Chen, G. Investigation on microwave torrefaction: Parametric influence, TG-MS-FTIR analysis, and gasification performance. Energy 2021, 220, 119794. [Google Scholar] [CrossRef]
- Dhaundiyal, A.; Singh, S.B.; Atsu, D.; Toth, L. Comprehensive analysis of pre-treated Austrian pine. Fuel 2021, 287, 119605. [Google Scholar] [CrossRef]
- Negi, S.; Jaswal, G.; Dass, K.; Mazumder, K.; Elumalai, S.; Roy, J.K. Torrefaction: A sustainable method for transforming of agri-wastes to high energy density solids (biocoal). Rev. Environ. Sci. Biotechnol. 2020, 19, 463–488. [Google Scholar] [CrossRef]
- Holman, J.P. Heat Transfer, 9th ed.; McGraw-Hill, Inc.: New York, NY, USA; Boston, MA, USA, 2002. [Google Scholar]
- MacLean, J. Thermal conductivity of wood. Heat. Pip. Air Cond. 1941, 13, 380–391. [Google Scholar]
- Lewellen, P.C.; Peters, W.A.; Howard, J.B. Cellulose pyrolysis kinetics and char formation mechanism. Symp. (Int.) Combust. 1977, 16, 1471–1480. [Google Scholar] [CrossRef]
Figure 1.
The modified furnace used for thermal pre-treatment: (a)—Unit, (b)—Sketch, (c)—Torrefied pellets.
Figure 1.
The modified furnace used for thermal pre-treatment: (a)—Unit, (b)—Sketch, (c)—Torrefied pellets.

Figure 2.
The meshed structure of a biofuel pellet.

Figure 3.
The torrefaction of a pellet in a nitrogen atmosphere.

Figure 4.
The temperature distribution (quasi-static condition) across a biofuel pellet with arbitrarily chosen heat transfer properties for torrefaction temperature of 523 K (a): mesh points, (b): interpolated solution, 5 min; (c): mesh points; (d): interpolated solution, 10 min; (e): mesh points; (f): interpolated solution, 15 min (g = 0, q = 1.430 W·m−2·K−1, k = 3.056 W·m−1·K−1, Re = 798.85, Pr = 0.0001988).


Figure 5.
The effect of thermo-fluid properties of inert gas on the temperature distribution (Iso surfaces) of biofuel pellets for the quasi-static torrefaction at 523 K (a–c): 5 min, (d–f): 10 min, (g–i): 15 min (g = 0, q = 1.430 W·m−2·K−1, k = 3.056 W·m−1·K−1, Pr = 0.0001988).
Figure 5.
The effect of thermo-fluid properties of inert gas on the temperature distribution (Iso surfaces) of biofuel pellets for the quasi-static torrefaction at 523 K (a–c): 5 min, (d–f): 10 min, (g–i): 15 min (g = 0, q = 1.430 W·m−2·K−1, k = 3.056 W·m−1·K−1, Pr = 0.0001988).


Figure 6.
Thermal gradient across the biofuel pellet (a,c,e): quasi-static; (b,d,f): dynamic ( g = 0, q = 1.430 W·m−2·K−1, k = 3.056 W·m−1·K−1, Re = 798.85, Pr = 0.0001988).
Figure 6.
Thermal gradient across the biofuel pellet (a,c,e): quasi-static; (b,d,f): dynamic ( g = 0, q = 1.430 W·m−2·K−1, k = 3.056 W·m−1·K−1, Re = 798.85, Pr = 0.0001988).


Figure 7.
The temperature distribution (dynamic condition) across the biofuel pellet at arbitrarily chosen thermo-fluid properties for torrefaction temperature of 523 K (a): mesh points; (b): interpolated solution, 5 min; (c): mesh points; (d): interpolated solution, 10 min; (e): mesh points; (f): interpolated solution, 15 min (g = 0, q = 1.430 W·m−2·K−1, k = 3.056 W·m−1·K−1, Re = 798.85, Pr = 0.0001988).

Figure 8.
The effect of thermo-fluid properties of inert gas on temperature distribution (isosurfaces) of biofuel during torrefaction (dynamic) at 523 K (a–c): 5 min, (d–f): 10 min, (g–i): 15 min (g = 0, q = 1.430 W·m−2·K−1, k = 3.056 W·m−1·K−1, Pr = 0.0001988).
Figure 8.
The effect of thermo-fluid properties of inert gas on temperature distribution (isosurfaces) of biofuel during torrefaction (dynamic) at 523 K (a–c): 5 min, (d–f): 10 min, (g–i): 15 min (g = 0, q = 1.430 W·m−2·K−1, k = 3.056 W·m−1·K−1, Pr = 0.0001988).

Figure 9.
Thermal gradient in polar coordinate (a,c,e): varying heat flux, (b,d,f): constant heat flux.
Figure 9.
Thermal gradient in polar coordinate (a,c,e): varying heat flux, (b,d,f): constant heat flux.


Figure 10.
Temperature distribution on the surface of a biofuel pellet in varying heat flux conditions (a,c,e): quasi-static, (b,d,f): dynamic.
Figure 10.
Temperature distribution on the surface of a biofuel pellet in varying heat flux conditions (a,c,e): quasi-static, (b,d,f): dynamic.


Figure 11.
The average temperature distribution across a biofuel pellet in both quasi-static and dynamic thermal conditions under varying heat flux conditions.
Figure 11.
The average temperature distribution across a biofuel pellet in both quasi-static and dynamic thermal conditions under varying heat flux conditions.

Figure 12.
The distribution of mass fraction across the gas film (quasi-static condition) at different torrefaction duration (a) 5 min, (b) 10 min, (c) 15 min, yCO2; (d) 5 min, (e) 10 min, (f) 15 min, yCO.
Figure 12.
The distribution of mass fraction across the gas film (quasi-static condition) at different torrefaction duration (a) 5 min, (b) 10 min, (c) 15 min, yCO2; (d) 5 min, (e) 10 min, (f) 15 min, yCO.

Figure 13.
The distribution of mass fraction across the gas film (dynamic condition) at different torrefaction time (a) 5 min, (b) 10 min, (c) 15 min, yCO2; (d) 5 min, (e) 10 min, (f) 15 min, yCO.
Figure 13.
The distribution of mass fraction across the gas film (dynamic condition) at different torrefaction time (a) 5 min, (b) 10 min, (c) 15 min, yCO2; (d) 5 min, (e) 10 min, (f) 15 min, yCO.

Figure 14.
The distribution of mass fraction across the gas film at different torrefaction period (a) 5 min, (b) 10 min, (c) 15 min, yH2O (quasi-static); (d) 5 min, (e)10 min, (f) 15 min, yH2O (dynamic).
Figure 14.
The distribution of mass fraction across the gas film at different torrefaction period (a) 5 min, (b) 10 min, (c) 15 min, yH2O (quasi-static); (d) 5 min, (e)10 min, (f) 15 min, yH2O (dynamic).


Table 1.
The elemental composition of black pine (Pinus Nigra) (dry basis).
| C% | H% | N% | O% | S% | Ash% | * V.M% | ** F.C% |
|---|---|---|---|---|---|---|---|
| 53.32 | 6.40 | 0.54 | 36.69 | 0.1 | 2.93 | 89.92 | 7.15 |
* volatile matter, ** fixed carbon.
Table 2.
The physical characteristics of densified black pine.
| Bulk Density (kg·m−3), ρb | HHV (MJ·kg−1) | Length (mm) | Diameter (mm) | Material Density (kg·m−3), ρm | Energy Density (GJ·m−3) |
|---|---|---|---|---|---|
| 788 | 20.53 | 14.80 ± 0.65 | 6.34 ± 0.02 | 1158 | 16.17 |
Table 3.
The thermo-fluid parameters for a biofuel pellet.
| C (kJ·kg−1·K−1) | k (W·m−1·K−1) | Nu | Re | Pr | νN2 (m2·s−1) | P (bar) | |
|---|---|---|---|---|---|---|---|
| 0.298 | 11.98 | 2.7124 | 1.44 | 798.85 | 454.182 | 15.73 × 10⁻⁶ | 2.51 |
Table 4.
Parametric information about mass diffusivity.
| Parameters | CO2 | CO | H2O | N2 | O2 |
|---|---|---|---|---|---|
| 3.996 Å | 3.590 Å | 2.649 Å | 3.681 Å | 3.433 Å | |
| 190 | 110 | 356 | 91.5 | 113 | |
| Ω | 0.885 | 0.9203 | 1.305 | – | 0.9225 |
| Di | 0.077 cm2·s−1 | 2.546 cm2·s−1 | 0.237 cm2·s−1 | – | 0.245 cm2·s−1 |
Table 5.
The numerical solution derived from a PDE model under the experimental conditions of a Joule heating system.
Table 5.
The numerical solution derived from a PDE model under the experimental conditions of a Joule heating system.
| Parameters | Quasi-Static | Dynamic | |||||
|---|---|---|---|---|---|---|---|
| 5 | 10 | 15 | 5 | 10 | 15 | ||
| Average Temperature (K) | 336.78 | 368.38 | 335.84 | 319.46 | 320.31 | 326.97 | |
| Minimum Temperature (K) | 299.17 | 313.32 | 298.89 | 230.21 | 232 | 228.55 | |
| Standard Deviation (K) | 82.35 | 68.54 | 82.77 | 41.61 | 41.22 | 38.18 | |
| Average Heat flux (kW·m−2) | X | 35.58 | 32.11 | 35.96 | 21.33 | 10.57 | 6.53 |
| Y | 132.59 | 125.34 | 133.61 | 45.79 | 22.70 | 14.02 | |
| Z | 8.61 | 7.74 | 8.70 | 5.36 | 2.65 | 1.64 | |
| Mass Yield (%) | Numerical | 96.20% | 94.20% | 92.53% | 96.40% | 94.93% | 92.60% |
| Experimental | 95.18% | 93.11% | 92.77% | 99% | 98.8% | 98.4% | |
Publisher’s Note: MDPI stays neutral with regard to jurisdictional claims in published maps and institutional affiliations. |
© 2021 by the authors. Licensee MDPI, Basel, Switzerland. This article is an open access article distributed under the terms and conditions of the Creative Commons Attribution (CC BY) license (https://creativecommons.org/licenses/by/4.0/).
Share and Cite
MDPI and ACS Style
Dhaundiyal, A.; Toth, L. Modelling of a Torrefaction Process Using Thermal Model Object. Energies 2021, 14, 2481. https://doi.org/10.3390/en14092481
AMA Style
Dhaundiyal A, Toth L. Modelling of a Torrefaction Process Using Thermal Model Object. Energies. 2021; 14(9):2481. https://doi.org/10.3390/en14092481
Chicago/Turabian StyleDhaundiyal, Alok, and Laszlo Toth. 2021. "Modelling of a Torrefaction Process Using Thermal Model Object" Energies 14, no. 9: 2481. https://doi.org/10.3390/en14092481
Note that from the first issue of 2016, this journal uses article numbers instead of page numbers. See further details here.